
Laser-Induced Breakdown Spectroscopy and X-ray Fluorescence Analysis of Bronze Objects from the Late Bronze Age Baley Settlement, Bulgaria
 ,
,
Abstract
:1. Introduction
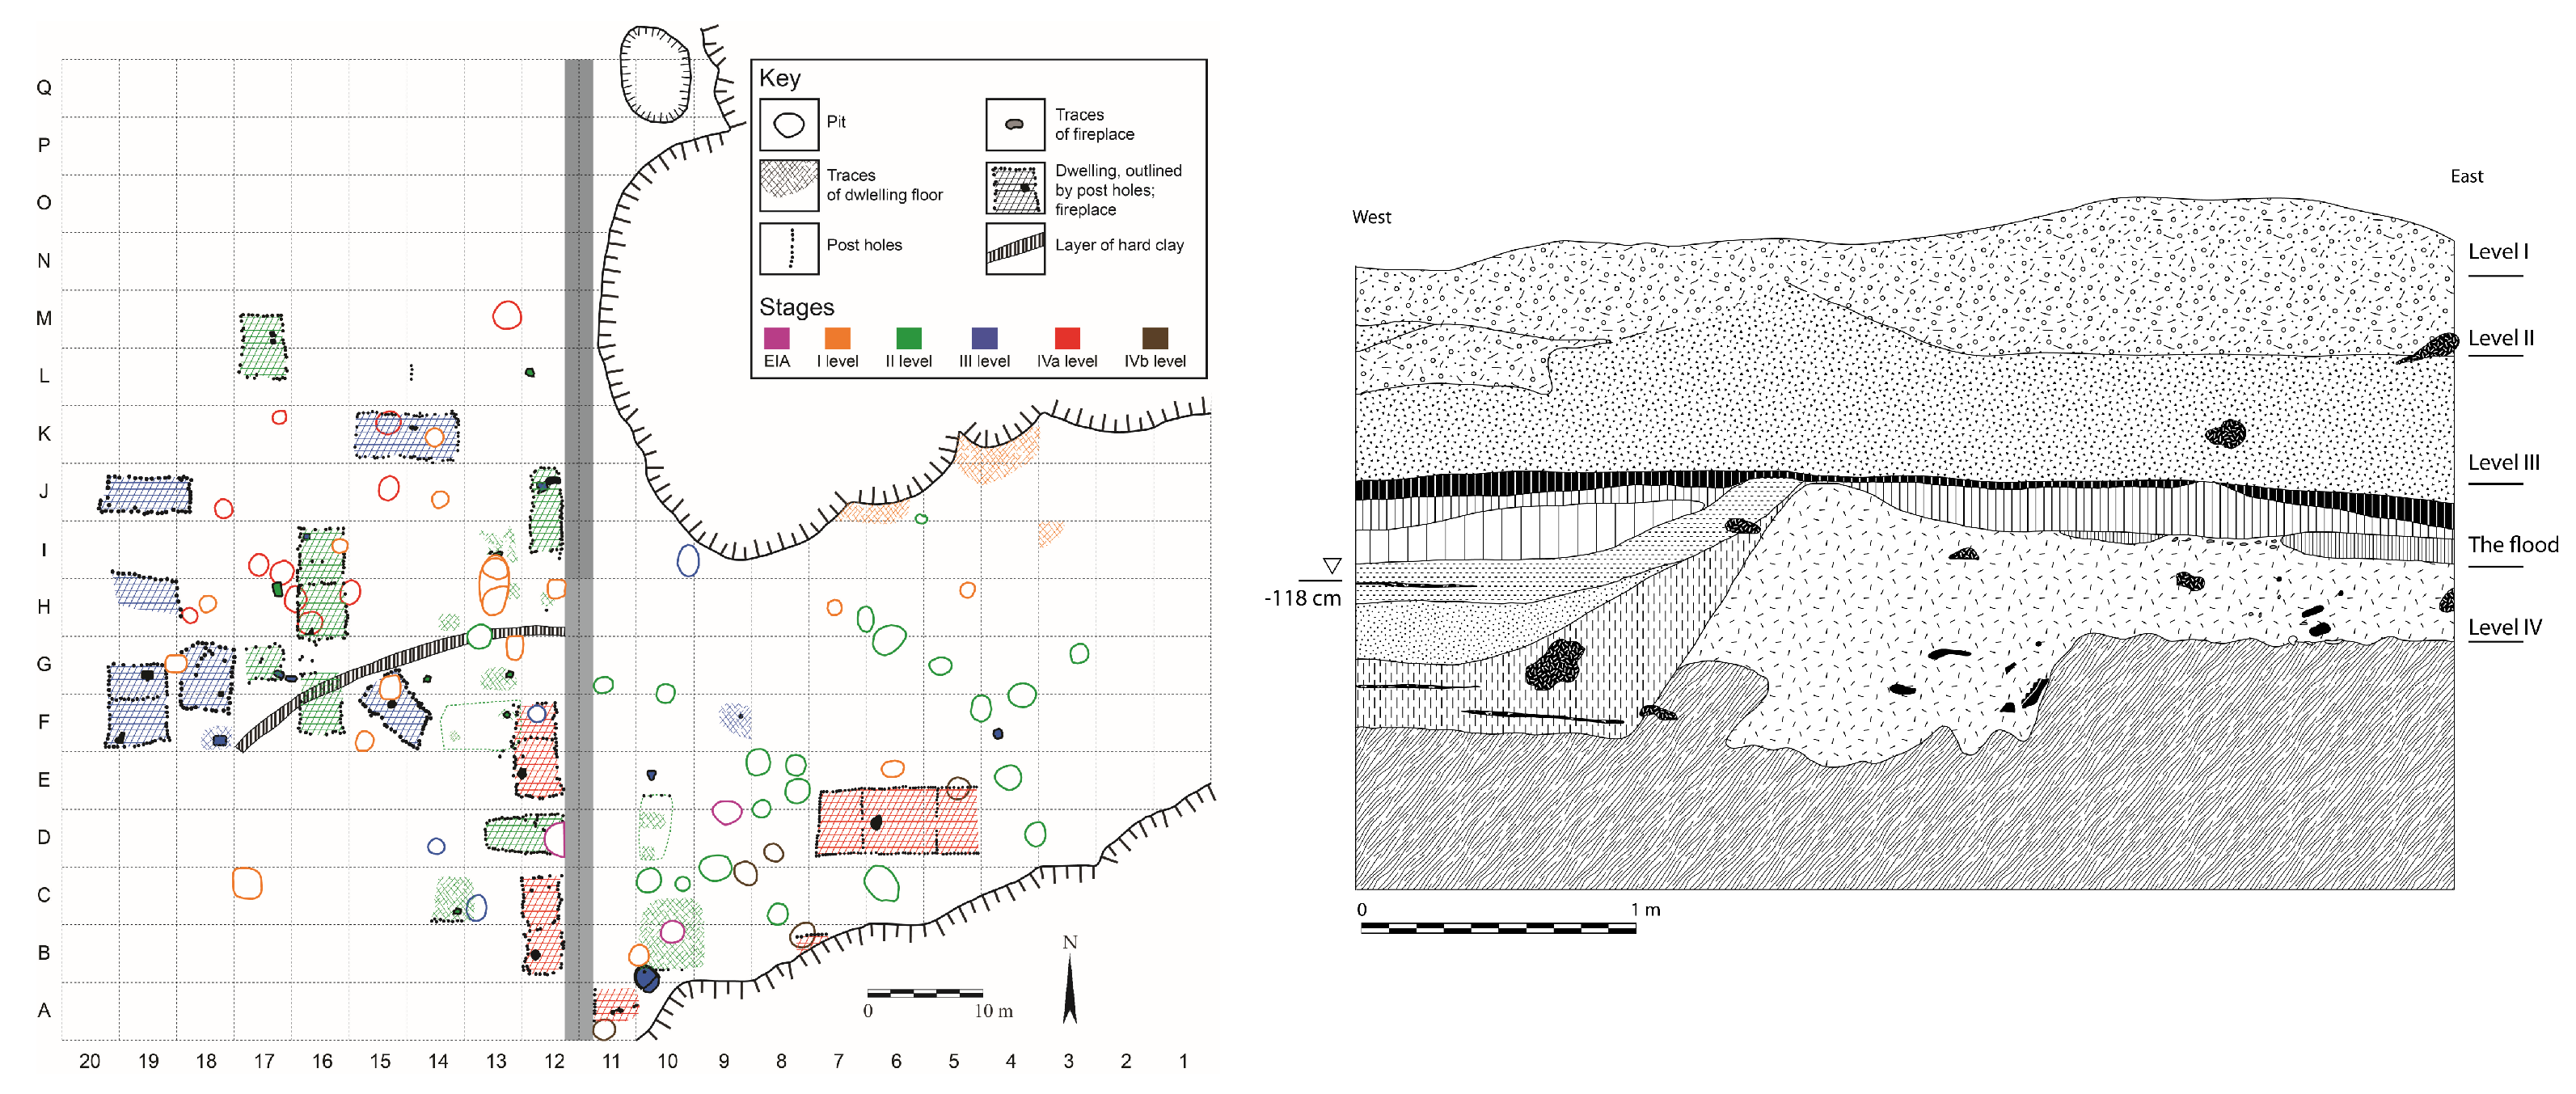
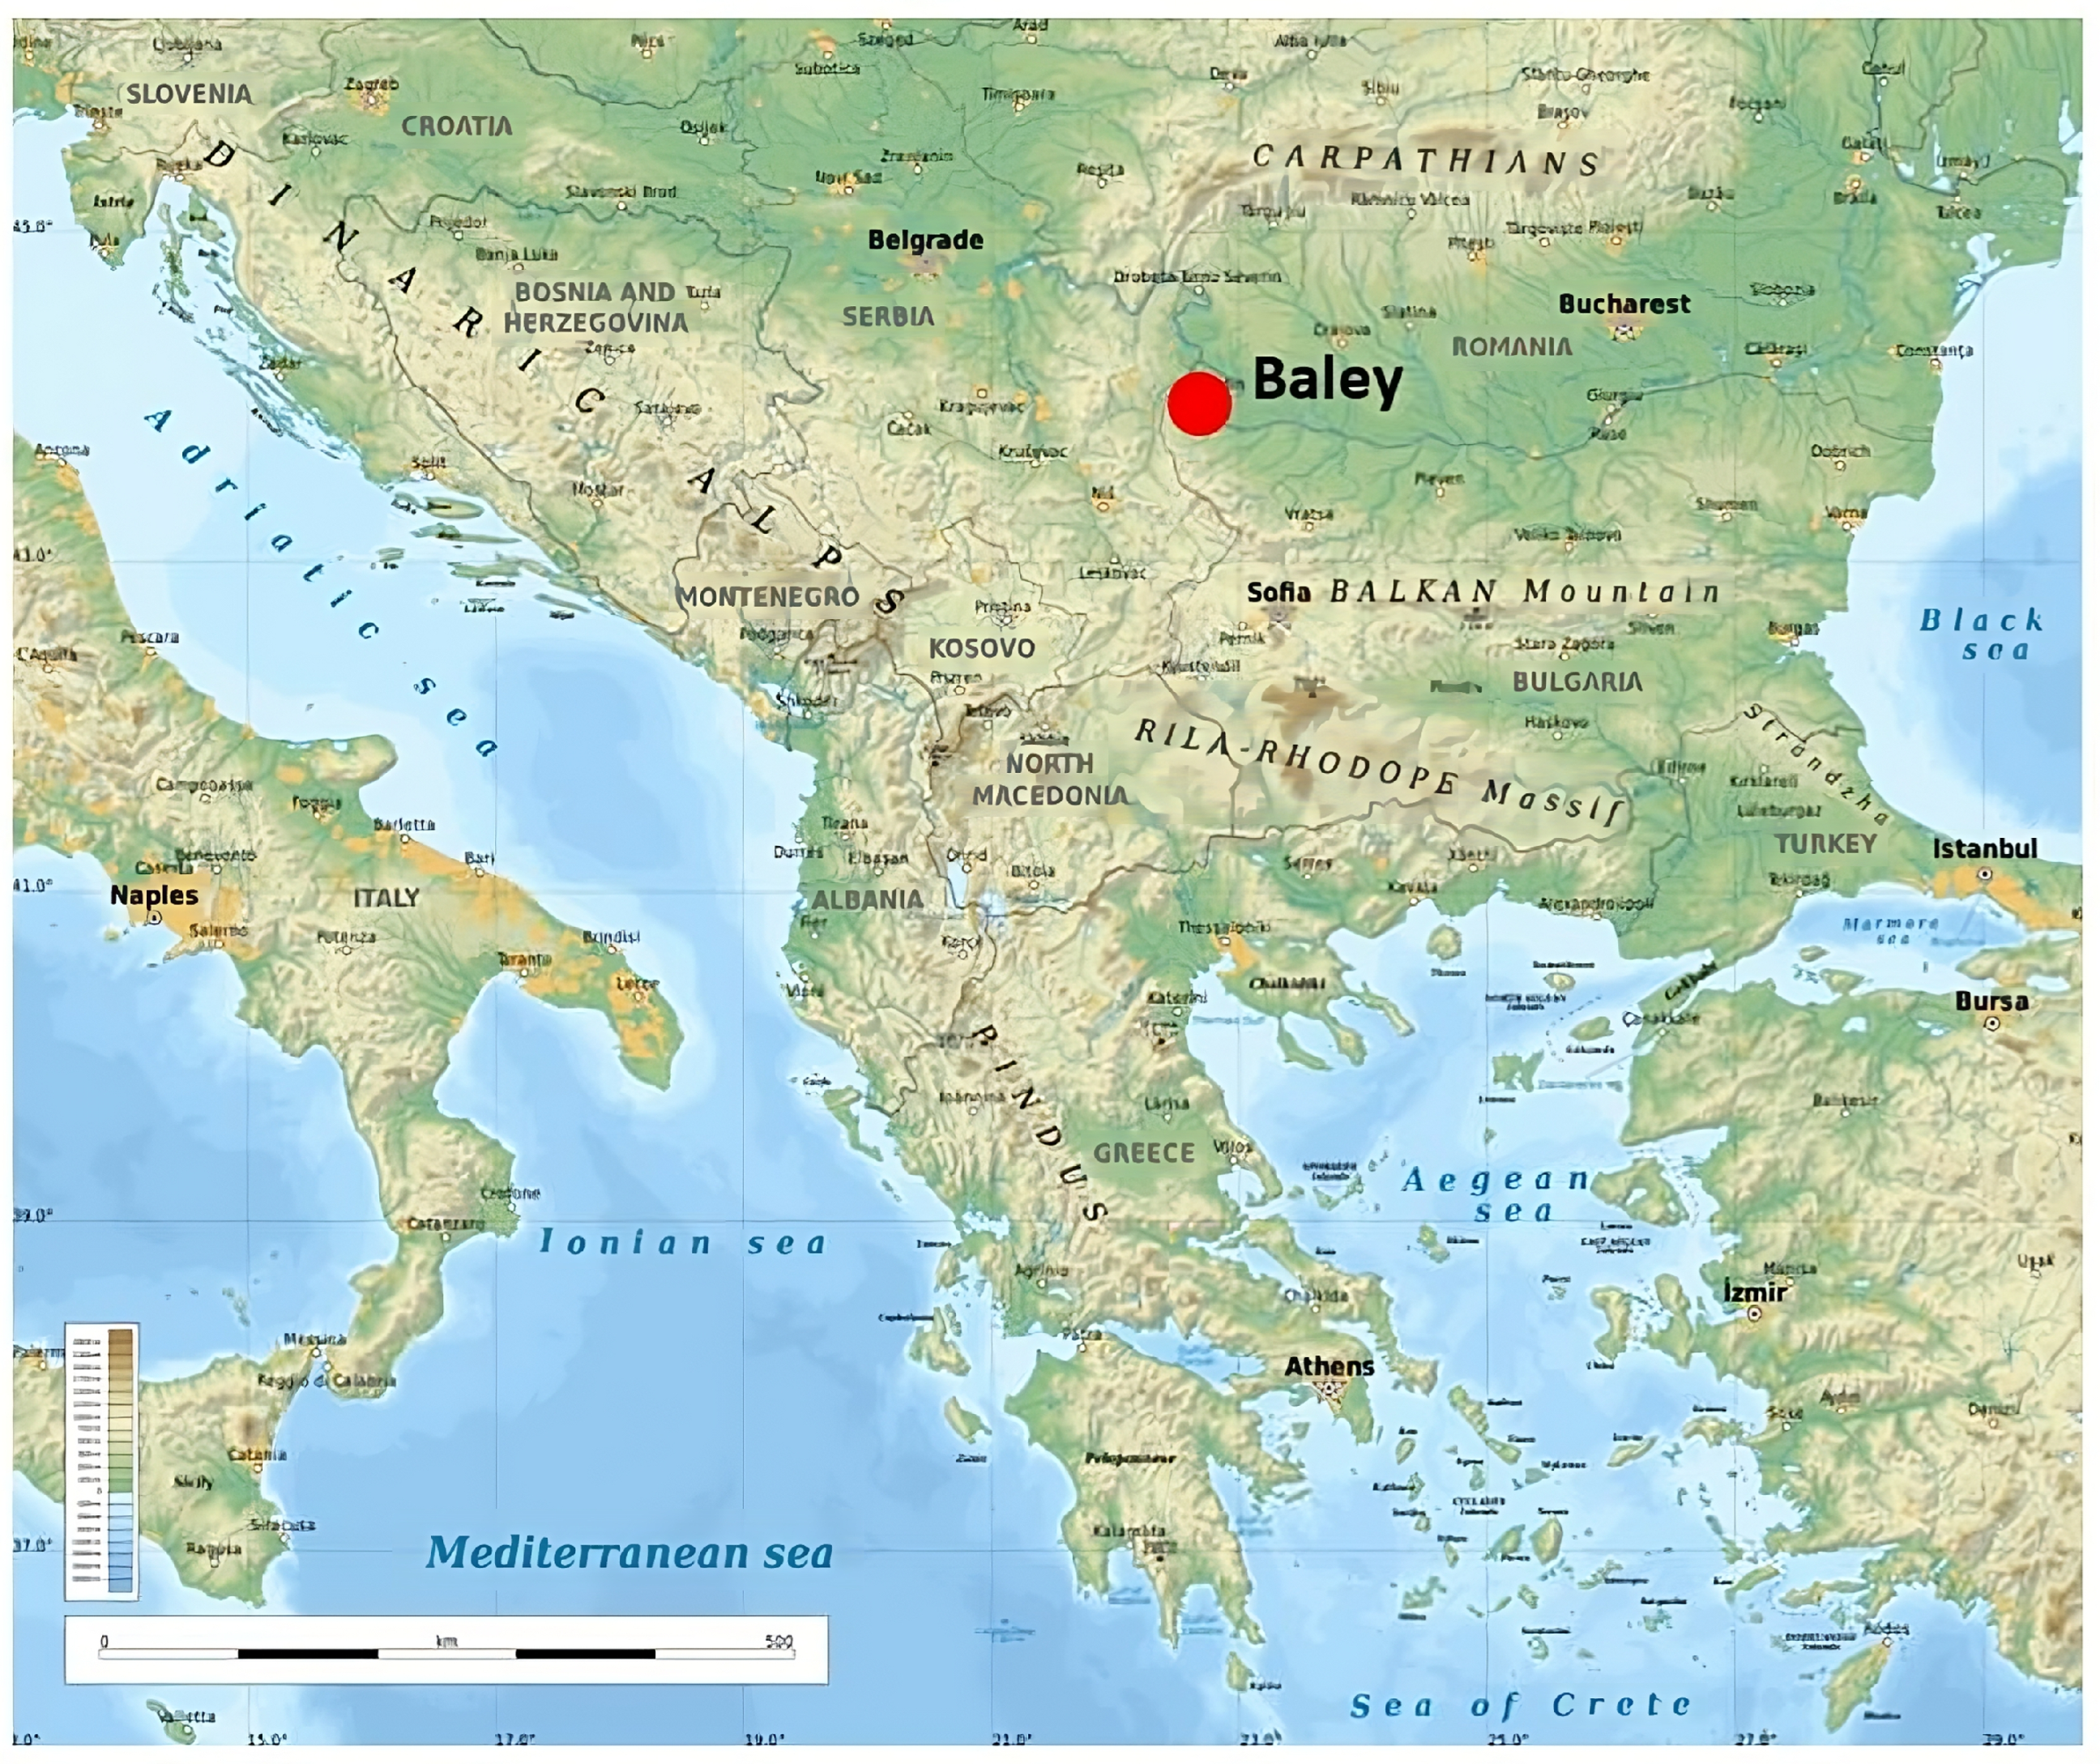
2. Prehistoric Complex Baley
3. Materials and Methods
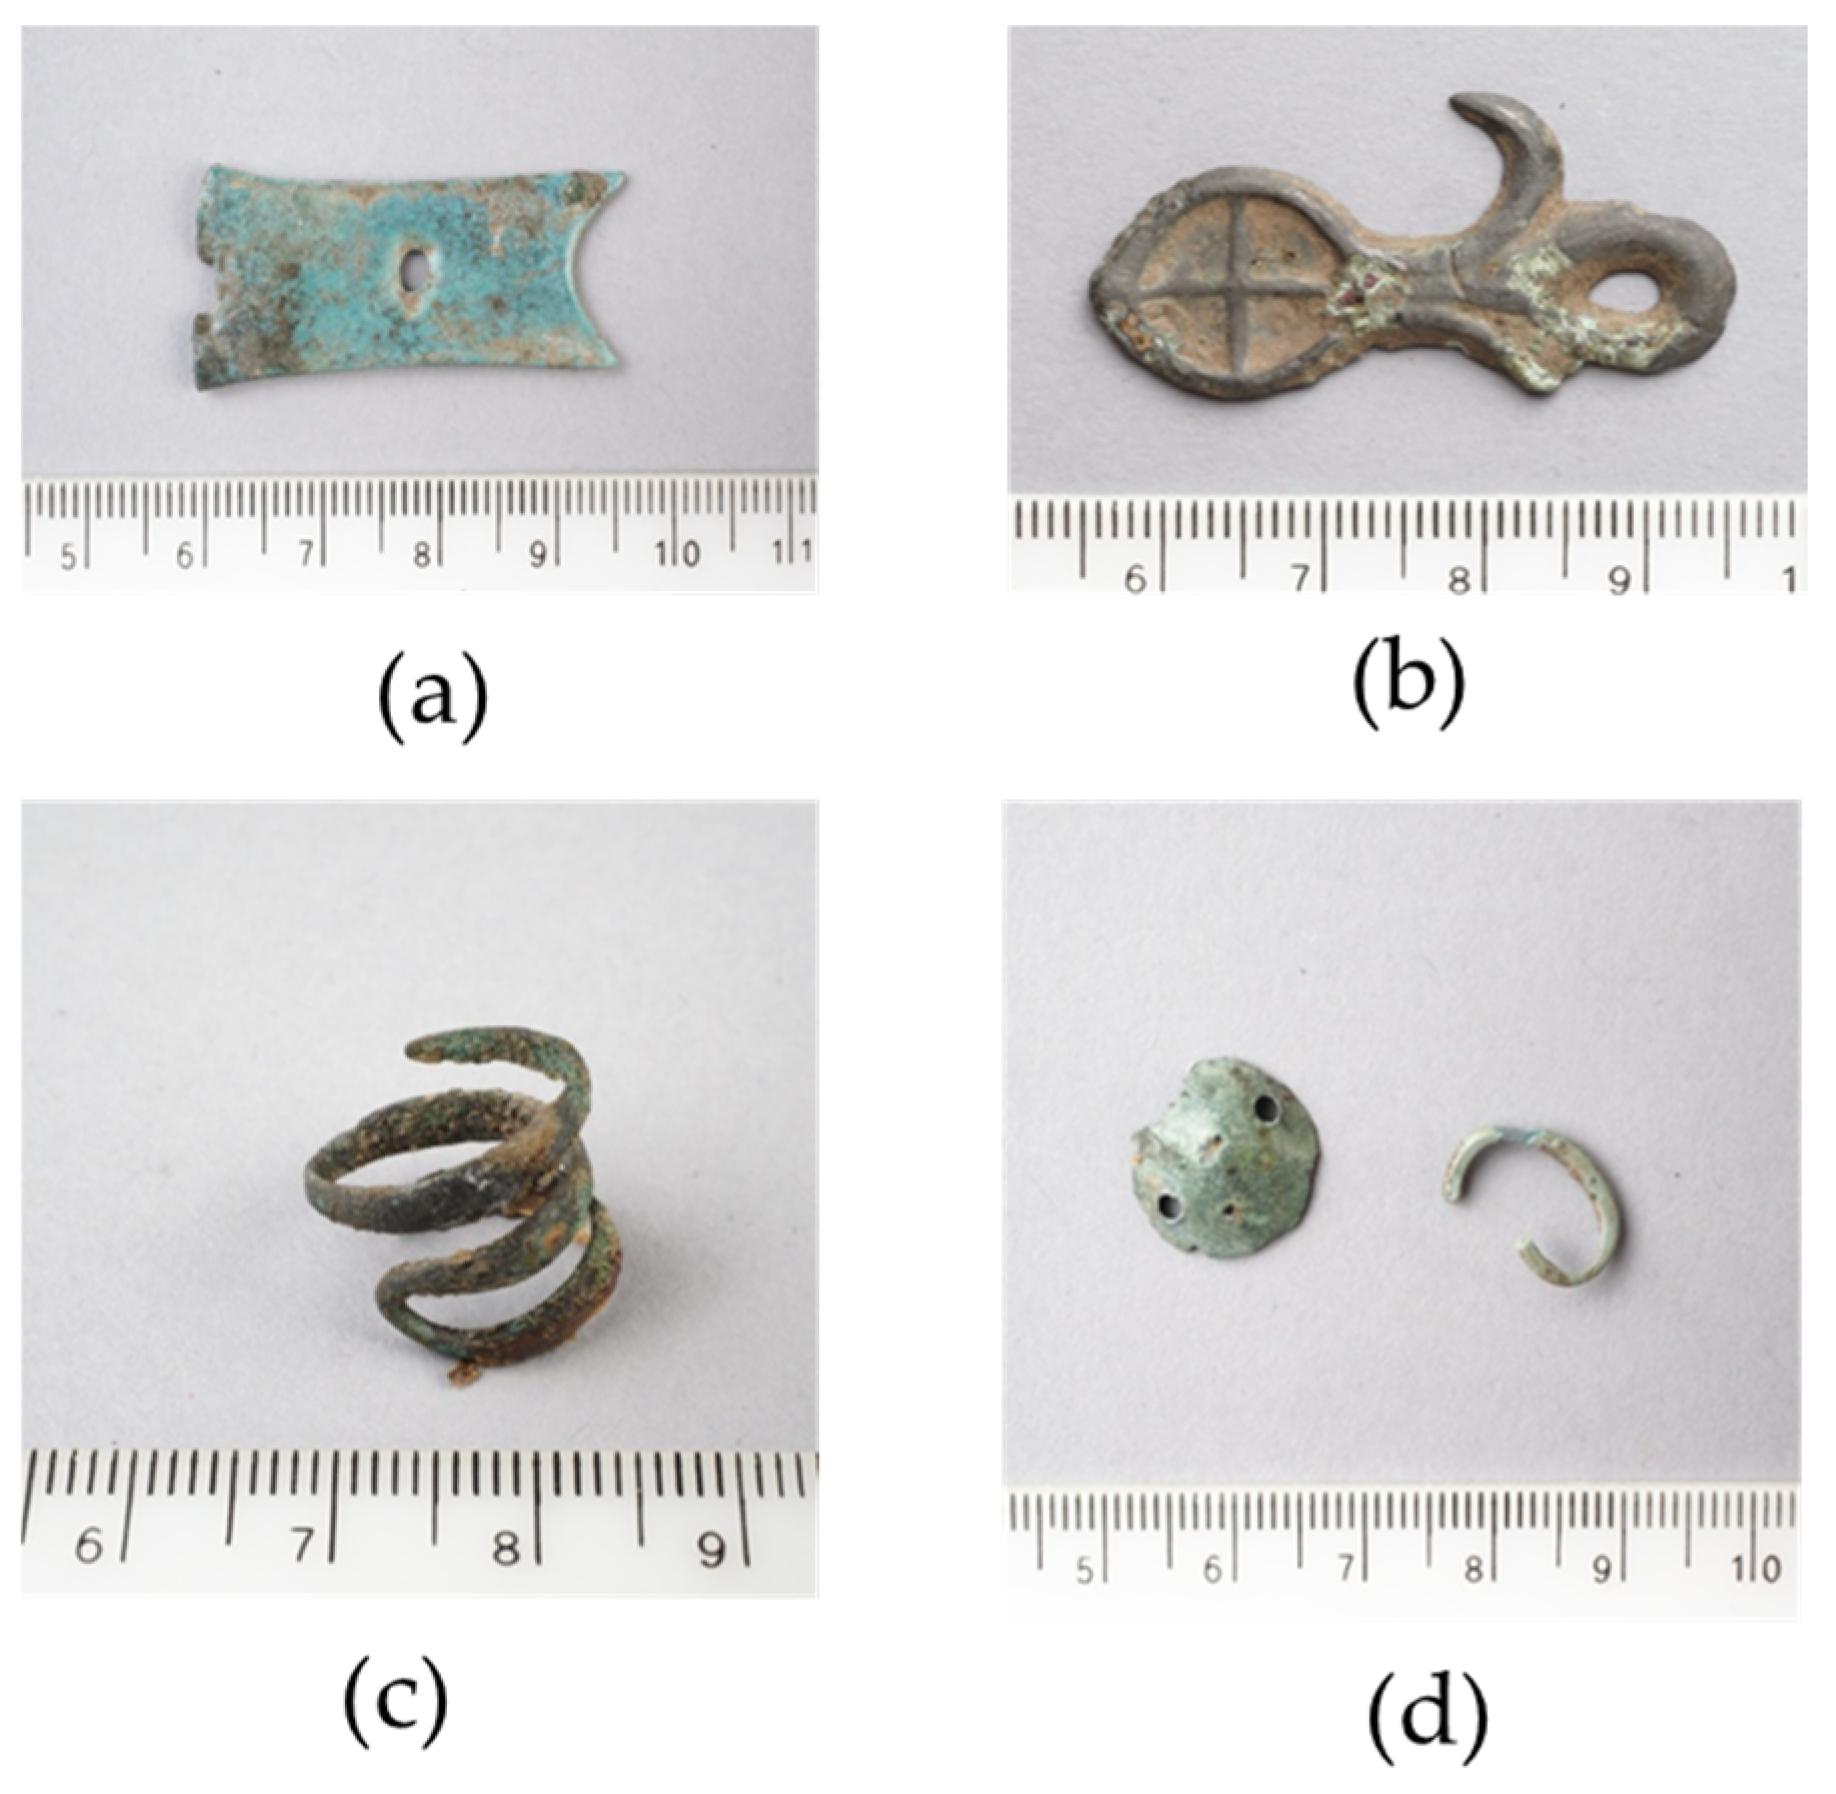
3.1. Investigated Artefacts
3.2. Methods
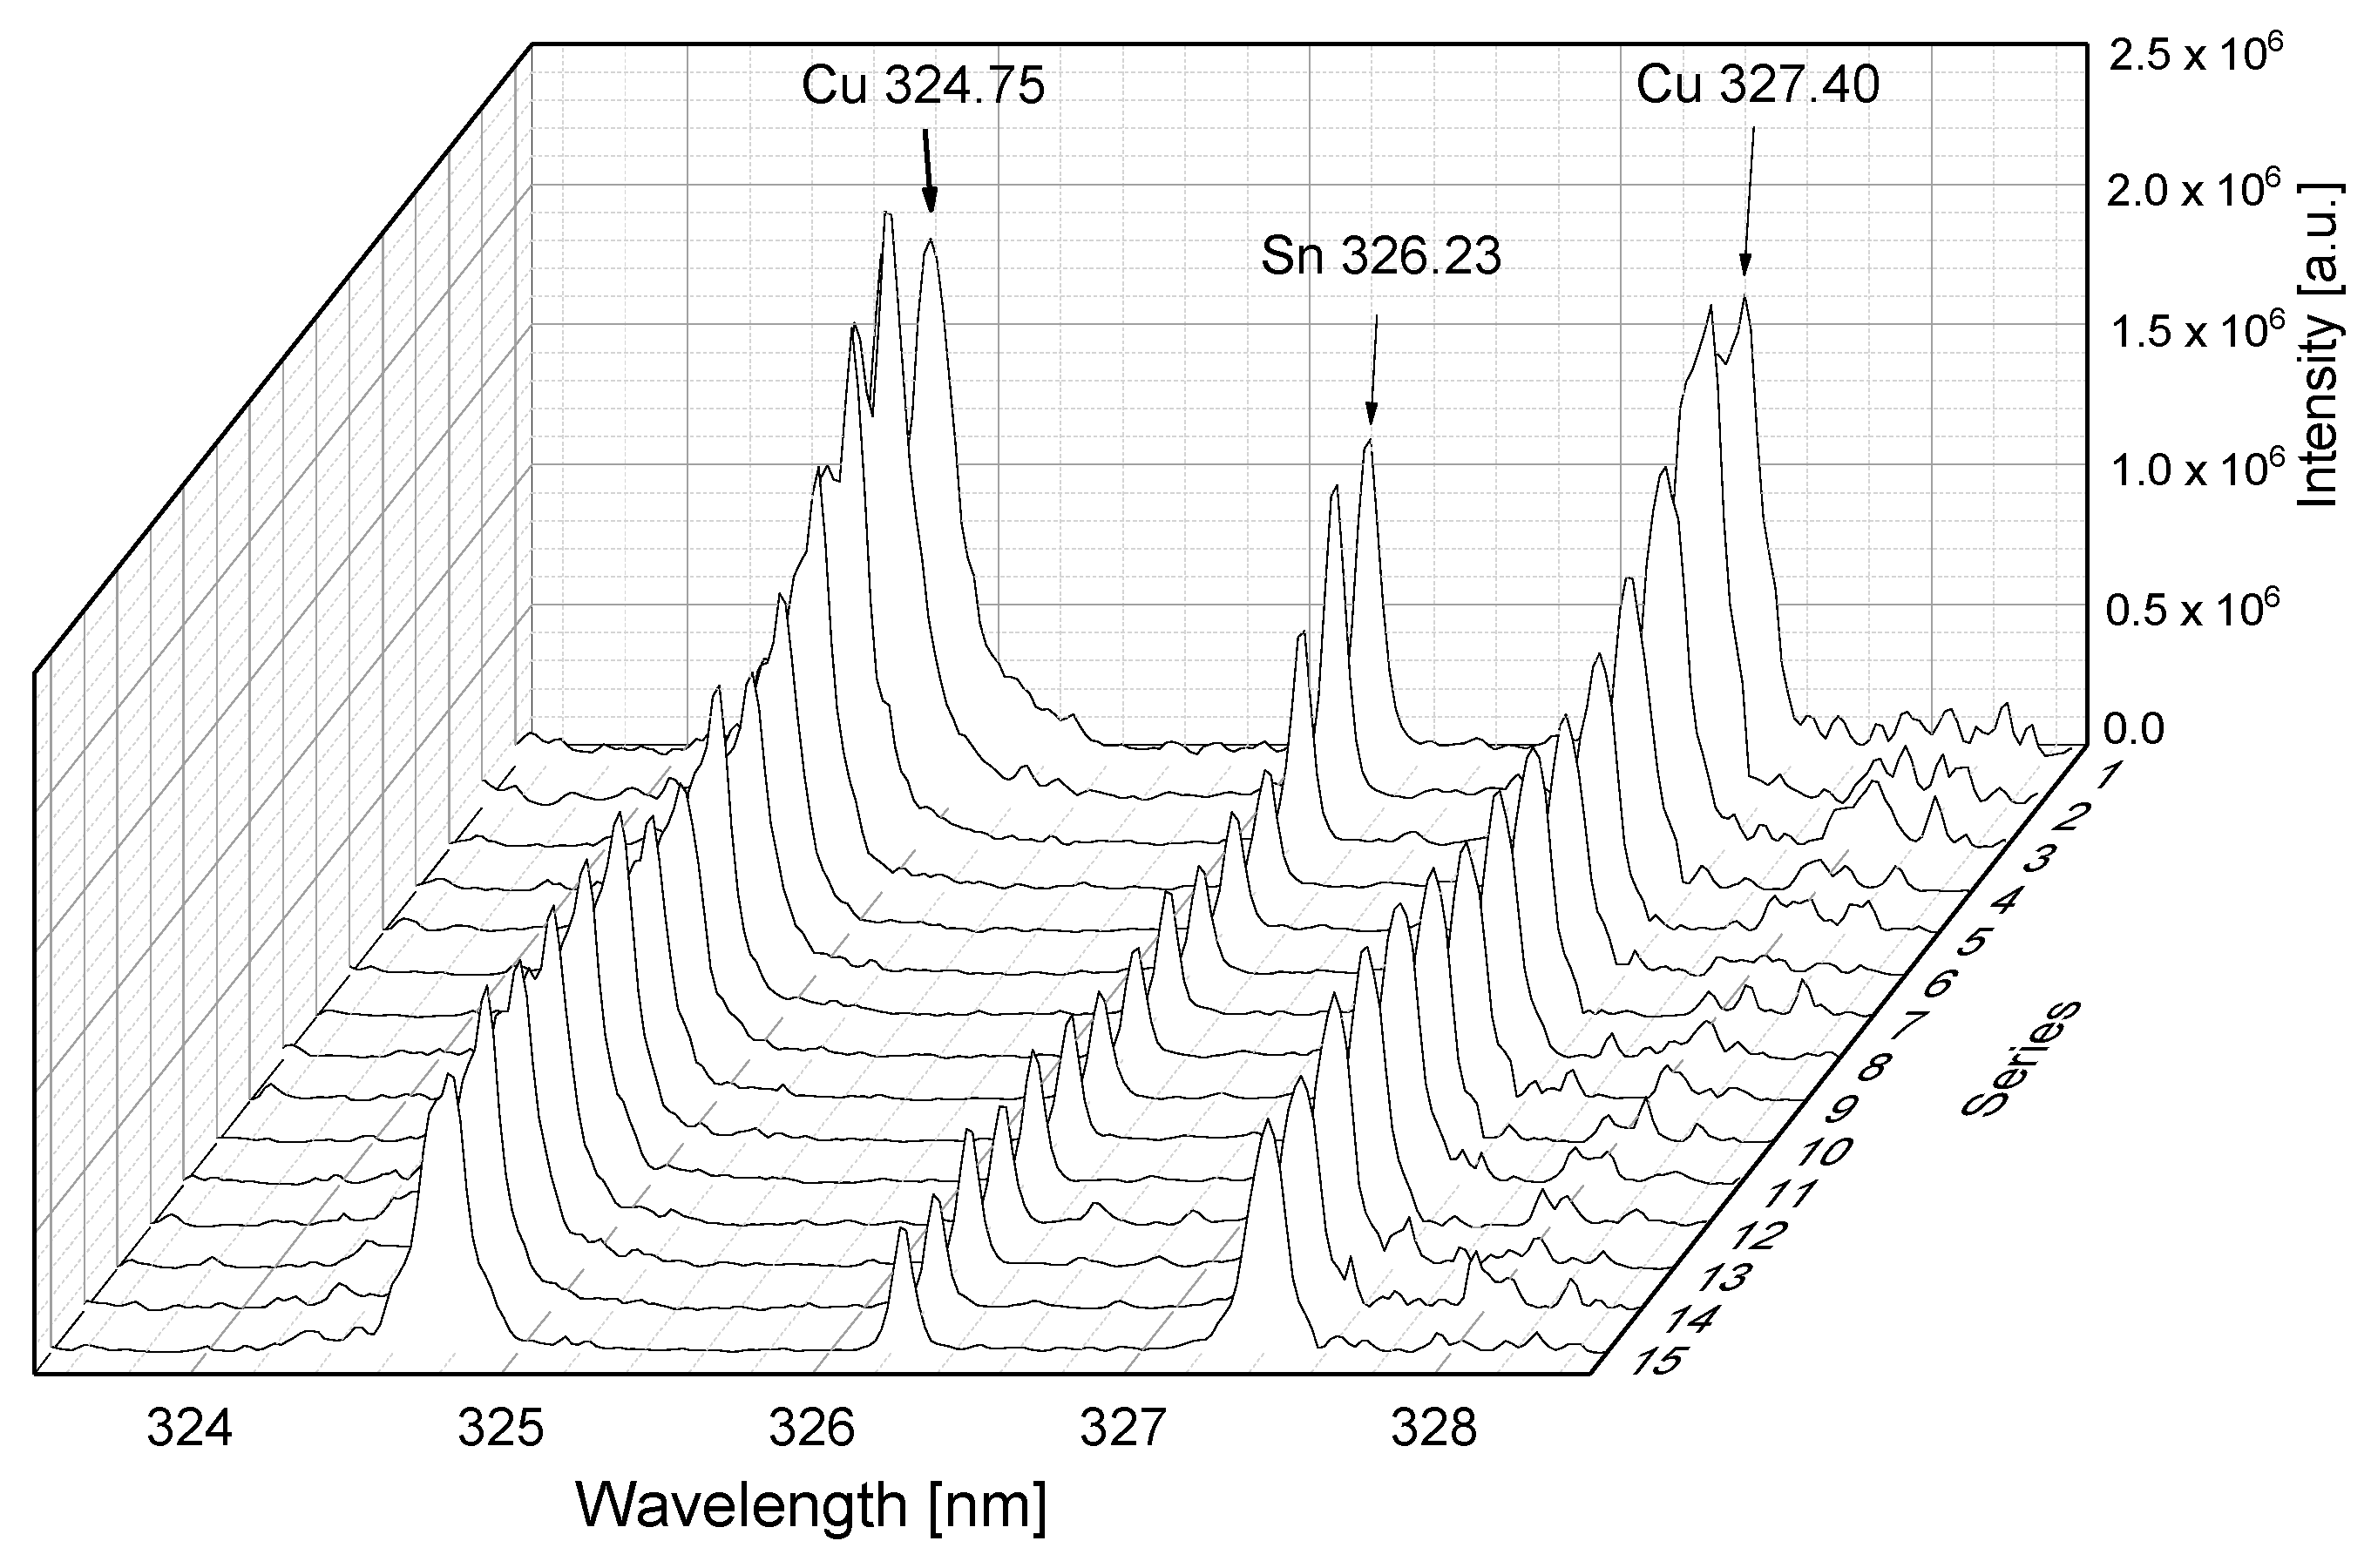
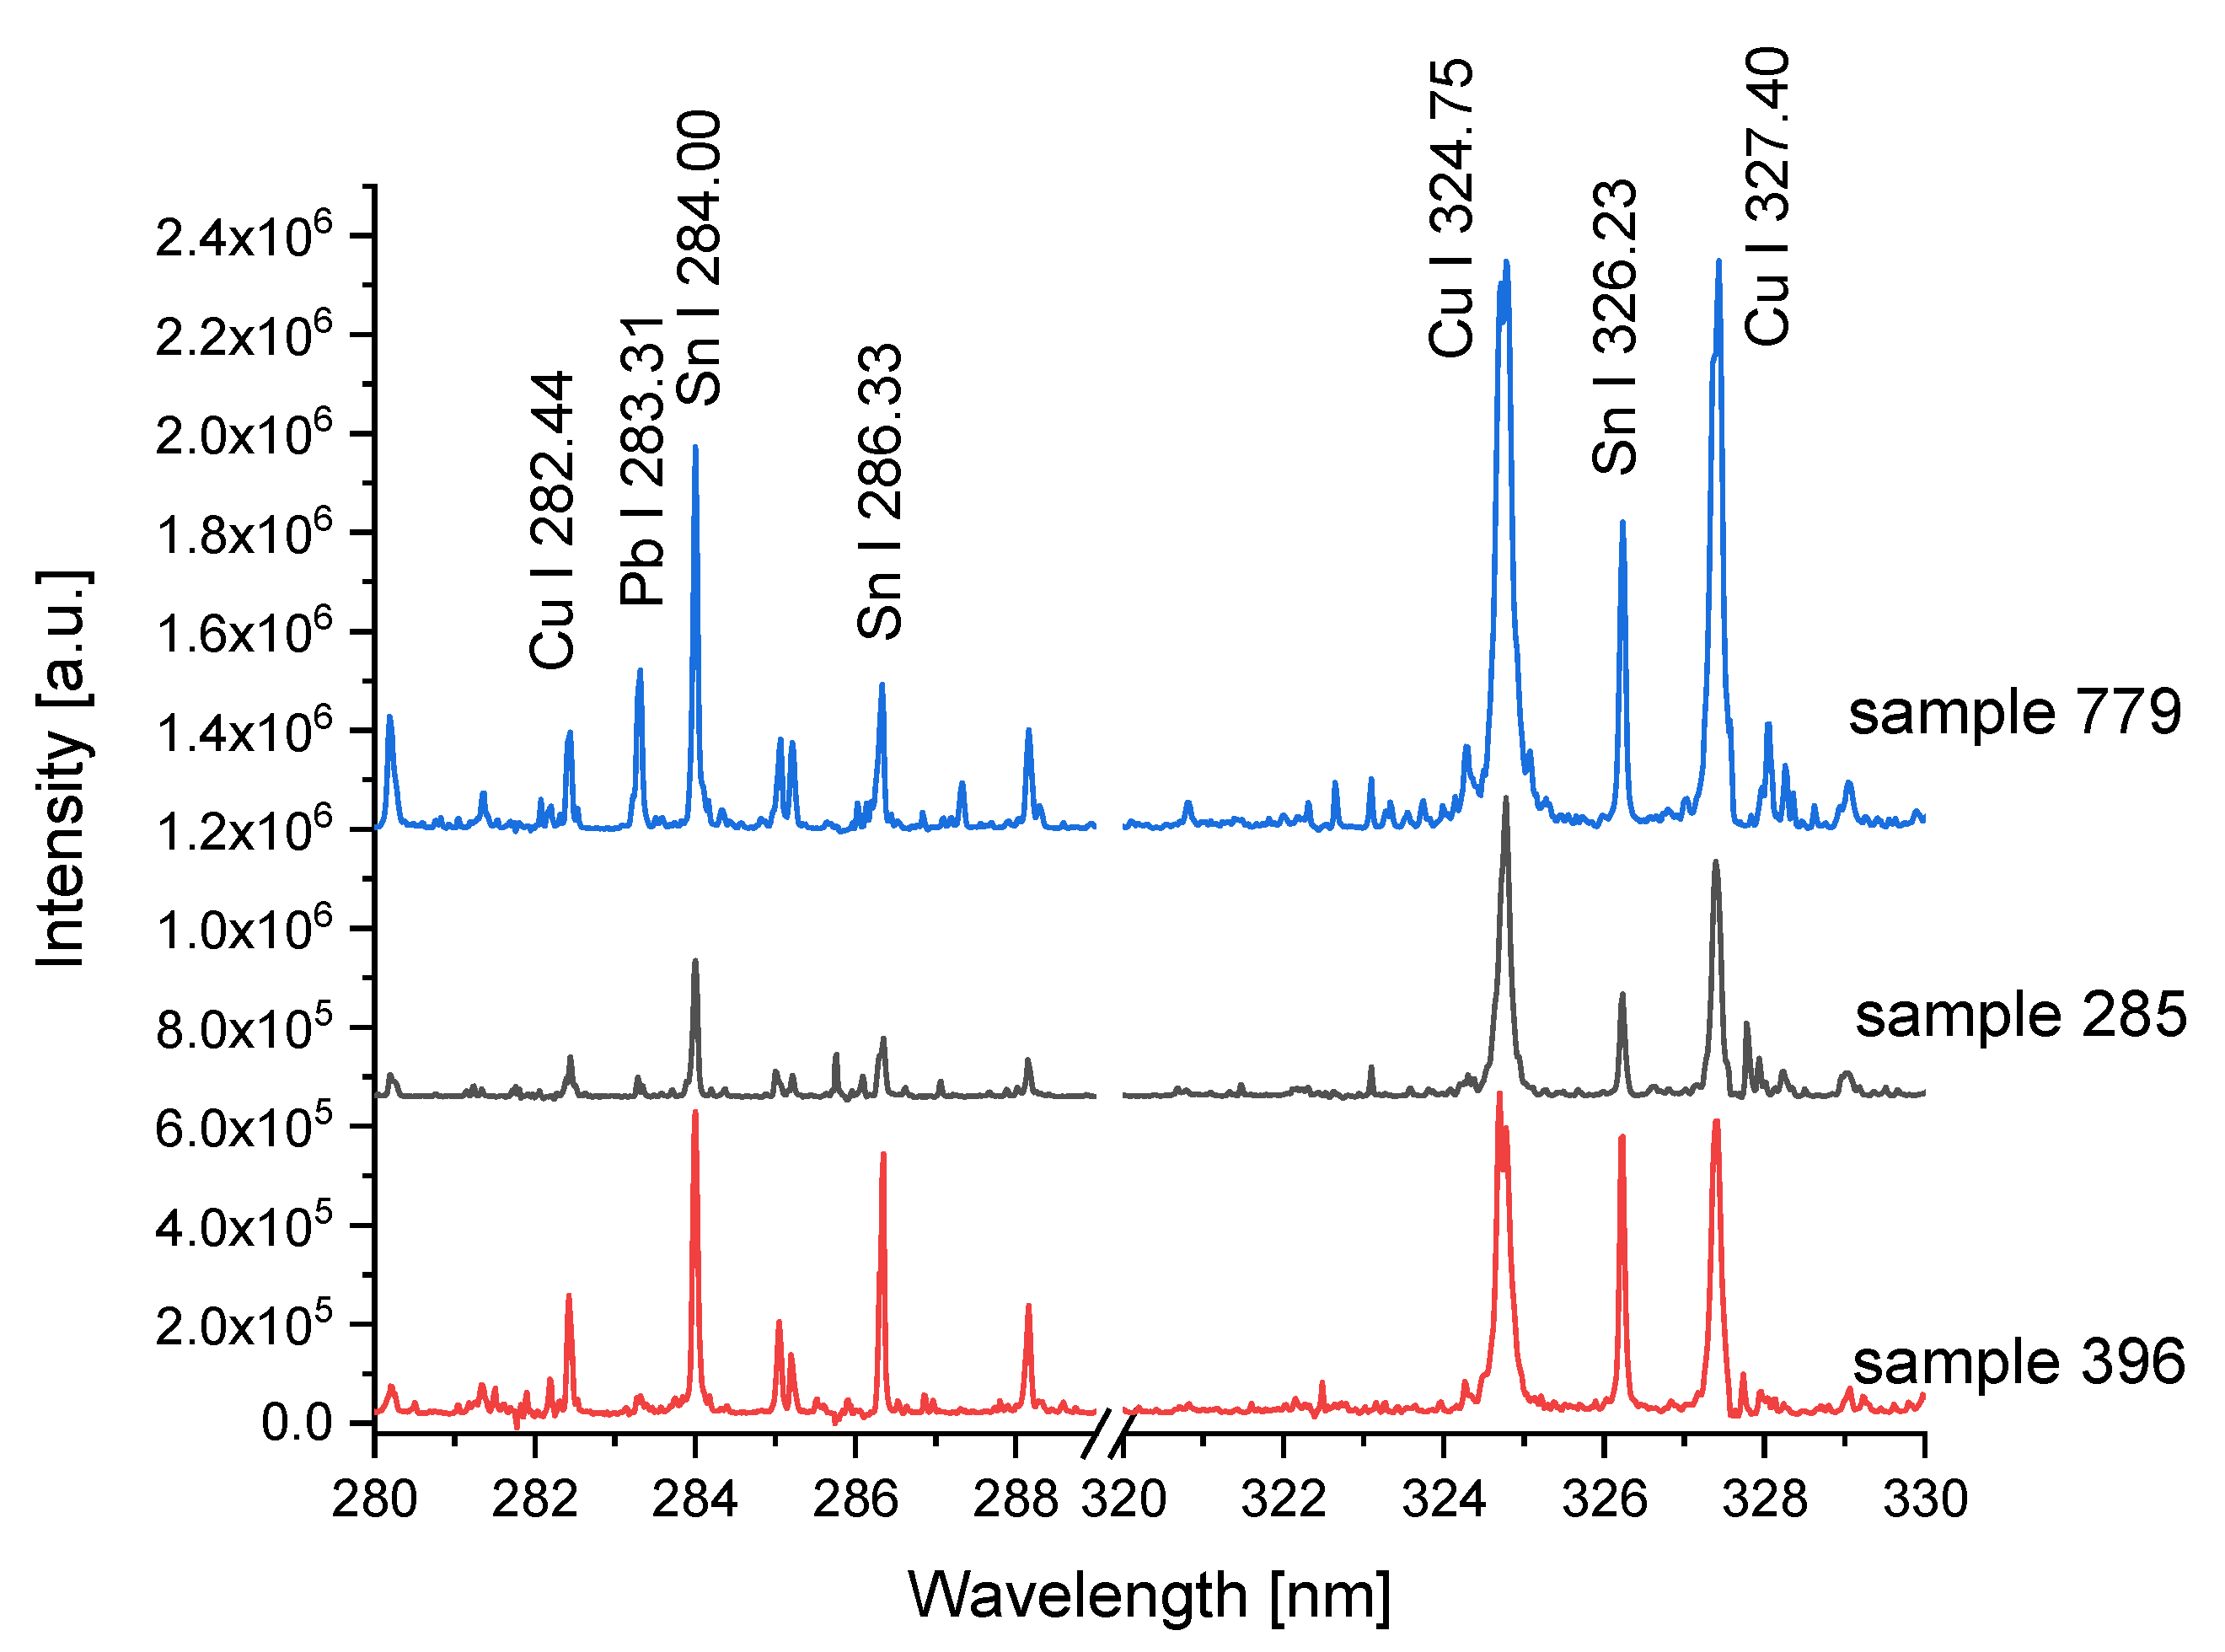
3.2.1. Laser-Induced Breakdown Spectroscopy
3.2.2. X-ray Fluorescence Spectroscopy
3.2.3. Principal Component Analysis
4. Results and Discussion
5. Conclusions
Author Contributions
Funding
Institutional Review Board Statement
Informed Consent Statement
Data Availability Statement
Acknowledgments
Conflicts of Interest
References
- Goffer, Z. Archaeological Chemistry, 2nd ed.; John Wiley & Sons, Inc.: Hoboken, NJ, USA, 2007; pp. 165–184. [Google Scholar]
- Scott, D.; Podany, J.; Considine, B. Ancient & Historic Metals: Conservation and Scientific Research; Oxford University Press: Oxford, UK, 1995. [Google Scholar]
- Fortes, F.J.; Cortés, M.; Simòn, M.D.; Cabalìn, L.M.; Laserna, J.J. Chronocultural sorting of archaeological bronze objects using laser-induced breakdown spectrometry. Anal. Chim. Acta 2005, 554, 136–143. [Google Scholar] [CrossRef]
- Casaletto, M.P.; Privitera, A.; Figa, V. Nanoscale Investigations of the Corrosion of Metallic Artworks by X-ray Photoemission Spectroscopy. In Proceedings of the 2018 IEEE 4th International Forum on Research and Technology for Society and Industry (RTSI), Palermo, Italy, 10–13 September 2018. [Google Scholar]
- Pollard, A.M. (Ed.) Elemental analysis by absorption and emission spectroscopies in the visible and ultraviolet. In Analytical Chemistry in Archaeology; Cambridge University Press: Cambridge, UK, 2007; pp. 47–69. [Google Scholar]
- Moro, D.; Ulian, G.; Valdre, G. SEM-EDS microanalysis of ultrathin glass and metal fragments: Measurement strategy by Monte Carlo simulation in cultural heritage and archaeology. Int. J. Conserv. Sci. 2020, 11, 223–232. [Google Scholar]
- Ghani-ur-Rahman; Basid, A. Scanning Electron Microscopy in Archaeology: The Analysis of Unknown Specimen Recovered from District Shangla, Pakistan. J. Asian Civiliz. 2015, 38, 153–164. [Google Scholar]
- Vannoorenberghe, M.; Van Acker, T.; Belza, J.; Teetaert, D.; Crombé, P.; Vanhaecke, F. Multi-element LA-ICP-MS analysis of the clay fraction of archaeological pottery in provenance studies: A methodological investigation. J. Anal. At. Spectrom. 2020, 35, 2686–2696. [Google Scholar] [CrossRef]
- Dussubieux, L. LA-ICP-MS analysis of Andean ceramics: Comparability and data correction for datasets acquired over almost two decades. J. Archaeol. Sci. Rep. 2023, 48, 103856. [Google Scholar] [CrossRef]
- Bersani, D.; Conti, C.; Matousek, P.; Pozzi, F.; Vandenabeele, P. Methodological evolutions of Raman spectroscopy in art and archaeology. Anal. Methods 2016, 8, 8395–8409. [Google Scholar] [CrossRef] [Green Version]
- Ropret, P.; Madariaga, J.M. Applications of Raman spectroscopy in art and archaeology. J. Raman Spectrosc. 2014, 45, 985–992. [Google Scholar] [CrossRef]
- Glavcheva, Z.I.; Yancheva, D.Y.; Kancheva, Y.K.; Velcheva, E.A.; Stamboliyska, B.A. Development of FTIR spectra database of reference art and archaeological materials. Bulg. Chem. Commun. 2014, 46, 164–169. [Google Scholar]
- Legan, L.; Leskovar, T.; Črešnar, M.; Cavalli, F.; Innocenti, D.; Ropret, P. Non-invasive reflection FTIR characterization of archaeological burnt bones: Reference database and case studies. J. Cult. Herit. 2020, 41, 13–26. [Google Scholar] [CrossRef]
- Alberghina, M.F.; Barraco, R.; Brai, M.; Schillaci, T.; Tranchina, L. Double Laser LIBS and micro-XRF spectroscopy applied to characterize materials coming from the Greek-Roman theater of Taormina. Proc. SPIE 2009, 7391, 61–71. [Google Scholar]
- Ferretti, M.; Cristoforetti, G.; Cristoforetti, S.; Palleschi, V.; Salvetti, A.; Tognoni, E.; Console, E.; Palaia, P. In situ study of the Porticello Bronzes by portable X-ray fluorescence and laser-induced breakdown spectroscopy. Spectrochim. Acta Part B 2007, 62, 1512–1518. [Google Scholar] [CrossRef]
- Alberghina, M.F.; Barraco, R.; Brai, M.; Schillaci, T.; Tranchina, L. Comparison of LIBS and m-XRF measurements on bronze alloys for monitoring plasma effects. J. Phys. Conf. Ser. 2011, 275, 012017. [Google Scholar] [CrossRef]
- Wallace, S.; Smith, N.; Nerantzis, N. Handheld Methods in Archaeological Research on Large Copper Alloy Assemblages: HH-XRF Against HH-LIBS. Archaeometry 2021, 63, 343–371. [Google Scholar] [CrossRef]
- Arafat, A.; Na’es, M.; Kantarelou, V.; Haddad, N.; Giakoumaki, A.; Argyropoulos, V.; Anglos, D.; Karydas, A.G. Combined in situ micro-XRF, LIBS and SEM-EDS analysis of base metal and corrosion products for Islamic copper alloyed artefacts from Umm Qais museum. J. Cult. Herit. 2013, 14, 261–269. [Google Scholar] [CrossRef]
- Agresti, J.; Osticioli, I.; Guidotti, M.C.; Kardjilov, N.; Siano, S. Non-invasive archaeometallurgical approach to the investigations of bronze figurines using neutron, laser, and X-ray techniques. Microchem. J. 2016, 124, 765–774. [Google Scholar] [CrossRef]
- Zmuda-Trzebiatowska, I.; del Hoyo-Mel’endez, J.; Śliwiński, G. Material composition evaluation of historical Cu alloy aquamanilia by complementary XRF and LIBS measurements. Eur. Phys. J. Plus 2019, 134, 269. [Google Scholar] [CrossRef]
- Siano, S.; Agresti, J. Archaeometallurgical characterisation of Donatello’s Florentine copper alloy masterpieces using portable laser-induced plasma spectroscopy and traditional techniques. Stud. Conserv. 2015, 60, S106–S119. [Google Scholar] [CrossRef]
- Kuzmanovic, M.; Stancalie, A.; Milovanovic, D.; Staicu, A.; Damjanovic-Vasilic, L.J.; Rankovic, D.; Savovic, J. Analysis of lead-based archaeological pottery glazes by laser induced breakdown spectroscopy. Opt. Laser Technol. 2021, 134, 106599. [Google Scholar] [CrossRef]
- Pardini, L.; El Hassan, A.; Ferretti, M.; Foresta, A.; Legnaioli, S.; Lorenzetti, G.; Nebbia, E.; Catalli, F.; Harith, M.A.; Diaz Pace, D.; et al. X-ray Fluorescence and Laser-Induced Breakdown Spectroscopy analysis of Roman silver denarii. Spectrochim. Acta Part B 2012, 74–75, 156–161. [Google Scholar] [CrossRef]
- Lazic, V.; Vadrucci, M.; Fantoni, R.; Chiari, M.; Mazzinghi, A.; Gorghinian, A. Applications of Laser Induced Breakdown Spectros-copy (LIBS) for Cultural Heritage: A Comparison with XRF and PIXE Techniques. Spectrochim. Acta Part B At. Spectrosc. 2018, 149, 1–14. [Google Scholar] [CrossRef]
- Abdelhamid, M.; Grassini, S.; Angelini, E.; Ingo, G.M.; Harith, M.A. Depth profiling of coated metallic artifacts adopting laser-induced breakdown spectrometry. Spectrochim. Acta Part B At. Spectrosc. 2010, 65, 695–701. [Google Scholar] [CrossRef]
- Corsi, M.; Cristoforetti, G.; Giuffrida, M.; Hidalgo, M.; Legnaioli, S.; Masotti, L.; Palleschi, V.; Salvetti, A.; Tognoni, E.; Vallebona, C.; et al. Archaeometric Analysis of Ancient Copper Artefacts by Laser-Induced Breakdown Spectroscopy Technique. Microchim. Acta 2005, 152, 105–111. [Google Scholar] [CrossRef]
- He, J.; Liu, Y.; Pan, C.; Du, X. Identifying Ancient Ceramics Using Laser-Induced Breakdown Spectroscopy Combined with a Back Propagation Neural Network. Appl. Spectrosc. 2019, 73, 1201–1207. [Google Scholar] [CrossRef]
- Singh, P.; Mal, E.; Khare, A.; Sharma, S. A study of archaeological pottery of Northeast India using laser induced breakdown spectroscopy (LIBS). J. Cult. Herit. 2018, 33, 71–82. [Google Scholar] [CrossRef]
- Singh, J.P.; Thakur, S.N. Laser-Induced Breakdown Spectroscopy, 2nd ed.; Elsevier Science: Amsterdam, The Netherlands, 2020. [Google Scholar]
- Cremers, D.A.; Radziemski, L.J. Handbook of Laser-Induced Breakdown Spectroscopy, 1st ed.; Wiley & Sons Ltd.: Chichester, UK, 2006. [Google Scholar]
- Foster, P.A. Guide to Laser-Induced Breakdown Spectroscopy; Nova Science Pub. Inc.: Hauppauge, NY, USA, 2020. [Google Scholar]
- Jolivet, L.; Leprince, M.; Moncayo, S.; Sorbier, L.; Lienemann, C.P.; Motto-Ros, V. Review of the recent advances and applications of LIBS-based imaging. Spectrochim. Acta Part B At. Spectrosc. 2019, 151, 41–53. [Google Scholar] [CrossRef]
- Khan, Z.H.; Ullah, M.H.; Rahman, B.; Talukder, A.I.; Wahadoszamen, M.; Abedin, K.M.; Haider, A.F.M.Y. Laser-Induced Breakdown Spectroscopy (LIBS) for Trace Element Detection: A Review. J. Spectrosc. 2022, 2022, 3887038. [Google Scholar] [CrossRef]
- Detalle, V.; Bai, X. The assets of laser-induced breakdown spectroscopy (LIBS) for the future of heritage science. Spectrochim. Acta Part B At. Spectrosc. 2022, 191, 106407. [Google Scholar] [CrossRef]
- Orlic Bachler, M.; Bišcan, M.; Kregar, Z.; Jelovica Badovinac, I.; Dobrinic, J.; Miloševic´, S. Analysis of antique bronze coins by Laser Induced Breakdown Spectroscopy and multivariate analysis. Spectrochim. Acta Part B 2016, 123, 163–170. [Google Scholar] [CrossRef]
- Moncayo, S.; Kociánová, M.; Hulík, J.; Plavčan, J.; Horňáčková, M.; Suchoňová, M.; Veis, P.; Cáceres, J.O. Discrimination of Copper Alloys with Archaeological Interest Using LIBS and Chemometric Methods. In Proceedings of the 2014 World Data System (WDS) Contributed Paper–Physics, Prague, Czech Republic, 3–5 June 2014; pp. 131–135. [Google Scholar]
- Pořízka, P.; Klus, J.; Képeš, E.; Prochazka, D.; Hahn, D.W.; Kaiser, J. On the utilization of principal component analysis in laser-induced breakdown spectroscopy data analysis, a review. Spectrochim. Acta Part B 2018, 148, 65–82. [Google Scholar] [CrossRef]
- Alexandrov, S.; Ivanov, G.; Hristova, T. The necropolis of Baley in Northwest Bulgaria and its significance for the end of the Bronze Age and the beginning of the Iron Age in the Lower Danube region. In Southeast Europe and Anatolia in Prehistory: Essays in Honor of Vassil Nikolov on His 65th Anniversary, 1st ed.; Bacvarov, K., Gleser, R., Eds.; Universitätsforschungen zur Prähistorischen Archäologie 293: Bonn, Germany, 2016; pp. 149–158. [Google Scholar]
- Streli, C.; Wobrauschek, P.; Kregsamer, P. X-ray Fluorescence Spectroscopy, Applications. In Encyclopedia of Spectroscopy & Spectrometry; Lindon, J., Tranter, G., Holmes, J., Eds.; Academia Press Ltd.: Cambridge, MA, USA, 1999; pp. 2478–2487. [Google Scholar]
- Towett, E.K.; Shepherd, K.D.; Cadisch, G. Quantification of total element concentrations in soils using total X-ray fluorescence spectroscopy (TXRF). Sci. Total Environ. 2013, 463–464, 374–388. [Google Scholar] [CrossRef] [Green Version]
- Han, H.; Dang, S.; Acosta, J.C.; Fu, J.; Sondergeld, C.; Rai, C. X-ray Fluorescence and Laser-Induced Breakdown Spectroscopy for Advanced Rock Elemental Analysis. In Proceedings of the SPE/AAPG/SEG Unconventional Resources Technology Conference, Denver, CO, USA, 22–24 July 2019. [Google Scholar]
- Erdem, A.; Çilingiroglu, A.; Giakoumaki, A.; Castanys, M.; Kartsonaki, E.; Fotakis, C.; Anglos, D. Characterization of Iron age pottery from eastern Turkey bylaser-induced breakdown spectroscopy (LIBS). J. Archaeol. Sci. 2008, 35, 2486–2494. [Google Scholar] [CrossRef]
- Schröder, S.; Pavlov, S.G.; Rauschenbach, I.; Jessberger, E.K.; Hübers, H.W. Detection and identification of salts and frozen salt solutions combining laser-induced breakdown spectroscopy and multivariate analysis methods: A study for future martian exploration. Icarus 2013, 223, 61–73. [Google Scholar] [CrossRef]
- Smith, L.A. A Tutorial on Principal Components Analysis; Computer Science Technical Report OUCS-2002-12; University of Otago: Dunedin, New Zealand, 2002. [Google Scholar]
- Robbiola, R.; Blengino, J.M.; Fiaud, C. Morphology and mechanisms of formation of natural patinas on archaeological Cu-Sn alloys. Corros. Sci. 1998, 40, 2083–2111. [Google Scholar] [CrossRef]
- National Institute of Standard and Technology. Available online: http://physics.nist.gov/PhysRefData/ASD/index.html (accessed on 27 April 2023).
- Scott, D.A. Metallography and Microstructure of Ancient and Historic Metals; Getty Conservation Institute in Association with Archetype Books: Marina del Rey, CA, USA, 1991. [Google Scholar]
- Papadimitriou, G. The technological evolution of copper alloys in the Aegean during the prehistoric period. In Aegean Metallurgyin the Bronze Age; Tzachili, I., Ed.; Ta Pragmata Publications: Athens, Greece, 2008; pp. 271–280. [Google Scholar]
- Johannsen, J.W. Heavy Metal–lead in Bronze Age Scandinavia. J. Swed. Antiqu. Res. 2016, 111, 153–161. [Google Scholar]
- Hurcombe, L.M. Archaeological Artifacts as Material Culture; Routledge: London, UK; New York, NY, USA, 2007. [Google Scholar]
- Radivojević, M.; Roberts, B.W. Early Balkan Metallurgy: Origins, Evolution and Society, 6200–3700 BC. J. World Prehist. 2021, 34, 195–278. [Google Scholar] [CrossRef]
- Otto, H.; Witter, W. Handbuch der Ältesten Vorgeschichtlichen Metallurgie in Mitteleuropa; Leipzig: Barth, Germany, 1957. [Google Scholar]


| Level | Sample No. | Sn (LIBS) | Sn (XRF) | Pb (LIBS) | Pb (XRF) | As (XRF) | Sample Description |
|---|---|---|---|---|---|---|---|
| II | 100 | 9.3 | 9.51 | 0.39 | 0.3 | 0.48 | Decorative needle |
| 160 | n.m. | 11.43 | n.m. | 0.51 | 0.23 | Hair ring | |
| 172 | 10.6 | 12.49 | 0.6 | 0.72 | 0.48 | Decorative needle | |
| 174 | 5.82 | 6.31 | 0.25 | 0.37 | 0.64 | Awl | |
| 180 | 9.0 | 8.9 | 0.3 | 0.31 | 0.52 | Awl fragment | |
| 213 | 8.83 | 10.1 | 0.34 | 0.47 | 0.45 | Decorative needle | |
| 214 | n.m. | 12.27 | n.m. | 0.26 | n.d. | Decorative needle | |
| 237 | 14.2 | 15.05 | 0.46 | 0.63 | 0.36 | Dagger handle | |
| 238 | 8.0 | 8.49 | 0.7 | 0.88 | 0.91 | Decoration | |
| 264 | 14.6 | 14.68 | 0.25 | 0.4 | 1.02 | Decorative needle | |
| 268 | 8.0 | 9.72 | 0.3 | 0.82 | 0.69 | Decorative needle | |
| 269 | 21.2 | 26.35 | 1.4 | 1.01 | 0.31 | Pendant | |
| 270 | 8.9 | 8.43 | 0.19 | 0.25 | 0.37 | Decorative needle | |
| 273 | 21.4 | 18.42 | 0.7 | 0.96 | 0.36 | Decorative needle | |
| 280 | 12.4 | 14.32 | 0.2 | 0.27 | 0.27 | Pendant | |
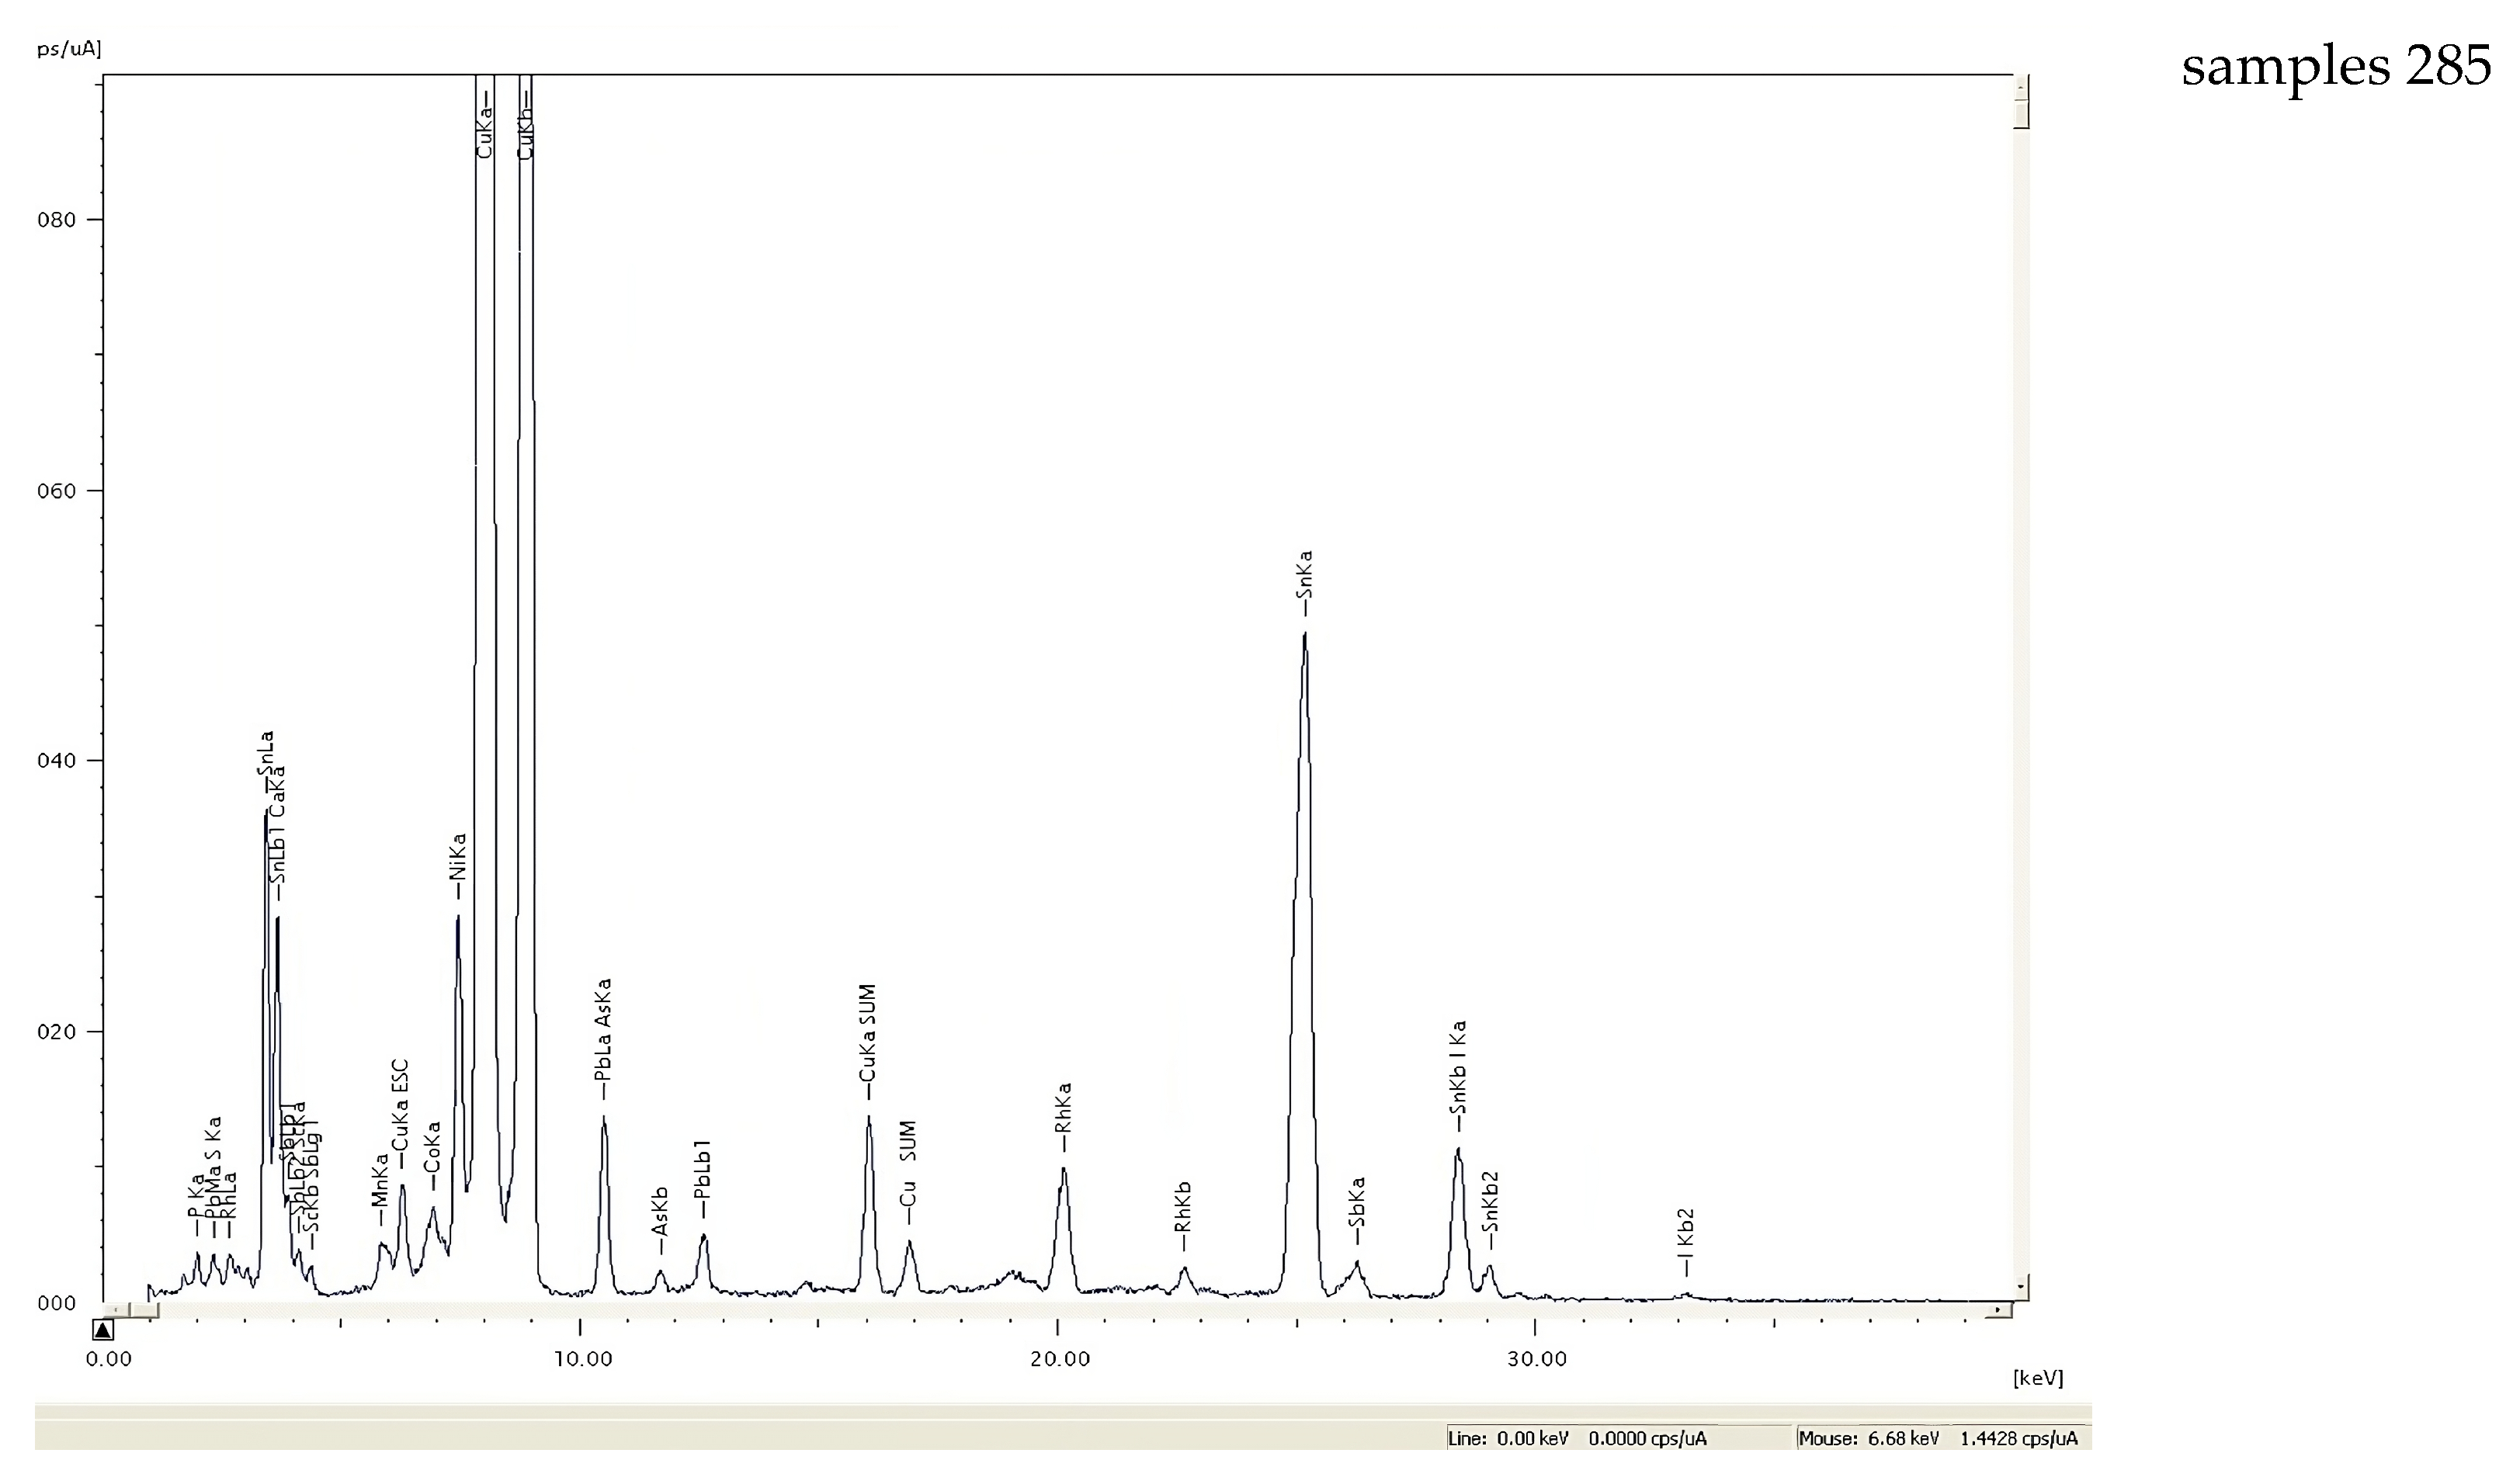
| 285 | 5.11 | 6.38 | 0.23 | 0.39 | 0.55 | Knife edge | |
| 287 | n.m. | 10.21 | n.m. | n.d. | n.d. | Saltaleone | |
| 290 | 10.5 | 11.59 | 0.27 | 0.21 | 0.36 | Decorative needle | |
| 302 | 13.2 | 13.22 | 0.5 | 0.48 | 0.40 | Sewing needle | |
| 303 | 19.0 | 14.53 | 0.1 | n.d. | 0.25 | Decorative needle | |
| 305 | 8.0 | 9.02 | 0.19 | 0.18 | 0.43 | Knife edge | |
| 357 | 12.0 | 9.46 | 0.35 | 0.22 | 0.52 | Axe | |
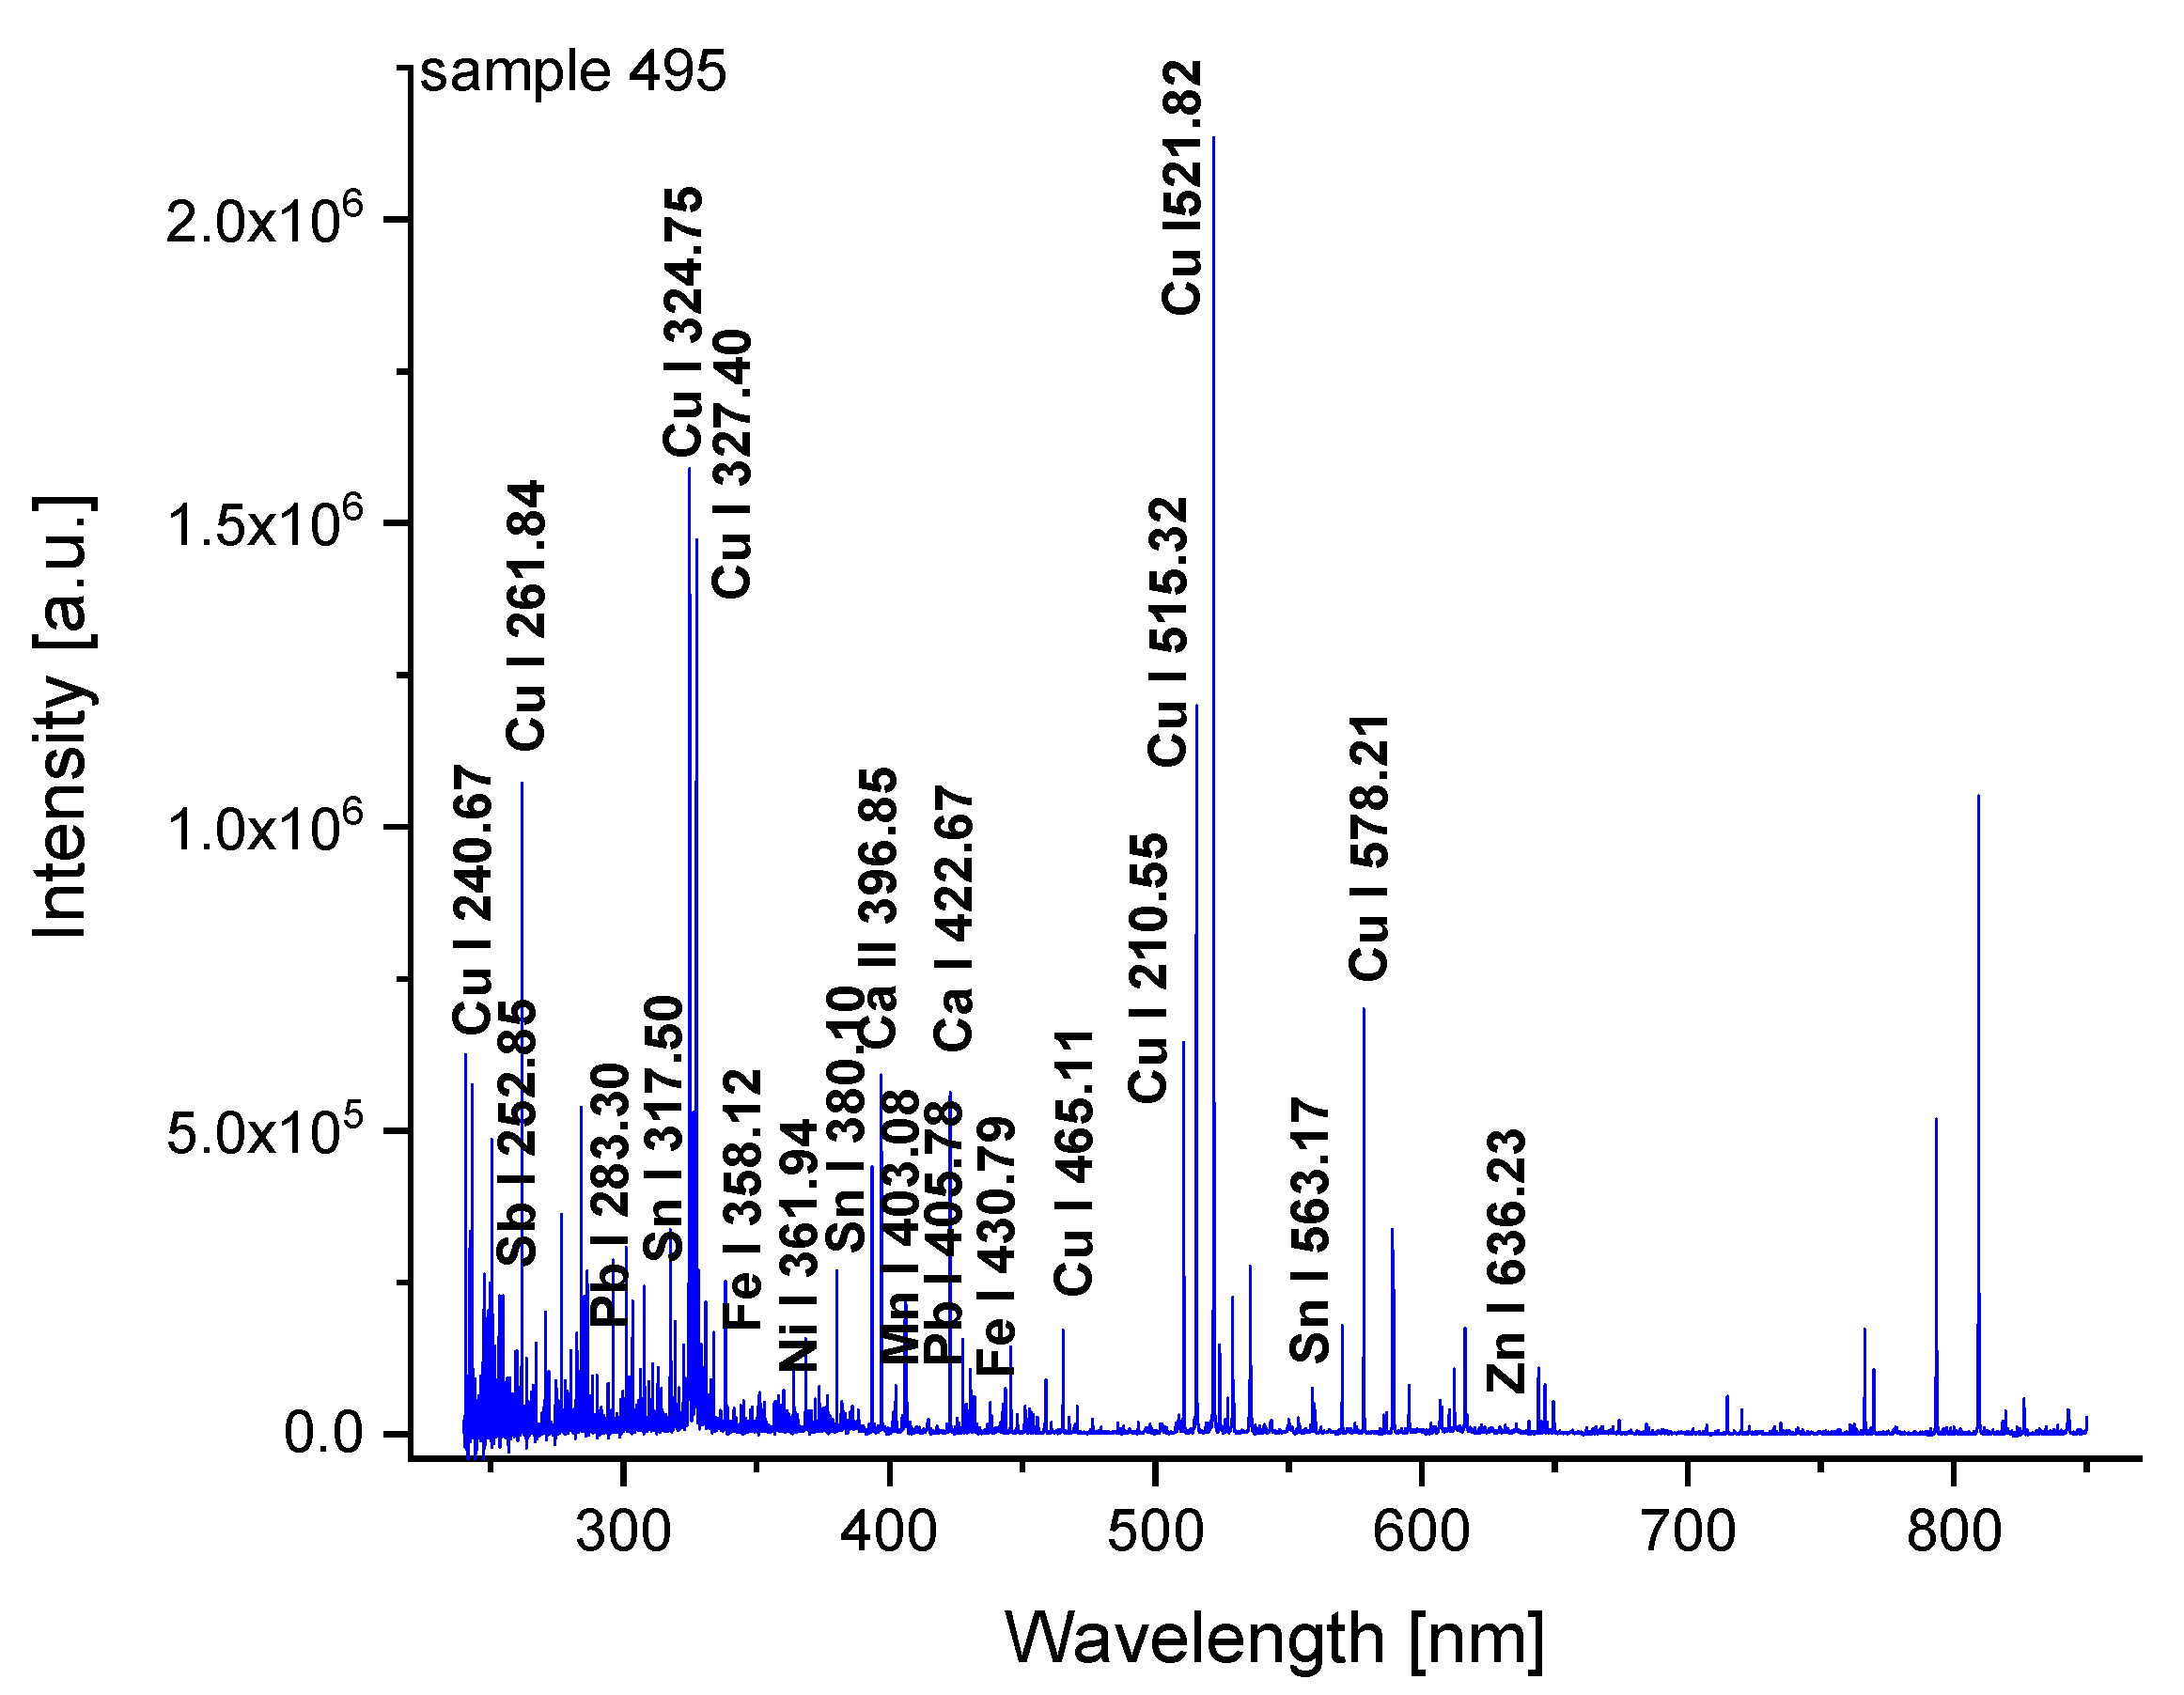
| 495 | n.m. | 4.16 | n.m. | 0.67 | 1.92 | Decoration | |
| 501 | 11.9 | 13.8 | 0.1 | n.d. | 0.35 | Decorative needle | |
| 503 | 9.0 | 11.08 | 0.2 | 0.34 | n.d. | Decoration | |
| 520 | 13.1 | 16.0 | 0.11 | 0.7 | 0.57 | Decoration | |
| 559 | 10.0 | 12.4 | 0.12 | n.d. | 1.41 | Hook | |
| III | 101 | 8.5 | 10.69 | 0.5 | 0.64 | 0.51 | Decorative needle |
| 108 | 7.3 | 6.01 | 0.41 | 0.48 | n.d. | Decorative needle | |
| 115 | 16.8 | 16.30 | 0.3 | 0.26 | 0.43 | Awl | |
| 274 | 8.0 | 9.16 | 0.3 | 0.52 | 0.56 | Awl | |
| 281 | 19.2 | 22.81 | 0.4 | 0.54 | 0.33 | Pendant | |
| 282 | 12.1 | 10.64 | 0.2 | 0.27 | 0.42 | Sewing needle | |
| 284 | 12.7 | 13.79 | 1.4 | 1.44 | 0.21 | Decorative needle | |
| p284 | 12.6 | 11.5 | 0.5 | 1.55 | 0.22 | Decorative needle | |
| 300 | 10.3 | 12.22 | 0.3 | 0.45 | 0.48 | Decorative needle | |
| 301 | 11.7 | 12.86 | 1.25 | 1.30 | 0.39 | Decorative needle | |
| 304 | 8.1 | 10.80 | 0.52 | 0.68 | 0.31 | Sewing needle | |
| 306 | 21.7 | 18.45 | 0.41 | 0.43 | 0.28 | Decoration | |
| 308 | 13.4 | 10.24 | 0.13 | 0.19 | 0.22 | Knife edge | |
| 318 | 17.8 | 16.56 | 3.0 | 2.32 | 0.63 | Axe | |
| 342 | 13.2 | 14.17 | 0.5 | 0.3 | 0.46 | Decorative needle | |
| 343 | n.m. | 16.95 | n.m. | 0.48 | 0.41 | Decorative needle | |
| 396 | 25.8 | 25.06 | 0.63 | 0.68 | 0.61 | Pendant | |
| 404 | 8.2 | 11.5 | 0.17 | n.d. | 0.83 | Decorative needle | |
| 409 | 14.0 | 26.58 | 0.2 | 0.4 | 0.65 | Decorative needle | |
| 410 | 11.6 | 12.19 | 0.21 | 0.3 | 0.43 | Awl | |
| 452 | 17.0 | 19.5 | 2.3 | 1.5 | 0.71 | Decoration | |
| 463 | 7.9 | 12.83 | 0.2 | 0.42 | 2.27 | Awl | |
| 778 | 10.6 | 13.53 | 0.1 | n.d. | 0.81 | Hook | |
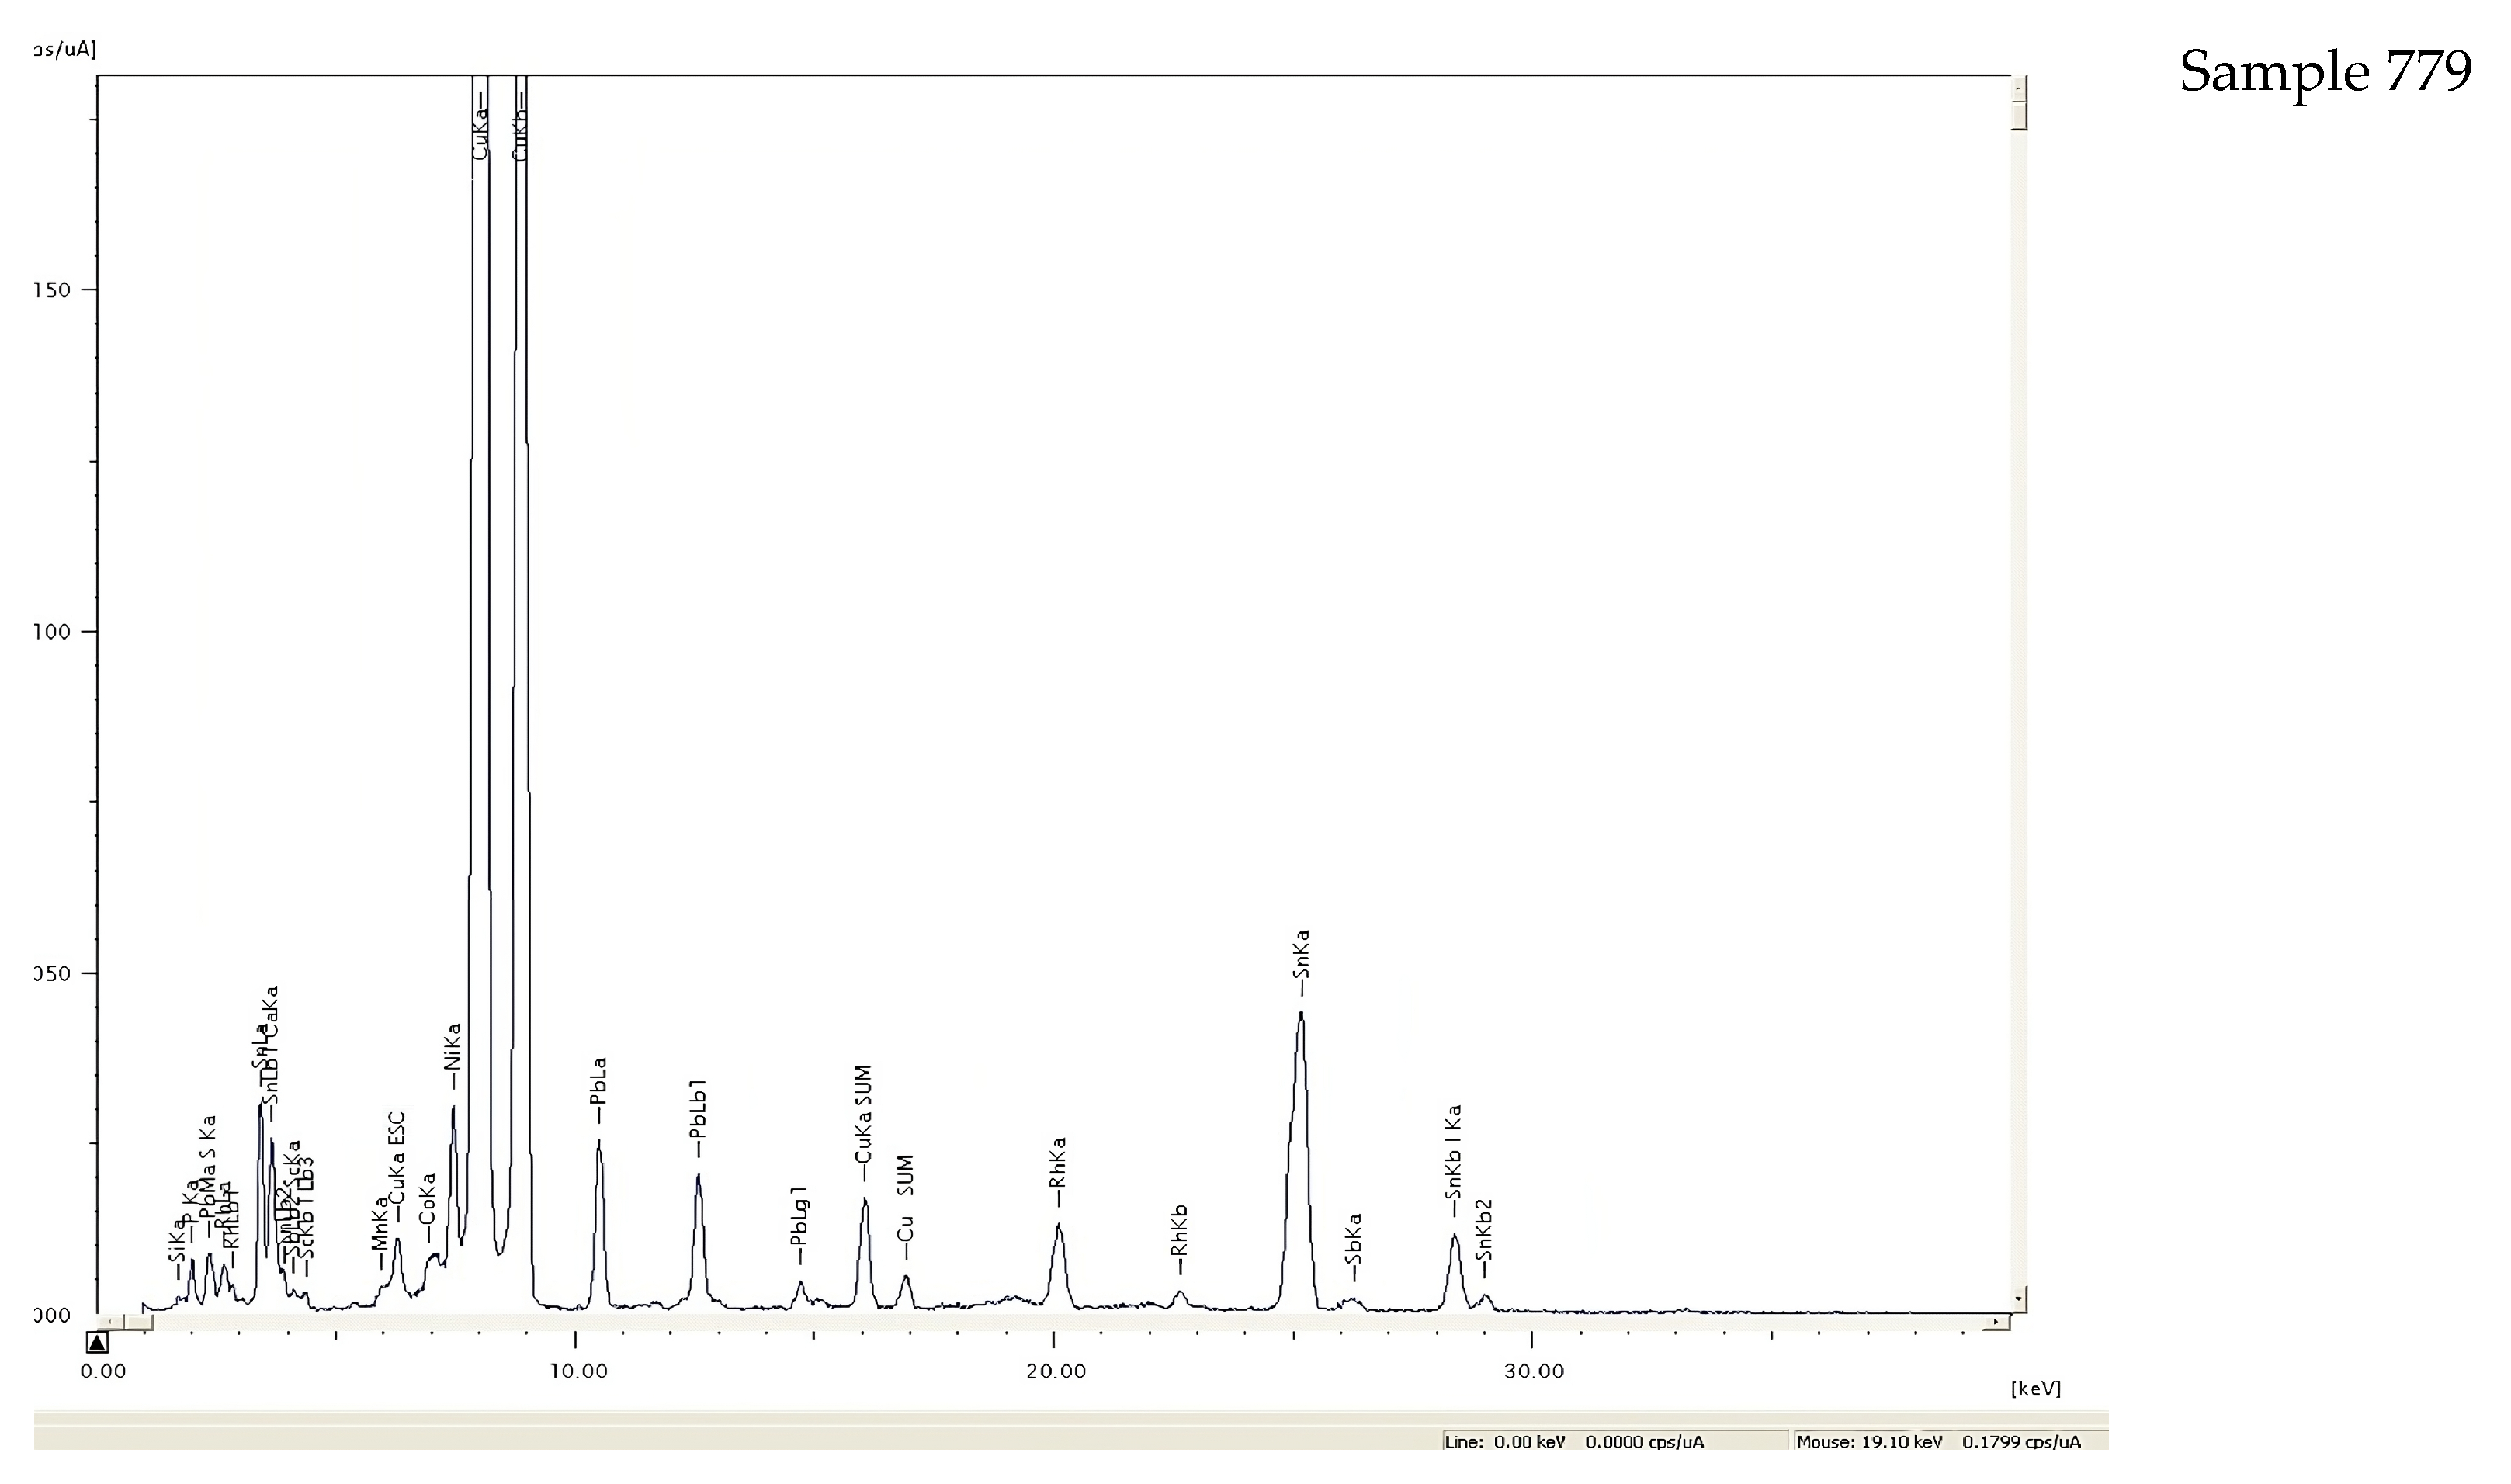
| 779 | 10.8 | 9.8 | 3.6 | 3.3 | 0.2 | Sewing needle | |
| IV | 278 | 20.8 | 18.49 | 0.1 | n.d. | 0.48 | Hair ring |
| 279 | 12.2 | 15.59 | 0.51 | 0.67 | 0.49 | Hair ring | |
| 309 | 15.1 | 16.41 | 0.28 | 0.32 | 0.7 | Hair ring | |
| 487 | n.m. | 12.36 | n.m. | 0.23 | 0.24 | Indefinable object | |
| 729 | n.m. | 14.08 | n.m. | 0.24 | 0.45 | Sewing needle | |
| 748 | 7.8 | 10.5 | 0.1 | n.d. | 0.61 | Razor | |
| 782 | 12.05 | 12.6 | 0.77 | 0.85 | 0.43 | Decoration |
Disclaimer/Publisher’s Note: The statements, opinions and data contained in all publications are solely those of the individual author(s) and contributor(s) and not of MDPI and/or the editor(s). MDPI and/or the editor(s) disclaim responsibility for any injury to people or property resulting from any ideas, methods, instructions or products referred to in the content. |
© 2023 by the authors. Licensee MDPI, Basel, Switzerland. This article is an open access article distributed under the terms and conditions of the Creative Commons Attribution (CC BY) license (https://creativecommons.org/licenses/by/4.0/).
Share and Cite
Penkova, P.; Malcheva, G.; Grozeva, M.; Hristova, T.; Ivanov, G.; Alexandrov, S.; Blagoev, K.; Tankova, V.; Mihailov, V. Laser-Induced Breakdown Spectroscopy and X-ray Fluorescence Analysis of Bronze Objects from the Late Bronze Age Baley Settlement, Bulgaria. Quantum Beam Sci. 2023, 7, 22. https://doi.org/10.3390/qubs7030022
Penkova P, Malcheva G, Grozeva M, Hristova T, Ivanov G, Alexandrov S, Blagoev K, Tankova V, Mihailov V. Laser-Induced Breakdown Spectroscopy and X-ray Fluorescence Analysis of Bronze Objects from the Late Bronze Age Baley Settlement, Bulgaria. Quantum Beam Science. 2023; 7(3):22. https://doi.org/10.3390/qubs7030022
Chicago/Turabian StylePenkova, Petya, Galina Malcheva, Margarita Grozeva, Tanya Hristova, Georgy Ivanov, Stefan Alexandrov, Kiril Blagoev, Vani Tankova, and Valentin Mihailov. 2023. "Laser-Induced Breakdown Spectroscopy and X-ray Fluorescence Analysis of Bronze Objects from the Late Bronze Age Baley Settlement, Bulgaria" Quantum Beam Science 7, no. 3: 22. https://doi.org/10.3390/qubs7030022