
GEANT4 Simulation of Photoneutron Spectrum from Medical Linear Accelerator

Physics Faculty, Lomonosov Moscow State University, Moscow 119991, Russia
*
Author to whom correspondence should be addressed.
†
These authors contributed equally to this work.
Quantum Beam Sci. 2023, 7(3), 27; https://doi.org/10.3390/qubs7030027
Submission received: 4 June 2023
/
Revised: 23 July 2023
/
Accepted: 2 August 2023
/
Published: 1 September 2023
(This article belongs to the Special Issue Quantum Beam Science: Feature Papers 2023)
Abstract
:Photons with energy totaling more than 10 MeV provide efficient treatment for deeply seated tumors but interact with the nuclei of high-Z materials constituting a head of the linac. These interactions result in photoneutrons that deliver an additional out-of-field dose to the patient, which increases the risk of radiation-induced cancer. Monte Carlo simulation is an accurate strategy for estimating the effective photoneutron dose for a patient. In the current study, the possibility of using GEANT4 to calculate the photoneutron spectrum from the medical linac was investigated. The free-in-air photoneutron spectrum from a head of the linac was simulated using the NeutronHP experimental package. Validation of the simulated model was carried out based on a comparison of simulated and measured percentage depth–dose curves from photons in the water phantom. The obtained photoneutron spectrum was compared with the previously measured spectrum at the Varian Thilogy linac. GEANT4 may improve the accuracy of calculations of the effective dose based on photoneutrons. However, the simulated model should be improved and optimized. In the future, this model may constitute a physical basis for the prediction of the risk of radiation-induced cancer at our clinical center.
1. Introduction
Radiation therapy is an effective, non-invasive method of cancer treatment that is required for half of all patients with cancer [1]. The aim of radiotherapy is to deliver the prescribed dose to the tumor and minimize the dose to surrounding healthy tissues and organs at risk. To this end, various irradiation techniques are used, including intensity-modulated radiotherapy (IMRT) [2], volumetric modulated arc therapy (VMAT) [3], and image-guided radiotherapy (IGRT) [4]. Most often, radiotherapy is carried out using external photon beams with energy ranging from 6 to 20 MeV, which are obtained using electron linear accelerators (linacs). Photons with energy totaling more than 10 MeV provide efficient treatment for deeply seated tumors but interact with the nuclei of high-Z materials constituting a head of the linac. These interactions result in secondary photoneutrons, which deliver an additional out-of-field non-therapeutic dose to the patient, which increases the risk of radiation-induced cancer. According to NCRP 116, photoneutrons are highly penetrating particles with high relative biological effectiveness and a quality factor of 20 for the energy range of 0.1–2.0 MeV. Therefore, at operating energies greater than 10 MeV, photoneutrons should not be neglected. The characteristics of photoneutrons in radiotherapy with high-energy photon beams were reviewed in detail by Naseri et al. [5]
To estimate the effective dose from a photoneutron, its energy spectrum must be determined. The typical spectrum of a photoneutron from the linac includes two components: a fast neutron peak from 0.1 MeV to 5–10 MeV and a low-energy peak below 1 eV [6]. The spectrum depends on many parameters, including the measurement location [6], the depth in the tissue or phantom [7], the beam energy [8], the linac model [9], the linac’s head configuration [9], and the field size [10]. If the energy spectrum of photoneutrons is not taken into account when measuring the equivalent dose, uncertainty can reach 20% [10].
In previous studies, the measurement of photoneutrons was more often carried out free-in-air at various locations in the patient plane [9,11,12,13] or in the water phantom [11,14]. Various types of equipment can be used for measurement, including a Bonner sphere spectrometer [15], a nested neutron spectrometer (NNS, Detec Inc., Gatineau, QC, Canada) [16], a Meridian Neutron Survey Meter 5085 (HPI, Goleta, CA, USA) [12], and CR-39 detectors [14]. Photoneutron dosimetry is a challenge because the measurement is carried out in a mixed field with photons, which can lead to an uncertainty of about 10% due to the saturation of the detector and the strong dependence of the detector response on the neutron spectrum [17]. Moreover, the assessment of the equivalent dose in the patient from the in-air or surface photoneutron dose can be incorrect due to substantial perturbation of the neutron field. As shown by Kry et al. [7], the presence of tissue increases the total fluence by over 60%, as well as the average energy. In addition, in terms of estimation of the radiation-induced cancer risk, not only is the spectrum required but also the distribution of the photoneutron doses at different locations in the patient [7,14]. In vivo measurements of photoneutrons are preferable but are associated with a difficult and invasive procedure.
Monte Carlo (MC) simulation is a more preferable strategy for estimating the effective photoneutron dose in the patient because it allows for the calculation of details when measurements cannot be performed due to physical limitations. This approach makes it possible to calculate the photoneutron spectra and the photoneutron dose distribution in different locations of the treatment room [6] and inside the patient’s tissues [7], as well as to study the dependence of the photoneutron spectrum on various parameters of the linac [9]. However, to achieve reasonable results, accurate modeling of the geometry of the linac head and treatment room is required, as well as high-performance computers. Many previous MC studies were carried out using MCNPX [7,9,17,18], MCNP611 [10], MCNP [6], and FLUKA [8,19]. On the other hand, GEANT4 code with the standard electromagnetic physics packages showed less statistical uncertainty compared to MCNPX, as demonstrated by Kim et al. [20] (0.05% vs. 0.3%). Therefore, the use of GEANT4 code may potentially increase the accuracy of calculation of the photoneutron dose and estimation of the risk of radiation-induced cancer. To approach the study of this topical but complex problem, estimation of the dose from secondary neutrons in various organs of the human body, especially in critical organs and tissues, is required. To this end, the dose should be calculated with the smallest possible error. Such a task can be carried out using the GEANT4 software package.
In the current study, the possibility of using GEANT4 to calculate the photoneutron spectrum from the medical linac was investigated. The free-in-air photoneutron spectrum was simulated using the experimental NeutronHP package and was compared to the previously measured spectrum. The designed MC model and the obtained results may serve as a basis for the development of a strategy for predicting radiation-induced cancer at our clinical center.
2. Materials and Methods
Simulation of the linac’s head was carried out by the Monte Carlo algorithm using GEANT4 with multithreading. A virtual machine (VM) at Yandex Compute Cloud [21] was used for calculation. The VM consisted of an Intel Cascade Lake (Intel Corp., Santa Clara, CA, USA) CPU with 80 computing threads and 80 Gb DDR memory. Such an approach increases the calculation speed and does not require high-performance computer equipment in the laboratory.
To simulate the interaction of high-energy hadrons with matter, the QGSP_BIC_HP physics list was used. The model is based on quark–gluon strings and considers excitations of the nucleus and its removal. The experimental NeutronHP package was used for the transport calculation of neutrons. Geng et al. [22] and Apostolakis et al. [23] demonstrated optimal agreement between simulated and experimental data for neutrons with energy totaling less than 20 MeV.
The head geometry of the commercially available linac is not freely available, so a simplified model (Figure 1) based on the example of GEANT4 (medicalLinac2) was used in the current study, which consists of a target, a primary collimator, a flattening filter, an ion chamber, and jaws. The geometry of the model was modified in terms of the primary collimator construction. The primary collimator included three concentric spherical layers of tungsten, iron, and lead, respectively. The layers were located similarly to the simple model of the linac’s head described by Kase et al. [24]. The target was a coppered tungsten plate with dimensions of 1 × 1 cm2 and a thickness of 5 mm. The flattening filter was made of iron with a tantalum core. The ion chamber consisted of six cylindrical Kapton polyimide films and was placed behind the primary collimator. Two pairs of mutually perpendicular tungsten parallelepipeds represented the jaws. A monoenergetic electron beam with energy totaling 20 MeV was simulated for primaries. The calculation time was about 40 h.
To validate the model, central-axis percentage depth–dose (PDD) curves were calculated from photons and measured in a water phantom similarly to [10,25]. Measurement was carried out at a Varian Trilogy linac (Varian Medical System, Inc., Palo Alto, CA, USA) at Burnazyan Federal Medical Biophysical Center of the FMBA of Russia. The water phantom had dimensions of 30 × 30 × 30 cm3. The measurement was carried out in an SNC125 ion chamber (Sun Nuclear Corporation, Melbourne, Florida, USA) according to TRS-398. The calculation was performed with a voxel volume of 0.125 cm3, which matches the sensitive volume of the SNC125.
The geometry from the experiment described previously in [26] and the model described above were used for simulation of the photoneutron spectrum (Figure 1). The photon beam was directed vertically down. The gantry and collimator were set at 0 degrees. The field size was 40 × 40 cm2.
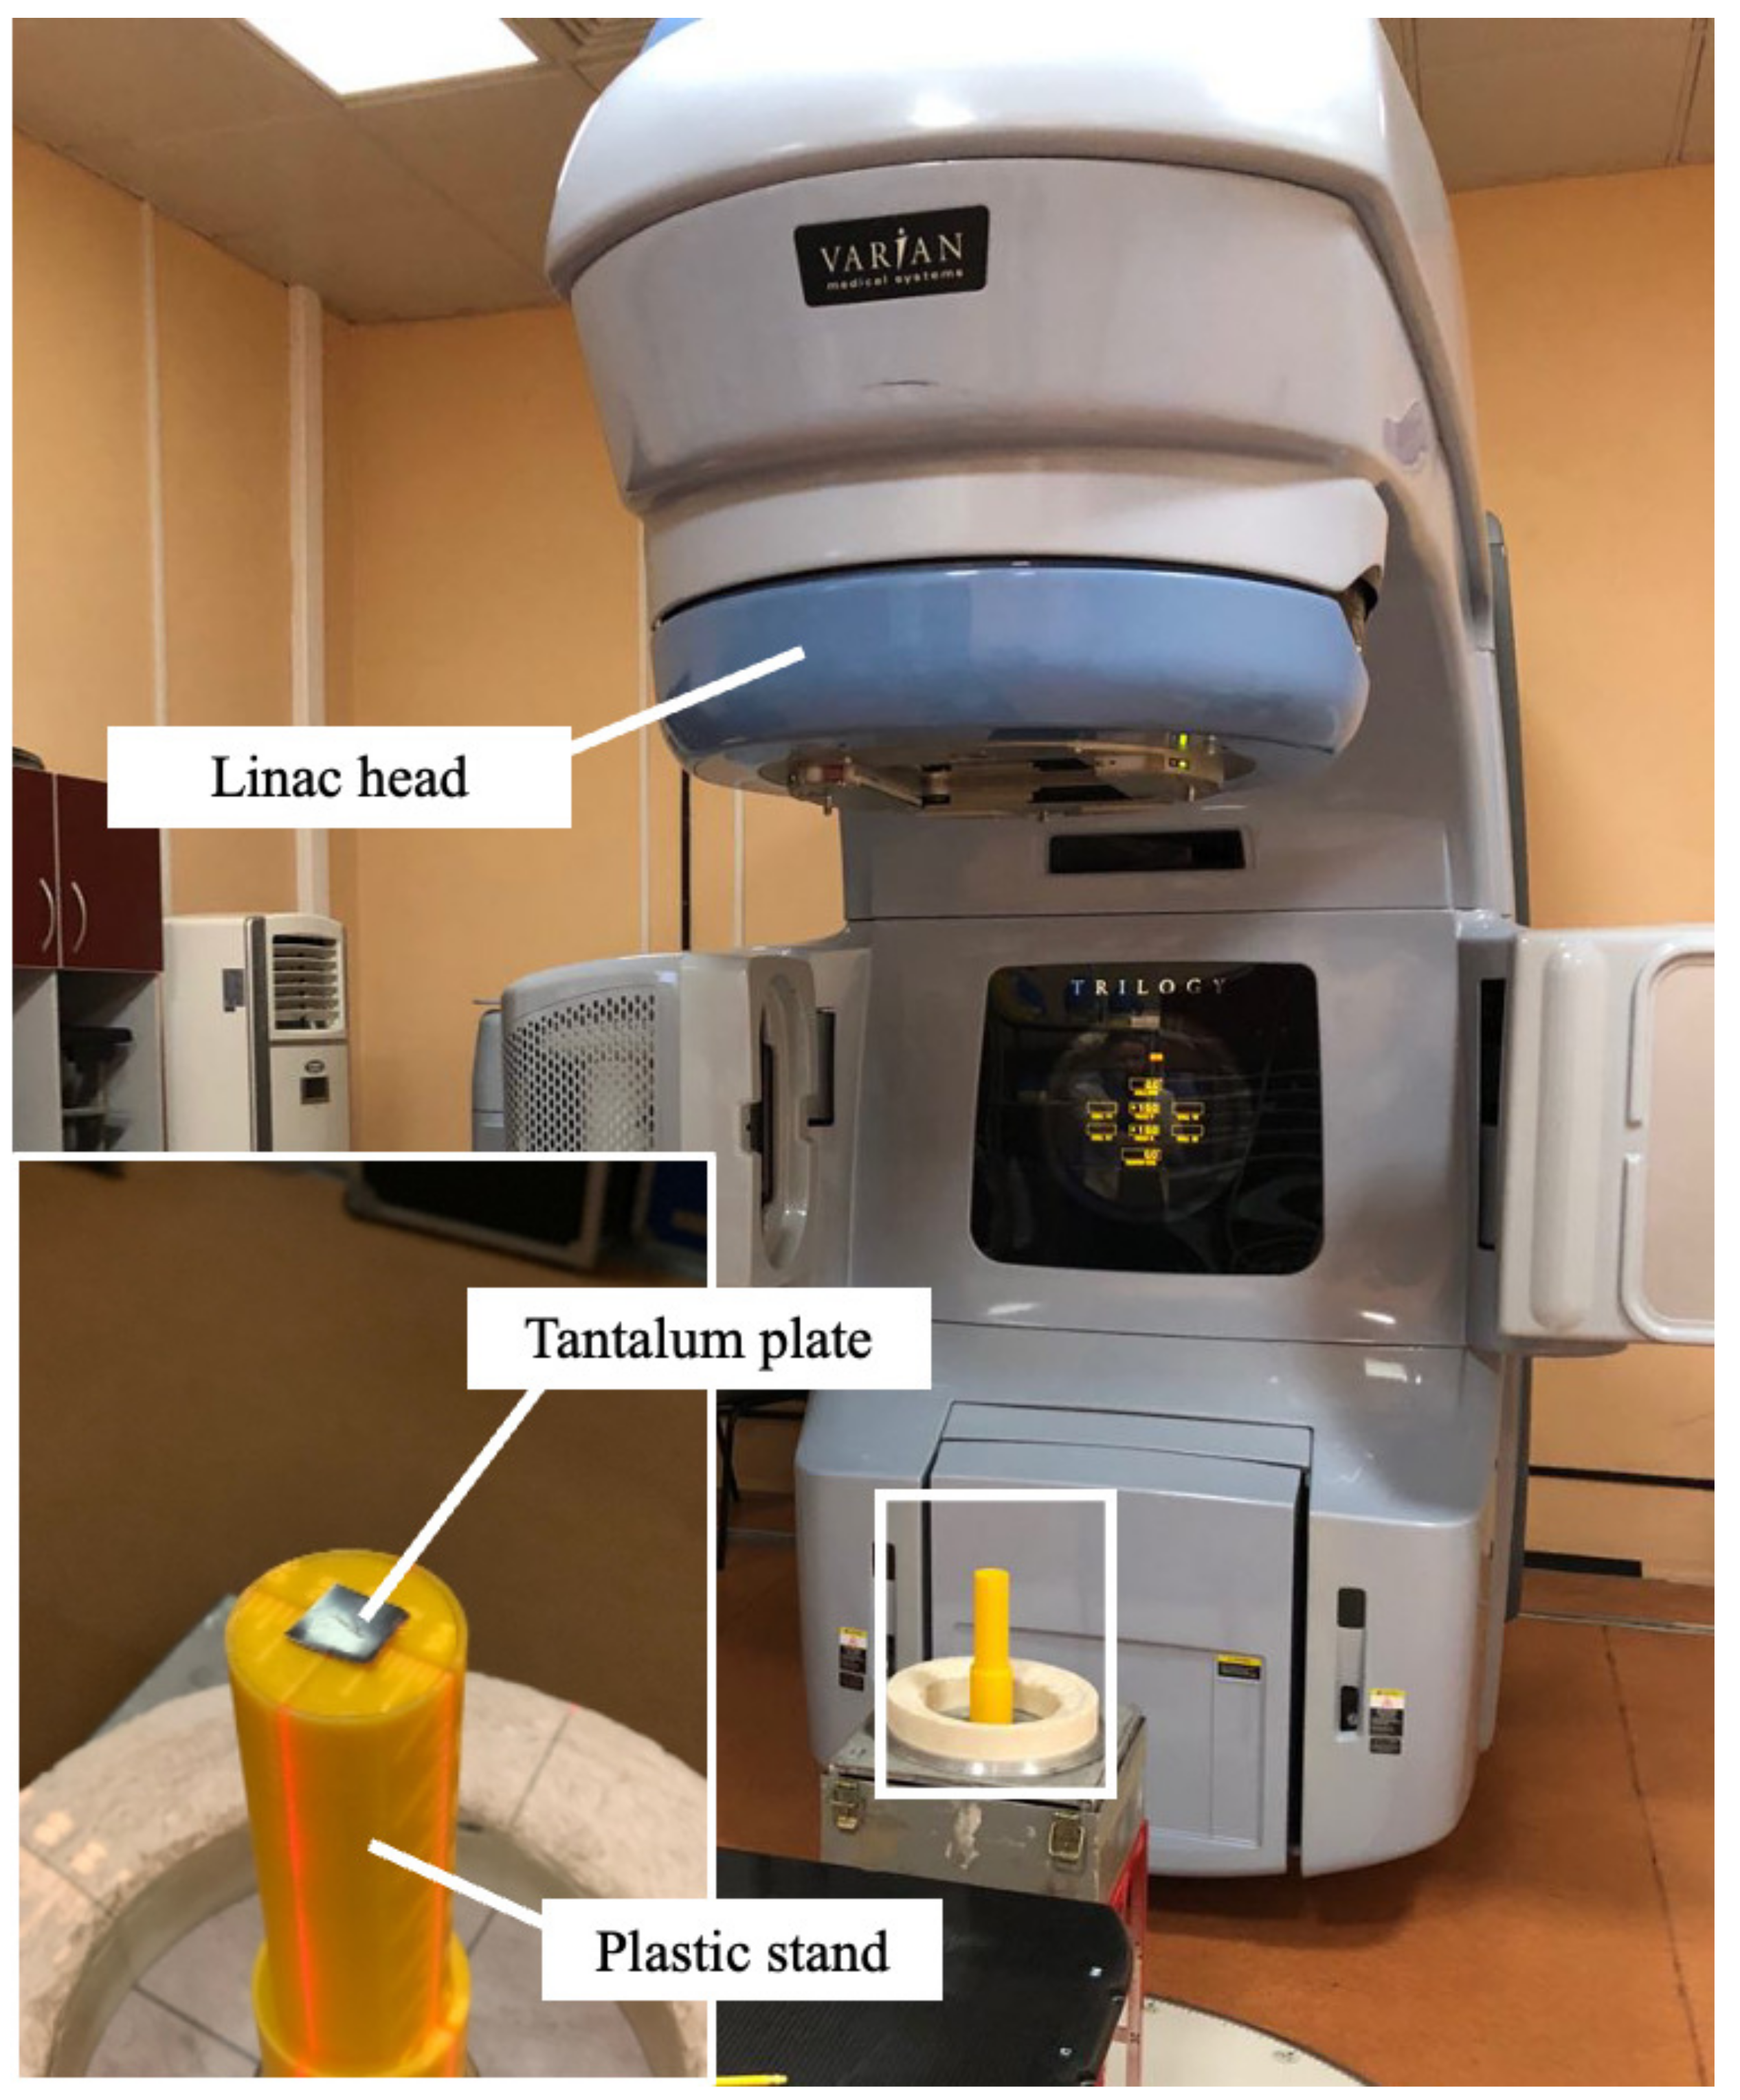
A spectrometer was placed on a treatment couch at a source–surface distance (SSD) of 100 cm from the bremsstrahlung target. The spectrometer consisted of tantalum foil located inside spherical polyethylene decelerators with diameters of 70, 120, 200, and 300 mm. Tantalum foil without decelerators was also used to measure the photoneutron fluence. The tantalum foil had a square shape, with dimensions of 10 × 10 mm2, weighed 1.2 g, and had a thickness of 350 m. The irradiation time for each tantalum foil was 17.7 min.
The standard approach is based on neutron spectrometry using a set of decelerators of different diameters, with the compact detector placed in the center. The BDMN-96s neutron detection unit (SPC Doza, Moscow, Russian Federation) includes a neutron scintillation detector in the form of a thin disk with a diameter of 25 mm placed on the photomultiplier. The detector was made of polymethyl methacrylate with the addition of enriched with isotope 6 and . Neutrons were detected by reaction 1, with a detection of subsequent reaction products using a ZnS scintillator.
The linac operated in a pulsed mode with a high particle flux density in the radiation field (according to various estimates, – particles [5]). Therefore, the use of direct spectrometric methods to measure the flux of photons and photoneutrons is extremely difficult.
In this regard, the standard BDMN-96s detector is also unsuitable for measurement under high-intensity pulsed fields. Therefore, a plastic structure was made using FDM printing, which repeated the shape of the detector, as presented in Figure 2.
This design provided for the placement of detectors in the center of the spherical decelerators and the concentric arrangement of the decelerators in space. The internal volume of the structure located in the spherical decelerator was filled with paraffin to prevent the leakage of thermal neutrons from the center of the sphere. After irradiation, the activity of the tantalum foils was measured using a Canberra semiconductor spectrometer (Mirion Technologies, Inc., Lamanon, France) with an Inspector 2000c analyzer and a broadband detector made of ultrapure germanium BE3830 with an energy resolution of 1.94 keV on the 1332.5 keV line. The spectra were applied using Winspectrum software.
Because, as a result of the modification, the neutron-detecting mechanism at the center of the spherical decelerators was changed, the response functions of the spherical decelerators also required recalculation. The calculation of new response functions was performed using MCNP5, taking into account all the construction details of the resulting system.
To restore the photoneutron spectra for this modification of the spectrometer, in-house software based on the parameterization method was developed. Spectrum functions and measured activities were used as input data.
The neutron spectrum () was represented by a superposition of the low-energy Maxwellian thermal neutron spectrum (), epithermal neutron tail (), intermediate neutron tail (), and fast neutron peak (). The selection of parameters was carried out using the method of coordinate descent with a golden section.
where
where eV is the thermal neutron energy, MeV is the fast neutron energy, E is the energy of the detected neutron, and the b parameter changes from 0.5 to 1.5.
The described experiment was simulated using our GEANT4 model of the linac head. Spherical decelerators were not used in simulation because the number of photoneutrons could be detected directly. A plastic stand filled with paraffin was added to the model because we assumed that it could decelerate fast photoneutrons to epithermal energies. The exact sizes of the stand were used in the simulation. The kinetic energy of photoneutrons was fixed when they hit the tantalum plate.
To estimate the contribution of photoneutrons to the dose, another computer experiment was performed. A 20 × 20 × 20 cm3 water phantom was installed with an SSD of 90 cm. The sensitive volume was a thin water layer with dimensions of 10 × 10 × 1 mm3 located in the center of the phantom at a distance of 100 cm from the bremsstrahlung target. In the sensitive layer, the energy deposited by all particles was recorded, with neutron energy deposits recorded separately. The volume of absorbed dose was calculated using Equation (3).
where is the value of absorbed dose, is total energy deposited in the volume, and m is the sensitive layer mass.
To assess the biological effect of radiation on the patient, the absorbed doses were recalculated into equivalent doses using Equation (4).
where is equivalent dose in the sensitive volume, is the absorbed dose in the same volume, and k is the radiation weighting factor.
All photoneutrons that transferred energy to the sensitive layer were divided into four energy ranges. For each energy range, the total absorbed dose was multiplied by the radiation weighting factor. The values of the neutron and photon weighting factors were used in accordance with NRB-99/2009 [27], which regulates the radiation safety standards in Russia. The values of radiation weighting factors according to this document are presented in Table 1. The evaluation was conducted based on the assumption that all doses not due to neutrons were due to photons or electrons. The weighting factors for the radiation doses were equal, so we did not separate them for dose calculation.
The contribution of photoneutrons to the absorbed and equivalent doses was estimated using Equations (5) and (6), respectively:
where and are the contribution of neutron radiation to the absorbed and equivalent dose, respectively; and are the absorbed and equivalent doses due to neutron radiation in the i-th energy range, respectively; and and are the absorbed and equivalent doses due to photon radiation, respectively.
3. Results
The measured and calculated PDDs are shown in Figure 3. The error of the dose measurement in the water phantom was less than 1.8%. Statistical uncertainty for the simulation was found to be 0.04%. In the depth range from 0 to 10 mm, the PDD value significantly depended on measurement conditions, which is why the values in this range were not considered. In the depth range from 10 to 250 mm, the discrepancy between the calculated PDD and the measured PDD was less than 4%, with a standard deviation value of 1.7%. We decided that the obtained discrepancy of 4% was acceptable for our study, considering the lack of availability of the head geometry of the Varian Trilogy linac. The calculated bremsstrahlung spectrum is shown in Figure 4.
As shown in Figure 4, the photon spectrum had an annihilation peak that appeared as a result of the presence of many photons in the spectrum with an energy of more than 1.022 MeV. Electron–positron pairs were formed in the Coulomb field of nuclei. When interacting with atomic electrons, positrons annihilated, forming a pair of photons with an energy of 0.511 MeV.
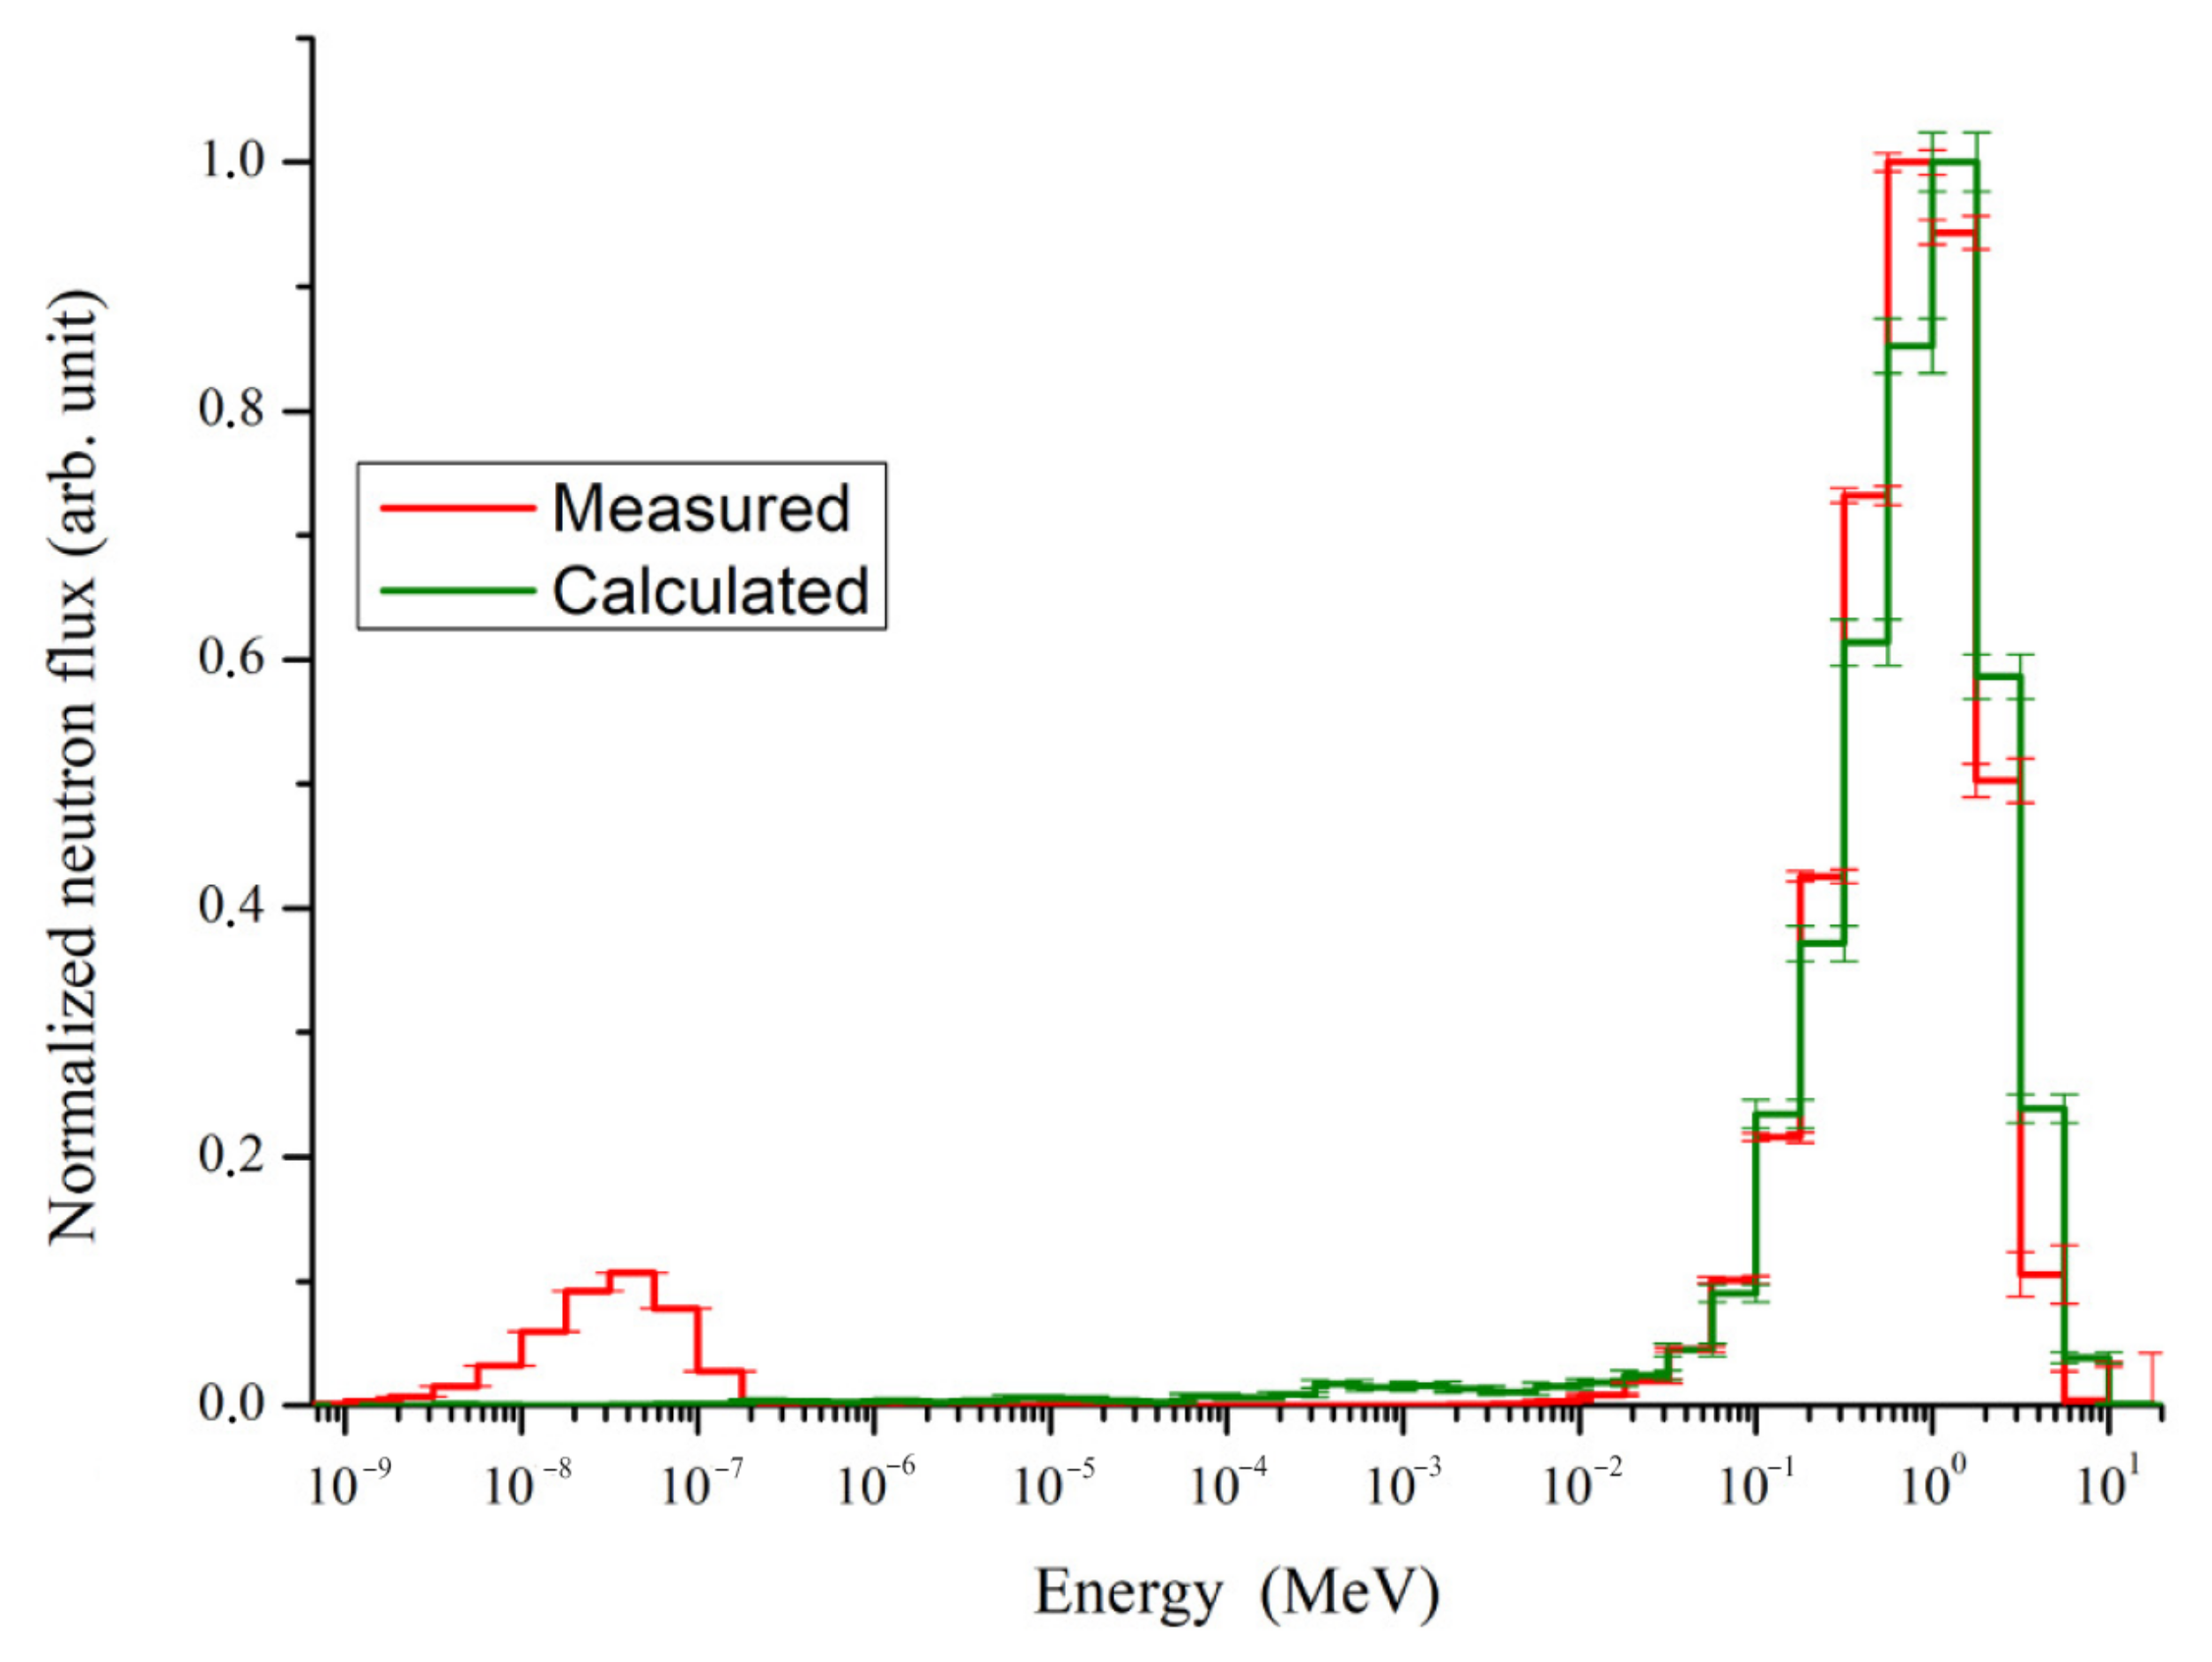
The photoneutron spectrum detected in the tantalum plate is shown in Figure 5. The obtained data were divided into energy intervals similarly to [26]. The measurement error for the maximum value was 7%. The error of the spectrum calculation at the peak region was less than 11%. The error value around the peak energy was less than 3%. The disagreement between the calculated and measured data was less than 17% with a standard deviation of 10% in the energy range of 32 keV to 3.16 MeV.
The mean value of photoneutron energy was MeVm, in agreement with the measured mean energy reported in [26], which was MeV.
The calculated spectrum has a single peak with the maximum at 1 MeV. The measured spectrum includes two peaks: a fast neutron peak with energy of 1 MeV and a thermal neutron peak with a maximum of 0.03 eV. The peak shapes of high-energy neutrons in the simulated and measured spectra in the energy range of resonant neutrons are similar to that described in similar studies, but a thermal neutron peak is not observed in the simulated spectrum.
The contribution of neutron radiation to the dose in the sensitive layer is presented in Table 2.
The total contribution of photoneutrons to the absorbed dose was 0.22%. The contribution of photoneutrons to the equivalent dose was 1.6%. With a fractionated dose of 2 Gy in 35 sessions, the patient receives an additional dose of about 1.12 Sv—value that is close to the dose in one fraction.
4. Discussion
In the present work, a photoneutron spectrum was simulated using GEANT4 code and compared with the previously measured spectrum. Similar investigations have been conducted by many authors [6,9,18,24,28,29]. Table 3 compares the peak energies of the photoneutron spectra and the maximum energies of bremsstrahlung obtained by MC simulations in the abovementioned studies.
In the works mentioned above, photoneutron fluxes were measured at the Varian Clinac 2100c/2300c/21EX [9,24], Electa SL75/25 (Elekta North America, Norcross, GA, USA) [28], and Siemens Primus (Siemens Medical Solutions, Malvern, PA, USA) [6,18,29] linacs. The head configuration differs depending on the accelerator. For example, the flattening filter and primary and secondary collimators of Elekta linacs are made of lighter materials than those of the Varian Clinac [30]. Moreover, the configurations of the same model of linac heads manufactured in different years may differ. Therefore, individual calculations of the photoneutron spectrum of each linac is important.
The simulated models described in the literature differ in terms of bremsstrahlung energies, head constructions, the presence or absence of walls of the treatment room and the treatment couch, detector placements, and the measurement position. Therefore, a direct comparison of the spectra is difficult, because in each study the spectra were obtained under different conditions. However, the maximum value of resonant neutrons was in the energy range of 0.1 to 1 MeV.
The calculated spectrum shape shown in Figure 5 corresponds to the spectrum reported in the abovementioned papers. However, Figure 5 shows that the thermal neutron peak observed in the experimental data does not appear in the simulation, likely due to the simplicity of our model, which does not include concrete walls and a maze in the treatment room. The presence of walls leads to a decrease in the energy of fast photoneutrons to thermal energies, which causes the appearance of a corresponding peak in the spectrum, as confirmed by the simulation results reported in [6], in which simulations with and without treatment room walls were discussed. A peak of thermal neutrons appeared in the first case and was absent in the second case. Analysis of our results shows that it is the components of the treatment room must be considered, such as the couch, the screen, the walls, and the shape of the treatment room for each individual medical linac.
Furthermore, the geometric characteristics and parameters of the Varian Trilogy head are not available from public sources because they are a commercial secret. We used a simplified model based on open-access data and GEANT4 example geometry. Differences in the geometry of our model relative to real linac heads may lead to changes in the shape of the photoneutron spectrum and the energy peaks. Therefore, effective dose estimations for patients may vary. To improve the model, we have requested detailed data on the configuration of the Varian Trilogy linac from the manufacturers. We also plan to simulate different linac heads and estimate the differences between them. If the differences are found not to be essential, it may be possible to use a general model of linac heads for the estimation of photoneutron spectra.
During the verification of the PDD curves, the discrepancy between simulation and experiment did not exceed 4%, which we assumed was acceptable in the absence of real parameters for the linac head. In some similar studies, the discrepancy was lower, for example, less than 3% in [10] and less than 1% in [25,28]. Further refinement of our linac model may improve its accuracy. In addition, in the current study, the free-in-air photoneutron spectrum was considered only at the isocenter. In [6,9,18,24], measurements were carried out at different locations, making it possible to estimate the effective dose from photoneutrons in the treatment room for both the patients and staff.
In similar studies, information about computation time was not presented. Therefore, we cannot compare the time required for simulation. However, the model must be optimized to reduce the computation time, which is important for the clinical application of the model. As shown in [31], the speed of single-threaded calculations using GEANT4 increases with the complexity of the model, whereas the computation time in MCNP and PHITS increases with the linear dimensions of the model. However, in multi-threaded computations, the computational speed in GEANT4 increases faster than in MCNP with the number of computational threads. For PHITS, the increase in the computational speed becomes saturated after eight threads. Therefore, using more than eight threads does not result in further improvement. For this reason, in order to correctly compare the computation times in two simulation environments, calculations must be performed for the same model in each simulation environment.
The use of calculations based on the MC algorithm demonstrates a number of essential advantages in estimating the spectrum of photoneutrons and effective dose. First, expensive and difficult-to-acquire instruments are not required for neutron dosimetry, nor are expert staff able to carry out such measurements. Any geometry can be recreated [14], including the linac head, couch, treatment room, walls, maze, radiation shielding, etc. The anatomy of the patient can also be added to such a model, making it possible to determine not only the photoneutron spectrum in any location in the treatment room but also to calculate the dose distribution from photoneutrons inside the patient’s anatomy, which is especially useful in predicting the risk of organ-specific radiation-induced cancer. If the calculation speed is high enough, such calculations of the effective dose can be provided individually for each patient. However, even if the calculation time is too long, such calculations can be performed for the average anatomy of patients. As shown in many previous studies, the photoneutron spectrum and, accordingly, the effective dose, largely depend on the configuration of the accelerator head and the presence of other elements of the treatment room. MC-based calculation allows for flexible variation of the geometry considering the features of each element separately. For example, the spectrum of photoneutrons and their distribution at different positions of the MLC can be studied, as well as the size of the irradiation field, the presence/absence of a screen, various photon energies, etc. The contributions to the total photoneutron flux from each element of the linac head can be studied separately. The contributions of different particles to the total dose in the patient can also be investigated, which may allow manufacturers to optimize their linacs in the future with the aim of reducing the number of photoneutrons. Calculation of radiation protection for the accelerator can also be performed based on the MC model. As shown in [14], the use of CR-39 for photoneutron dosimetry in a water phantom requires knowledge of the photoneutron spectrum at a given position. The MC algorithm allows for the calibration of CR-39, which enables experimental measurements of the dose distribution from photoneutrons. The MC model can also be used to estimate the dose from photoneutrons generated by the linac. For example, with the help of the model, the neutrons born inside the patient’s body can be predicted. Thus, Monte Carlo simulation is a flexible approach in the study of secondary neutrons. However, to fully implement the proposed approach, the geometry and chemical composition of the linac and procedural heads must be accurately reproduced. In addition, a high level of computer performance is required to provide the optimal number of calculated histories within an acceptable calculation time. Furthermore, the materials used to simulate wall components, as well as their shapes and positions, add additional uncertainties to our model.
In the current study, we considered only a case with maximal field size and without a multileaf collimator (MLC). In the future, the configuration of the linac head should be varied, and the model should be refined with a more detailed chemical composition of its components, the shape of the maze, and the composition of the elements inside the treatment room. Simulations should be performed for various photon energies, sizes of irradiation field, and positions of the MLC leaves. We also plan to add a patient’s anatomy to our model to calculate the dose distribution from photoneutrons at different locations in the patient’s body. We now have a much better understanding of all the factors influencing dose formation in the patient’s organs and evaluated the error for each component of the complicated model. Accounting for all mentioned factors can make it possible to more accurately determine the additional dose from photoneutrons when planning radiation treatment. As shown in our previous study [26], performed by us earlier, the additional dose can exceed 2 Sv across thirty treatment procedures.
In a previous study, we found that the dose from secondary photons and electrons outside the irradiation can reach 1.2–1.5 Sv [32]. Therefore, the total dose from secondary neutrons, photons, and electrons can reach approximately 2.5 Sv, which exceeds the fraction dose.
5. Conclusions
In the current work, the possibility of using GEANT4 code for the calculation of the photoneutron spectrum from a medical linac was evaluated. The model used in this study needs to be improved and optimized. Such an improved model may provide a nuclear physics basis for the prediction of radiation-induced cancer in our clinical center.
The total dose received by the patient for a full course of radiation treatment was estimated. Determining the proportion of the dose affecting various organs of the human body is important, especially for critical parts of the body. We expect that, with the improvement and optimization of the proposed model, the effective dose of photoneutrons in various organs and critical tissues of the human body can be accurately predicted, linking the amount of additional dose in the patient’s tissues with the incidence of secondary cancers. Such an improved model can enable the establishment of a nuclear physical basis for the prediction of radiation-induced cancer in the future.
Author Contributions
Conceptualization, A.C. and E.L.; methodology, E.L. and A.S.; software, A.S.; validation, M.B. and E.L.; formal analysis, A.S. and M.B.; investigation, M.B., E.L. and A.S.; resources, A.C.; data curation, A.C.; writing—original draft preparation, M.B., E.L. and A.S.; writing—review and editing, M.B.; visualization, A.S. and M.B.; supervision, A.C.; project administration, A.C.; funding acquisition, A.C. All authors have read and agreed to the published version of the manuscript.
Funding
This research was funded by the Russian Foundation for Basic Research (RFBR) “Investigation of the ionizing radiation effect during radiotherapy on oncological diseases relapse” (grant number 18-00-00745 KOMFI).
Institutional Review Board Statement
Not applicable.
Informed Consent Statement
Not applicable.
Data Availability Statement
Data are available from the authors upon request.
Acknowledgments
We are grateful to the team of the Burnazyan Federal Medical Biophysical Center for the opportunity to carry out measurements on the linac.
Conflicts of Interest
The authors declare no conflict of interest.
Abbreviations
| MC | Monte Carlo |
| PDD | Percentage depth dose |
| SSD | Source–surface distance |
| MLC | Multileaf collimator |
| IMRT | Intensity-modulated radiotherapy |
| IGRT | Image-guided radiotherapy |
| VMAT | Volumetric Modulated arc therapy |
| LINAC | Linear accelerator |
References
- Abdel-Wahab, M.; Gondhowiardjo, S.S.; Rosa, A.A.; Lievens, Y.; El-Haj, N.; Rubio, J.A.P.; Prajogi, G.B.; Helgadottir, H.; Zubizarreta, E.; Meghzifene, A.; et al. Global Radiotherapy: Current Status and Future Directions—White Paper. JCO Glob. Oncol. 2021, 7, 827–842. [Google Scholar] [CrossRef]
- Cho, B. Intensity-modulated radiation therapy: A review with a physics perspective. Radiat. Oncol. J. 2018, 36, 1–10. [Google Scholar] [CrossRef]
- Hunte, S.O.; Clark, C.H.; Zyuzikov, N.; Nisbet, A. Volumetric modulated arc therapy (VMAT): A review of clinical outcomes—What is the clinical evidence for the most effective implementation? Br. J. Radiol. 2022, 95, 20201289. [Google Scholar] [CrossRef]
- Keall, P.J.; Nguyen, D.T.; O’Brien, R.; Zhang, P.; Happersett, L.; Bertholet, J.; Poulsen, P.R. Review of real-time 3-dimensional image guided radiation therapy on standard-equipped cancer radiation therapy systems: Are we at the tipping point for the era of real-time radiation therapy? Int. J. Radiat. Oncol. Biol. Phys. 2018, 102, 922–931. [Google Scholar] [CrossRef] [PubMed]
- Naseri, A.; Mesbahi, A. A review on photoneutrons characteristics in radiation therapy with high-energy photon beams. Rep. Pract. Oncol. Radiother. 2010, 15, 138–144. [Google Scholar] [CrossRef]
- Pena, J.; Franco, L.; Gómez, F.; Iglesias, A.; Pardo, J.; Pombar, M. Monte Carlo study of Siemens PRIMUS photoneutron production. Phys. Med. Biol. 2005, 50, 5921–5933. [Google Scholar] [CrossRef] [PubMed]
- Kry, S.F.; Howell, R.M.; Salehpour, M.; Followill, D.S. Neutron spectra and dose equivalents calculated in tissue for high-energy radiation therapy. Med. Phys. 2009, 36, 1244–1250. [Google Scholar] [CrossRef] [PubMed]
- Huang, W.; Li, Q.; Lin, Y. Calculation of photoneutrons produced in the targets of electron linear accelerators for radiography and radiotherapy applications. Nucl. Instruments Methods Phys. Res. Sect. B Beam Interact. Mater. Atoms 2005, 229, 339–347. [Google Scholar] [CrossRef]
- Howell, R.M.; Kry, S.F.; Burgett, E.; Followill, D.; Hertel, N.E. Effects of tertiary MLC configuration on secondary neutron spectra from 18 MV x-ray beams for the Varian 21EX linear accelerator. Med. Phys. 2009, 36, 4039–4046. [Google Scholar] [CrossRef]
- Brkić, H.; Ivković, A.; Kasabašić, M.; Sovilj, M.P.; Jurković, S.; Štimac, D.; Rubin, O.; Faj, D. The influence of field size and off-axis distance on photoneutron spectra of the 18 MV Siemens Oncor linear accelerator beam. Radiat. Meas. 2016, 93, 28–34. [Google Scholar] [CrossRef]
- Biltekin, F.; Yeginer, M.; Ozyigit, G. Evaluation of Photoneutron Dose Measured by Bubble Detectors in Conventional Linacs and Cyberknife Unit. Technol. Cancer Res. Treat. 2016, 15, 560–565. [Google Scholar] [CrossRef] [PubMed]
- Tai, D.T.; Loan, T.T.H.; Sulieman, A.; Tamam, N.; Omer, H.; Bradley, D.A. Measurement of Neutron Dose Equivalent within and Outside of a LINAC Treatment Vault Using a Neutron Survey Meter. Quantum Beam Sci. 2021, 5, 33. [Google Scholar] [CrossRef]
- Followill, D.S.; Stovall, M.S.; Kry, S.F.; Ibbott, G.S. Neutron source strength measurements for Varian, Siemens, Elekta, and General Electric linear accelerators. J. Appl. Clin. Med. Phys. 2003, 4, 189–194. [Google Scholar] [CrossRef] [PubMed]
- Homkhaow, K.; Liamsuwan, T.; Suntiwong, S.; Rattanarungruangchai, N.; Sudchai, W. Measurement of the distribution of neutrons produced by a 15 MV linear accelerator in a solid water phantom using CR-39 detectors. J. Assoc. Med. Sci. 2021, 54, 48–56. [Google Scholar] [CrossRef]
- Bramblett, R.L.; Ewing, R.I.; Bonner, T. A new type of neutron spectrometer. Nucl. Instruments Methods 1960, 9, 1–12. [Google Scholar] [CrossRef]
- Mathew, F.; Makdessi, G.A.; Montgomery, L.; Evans, M.; Kildea, J. The impact of treatment parameter variation on secondary neutron spectra in high-energy electron beam radiotherapy. Phys. Medica 2020, 80, 125–133. [Google Scholar] [CrossRef]
- Chibani, O.; Ma, C.M.C. Photonuclear dose calculations for high-energy photon beams from Siemens and Varian linacs. Med. Phys. 2003, 30, 1990–2000. [Google Scholar] [CrossRef]
- Mahmoudi, F.; Mohammadi, N.; Haghighi, M.; Alirezaei, Z.; Jabbari, I.; Chegeni, N.; Elmtalab, S.; Vega-Carrillo, H.R.; Kazemian, A.; Geraily, G.; et al. How much should you worry about contaminant neutrons in spatially fractionated grid radiation therapy? PLoS ONE 2023, 18, e0280433. [Google Scholar] [CrossRef]
- Ashrafinia, M.; Hadadi, A.; Sardari, D.; Saeedzadeh, E. Investigation of LINAC Structural Effects on Photoneutron Spectra, Flux, and Dose Using FLUKA code. Iran. J. Med. Phys. 2020, 17, 7–14. [Google Scholar] [CrossRef]
- Kim, Y.S.; Khazaei, Z.; Ko, J.; Afarideh, H.; Ghergherehchi, M. Estimation of photoneutron yield in linear accelerator with different collimation systems by Geant4 and MCNPX simulation codes. Phys. Med. Biol. 2016, 61, 2762–2779. [Google Scholar] [CrossRef]
- Yandex Cloud—Cloud.yandex.ru. Available online: https://cloud.yandex.ru/services/compute (accessed on 30 May 2023).
- Geng, C.; Tang, X.; Guan, F.; Johns, J.; Vasudevan, L.; Gong, C.; Shu, D.; Chen, D. GEANT4 calculations of neutron dose in radiation protection using a homogeneous phantom and a Chinese hybrid male phantom. Radiat. Prot. Dosim. 2015, 168, 433–440. [Google Scholar] [CrossRef]
- Apostolakis, J.; Folger, G.; Grichine, V.; Heikkinen, A.; Howard, A.; Ivanchenko, V.; Kaitaniemi, P.; Koi, T.; Kosov, M.; Quesada, J.M.; et al. Progress in hadronic physics modelling in Geant4. J. Phys. Conf. Ser. 2009, 160, 012073. [Google Scholar] [CrossRef]
- Kase, K.R.; Mao, X.S.; Nelson, W.R.; Liu, J.C.; Kleck, J.H.; Elsalim, M. Neutron Fluence and Energy Spectra around the Varian Clinac 2100C/2300C Medical Accelerator. Health Phys. 1998, 74, 38–47. [Google Scholar] [CrossRef]
- Lin, S.Y.; Chu, T.C.; Lin, J.P. Monte Carlo simulation of a clinical linear accelerator. Appl. Radiat. Isot. 2001, 55, 759–765. [Google Scholar] [CrossRef] [PubMed]
- Gantsovskiy, P.P.; Zheltonozhskaya, M.V.; Komarov, A.Y.; Lykova, E.N.; Tsovyanov, A.G.; Chernyaev, A.P.; Sirnov, F.Y.; Zinchenko, Y.P.; Kovyazina, M.S.; Shilko, R.S. Radiation Technologies in Medicine: The Role of Secondary Particles in Dose Formation. Bull. Russ. Acad. Sci. Phys. Ser. 2020, 84, 1547–1552. [Google Scholar] [CrossRef]
- Radiation Safety Standards (NRB-99/2009)-ntcexpert.ru—ntcexpert.ru. Available online: https://www.ntcexpert.ru/documents/docs/nrb-99-2009.pdf (accessed on 1 August 2023).
- Talebi, A.S.; Jadidi, M.; Hejazi, P. A Monte Carlo study on Photoneutron Spectrum around Elekta SL75/25 18 MV linear accelerator. Int. J. Adv. Biol. Biomed. Res. 2016, 4, 48–57. [Google Scholar] [CrossRef]
- Vega-Carrillo, H.; Martínez-Ovalle, S.; Lallena, A.; Mercado, G.; Benites-Rengifo, J. Neutron and photon spectra in LINACs. Appl. Radiat. Isot. 2012, 71, 75–80. [Google Scholar] [CrossRef] [PubMed]
- Martinez-Ovalle, S.A.; Barquero, R.; Gomez-Ros, J.M.; Lallena, A.M. Neutron dose equivalent and neutron spectra in tissue for clinical linacs operating at 15, 18 and 20 MV. Radiat. Prot. Dosim. 2011, 147, 498–511. [Google Scholar] [CrossRef]
- Han, M.C.; Yeom, Y.S.; Lee, H.S.; Shin, B.; Kim, C.H.; Furuta, T. Multi-threading performance of Geant4, MCNP6, and PHITS Monte Carlo codes for tetrahedral-mesh geometry. Phys. Med. Biol. 2018, 63, 09NT02. [Google Scholar] [CrossRef]
- Lykova, E.N.; Morozova, E.P.; Petrova, A.F.; Gromova, N.V.; Chernyaev, A.P. Measuring Doses of Radiation Leaked from a Multileaf Collimator on a Varian Halcyon Accelerator. Bull. Russ. Acad. Sci. Phys. 2022, 86, 460–464. [Google Scholar] [CrossRef]
Figure 1.
Scheme of the simulated model.

Figure 2.
The measurement of photoneutrons with tantalum plates and Bonner spheres (not installed).

Figure 3.
(a) The measured and calculated percentage depth–dose (PDD) curves and (b) the discrepancy between the measured and calculated dose.
Figure 3.
(a) The measured and calculated percentage depth–dose (PDD) curves and (b) the discrepancy between the measured and calculated dose.

Figure 4.
The calculated bremsstrahlung spectrum.

Figure 5.
Measured and calculated photoneutron spectra.


Table 1.
The radiation weighting factors for different radiation doses [27].
Table 1.
The radiation weighting factors for different radiation doses [27].
| Radiation | Energy Range, MeV | Radiation Weighting Factor from NRB-99/2009 (Agree with ICRP 60), Sv × Gy−1 | Energy Range, MeV | Radiation Weighting Factor from ICRP 103, Sv × Gy−1 |
|---|---|---|---|---|
| Photons, electrons, and muons | 1 | 1 | ||
| Electrons | 1 | 1 | ||
| Neutrons | <0.01 | 5 | <1 | |
| 0.01–0.1 | 10 | |||
| 0.1–2 | 20 | 1–50 | ||
| 2–20 | 10 | |||
| >20 | 5 | >50 | ||
| Protons | 5 | 2 | ||
| -particles | 20 | 20 |
is neutron energy.
Table 2.
Contributions of neutrons to the absorbed and equivalent dose.
| Radiation | Energy Range, MeV | Absorbed Dose Contribution (%) | Equivalent Dose Contribution (%) |
|---|---|---|---|
| Neutrons | Total | 0.22 | 1.61 |
| <0.01 | 0.17 | 0.86 | |
| 0.01–0.1 | 0.02 | 0.24 | |
| 0.1–2 | 0.02 | 0.51 | |
| 2–20 | |||
| Photons | Total | 99.77 | 98.39 |
Table 3.
The peak energies of the photoneutron spectra demonstrated in the literature.
| Reference | Bremsstrahlung Energy, MeV | Resonant Spectrum Peak Energy, MeV | Thermal Neutron Peak Energy, eV |
|---|---|---|---|
| Mahmoudi et al. [18] | 15 | 0.8 | 0.05 |
| Pena et al. [6] | 15 | 0.7 | 0.7 |
| Howell et al. [9] | 18 | 0.2 | NA |
| Kase et al. [24] | 18 | 0.1 | NA |
| Vega-Carillo et al. [29] | 18 | 0.3 | NA |
| Talebi et al. [28] | 18 | 0.6 | NA |
| Calculations | 20 | 1 | NA |
Disclaimer/Publisher’s Note: The statements, opinions and data contained in all publications are solely those of the individual author(s) and contributor(s) and not of MDPI and/or the editor(s). MDPI and/or the editor(s) disclaim responsibility for any injury to people or property resulting from any ideas, methods, instructions or products referred to in the content. |
© 2023 by the authors. Licensee MDPI, Basel, Switzerland. This article is an open access article distributed under the terms and conditions of the Creative Commons Attribution (CC BY) license (https://creativecommons.org/licenses/by/4.0/).
Share and Cite
MDPI and ACS Style
Chernyaev, A.; Belikhin, M.; Lykova, E.; Shcherbakov, A. GEANT4 Simulation of Photoneutron Spectrum from Medical Linear Accelerator. Quantum Beam Sci. 2023, 7, 27. https://doi.org/10.3390/qubs7030027
AMA Style
Chernyaev A, Belikhin M, Lykova E, Shcherbakov A. GEANT4 Simulation of Photoneutron Spectrum from Medical Linear Accelerator. Quantum Beam Science. 2023; 7(3):27. https://doi.org/10.3390/qubs7030027
Chicago/Turabian StyleChernyaev, Alexander, Mikhail Belikhin, Ekaterina Lykova, and Alexey Shcherbakov. 2023. "GEANT4 Simulation of Photoneutron Spectrum from Medical Linear Accelerator" Quantum Beam Science 7, no. 3: 27. https://doi.org/10.3390/qubs7030027