1. Introduction
In 1965, Ivan Sutherland envisioned the ultimate display [
1], a display that provides visual and haptic feedback that can present objects that are indistinguishable from those in the real world. This vision is similar to the Star Trek Holodeck [
2] and has inspired research in the fields of photorealistic Augmented Reality (AR). Current technology is far from being able to create such an ultimate display, but recent research has made progress towards providing indistinguishable visual AR, causing some researchers to call for an AR Turing Test to quantify this progress [
3].
Commercial interest in AR has increased significantly over the last years, paving the way for Optical See-Through Head-Mounted Displays (OST-HMDs) such as the Google Glass (Mountain View, CA, USA) [
4] and Microsoft HoloLens (Redmond, WA, USA) [
5]. OST-HMDs overlay AR content directly onto a user’s view. One of the largest obstacles to photorealistic AR on OST-HMDs is the mismatch between the Depth of Field (DoF) properties of the user’s eyes and virtual camera used to generate computer graphics (CG). Over the years, researchers have proposed a variety of HMDs that can be refocused [
6]. For example, by rendering CG at multiple focal planes, users will experience DoF effects when they focus on objects at different depths. Some displays reproduce the appearance of CG from multiple viewing angles, thus recreating the entire light field (also referred to as Light-Field Displays (LFDs)). These displays are computationally expensive, have small spatial resolution, and introduce unintended noise. Refocusable displays are also difficult to manufacture, for example due to the required resolution of the display and accuracy of the manufacturing process. Most designs were on a conceptual level with bulky proof-of-concept setups. Only a few of these systems have been built into HMDs, and even fewer into OST-HMDs. These prototypes suffer from increased diffraction, contrast, and color issues, as well as bulkiness due to the increased complexity of the optical system [
6]. For these reasons, it is no surprise that no refocusable OST-HMDs are currently available commercially. State-of-the-art OST-HMDs present CG on a single focus plane, which is simpler to manufacture, and thus cannot create DoF effects with the built-in optics.
In recent years, there has also been a growing interest in free-focus displays, for example retinal displays [
7]. These displays ensure that the content displayed on the OST-HMD always appears in focus to the user. This is especially beneficial for users with eye deformations, like keratoconus or macular degeneration, or those who have to constantly switch focus between CG and the real world, thus leading to increased eye fatigue. As the CG is always presented in focus, it is also not possible to generate DoF effects optically. Therefore, it is necessary to develop a method that creates realistic DoF effects for displays where these cannot be created optically.
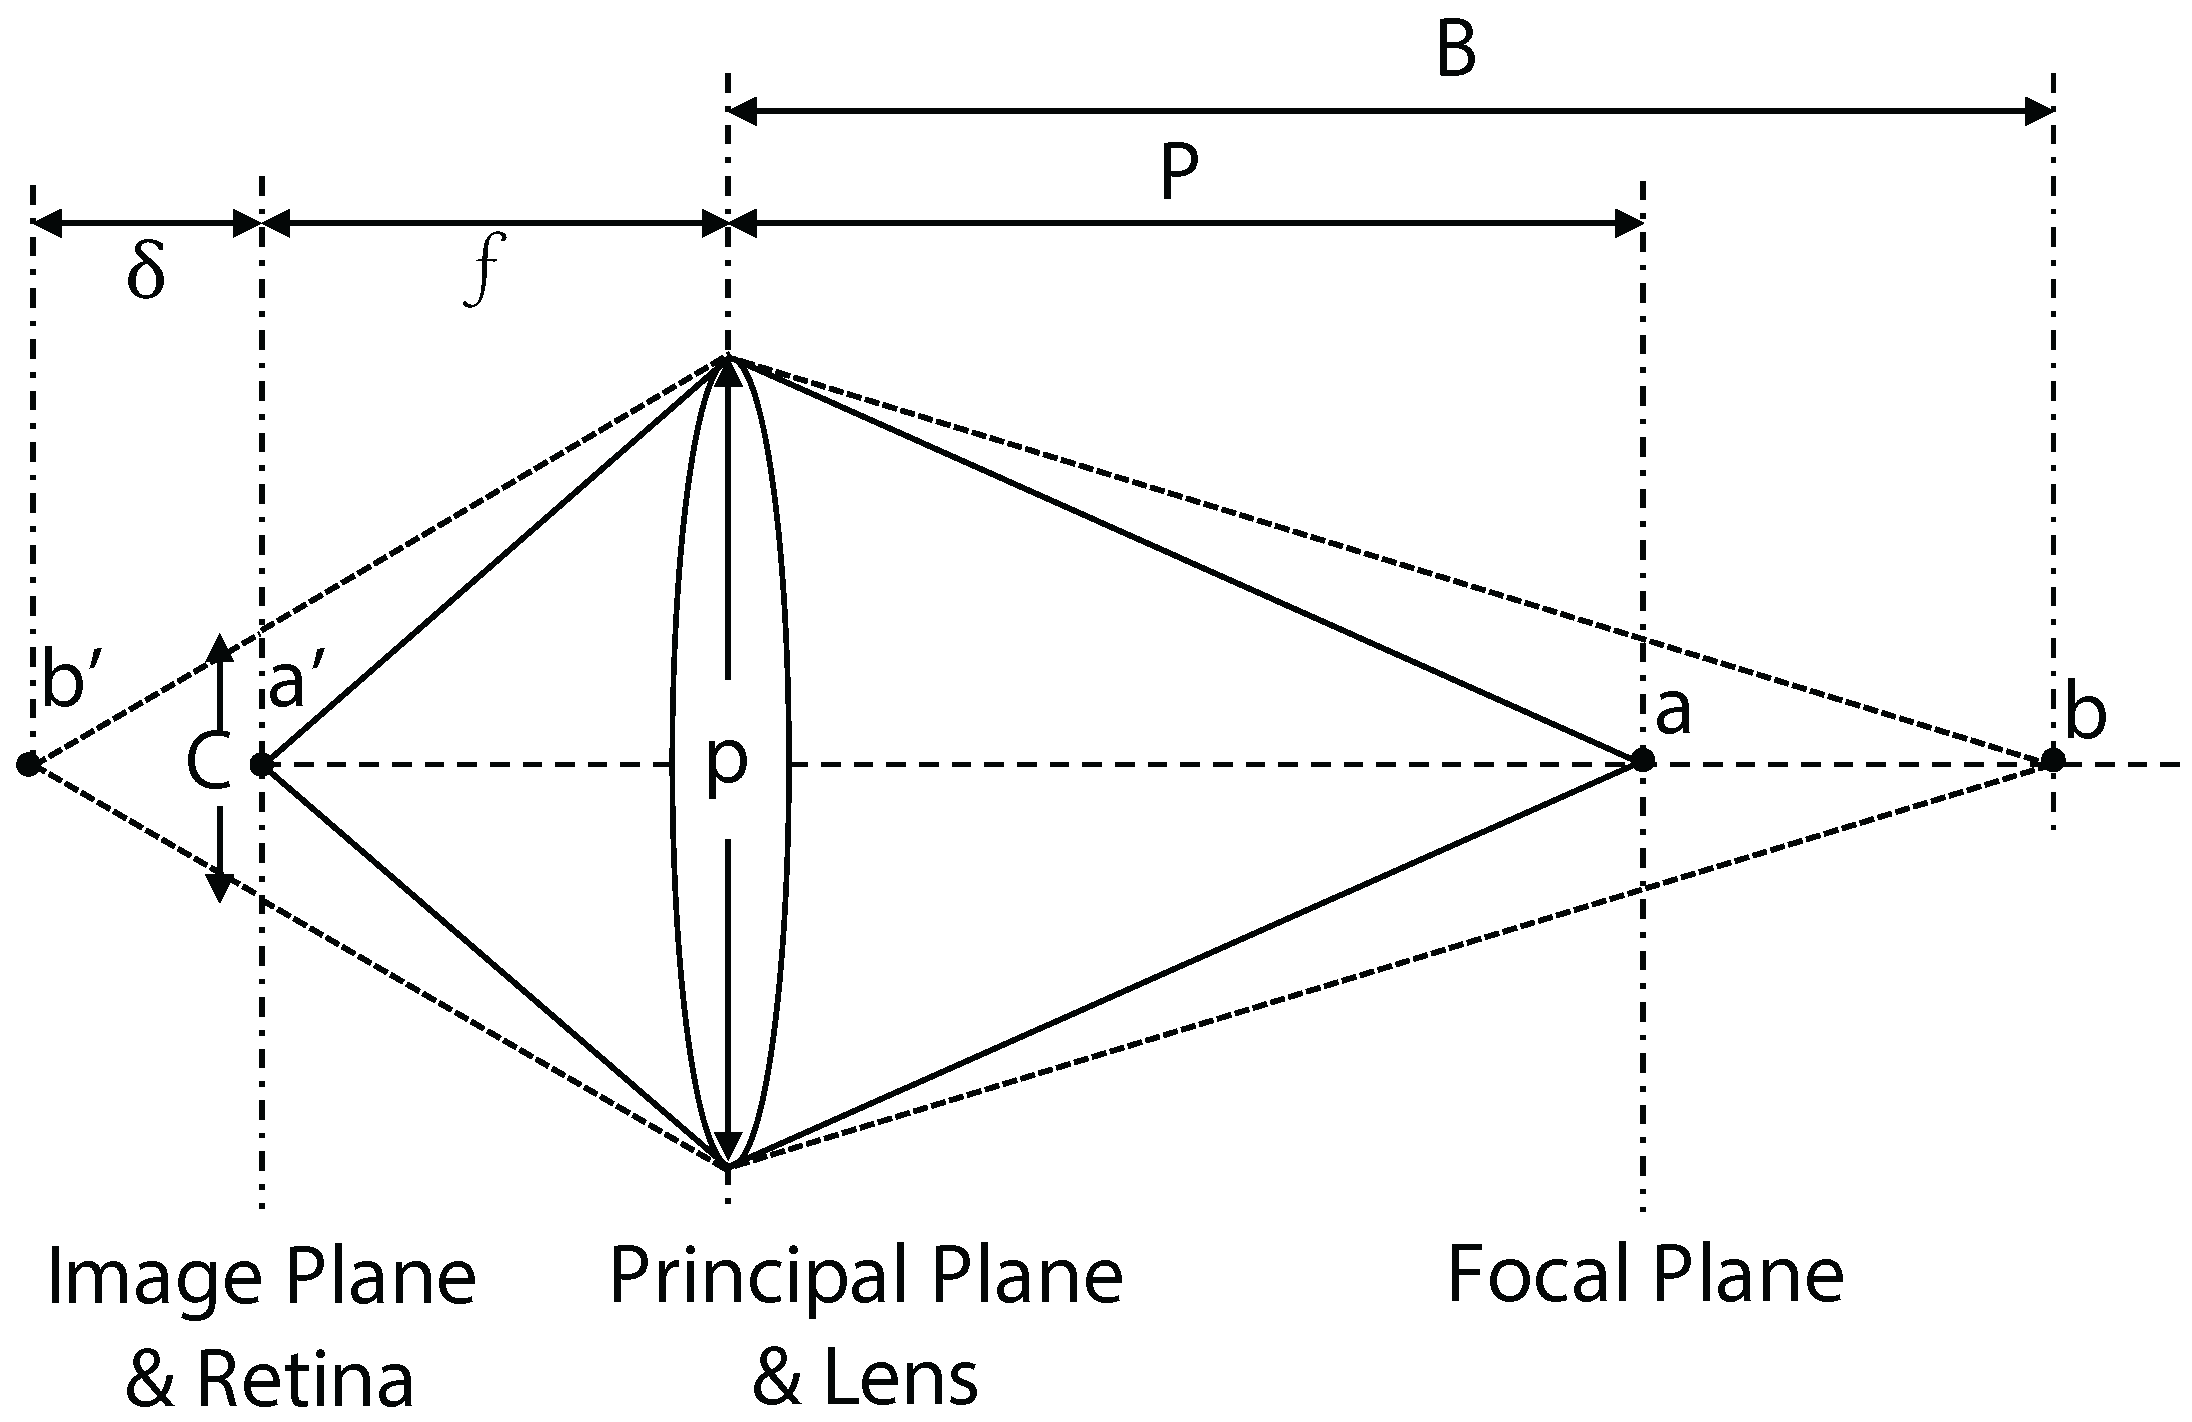
Commonly, to project CG from an OST-HMD to the user, the eye is modeled as a pinhole camera, and the image plane coincides with the imaging plane of the HMD [
8]. This assumption does not correctly represent the human visual system. Our visual system relies on several depth cues in order to distinguish which objects are closer to us. Teittinen [
9] and Ware [
10] discuss all depth cues in detail. One of them, accommodation, is closely related to DoF and refers to the eye changing its shape to change its focal length, thus bringing objects at different distances into focus. Similarly, the size of the pupil diameter is adjusted to control the amount of light entering the eye. Similar to a camera, a wider pupil results in a shorter focus, while a smaller pupil increases the focal distance. Thus, a more accurate representation of our visual system would be a camera with continuously adjusted focal length and aperture size.
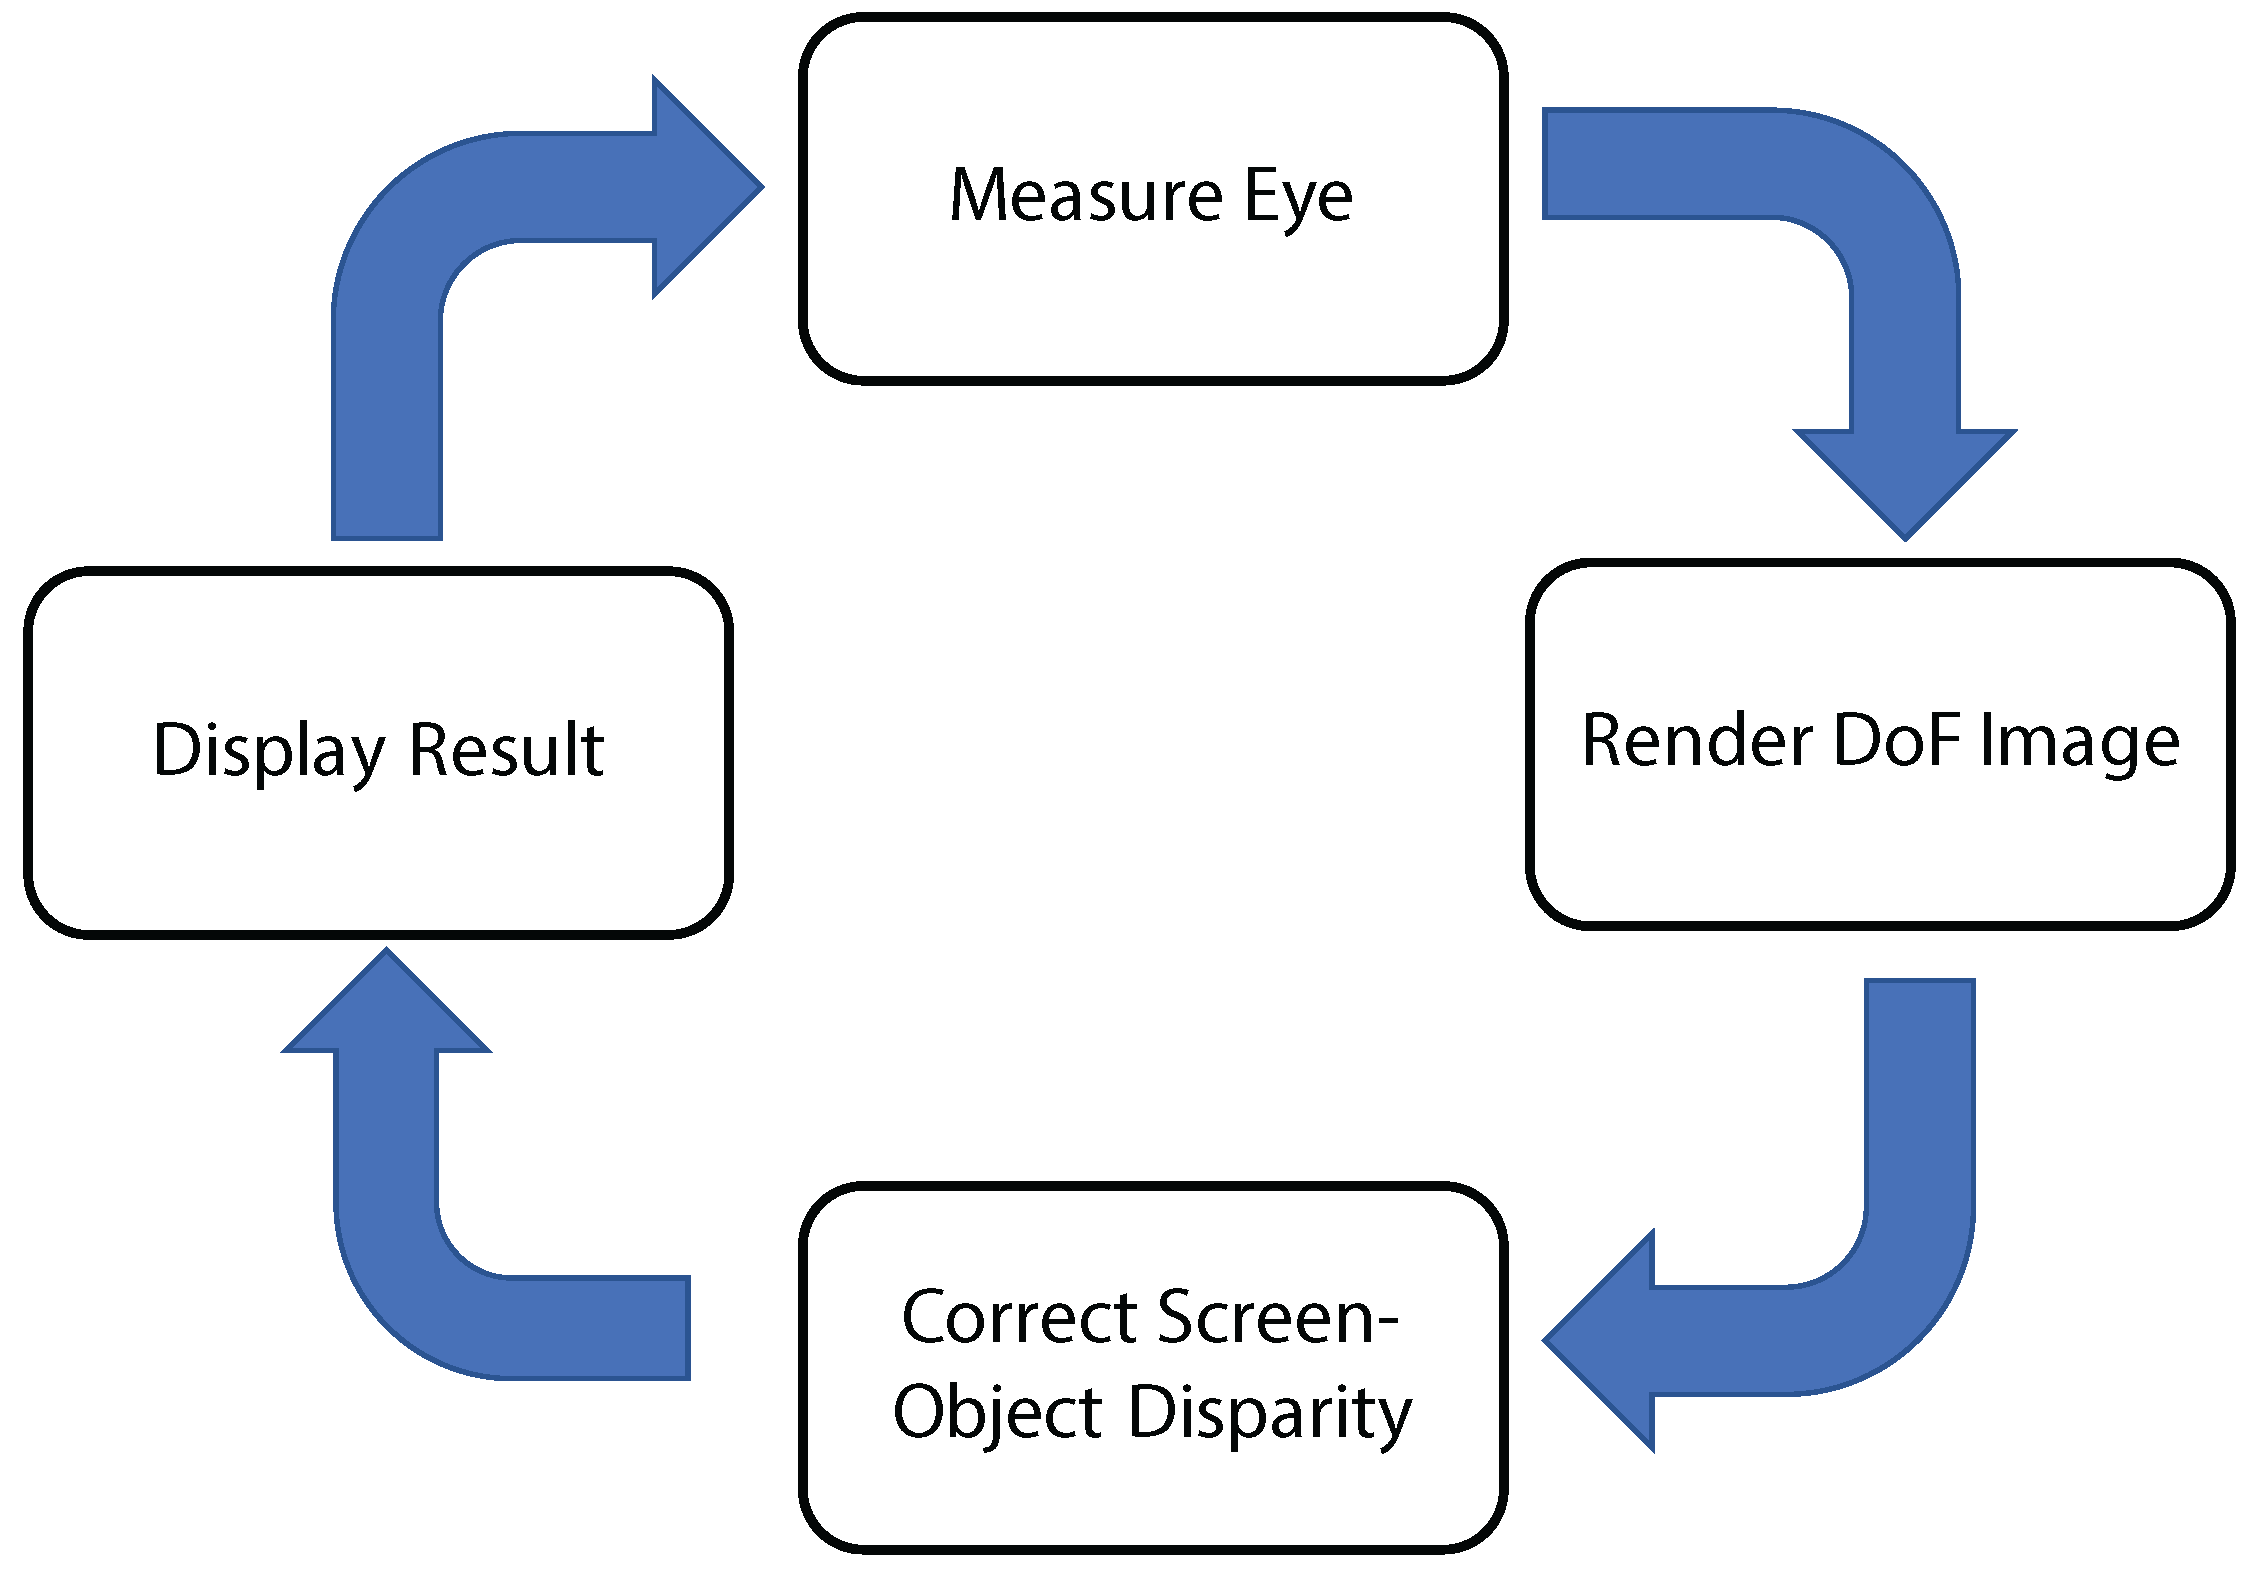
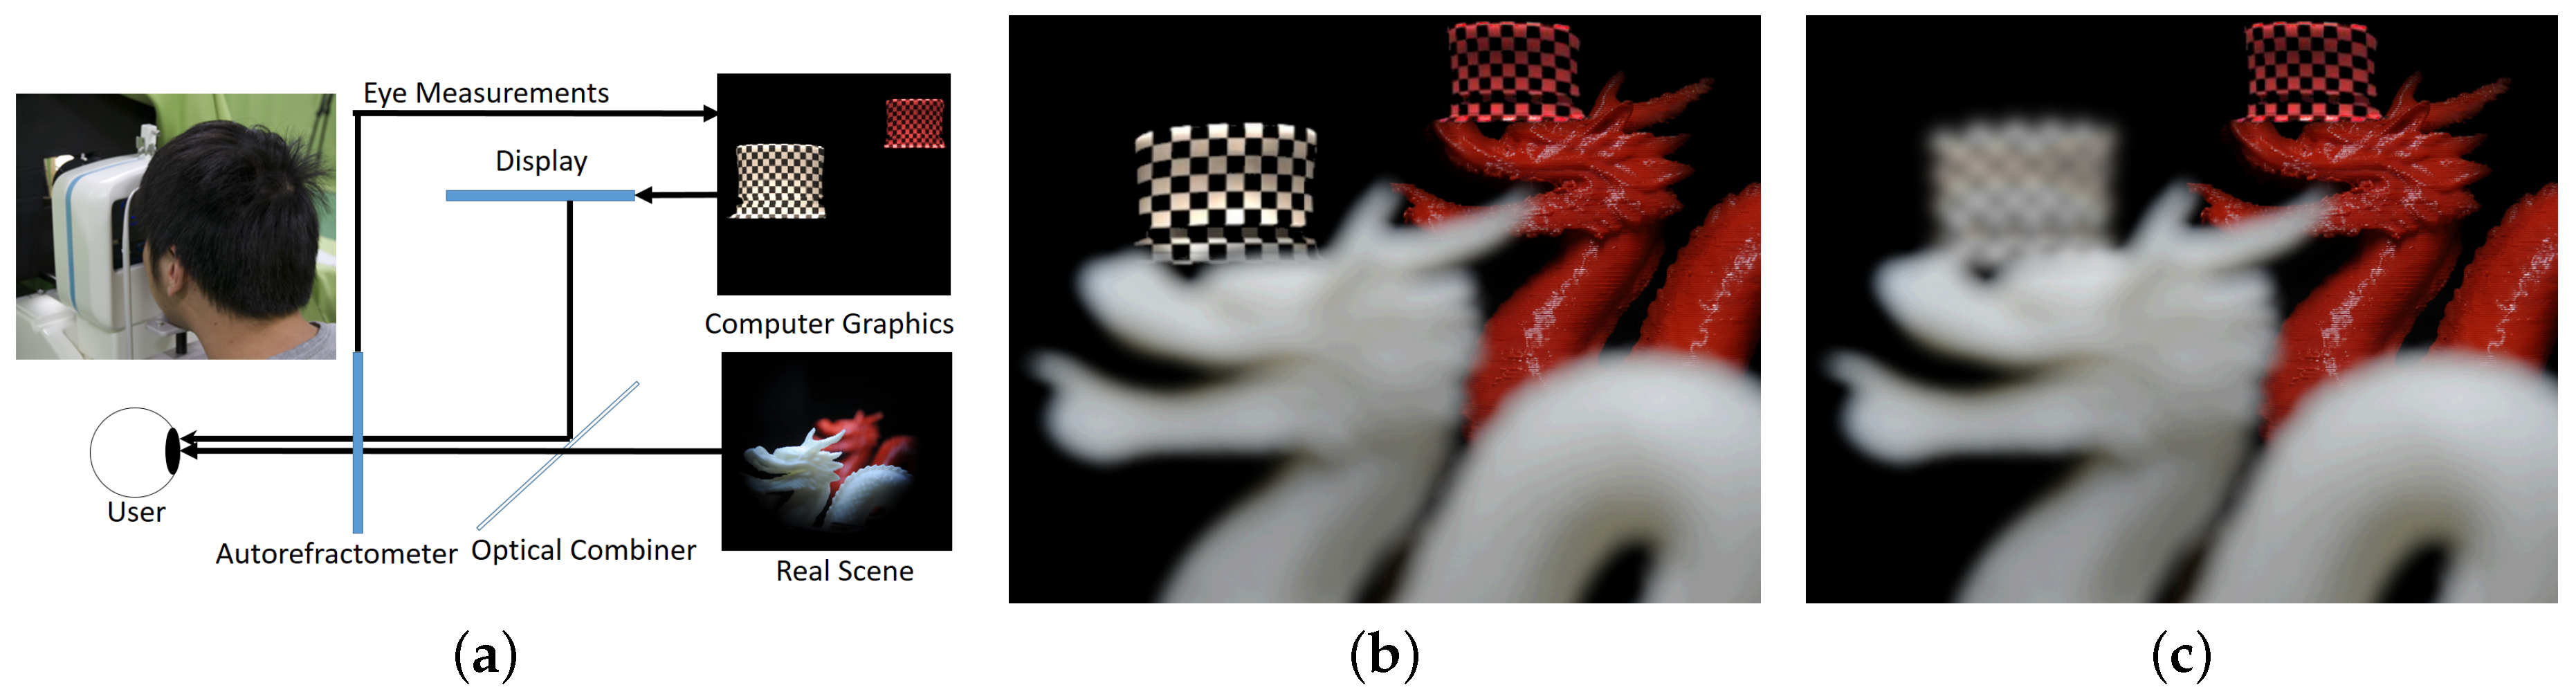
In this paper, we present EyeAR, an approach to generate refocusable AR content through the use of eye measurements (see
Figure 1). By measuring the user’s focus distance and pupil size we can continuously match CG with the user’s visual system, thus presenting CG that matches the DoF of the eye. This idea is similar to the work of Kán and Kaufmann [
11] who recover the DoF of a camera to present CG that match the camera’s DoF. We describe the theory behind EyeAR and how it could be integrated into off-the-shelf OST-HMDs. In this paper, we investigate how well EyeAR can reproduce the DoF on a display with a single focal plane. Contrary to retinal and varifocal displays, the most common type of OST-HMDs presents content in focus only on a single plane. It is thus necessary to understand how well EyeAR performs on these displays and how the disparity between the focus distance and the virtual image plane will affect the results. We use a variant of the AR Turing Test to check if users can distinguish between real and virtual objects and determine the improvement in quality over CG rendered with a pinhole camera eye model.
The realism of rendered content is affected by a variety of cues, such as reflection, occlusion, color consistency, shadow consistency, and DoF consistency, to name a few. As each of these aspects could be used to distinguish between real objects and CG, most visual Turing Tests use photographs to evaluate the quality of rendered content [
12,
13]. In OST AR, it is not sufficient to ask users to compare photographs of the CG with real objects, as users can also observe the real world. The graphics thus must be affected by the scene illumination, account for the user’s focus, and exhibit correct occlusion with real objects.
In our setup, we tried to eliminate cues that could help users distinguish between real objects and CG and focus on the impact of the estimated DoF while users freely refocus between objects at different depths. We asked participants to look at three pillars (one of which was virtual) placed at three different depths (see
Figure 2). We then challenged users to identify the virtual pillar while allowing their eyes to freely change focal depth. We compare CG rendered with EyeAR and the pinhole eye model. The results of our experiment confirm our expectation that CG rendered based on eye measurements are more realistic than those rendered with the pinhole eye model. We also found that the blue pillar could not be identified as real or CG better than chance if it was placed at the same distance as the display; the other two pillars came close, but were identified slightly above chance. This could be due to the disparity of focal lengths between the real objects and the virtual image plane, the low update rate of the autorefractometer that we used to measure the focus distance, or unintended artifacts, such as minor differences in texture or illumination of the real objects and the generated CG.
This paper describes the core idea and theory that has been presented both as a tabletop prototype [
14] and as a partially implemented OST-HMD integration [
15]. This paper also describes in detail the AR Turing test from [
16].
Contributions:
We show that, for OST AR, rendering CG based on measurements of the user’s eyes improves the perceived realism of the observed graphics. In particular, CG rendered with EyeAR were always perceived to be more realistic than CG rendered with the pinhole eye model.
EyeAR is the first OST system to create AR CG that are coherent with the real environment while refocusing, albeit only when the position of virtual objects coincided with the focus distance of the display.
Our experiment is the first instance of an AR Turing Test aimed at testing refocusable content for OST AR setups.
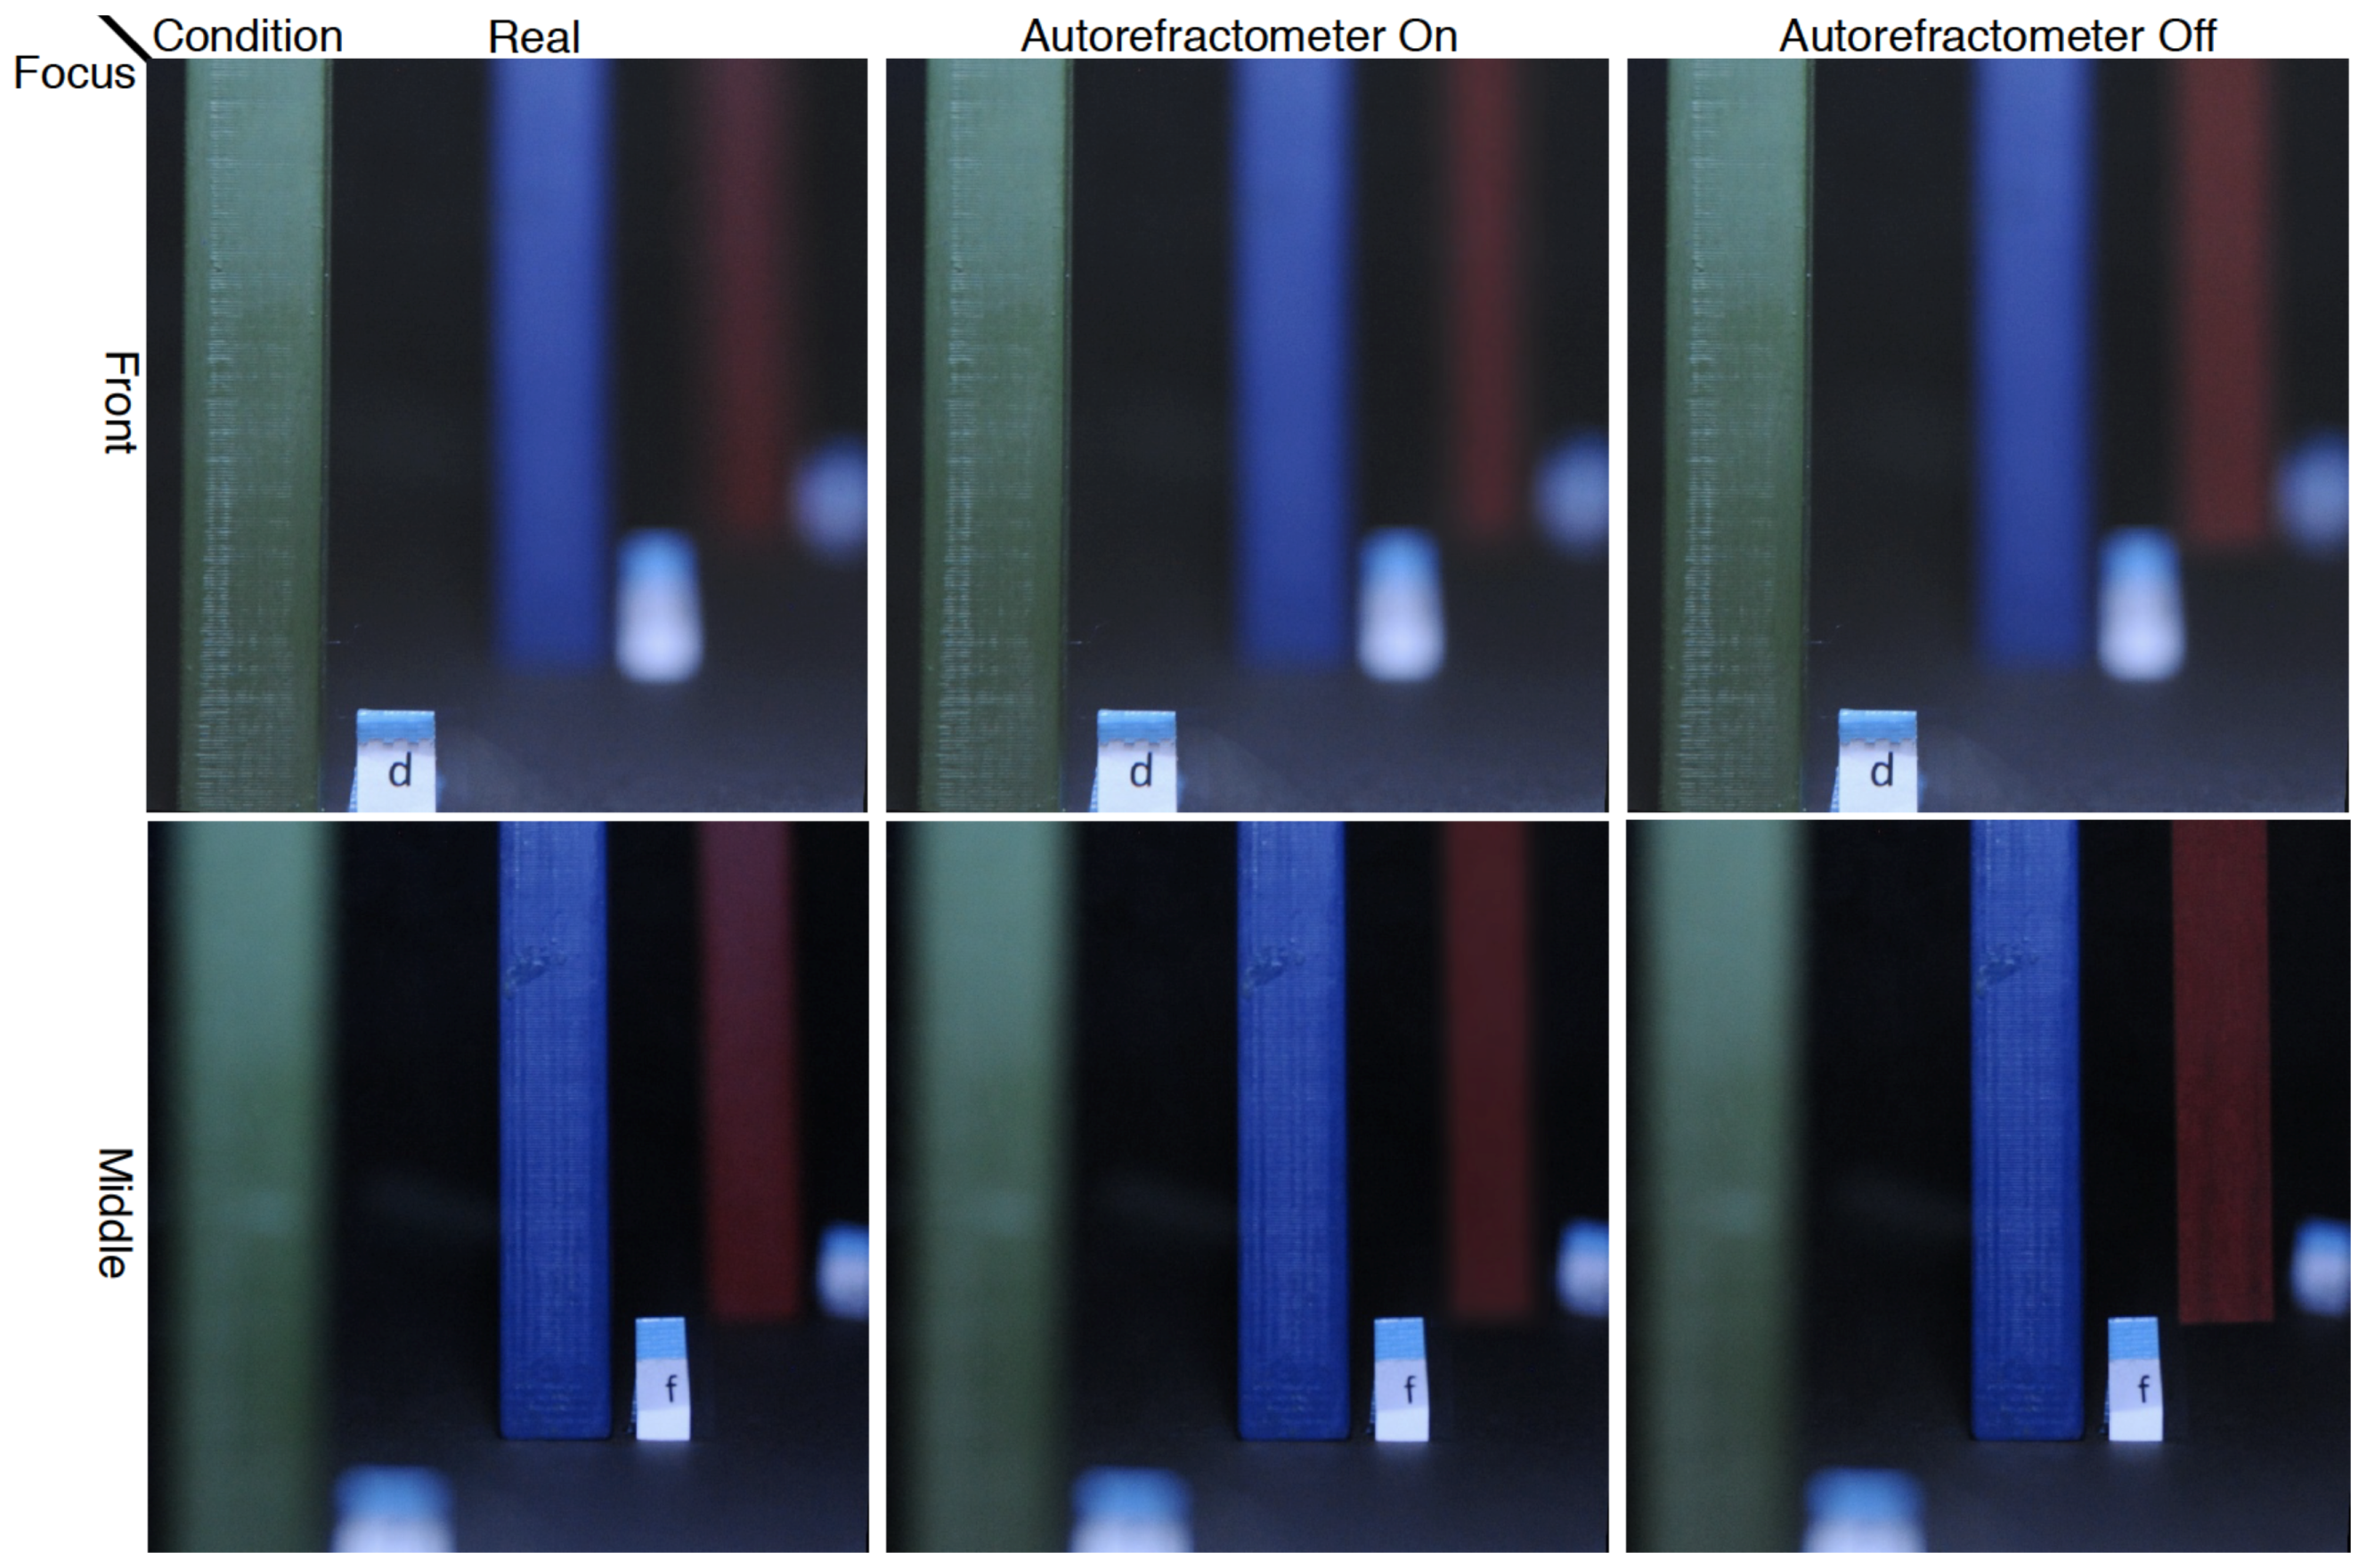
We captured the first person illustrations of our display with a Nikon D700 SLR camera (Shinagawa, Tokyo, Japan) through the display itself and did not apply any post processing. We set the SLR’s aperture size and f-stop to typical values obtained from users of user testing.
4. Experimental Platform
Our experimental platform consisted of the following elements:
Measuring the Eye. We use the Grand Seiko WAM-5500 autorefractometer (Fukuyama City, Hiroshima, Japan). It measures pupil size p and focal length in diopters D at 5 Hz with an accuracy of ±0.25 D. It also allows us to read these measurements over a serial connection. We then calculate the focus distance as and transmit p and f to the rendering component.
Rendering System. We implemented the rendering pipeline on a desktop computer with an Intel Core i7 3790K processor (Santa Clara, CA, USA), 8 GB RAM and an NVIDIA GTX 980 graphics card.
Our implementation of distributed ray tracing [
40] is based on NVIDIA’s Optix [
43] framework. For each point on the retinal image, we combined ray tracing results from 32 samples uniformly distributed over the pupil. We additionally use bi-directional reflectance functions [
44] for materials. To account for the slow measurement speed of the autorefractometer, we linearly extrapolate the values received over the past second to predict the next observation. We then interpolate from the current parameters towards the predicted values. We rendered all images at 30 fps and transferred them to the display in our experimental platform.
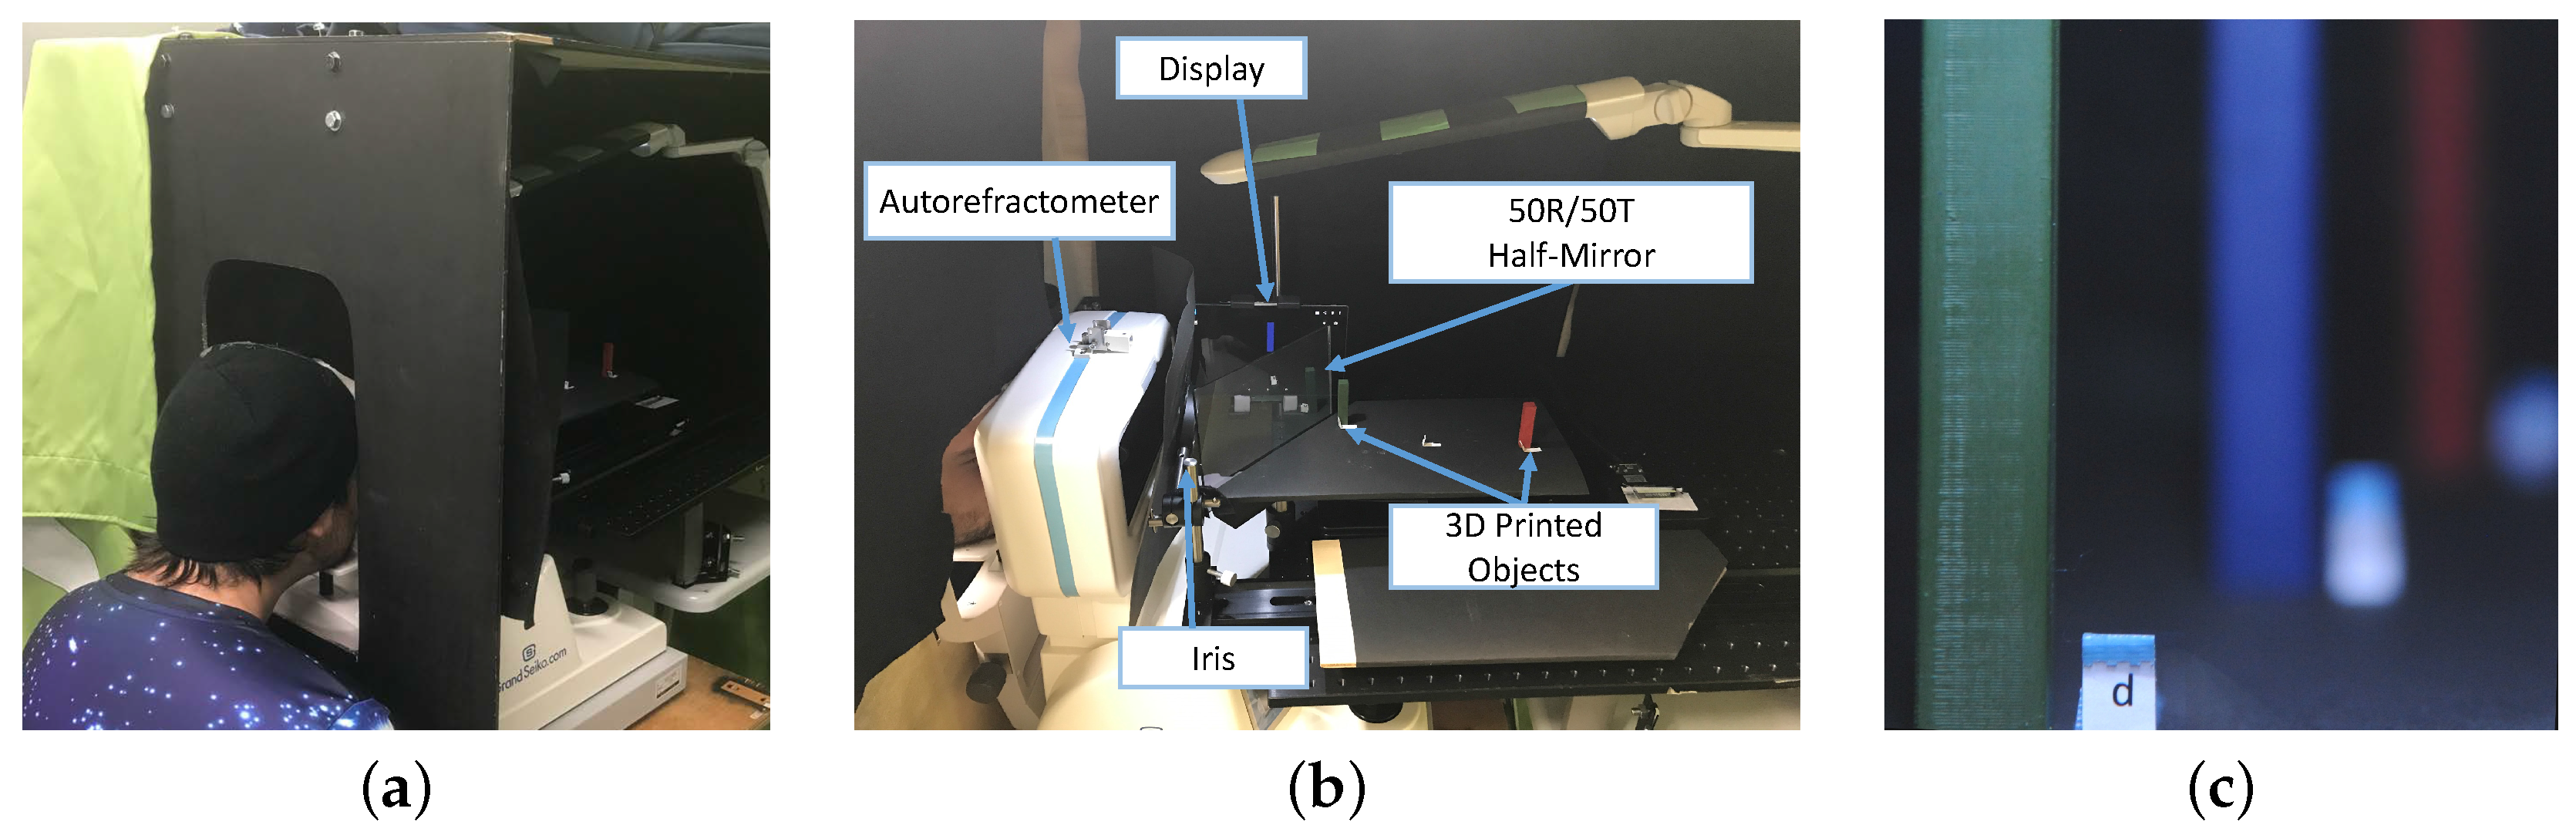
Physical Setup. Our experimental setup is shown in
Figure 5a. The setup was surrounded by an enclosure to prevent variations of illumination of the scene caused by external light sources. Inside the box enclosure, an LED lamp was placed to provide a controllable area light source. We display the graphics on a Dell Venue 8 (Round Rock, TX, USA) organic light emitting diodes (OLED) tablet with a resolution of 2560 × 1600 and 359 dpi and a 50 R/50 T optical mirror to create an optical see-through display with a fixed display depth. The display was positioned 0.375 m away from the participant. Inside the box enclosure, we placed three 3D printed pillars painted in uniform colors. One was green, the second was blue, and the last one was red, and they were placed at depths of 0.25 m, 0.375 m, and 0.5 m, respectively, on a tilted platform to provide a perspective depth cue (see
Figure 5b). In each trial, one of the three real pillars was replaced with a computer-generated counterpart, which was rendered either in perfect focus or using the measurements taken from the autorefractometer, exhibiting DoF. Given the standard error of the autorefractometer of 0.25 D, the expected focus measurements for each pillar were:
23.5–26.6 cm for the green pillar,
34.2–41.3 cm for the blue pillar, and
44.4–57 cm for the red pillar.
Liu et al. [
23] showed that measurements provided by the autorefractometer fluctuate near the ground-truth focus distance. We thus average the measurements over the past 2 s to account for this fluctuation.
Humans use multiple depth cues such as accommodation, vergence, overlap, and retinal image size to recover the depth of objects [
9]. Our setup was designed to eliminate shadows, aerial perspective, overlapping, and linear perspective cues. Additionally, to prevent movement and binocular parallax cues, participants had to wear an eye-patch over their non-dominant eyes and place their heads onto a chin rest. An iris diaphragm behind the autorefractometer ensured that the participant’s field-of-view was limited to the experiment setup. To prevent texture depth cues, the pillars had a uniform color. The pillars were aligned manually before each trial and this could cause their position to change slightly. This unnoticeable displacement helped prevent the participants from guessing the virtual pillars due to the aberrations of their eyes. To assist participants in refocusing at different depths, the letters placed next to the pillars provided a texture cue, and the relative size of the pillars provided retinal image size cues. These cues allow participants to adjust the focal length of the eye to refocus at different distances. We could thus measure the participant’s accommodation to determine the focus depth.
5. Experiment
The purpose of this experiment was to assess whether correctly rendered DoF computer-generated objects using EyeAR were more difficult to distinguish from the real objects than those generated without using EyeAR. For this, we conducted a variant of the graphics Turing Test [
13]. Our hypotheses stated that:
H1 With the autorefractometer off, participants will guess the virtual pillar correctly more often than when the autorefractometer is on.
H2 With the autorefractometer on, participants will correctly guess the virtual pillar no better than random chance.
5.1. Participants
We recruited twelve participants (6 female, 6 male) between 19 and 45 years, mean 30.2, and standard deviation of 9.2, from both the students at the university and the general public. All participants claimed to have normal or corrected-to-normal vision with the use of contact lenses. We verified this with visual acuity tests under three conditions (see
Section 5.2). The study was conducted in accordance with the Declaration of Helsinki, and the protocol was approved by the Ethics Committee of Nara Institute of Science and Technology (Ikoma, Japan). Participants signed a consent form, and were monetarily compensated for their time.
5.2. Preliminary Tests
Our system requires reliable measurements of the participants’ dominant eye with the use of the autorefractometer. We verified that we could read data over a range of diopters. We also confirmed that they were able to focus on the objects within the range used in the experiment. All volunteers had to pass four preliminary tests before taking part in the experiment. The first test allowed us to verify the participant’s dominant eye. The second and third verified the participants visual acuity for far and near sight, respectively. The final test verified that the autorefractometer was capable of reading diopters over the experimental depth range (0.25–0.5 m). The total time needed for these tests was 10 min per participant. The tests are described as follows:
Eye-dominance test. Each participant stood 3 m away from a marked object facing towards it. They were then asked to hold their hands 50 cm away from their eyes with the thumb and index finger forming a connected arch, and looked at the marked object through the arch. This caused participants to hold their hands biased towards their dominant eye. We consider the eye used to look at the object their dominant eye. The dominant eye was then used on the later preliminary tests, with the non-dominant eye covered by an eye patch.
Acuity test. Once the dominant eye was determined, each participant carried out two standard tests used in optometry to measure visual acuity. In the first, they stood 2.8 m away from a Snellen chart held at eye level. If the participant was not able to read a letter, they guessed it. The test finished when he or she failed to read more than half of a line or was able to read the entire chart. We only accepted participants with a visual acuity of at least 20/30.
The second acuity test measured participant’s short-distance visual acuity. Each participant sat down on a chair 40 cm away from a Rosenbaum chart placed at eye level. They proceeded to read the numbers on each line. If they could not read the line, they had to guess it. The test had the same ending conditions as the previous one, with participants excluded if their determined visual acuity was not better than 20/30.
Operability test. The fourth and last preliminary test verified that the autorefractometer could accurately read the participant’s dominant eye. The measurements can sometimes be affected by participants with corrected-to-normal vision with the use of either contact lenses or spectacles, or when the person is not able to focus on the objects placed within the range limit accepted by the autorefractometer, between 0.25 m and 0.5 m. Each participant was asked to look at a chart hanged from a horizontal beam. The dominant eye was measured while the card moved steadily along the beam, starting from 0.5 m away and moving it towards the eye (up to 0.25 m), and then back to the original position over an interval of 3 s.
5.3. Task and Procedure
Participants sat down in front of the autorefractometer and looked at the scene inside the box enclosure. The scene composed of three pillars with letters besides them. Participants were instructed to focus on the pillars and letters beside them for a total of 20 s per trial. At the end of each trial, a researcher occluded the scene and in a separate room the participant wrote on a sheet which pillar they considered to be virtual. While they answered, the researcher changed the pillars according to a sequence randomly generated in advance. The procedure was then repeated twelve times for each participant—from which each permutation of the experimental variables was repeated twice per participant. Each session took 40 min per participant in total.
5.4. Variables
Our experiment was designed as a within-subjects experiment. We looked at whether participants correctly guessed the pillar that was computer generated as a binary outcome. We also collected general feedback from each participant with the goal of gaining insight on the results from the evaluation. The independent variables of our experiment were as follows:
VirtualPillar ∈ { red, green, blue}
Autorefractometer ∈ { On, Off}
TrialSequence ∈ { 1 ... 12}
5.5. Results
Table 1 shows the results of the analysis of the recorded data. We use
p < 0.05 as a criteria to determine statistically significant results.
The results of the regression support H1. The results show that the number of correct guesses was significantly higher when the autorefractometer was off for all three pillars. We also found that there was a learning effect, making it easier for participants to guess the virtual pillar in later trials. The analysis also revealed that gender was also significant, which was not initially expected.
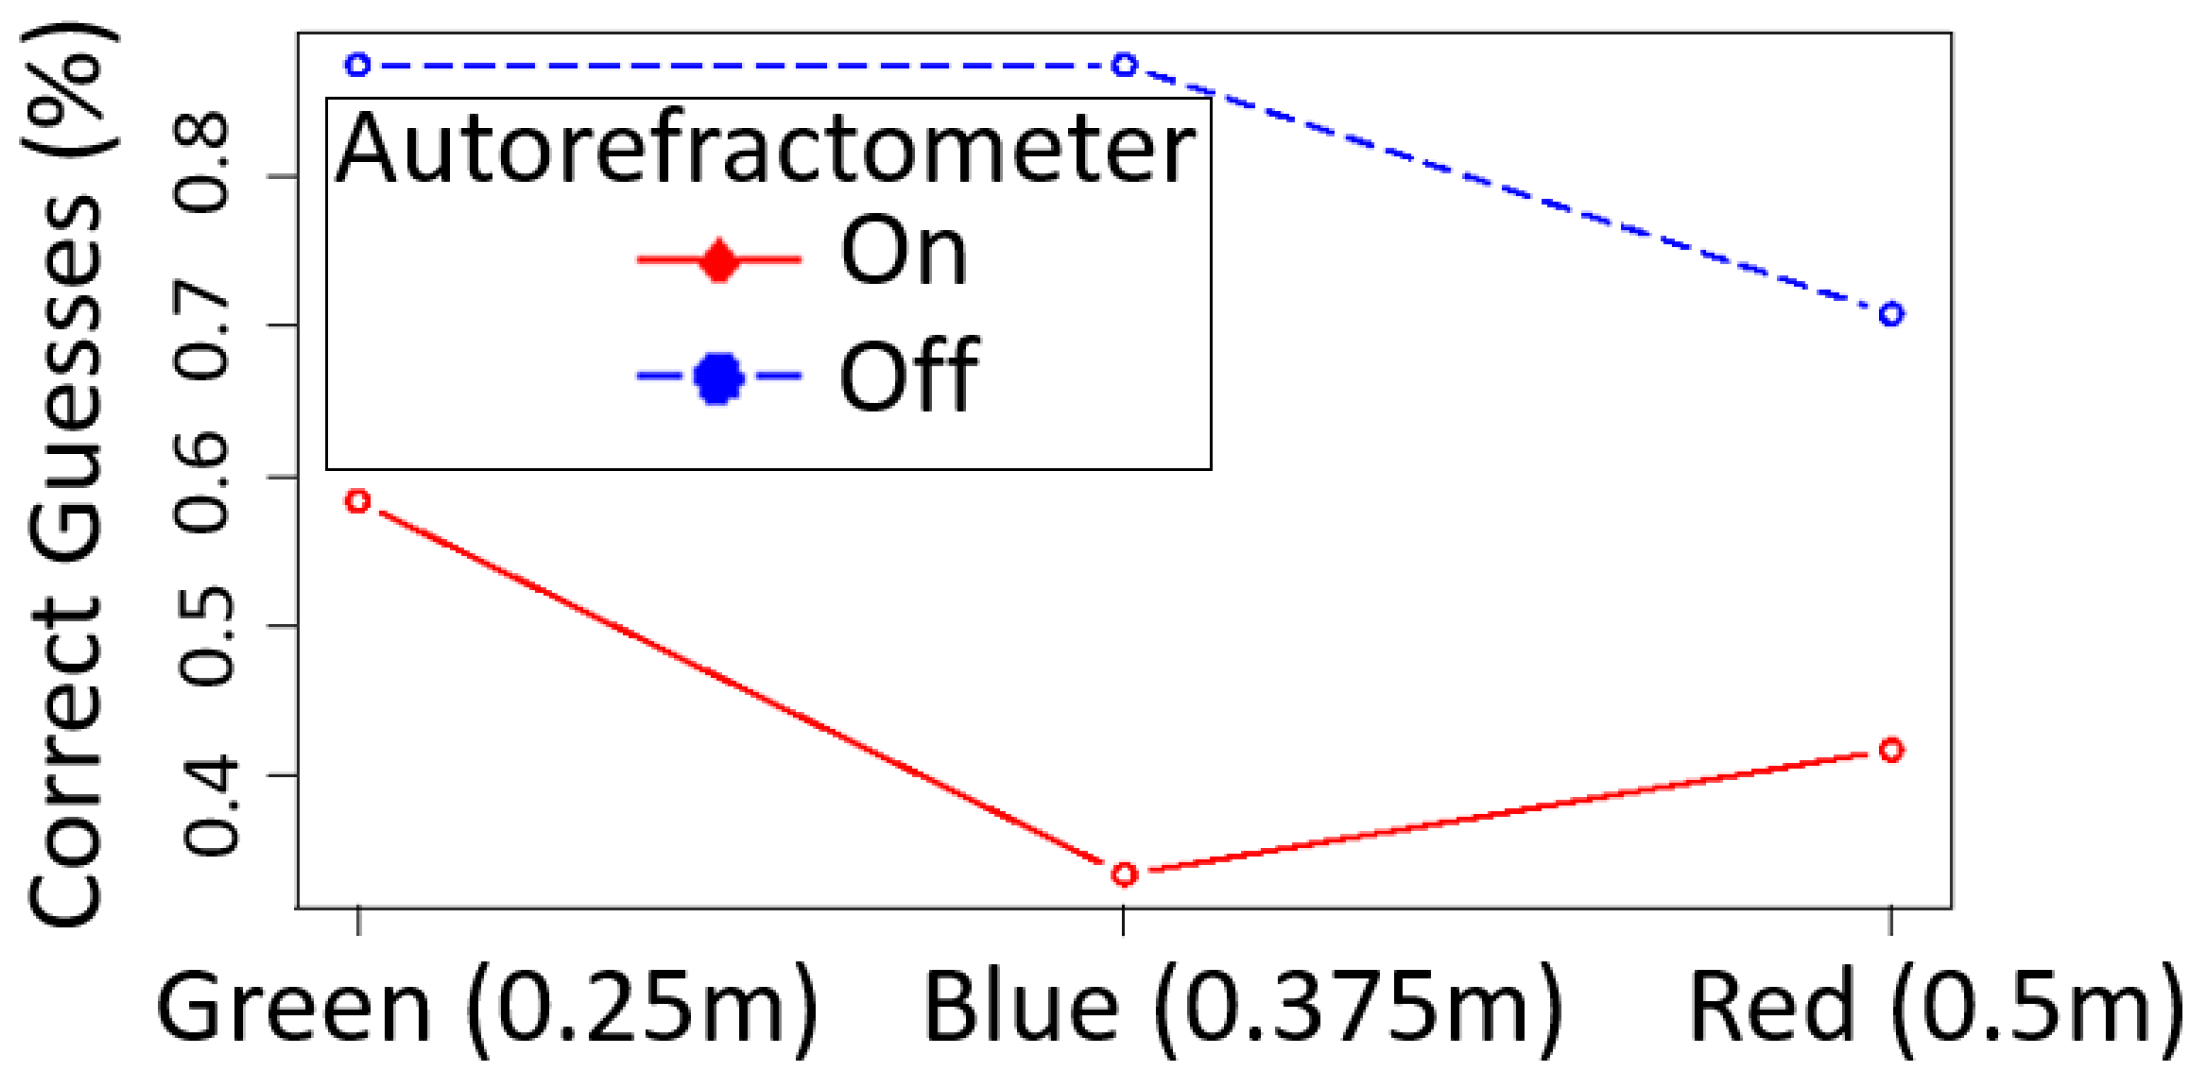
H2 stated that, with the use of the data collected from the autorefractometer, participants would correctly guess about 33% of the time, the same results as if they tried to guess by chance. This hypothesis was rejected for the green (58.3%) and red (41.7%) pillars. However, the results for the blue pillar (33.3% of correct guesses) were compatible with H2. In all cases, CG rendered in the “Autorefractometer = on” condition were recognized less often than CG rendered in the “Autorefractometer = off” condition.
Figure 6 shows the percentages of success when guessing which pillar was the virtual one for each experimental condition. At first sight, the plot shows that participants found it easier to guess the virtual pillar when the refractometer was off (
of the times) compared to using the data from the refractometer (
) to adjust the blurriness of the pillars in real time. Concerning the pillars, participants guessed it right more often when the green one was virtual compared to the other two. Looking at
H2, the total number of correct guesses for “Autorefractometer = on” was 32,
n = 72. We computed the confidence intervals using different methods to test whether the probability to guess it correctly could be 0.33. The Wilson score interval method returned a sample mean of 0.44 with a 95% confidence interval = 0.335 to 0.559. This result rejects that 0.33 is the expected mean value of the population by a very narrow margin, therefore rejecting
H2. The Clopper–Pearson binomial interval returns a very similar value (95% conf. int. = 0.327 to 0.566), but it does not reject the hypothesis, although it is still very unlikely that the true mean is 0.33.
We now take a look at the pillars separately. With “Autorefractometer = on”, the green pillar was guessed correctly 14 times (n = 24, sample mean = 0.583, 95% conf. int. = 0.366 to 0.779), the blue pillar 8 times (n = 24, sample mean = 0.333, conf. int. = 0.156 to 0.553), and the red one 10 times (n = 24, sample mean = 0.417, conf. int. = 0.221 to 0.634). These results reject that green and red pillars were guessed only by chance, but provide evidence that the virtual blue pillar could not be distinguished from its real counterpart.
This was a within-subjects experimental design with a binary dependent variable. Then, we decided to estimate a model using generalized estimating equations (GEE) [
45,
46]. The GEE analysis provides statistical estimation similar to repeated-measures ANOVA, but can achieve higher power with a lower number of repeated measurements [
47]. Besides the two main independent variables, we also included the trial sequence (
TrialSequence), gender, and age to test whether they could also be explanatory variables. A standard criteria to test the model fitting is the Akaike information criteria, but it has been argued that it is not applicable when using GEE, as this method does not provide models based on likelihood. Pan [
48] proposed that the quasi-likelihood information criterion (QIC) suits better for this case. Other criteria have been proposed such as the correlation information criterion (CIC) [
49], although it is better take into account more than one criterion [
50].
Table 1 shows that the main contributor of the linear model with no interaction terms was the experimental variable
Autorefractometer, although it is not the only one. The trial sequence and gender are also contributors, though they have a lesser effect. On the other hand, VirtualPillar and age do not contribute. This model returned criteria values QIC = 164.91 and a CIC = 4.01. Removing the non-contributors and adding interaction terms for the predictors of the previous model returns that none of them are significant (Autorefractometer•Gender
p = 0.439; Autorefractometer•TrialSequence
p = 0.804; TrialSequence•Gender
p = 0.902). This second model returns higher scores on both QIC (169.14) and CIC (6.34), which means that the second model fitting is not as good as the previous one. One last model was tried with only Autorefractometer, TrialSequence, and gender, returns the lowest criterion scores, with QIC = 164.54 and CIC = 3.34, having again Autorefractometer (
p) the strongest predictor, but both TrialSequence (
p = 0.022) and Gender (
p = 0.013) also need to be taken into account.
5.6. Discussion
The results of our experiment support H1. We found that participants were less likely to detect the CG content when rendered based on readings from the autorefractometer. We were surprised by the bad performance of the “Autorefractometer = off” condition for the central pillar. One would expect that if the pillar is rendered in a photorealistic manner, detection results would be identical to placing a picture at the position of the display. Upon further investigation, we concluded that the pillar rendered under the pinhole camera assumption did not appear realistic enough as it looked too sharp. This also indicates that a pinhole eye model is not suitable for rendering realistic objects for AR. In the future, we want to investigate the improvement of realism taking only pupil size into account.
Our results only partially supported hypothesis H2. This can be attributed to various factors, such as the disparity between the user’s focus and display depth, appearance of the pillars, low update rate of the autorefractometer, and update delay of the resulting CG displayed. These issues could also explain the observed learning effect. Participants were more likely to detect the difference between the real objects and their CG counterparts as they became used to experiments. The results of our experiment suggest that future OST-HMDs, especially HMDs that have a single focal plane, should incorporate the concept of EyeAR to increase the realism of the rendered CG. This may range from using a non-pinhole eye model to generating CG based on measurements of the eye focal length and pupil radius, as reported in this paper.
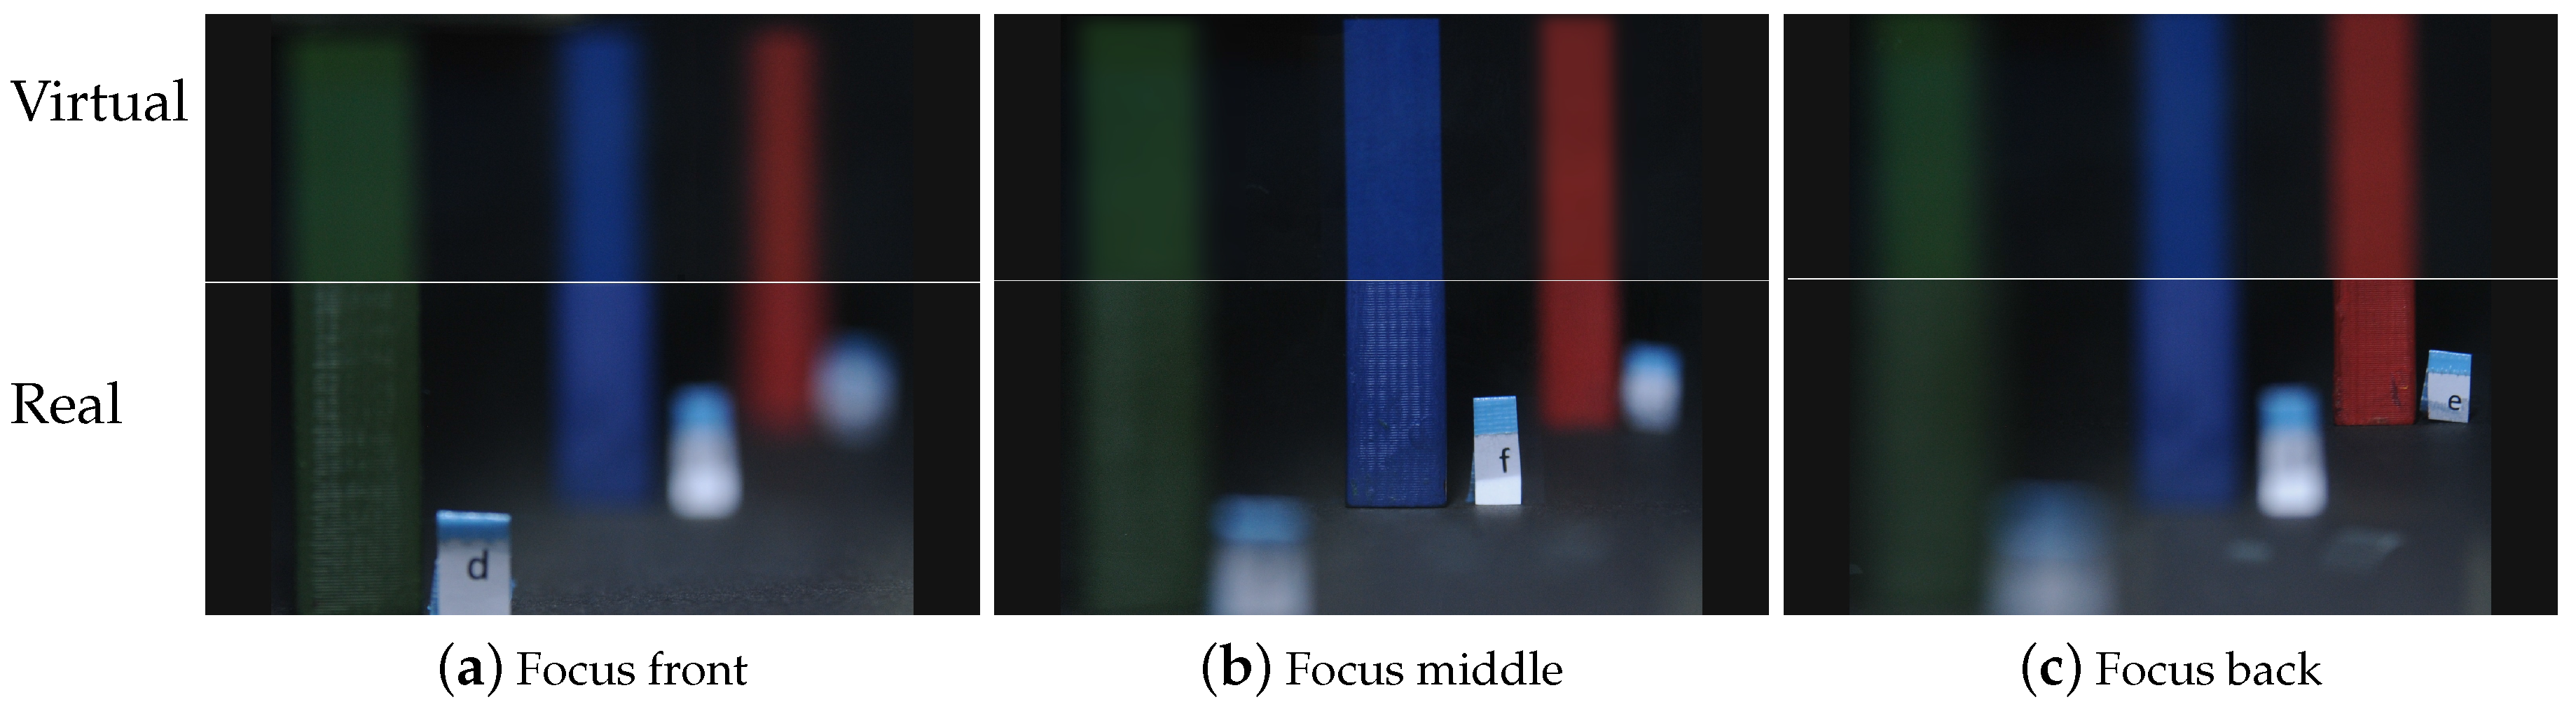
The most likely reason that
H2 was not supported for the front and back pillars is the depth disparity between the position of the virtual pillars and the display. As discussed in
Section 3.3, we did not correct the different depths of the participant’s focus and display image, which may have caused unnecessary blur when looking at the front or back pillars (see
Figure 7). Although the same condition applied to the central pillar, these effects are more prominent for the front and back pillars, which led to the higher detection rate. In the “Autorefractometer = on” condition, participants could not detect the blue pillar that coincided with the focal plane of the display and were less likely to detect the red pillar in the back than the green pillar in the front. We speculate that EyeAR can create realistic effects within a certain region around the actual focal depth of the display. In the future, it will be necessary to investigate how large this region is, if it is ratio or diopter-based, and at what point the benefits of rendering content with EyeAR are no longer detectable.
The higher detection rate could also be explained by the slight difference in the appearance of virtual pillars—the texture, environment illumination, refractive optics of the eye, and the sensitivity to different colors, among others. All affected the appearance of the virtual pillars. Although the design of our setup aimed to control the lighting conditions and we optimized the texture and appearance of the pillars to match that of their real counterparts, participants might have noticed slight differences in the color, hue, or texture of the pillars. This is also supported by the learning effects revealed by our analysis. Over the course of the experiment, participants might have become better at detecting the slight differences and cues that distinguished the pillars. We considered switching the pillars to counteract the learning effect and different sensitivity. However, this could have introduced other unintended effects. For example, artifacts introduced when optimizing the appearance of the various pillars could have influenced the results of the evaluation. Overall, our analysis did not reveal that the color of the pillar had a significant effect on the overall results (p = 0.1357). While the color might have contributed to easier detection of the front pillar, our results indicate that rendering the content based on the readings from the autorefractometer, or with the pinhole camera model of the eye had the strongest effect (p < 10). In future experiments, we plan to investigate what effects the pillar color had when content was rendered using the readings from the autorefractometer to adjust its appearance and if rendering content with a non-pinhole eye model can achieve similar results without adjusting the blur effects of CG content.
The slow update rate of the autorefractometer is another factor that could have impacted the results of our study. For one, when participants refocused between the pillars, it could take up to 0.2 s for the system to register this change. Combined with the interpolation that was added to reduce the detection of changes in the rendered content, it created sufficient delay for participants to become aware of it over the course of the experiment. This could also explain the observed learning effects. At the same time, H2 was supported for the central pillar. This suggests that the delay may not have been noticeable to the participants all the time, but potentially only when participants were observing large changes, e.g., refocusing from the front to back pillar.
Nonetheless, our results show that accounting for focus distance measurements improves the realism of the CG. We expect that faster autorefractometers and improvements to focus depth estimation from eye-gaze tracking cameras will enable focus updates at a speed that is not noticeable by participants. Our results highlight the need for such technology. At the same time, the current measurement speed is enough when participants change focus between objects that are far away and very close by, e.g., at hand’s reach. In that case, the maximum refocusing speed of the eye is less than 1.878 ± 0.625 diopter/s [
51], which is slower than the update rate of our system. Our analysis also revealed that the gender had a significant impact on the detection rate. Our goal was to evaluate how likely users were to detect content rendered with EyeAR compared to content rendered with a pinhole camera eye model. Therefore, we did not counterbalance the participants in terms of age and gender. This might be a reason for the significance we detected in gender and we will investigate how age and gender affects the results in future work.
6. Conclusions
There is a need for refocusable CG for OST AR in order to create realistic scenes where objects are placed at different depths. In this paper, we have presented the design of a display concept based on the user’s eye measurements as an alternative to light field displays. We implemented a tabletop prototype that emulates an OST-HMD setup that is capable of accurately matching the DoF of virtual objects to real objects. We then evaluated our prototype with a user study to verify our claims. Our results strongly support H1, which stated that our closed-loop system creates significantly more realistic renderings than a system that does not take into account the user’s eyes measurements. Our second hypothesis H2 was rejected for the pillars in the background and foreground. This is likely due to the reconstruction error in CG caused by the screen-object disparity. Other aspects that could have contributed to this are the slow update rate of the autorefractometer, color of the pillars, or unintended artifacts.
Referring back to our previously published taxonomy of AR displays [
3], EyeAR is an instance of a Personalized AR display, as opposed to the LFD approach, which is an instance of Surround AR. We are convinced that our approach is an interesting alternative to create realistic AR content. The main advantage is that EyeAR does not require complex optical systems and thus addresses many problems in existing refocusable concepts. On the other hand, EyeAR requires very accurate estimation of the user’s focus depth and, in the best situation, a display that can adjust its location so that the image plane of the OST-HMD always matches the user’s focus distance.
We have identified three main areas for future work: first, and most important, we need to improve the prototype to address the screen-object disparity. Second, we plan to integrate EyeAR into an OST-HMD by either miniaturizing, or replicating, the function of the autorefractometer, for example through use of eye tracking cameras as described in [
36,
37,
39]. Third, we will refine our methodology for conducting AR Turing Tests and carry out several more.
Our rendering algorithm assumes that the position of the display coincides with the position of the virtual object. This effectively restricts its applicable range, as it cannot correct large disparities between the screen and the focus distance. In the future, we want to evaluate the effective range where these disparities become noticeable. Additionally, we aim to investigate how EyeAR could be combined with free-focus OST-HMDs. We imagine that EyeAR could be applied in retinal displays, or with refocusable lenses designed to always present content shown on the OST-HMD in focus. Determining the applicable range of EyeAR could also lead to a combination of EyeAR with multi-focal and varifocal displays in order to reduce the optical complexity of the system.
Alternatively, EyeAR could be combined with SharpView for single focal-plane OST-HMDs. However, we still need to investigate how to build user-specific point-spread functions (PSFs), including 3D PSFs, and model the dynamic accommodation process. In order to achieve the required optical power, we are now considering programmable optical elements. This approach has been successfully demonstrated in the dual problem of increasing the DoF of projectors through coded apertures [
52] and fast focal sweep based on a shape-changing lens [
53].
In terms of portability, we aim to study how to reduce the size of our system to the point that it can be integrated into an HMD. We envision an EyeAR hardware module that can turn any legacy OST-HMD into a powerful display, perceptually equivalent to a LFD. Additionally, the update rate of our system (5 Hz) can be sufficient to refocus between distances several meters away from the eye, but can lead to noticeable latency when quickly refocusing between objects placed near the eye as in our tabletop setup, where the farthest object was 0.5 m away.
It is also part of our future work to improve the experimental design and standardize a methodology to carry out AR Turing Tests. In our experiment, we used three pillars with plain textures. We aim to study more complex scenes that include objects of different shapes, materials with different surface texture parameters, and models of light scattering. With increasingly complex scenes, experimental measurements could collect ordinal instead of binary answers from participants in order to provide more faceted results. We believe that CG rendered under the pinhole camera model appeared too sharp during our user study and were as a result easily detected. In the future, we plan to compare the realism of CG rendered with a non-pinhole camera model versus EyeAR.
Our evaluation also showed that gender played a significant role in the detection of the virtual objects. It is also part of our future plans to study in more detail how the biological and physiological differences affect the perception of EyeAR.

 and
and 

