1. Introduction
Science centres and museums present exhibitions, installations, and educational programmes that are designed to engage visitors for self-education on a subject and to inspire the visitors to learn more. For exhibitions to be engaging, the exhibit design process needs to take care of the needs of the visitor. We propose an iterative design process that integrates mandatory assessments of visitor engagement parameters into the design process using the
Engagement Profile, formerly denoted as the Visitor Engagement Installation (VEI) Profile [
1] and real-time visitor engagement studies [
1,
2].
An iterative design-process must include the museum practitioner, the designer, and the visitor. In today’s practice, the collaboration between these groups is not formalised—the museum practitioner is in many cases unable to mediate their expectations to the designer, the designer’s intention is not understood by the visitor, and the effect of the design on the visitor is not evaluated. Only a few of the available design methods include the points of view of all stakeholders, i.e., the curators, the designers, and the visitors. Further, visitor testing is often conducted late in the development process or as a post-opening activity. Including the visitor in the design process seems, in many cases, to be done in an unstructured fashion.
Our contribution is a novel methodology for visitor-centred assessment. Further, we present a study of an educational game where visitors in a science centre were asked which dimensions of the engagement profile they wanted to change. The analysis was performed using survey data and a graphical tool based on the engagement profile.
First, we present an overview of related work regarding design processes for installations in science centres and museums, evaluation tools, and visitor characteristics (
Section 2). Then, our design process for installations is presented including graphical visualisations (
Section 3). We show the viability of our approach (
Section 4) in a case study at Engineerium outside Oslo. Further, we discuss the findings of the design process itself and the findings for the installations (
Section 5), before presenting our conclusion (
Section 6).
2. Related Work
Exhibit design is the process of developing an exhibit from an early concept to a finalised installation. Although often used, the term exhibit design is, in most cases, implicitly defined. We have found a large research body of design approaches and design strategies but less on the process itself. Most approaches include exhibit evaluations and visitor studies at some point in the process, but these are not carried out systematically.
Roppola [
3] noted that exhibition design remains one of the last museum disciplines ’for which no specific professional training is required or even available’. She posited that theoretical and empirical museum studies have not reached their potential in making an impact on exhibition design. She suggested the concepts of framing, resonating, channelling, and broadening as moment-by-moment transactions for the visitors.
2.1. Exhibit Design Processes
Doering et al. [
4] presented a high-level description of the exhibition making process, covering exhibition statement, exhibition plans, overall organisation, roles, and project management. They discussed exhibition making models suitable for diverse types of museums and suggested five stages of the exhibit design process: (a) idea generation; (b) concept development; (c) design development; (d) production, fabrication, and installation; and (e) post-opening activities. Note that Doering et al. did not structure the single phases further nor did they emphasise the role of exhibit evaluations during exhibit design.
Bitgood [
5] presented seven exhibit design approaches that describe which intention is in the foreground when developing an exhibit. More relevant for our research, he divided the design strategies into qualitative and quantitative approaches, the latter are subdivided into the
visitor perception strategy (using the visitors’ perception and reaction as a design goal) and the
experimental strategy (using the intended visitor behaviour as a design goal).
Bitgood proposed three types of visitor measures of success: (a) behaviour measures including stopping (attracting power), viewing time (holding power), social impact, human factors impact, and trace or decay measures; (b) knowledge acquisition (memory, comprehension); and (c) affective measures (attitude change, interest level, satisfaction).
Skolnick et al. [
6] gave an overview of exhibit design related to large exhibitions and fairs in terms of history, elements, process, and the role of the audience. They described a process that is comprised of the following elements: (a) concept phase, (b) schematic design phase, (c) design development, (d) fabrication documents, (e) fabrication, and (f) installation. For audience involvement, they emphasise (a) front-end evaluations during the concept phase, (b) formative evaluations in the schematic design phase, (c) prototype evaluations, and (d) summative evaluations in the finished exhibition.
Several authors have presented exhibit design processes that include similar steps as described above, e.g., the work by Lin [
7]. These design processes are often controlled by managers, curators, designers, etc., and they fail to involve the visitor in the design process. In these approaches, evaluations are usually made at the very end of the design process.
Young [
8] has suggested that developers need to advocate for the visitors and think as a visitor; Young recommends a cyclical development process. She has presented the design approach suggested by McLean [
9] that comprises of five phases, namely, feasibility, preliminary design, detailed design, production planning, and production. Note that the post-opening activities are not included in this design model.
In disciplines like software development, agile development processes have appeared that are not bound to traditional development phases. Instead, they advocate for iterative processes where diverse development tasks are performed in short iterations. These iterations include specification, implementation, and testing as mandatory elements. So-called
test-driven development [
10] requires that all development is aligned alongside written tests that developed software is checked against.
Since exhibit design often involves the development and implementation of complex hardware installations, such agile processes cannot be implemented to their full extent. However, agile processes can be used in early steps of design and in the post-opening activities for incremental changes of exhibits.
User-centred design (UCD) [
11] is a framework of iterative processes where end users’ needs of a product, service, or process are addressed at each stage of the design process. It requires that designers analyse and foresee how users are likely to use a product. These assumptions are tested with users, thus involving the user into the design process.
2.2. Tools for Characterising Installations
A variety of methods are available for the evaluation of exhibits, including visitor observations (e.g., [
12]), video footage, and sensor-based methods (e.g., [
13]). For the sake of brevity, we refer to a review of evaluation methods in our previous work ([
1], Section II).
As a practical approach for exhibit evaluation, Spegel [
14] created
Expogon, a graphical tool used as a mind map for exhibit planners when going through a museum. It breaks down the exhibition medium into the six elements narrative, space, visitor, objects, time, and sender. Each element consists of fifteen hexagons representing categories, where ten are pre-filled and five empty for additional categories. The evaluator wanders through an exhibition and notes observations on the Expogon. It is a qualitative tool that gives hints to an evaluator on what to improve in an exhibition, but it does not reflect to what degree the six elements are fulfilled.
Schrandt [
15] presented a design approach that focuses on the physical characteristics of the exhibits and their impact on visitors. This research studies characteristics, such as layout, atmospherics, ambient conditions, usage of space and media, and social interaction.
The engagement profile [
1] was developed as a structured way of quantifying the characteristics in installations along eight dimensions, each dimension is given a value between zero and five according to the descriptions in a table. The dimensions of the engagement profile represent the degrees of
competition (C),
narrative elements (N),
interaction (I),
physical activity (P),
visitor (user) control (U),
social aspects (S),
achievement awareness (A), and
exploration possibilities (E). Note that the entries in the description table can be seen as a discretisation of a continuous scale between 0 and 5. Thus, in principle, values in-between these sample points could be used. However, for our purpose, we do not need a more fine-grained scale.
External influences are not taken into account in the engagement profile since these are not properties of the installation. Physical factors, such as noise, light or smell need to be handled separately. Further, properties that belong to the context, such as social factors, institutional factors, or recent incidents personally or globally, are excluded. However, these factors still need to be taken into account in the assessment process.
2.3. Characterising the Visitor
Most museums and science centres are targeted towards specific groups. Often, a segmentation based on the visitors’ situation is used in practice, identifying groups such as school classes, tourists, families, and weekend visitors.
Dierking and Falk [
16] presented the Interactive Experience Model, which is a visitor-centric model. They defined the interactive experience influenced by the personal context, the physical context, and the social context. Falk [
17] used the principle of identity-related motivation to place visitors into the five basic identity types: (1) the explorer; (2) the facilitator; (3) the professional and hobbyist; (4) the experience seeker; (5) the recharger; as well as the two extra identities (6) the respectful pilgrim, and (7) the affinity seeker. Variables, such as prior knowledge, experience, interest, visitor agenda, and social group are encapsulated in these identity types.
Note that the engagement for members of the
facilitator group is not primarily related to an installation but towards other visitors. Further, there are indications that the cardinality of the groups in this segmentation are uneven [
18].
Tomiuc [
19] has suggested to segment visitors into (a) the explorer; (b) the analyst; (c) the listener; (d) the creator; (e) the gamer; and (f) the socialiser. However, this segmentation is not further outlined by the authors.
Visitors could also be segmented by their learning style, expressed by the Experiential Learning Model by Kolb [
20]. This model has learning consisting of the components
concrete experience (CE),
active experimentation (AE),
reflective observation (RO), and
abstract conceptualisation (AC). His Learning Style Inventory (LSI) describes learning preferences on the axes AE—RO and AC—CE. This results in four learning styles, the converger (AE/AC), the accomodator (AE/CE), the assimilator (RO/AC), and the diverger (RO/CE). Recently, nine learning styles in the four dialectics of the learning cycle have been proposed [
21]. The learning style for an individual can be determined by answering a questionnaire of 48 questions.
Manolis et al. [
22] proposed the Reduced Learning Style Inventory (RLSI) with 17 items on a seven-point Likert scale. Note that the RLSI supports three factors, as RO and AE are expressed as one factor, denoted as AE.
3. A Design Process for Installations
The design of installations and exhibitions of a science centre or museum usually follows an iterative process. As outlined in
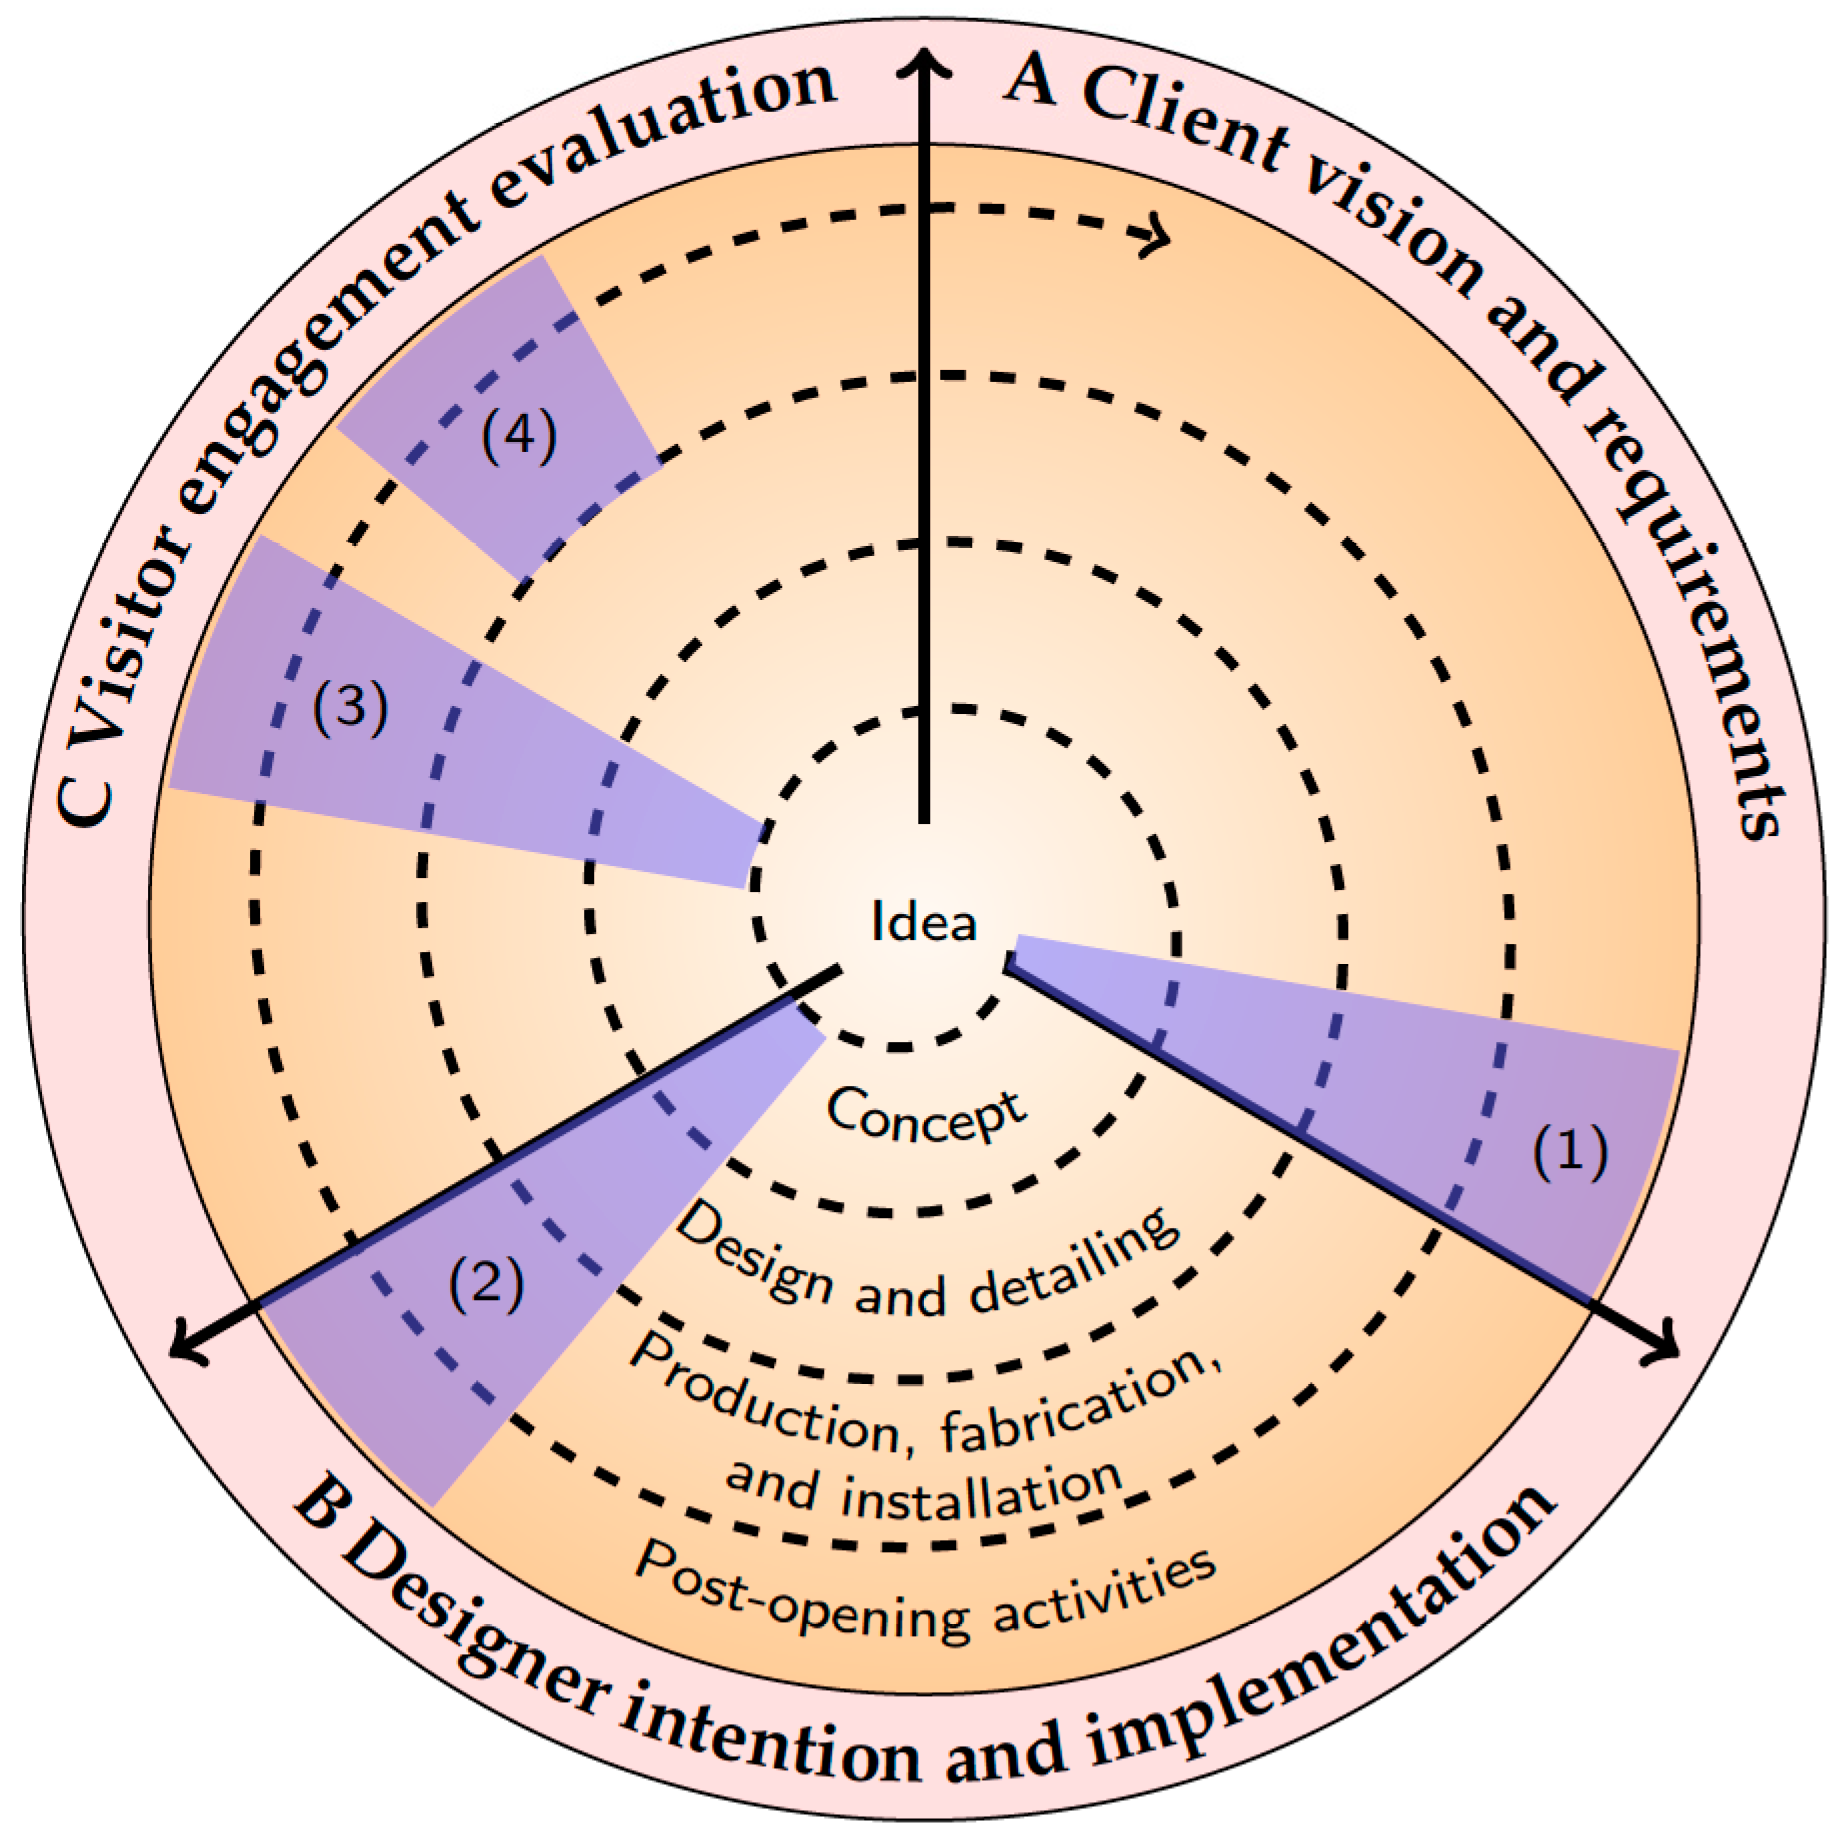
Section 2, the number of phases differs. We propose the following four phases: (1) concept, (2) design and detailing; (3) production, fabrication, and installation; and (4) post-opening activities. Each phase can be sub-divided into sub-phases, e.g., several iterations of one phase. Post-opening activities include a continuous process with regular and repeated evaluations of an exhibit.
Figure 1 shows the design process as a spiral instead of emphasising on the distinct phases.
3.1. Phases of the Design Process
Each of the four phases consists of three stages: (A) the client vision representing the functional and non-functional requirements set by the museum or science centre; (B) the designer intention representing the creative processes; and (C) the visitor experience, represented by a visitor-centric assessment and evaluation process.
In each of these stages, dedicated evaluation activities are performed, as indicated with the respective numbers in the blue areas in
Figure 1: (1) At the end of Stage A (client vision and requirements), the client vision (i.e., the value ranges of the engagement profile the curators assume best suited) is drawn into the design diagram, represented as the green areas in the example in
Figure 2. (2) At the end of Stage B (designer intention and implementation), the designer intention (i.e., an evaluation of the designed artefact) is added, represented as the fields with blue hatches. (3) In Stage C (visitor engagement evaluation), the visitor experience (i.e., the visitors’ opinion about the artefact) is added, represented as the orange lines. (4) In Stage C, a practical evaluation can be performed when this is viable, using sensors, surveys, and observations as presented by Leister et al. [
1].
In the evaluation activity (3), the concept, design, prototype, or finished installation is shown to a panel of visitors. The visitors are then asked to give their opinion on a five-point Likert-scale [
23] from
to +2 (in the experiment denoted with the values
). A Likert-type scale assumes that the strength of experience is linear, i.e., on a continuum from strongly disagree to strongly agree, and makes the assumption that attitudes can be measured [
24]. Note that the visitors are assumed not to know the current engagement profile values.
While the median value from such an analysis can be directly added to the values from the
designer intention giving the orange lines in the Engagement Design Diagram, we also suggest a more detailed visualisation of the visitor opinion in the Engagement Opinion Diagram as shown in s
Figure 3 and
Figure 4. These diagrams are results from our study presented in
Section 4.
Note that the data from the assessment could indicate a split opinion, i.e., substantial numbers of participants vote for both positive and negative changes. If this happens, there is no standard procedure on how to proceed—the museum and the designers need to discuss the design concept based on this assessment outcome and, possibly, consider the target group(s) for the installation.
In evaluation activity (4), a measure for engagement is derived from the assessed data and observations. Different designs from the current and previous evaluations can be set against each other, and the design candidate with the highest score on engagement can be identified.
3.2. Presentation of the Engagement Profile
The exhibit design process is supported by graphical tools. As a further development of the spider web diagram for the engagement profile introduced by Leister et al. [
1], we use a representation of coloured arcs and areas that are placed in the respective slice for each of the eight dimensions. The reason for changing the representation is related to the slope of the lines in the spider web diagram visualising information that is not present in the real installation [
25].
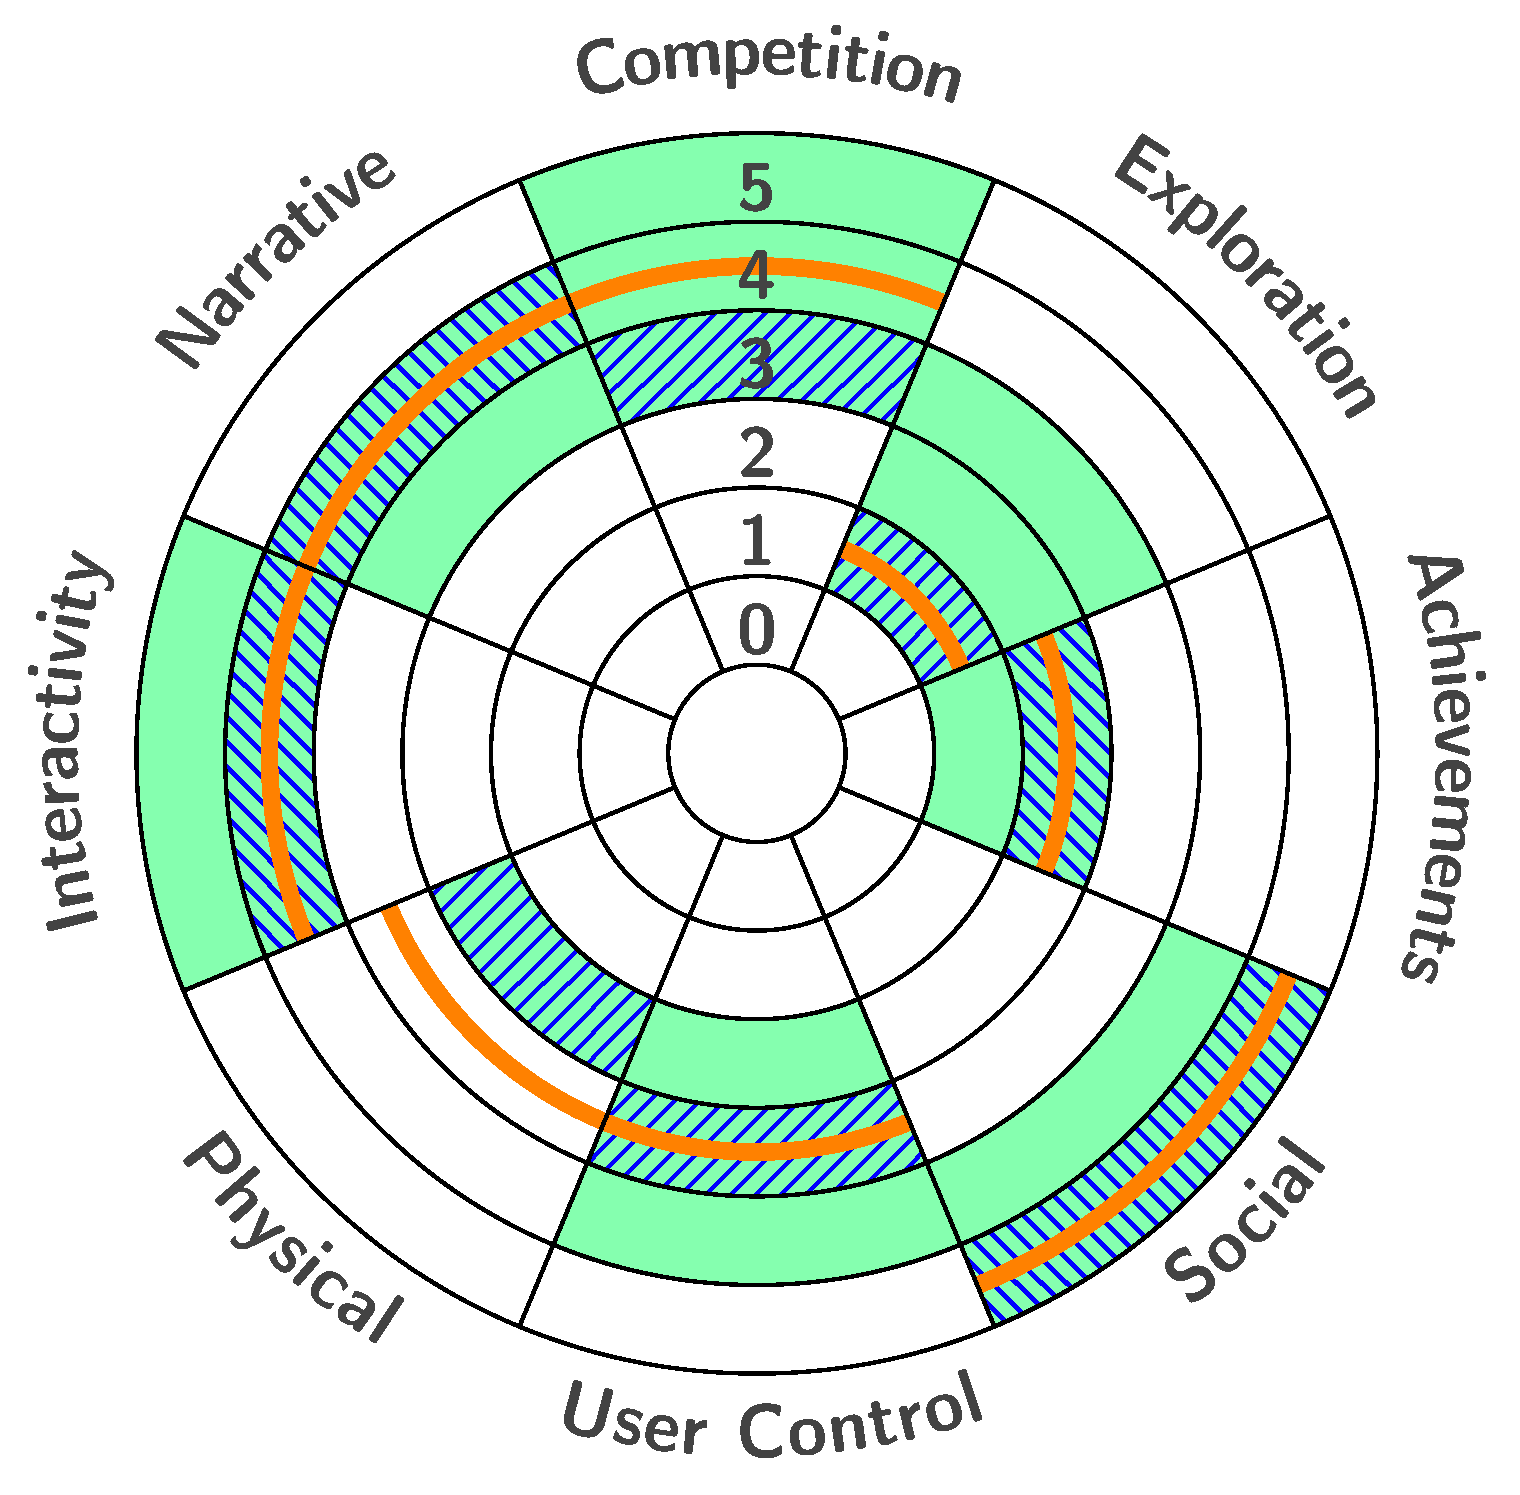
3.3. The Engagement Design Diagram
The engagement design diagram (see
Figure 2 for an example) shows the client vision as green areas, the designer intention as blue hatches, and the visitor experience as orange lines. If the designer intention is outside the client vision, this should trigger a reflection for the stakeholders. Likewise, if the visitor experience is considerably outside the designer intention, this could be an indication that the visitors expect changes to the design. Thus, the engagement design diagram serves as a basis for discussions and an indication for changes to be made to the design in the next iteration.
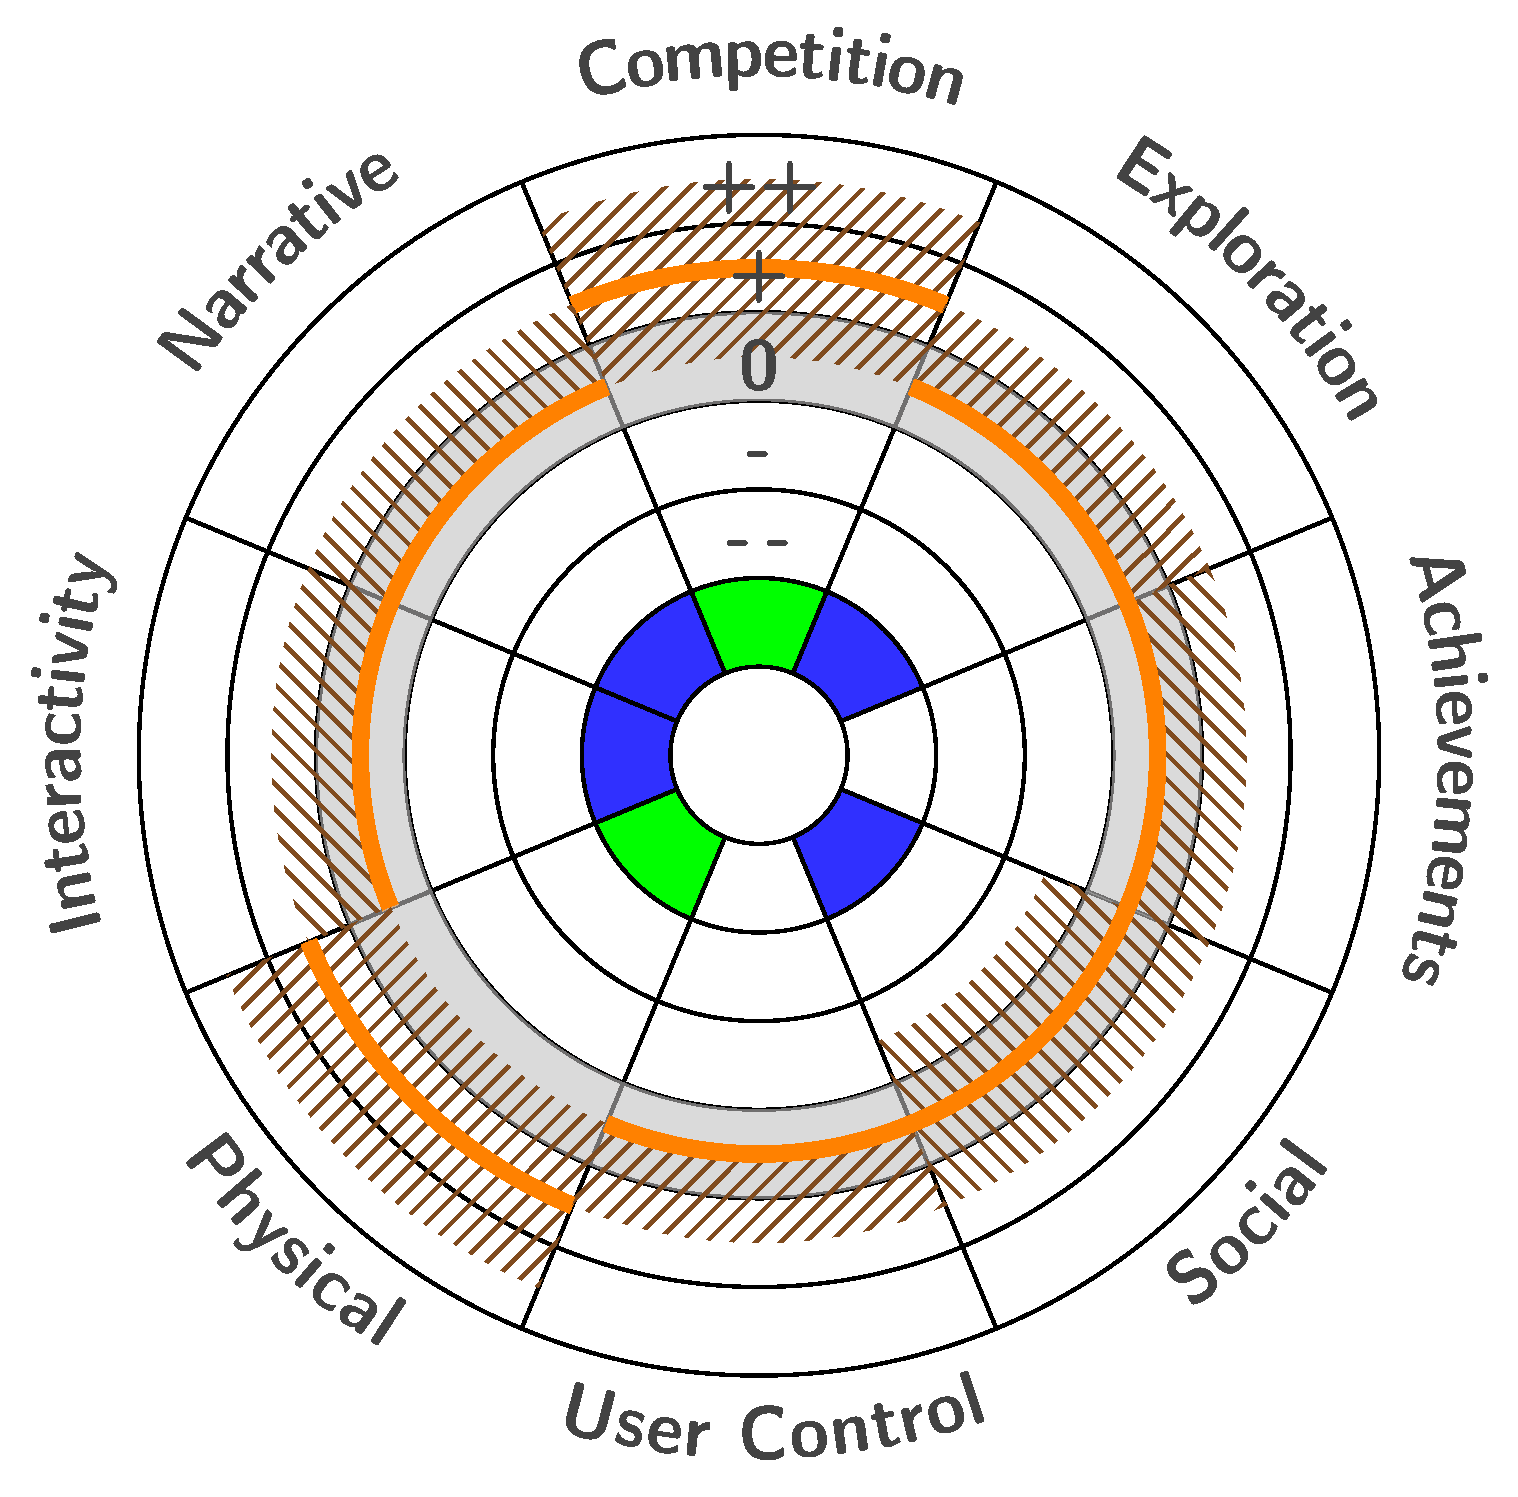
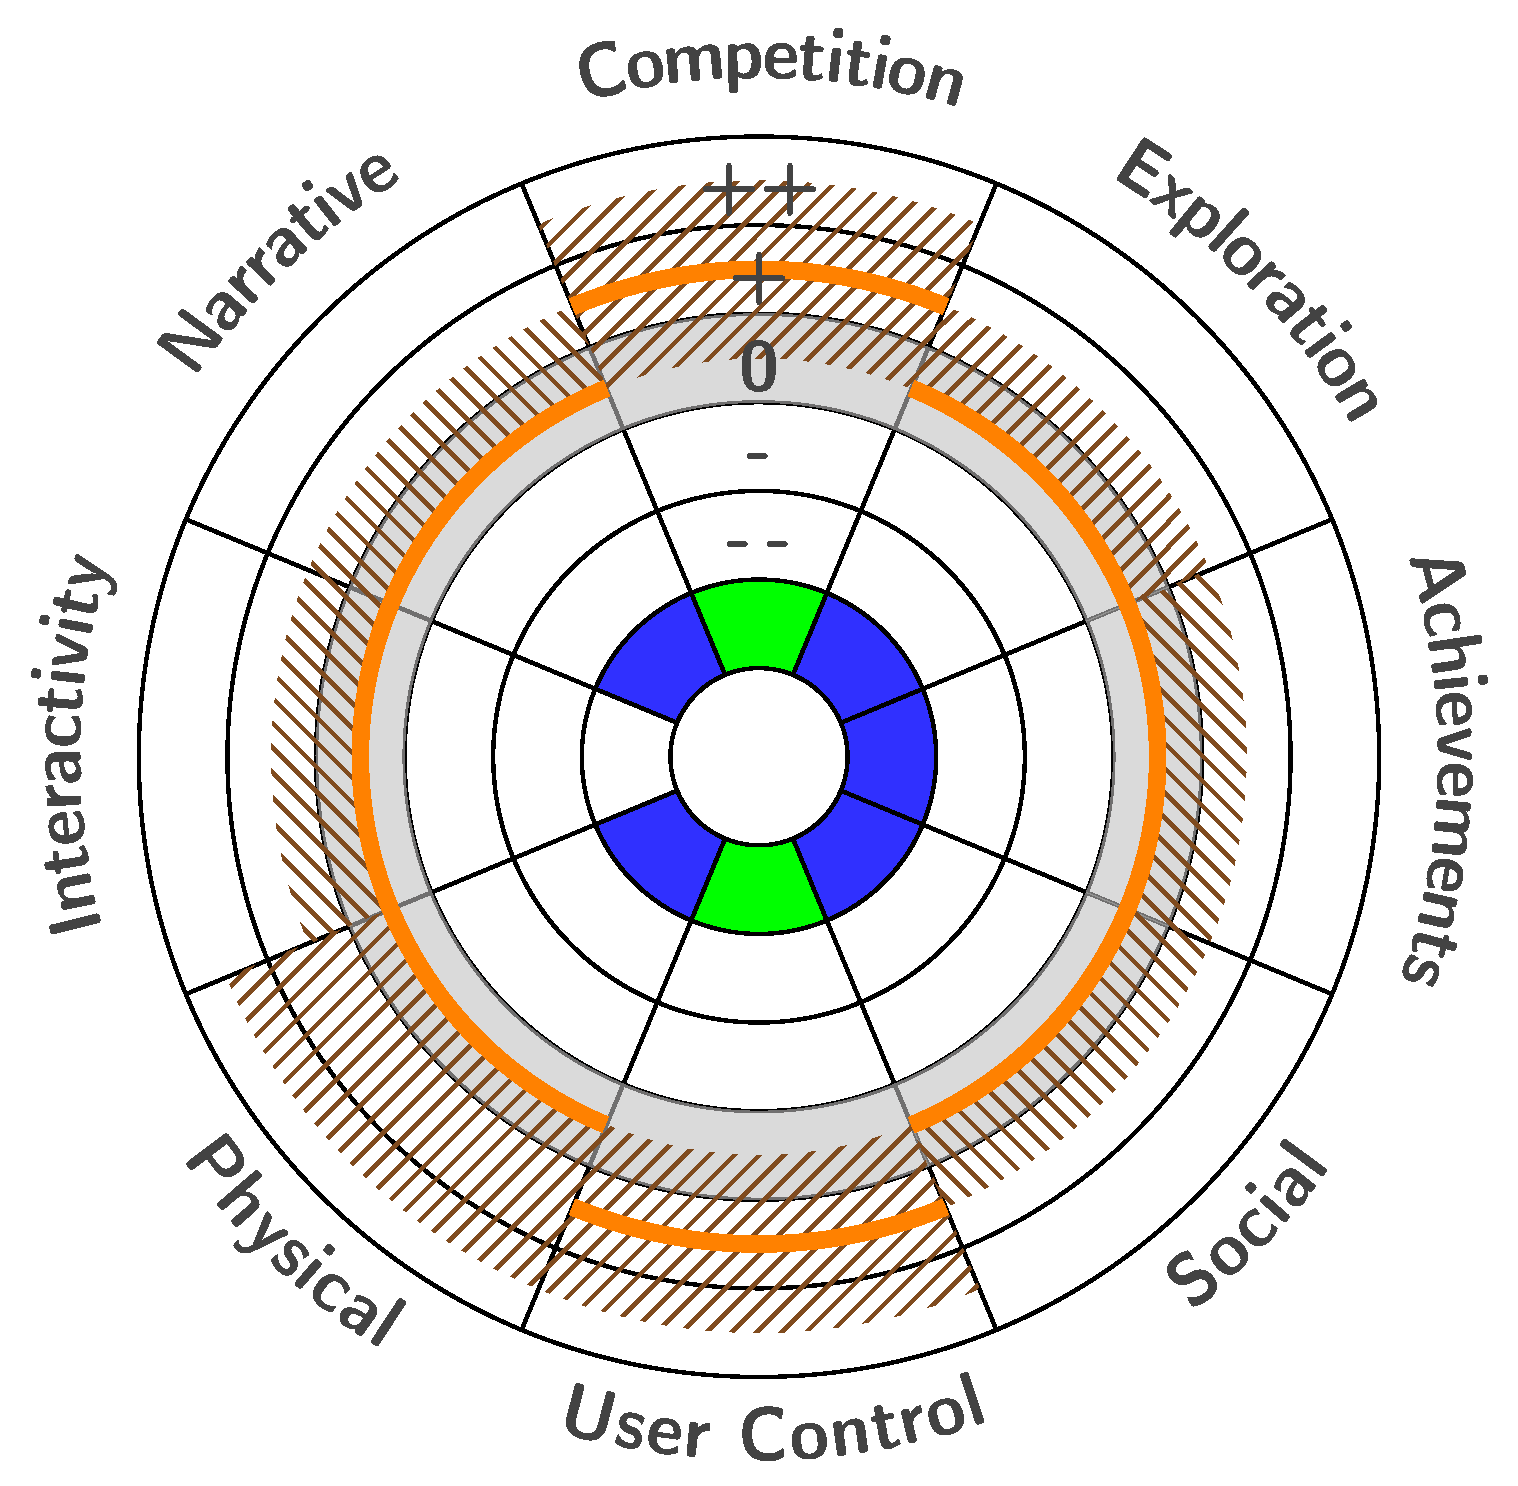
3.4. The Engagement Opinion Diagram
The engagement opinion diagram (see s
Figure 3 and
Figure 4 for examples) visualises the opinion of a group of visitors that are asked for each dimension whether they would prefer an installation with more or less points of each dimension. An orange line shows the median of the visitor responses while the shaded areas show the 10%-90% percentiles for the responses. The inner colours indicate whether the majority of the visitors wants to keep a dimension as it is (blue), an increase (green), or a decrease (red). If none of these three possibilities receives over 50%, the corresponding field remains white. A split opinion can be marked with grey.
4. Study Using Engineering Challenge
We tested elements of our proposed design process on installations at Engineerium, a science centre at Fornebu outside Oslo presenting installations about oil & gas, the art of engineering, technology, innovation, and energy. Engineerium presents the history of the Aker group of companies, at the moment mainly active in the oil and gas sector, and some of their ongoing projects, as well as interactive installations meant to illustrate how concepts from the science subjects are relevant for developing technology. As a part of this mission, they offer the interactive learning game Engineering Challenge for school groups from grades eight to 13, i.e., lower and upper secondary school.
4.1. Engineering Challenge
Engineering Challenge is a two-hour social learning game meant to increase the interest in and knowledge of science, engineering, and innovation among young people. The game is developed in accordance with the school curriculum. Through the game, the participants are exposed to how technology and science are used in the oil and gas industry, and they get to experience how an engineer works. It is a role-playing game with interactive tasks, played out individually and in groups.
Engineering Challenge works with five to 32 participants, divided into a maximum of four teams. In the game, these teams compete for a contract to design and engineer a technical solution for a new oil field. The participants are assigned roles. These roles include specific kinds of engineers with a set of responsibilities. Each player gets different information from, for example, phone calls, texts, e-mails, news articles, and video interviews. They work together and share this information in team meetings where the solution is developed. They need to choose the right equipment and use a 3D drawing-tool to present their solution. The players are quizzed on their understanding of the information they received during the game. For the main construction task in the game, there is no one correct solution.
The players rate the importance of factors like HSE (Health, Safety, and Environment), economy, consequences for local society, to develop innovative solutions, or to make use of tried and tested solutions. Thereafter, they synthesise their solutions accordingly. Towards the end of the game, the teams present their solutions to an audience of peers, and they vote on the winning solution. The game makes use of several of the installations in Engineerium’s exhibition. It is part of a pedagogical package, which may also include activities to be carried out at school before and after the visit at Engineerium.
4.2. Evaluating the Game
First, we evaluated the science centre vision and the designer intention, which are both shown in
Figure 2.
In a second step, we analysed the opinions of visitors recruited from high school classes: 494 students from lower secondary school and 142 students from upper secondary school. After the visit, the students were asked to answer two questionnaires: the questionnaire shown in
Table 1 indicates changes to the engagement profile, while the questionnaire shown in
Table 2 indicates how much the visitors liked the game and background questions on considering a career in engineering professions.
We excluded responses that were incomplete on the eight factors of the engagement profile. We did not remove outliers, although some of them seem obvious, such as answering −2 to all questions in
Table 1 (
in each of the groups). Note that answering 0 to these questions would make sense.
The results are shown in
Table 3 and
Table 4, respectively. We present the results graphically in the Engagement Opinion Diagrams in s
Figure 3 and
Figure 4.
The opinion diagram is based on median values, as is common for the analysis of opinions with discrete values. However, the mean value can still serve as an indicator of how strongly the visitors want a change, as long as there is no split opinion. As noted before, a split opinion needs to be handled separately. We did not observe this case in our data material.
The responses are generally on the positive side, in the sense that the students want more of each dimension. However, the median values indicate that most of the dimensions should remain as they are, with the exception of C and P, followed by U (see
Section 2.2 for the definitions of these dimensions). The upper secondary students want to increase the U dimension stronger than the lower secondary students.
The majority of the lower secondary school students want to keep the dimensions S, N, and E as they are. Note that S already is at the highest level and cannot be increased. The visitors give a clear message that they want more competition (C), more physical activity (P), and, to some extent, more user control (U).
The upper secondary students seem to be more critical towards the game, as can be seen in
Table 4. While most of the upper secondary students seem to like the game, they are not as inclined to recommending the game to other visitors.
As a last step, we add the median of the visitor opinion to the current values of the engagement profile. This is shown as the orange line in
Figure 2.
5. Discussion
Using the experiences from applying our novel design process to installations, we were able to show one iteration of this process. From this, we gained experiences about the design process as such, as well as valuable information about the installations used in our case studies.
5.1. Discussion of the Design Process
So far, we have evaluated one iteration of the design process only. As it is a method based on best practice, adjustments to the method and its tools have been applied and more will be needed. According to our experience, the engagement profile seems to be suitable for the evaluation of installations.
The tool set used in the design process, as well as the statistical methods used, do not give fine-grained results. Instead the tools are suited to give hints on what to adjust when further developing an installation. Currently, we assume that it is enough to interpret the rather coarse results that point out only a few characteristics that visitors want to change.
While we, currently, need a large number of visitors to create an Opinion Diagram, we anticipate that we can use a panel with fewer participants in the future.
As we see in the results from the questionnaires, the answers are on the positive side; this might have psychological reasons. For instance, it might be easier to consider elements that one would like more of than elements that one would like less of. However, it is too early to conclude whether and how this fact needs to be taken into account.
5.2. Discussion of Results from Engineering Challenge
In our study, the science centre vision and the designer intention were drawn post-opening, as was the evaluation step with visitors. Thus, the study can be used to get an indication of changes to the game that could increase engagement. The evaluation of the game gave the following indications, based on the fact that the game is mainly intended for students in lower secondary school: (a) The visitors want a stronger competition element than currently offered. Increasing the competition element during the game could be challenging since this could interfere with the current way of voting for the best presentation. However, including an additional step with a quiz, e.g., Kahoot [
26], could increase the competition factor. (b) The visitors want more physical activity during the game than both science centre vision and designer intention suggested. (c) The visitors want more user control, i.e., make decisions that have an influence on the course of the game. This is most evident for visitors from upper secondary schools, but these are not in the main target group and may find the game is not enough of a challenge for them.
As major changes to the game and the installations used during the game could be costly for Engineerium, the suggested changes need to be carefully considered, as the budget allows larger changes only if the learning goals change, e.g., as a consequence of changes in the curriculum. The analysis shows that the game receives good feedback from the participants. Adjustments like introducing an additional quiz to the learning game seem suitable to increase the competition element.
The study also shows that more than 50% of the visitors in the target groups say that they get a better or much better impression of being an engineer as a profession. This indicates that an important goal for the science centre is fulfilled.
5.3. Discussion of Significance
We have indications that the visitor opinion is dependent on both the installation (or game) and the target group. Further studies with different engagement profile characteristics will be necessary to get further evidence of this.
As a further note, the evaluation of the visitor opinion shows that the average of all eight dimensions is on the positive side with a value of about 0.4. We need to investigate whether this is specific to the installation or is more an indicator for the engagement of the visitors. As a measure to avoid this bias to the positive side, we considered that the sum of the positive opinions should be forced to be close to 0. However, as we did not observe negative effects of this bias, we decided against this measure.
6. Conclusions
We have presented a novel, iterative design process for installations in science centres and museums that supports the involvement of visitors. As the goal of this design process is to increase visitor engagement, we use the engagement profile with its eight characteristics as the foundation for supporting design decisions. Curators and designers use the engagement design diagram as a tool during the design process. Assessments among visitors with standardised questionnaires collect the visitors’ opinions about an exhibit, which results in an engagement opinion diagram as further input into the design process. Together, these tools allow curators and designers to take informed, future design decisions.
The tools used in the design process can give indications about what to change in an exhibit. The design process can also be informed by measurements of engagement, as proposed in our earlier work [
1].
While previous design processes for museums and science centres are mostly based on qualitative measures, except for the counting of visitors, our design process uses quantitative measures and standardised questionnaires. So far, curators and designers embrace the method and find it intuitive in use.
The study performed at Engineerium shows promising results. This study has produced value for Engineerium in their work on improving the game and in communicating to the teachers the benefits of taking the students to play the game at the science centre.
We are about to implement graphical tools using the design diagram and the opinion diagram on an app to support the design process interactively. Further, tools to assess the visitor opinion with electronic questionnaires and analysis tools are under development.
So far, we have applied our method to one design iteration of existing exhibits. Our goal is to accompany the design process of exhibits from the start to the opening and beyond. Further, we intend to extend the application area of our concept to entire exhibitions or parts of them. We will develop methods to relate the engagement profile of the exhibition concept to the engagement profiles of single exhibits. We also envisage that we can transfer our method to other application areas, such as education, cultural events, and tourism. These application areas are similar in that engagement is the key to the success of experiences. However, as the domains are different, we need to study how to adapt the definitions in the table entries that define the engagement profile.
Acknowledgments
The work presented here has been carried out in the project VisitorEngagement funded by the Research Council of Norway in the BIA programme, grant number 228737. The authors thank Trenton Schulz for comments on earlier versions of the manuscript.
Author Contributions
W.L., I.T., G.J., M.d.B., and S.R. conceived and designed the concept and the experiments; M.d.B. and G.J. prepared the installations for the experiments; I.T. and S.R. performed the experiments; I.T. and W.L. analysed the data; W.L. and S.L. developed the graphical tool for the experience profile; W.L. and I.T. wrote the paper.
Conflicts of Interest
The experiments were performed at Engineerium where one of the authors (S.R.) is employed. The installations used in the experiments were developed by Expology where three of the authors (G.J., M.d.B., and S.L.) are employed. Beyond these facts, the authors declare no conflict of interest.
Abbreviations
The following abbreviations are used in this manuscript:
| VEI profile | Visitor Engagement Installation profile |
References
- Leister, W.; Tjøstheim, I.; Joryd, G.; Schulz, T.; Larssen, A.; de Brisis, M. Assessing Visitor Engagement in Science Centres and Museums. J. Adv. Life Sci. 2016, 8, 49–63. [Google Scholar]
- Tjøstheim, I.; Leister, W.; Larssen, A.; Schulz, T. The Role of Emotion and Enjoyment for QoE—A Case Study of a Science Centre Installation. In Proceedings of the 2015 7th International Workshop on Quality of Multimedia Experience (QoMEX), Pilos, Greece, 26–29 May 2015; pp. 1–6. [Google Scholar]
- Roppola, T. Designing for the Museum Visitor Experience; Routledge: New York, NY, USA, 2012. [Google Scholar]
- Doering, Z.D.; Watriss, W.; Pekarik, A.; DiGiacomo, K.; Kaufmann, C.; Neves, C. The Making of Exhibitions: Purpose, Structure, Roles and Process; White Paper; Smithsonian Institution, Office of Policy and Analysis: Washington, DC, USA, 2002. [Google Scholar]
- Bitgood, S. Designing Effective Exhibits: Criteria for Success, Exhibit Design Approaches, and Research Strategies. Visit. Behav. 1994, 9, 4–15. [Google Scholar]
- Skolnick, L.H.; Marwit, D.; Secor, J.A. Exhibition Design. In Encyclopedia of Library and Information Sciences, 3rd ed.; CRC Press: Boca Raton, FL, USA, 2009; pp. 1797–1807. [Google Scholar]
- Lin, C.H. Mapping the Design Criterion Framework for Museum Exhibition Design Project; Design Research Society Conference 2008; Sheffield Hallam University: Sheffield, UK, 2008; undisciplined. [Google Scholar]
- Young, D.L. A Phenomenological Investigation of Science Center Exhibition Developers’ Expertise Development. Ph.D. Thesis, The University of North Carolina, Chapel Hill, NC, USA, 2012. [Google Scholar]
- McLean, K. Planning for People in Museum Exhibitions; Association of Science-Technology Centers: Washington, DC, USA, 1993. [Google Scholar]
- Fraser, S.; Beck, K.; Caputo, B.; Mackinnon, T.; Newkirk, J.; Poole, C. Test Driven Development (TDD). In Proceedings of the 4th Intnational Conference on Extreme Programming and Agile Processes in Software Engineering; Springer-Verlag: Berlin/Heidelberg, Germany, 2003; pp. 459–462. [Google Scholar]
- International Standard (ISO). ISO 9241-210:2010. Ergonomics of Human-System Interaction—Part 210: Human-Centred Design for Interactive Systems; International Organization for Standardization: Geneva, Switzerland, 2010. [Google Scholar]
- Pierroux, P.; Steier, R. Making it Real: Transforming a University and Museum Research Collaboration into a Design Product. In Design as Scholarship in the Learning Sciences; Svihla, V., Reeve, R., Eds.; Routledge: London, UK, 2016; pp. 115–126. [Google Scholar]
- Yoshimura, Y.; Sobolevsky, S.; Ratti, C.; Girardin, F.; Carrascal, J.P.; Blat, J.; Sinatra, R. An analysis of visitors’ behavior in The Louvre Museum: A study using Bluetooth data. Environ. Plan. B 2014. [Google Scholar] [CrossRef]
- Spegel, D. Expogon. 2014. Available online: www.expogon.org (accessed on 27 September 2017).
- Schrandt, B. Designing Experiencescapes. In Proceedings of the ECSITE Annual Conference, Porto, Portugal, 15–17 June 2017. [Google Scholar]
- Dierking, L.D.; Falk, J.H. Redefining the museum experience: the interactive experience model. Visit. Stud. 1992, 4, 173–176. [Google Scholar]
- Falk, J. Viewing the Museum Experience through an Identity Lens. In Visiting the Visitor: An Enquiry Into the Visitor Business in Museums; Davis, A., Smeds, K., Eds.; transcript Verlag: Bielefeld, Germany, 2016; pp. 71–88. [Google Scholar]
- Falk, J.; Storksdieck, M. Using the contextual model of learning to understand visitor learning from a science center exhibition. Sci. Educ. 2005, 89, 744–778. [Google Scholar] [CrossRef]
- Tomiuc, A. Navigating Culture. Enhancing Visitor Museum Experience through Mobile Technologies. From Smartphone to Google Glass. J. Media Res. 2014, 7, 33. [Google Scholar]
- Kolb, D.A. Experiential Learning as the Science of Learning and Development; Prentice Hall: Englewood Cliffs, NJ, USA, 1984. [Google Scholar]
- Kolb, D.A.; Kolb, A.Y. The Kolb Learning Style Inventory 4.0: Guide to Theory, Psychometrics, Research & Applications; Experience Based Learning Systems: 2013. Available online: https://learningfromexperience.com/research-library/the-kolb-learning-style-inventory-4-0/ (accessed on 27 September 2017).
- Manolis, C.; Burns, D.J.; Assudani, R.; Chinta, R. Assessing experiential learning styles: A methodological reconstruction and validation of the Kolb Learning Style Inventory. Learn. Individ. Differ. 2013, 23, 44–52. [Google Scholar] [CrossRef]
- Likert, R. A technique for the measurement of attitudes. Arch. Psychol. 1932, 22, 1–55. [Google Scholar]
- McLeod, S.A. Likert Scale. Simply Psychology. 2008. Available online: http://www.simplypsychology.org/likert-scale.html (accessed on 27 September 2017).
- Leister, W.; Aursand, P.; Tjøstheim, I.; Lauritzsen, S.; Joryd, G. The Graphical Expression of the Visitor Engagement Installation (VEI) Profile Revisited. Norsigd Info 2017, 1, 9–10. Available online: http://www.norsigd.no/norsigd_info/nsi-1-17.pdf (accessed on 27 September 2017).
- Wang, A.I. The wear out effect of a game-based student response system. Comput. Educ. 2015, 82, 217–227. [Google Scholar] [CrossRef]
© 2017 by the authors. Licensee MDPI, Basel, Switzerland. This article is an open access article distributed under the terms and conditions of the Creative Commons Attribution (CC BY) license (http://creativecommons.org/licenses/by/4.0/).

 ,
, 
