Eye Gaze Controlled Projected Display in Automotive and Military Aviation Environments


Indian Institute of Science, Bangalore 560012, India
*
Author to whom correspondence should be addressed.
Multimodal Technol. Interact. 2018, 2(1), 1; https://doi.org/10.3390/mti2010001
Submission received: 20 December 2017
/
Revised: 13 January 2018
/
Accepted: 13 January 2018
/
Published: 17 January 2018
Abstract
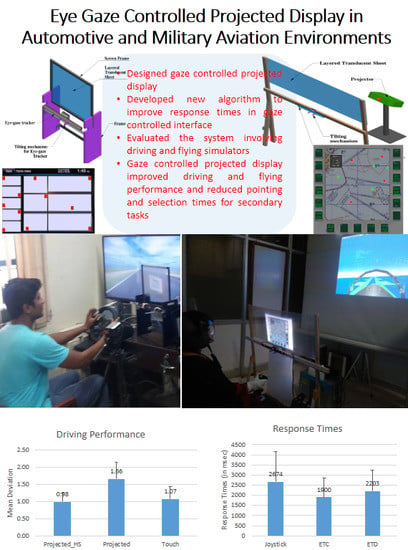
:This paper presents an eye gaze controlled projected display that can be used in aviation and automotive environment as a head up display. We have presented details of the hardware and software used in developing the display and an algorithm to improve performance of point and selection tasks in eye gaze controlled graphical user interface. The algorithm does not require changing layout of an interface; it rather puts a set of hotspots on clickable targets using a Simulated Annealing algorithm. Four user studies involving driving and flight simulators have found that the proposed projected display can improve driving and flying performance and significantly reduce pointing and selection times for secondary mission control tasks compared to existing interaction systems.
1. Introduction
Modern infotainment systems in automobiles facilitate driving by adding secondary tasks to the primary task of driving. These secondary tasks have considerable chance to distract a driver from his primary driving task, thereby reducing safety or increasing cognitive workload. Similarly, pilots of military aircrafts (both fast jets and transport ones) need to undertake a plethora of secondary mission control tasks in addition to primary flying tasks and in certain situations, like on a ground attack routine, the mission control secondary tasks become more crucial than the auto-pilot enabled flying task. Thus, easing out human machine interaction (HMI) between operators and electronic user interfaces in automotive and aviation environments can potentially raise safety and help to leverage the true potential of those systems.
This paper proposes a new interactive system that projects existing head-down displays on a semi-transparent sheet in front of the windscreen of the operator (driver in automotive environment and pilot in aviation environment). The projected screen allows interaction in the form of pointing and selection just like traditional graphical user interfaces, however tracking operators’ eye gaze or finger movements. The resulting system aims to reduce the number of times operators need to take their eyes off from their primary task of driving or flying and they can interact with the projected display simply by looking at it or through moving their index finger.
We have developed a couple of projected gaze controlled displays for driving and flying simulators and conducted four user studies to evaluate their performance in dual-task situations with respect to existing modalities of interaction. In all our user studies, participants undertook a standard driving or flying task and simultaneously undertook pointing and selection tasks in a secondary display. Our results show that the projected gaze controlled system can significantly improve pointing and selection times in an aviation environment compared to the existing joystick controller and improve driving performance compared to touchscreen display.
The main contributions of the paper are:
- Integrating and evaluating eye gaze controlled interaction for projected display;
- Proposing an algorithm to facilitate interaction with gaze controlled interface;
- Evaluating gaze controlled interface for automotive and military aviation environments and comparing their performance with existing interaction techniques.
The paper is organized as follows. The next section presents a detailed literature survey on eye gaze controlled interface and their applications in automotive and aviation domains. Section 3 presents the gaze controlled projected display followed by four user studies to evaluate the system in automotive and aviation environments. Section 5 presents general discussion and clarifies data analysis and deployment issues followed by conclusions in Section 6.
2. Related Work
2.1. Eye Gaze Tracking
Recent advancement in infra-red based eye gaze trackers has significantly increased research and industrial use of gaze tracking technology. Eye tracking is the process of measuring either the point of gaze (where one is looking) or the motion of an eye relative to the head. An eye tracker is a device for measuring eye positions and eye movement. Research on eye tracking dated back to late 18th century when Louis Émile Javal investigated saccadic movements in a reading task. Edmund Huey pioneered in building the first eye tracker in 1908, which was a contact lens connected with an Aluminium pointer [1].
Existing research on developing eye trackers investigates reducing cost as well as increasing accuracy. Most commercially available eye gaze trackers use infra-red cameras to track the eye gaze of users. However, accurately tracking eye gaze in different ambient light is a challenging problem. The most commonly used technique is pupil centre and corneal reflection technique [2]. The eye gaze tracker has inbuilt Infrared LED (Light Emitting Diode) that illuminates the eye and infrared-sensitive video takes rapid pictures of eye. The LED reflects a small amount of light off the cornea and through the pupil onto the retina. The bright pupil allows the image processor to locate centre of pupil. The eye gaze tracker can then locate where the person is looking on the screen based on the relative positions of the pupil centre and corneal reflection within the video image of the eye. A simple calibration procedure that requires users to follow (means staring at) a shape around screen or a designated position in space tunes parameters for each individual user with respect to a two-dimensional screen or three-dimensional space. However, there also exist eye gaze trackers that utilise cameras in visible spectrum like webcam or high speed video cameras although those systems are either less accurate (for webcam) or costlier (for high speed video cameras) than infrared trackers.
2.2. Gaze Controlled Interface
Eye gaze trackers are mainly used for analysing ocular parameters for reading and a variety of HMI tasks. With progress in processor speed and image processing algorithms, it has also become possible to use the gaze tracking technology in real time to control a screen pointer in a direct manipulation interface. In a two-dimensional screen, visual search consists of saccadic and small pursuit eye gaze movements. The saccadic movement takes 250 to 350 ms to complete including the latency involved with unexpected stimulus and ballistic in nature. However, the small pursuit movements keep the eye gaze moving around the point of interest. If we move a pointer directly following eye gaze, the small pursuit movements create jitters and it becomes difficult to select a target if the pointer is not stable. The available accuracy of the best eye-gaze tracker is 0.4° of the visual angle as of July 2017. Vendors of eye trackers usually publish details on the testing procedure [3] and the accuracy is part of the technical specification of an eye gaze tracker. This accuracy translates to approximately 18 pixels to a standard desktop screen from 65 cm of viewing distance. Thus, a gaze control interface may occasionally need a user to focus a little bit off target to bring the cursor on a screen element. Overall, it is not difficult to move a screen pointer based on eye gaze but focusing the screen pointer on a screen element remains a challenge in gaze controlled interface. Existing gaze controlled software solves this issue by designing a special interface with big screen elements to compensate variation and limitation in accuracy. However, any interaction system should not limit interface design and should work for existing interface without limiting the size of screen elements. Existing patents on eye gaze tracking mainly concerned about developing eye gaze tracking hardware [4] and using it to plot users’ gaze location in a two-dimensional screen [5]. There are a set of patents that proposes to modify part of the display based on eye gaze of users [6,7] or modifying rendering of a web browser [8]. Farrell [7] proposed expanding targets and proportionally contracting other parts of display based on eye gaze track of users although their system used a separate pointing device for cursor control instead of eye gaze.
Zhai [9] pioneered the MAGIC system, which aimed to use eye gaze track directly to improve pointing, in particular homing on a target using mouse. Ashdown and colleagues [10] addressed the issue of head movement while tracking eye-gaze in a multiple monitor scenario. They used head tracking to switch pointers across screens, which was preferred by participants, but in effect increased pointing time. Dostal and colleagues [11] addressed similar issues by detecting which monitor the user is looking at through analyzing webcam video. The Sideways system [12] even eliminates personalized calibration and can scroll contents of a display screen by detecting eye gaze. The system identifies whether users are looking at the middle or sides of a display and if they are looking to the sides, the system scrolls content at the middle. Both Dostal’s system and the Sideways system do not use precise x- and y-coordinates to a move a mouse pointer. Fu and Huang [13] proposed an input system hMouse, which moves a pointer based on head movement. They detected head movement by analyzing video input and their system is found to outperform another similar system called CameraMouse [14]. Fejtova’s [15,16] Magic Key system also uses a webcam like CameraMouse, but the pointer is moved on a screen based on position of nose (nosetrills to be precise). Selection is done by eye blinks. Bates’ [17] multimodal eye tracking system allows for zooming in on a portion of screen using a polhemus tracker. Zandera and colleagues [18] combine a BCI system with eye gaze tracking, where EEG generated by imagining a rinsing action is trained to make a selection. However, their system had limited success in reducing pointing times. Penkar [19,20] and colleagues investigated different dwell time durations for selecting targets for an eye gaze controlled interface, although their study involved only selecting targets in the middle of the screen. Later, they extended the study [21] for selecting hyperlinks in a webpage, but dwell time based selection would be inappropriate in automotive environment, as it requires operators staring away from the road for selecting targets. Pfeuffer and Voelker explored fusing touchscreen interaction with gaze controlled system by using eye gaze for object selection and touch interaction for object manipulation. Pfeuffer [22] explored desktop computing tasks like image searching and map navigation while Voelker [23] investigated multi-screen display, which is more advanced in terms of coordinate mapping between horizontal and vertical displays compared to Dostal’s [11] system. However, our proposed work uses eye gaze for not only object selection but also for cursor movement.
Gaze controlled interfaces have already been investigated and used for automotive and aviation environments as discussed below.
2.3. Aviation Environment
In the aviation environment, Electronic Flight Instrument Systems or ‘glass cockpits’ were introduced to declutter the cockpit by reducing the number of individual display instruments by compiling flight data into an integrated, easily understood picture of the aircraft. Furthermore, using soft keys (configurable buttons), the pilot can configure the displays to show different types of information on the same multi-function display (MFD), further reducing the space requirements for physical instruments [24,25]. The multi-functionality of a single display provided an unprecedented amount of flexibility to both cockpit display designers and pilots, and was a timely solution of the need for pilots to exhibit short-term flexibility while maintaining long-term adaptability [26]. A good example of the benefits of the MFD is the evolution of the F-15 cockpit. The F-15A variant, operational in 1975, housed electromechanical instruments, two cathode ray tube (CRT) displays and a multi-function Head-Up Display (HUD). By the mid-1980s, the F-15E variant possessed half the number of dedicated instruments, a HUD, and three fully multi-function CRT displays [27]. This permitted the pilot to arrange data required for each mission in the most convenient position in the cockpit. The other significant benefit from glass cockpits has been to obviate the role of the flight engineer by allowing the pilot and co-pilot to monitor and interact with the aircraft’s systems themselves via the displays. However, one of the biggest challenges in the glass cockpit is to comprehensively understand and successfully interact with flight systems through the MFDs. Many limitations in pilot–cockpit interaction were recognized at least three decades ago by the United States Air Force, which idealised solving all of these problems in one ‘Super Cockpit’ [28]; a generic crew station that would conform to operators’ natural perceptual, cognitive, and motor capabilities. Thomas [29] listed all input and output modalities used in a few modern fighter aircrafts that include physical buttons, target designation system (a joystick attached to throttle), direct voice input and touch screens for data input and head-mounted, head down and head up displays for output [30].
There is not much reported work in aviation domain about comparing modalities for secondary mission control tasks. Thomas [31] reported results from an ISO 9241 task involving thumbstick, trackball, touchpad and touchscreen and found the trackpad to be the most accurate and argued for supporting new modalities for the HOTAS Cursor Control Device (CCD). Biswas [32] reported significant reduction in reaction time for gaze controlled interface compared to HOTAS TDS for operating a simulated MFD, but their study did not involve any primary flying task and was configured in a desktop computing environment.
2.4. Automotive Environment
In an automotive environment, existing infotainment systems use electronic screens or head up displays as output modalities, while input is taken through touchscreen, physical buttons and voice recognition technologies. To facilitate human–machine interaction, researchers have already explored use of haptic feedback [33,34], hand gesture tracking based input [35], personalizing instrument displays and predictive models to help drivers in regular driving tasks like parking [36,37].
Kern and Poitschke [38] reported user studies involving simulated driving tasks while comparing eye gaze controlled interface with a traditional touchscreen system. Unless a particular interaction is familiar to the driver (like reaching for the gearbox while driving), he has to glance at the user interface [39]. An accurate gaze tracking can leverage this glance for pointing. Researchers attempted to eliminate or reduce visual search using gesture recognition techniques, but the systems either require remembering a set of gestures (AirGesture System [40]) or relative positions of screen items (BullsEye system [41]). Additionally, such systems worked inferiorly to a touchscreen system in terms of driving performance or secondary task.
Gaze controlled interfaces were already patented for automotive environment. For example, Mondragon and colleagues [42] presented an eye gaze controlled smart display for passengers of vehicles. Users may point and select icons on the display by staring at an appropriate portion of the screen. However, our proposed system is intended to be used by drivers and selection of target has to be faster than dwelling or staring away from road [43]. Seder and colleagues [44] presented a graphic projection display for drivers showing objects on the road ahead. Users can select objects on the projection display using different input modalities including eye gaze. However, the patent does not address a method of improving accuracy of the gaze tracking itself, and it does not intend to operate the dashboard as the proposed system. Poitschke’s [45] study compared gaze controlled dashboard with touchscreen and reported higher reaction time for gaze controlled dashboard. They did not propose any intelligent algorithm to reduce pointing and selection times for gaze controlled interface.
However, it is interesting to note that no system can completely exclude visual displays and visual feedback [46]. The visual search pattern is also reported to be distinctive for different drivers [47]. This paper has explored the possibility to leverage the visual search and eye gaze fixations as a mean of controlling electronic displays inside a car or an aircraft.
3. Gaze Controlled Projected Display
3.1. Existing Problem
In the Automotive Environment, drivers need to take their eyes off the road and physically touch the dashboard to undertake secondary tasks. Nowadays, drivers often put their iPad or smartphone on top of the dashboard to avoid looking down, but the device itself occludes part of the windscreen. Direct voice Input (DVI) systems, even with limited vocabulary, it is often not useful for different language speakers and in noisy environments [48].
In the Aviation Environment, military aircraft already use head up and head mounted displays to show primary flight information and neighboring flying objects. However, pilots need to use a small joystick on the throttle to operate the head up or head mounted displays. A direct manipulation interface shall be more useful than the traditional joystick. Touchscreen and physical buttons are often difficult to operate with gloves.
Existing research on comparing eye gaze controlled interfaces with other modalities is mainly limited to desktop computing, and, except for a few cases involving novice users [49], generally traditional input devices like mouse or touchscreen worked better than gaze controlled systems [45,50]. Researchers already explored different target predictions or intent recognition techniques for reducing pointing times. Most of these techniques continuously record velocity, acceleration, and bearing of cursor movement, fit different models and use that model to predict either the cursor movement or the target itself [43,51,52]. However, eye gaze movements are not as smooth as mouse or finger or hand movement, rather they follow a ‘spotlight’ metaphor and, so far, not any next point or target prediction models are tested for gaze controlled interface. A backpropagation neural network model was used in [32], but only to differentiate between ballistic and homing movements. Gaze tracking is used for zooming or accentuating part of display to help pointing by another pointing modality [6,9,22].
3.2. Proposed Solution
The proposed system projects the dashboard or primary flight displays on the windscreen, so that operators do not lose a view of the road or sky ahead even when they are interacting with it. It may be noted that, to operate any graphical user interface, operators need to look at the interface and the proposed system leverages the gaze of the operator to directly control the interface using an eye gaze tracker. The system is also integrated to a finger tracking device as an alternative to gaze control, so that the interface can also be controlled by small finger movement. The overall system will alleviate the need to look down and physically touch a display.
The system can be described through the following two parts:
- The hardware part consists of designing a semi-transparent sheet and its holder. Off-the-shelf computers, projectors, eye gaze and finger movement trackers were used.
- The software part consists of designing and implementing algorithms to control an on-screen pointer using eye gaze and finger movement trackers to operate the projected display.
3.3. Hardware
The hardware part of the projected display consisted of a semi-transparent sheet and a stand to hold it in front of the operator (pilot or driver) with minimal occlusion of the situation in front. A support structure was developed in order to keep the thin plastic screen upright along with a support for the eye gaze tracker. The projected display system also required its distance from projector and angle of the eye tracker adjustable for individual operators. We developed two different set ups for automotive and aviation environments. The setup consisted of the following three components, viz., Screen, Tilting mechanism and Frame.
The Screen consisted (Figure 1) of layers of semi-transparent Polyethylene sheets. In automotive setup, these sheets were fixed to a rigid plastic frame on all four sides. The thickness of the plastic frame was more than the plastic screen (~8 mm). In order to keep it upright, the screen was fixed into two slots present on a support structure made in a wooden frame. In aviation setup, the screen was fixed directly to the frame. The screen size of the aviation setup was wider than the automotive setup so that multiple MFDs (Multi-Function Displays) could be rendered.
A tilting mechanism (Figure 2) was developed to support the eye tracker and also to adjust the angle of the eye tracker. It consisted of a magnetic holder, pivot, base and threaded block. The base component held the other components in place. The magnetic holder was attached to the base component with a pivot. The threaded block was attached to the base. The screw in the threaded block allowed for varying the angle of magnetic holder with respect to the base. The eye tracker was magnetically fastened to the magnetic holder (Figure 3).
The frame for automotive setup (Figure 4) consisted of two wooden blocks held in position with two metal support sheets. The setup was placed above the dashboard of the automobile. The screen was mounted in the slots of the frame. The eye tracker along with the tilting mechanism was placed on the metal support sheet. The frame for the aviation setup consisted of five wooden bars nailed together as shown below. Due to space constraints of a cockpit, a rear projection was planned for the aviation set up, which also mimicked an existing head-up display. To avoid reflection by the projected display on main display, the frame was tilted by approximately 5° to project the reflection from the projected display away from the main display as shown in Figure 5.
The overall structure of the projected display system is shown in Figure 6.
3.4. Software
Even though state-of-the-art eye gaze trackers have 0.4° visual angle of accuracy, but, while people operate a car or even a driving simulator, they change their posture and head position reducing the accuracy of the eye gaze tracker. As a result, even though operators fixate attention to a button, the system often activates a neighbouring button requiring users to adjust the offset. The offset is random and different for different people in different situations and difficult to be fixed by simple translation operation. In the following section, we have presented two solutions to increase the accuracy of the gaze controlled interface as follows:
- We integrated a finger movement tracker as an alternative modality that can move a pointer on screen following finger movement.
- We proposed to use a set of hotspots to leverage the pop-out effect of visual attention to reduce probabilities of wrong solutions for a gaze controlled interface.
In the following sub-sections, we have described these solutions in detail.
3.4.1. Multimodal Software
This multimodal software was selected based on prior research on gaze controlled interface and different multimodal fusion strategies [53]. We used a Leap Motion controller for tracking finger and a Tobii X3 [54] tracker to track eye gaze. The Leap Motion controller is used to make corrective movements when the eye gaze tracker alone could not bring the pointer on target. If the user puts his hand on the Leap Motion sensor, the pointer stops moving based on eye gaze. When the user removed his hand from the top of the Leap Motion sensor, the pointer resumed moving based on the eye gaze of user. While either eye gaze or finger movement can be used for pointing (which means moving a pointer on the projected display), any push button on the steering wheel or throttle can be used for selection. We used the following set of equations to take an orthogonal projection of a three-dimensional finger position measured using a Leap Motion controller on a two-dimensional screen:
The constants a, b, c, d, w and h were calculated based on the relative screen position with respect to the Leap Motion sensor. Figure 7 below further illustrates the system. A real-time recording from the gaze tracker for a standard visual search task can be found at https://youtu.be/pN0lpxCiRAY. The proposed system records eye gaze positions continuously and takes the median of the pixel locations in every 300 ms to estimate the region of interest or saccadic focus points. The median was less susceptible to outliers than arithmetic mean in case the eye gaze tracker briefly lost signal. If finger movement is simultaneously found with eye gaze signal, the system gives precedence to the finger movement signal. A pointer is drawn at the screen based on either eye gaze or finger location. The pointer works as feedback to the user in case the sensor could not track accurately and the user can make corrective eye gaze or finger movement to select the target. The target prediction system [32] highlights the nearest target to the eye gaze or finger position and a hardware switch push can be used to select the target even if the pointer is not exactly on the target button itself.
3.4.2. Hotspots
In user studies involving gaze controlled interface, we noted that as users stare at the middle of the target, due to the inaccuracy of the tracker or their head movement, the neighbouring button was occasionally selected. This probability of wrong selection increases if the buttons are closely spaced in the interface. Hence, the probability of wrong selection will be reduced if we can increase the inter-button spacing. However, we cannot change the design of an interface just to make a particular interaction technique work better.
We have explored the option of introducing hotspots inside each button to facilitate eye gaze tracking interaction. If we can introduce a hotspot on each button and keep them well separated, we can instruct users such that the first saccade on a button would launch on these hotspots. We hypothesize that keeping these hotspots well separated may reduce chances of wrong selection. The hotspots will not change the size of any screen element or the interface, rather aim to leverage the ‘pop-out’ effect of parallel visual search [55]. Hence, they will not require larger length of saccades compared to the same interface without hotspots.
To find the best position of hotspots, we have represented an interface as a graph where each node corresponds to a target button (clickable objects) and neighbouring buttons are connected by an edge. For example, the interface in Figure 8 corresponds to the following graph.
We assumed each button has a hotspot on it, which is initially located at the centre of the button. The weight of each edge is equal to the Euclidian distance between the hotspots of two neighboring buttons. We explored two different algorithms to increase the distances between hotspots. We have defined the following cost function and tried to minimize it.
Cost Function = , where is the distance of the hotspots between buttons i and j and is equal to the weight of the edge between nodes i and j.
We have modelled the problem of finding optimum locations of hotspots as a state space search problem. Each state corresponds to a particular organization of hotspots. A state transition occurs when any hotspot changes its position. If we consider that each button has k possible positions and if an interface has n buttons, then an exhaustive search algorithm needs to evaluate kn states. Even for a moderately complex interface, an exhaustive search algorithm will be computationally intensive or almost impossible. Hence, we used the following two algorithms.
Greedy Algorithm: This algorithm picks up the edge with minimum weight, which means the two most closely spaced buttons. It checks the degrees of the two nodes of the minimum-weight edge and updates the hotspot of the node with higher degree. The algorithm calculates the centroid of the hotspots of neighboring nodes of the selected node and the new hotspot is calculated as the nearest point on the selected button (or node) to the centroid. While selecting the next node for updating the hotspot, the algorithm checks whether the node is visited earlier and, if so, it selects a different node. The algorithm is greedy in the sense that it only updates the hotspot if the overall value of the cost function is reduced from the previous value.
Simulated Annealing: This algorithm randomly selects a node and also randomly selects a point on the node as its new hotspot. If the new hotspot reduces the value of the cost function, then it is selected and updated. However, even if the new hotspot increases the value of the cost function, it may still be selected based on the following condition:
> A random number between 0 and 1.
In the above equation, the value of T runs from 5000 to 1 and reduced by 1 in each iteration.
Both algorithms were run for 5000 iterations and Figure 9 below plots the values of the cost function for the minimum value of the cost function obtained in the algorithms. In this figure, ‘Original’ stands for the initial state of the algorithm when all the hotspots were in the middle of each button.
We also plotted the sum of the weight of edges of the graph for the minimum value of the cost function for each algorithm in Figure 10 below.
It may be noted that both algorithms reduced the cost function and increased the overall weight of edges. The Simulated Annealing (SA) algorithm reduced the cost function further than the greedy algorithm. The greedy algorithm was stuck in cycle and a local optimum after visiting all nodes a couple of times. The SA algorithm never stuck in the local optimum due to randomly choosing node and hotspots, although we also could not conclude whether it reached the global optimum. It may be noted that the weights of edge in the final state of SA are significantly lower (p < 0.01) from the initial state in a paired t-test. Figure 11 below shows final positions of hotspots on the buttons as red dots.
We have also tested the algorithm on a representative multi-function display (MFD) from military aviation domain and tested the algorithms multiple times with different initial positions of the hotspots. The simulated annealing algorithm outperformed the greedy algorithm each time. Figure 12 shows an example of a set of hotspots on a sample MFD, and the blue dots on the buttons are obtained through the Simulated Annealing algorithm discussed above.
The hotspot drawing algorithm can be extended to any interface that has clickable items big enough to house a hotspot. However, hotspots will not work if clickable items are small and closely packed like a virtual keyboard.
4. User Study
The contributions of this paper are:
- Proposing an eye gaze controlled projected display,
- Developing an algorithm to improve pointing performance in gaze controlled display.
We hypothesized that introducing hotspots will reduce the number of incorrect selections than without using hotspots for gaze controlled displays and will also reduce pointing and selection times compared to existing pointing methods. We also hypothesized that driving and flying performances will be improved if users need not look down to operate the instrument panel. We undertook four user studies as follows, and the pilot studies investigated each of the contributions separately while the confirmatory studies combined two contributions and evaluated them with respect to existing modalities of interaction.
Pilot Studies
- The first study evaluated the utility of hotspots for eye gaze controlled interface in automotive environment. This study evaluated hotspot on a computer screen and did not use projected screen.
- The second study evaluated the projected display with respect to a HOTAS (Hands-On-Throttle-And-Stick [56]) joystick, which is the standard interaction device in military aviation environment for ISO 9241 pointing task.
Confirmatory Studies
Once we get promising results for both hotspots and projected screens, we combined them and evaluated them with respect to standard interaction devices for automotive and military aviation environments:
- The third user study evaluated the projected gaze controlled system with and without hotspots with respect to a touch screen display for automotive environment.
- The last study undertook trials in a sample multi-function display rendered on the gaze controlled projected display and compared its performance with respect to the HOTAS joystick.
In the following paragraphs, we presented the user studies in details.
4.1. Pilot Studies
We hypothesized that introducing hotspots will reduce the number of wrong selection and will also reduce pointing and selection times. In the following paragraphs, we presented a user study to compare a touchscreen system and eye gaze controlled systems with and without hotspots:
Study 1—Hotspots with gaze controlled screen in automotive environment
The following study aims to evaluate utility of hotspots for gaze controlled display. This particular study did not use projected display and compared performances between touchscreen and gaze controlled screen displays.
Participants: We collected data from nine participants (seven male, two female, average age 29.4 years). All participants used to drive cars and had no problems to use the experimental set up.
Material: We used a Tobii X3 eye gaze tracker and Lenovo Yoga Laptop for the secondary task. A Logitech G4 driving wheel and associated pedals were used for the primary driving task. We used the ISO 26022 lane changing task to measure participants driving performance and it was run on a 40” MicroMax TV screen.
Design: In this dual task study, participants undertook ISO 26022 lane changing task as their primary task. In this task, participants needed to drive along a 3-lane motorway. At a regular interval, drivers were shown a sign and instructed to change lane. The destination lane was randomly chosen and the driving path is automatically logged.
The secondary task involved pointing and clicking on a screen. We used the following three modalities for pointing:
- Eye gaze tracking with hotspots,
- Eye gaze tracking without hotspots,
- Touching.
We have used an existing dashboard display from a Jaguar Land Rover (Figure 11). We used the same dimensions of the buttons as the original display but removed all button captions. During the study, one of the buttons of the display was randomly selected as target and a caption ‘Target’ appeared on that button. The primary and secondary tasks were linked through an auditory cue. While driving, participants were instructed to point and select the designated target on the secondary screen after hearing an auditory cue. The auditory cue was set to appear between a 5 and 7 s interval. The auditory cue was kept on repeating during the whole duration of driving.
Procedure: Initially, we explained the aim of the study to participants. They were first trained with the gaze controlled interface and allowed to use the driving simulator to undertake a test run. After training, they undertook trials in different conditions in random order. Participants were instructed to drive realistically without veering off from the driving lane. While using the gaze controlled interface with hotspots, participants were instructed to focus on the hotspot of the designated target while no such instructions was given in other two conditions. After each condition, participants filled up the NASA TLX and SUS questionnaire. The order of modalities was randomized.
Results: We have measured the following dependent variables
- Driving performance is measured as
- Mean deviation from designated lane calculated according to Annex E of ISO 26022 standard.
- Average speed of driving, in particular we investigated if the new modality significantly affected driving speed.
- Standard Deviation of Steering Angle, a large standard deviation means drivers made sharp turns for changing lanes.
- Pointing and Clicking performance is measured as
- Error in secondary task as the number of wrong buttons selected. It is reported as a percent of the total number of button selections.
- Response time as the time difference between the auditory cue and the time instant of the selection of the target button. This time duration adds up time to react to auditory cue, switch from primary to secondary task and the pointing and selection time in the secondary task.
- Cognitive load measured as the NASA Task Load Index (TLX) score.
- Subjective preference as measured as the System Usability Score (SUS).
For each dependent variable, we initially compared the descriptive statistics and then undertook parametric or non-parametric statistical hypothesis test. If an ANOVA or H-test found a significant difference, we also used t-test or U-test for pairwise comparisons.
Before undertaking the trial in dual task conditions, participants used the driving simulator for undertaking the primary driving task only. The driving path of this single task situation was used as a baseline for evaluating deterioration in driving performance for the secondary task. Following the description of ISO 26022 Annex E, a reference path trajectory with a constant lane change start position and lane change length was calculated, which has a maximum correlation with the base line driving path. For example, in Figure 13 below, the green line showing the reference path while the red line is the driving path in a dual task situation.
We compared the arithmetic mean of the deviation from the reference path as a metric of driving performance. In all figures below, the bar represents average while the error bar signifies standard deviation. It may be noted from Figure 14 below that the mean deviation was lowest for touchscreen based selection while highest for eye gaze tracking based selection. Using hotspots resulted in 22% reduction of deviation from reference path than without using a hotspot in eye gaze controlled system.
The average speed of driving was the highest for eye gaze controlled interface while lowest for a hotspot equipped gaze controlled system is showing in Figure 15. However, the difference between highest to lowest average speed was less than 4 km/h and the differences were not statistically significant.
The standard deviation of steering angle was the highest for touchscreen system and lowest for hotspot equipped gaze controlled system is showing in Figure 16. It may indicate that drivers drove slower and more cautiously for hotspot equipped gaze controlled system compared to other systems.
We hypothesized that using hotspots will reduce probability of incorrect selections in gaze controlled interface and with hotspots; indeed, the average number of incorrect selections was reduced by 10.24% in gaze controlled interface. There were nine incorrect selections for touchscreen, 21 for eye gaze tracking without hotspot and nine for eye gaze tracking with hotspots. The average number of wrong selection was the lowest and equal for both touchscreen and hotspot equipped gaze controlled interface.
Average response time was lowest for the touchscreen system and highest for the eye gaze controlled system is showing in Figure 17. Hotspots decreased the average response times marginally (3%) than without using it in a gaze controlled interface.
The TLX scores, showing in Figure 18 were highest for the hotspot equipped gaze controlled system and lowest for the touchscreen. A one-way ANOVA among the different components of TLX scores for the hotspot equipped gaze controlled system found a statistically significant difference (F(5,48) = 3.15, p < 0.05) with the highest score for temporal demand (mean 55.44, stdev 11.93) followed by mental demand (mean 45.56, stdev 20.29) and effort (mean 42.67, stdev 18.38).
The SUS scores, showing in Figure 19 were greater than 68 for all cases and highest for the hotspot equipped gaze controlled system, which means all systems that were usable with hotspot equipped gaze controlled interfaces were most preferred by users.
We did not find any significant differences among the different conditions for any dependent variable.
Discussion: This study demonstrated that hotspots reduced the number of wrong selections by more than 50% and also marginally reduced the response time for the eye gaze controlled interface. Users found the system easy to use and preferred to use the system frequently although at an expense of high cognitive load, in particular the temporal demand. The touchscreen system was still the fastest to use and the driving performance was also best for the touchscreen system than eye gaze controlled systems even though hotspots improved driving performance in the gaze controlled interface.
One problem with the gaze controlled interface is that it still needs drivers to take their eyes off from the road even if the average duration of response times was 2.6 s. The next section presents a modification of the gaze controlled system that does not require drivers to take their eyes off the road but allow them to operate the dashboard using eye gaze.
Study 2—ISO pointing task with projected display in aviation environment
The previous study shows that hotspots can reduce wrong selections and response times for gaze controlled screen displays. The following study evaluated the projected display for a standard pointing task in military aviation environment.
Participants: Participants with prior gaming experience were recruited from our university and they volunteered for the study. They were trained with the flight simulator, among which nine participants were selected for this study based on their performance in maintaining altitude and direction in the flight simulator. All participants were male with an average age of 28.
Apparatus and Materials: The experimental setup consisted of primary and secondary projection displays. The flight simulator was projected on to primary projection display, while the secondary task was projected on to the secondary projection display described above.
Third-party flight simulator “YSFlight” with data logging feature was used for this study. The flight simulator was configured with Thrustmaster Warthog Hands On Throttle And Stick (HOTAS). The usefulness and suitability of this flight simulator with respect to this study was verified with senior pilots with ranks ranging from Air Marshall to Wing Commander operating fast jets for the national air force. A F-18E Super Hornet aircraft was chosen for the study as it was the default set up for the simulator and used for all participants. A custom map was created with guidelines to assist participants in maintaining a straight flight.
The secondary projection display is positioned in a line of sight with the primary projection display. Table 1 below furnishes the dimensions and resolutions of two displays.
Both the flight simulator and the secondary pointing task was run on an Intel® Pentium® CPU G3220@3Ghz computer running Windows 7 operating system with 4GB RAM and NVidia GeForce 210 graphics card. Tobii X3 eye gaze tracker was used for eye gaze tracking.
Design: We conducted a dual task study with
- The primary task consisted of Take-off manoeuvre followed by Straight and Level manoeuvre without trim control. Participants were instructed to level the flight at altitude between 1000 ft and 2000 ft after taking off.
- A pointing and selection task complying with ISO 9241-9 standard was developed as the secondary task with the following target sizes and distances as described in Table 2.
- The flow of the secondary task is listed below:
- An auditory cue (beep sound) was played to the participant. This mimicked the situation in which the pilot feels the need to look into the MFD for getting some information.
- The participant shifted his head and gaze to the MFD, in search for the cursor. For this task, the cursor was always placed in the center of the screen on a red-button (Figure 20). The eye tracker was used to determine if the pilot gazed at the button. The time taken by the participant to shift his head and gaze to the cursor on the MFD upon hearing that the auditory cue was measured and logged.
- Upon activation of the red button, fourteen buttons were displayed in a circular fashion around the center of the screen, of which one button was colored odd in white referred to as the target, and the rest were colored in blue referred to as distractors (Figure 21).
- The participant recognized the target from distractor, and manipulated the cursor using the provided input modality (TDS or eye gaze) to reach the target and then selected the target, using the Slew Button on the HOTAS. The time taken from the activation of the red button to the selection of the target button was measured and logged as the pointing and selection time.
- The participant then shifted his gaze back to the flight simulator to continue with the primary task.
Steps (i) to (v) were repeated with different target size and its position from the centre. The task was designed in such a way that an equal number of samples was logged for each Index of difficulty.
Procedure: Initially, participants were given a practice session in the flight simulator and secondary task. Then, participants initiated the primary flying task. After the participant completed the take-off maneuver of the primary task, the secondary task was initiated. After completion of the secondary task, the primary task was halted. Feedback for the given modality with respect to the pointing and selection task was collected in the form of a NASA Task Load Index (TLX Score) and System Usability Scale (SUS Score). The same procedure was repeated for the remaining modalities. The order of modalities was randomized.
Results: We have measured the following dependent variables:
- Flying Performance was measured by
- Deviation from the straight line flying path,
- Deviation in altitude outside the specified envelope of 1000 and 2000 feet,
- Total distance flown,
- Pointing and Clicking performance is measured as
- Error in secondary task as the number of wrong buttons selected. It is reported as a percent of the total number of button selections,
- Response time as the time difference between the auditory cue and the time instant of the selection of the target button. This time duration adds up time to react to auditory cue, switch from primary to secondary task and the pointing and selection time in the secondary task,
- Cognitive load measured as the NASA Task Load Index (TLX) score,
- Subjective preference as measured as the System Usability Score (SUS).
For each dependent variable, we initially compared the descriptive statistics and then undertook a parametric or non-parametric statistical hypothesis test. If an ANOVA or H-test found a significant difference, we also used t-test or U-test for pairwise comparisons.
The deviations from the flight path and altitude were both higher while participants used the gaze controlled system compared to the joystick, although the difference was not statistically significant in a signed rank test. Participants flew a longer distance while they used a gaze controlled system compared to the joystick.
We plotted selection times with respect to indices of difficulty of target. The selection times were significantly less for eye gaze controlled interface compared to joystick in a paired t-test (p < 0.05). The correlation between indices of difficulty and selection times was 0.34 for gaze controlled interface and 0.91 for joystick, showing in Figure 22.
The cognitive load measured in terms of NASA TLX scores was higher for joystick than gaze controlled interface although the difference was not significant in an unequal variance t-test. The subjective preference was higher and greater than 68 for gaze controlled interface compared to the joystick, showing in Figure 23 and Figure 24.
Discussion: This study found that pointing and selection times can indeed be improved with eye gaze controlled interface compared to HOTAS joystick but at the expense of degradation in flying performance by novice users. The cognitive load and subjective preference of users also indicated that novice participants preferred to use the gaze controlled system over the joystick. It may be noted that, in this study, we did not use any algorithm to help in pointing out similar target expansion or using hotspots like the automotive study discussed before. A post hoc analysis showed that participants took significantly less time to switch the gaze from primary to secondary display for the gaze controlled system than joystick, which may indicate that they paid less attention to the primary flying task. One possible solution could be to further reduce pointing and selection times in the secondary task so that they can quickly switch attention back to the flying task. In study 4, we used hotspots with the projected display and also made the task more externally valid than the present one by using two sets of visors and flying gloves with standard multi-function displays.
4.2. Confirmatory Studies
In this section, we have proposed a system that projects the dashboard on a semi-transparent screen in front of the windscreen, so that, even when drivers or pilots are interacting with it, they are not completely losing view of the road or sky ahead. The following subsections present another study to evaluate the utility of the hotspot for a projected gaze controlled interface.
Study 3—Hotspots with gaze controlled projected display in the automotive environment
In this study, we evaluated the gaze controlled projected display with and without hotspots and compared its performance with the touchscreen display. The study was designed similar to the previously described study in the automotive environment, except that the computer screen was replaced with the semi-transparent projected display.
Participants: We collected data from 11 participants (eight male, three female, average age 29.2 years). All participants used to drive cars and had no problems to use the experimental set up.
Material, Design, Procedure: We used a Phillips PicoPix 56 Lumen projector to display the secondary task on a semi-transparent display (Figure 25). The rest of the material, design and procedure was the same as the previous study. Seven out of eleven participants took part in the previous trial about two months ago but did not use the gaze controlled system afterwards. Thus, we assumed that all participants were novice to gaze controlled interface.
Results: We used a similar analysis strategy as the previous section. The driving performance in terms of mean deviation from the designated lane was significantly different in a Kruskal–Wallis H-test (χ2 (2,28) = 10.56, p < 0.05). Pairwise signed rank test also found that the driving performance was significantly different between projected gaze controlled systems for using hotspots. It may be noted that, using hotspots, mean deviation from designated driving lane was reduced by 41% for the projected gaze controlled interface and the mean deviation for hotspot equipped projected gaze controlled interface was even lower than the touchscreen based system, showing in Figure 26.
The differences among average speeds of driving were not significant. It was approximately 3 kn/h slower for hotspot equipped projected gaze controlled system than the touchscreen system, showing in Figure 27.
The standard deviation of steering angle was significantly lower for projected gaze controlled system than the touchscreen system in a signed rank test (p < 0.05). It may indicate that drivers needed to drive more carefully with the projected gaze controlled system compared to the touchscreen system, showing in Figure 28.
The average number of incorrect selections was higher in the projected gaze controlled interface than the touchscreen system, although using hotspots reduced it by 15.6% than without it. There were nine incorrect selections for the touchscreen, 36 for projected display without hotspot and 19 for projected display with hotspots.
Average response time was still the lowest for the touchscreen based system, but it is only 2% higher in the hotspot equipped projected screen. A one-way ANOVA found a significant difference among the reaction times (F(2,257) = 4.84, p < 0.05). A set of unequal variance t-tests found that the touchscreen had a significantly lower response times (p < 0.05) than the projected screen without hotspot, while the difference between the touchscreen and hotspot equipped projected screen was not significant, showing in Figure 29.
The TLX scores were highest for the projected gaze controlled system and lowest for the touchscreen. The hotspots reduced the average cognitive load by approximately 6% from the projected gaze controlled system without hotspots. However, we did not find any significant difference among different components of TLX scores for hotspot equipped gaze controlled projected system although the temporal demand (mean 52.89, stdev 19.38) was still higher than other components, showing in Figure 30.
The SUS scores were greater than 68 for all cases and highest for hotspot equipped gaze controlled system, which means all systems that were usable with hotspot equipped gaze controlled interfaces were most preferred by users, showing in Figure 31.
Discussion: This study demonstrates that eye gaze tracking devices and our cursor control algorithms can be used for projected displays as well. While participants used the projected display, they need not look down or stretch their hands, and could see through the road behind the semi-transparent display. We indeed found that driving performance was better than the touchscreen for the hotspot equipped projected gaze control system. The average response time was only 2% higher than the touchscreen system. The SUS scores also indicated users did not face any serious trouble in using this system. The cognitive load was still higher than touchscreens, but it should also be noted that our participants use a touchscreen enabled device everyday while they were using the eye gaze controlled interface for the first time during the trials.
The main problem with the projected display was the number of incorrect selections. Using hotspots significantly reduced it, but it was still higher than both the touchscreen and the screen based gaze controlled system. Actually, we could not completely eliminate the skewness of the projected display and positioning the projector without hampering driving equipment was also a challenge, which all resulted in poor calibration of the system. Our future work is investigating appropriate ways of positioning the projector and eye gaze tracker.
Finally, these gaze tracking studies were conducted in a driving simulator where we missed out on the effect of on road vibration. Our future work will investigate the effect of vibration in detail on the gaze controlled system.
Study 4—Gaze controlled projected display in an aviation environment
In this study, we evaluated the gaze controlled projected display with a flight simulator. The control condition was the HOTAS joystick, which is the main input modality for military fast jets. We hypothesized that the gaze controlled system will reduce response times for pointing and selection tasks without degrading flying performance.
Participants: We collected data from 11 participants (nine male, two female, age range 25 to 34 years) recruited from our university with similar sampling criteria as the second study discussed above. The participants had no visual, cognitive and motor impairment and did not have any problem in using the experimental setup. None of them have used either a HOTAS joystick or an eye gaze tracking based interface earlier.
Design and Material: The study used a similar set of material as the previous study (study 2) described before. We also used a helmet with both clear and dark visors and a pair of gloves used in fast jets given to us by the national aerospace company. Instead of the ISO task, we used the screenshot of Figure 32, and each participant was instructed to make at least eight selections for each condition while undertaking the flying task. Since the eye gaze tracker works based on reflected infrared light, we wanted to evaluate and compare the quality of interaction with the dark visor. Our study consisted of the following three conditions for pointing and selection tasks:
- Using HOTAS joystick,
- Using eye gaze tracking with clear visor (ETC),
- Using eye gaze tracking with dark visor (ETD).
Procedure: Participants were initially briefed about the study and were given one or two test runs with the flight simulator as well as the eye gaze tracking system. Then, they undertook the experimental task, the order of using the joystick and eye gaze tracking based systems were randomized to minimize order effect. After each condition, they filled up the TLX and SUS questionnaires.
Results: We initially analysed the flight performance under three different conditions in terms of the standard deviation from the horizontal flight path, standard deviation in altitude when the flight was outside the envelope between 1000 and 2000 feet and total distance covered during the task. We did not find any significant difference among those parameters in one-way ANOVAs. In fact, the deviation in altitude was 10% less with eye gaze tracking with a clear visor compared to the HOTAS joystick, showing in Figure 33.
Next, we analysed response times for 268 pointing tasks and found a significant difference among three different conditions F(2,246) = 9.65, p < 0.05 η2 = 0.07. A set of pairwise t-tests also found a significant difference between the response times for the gaze tracking system and HOTAS joystick, showing in Figure 34.
The number of wrong selections was measured and reported in terms of percent error, which was lowest for the joystick and under 10% for all conditions. There were four incorrect selections for HOTAS, nine for eye gaze tracking with a clear visor and six for eye gaze tracking with a dark visor, showing in Figure 35.
Users reported significantly less cognitive load for gaze controlled systems in terms of TLX scores (F(2,26) = 5.04, p < 0.05, η2 = 0.28) and they also reported significantly higher preference (F(2,26) = 8.78, p < 0.05, η2 = 0.40) for a gaze controlled system over the HOTAS joystick in terms of SUS scores, showing in Figure 36 and Figure 37.
Discussion: This study demonstrates that, for the standard flying task, the eye gaze controlled interface can perform better than the existing HOTAS joystick both in terms of response times and subjective preference. The average response time was even lower than the gaze controlled head down display reported by Biswas and Langdon in a single task study. The flying performance in terms of deviation in altitude marginally improved for gaze controlled system than the joystick. Users preference is also significantly higher for the gaze controlled system. In summary, we can conclude that, at least for novice users, the gaze controlled system can improve performace with secondary mission control tasks in a military aviation environment without degrading the primary manual flying task.
5. Discussion
Overall, we can conclude that gaze controlled system can improve performance with secondary tasks in the aviation environment with respect to the joystick and can improve driving performance in automotive without significantly affecting performance in the secondary task compared to the touchscreen. Earlier work on the gaze controlled interface have not explored a projected display, and this paper shows that eye gaze controlled interfaces can be used with projected display, and it will be useful for both automotive and aviation environments. A demonstration video of the automotive setup can be found at https://youtu.be/72whe5KiZ44 while that of the aviation set up can be found at https://youtu.be/j4KznPbc7n8.
However, the improvement with the gaze controlled system was better for aviation than automotive environment. One of the main reasons may be the placement of projectors. In the automotive environment, we used a pico-projector and smaller display size, while in aviation we have a bigger screen space. The primary task for the driving simulator was rendered in a TV screen while the projected display was only 3” away from the TV and used a 56 lumen pico-projector, reducing its legibility compared to the setup we used for the flight simulator study [56].
We also noted the higher number of wrong selections with a gaze controlled projected display. Although the use of hotspots reduced it, it was still higher than touchscreen or joystick. Considering the speed-accuracy trade-off, we are considering using a higher frequency eye gaze tracker that can bring the pointer on a target quicker than our existing one and then we can instruct participants to slow down the selection procedure (presently pressing a hardware switch), which may reduce the number of incorrect selections.
In the remaining part of this section, we have justified a few of our design and validation decisions and also pointed out future research directions.
Cluttering of display due to hotspots: Putting hotspots on every clickable items on a screen may clutter the display. Large [57] and colleagues classified existing automotive user interfaces into four types: list, menu, map and text entry. The clickable items for list and menu selection has less density (#items/screen area) and putting a small spot on them will not clutter the display. For map manipulation, a hotspot will not be sufficient, as users may need to click and drag anywhere in the map, our previous work (anonym. ref) proposed a different fixation duration based technique for map manipulation. For the virtual keyboard, the minimum distance between two hotspots may not be greater than the accuracy of the gaze tracker due to high screen-density, making hotspots less worthy. A ‘Dasher’ [58] type of virtual keyboard will be more appropriate for gaze controlled interface.
Interference with caption for hotspots: When the buttons will have captions on them, it may be possible that the optimum position of the hotspot will be on the caption itself. It may be noted that the aim of the hotspot is to leverage the pop out effect, and it need not be a physical spot itself. Bold-facing or rendering in reverse-contrast a single letter of the caption or placing a high-contrast icon can also serve as a hotspot.
Selection for gaze control interface: In gaze controlled interface, selection of a target, popularized as the Midas Touch problem, is not as straightforward as with other interaction techniques like touchscreen, touchpad or mouse. A previous study [32] explored hardware switch and voice command based selection while researchers on assistive technology [40] explored dwell time based selection. Considering the timing constraint, we used a button on steering and throttle (slew button) for selecting targets in the reported user studies.
Use of finger tracking: The finger tracking interface was set up as an alternative modality of selection. We did not use it for the aviation trial, but participants were allowed to use it for the driving simulator. A previous study [6] explored different fusion strategies for eye gaze and finger tracking systems, and we followed a precedence rule to fuse eye gaze and finger tracking for the present paper. We included finger tracking interaction to demonstrate that the projected display can also be operated by other interaction techniques besides eye gaze.
Comparison to previous results: There are not much reported work on dual task studies involving gaze controlled interface. In single task study, we can only measure the pointing and selection times, but in our setup, we could measure both response times of switching attention from primary to secondary task and completion time of the secondary task. Kern [59] reported such a study, and, using a similar primary task as this paper, the touchscreen produced a mean deviation of 1.18 while a gaze controlled interface 1.31. In our projected gaze controlled display, the average mean deviation was only 0.98. Unlike Kern [59], we also reported average response times for pointing and selection times on the dashboard. As per our knowledge, there is not any reported work on dual task studies involving flight simulator and gaze controlled interface. However, the average response time reported in study 4 was even lower than the gaze controlled head down display reported by Biswas [32] in a single task study.
Design of user studies: The user studies were designed to cover both aviation and automotive environments. The pilot studies were conducted on an ISO pointing task on the projected display in the aviation environment and on a hotspot equipped interface in automotive environment. We did not conduct an ISO pointing task in an automotive environment yet but could be undertaken in near future. The pilot studies aimed to confirm whether participants could operate a projected display or gaze control display while undertaking flyinng or driving tasks, and once they could do so, we undertook the confirmatory studies that combined both hotspots and projected display.
Sampling strategy: For studies in the automotive environment, we recruited participants who had valid driving licenses. Similarly, for studies in the aviation environment, we aimed to recruit pilots. However, senior pilots at the local aerospace company suggested us to collect data from university students as they thought any new technology is most likely to be tested first on a training platform with students with little flying knowledge rather than on an established platform with more experienced pilots. They also suggested that performance with a new interactive device should not be different between pilots and non-pilots, as none of them used gaze controlled interface before. However, we constantly took suggestions from experienced pilots on designing the flight simulator and flying task during design of the study [60].
Data analysis strategy: We checked normality by drawing box plots and comparing mean and median for each individual dependent variable. If the data were normally distributed, we conducted parametric tests and otherwise we undertook non-parametric tests. For all graphs, the column represents the average while the error bar represents standard deviation.
Vibrating environment: It may be noted that all our studies were conducted in driving and flying simulators inside laboratory and thus we missed to measure the effect of vibration on the performance of eye gaze and finger tracking sensors. A study in automotive environment [6] reported that variation in vibration along the vertical axis of a screen is more detrimental to performance of eye gaze controlled system than along the x- or z-axes. In a more precise experiment, We undertook a study [61] where we collected data from nine participants on an eye gaze and finger controlled system inside a car running at approximately 60 km/h on a highway. However, unlike our previous studies, the driver himself could not undertake trials due to risk of causing accident and a fellow passenger undertook the trials. The design of the study was otherwise similar to the studies one and three. We found an average selection time of 1.99 s (stdev 0.86 s). We are now designing a more accurate study under variable g-conditions in the aviation environment.
Integration to car and aircrafts: As reported in [61], gaze controlled interface has already been tested inside a car. It may be noted that many drivers nowadays prefer to put their smartphone or iPad at the windscreen on the line of sight of driving, so that they need not to look down (Figure 38). A few modern cars (like Audi A3 or A4) also put part of the dashboard at the line of sight of driving (Figure 38). We can attach the eye gaze tracker on any display at the line of sight of driver. We can attach our projector on the inner roof of the vehicle and replace any display on the windscreen with a semi-transparent sheet and operate it using both eye gaze and finger movement.
We undertook two pilot studies for studying feasibility of putting an eye gaze tracker in a military aircraft cockpit. Our testing investigated both ergonomic and engineering challenges on connecting cockpit computers to eye gaze tracker and positioning the tracker in the cockpit so that the tracker can track eyes of pilots of different heights. Due to time constraints and security issues, we could manage to collect data from only four participants (height range 5′6′′ to 6′1′′, age range 24 to 34 years, three male, one female).
We tried to fit an eye gaze tracker in a BAES Hawk Trainer aircraft. We used an Intel NUC computer with an i3 processor and kept the set up on the wing of the aircraft. We hold a 10′′ screen fitted with an eye gaze tracker on top of the existing MFDs. We tried all six MFDs of the Hawk Trainer spread over two cockpits and the tracker worked for the top most MFD of the rear cockpit (Figure 39). We used a similar experimental task with simulated MFD discussed above for the secondary task. In our simulated MFD, participants undertook 40 pointing tasks at an average speed of 1.35 s (stdev 1.19 s) inside the aircraft.
Later, we also integrated an eye gaze tracker to a high end simulator (Figure 40) at the National Aerospace Laboratory of India and participants could undertake pointing and selection tasks in the MFD using our algorithm. In this setup, we installed our gaze tracking program and simulated MFD into the cockpit computer. Participants undertook 32 pointing tasks at an average speed of 2.4 s (stdev 1.21 s) in the simulator.
6. Conclusions
This paper proposes an algorithm to facilitate human–machine interaction in automotive and aviation environments by using a gaze controlled projected (head up) display. Our proposed system does not require drivers to look down and take their eyes off of the road while operating a dashboard. The performance of the system was evaluated using a dual task setting involving a driving simulator, and it is found that the pointing and selection times are not significantly different between the proposed system and touchscreen display; instead, driving performance was improved with the proposed system than the existing touchscreen display. We also reported a significant improvement in pointing and selection times with secondary tasks in the military aviation environment and an improvement in the flying performance compared to the HOTAS joystick. Participants also preferred using the gaze controlled system compared to existing interaction devices and reported less cognitive load. Our future work is evaluating the system in a vibrating environment under different degrees of acceleration.
Author Contributions
Gowdham Prabhakar contributed in setting up both the driving simulator as well as flight simulator both in hardware as well as software. He conducted the user trials for automotive task. He also helped in conducting the user trials for aviation environment. He performed part of data analysis for automotive as well as aviation tasks. Pradipta Biswas helped in developing the software, designing user studies and drafting the paper. He is Gowdham’s PhD supervisor.
Conflicts of Interest
Declare conflicts of interest.
References
- Huey, E. The Psychology and Pedagogy of Reading (Reprint); MIT Press: Cambridge, MA, USA, 1968. [Google Scholar]
- Duchowski, A.T. Eye Tracking Methodology; Springer: London, UK, 2007. [Google Scholar]
- Testing Procedure of Tobii Tracker. Available online: https://www.tobiipro.com/about/quality/ (accessed on 17 October 2017).
- Voronka, N.; Jacobus, C.J. Low-Cost Non-Imaging Eye Tracker System for Computer Control. U.S. Patent No. 6299308 B1, 9 October 2001. [Google Scholar]
- Milekic, S. Using Gaze Actions to Interact with a Display. U.S. Patent No. 7561143 B1, 14 July 2009. [Google Scholar]
- Jacob, M.; Hurwitz, B.; Kamhi, G. Eye Tracking Based Selective Accentuation of Portions of a Display. WO Patent No. 2013169237 A1, 14 November 2013. [Google Scholar]
- Farrell, S.; Zhai, S. System and Method for Selectively Expanding or Contracting a Portion of a Display Using Eye-Gaze Tracking. U.S. Patent No. 20050047629 A1, 3 March 2005. [Google Scholar]
- Martins, F.C.M. Passive Gaze-Driven Browsing. U.S. Patent No. 6608615 B1, 19 August 2003. [Google Scholar]
- Zhai, S.; Morimoto, C.; Ihde, S. Manual and Gaze Input Cascaded (MAGIC) Pointing. In Proceedings of the SIGCHI Conference on Human Factors in Computing System (CHI), Pittsburgh, PA, USA, 15–20 May 1999; ACM: New York, NY, USA, 1999. [Google Scholar]
- Ashdown, M.; Oka, K.; Sato, Y. Combining Head Tracking and Mouse Input for a GUI on Multiple Monitors. In Proceedings of the CHI Late breaking Result, Portland, OR, USA, 2–7 April 2005. [Google Scholar]
- Dostal, J.; Kristensson, P.O.; Quigley, A. Subtle Gaze-Dependent Techniques for Visualising Display Changes in Multi-Display Environments. In Proceedings of the ACM International Conference of Intelligent User Interfaces (IUI), Santa Monica, CA, USA, 19–22 March 2013. [Google Scholar]
- Zhang, Y.; Bulling, A.; Gellersen, H. SideWays: A Gaze Interface for Spontaneous Interaction with Situated Displays. In Proceedings of the ACM SIGCHI Conference on Human Factors in Computing System (CHI), Paris, France, 27 April–2 May 2013. [Google Scholar]
- Fu, Y.; Huang, T.S. hMouse: Head Tracking Driven Virtual Computer Mouse. In Proceedings of the IEEE Workshop on Applications of Computer Vision, Austin, TX, USA, 21–22 February 2007. [Google Scholar]
- CameraMouse. Available online: http://www.cameramouse.com (accessed on 22 September 2013).
- Fejtova, M.; Figueiredo, L.; Novák, P. Hands-free interaction with a computer and other technologies. Univers. Access Inf. Soc. 2009, 8, 277–295. [Google Scholar] [CrossRef]
- Fitts, P.M. The Information Capacity of the Human Motor System in controlling the amplitude of movement. J. Exp. Psychol. 1954, 47, 381–391. [Google Scholar] [CrossRef] [PubMed]
- Bates, R. Multimodal Eye-Based Interaction for Zoomed Target Selection on a Standard Graphical User Interface. In Proceedings of the INTERACT, Edinburgh, Scotland, 30 August–3 September 1999. [Google Scholar]
- Zandera, T.O.; Gaertnera, M.; Kothea, C.; Vilimek, R. Combining Eye Gaze Input with a Brain–Computer Interface for Touchless Human–Computer Interaction. Int. J. Hum. Comput. Interact. 2010, 27, 38–51. [Google Scholar] [CrossRef]
- Penkar, A.M.; Lutteroth, C.; Weber, G. Designing for the Eye—Design Parameters for Dwell in Gaze Interaction. In Proceedings of the 24th Australian Computer-Human Interaction Conference (OZCHI 2012), Melbourne, Australia, 26–30 November 2012. [Google Scholar]
- Grandt, M.; Pfendler, C.; Mooshage, O. Empirical Comparison of Five Input Devices for Anti-Air Warfare Operators. Available online: http://dodccrp.org/events/8th_ICCRTS/pdf/035.pdf (accessed on 30 November 2013).
- Lutteroth, C.; Penkar, M.; Weber, G. Gaze vs. Mouse: A Fast and Accurate Gaze-Only Click Alternative. In Proceedings of the 28th Annual ACM Symposium on User Interface Software & Technology, Charlotte, NC, USA, 11–15 November 2015. [Google Scholar]
- Pfeuffer, K.; Gellersen, H. Gaze and Touch Interaction on Tablets. In Proceedings of the 29th Annual Symposium on User Interface Software and Technology, Tokyo, Japan, 16–19 October 2016; ACM: New York, NY, USA, 2016; pp. 301–311. [Google Scholar]
- Voelker, S.; Matviienko, A.; Schöning, J.; Borchers, J. Combining Direct and Indirect Touch Input for Interactive Desktop Workspaces using Gaze Input. In Proceedings of the 3rd ACM Symposium on Spatial User Interaction, Los Angeles, CA, USA, 8–9 August 2015. [Google Scholar]
- Jagacinski, R.J.; Monk, D.L. Fitts’ Law in Two Dimensions with Hand and Head Movements. J. Mot. Behav. 1985, 17, 77–95. [Google Scholar] [CrossRef] [PubMed]
- Kaber, D.B.; Riley, J.M.; Tan, K.W. Improved usability of aviation automation through direct manipulation and graphical user interface design. Int. J. Aviat. Psychol. 2002, 12, 153–178. [Google Scholar] [CrossRef]
- Baty, D.L.; Watkins, M.L. An Advanced Cockpit Instrumentation System: The Co-Ordinated Cockpit Displays; NASA Technical Memorandum 78559; NASA Scientific and Technical Information Office: Washington, DC, USA, 1979.
- Sokol, T.C.; Stekler, H.O. Technological change in the military aircraft cockpit industry. Technol. Forecast. Soc. Chang. 1988, 33, 55–62. [Google Scholar] [CrossRef]
- Furness, T.A. The super cockpit and its human factors challenges. In Proceedings of the Human Factors and Ergonomics Society Annual Meeting, Dayton, OH, USA, 29 September–3 October 1986; Volume 30, p. 48. [Google Scholar]
- Thomas, P.; Biswas, P.; Langdon, P. State-of-the-Art and Future Concepts for Interaction in Aircraft Cockpits. In Proceedings of the HCI International, Los Angeles, CA, USA, 2–7 August 2015. [Google Scholar]
- MacKenzie, I.S.; Sellen, A.; Buxton, W. A comparison of input devices in elemental pointing and dragging tasks. In Proceedings of the CHI’91 Conference on Human Factors in Computing Systems, New Orleans, LA, USA, 27 April–2 May 1991; ACM: New York, NY, USA, 1991; pp. 161–166. [Google Scholar]
- Thomas, P. Performance, characteristics, and error rates of cursor control devices for aircraft cockpit interaction. Int. J. Hum. Comput. Stud. 2018, 109, 41–53. [Google Scholar] [CrossRef]
- Biswas, P.; Langdon, P. Multimodal Intelligent Eye-Gaze Tracking System. Int. J. Hum. Comput. Interact. 2015, 31, 277–294. [Google Scholar] [CrossRef]
- Chang, W.; Hwang, W.; Ji, Y.G. Haptic Seat Interfaces for Driver Information and Warning Systems. Int. J. Hum. Comput. Interact. 2011, 27, 1119–1132. [Google Scholar] [CrossRef]
- Miniotas, D. Application of Fitts’ Law to Eye Gaze Interaction. In Proceedings of the ACM SIGCHI Conference on Human Factors in Computing Systems (CHI), The Hague, The Netherlands, 1–6 April 2001; pp. 339–340. [Google Scholar]
- Ohn-Bar, E.; Trivedi, M. Hand Gesture Recognition in Real-Time for Automotive Interfaces: A Multimodal Vision-based Approach and Evaluations. IEEE Trans. Intell. Transp. Syst. 2014, 15, 2368–2377. [Google Scholar] [CrossRef]
- Feld, M.; Meixner, G.; Mahr, A.; Seissler, M.; Kalyanasundaram, B. Generating a Personalized UI for the Car: A User-Adaptive Rendering Architecture. In Lecture Notes in Computer Science, Proceedings of the International Conference on User Modeling, Adaptation, and Personalization (UMAP), Rome, Italy, 10–14 June 2013; Springer: Berlin/Heidelberg, Germany, 2013; Volume 7899, pp. 344–346. [Google Scholar]
- Normark, C.J. Design and Evaluation of a Touch-Based Personalizable In-vehicle User Interface. Int. J. Hum. Comput. Interact. 2015, 31, 731–745. [Google Scholar] [CrossRef]
- Poitschke, T.; Laquai, F.; Stamboliev, S.; Rigoll, G. Gaze-based interaction on multiple displays in an automotive environment. In Proceedings of the IEEE International Conference on Systems, Man, and Cybernetics (SMC), Anchorage, AK, USA, 9–12 October 2011; pp. 543–548. [Google Scholar]
- Duarte, R.S.; Oliveira, B.F. Comparing the Glance Time Required to Operate Standart Interface Devices and Touchscreen Devices in Automobiles. In Proceedings of the ACM Interacción, Puerto de la Cruz, Tenerife, Spain, 10–12 September 2014. [Google Scholar]
- May, K.R.; Walker, B.N.; Gable, T.M. A Multimodal Air Gesture Interface for In Vehicle Menu Navigation. In Proceedings of the 6th International Conference on Automotive User Interfaces and Interactive Vehicular Applications (Automotive UI 2014), Seattle, WA, USA, 17–19 September 2014; ACM: New York, NY, USA, 2014. [Google Scholar]
- Weinberg, G.; Knowles, A.; Langer, P. BullsEye: An Automotive Touch Interface that’s always on Target. In Proceedings of the 4th International Conference on Automotive UI, Portsmouth, NH, USA, 17–19 October 2014. [Google Scholar]
- Mondragon, C.K.; Bleacher, B. Eye Tracking Control of Vehicle Entertainment Systems. U.S. Patent No. WO2013036632, 14 March 2013. [Google Scholar]
- Ruiz, J.; Lank, E. Speeding pointing in tiled widgets: Understanding the effects of target expansion and misprediction. In Proceedings of the 15th International Conference on Intelligent User Interfaces (IUI’10), Hong Kong, China, 7–10 February 2010; ACM: New York, NY, USA, 2010; pp. 229–238. [Google Scholar]
- Seder, T.A.; Szczerba, J.F.; Cui, D. Virtual Cursor for Road Scene Object Lelection on Full Windshield Head-up Display. U.S. Patent No. US20120174004, 16 June 2015. [Google Scholar]
- Vertegaal, R. A Fitts’ Law Comparison of Eye Tracking and Manual Input in the Selection of Visual Targets. In Proceedings of the International Conference of Multimodal Interaction, Chania, Crete, Greece, 20–22 October 2008; pp. 241–248. [Google Scholar]
- System Usability Scale. Available online: http://en.wikipedia.org/wiki/System_usability_scale (accessed on 12 July 2014).
- Kim, J.; Lim, J.; Jo, C.; Kim, K. Utilization of Visual Information Perception Characteristics to Improve Classification Accuracy of Driver’s Visual Search Intention for Intelligent Vehicle. Int. J. Hum. Comput. Interact. 2015, 31, 717–729. [Google Scholar] [CrossRef]
- Flight Manual for the Package Eurofighter Typhoon Professional. Available online: https://www.afs-design.de/pdf/AFS_EFpro_English.pdf (accessed on 3 October 2017).
- Biswas, P.; Langdon, P. Eye-Gaze Tracking based Interaction in India. Procedia Comput. Sci. 2014, 39, 59–66. [Google Scholar] [CrossRef]
- Ware, C.; Mikaelian, H.M. An Evaluation of an Eye Tracker as a Device for Computer Input. In Proceedings of the ACM SIGCHI Conference on Human Factors in Computing Systems (CHI), Toronto, ON, Canada, 5–9 April 1987; pp. 183–187. [Google Scholar]
- Murata, A. Improvement of Pointing Time by Predicting Targets in Pointing with a PC Mouse. Int. J. Hum. Comput. Interact. 1998, 10, 23–32. [Google Scholar] [CrossRef]
- Pasqual, P.; Wobbrock, J. Mouse pointing end-point prediction using kinematic template matching. In Proceedings of the SIGCHI Conference on Human Factors in Computing Systems (CHI’14), Toronto, ON, Canada, 26 April 26–1 May 2014; pp. 743–752. [Google Scholar]
- Biswas, P. Exploring the Use of Eye Gaze Controlled Interfaces in Automotive Environments; Springer: Cham, Switzerland, 2016; ISBN 978-3-319-40708-1. [Google Scholar]
- Tobii X3 Eye Tracker. Available online: https://www.tobiipro.com/product-listing/tobii-pro-x3-120/ (accessed on 31 August 2016).
- Treisman, A.; Gelade, G. A Feature Integration Theory of Attention. Cogn. Psychol. 1980, 12, 97–136. [Google Scholar] [CrossRef]
- HOTAS. Available online: http://www.thrustmaster.com/products/hotas-warthog (accessed on 12 July 2016).
- Large, D.; Burnett, G.; Crundall, E.; Lawson, G.; Skrypchuk, L. Twist It, Touch It, Push It, Swipe It: Evaluating Secondary Input Devices for Use with an Automotive Touchscreen HMI. In Proceedings of the 8th International Conference on Automotive User Interfaces and Interactive Vehicular Applications (ACM AutoUI), Ann Arbor, MI, USA, 24–26 October 2016. [Google Scholar]
- Ward, D.J.; Blackwell, A.F.; MacKay, D.J.C. Dasher—A Data Entry Interface Using Continuous Gestures and Language Models. In Proceedings of the 13th annual ACM symposium on User interface software and technology (UIST), San Diego, CA, USA, 6–8 November 2000. [Google Scholar]
- Kern, D.; Mahr, A.; Castronovo, S.; Schmidt, A.; Müller, C. Making Use of Drivers’ Glances onto the Screen for Explicit Gaze-Based Interaction. In Proceedings of the Second International Conference on Automotive User Interfaces and Interactive Vehicular Applications, Pittsburgh, PA, USA, 11–12 November 2010. [Google Scholar]
- Zhai, S.; Hunter, M.; Smith, B.A. The Metropolis Keyboard—An Exploration of Quantitative Techniques for Virtual Keyboard Design. In Proceedings of the ACM Symposium on User Interface Software and Technology (UIST 2000), San Diego, CA, USA, 5–8 November 2000. [Google Scholar]
- Biswas, P.; Twist, S.; Godsill, S. Intelligent Finger Movement Controlled Interface for Automotive Environment. In Proceedings of the British HCI Conference, Sunderland, UK, 3–6 July 2017. [Google Scholar]
Figure 1.
The screen (top one automotive set up, bottom one for aviation setup).
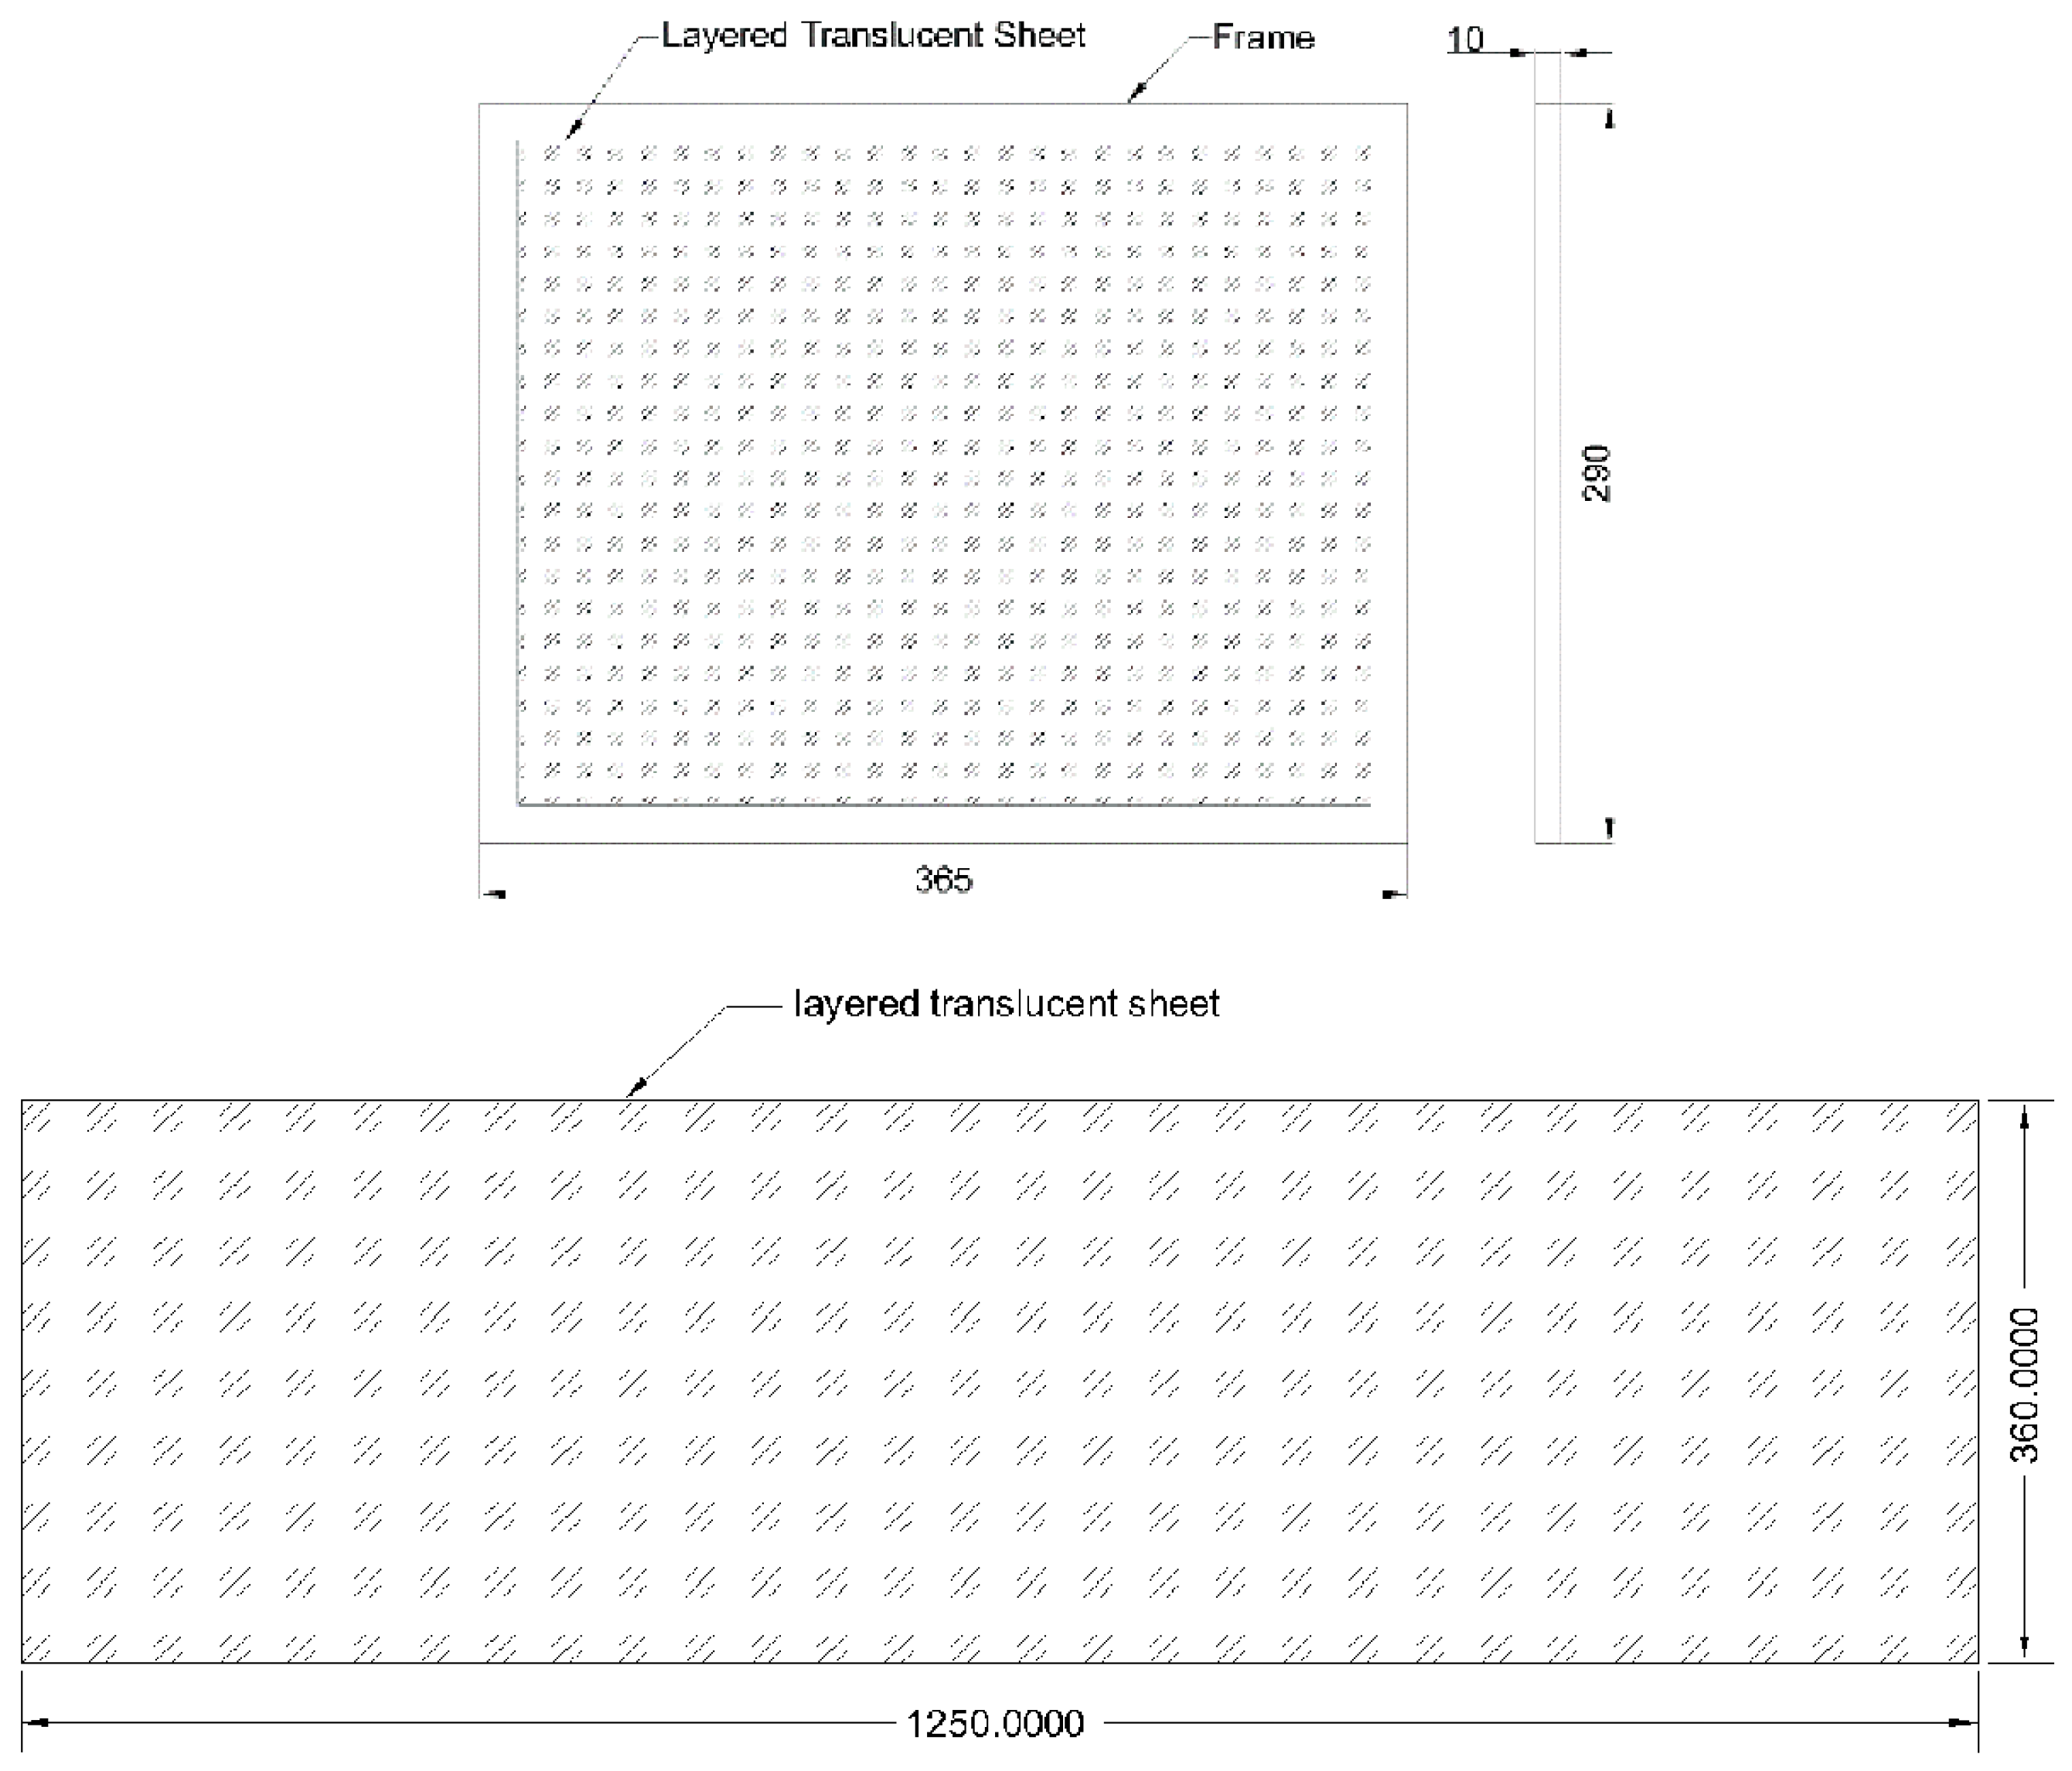
Figure 2.
Tilting mechanism.
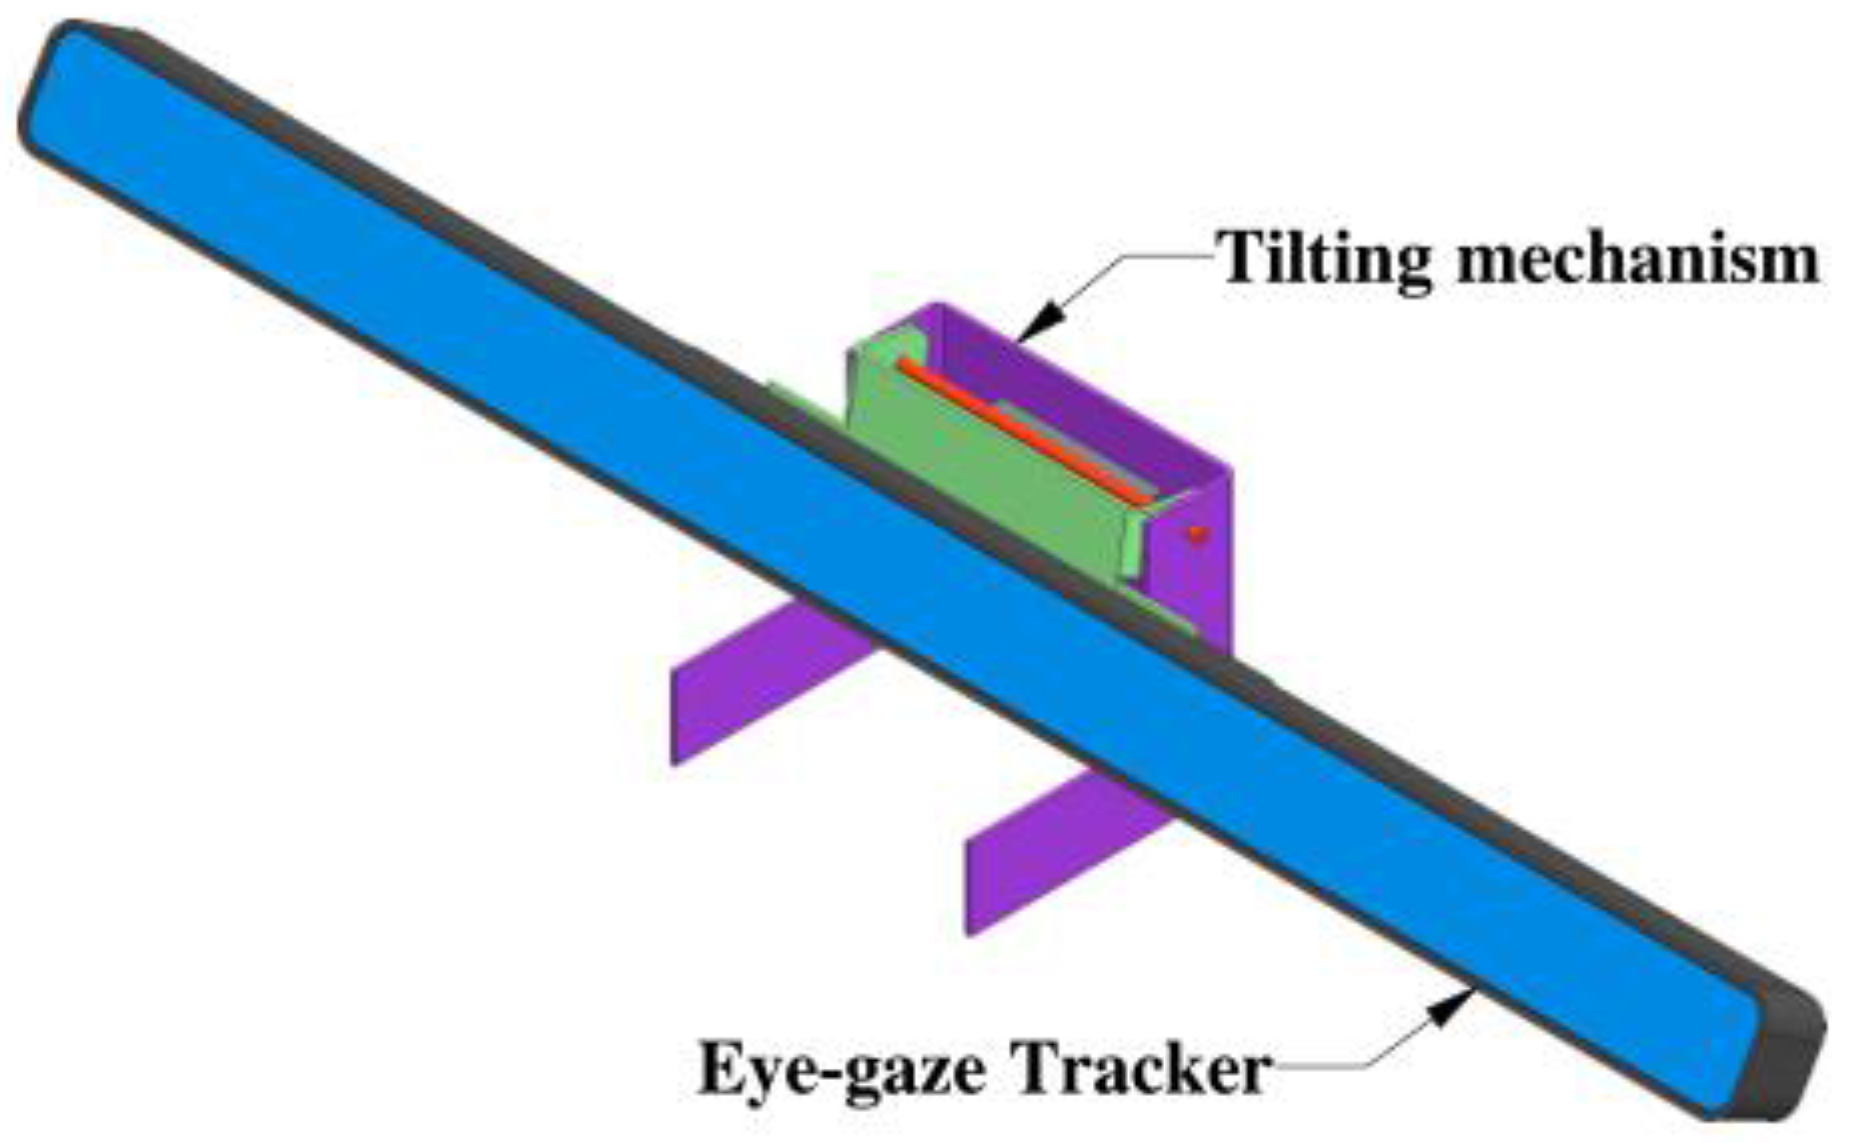
Figure 3.
Components of tilting mechanism.

Figure 4.
The support frame (left and middle picture for automotive and right one for aviation setup).
Figure 4.
The support frame (left and middle picture for automotive and right one for aviation setup).

Figure 5.
Reflection from projected display.

Figure 6.
The projected screen set up (left one for automotive, right one for aviation).

Figure 7.
State chart diagram of Eye Gaze–Finger tracking combined system.
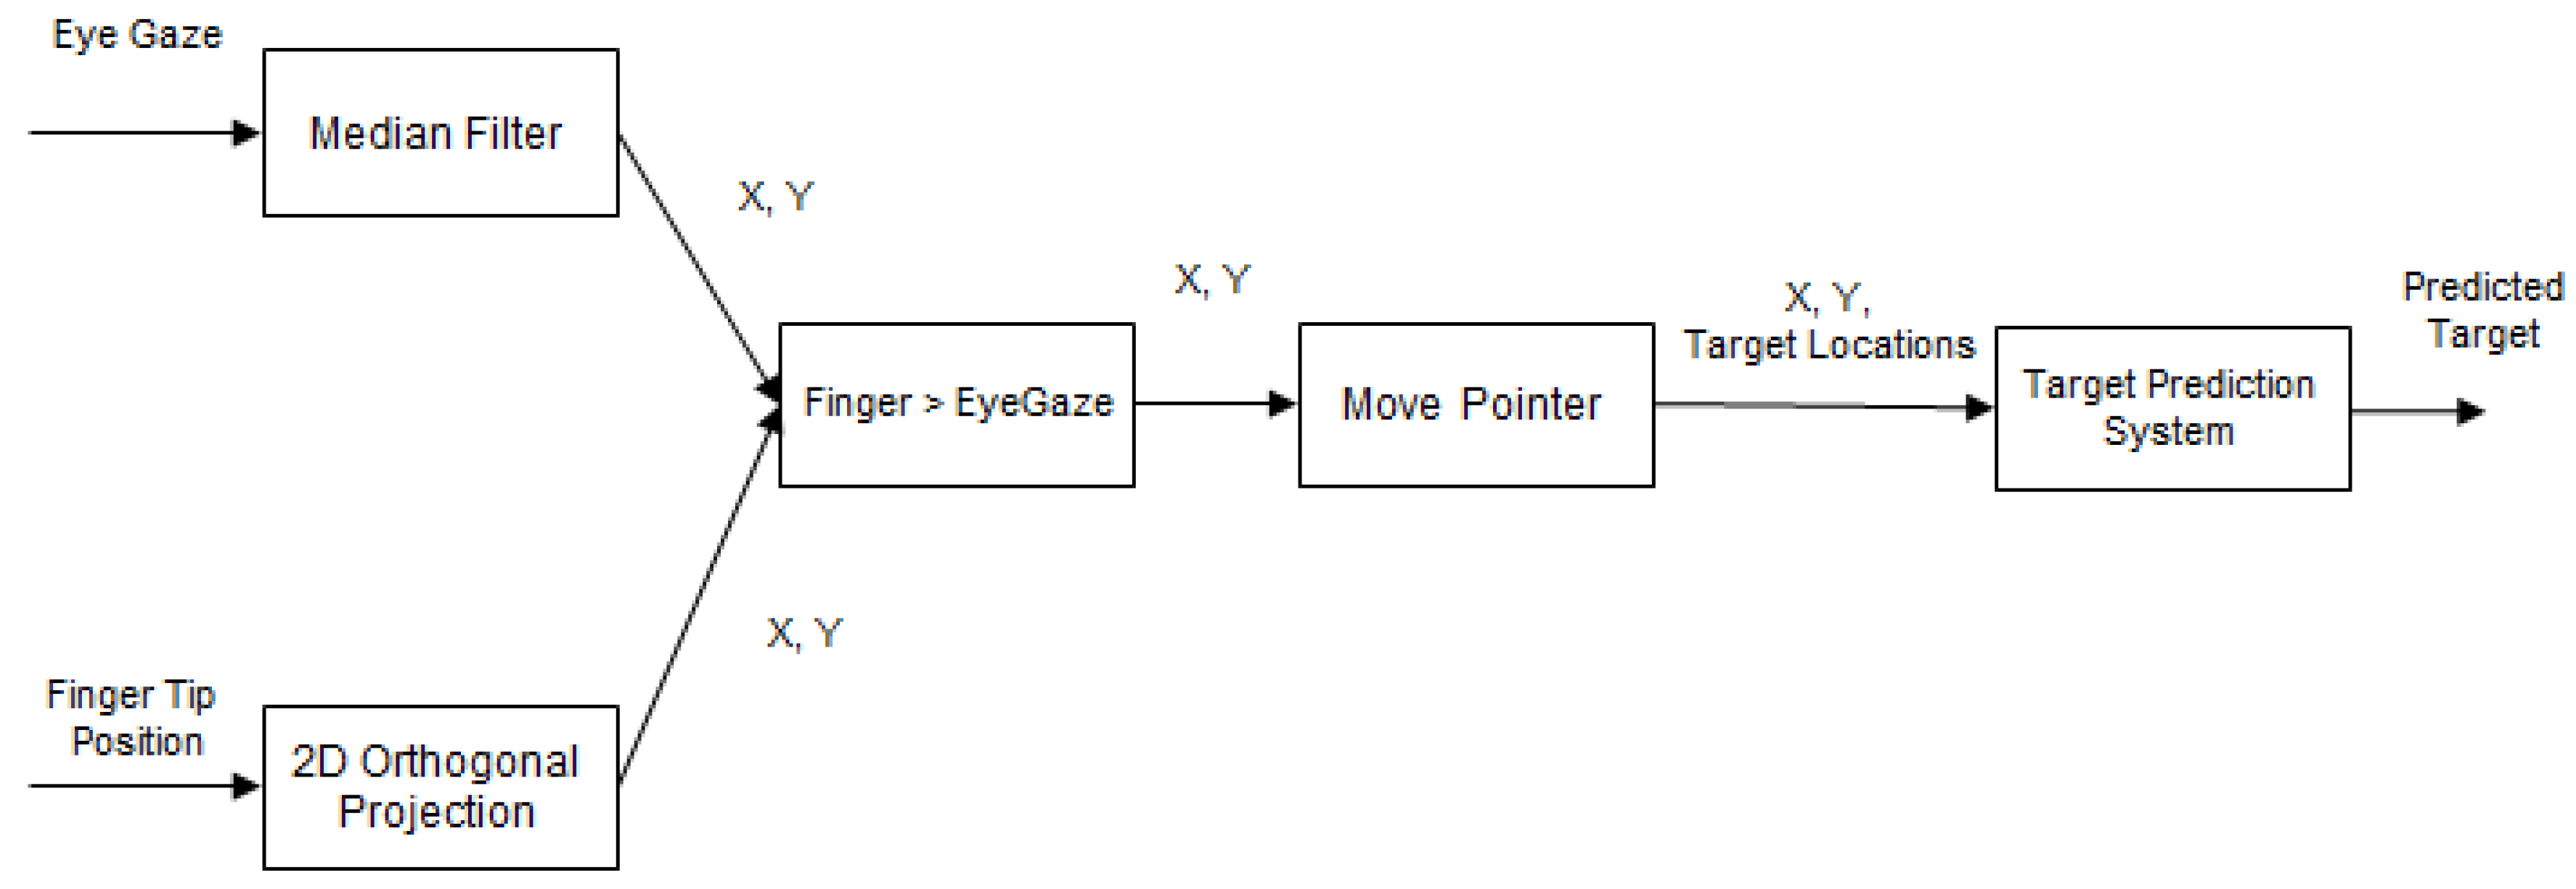
Figure 8.
Graph structure of an interface.
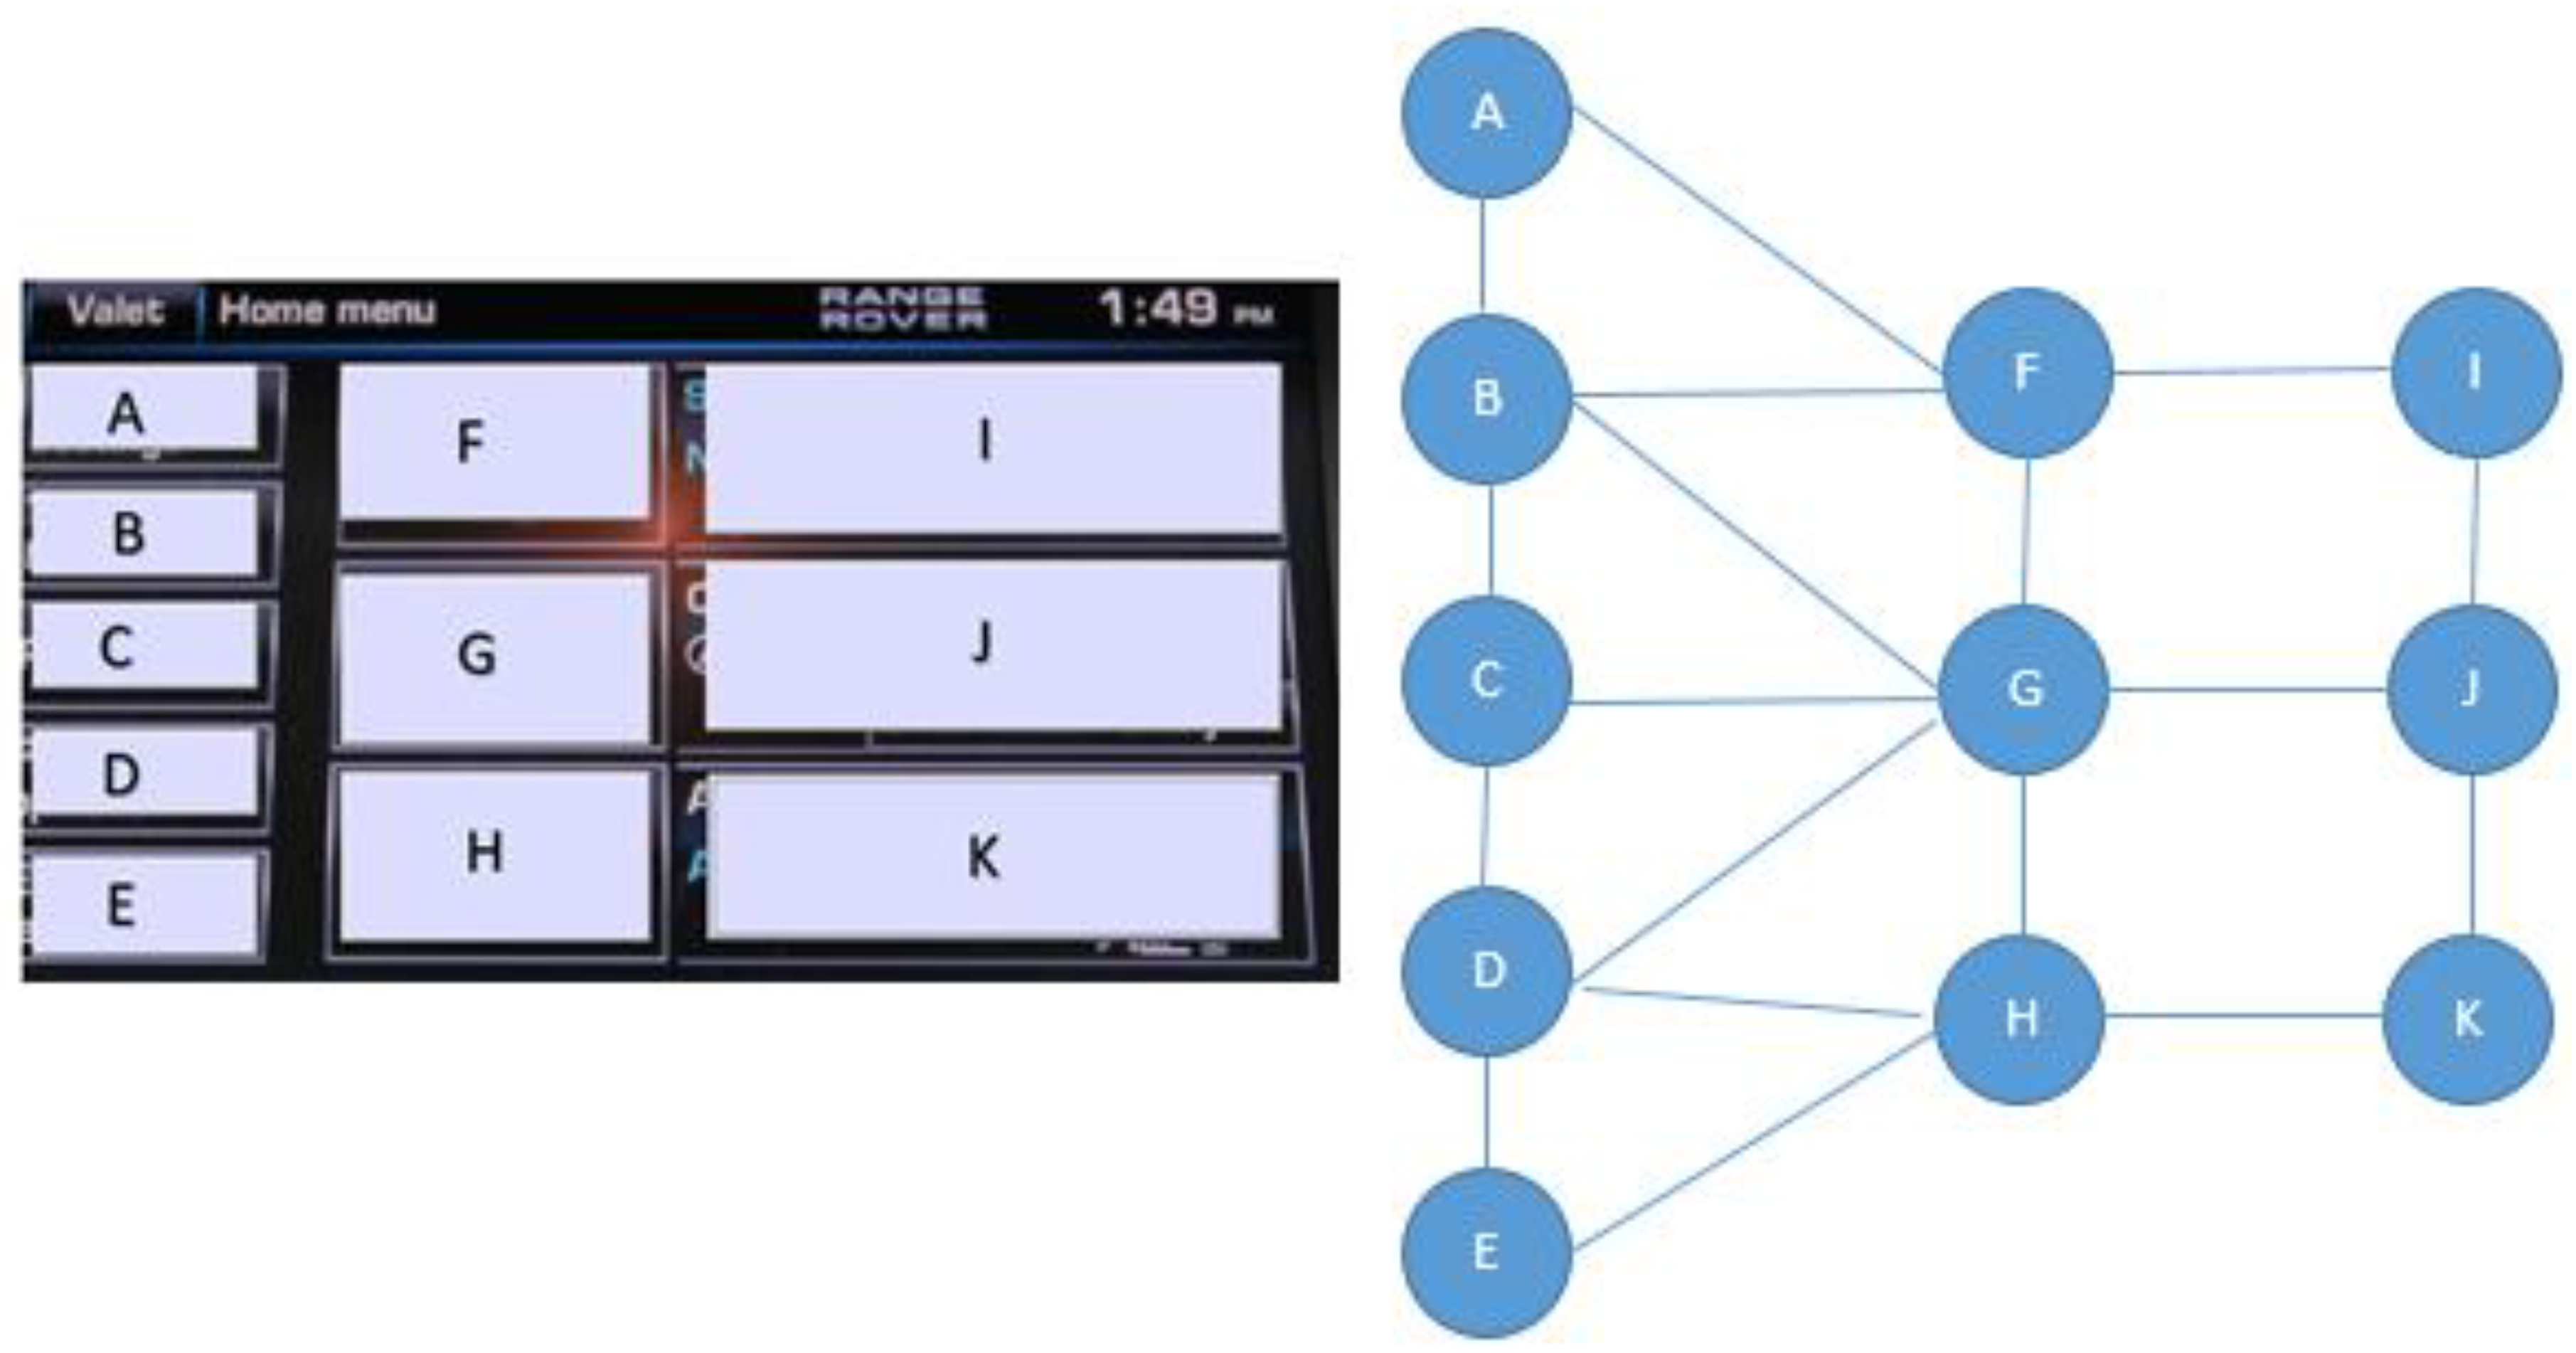
Figure 9.
Comparing the cost function for different algorithms.
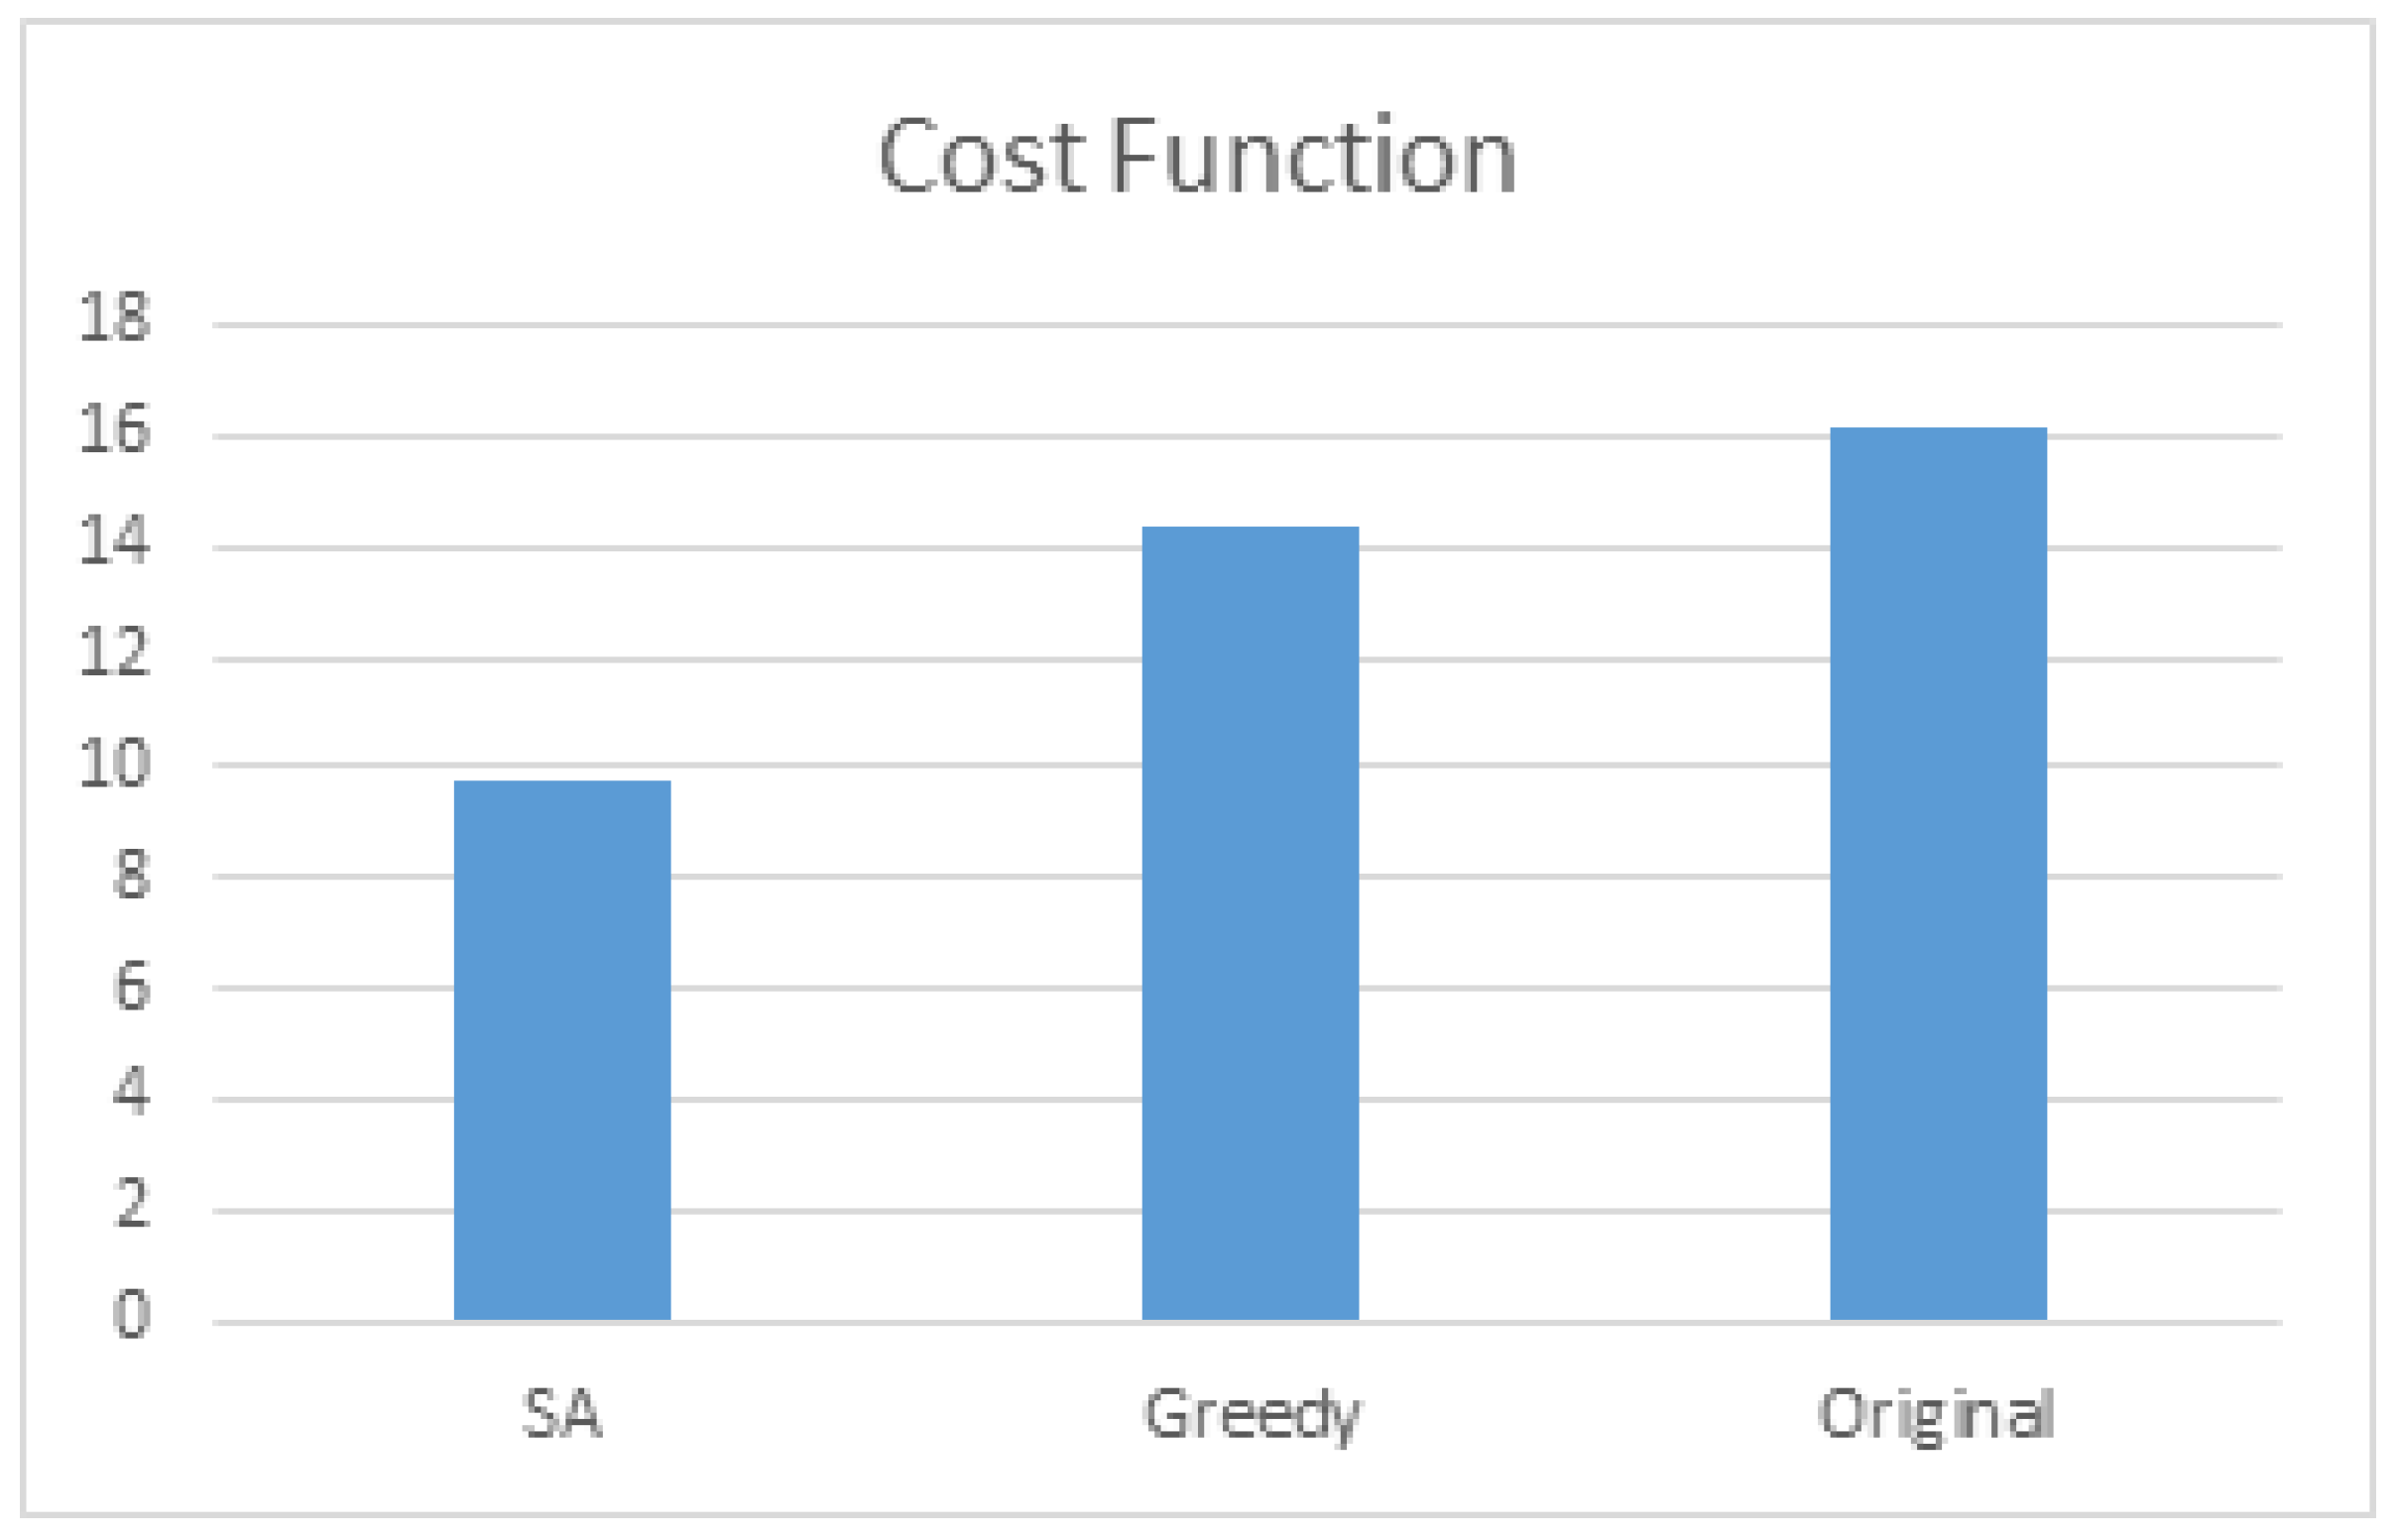
Figure 10.
Comparing total distances among hotspots for different algorithms.
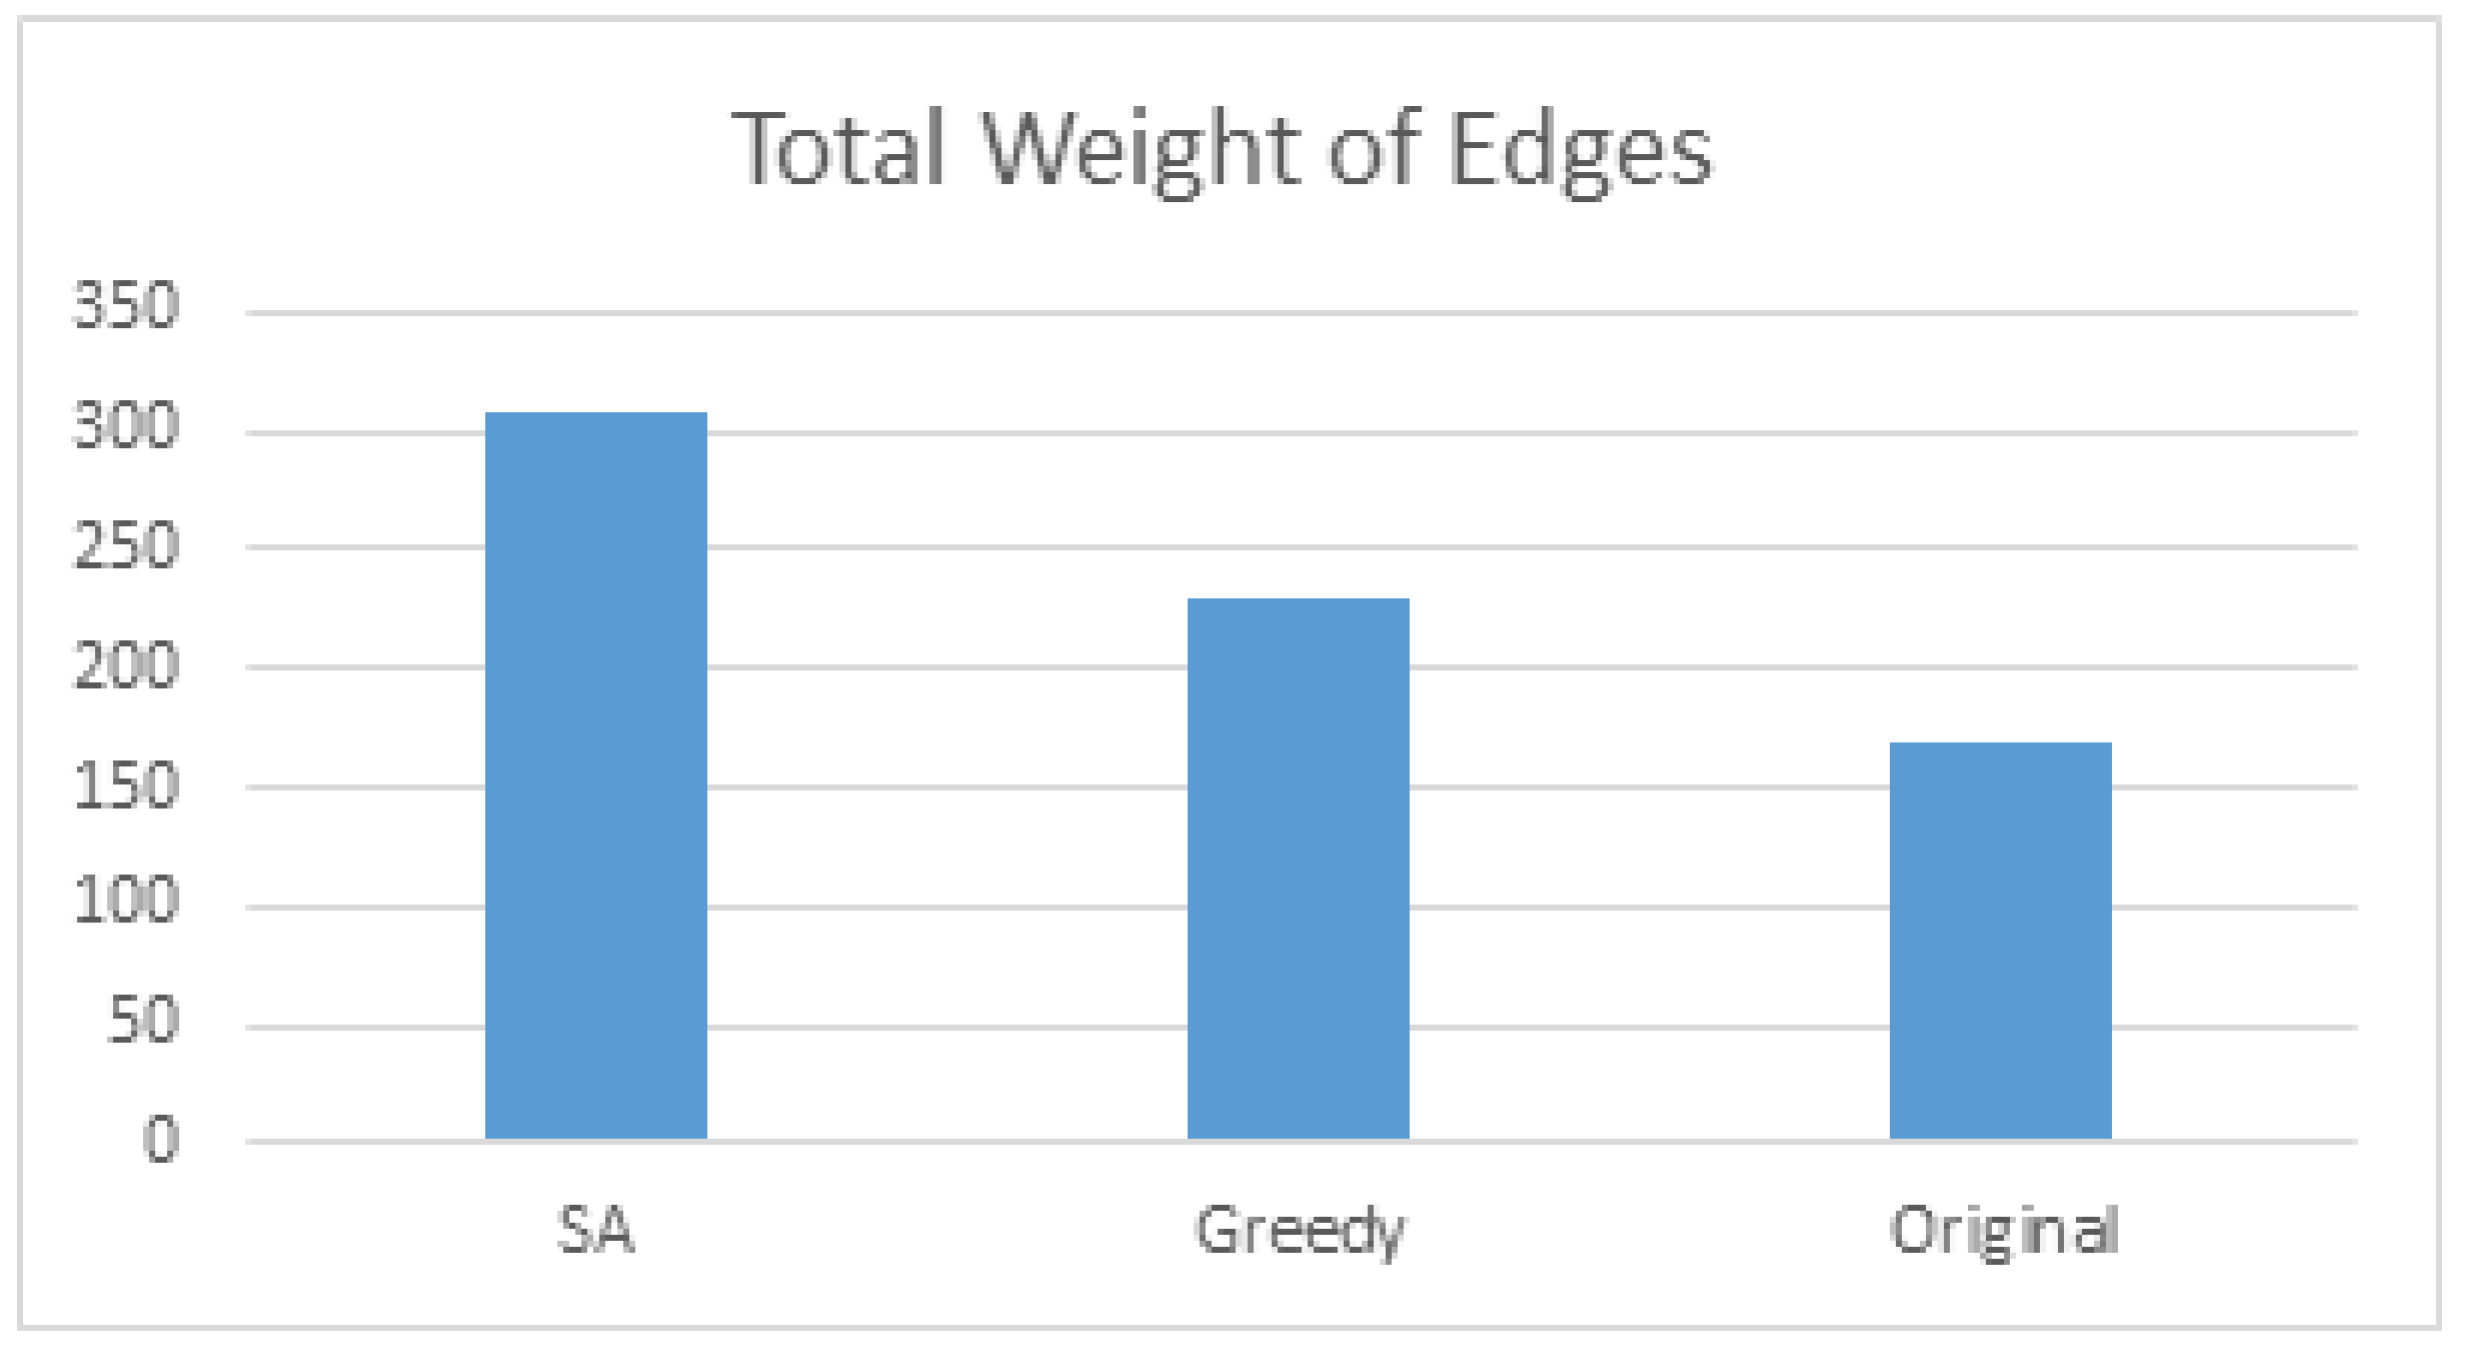
Figure 11.
Final positions of hotspots after Simulated Annealing.

Figure 12.
Hotspots for a representative MultiFunction Display.

Figure 13.
Illustrating calculation of driving performance.
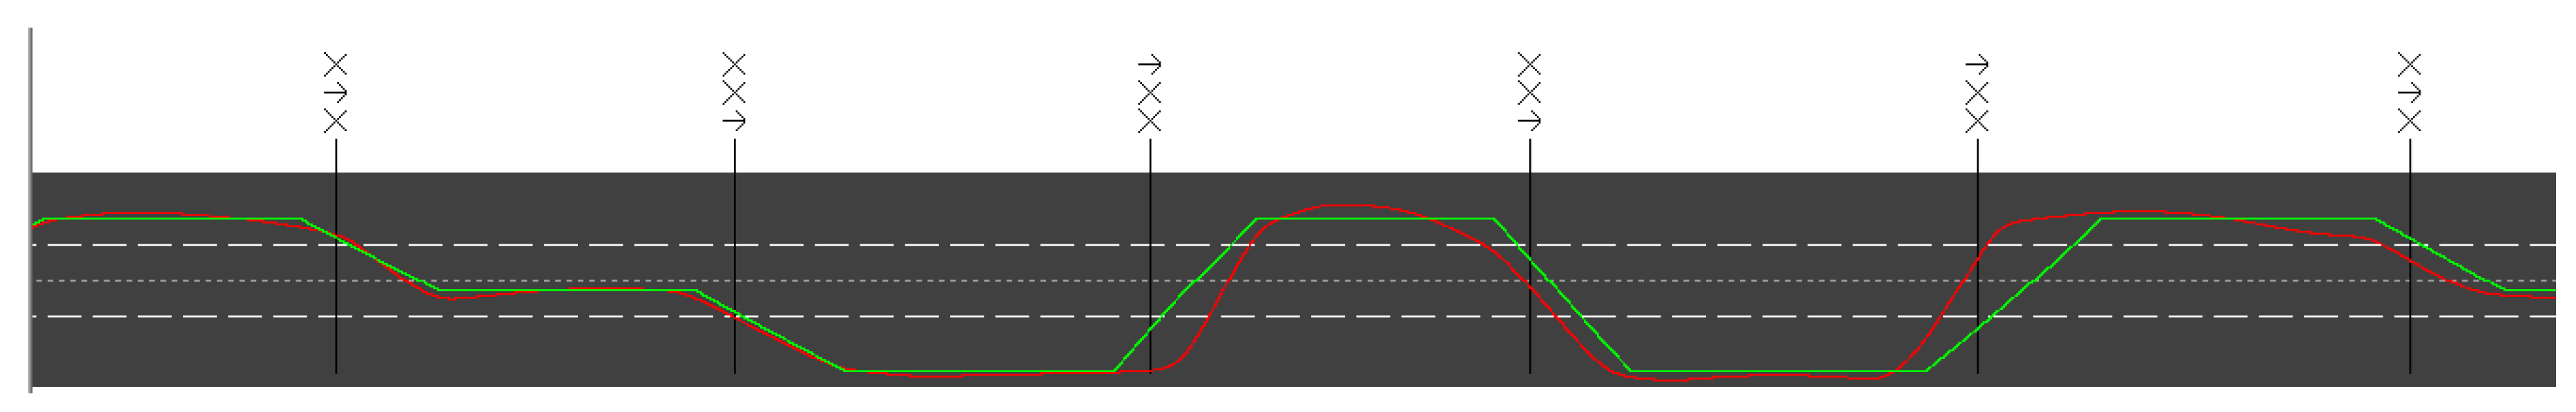
Figure 14.
Comparing Driving Performance in terms of mean deviation.
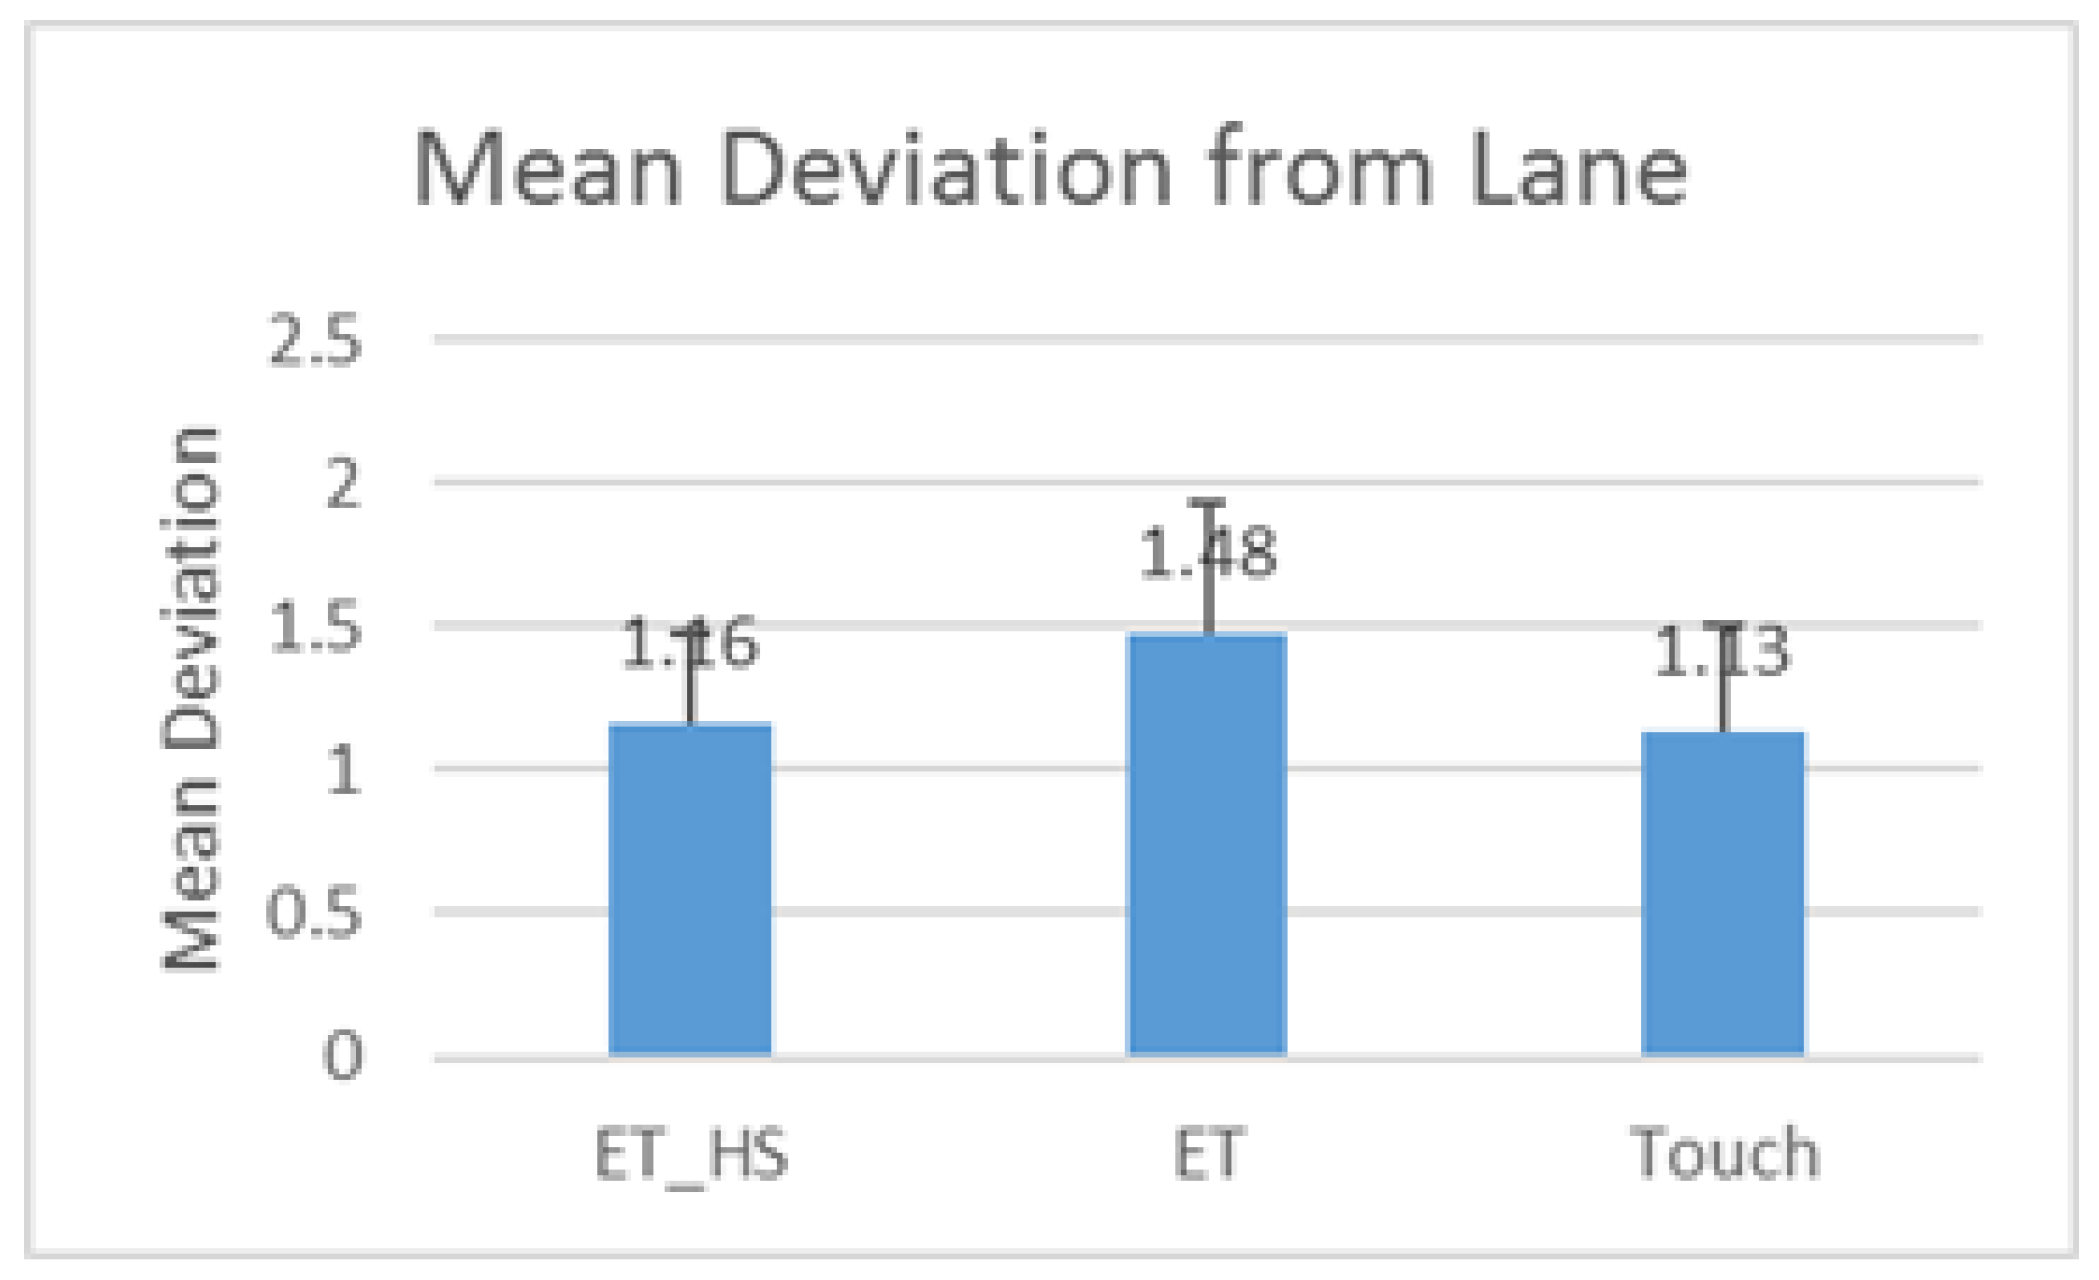
Figure 15.
Comparing Driving Performance in terms of average speed of driving.
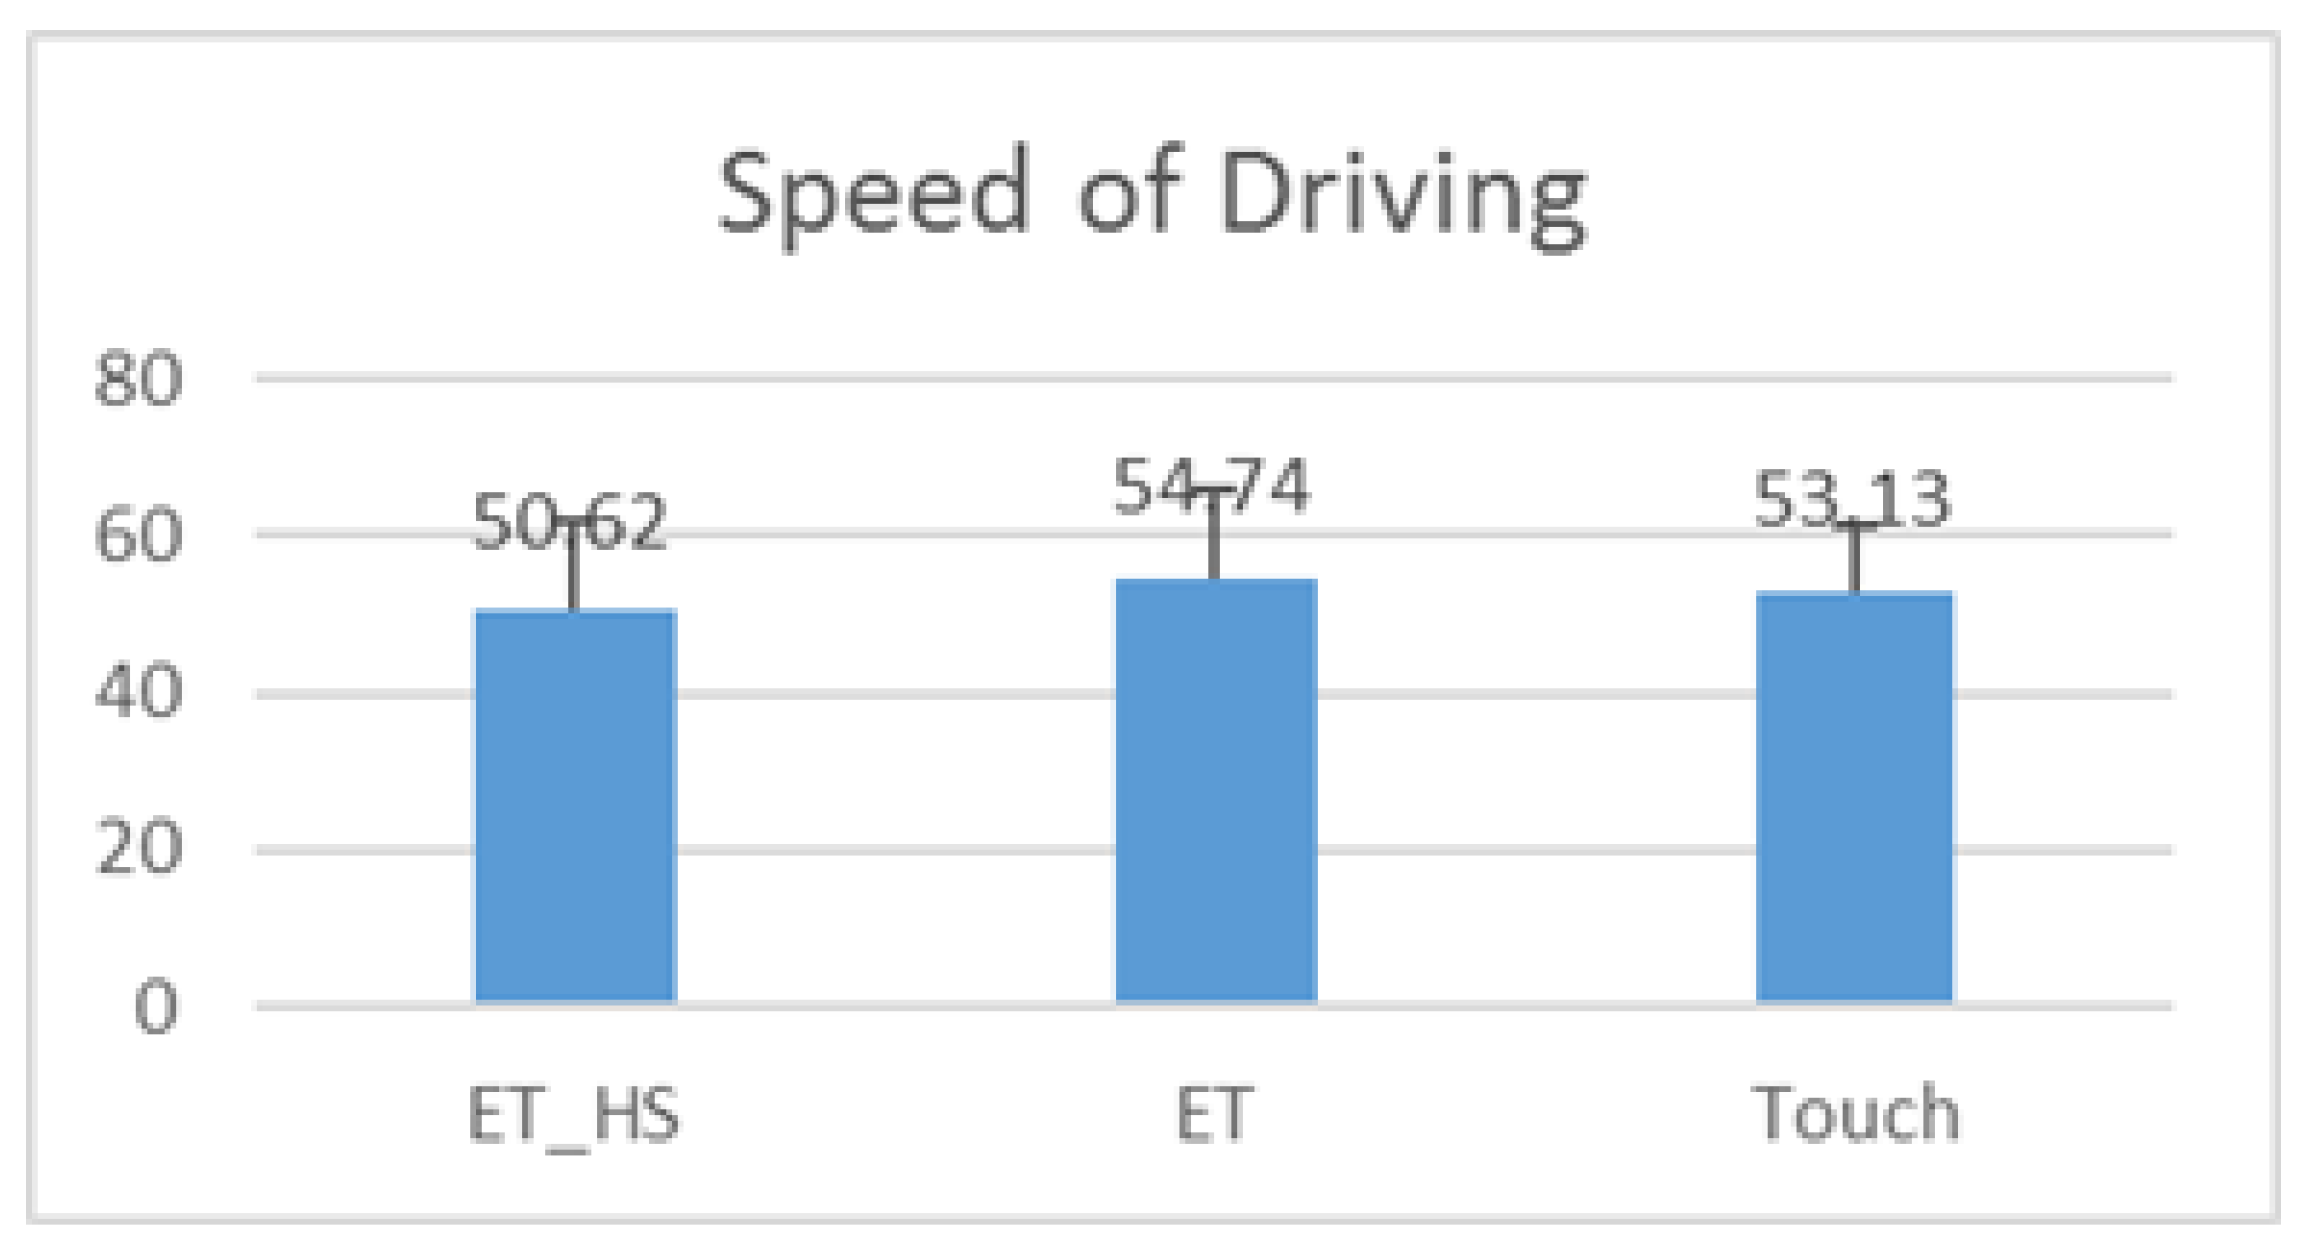
Figure 16.
Comparing Driving Performance in terms of standard deviation of steering angle.

Figure 17.
Comparing average response times.

Figure 18.
Comparing cognitive load in terms of average TLX scores.

Figure 19.
Comparing preference in terms of average SUS scores.
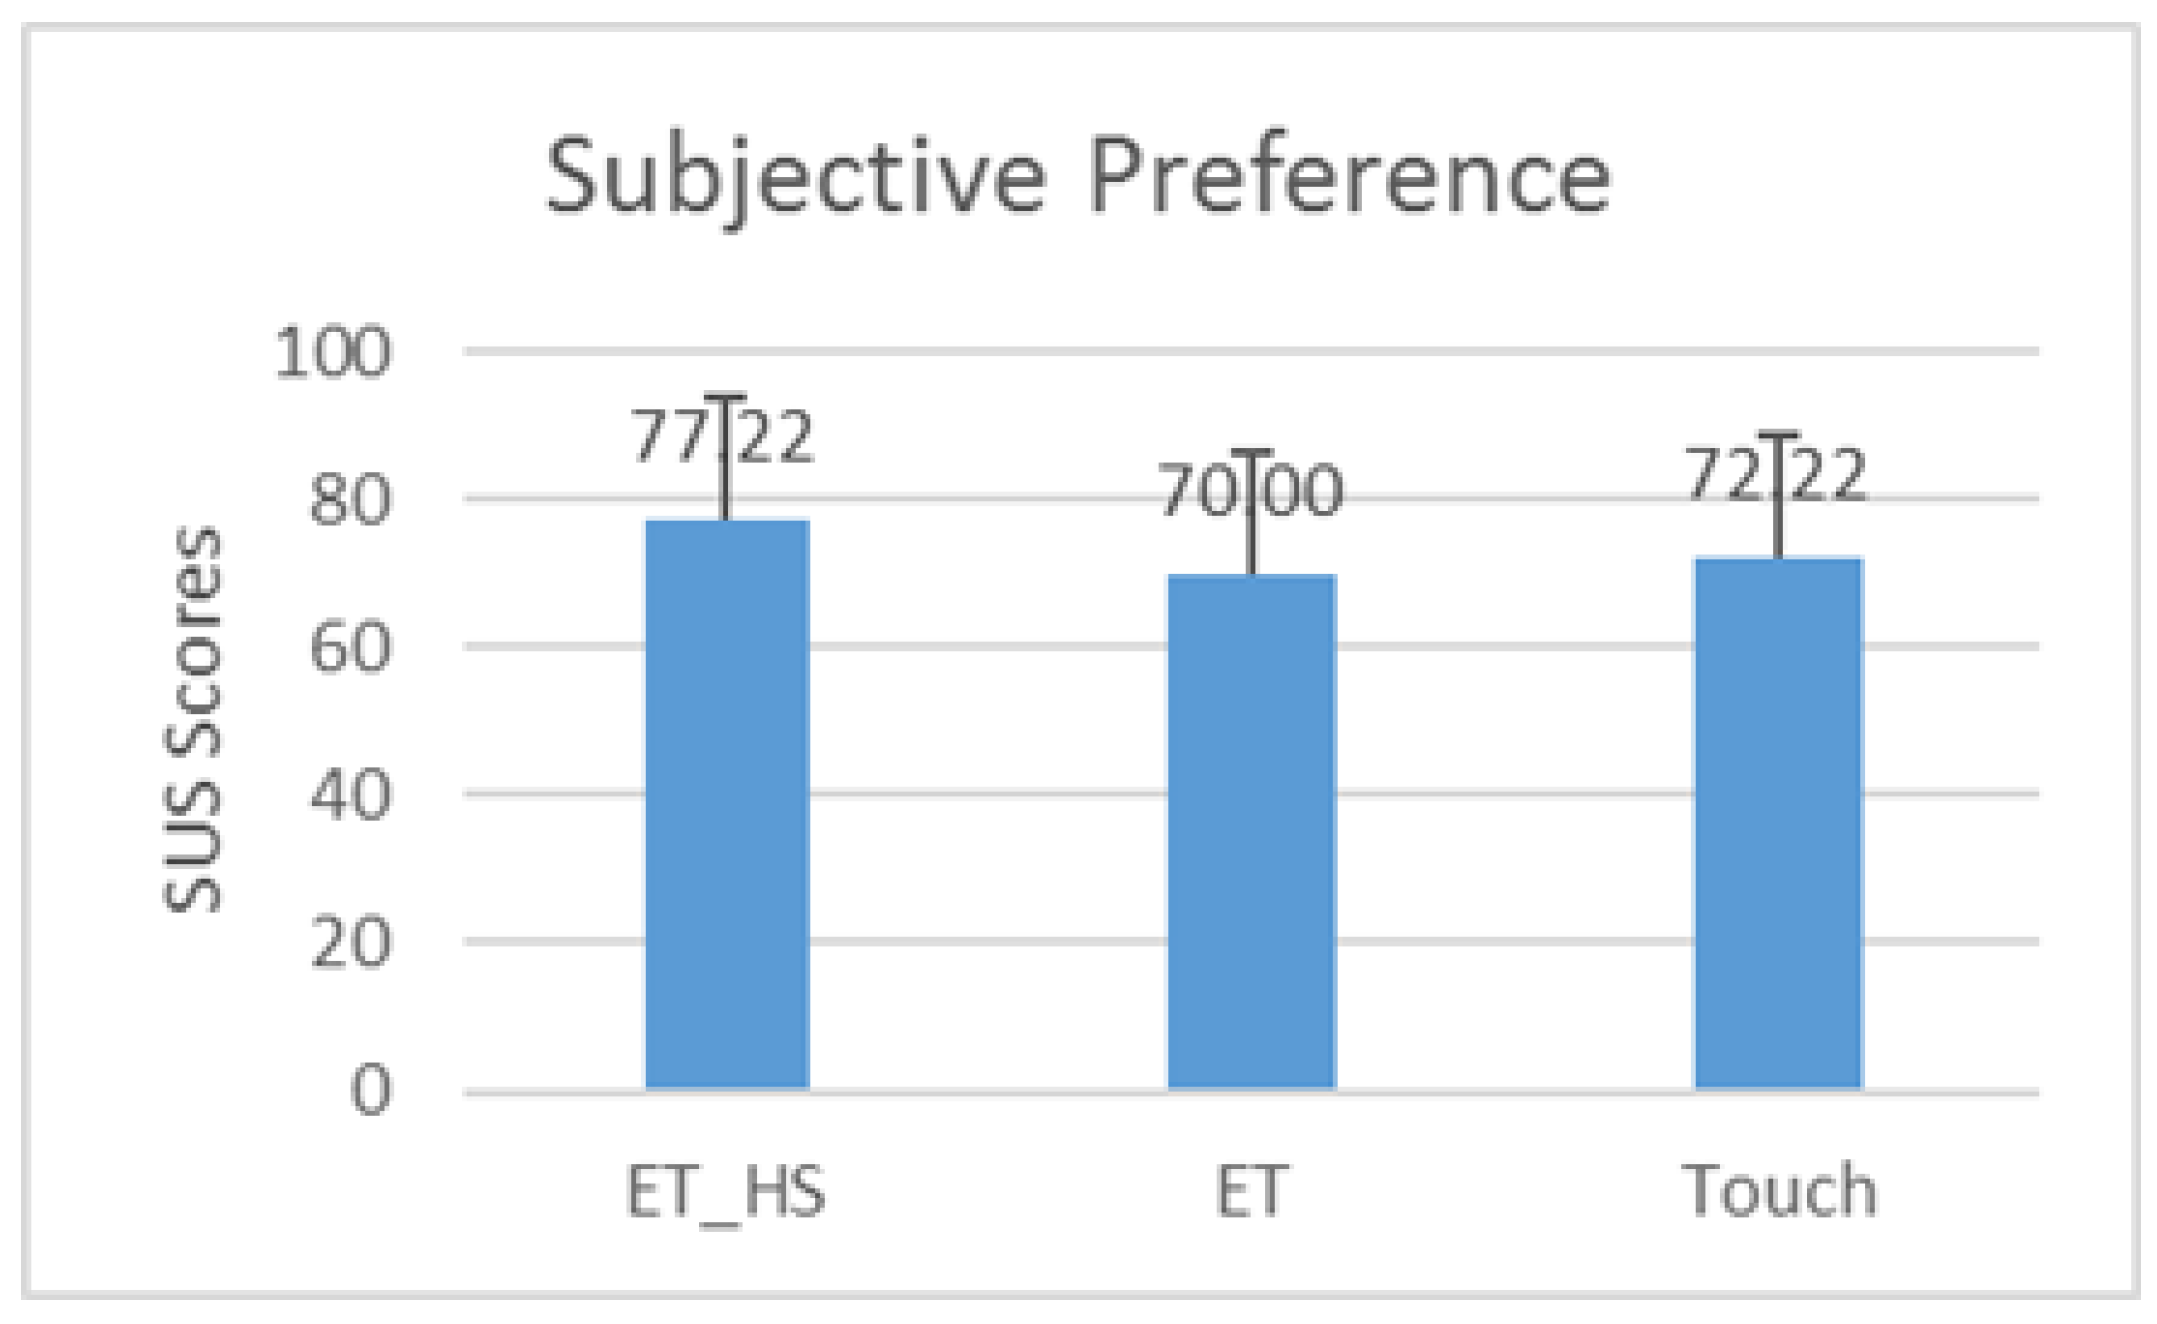
Figure 20.
Screenshot at the beginning of the task.
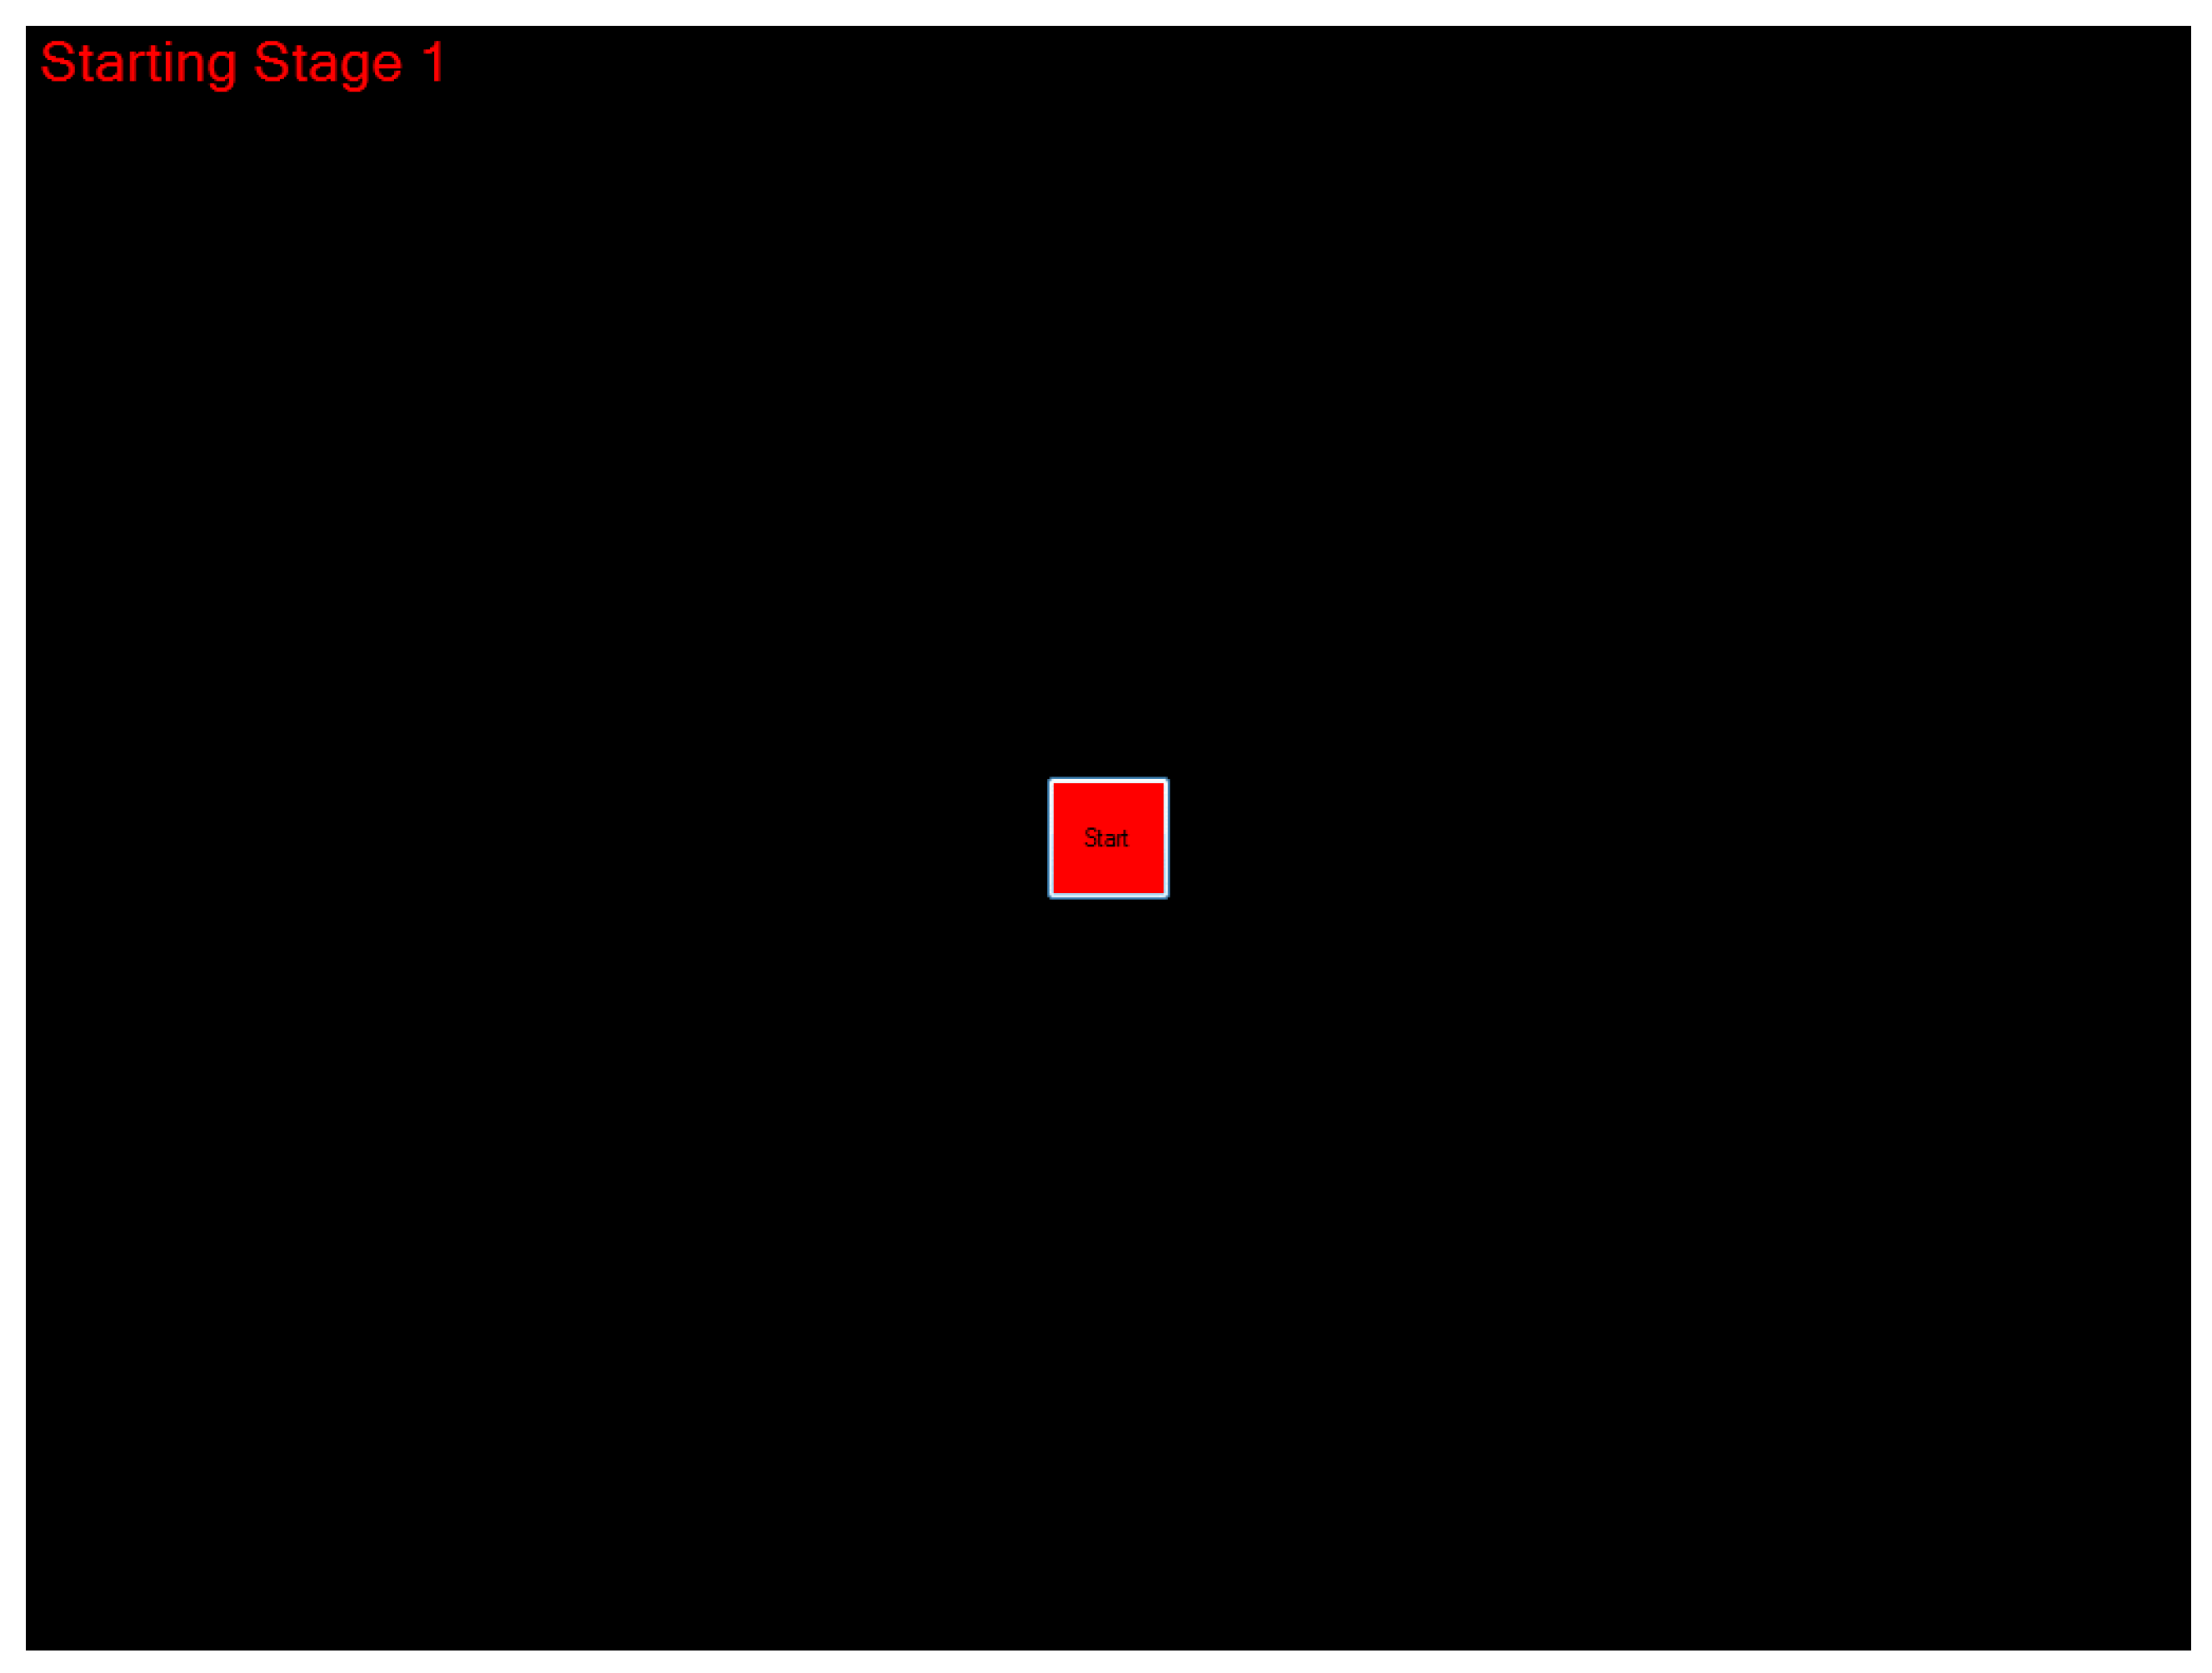
Figure 21.
Screenshot showing target and distractors.

Figure 22.
Comparing Pointing and Selection Times w.r.t. ID.

Figure 23.
Comparing cognitive load in terms of average TLX scores.

Figure 24.
Comparing preference in terms of average SUS scores.
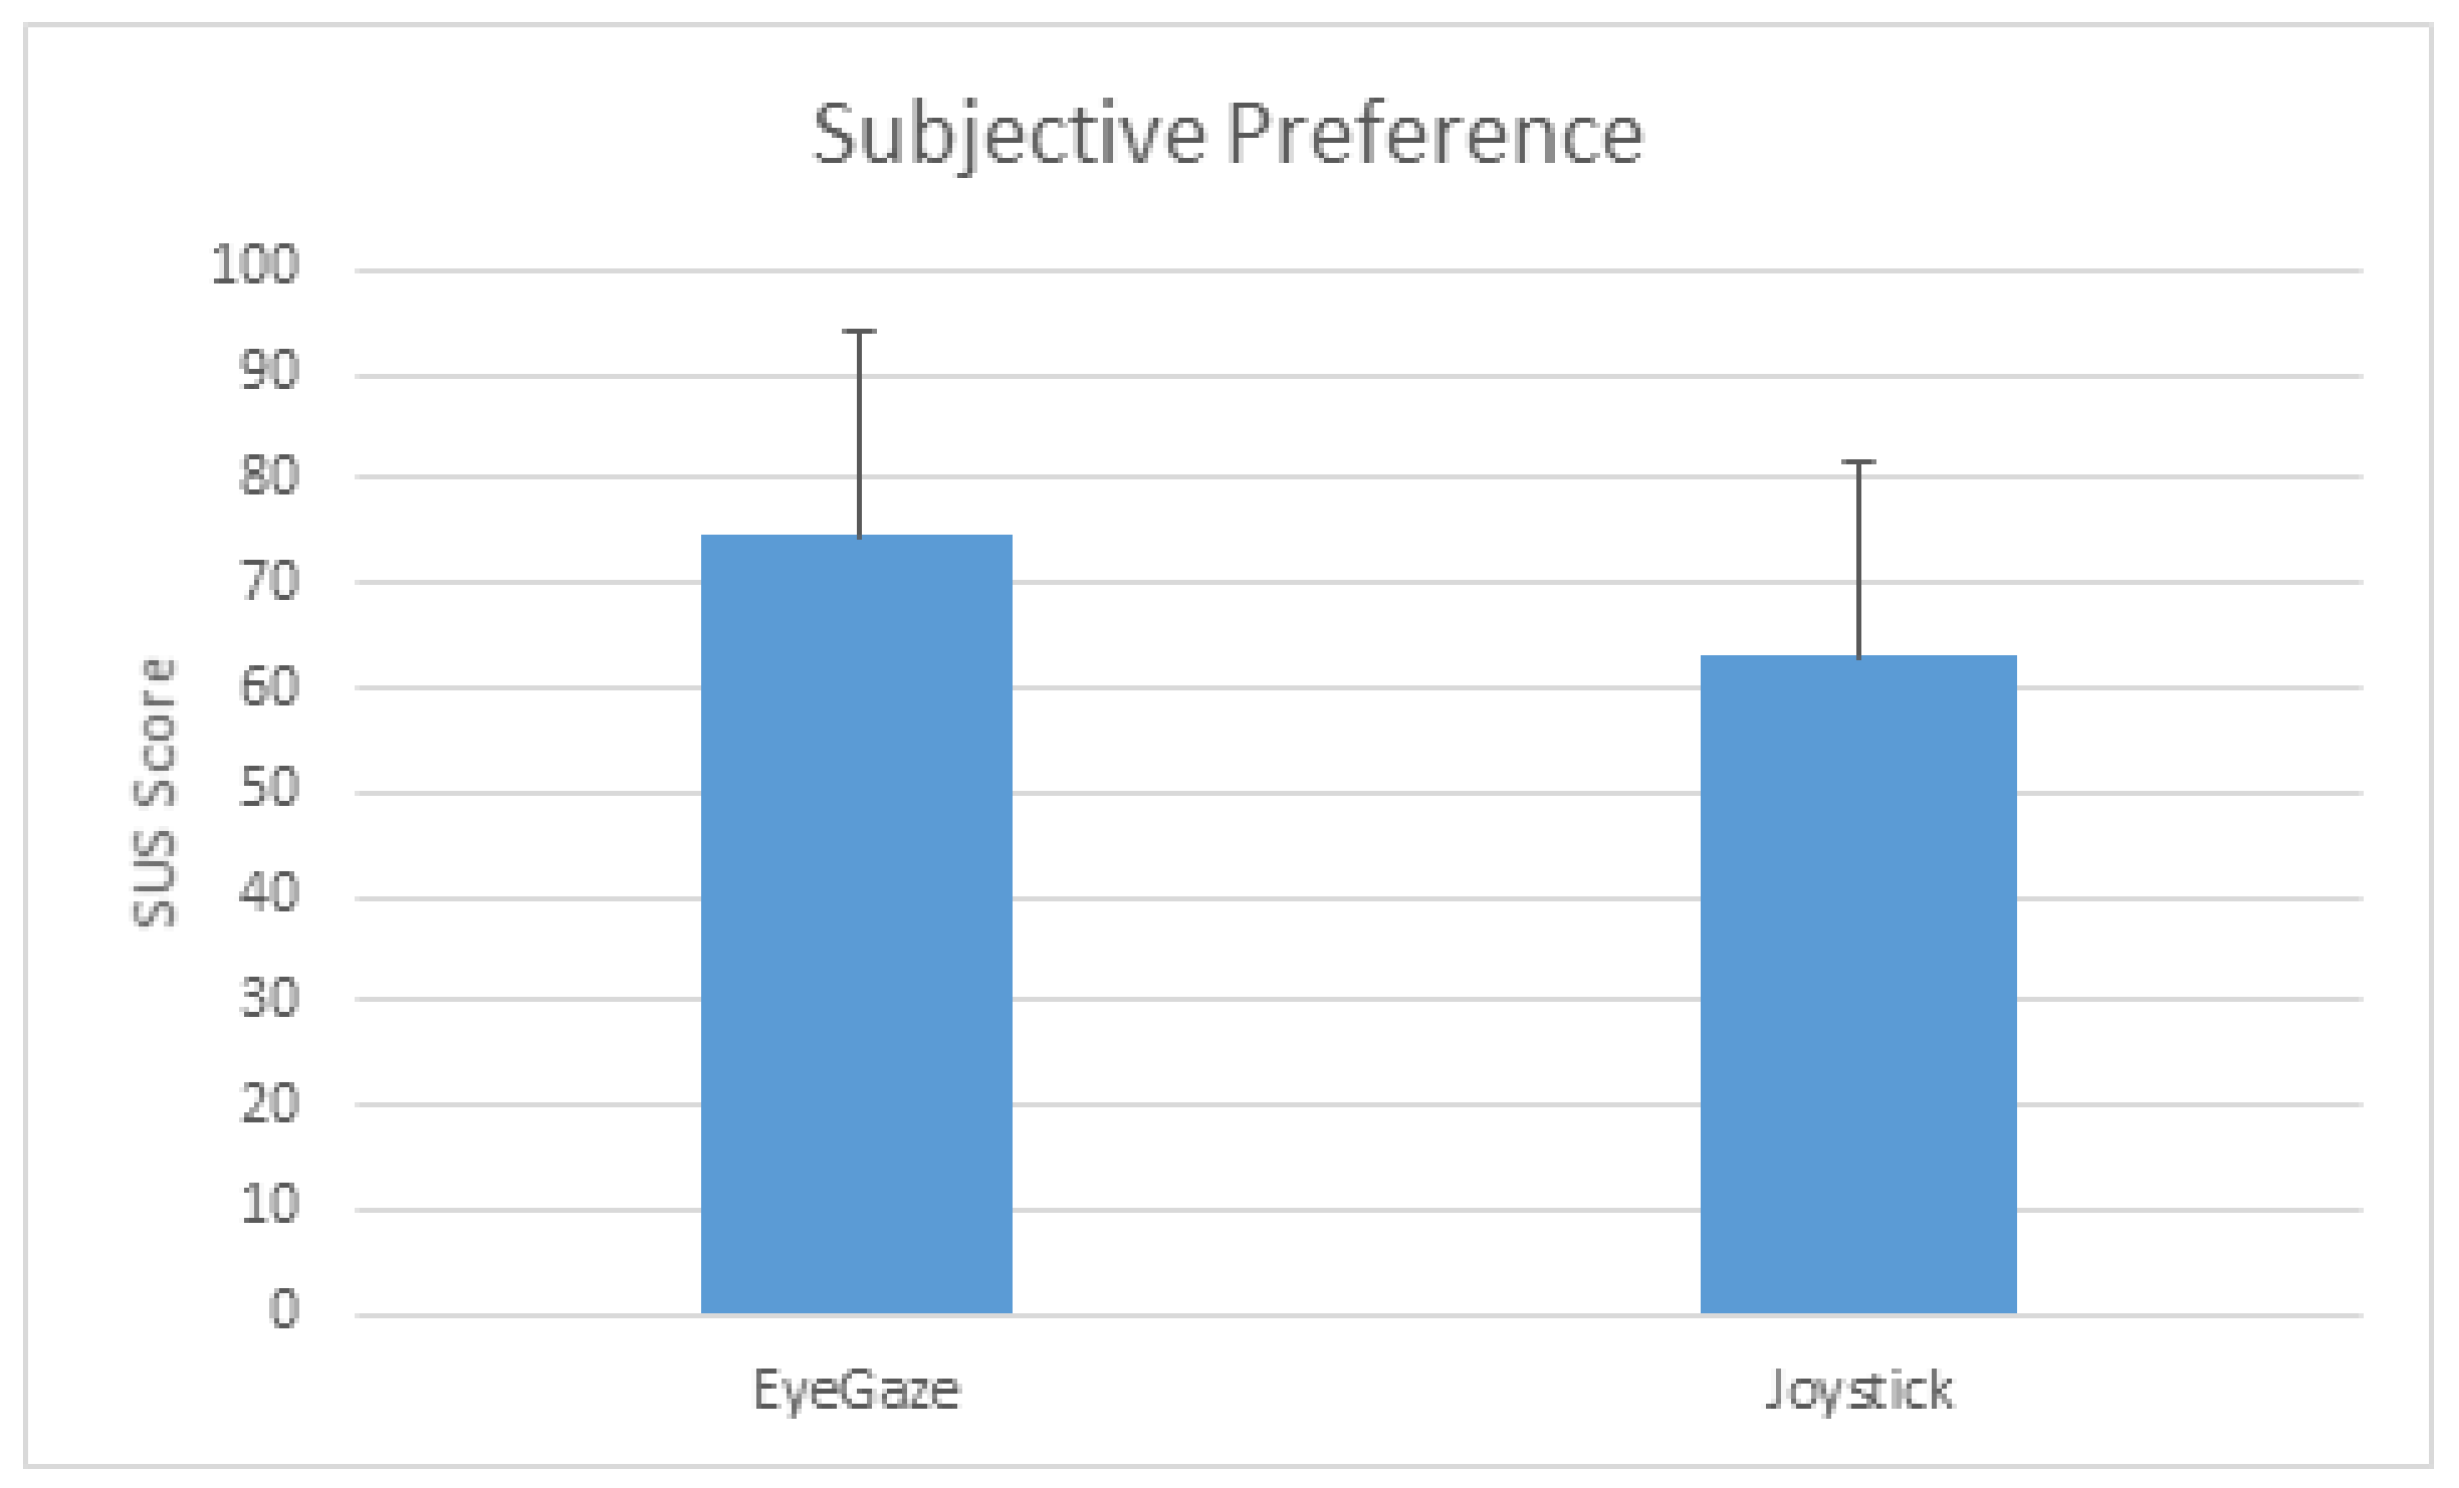
Figure 25.
Set up of gaze controlled projects display.
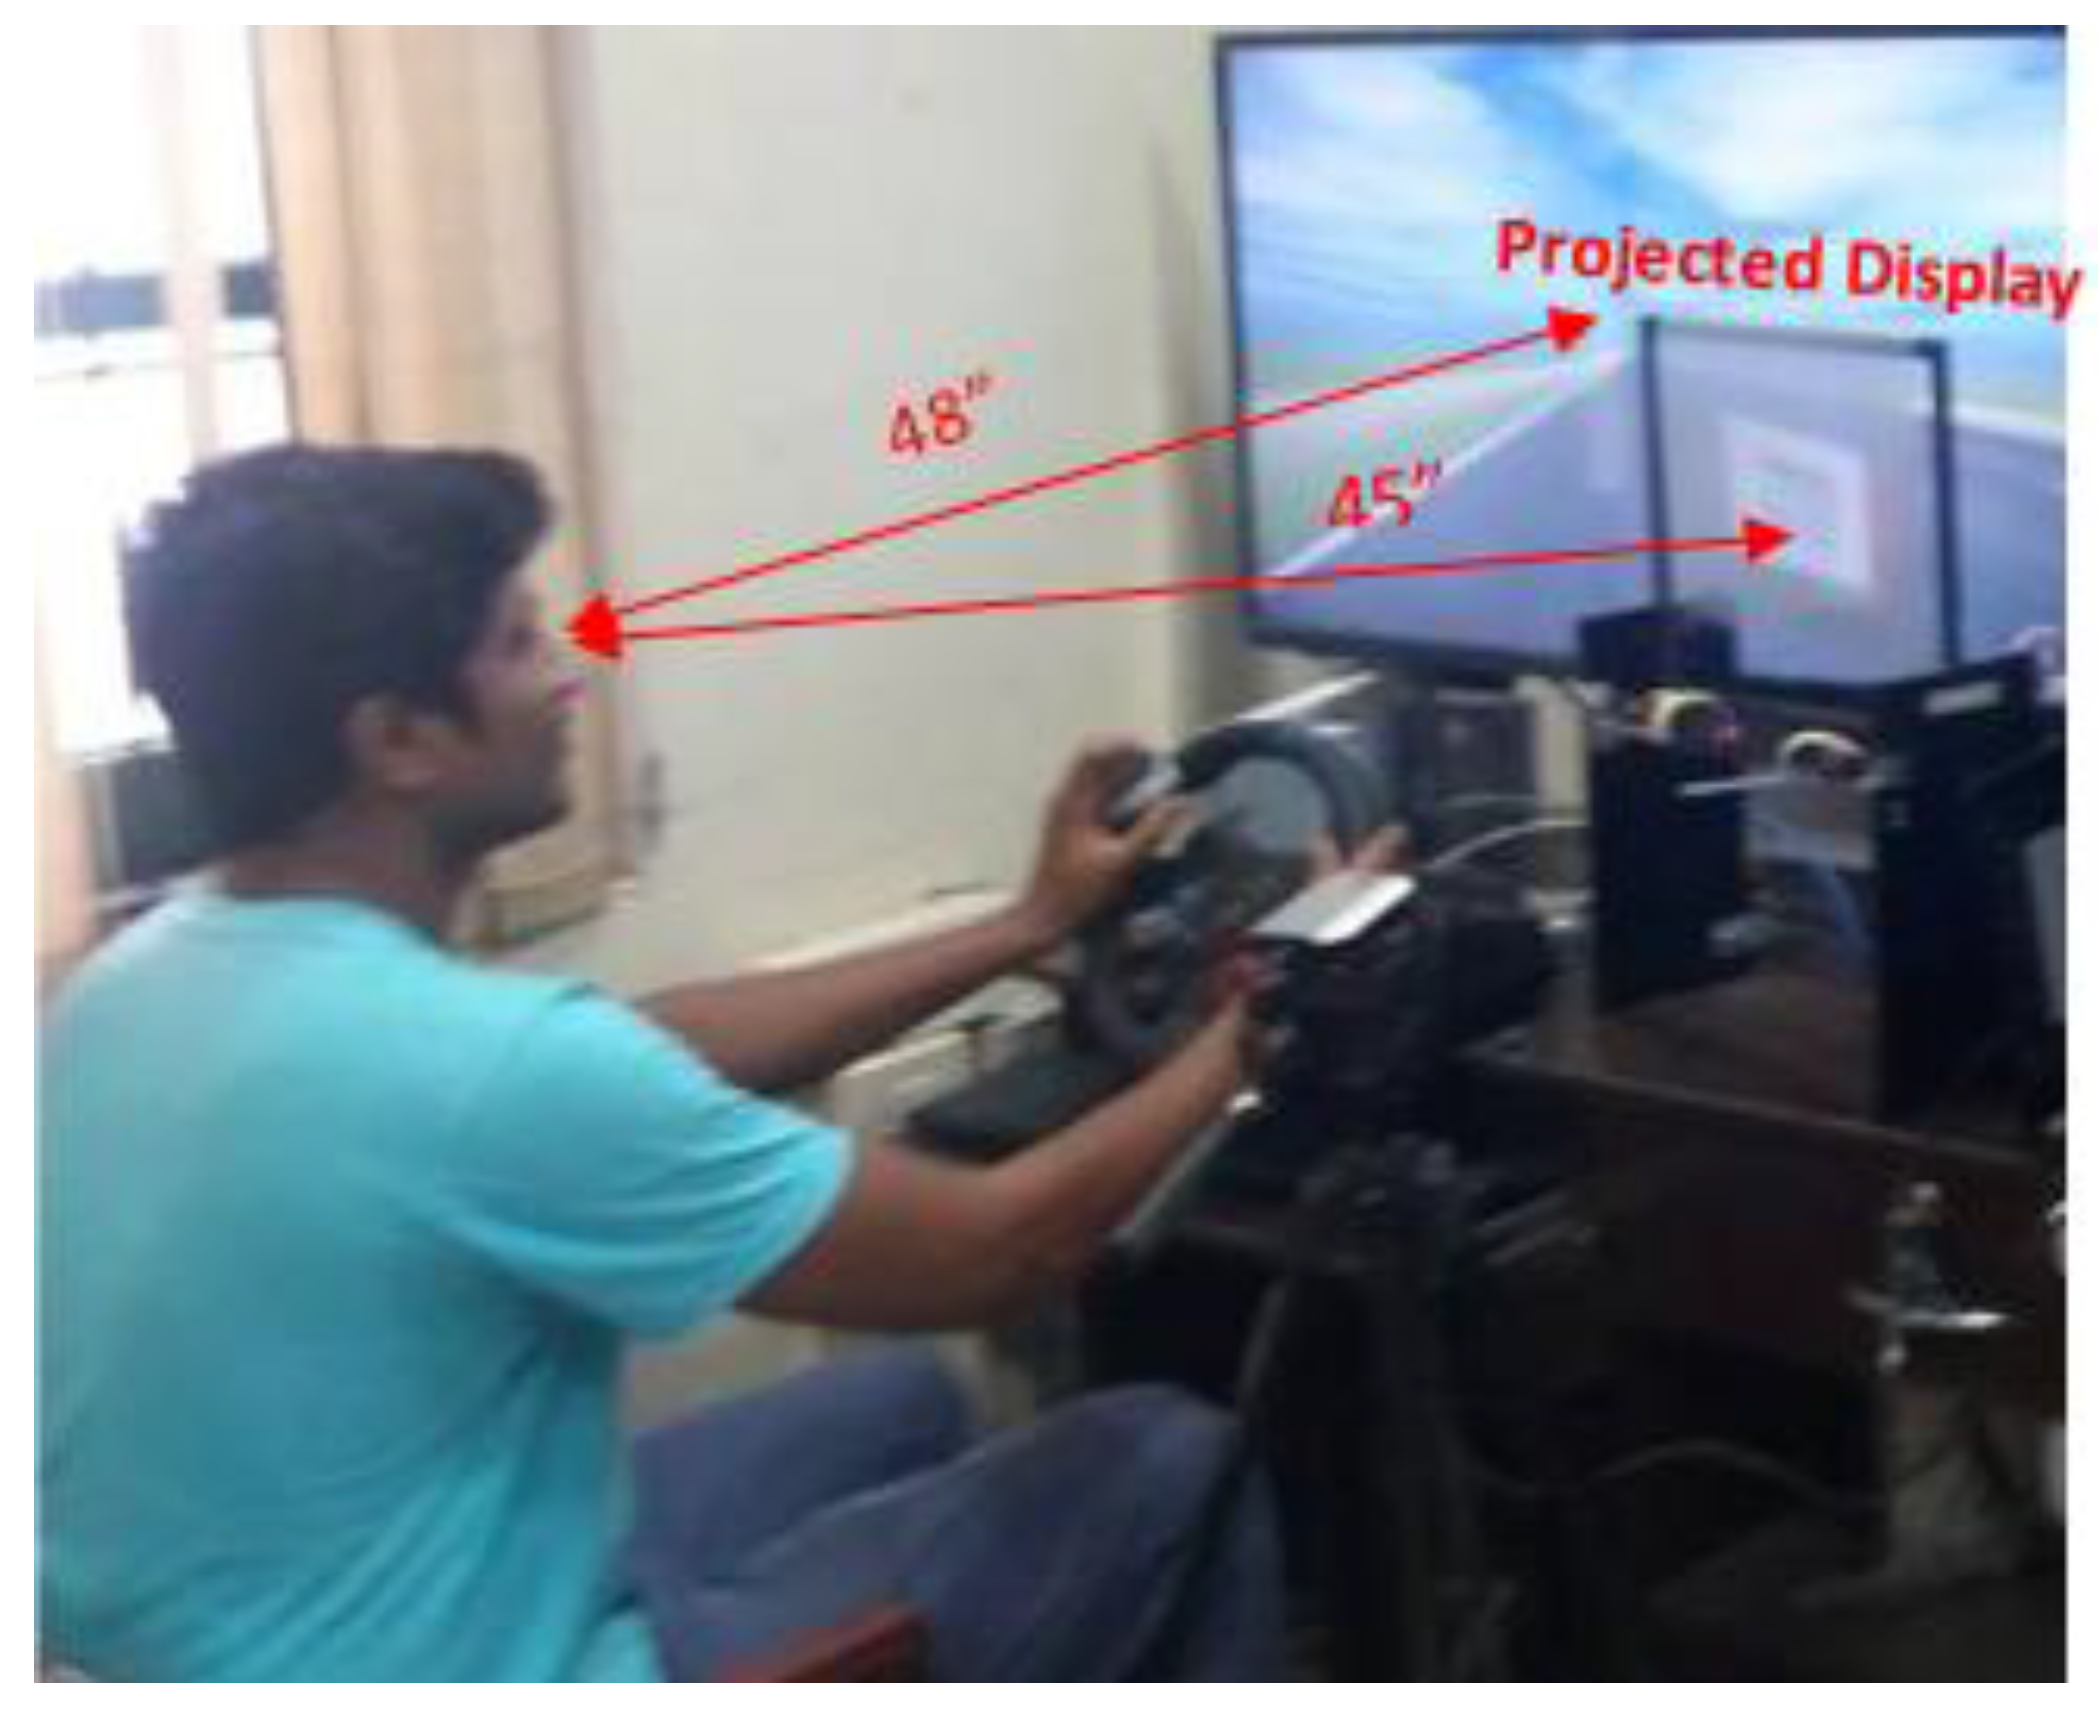
Figure 26.
Comparing Driving Performance in terms of mean deviation.
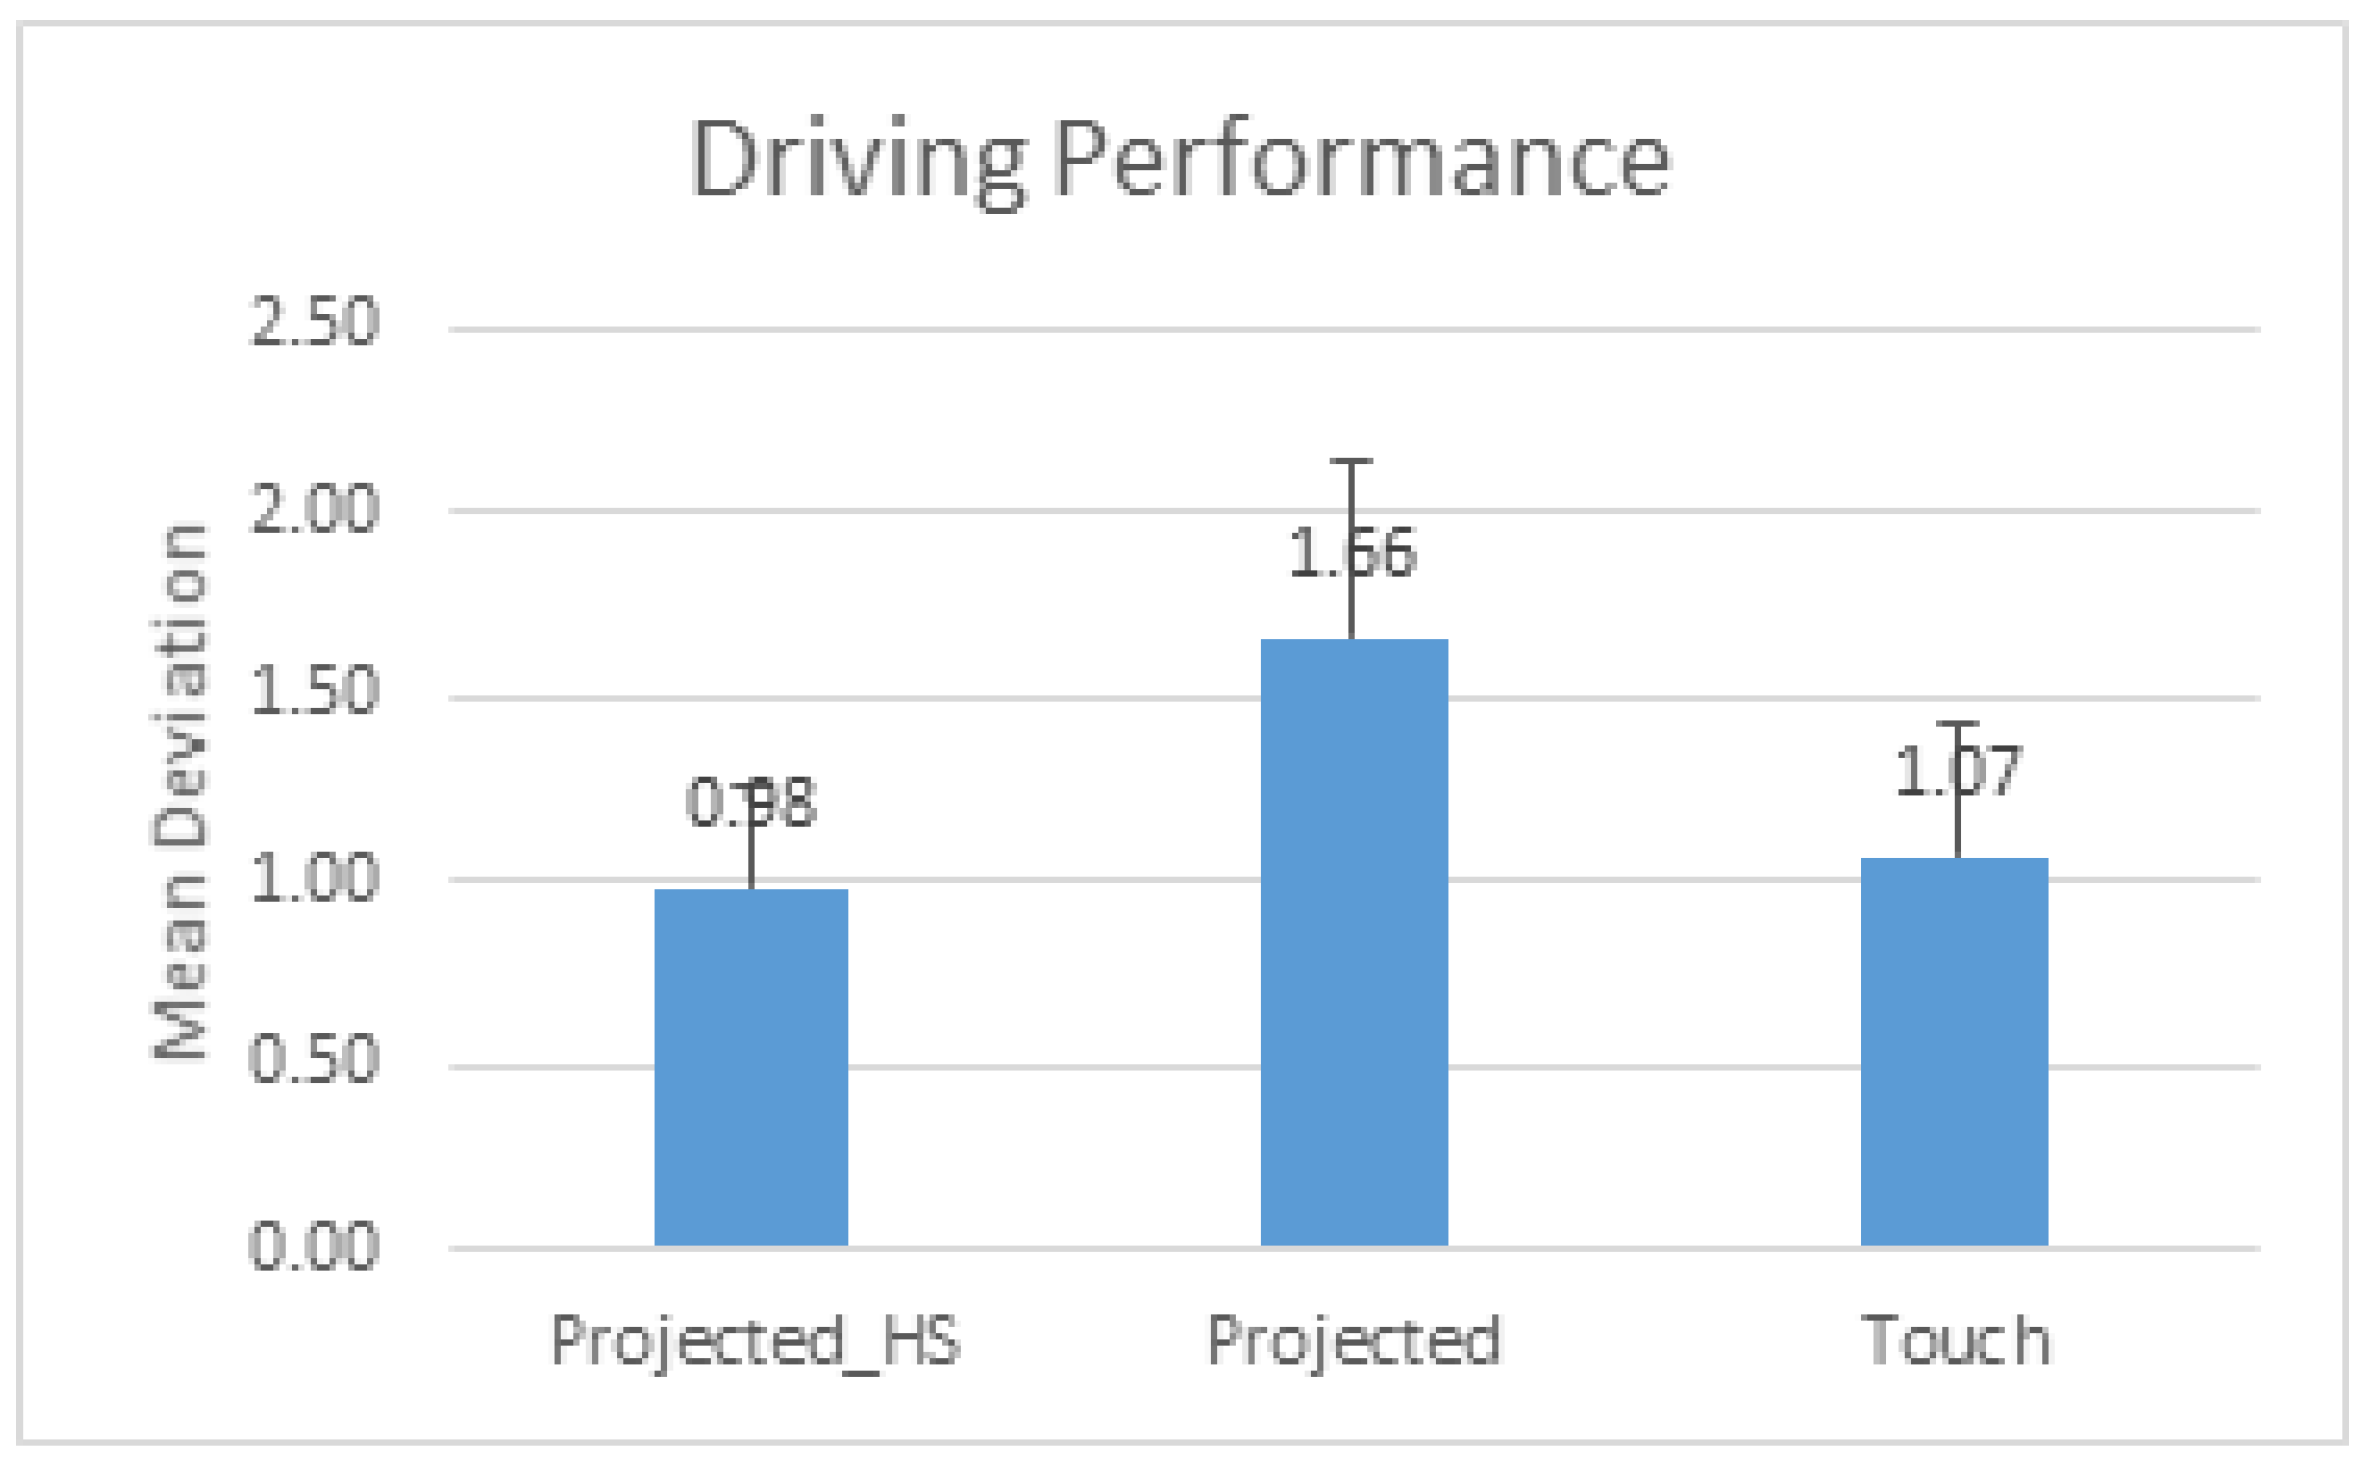
Figure 27.
Comparing Driving Performance in terms of the average speed of driving.

Figure 28.
Comparing Driving Performance in terms of standard deviation of steering angle.

Figure 29.
Comparing average response times.

Figure 30.
Comparing cognitive load in terms of average TLX scores.

Figure 31.
Comparing preference in terms of average SUS scores.

Figure 32.
Experimental setup for the flight simulator.

Figure 33.
Quality of flying w.r.t. change in altitude.

Figure 34.
Analysing response times in flight simulator.
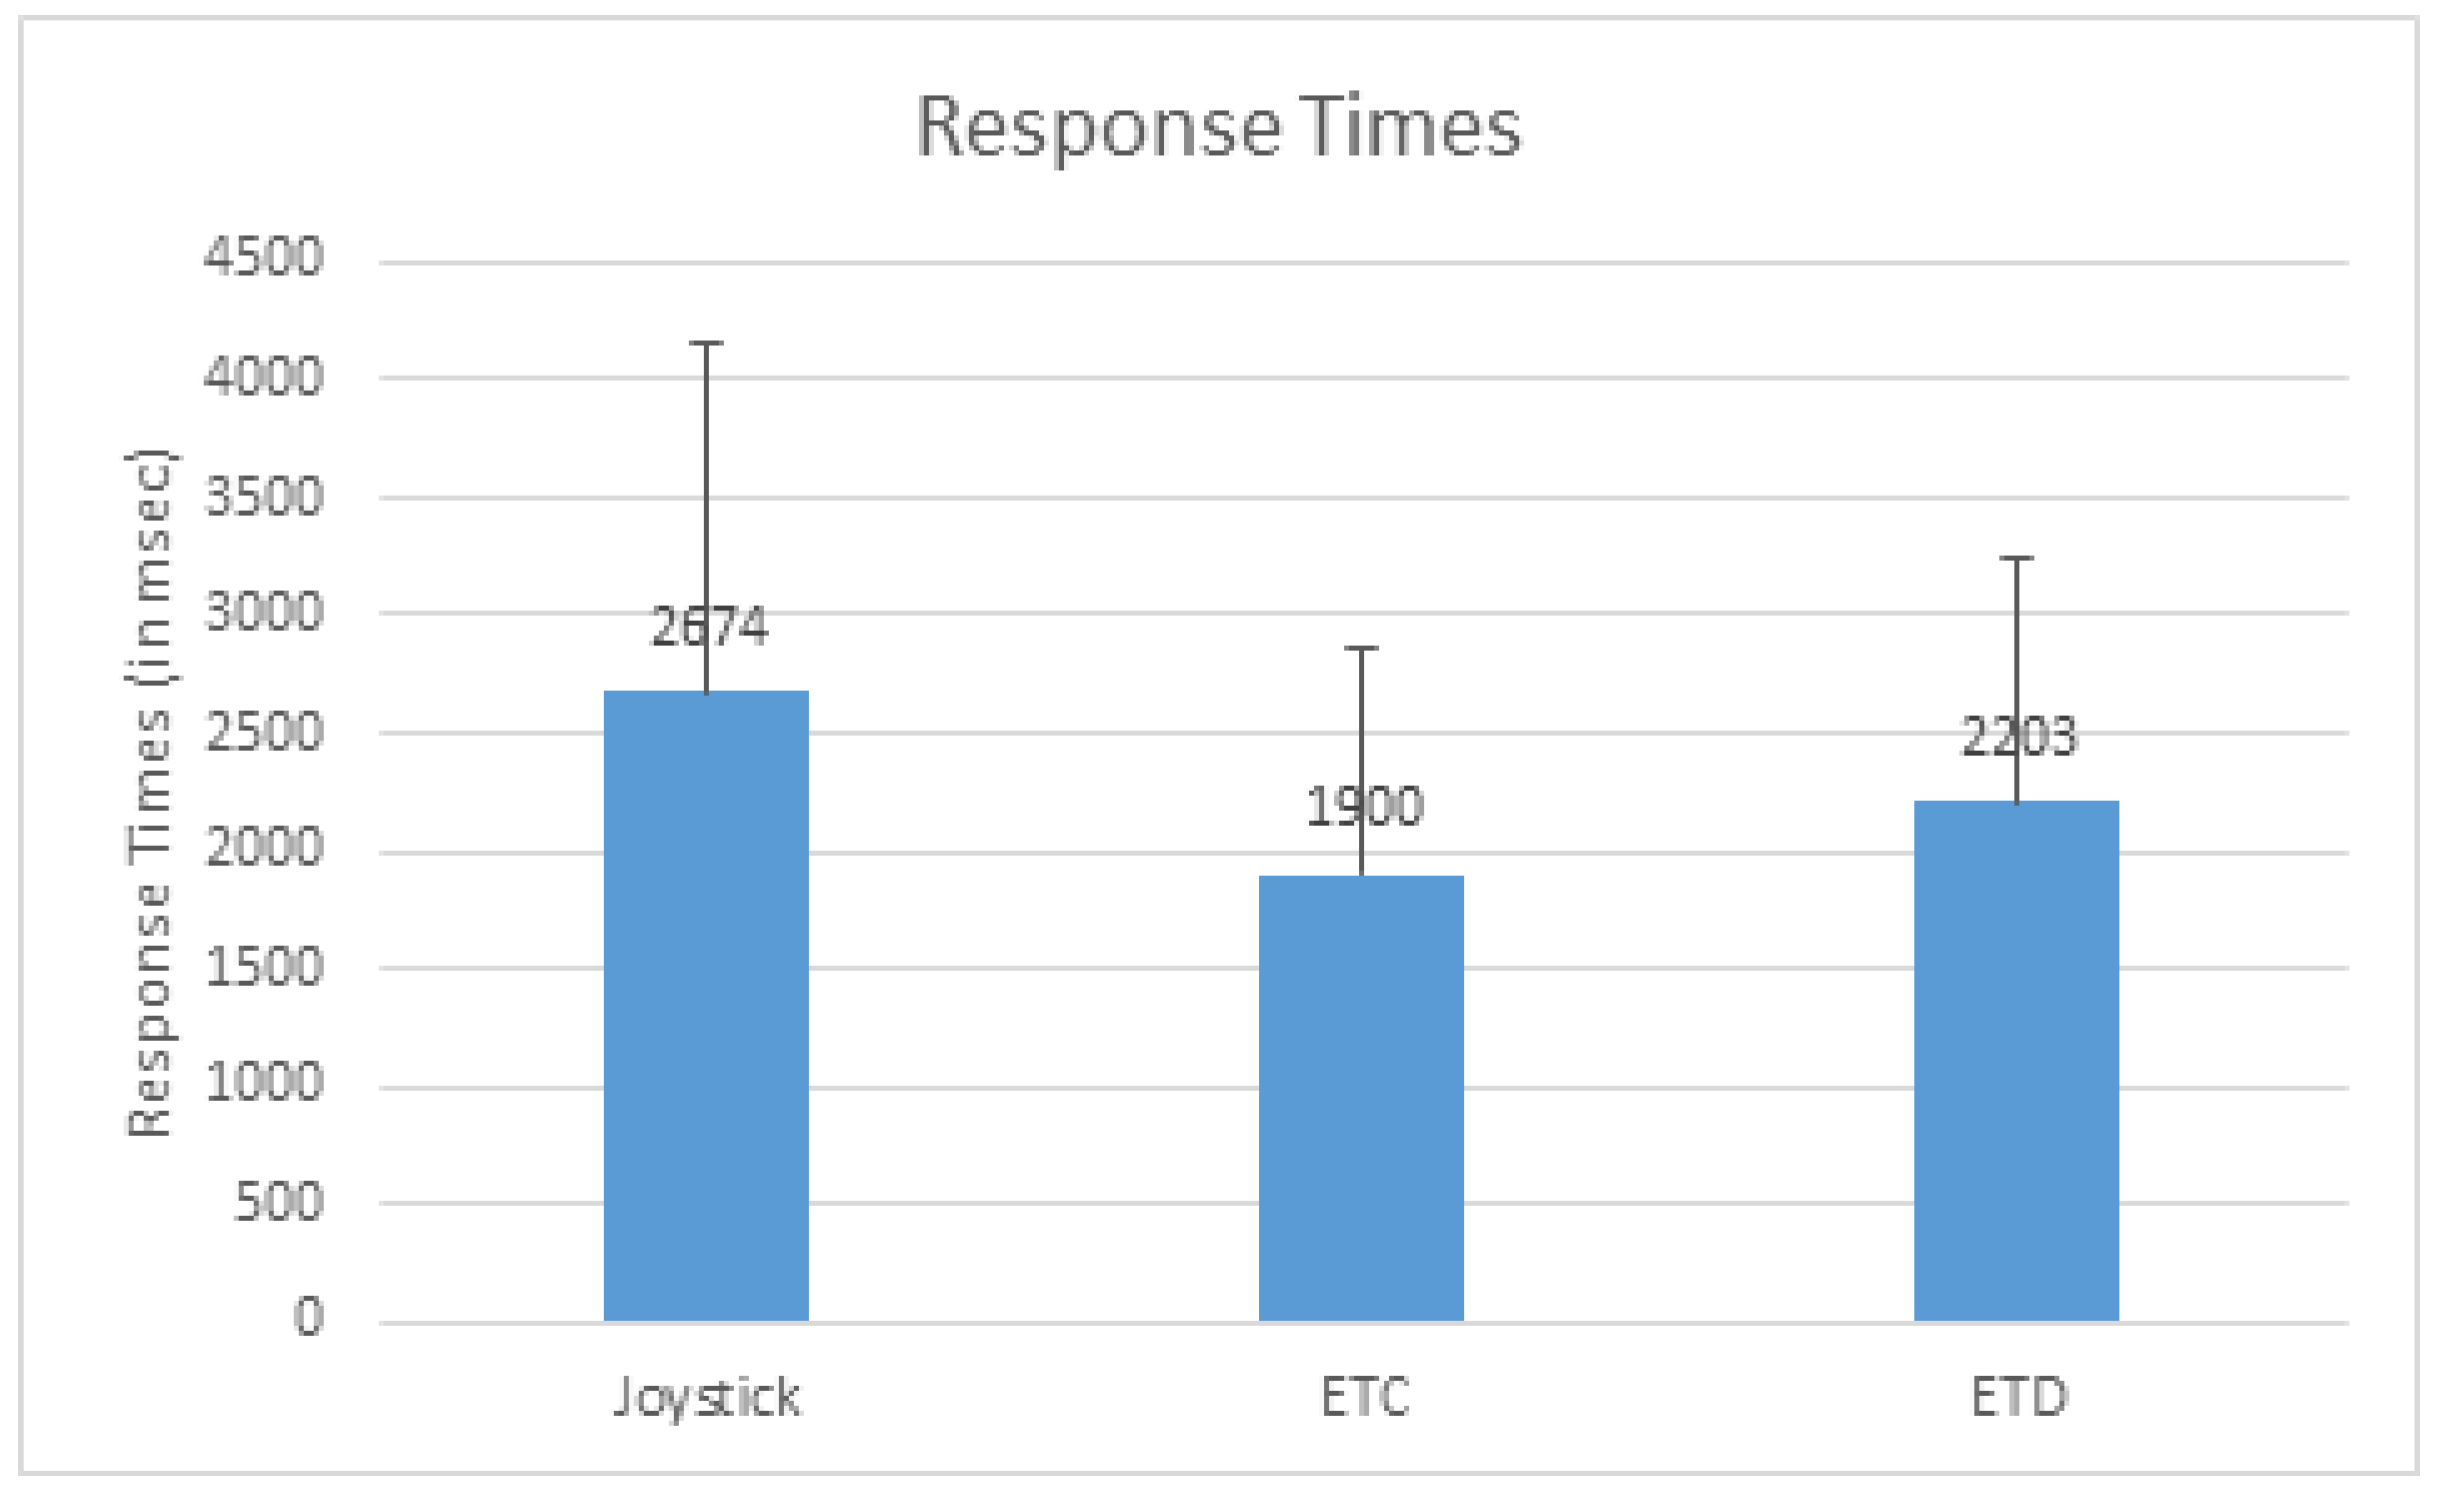
Figure 35.
Analysing error in the flight simulator.
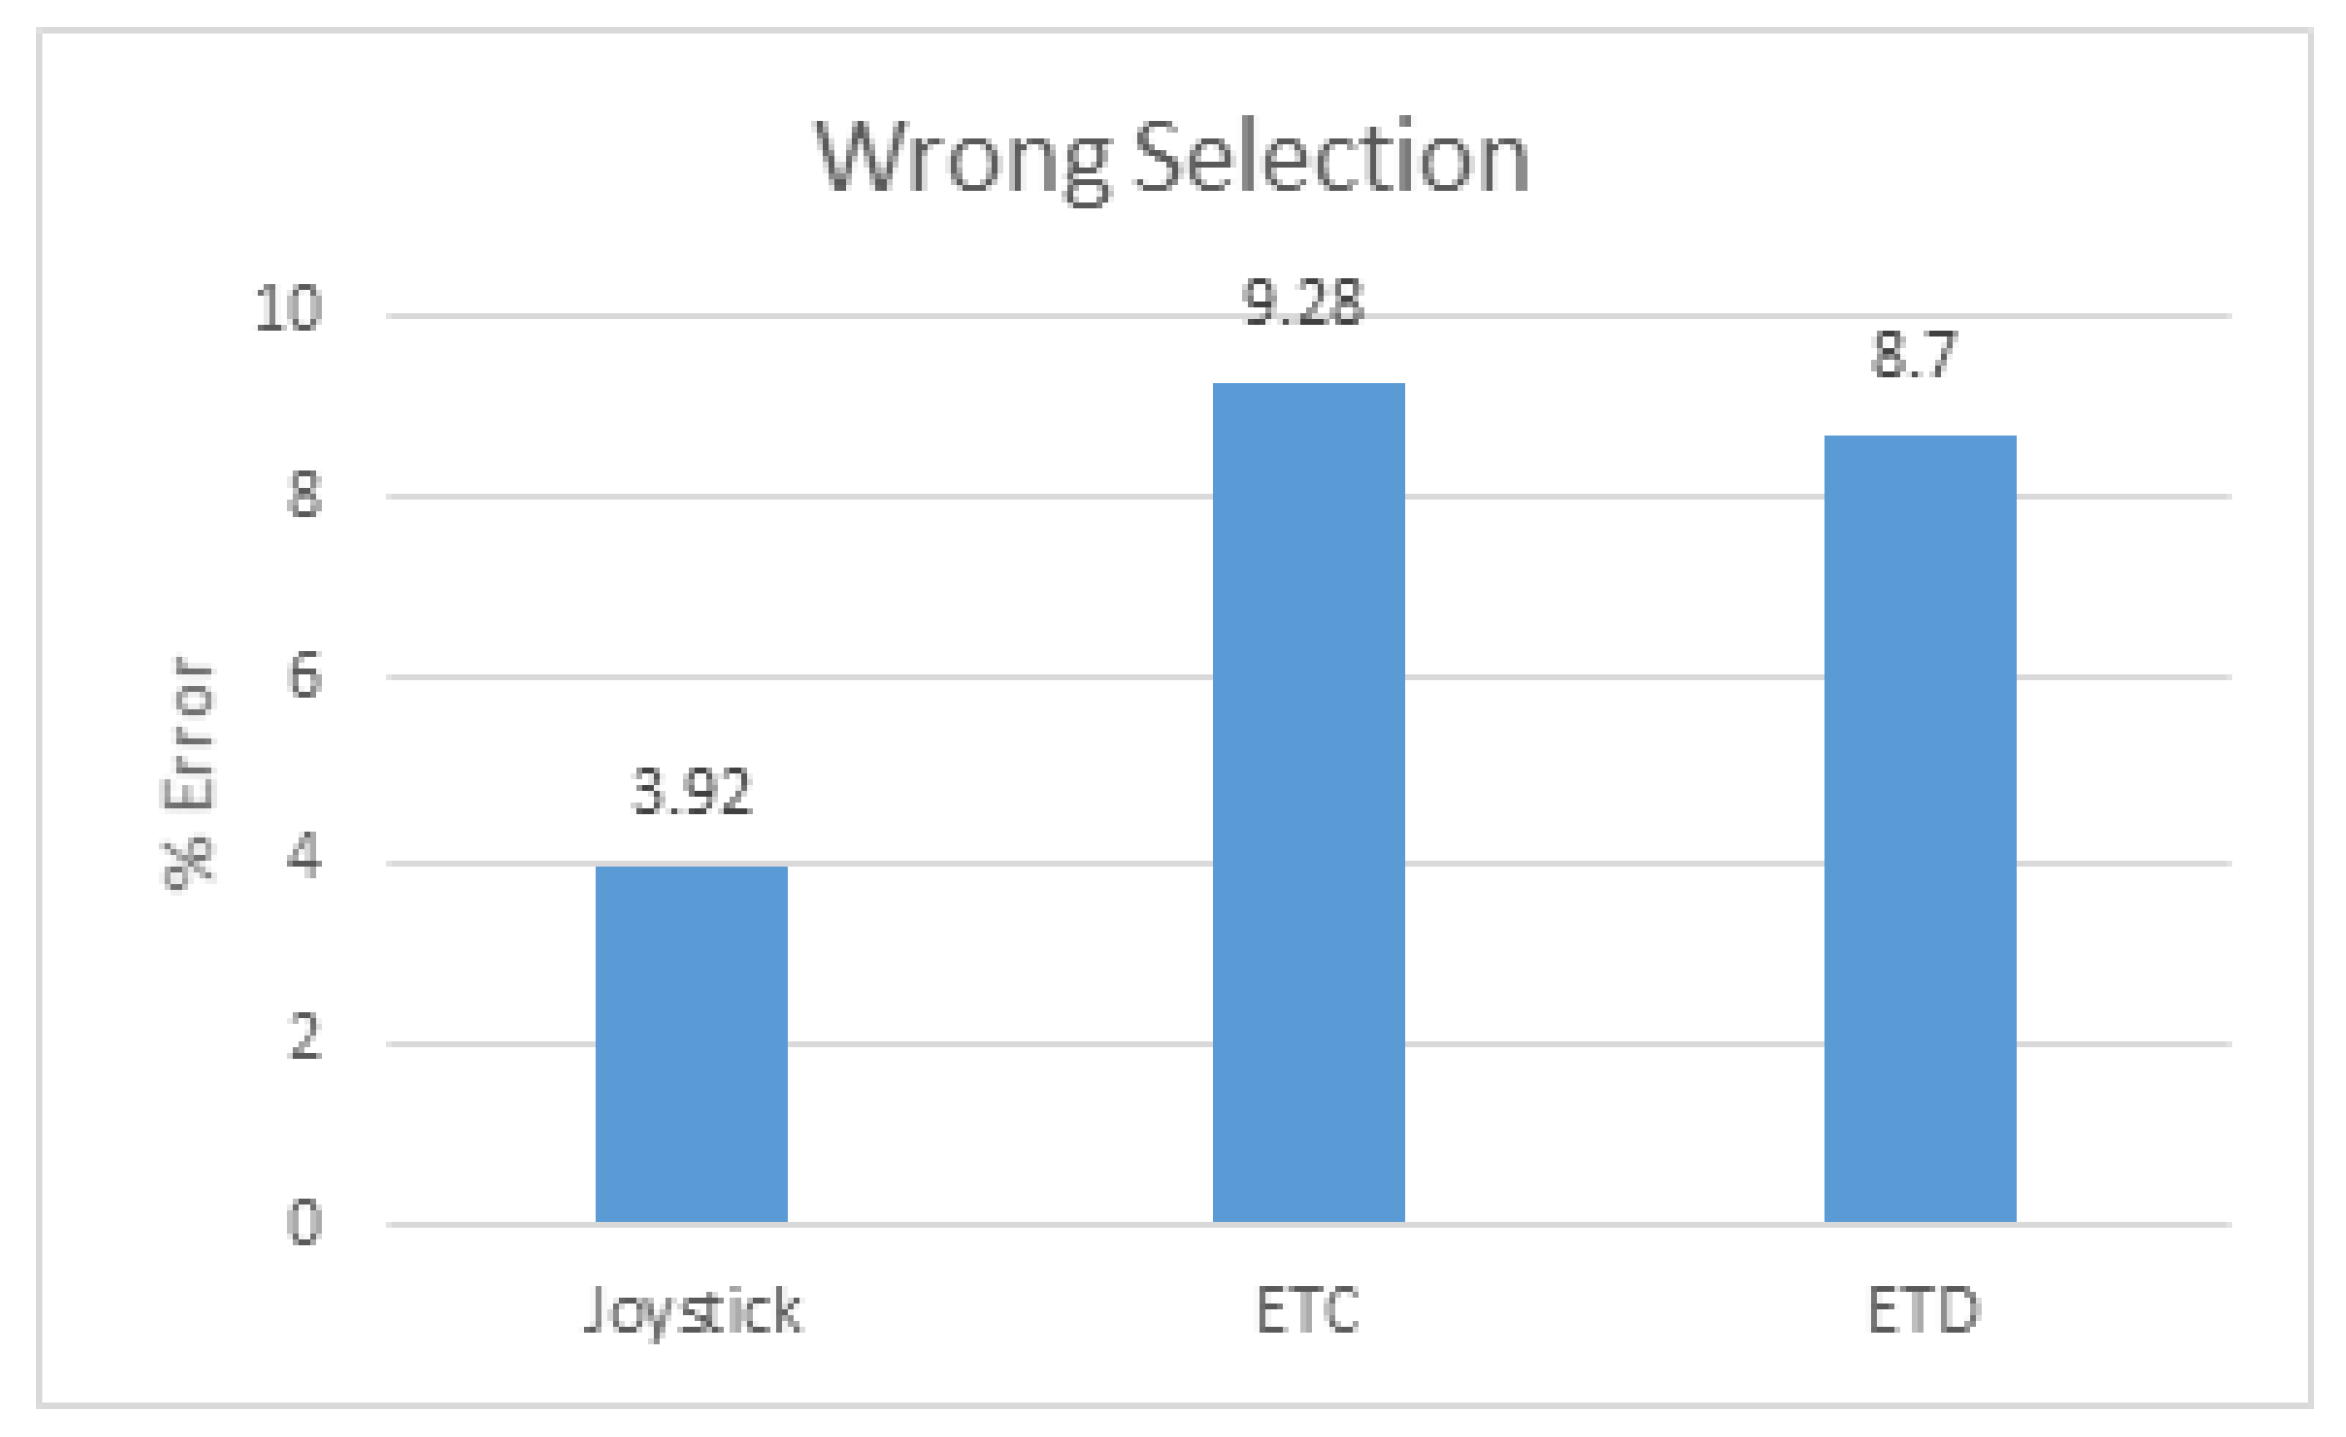
Figure 36.
Analysing cognitive load in the flight simulator.

Figure 37.
Analysing subjective preference in the flight simulator.

Figure 38.
Existing car dashboard in line of sight of drivers.
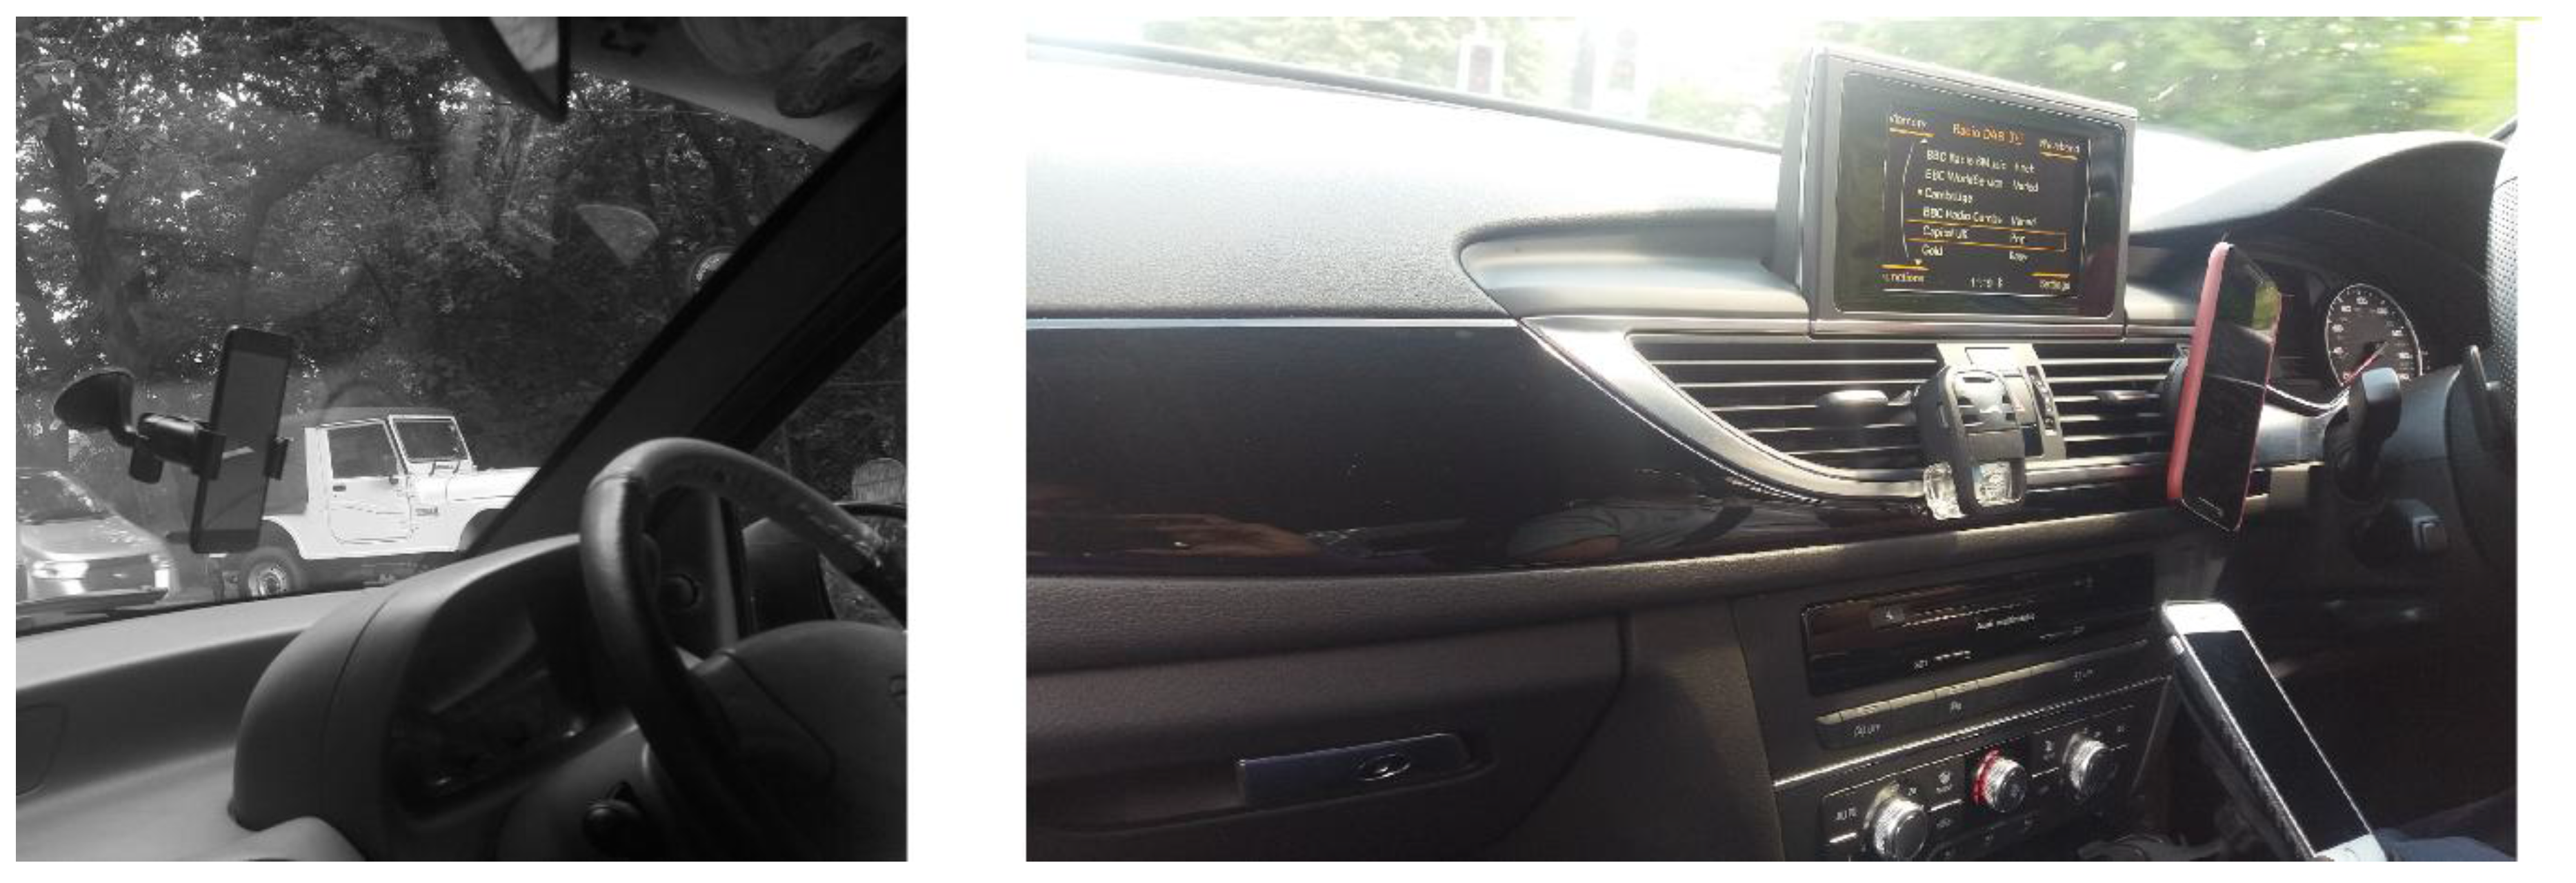
Figure 39.
Testing with a Hawk trainer aircraft.
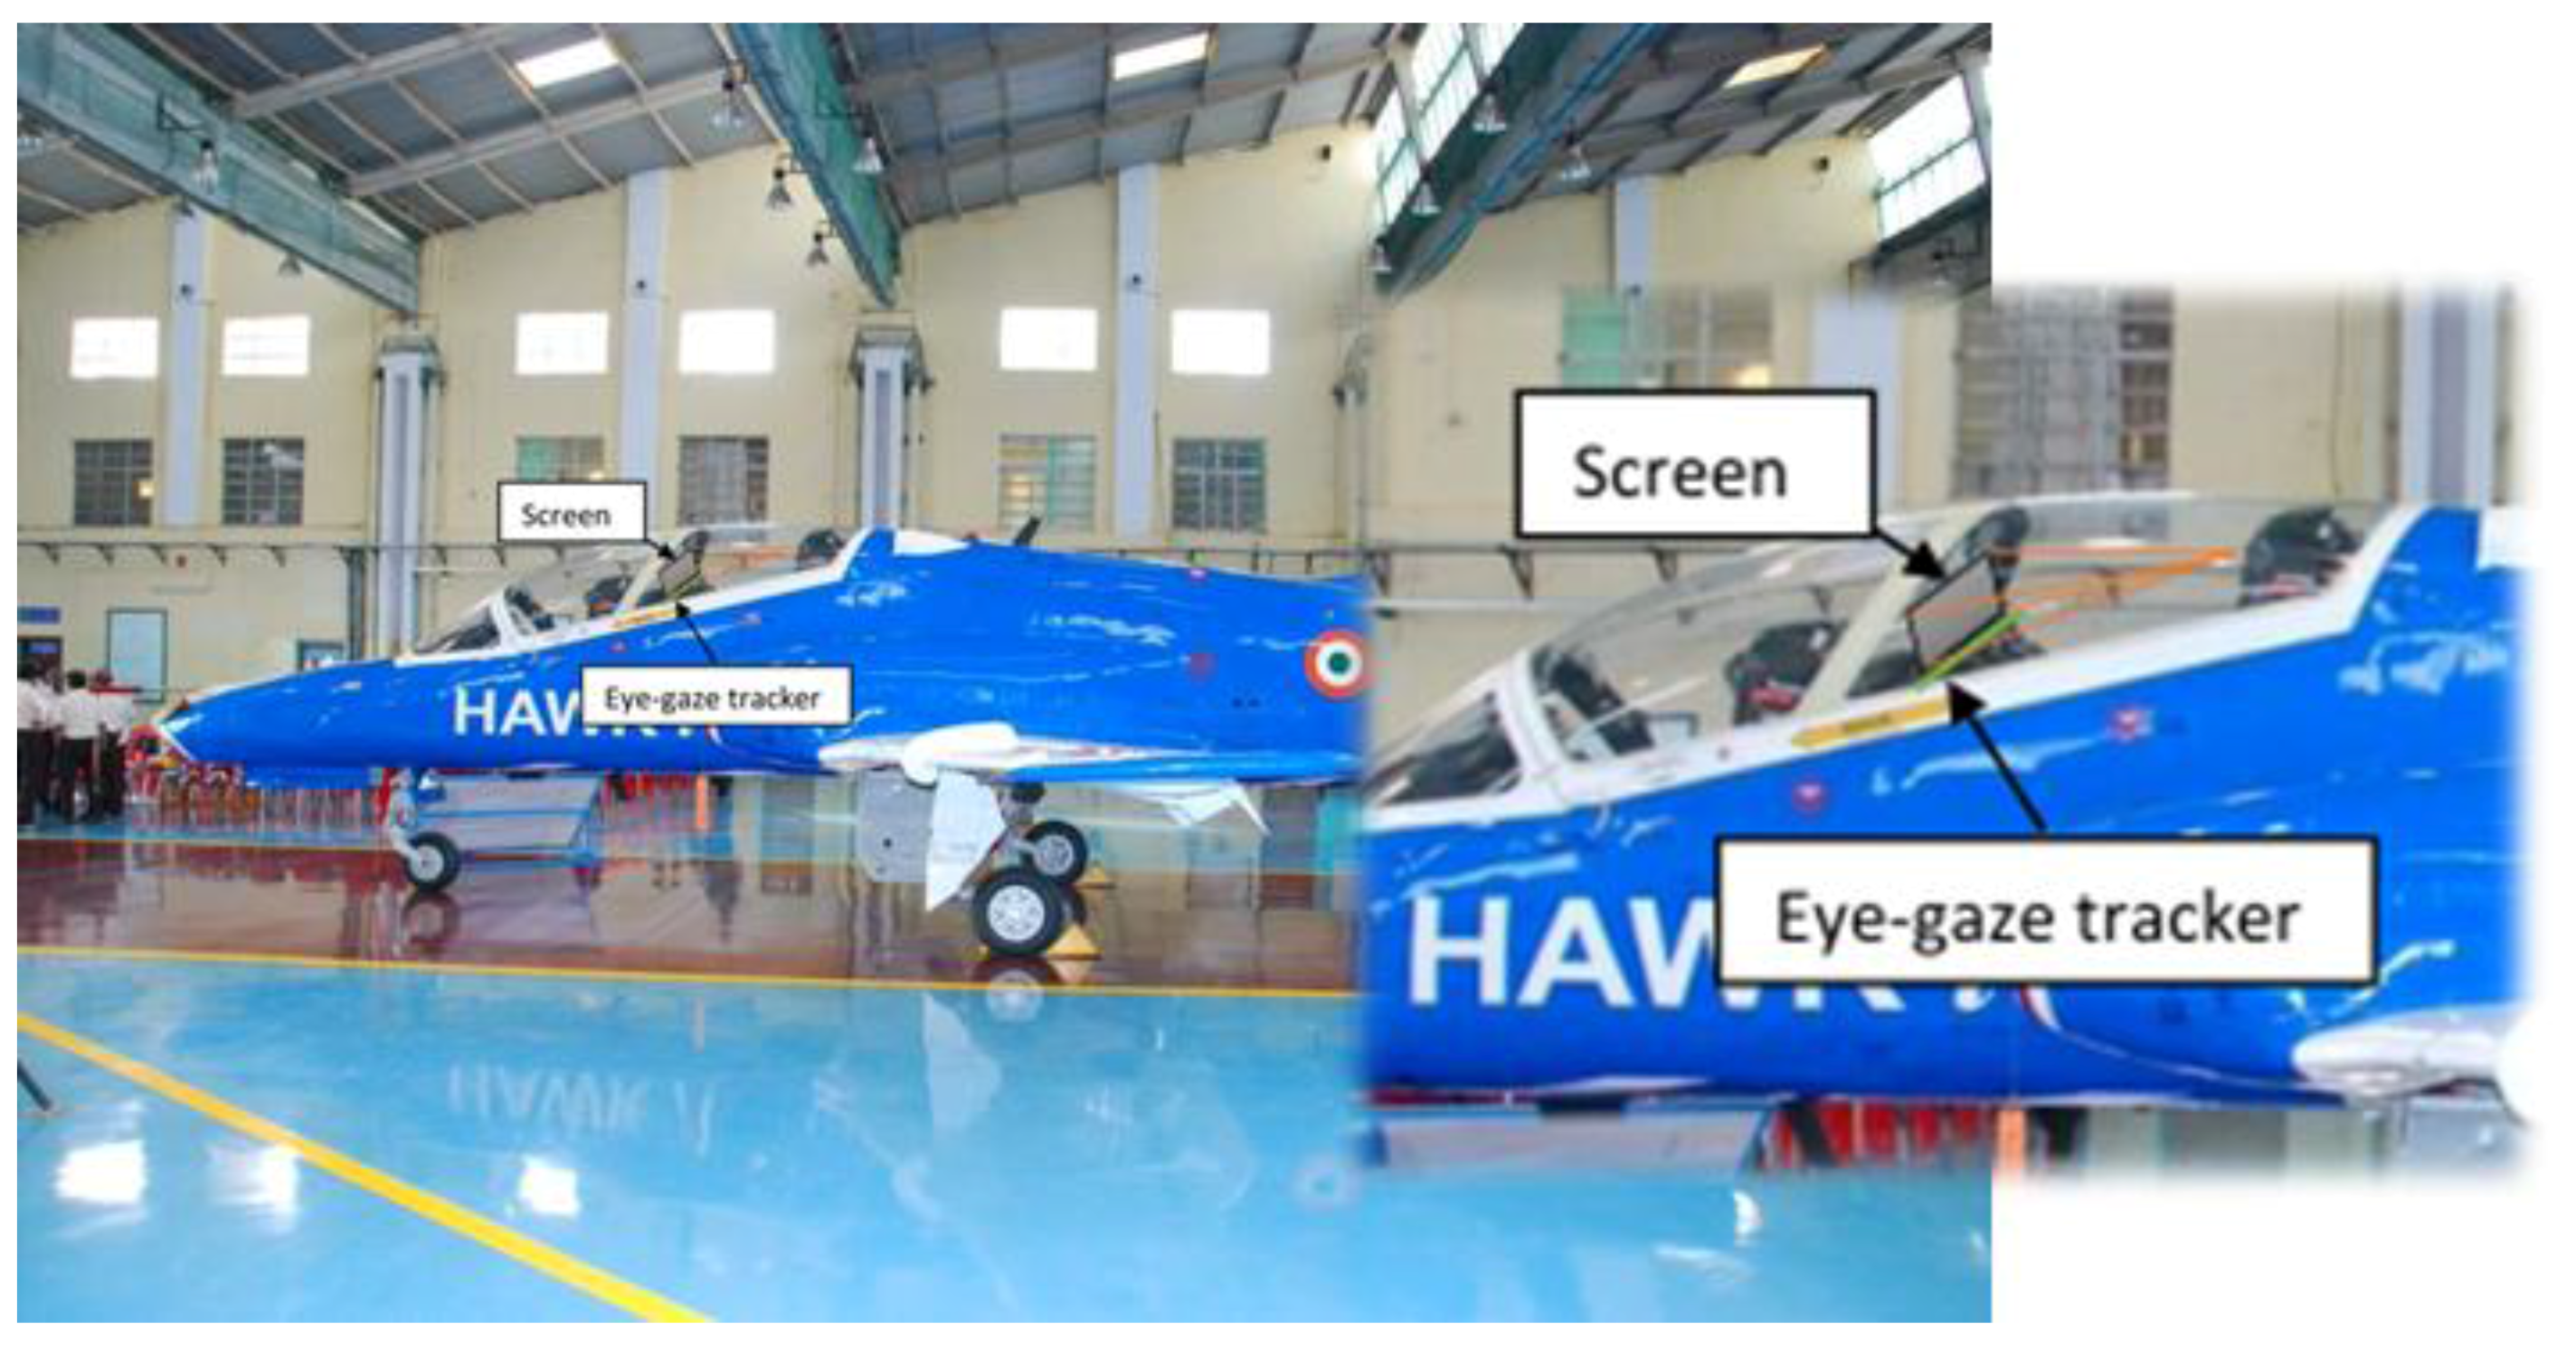
Figure 40.
Testing with a high end simulator.


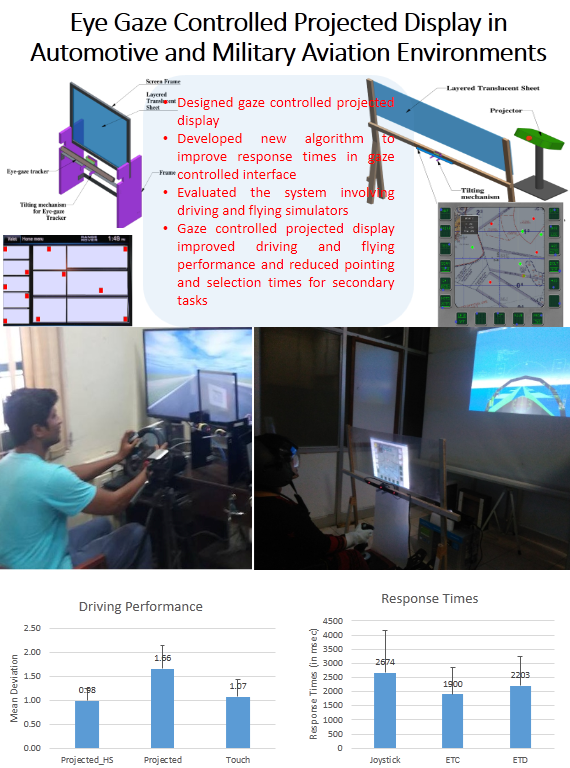
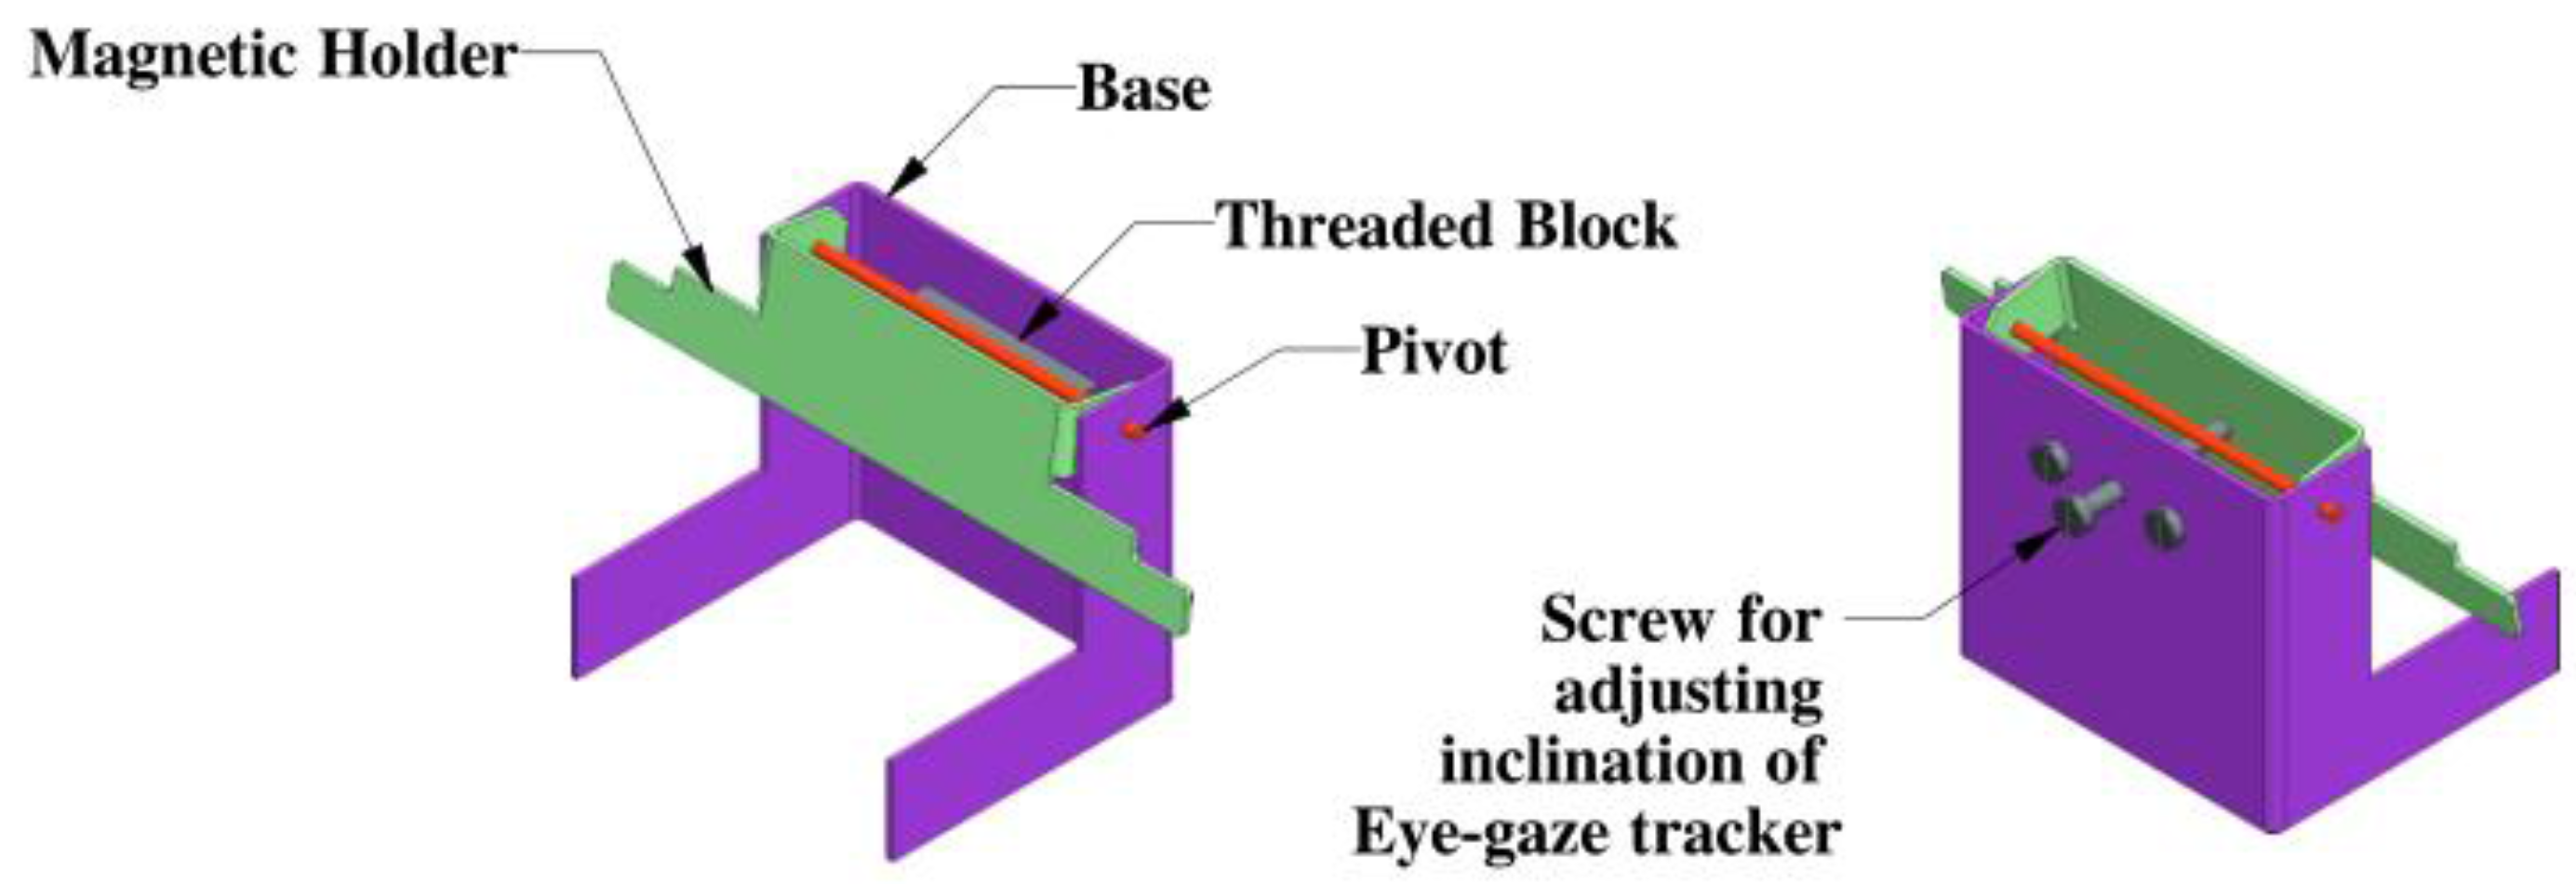
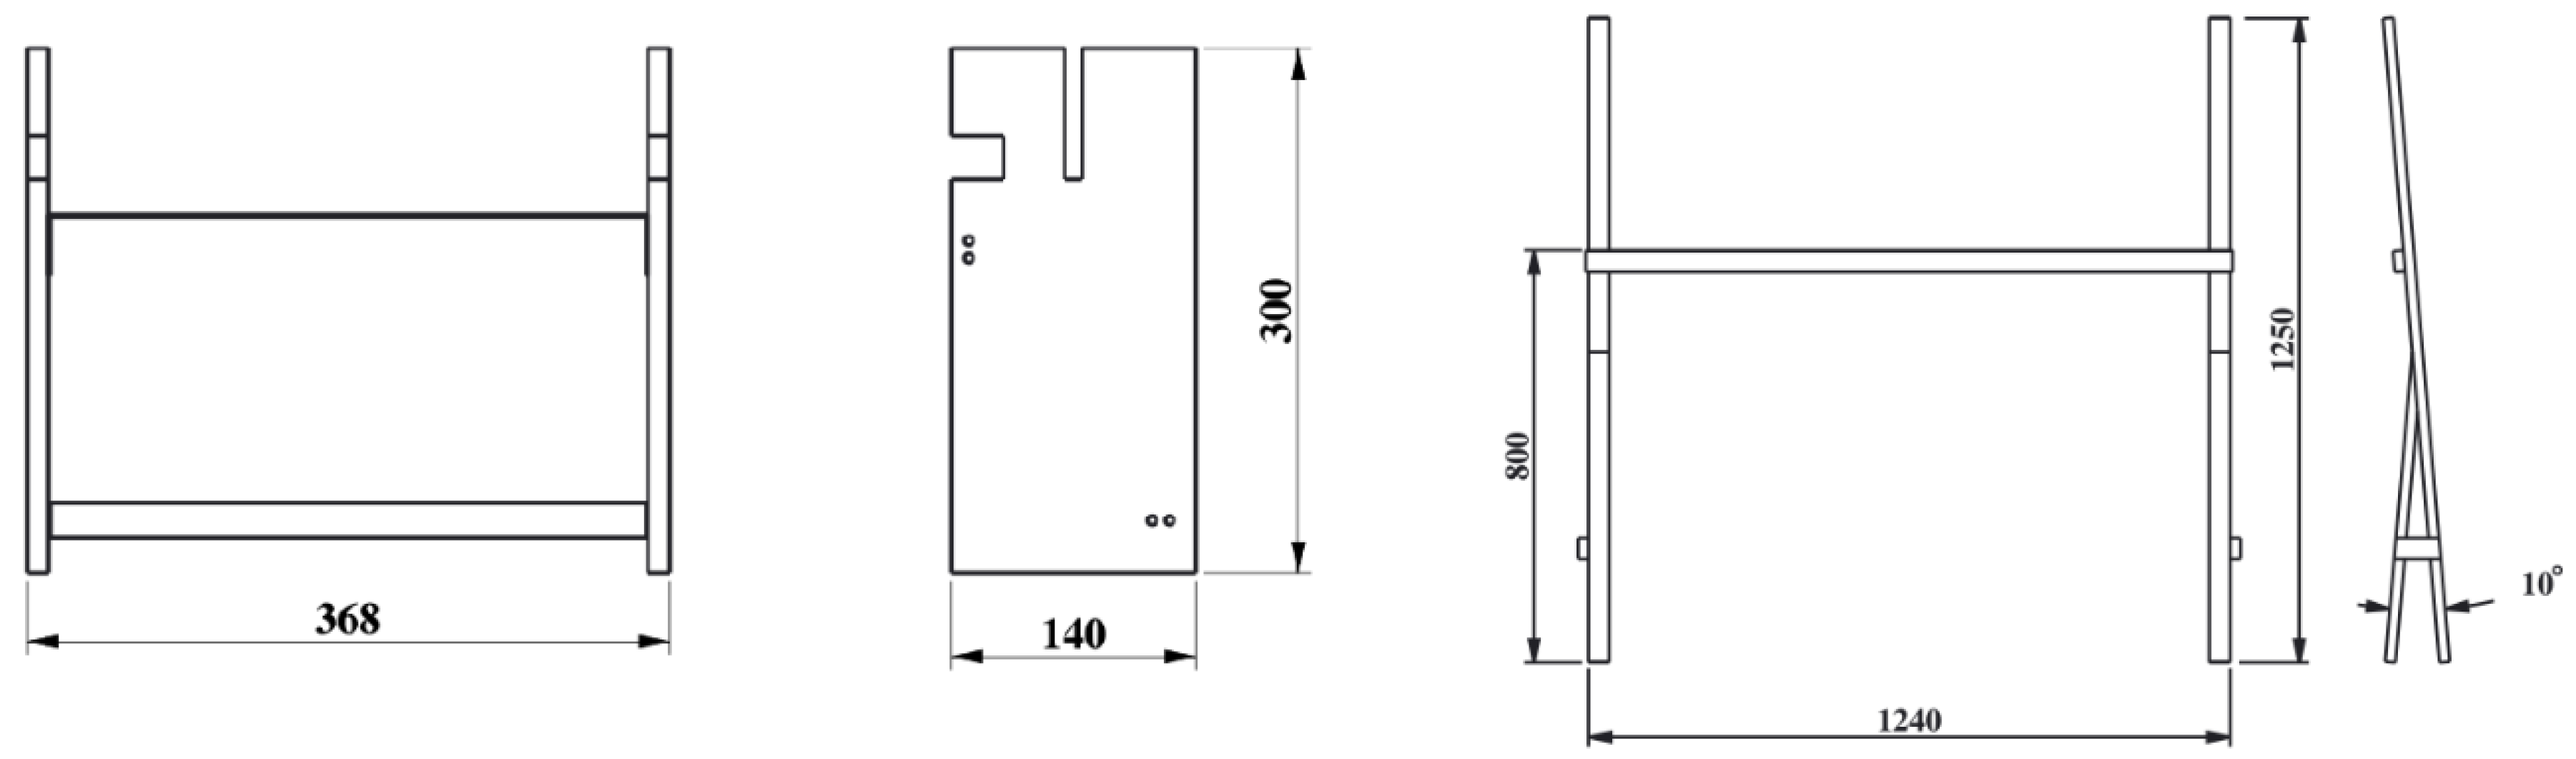
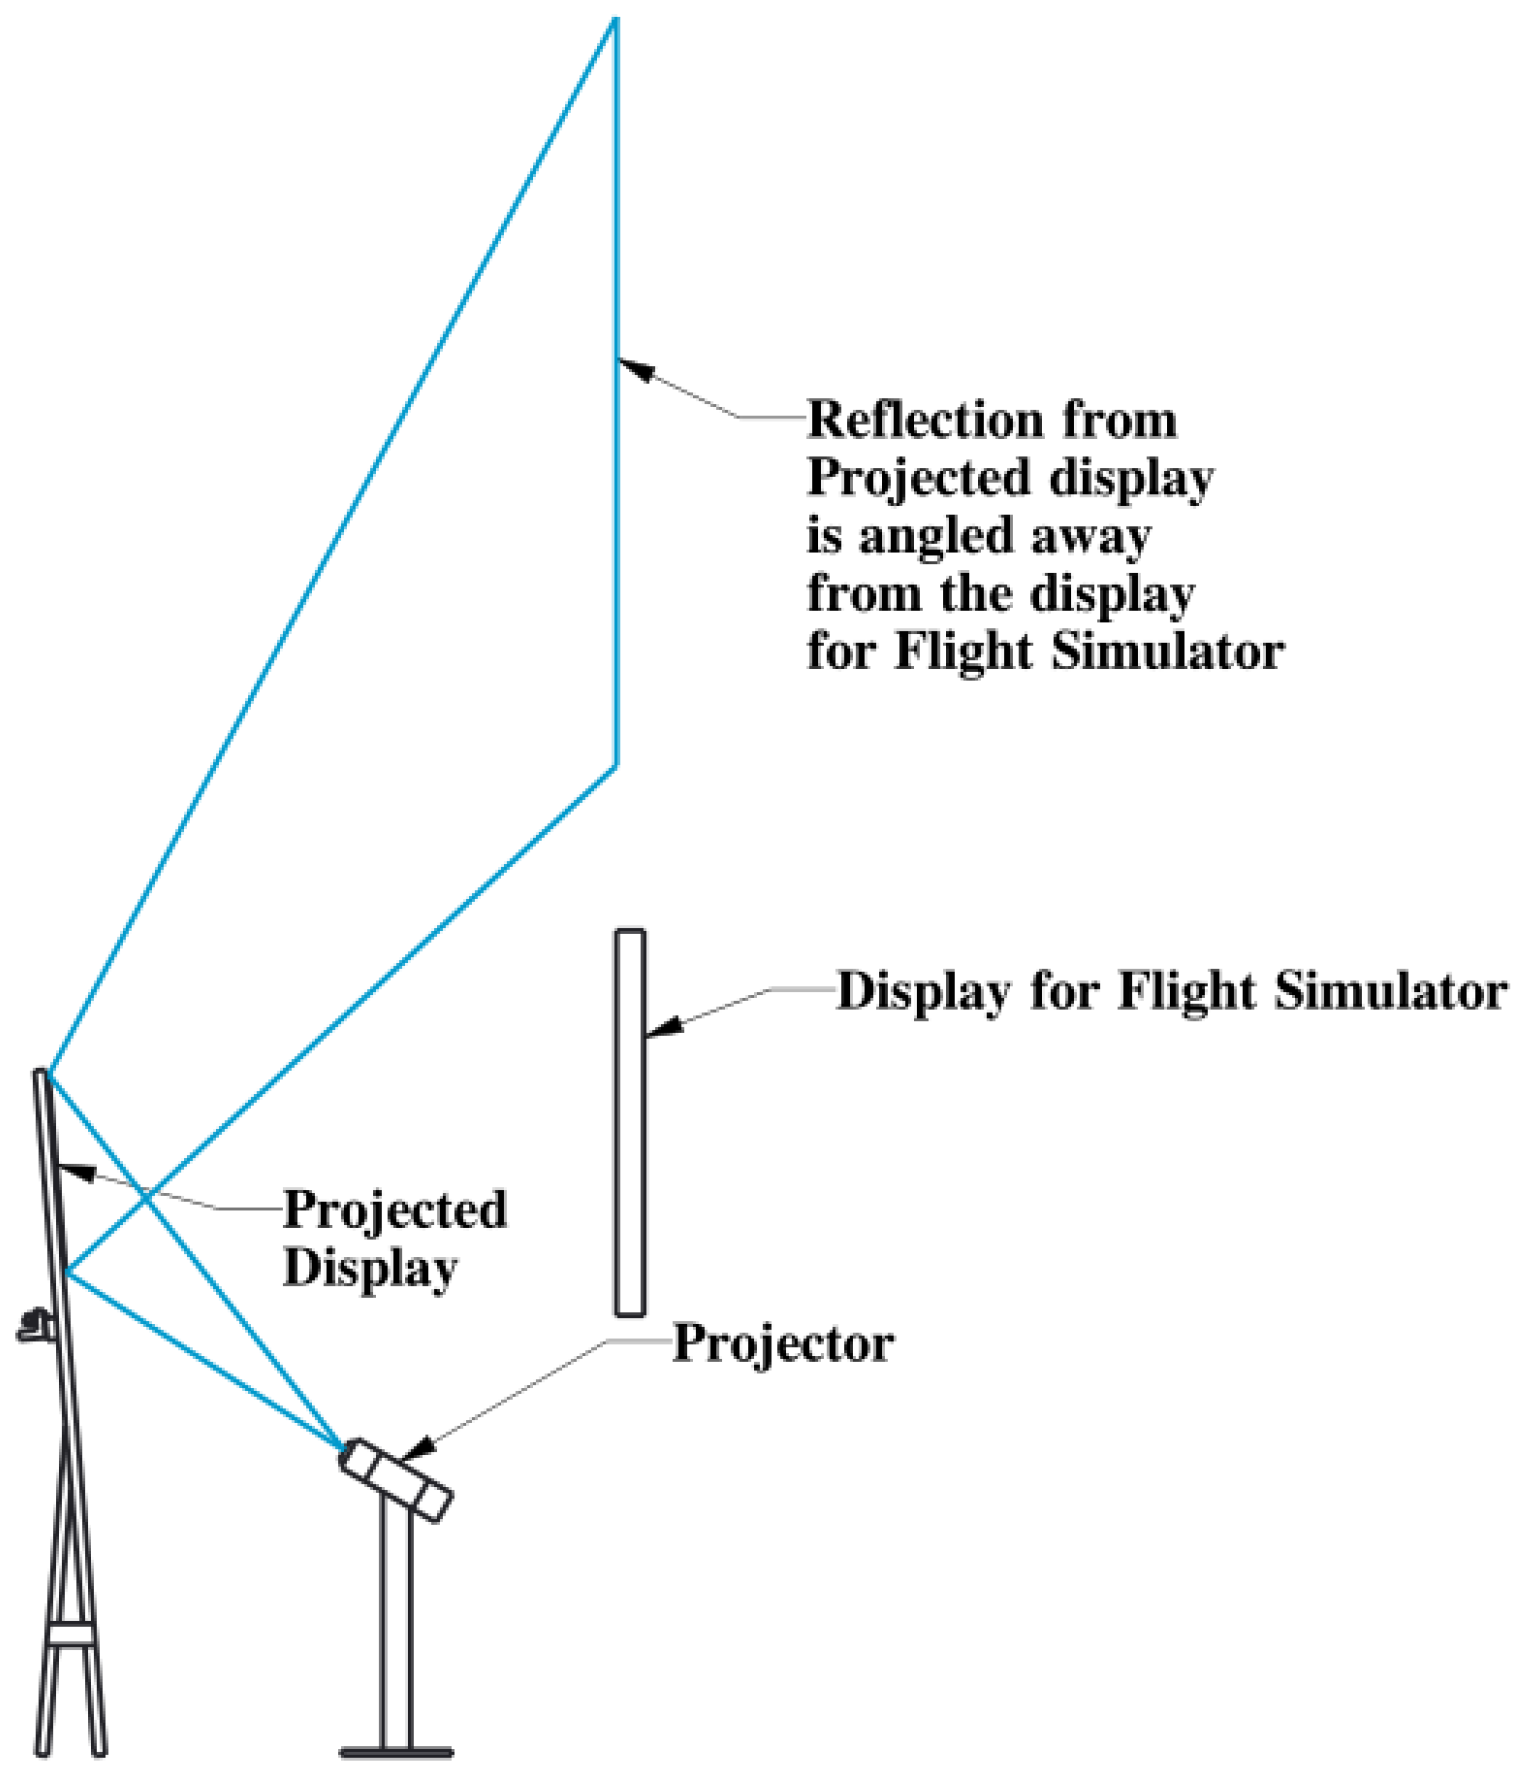
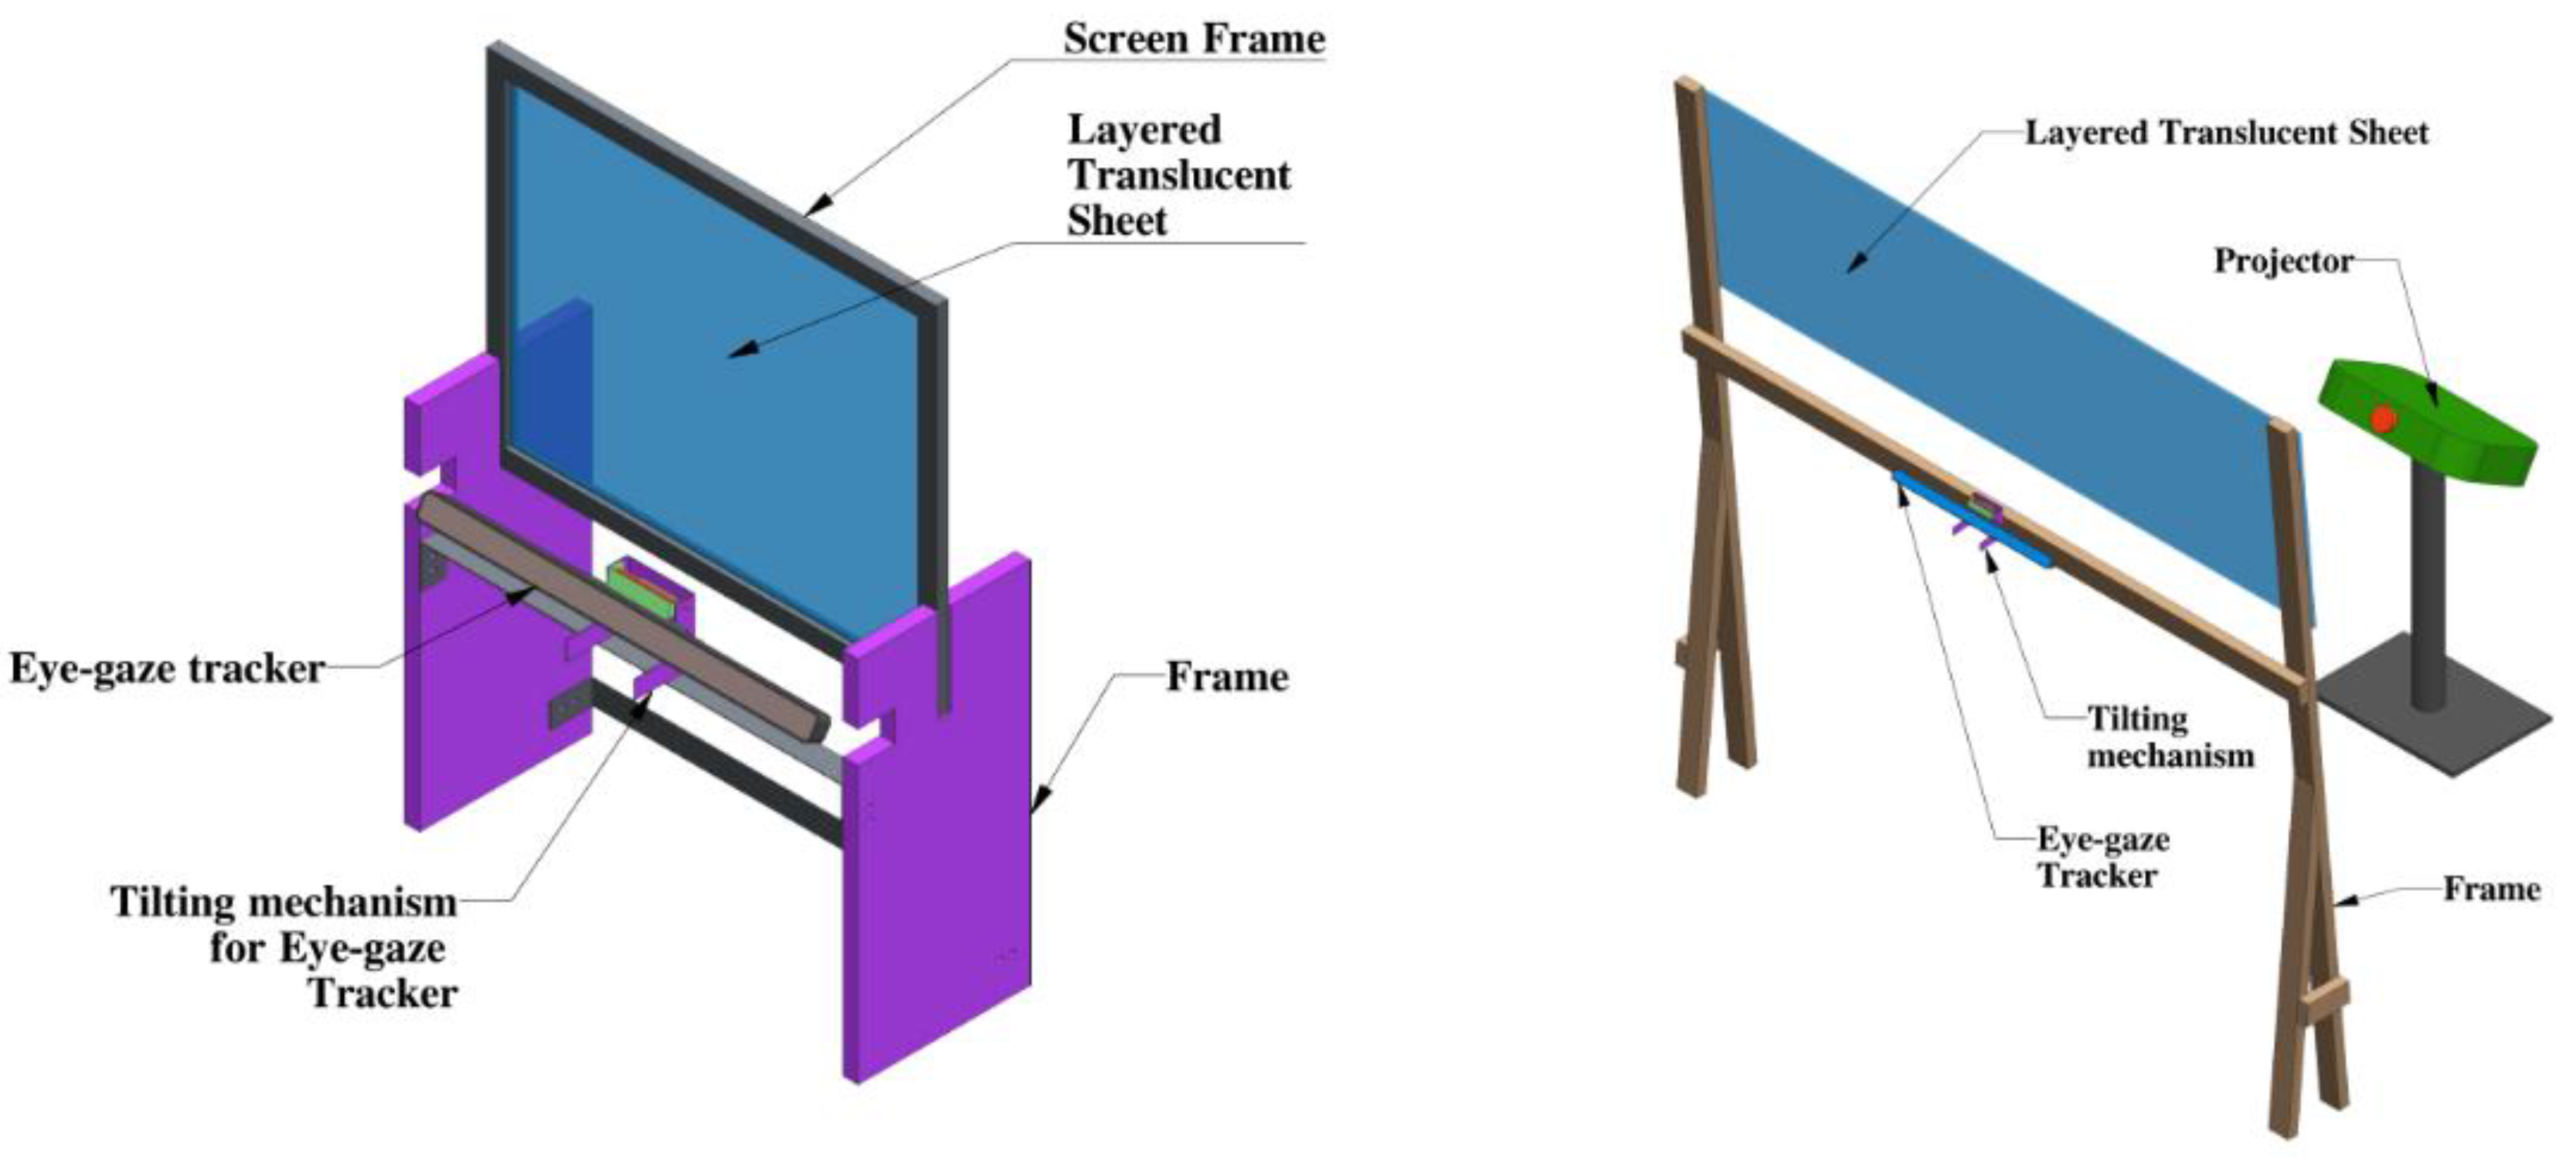
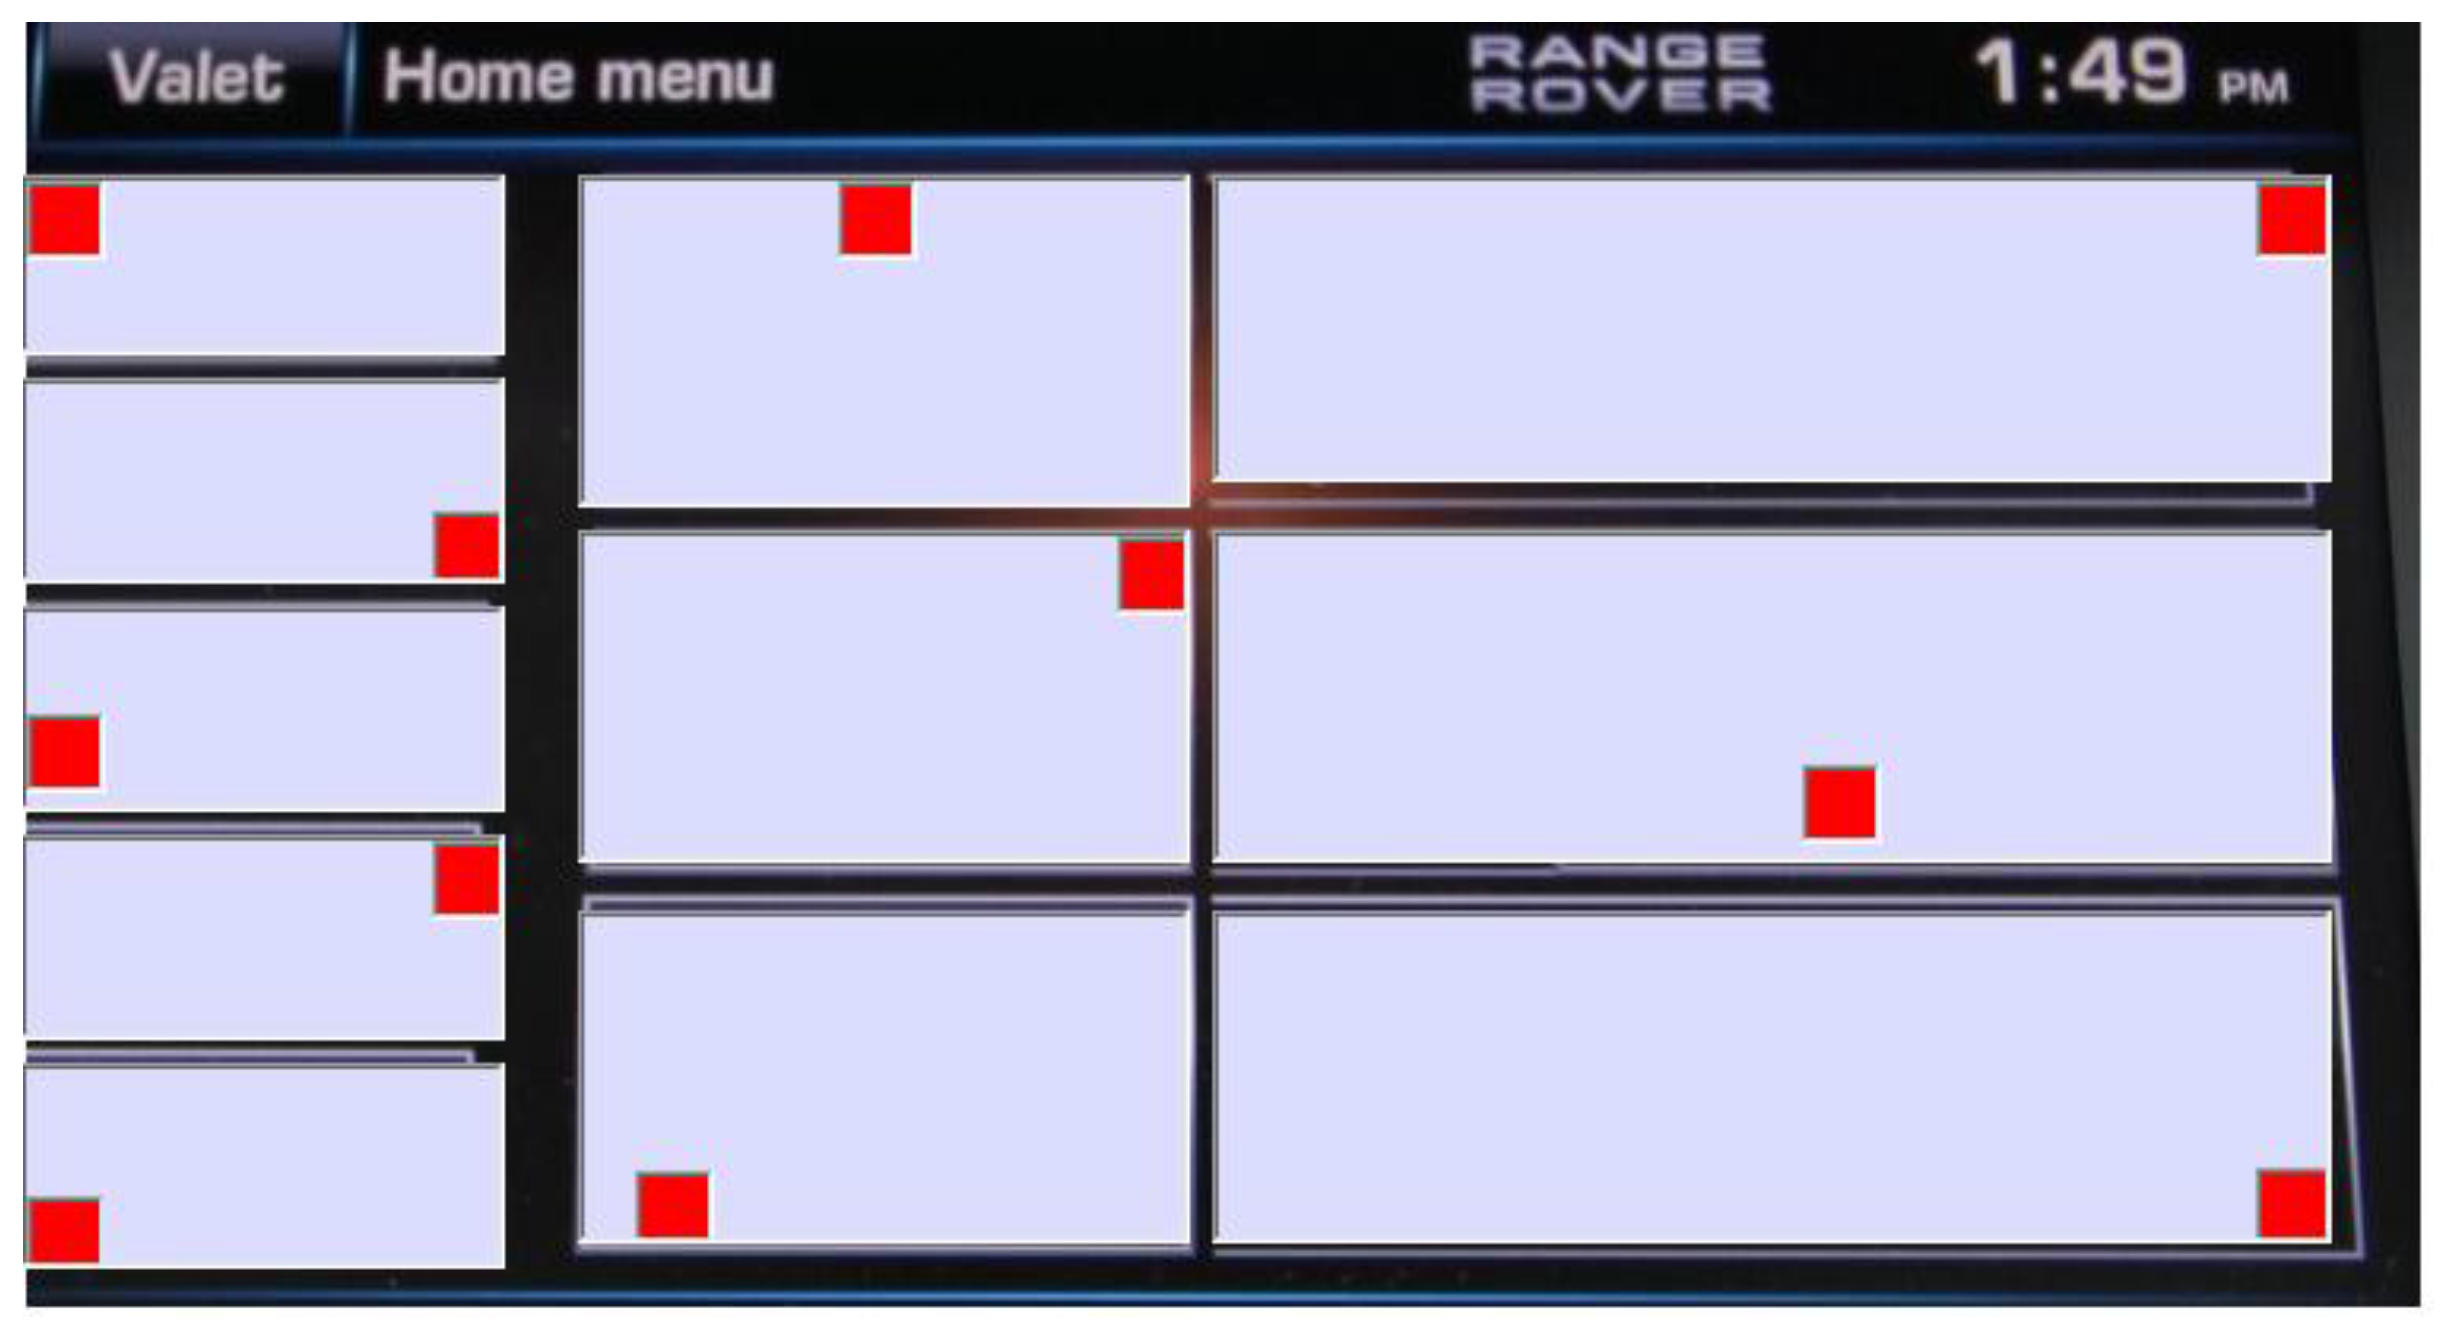
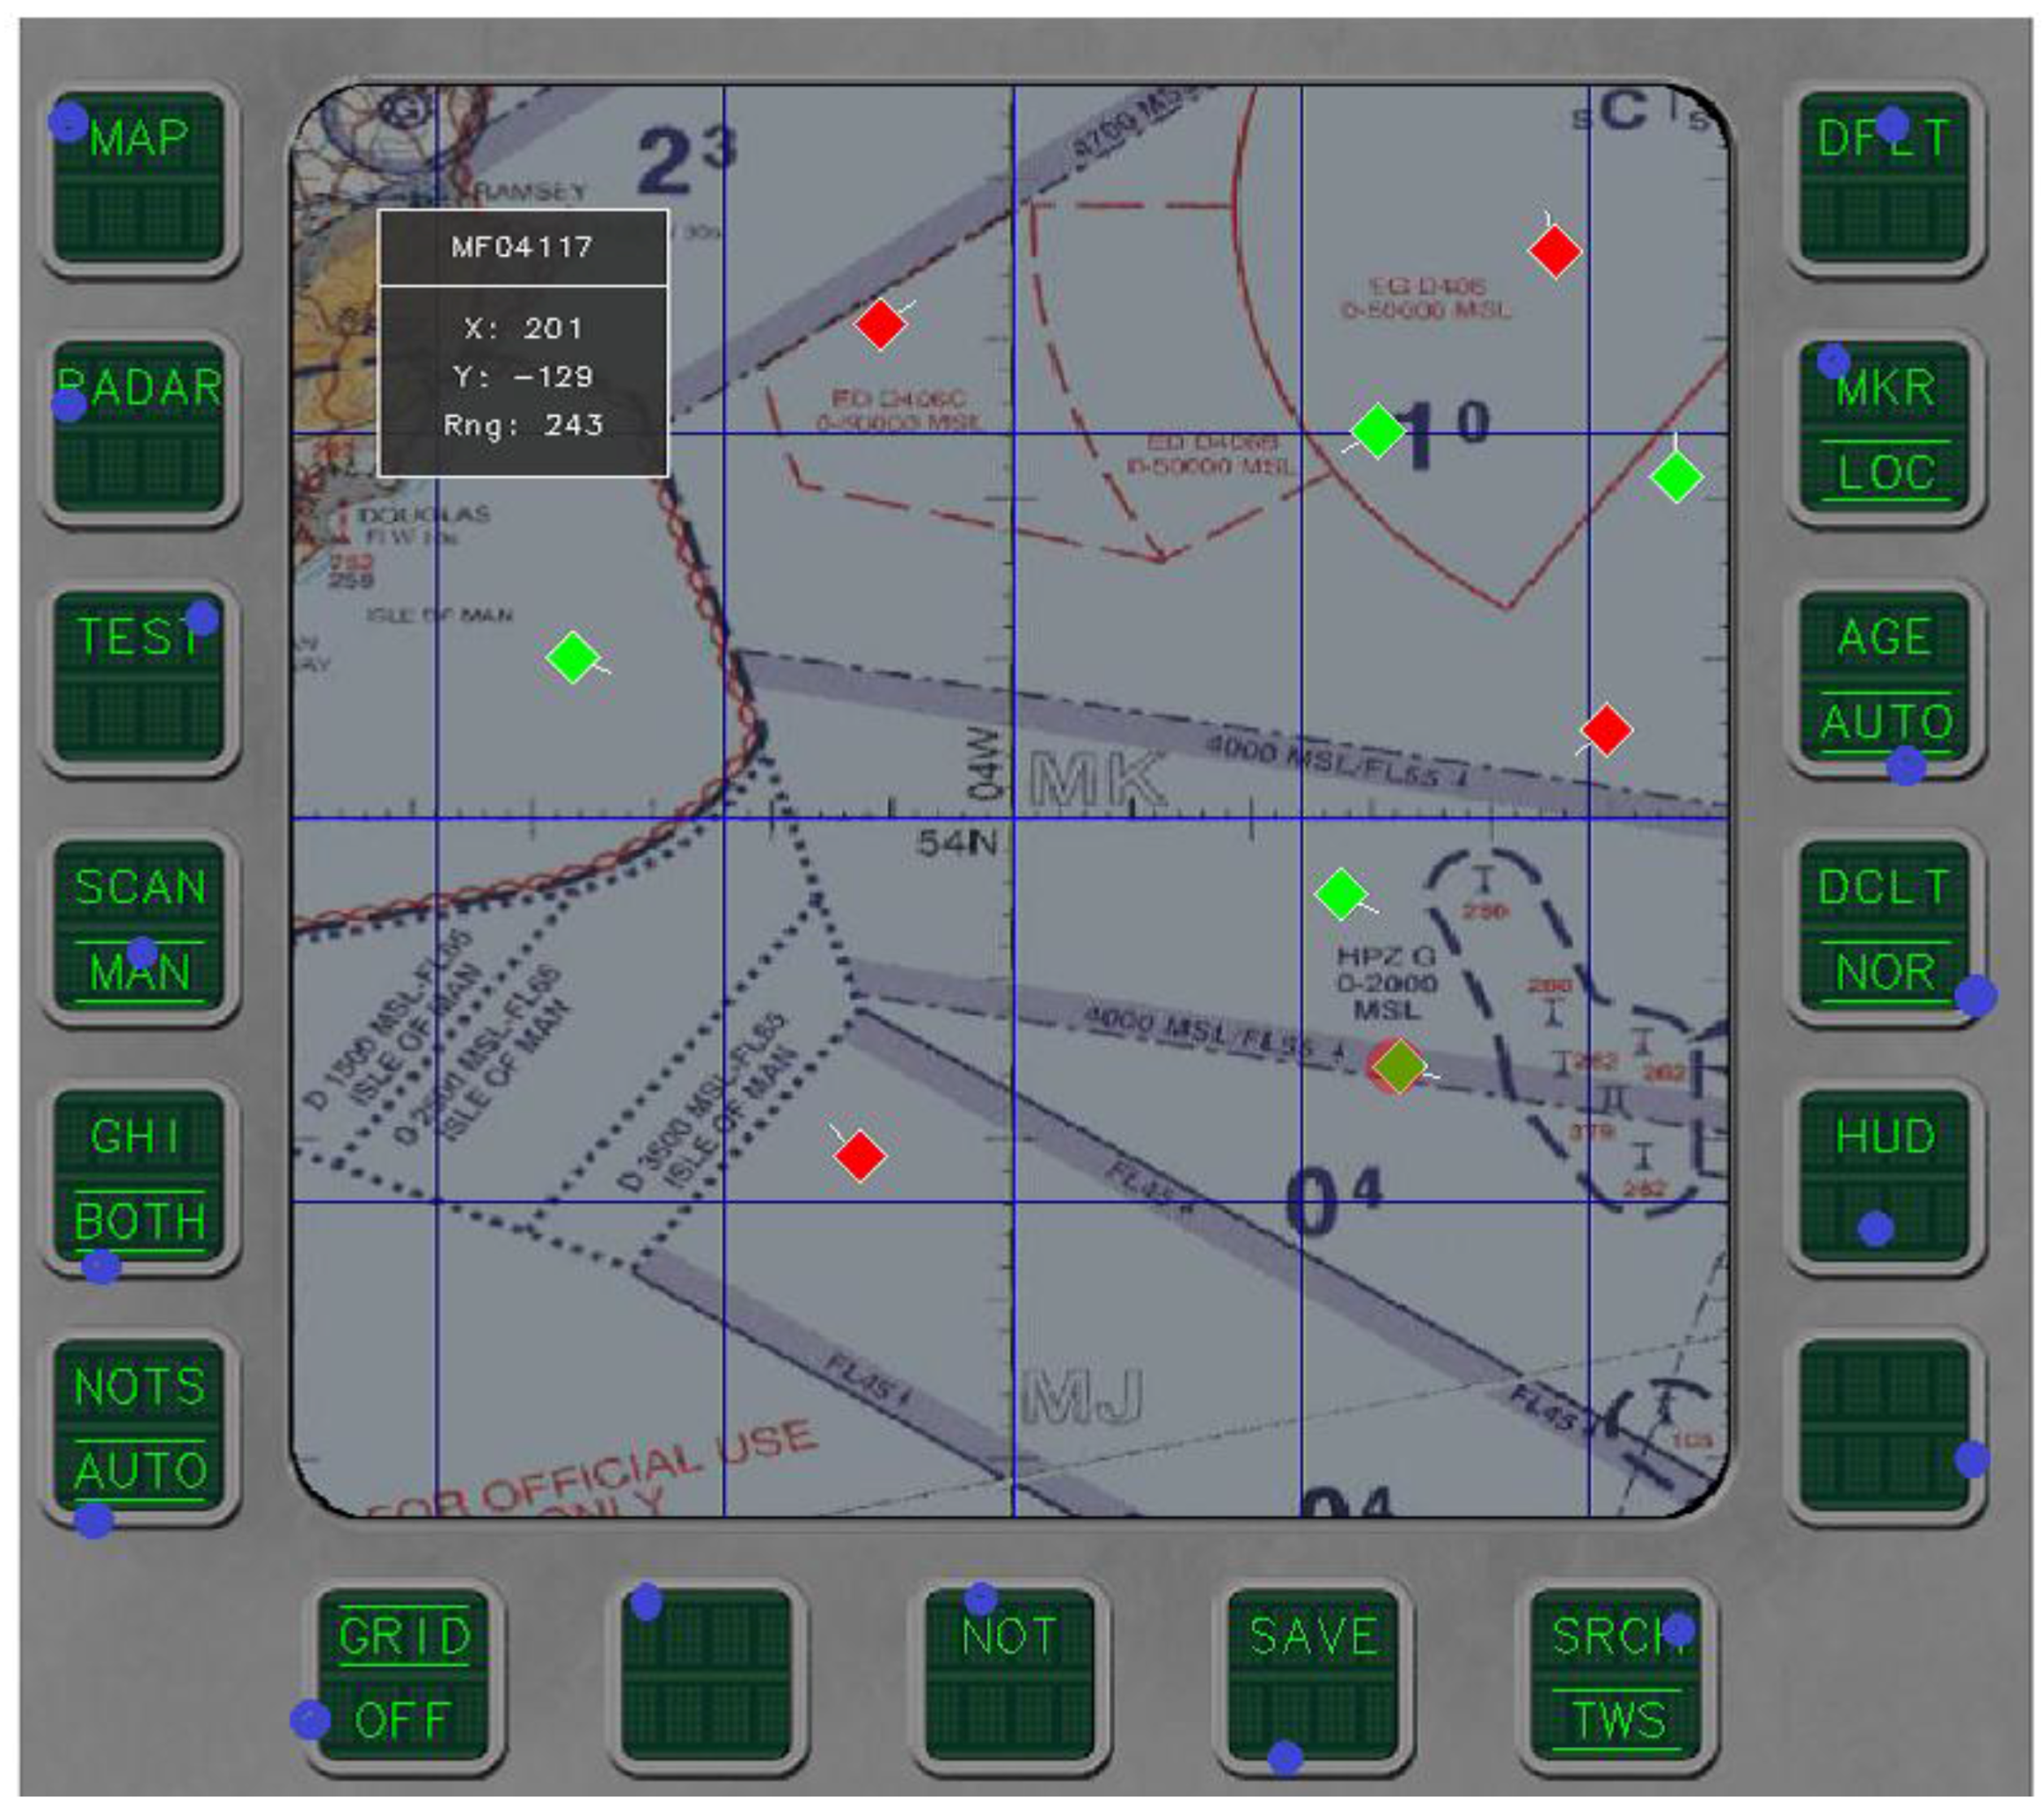
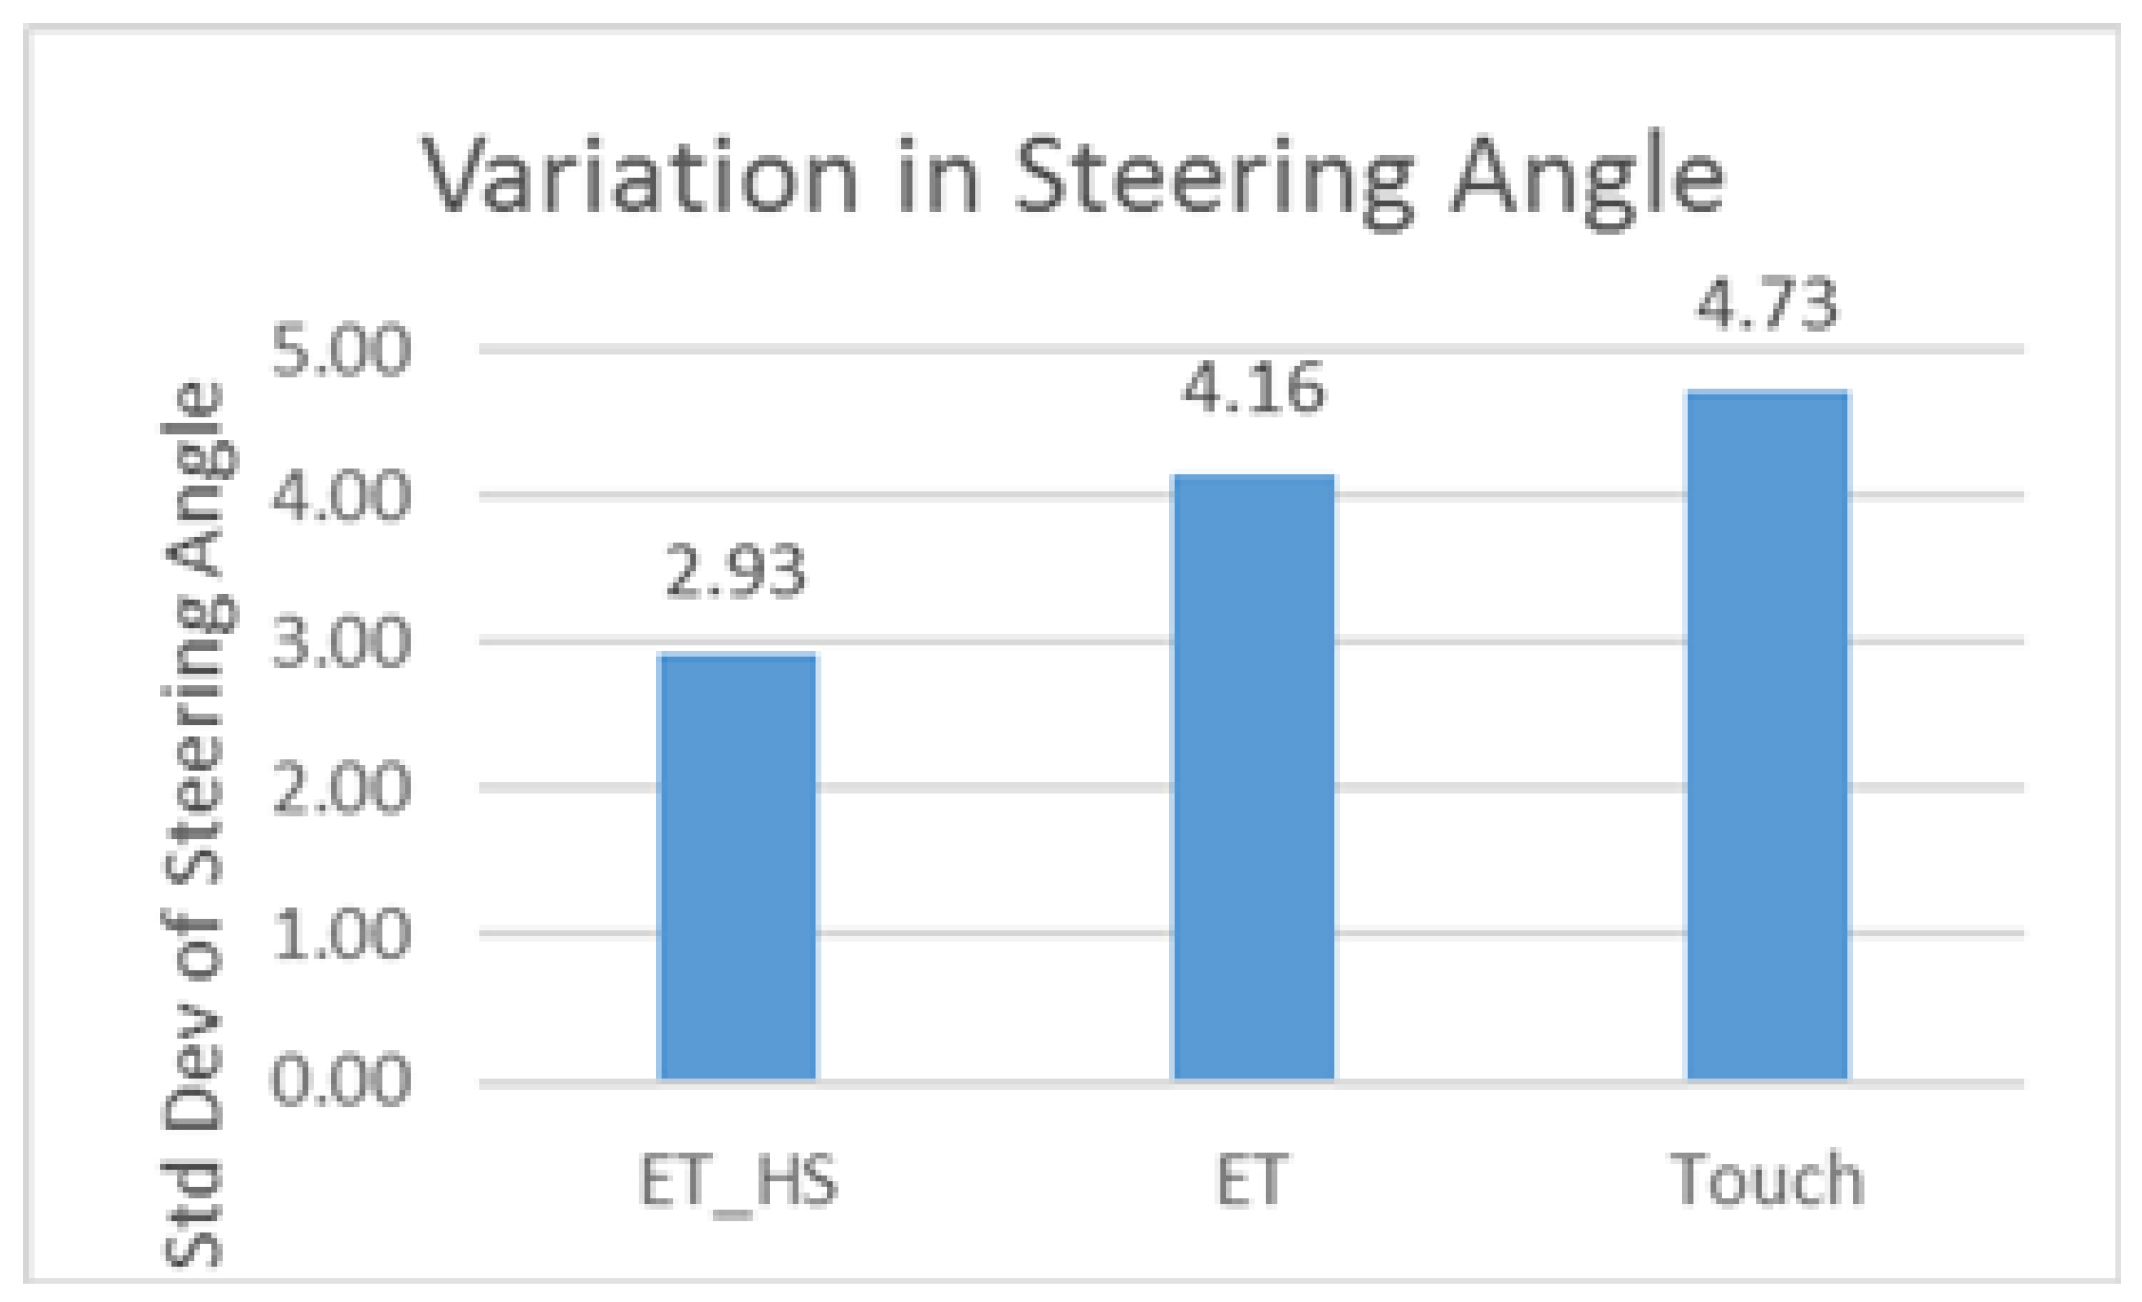
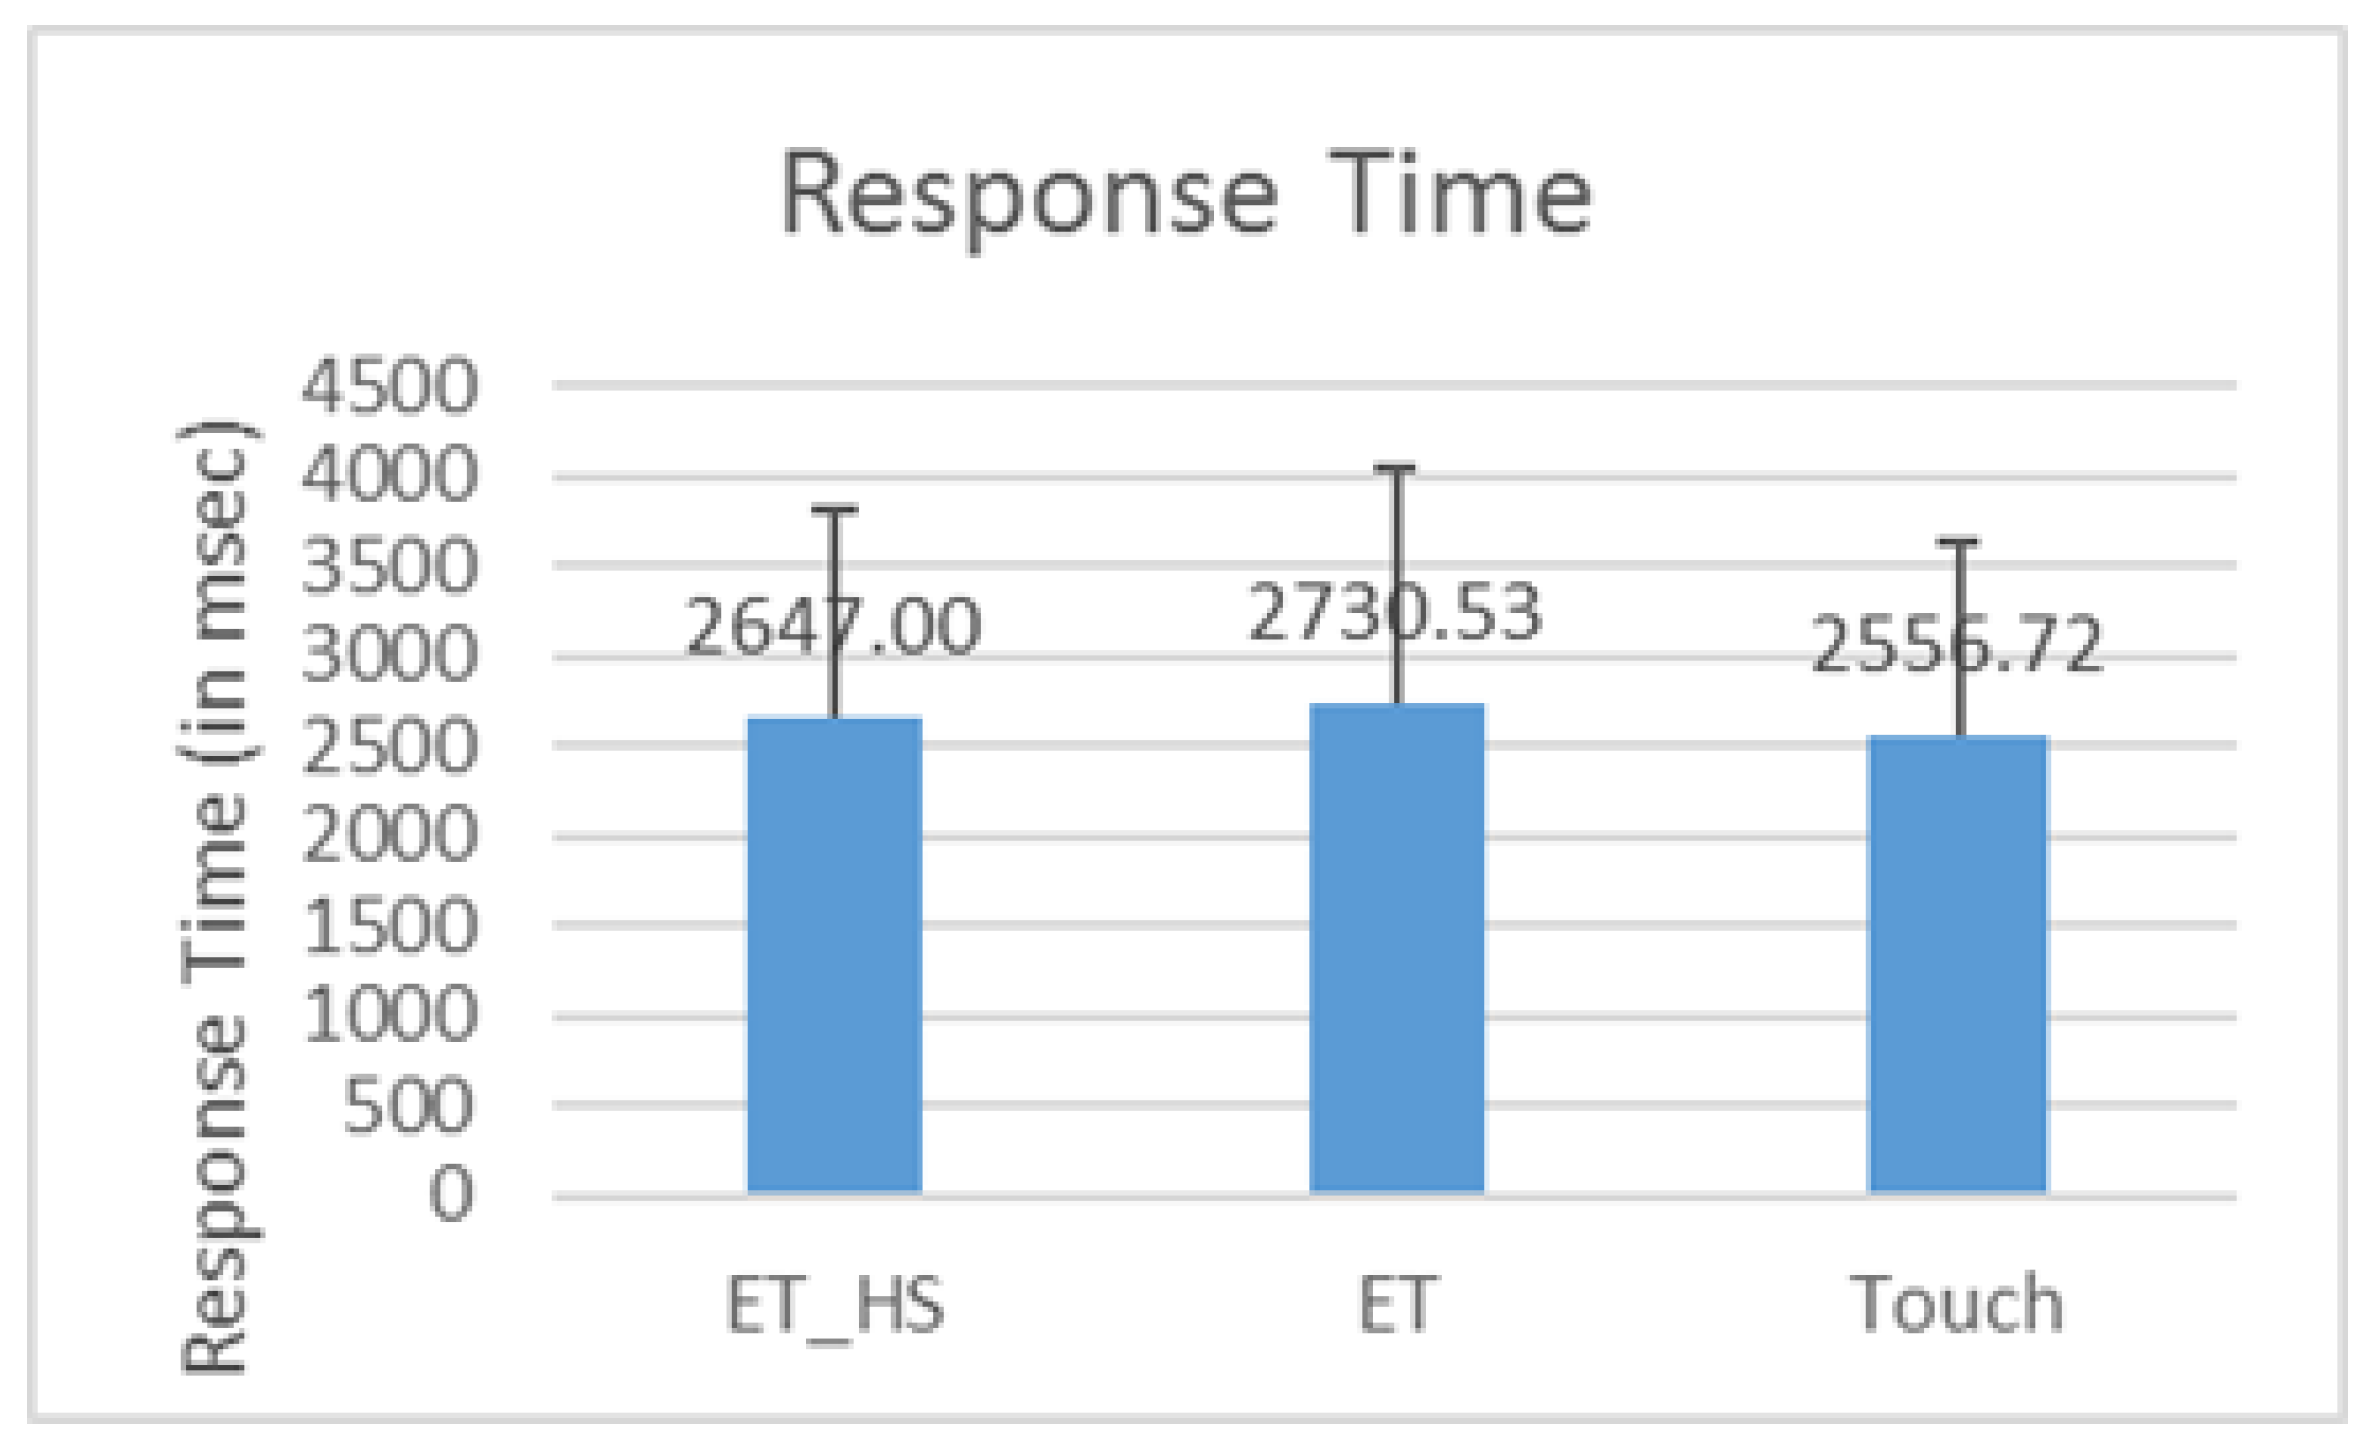
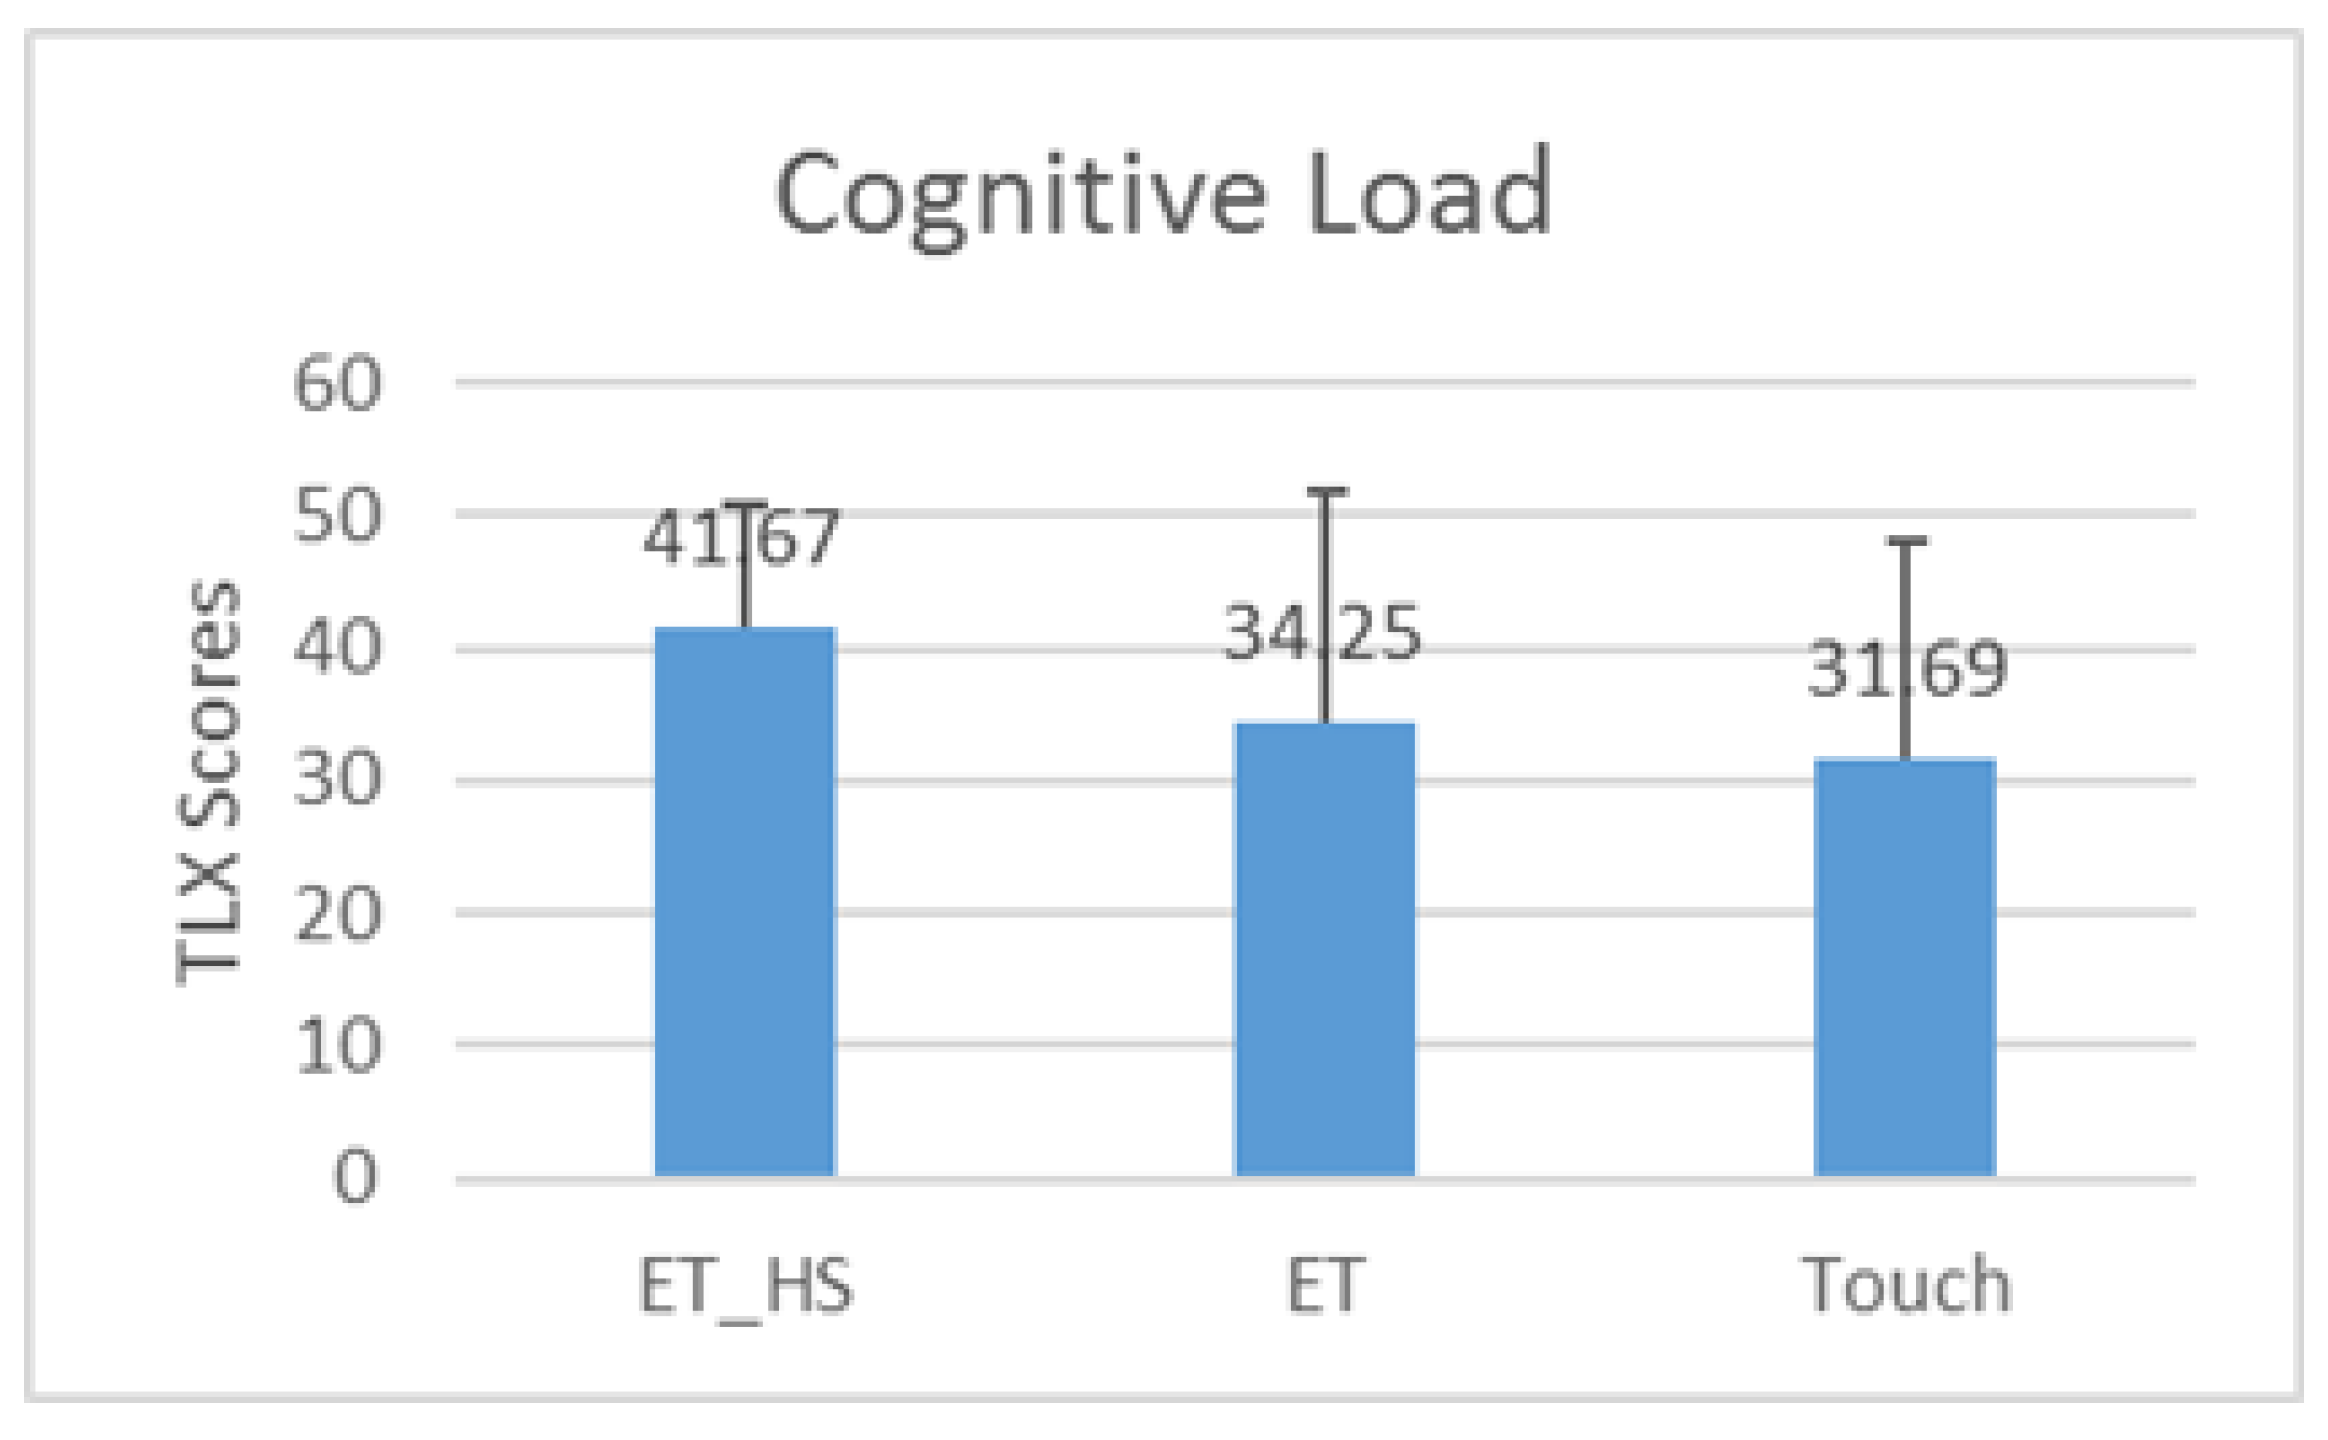
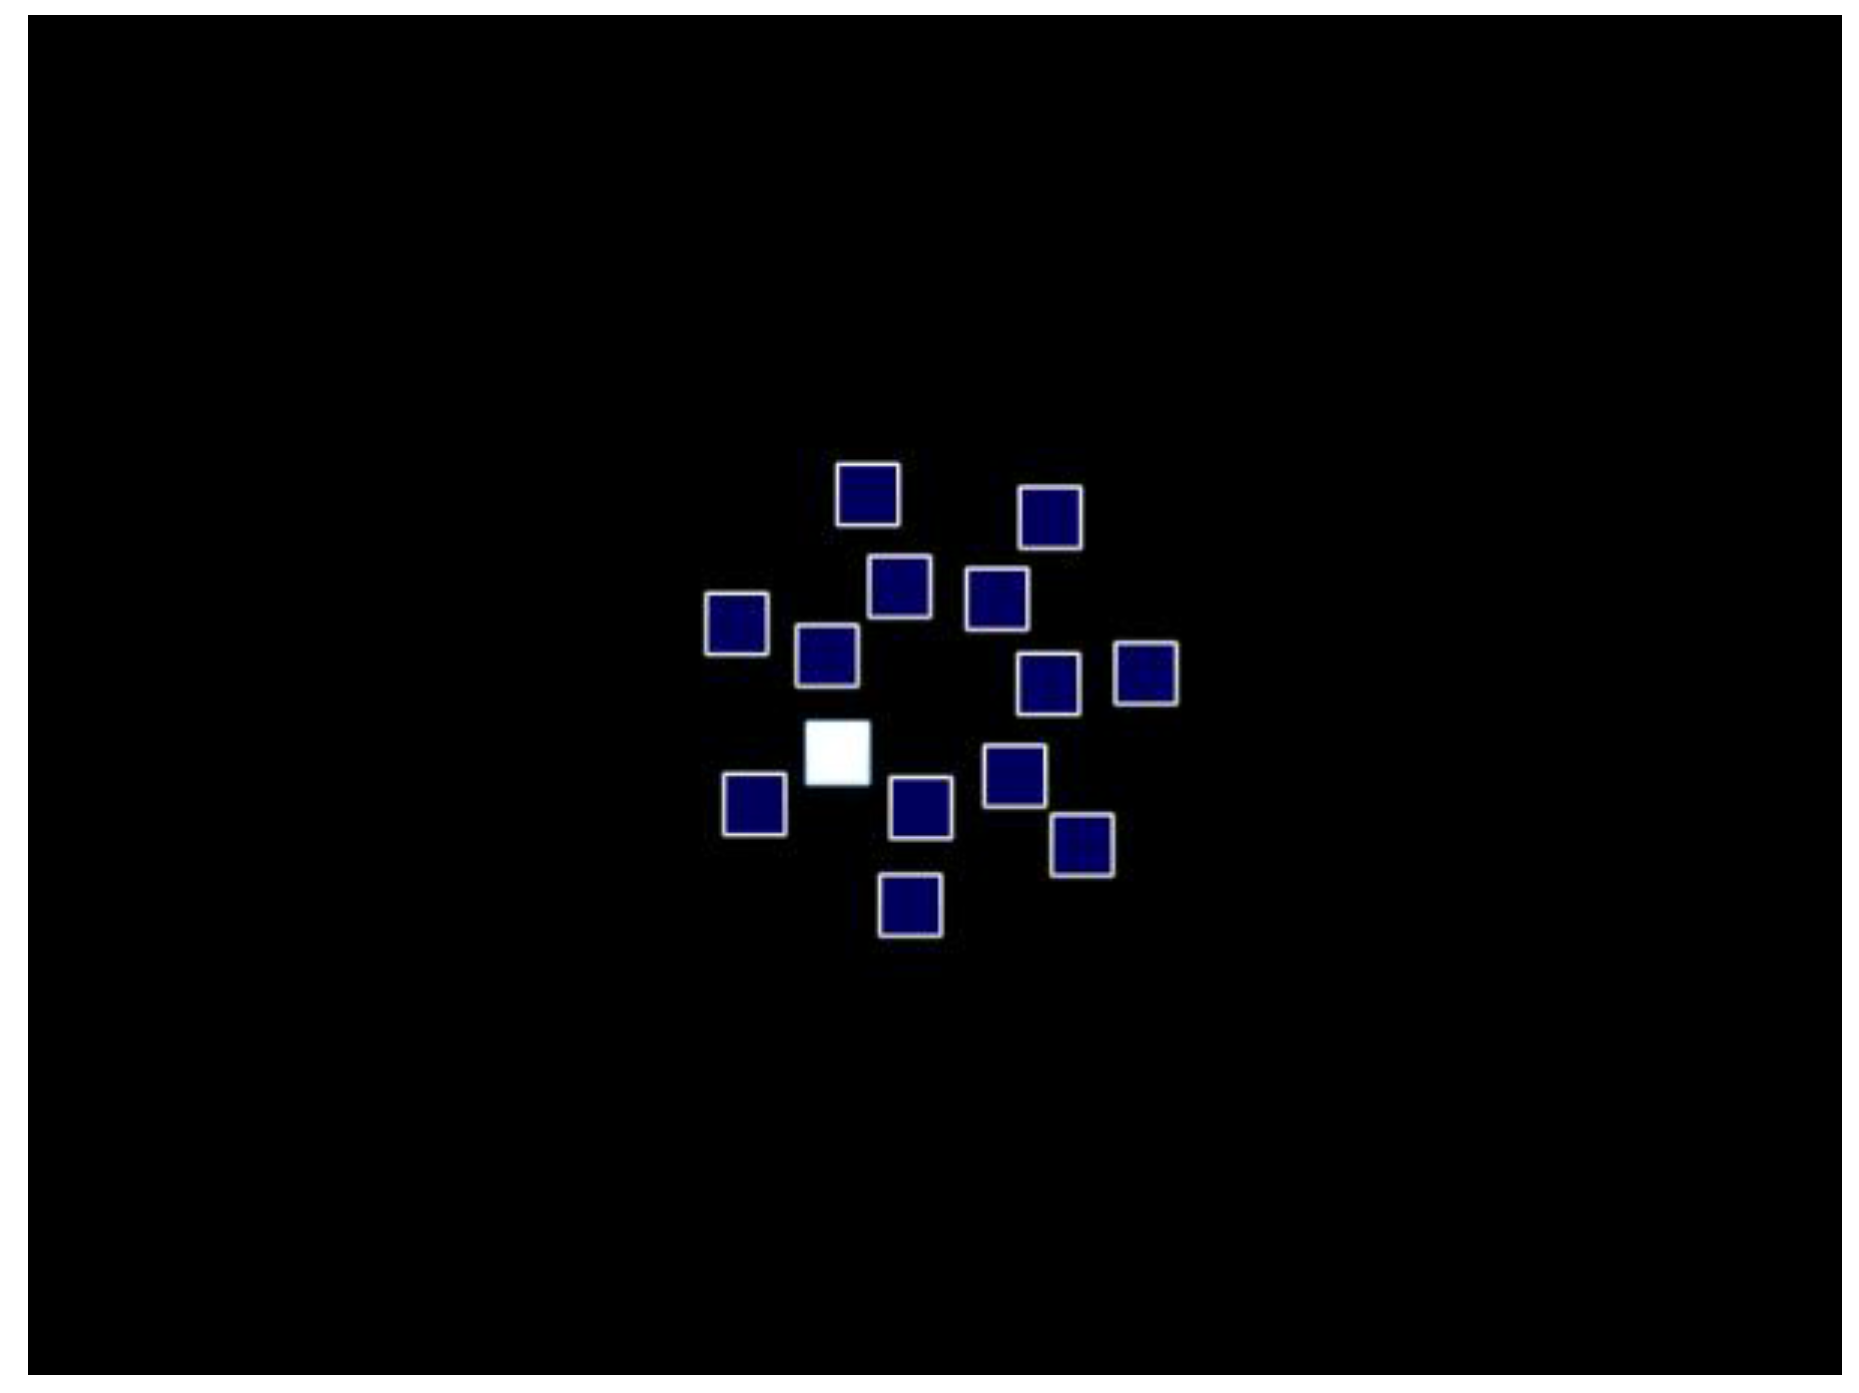
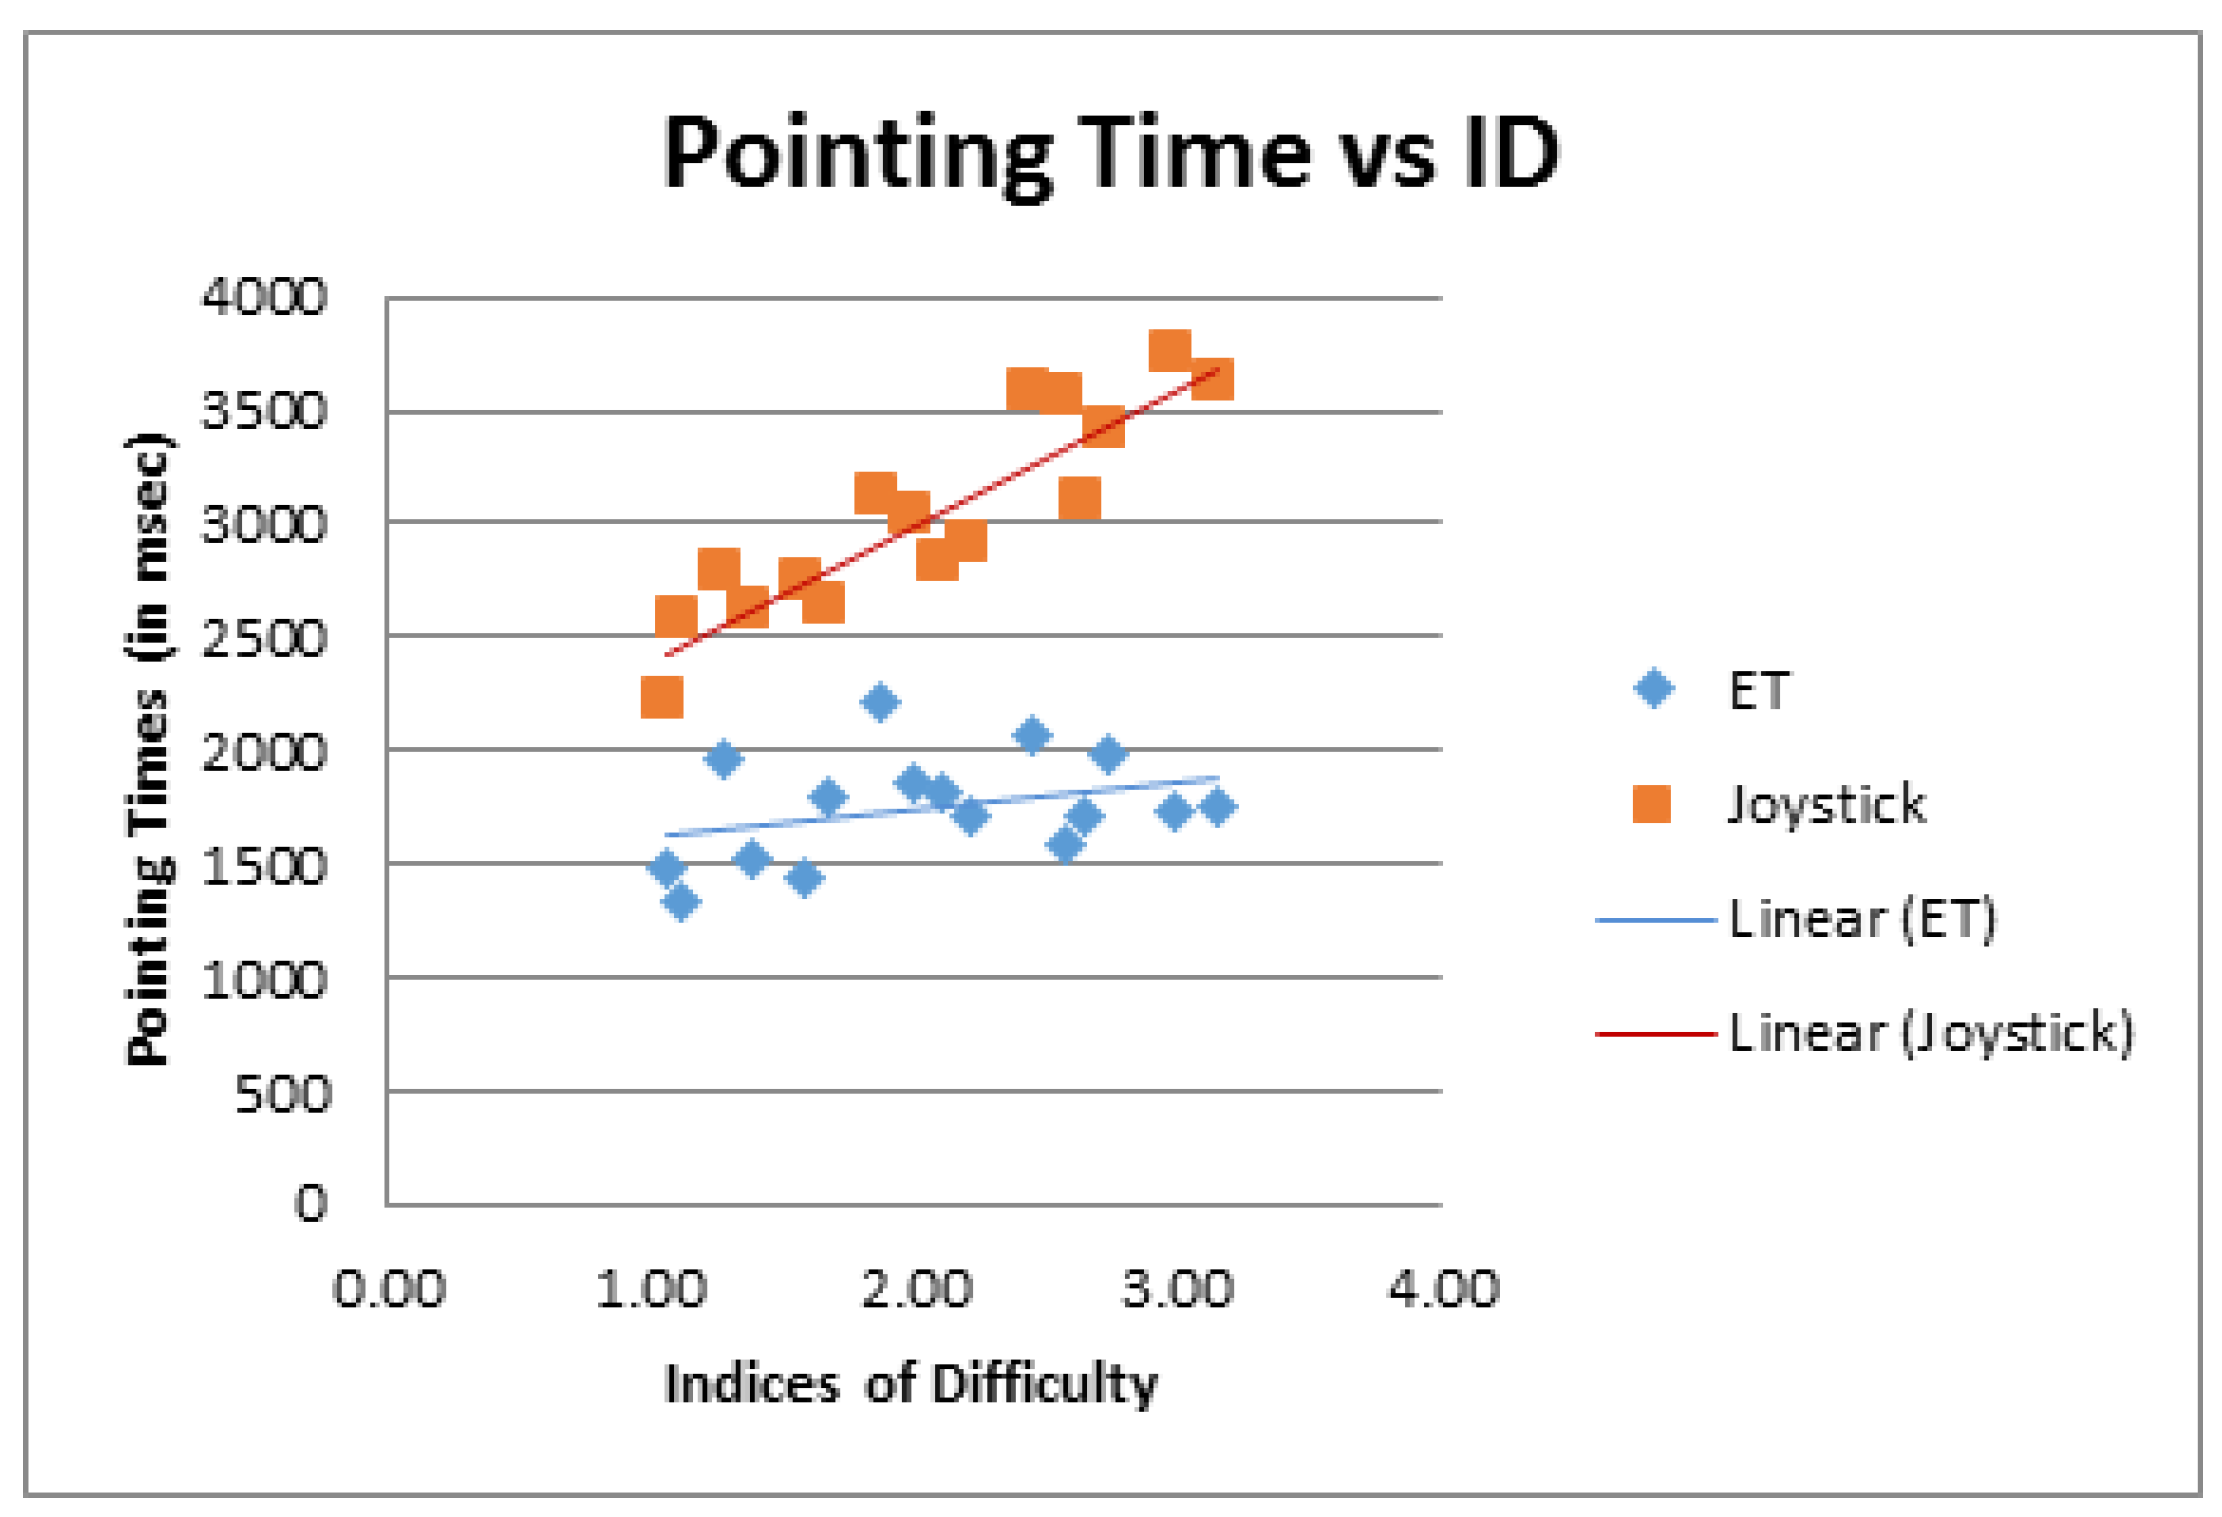
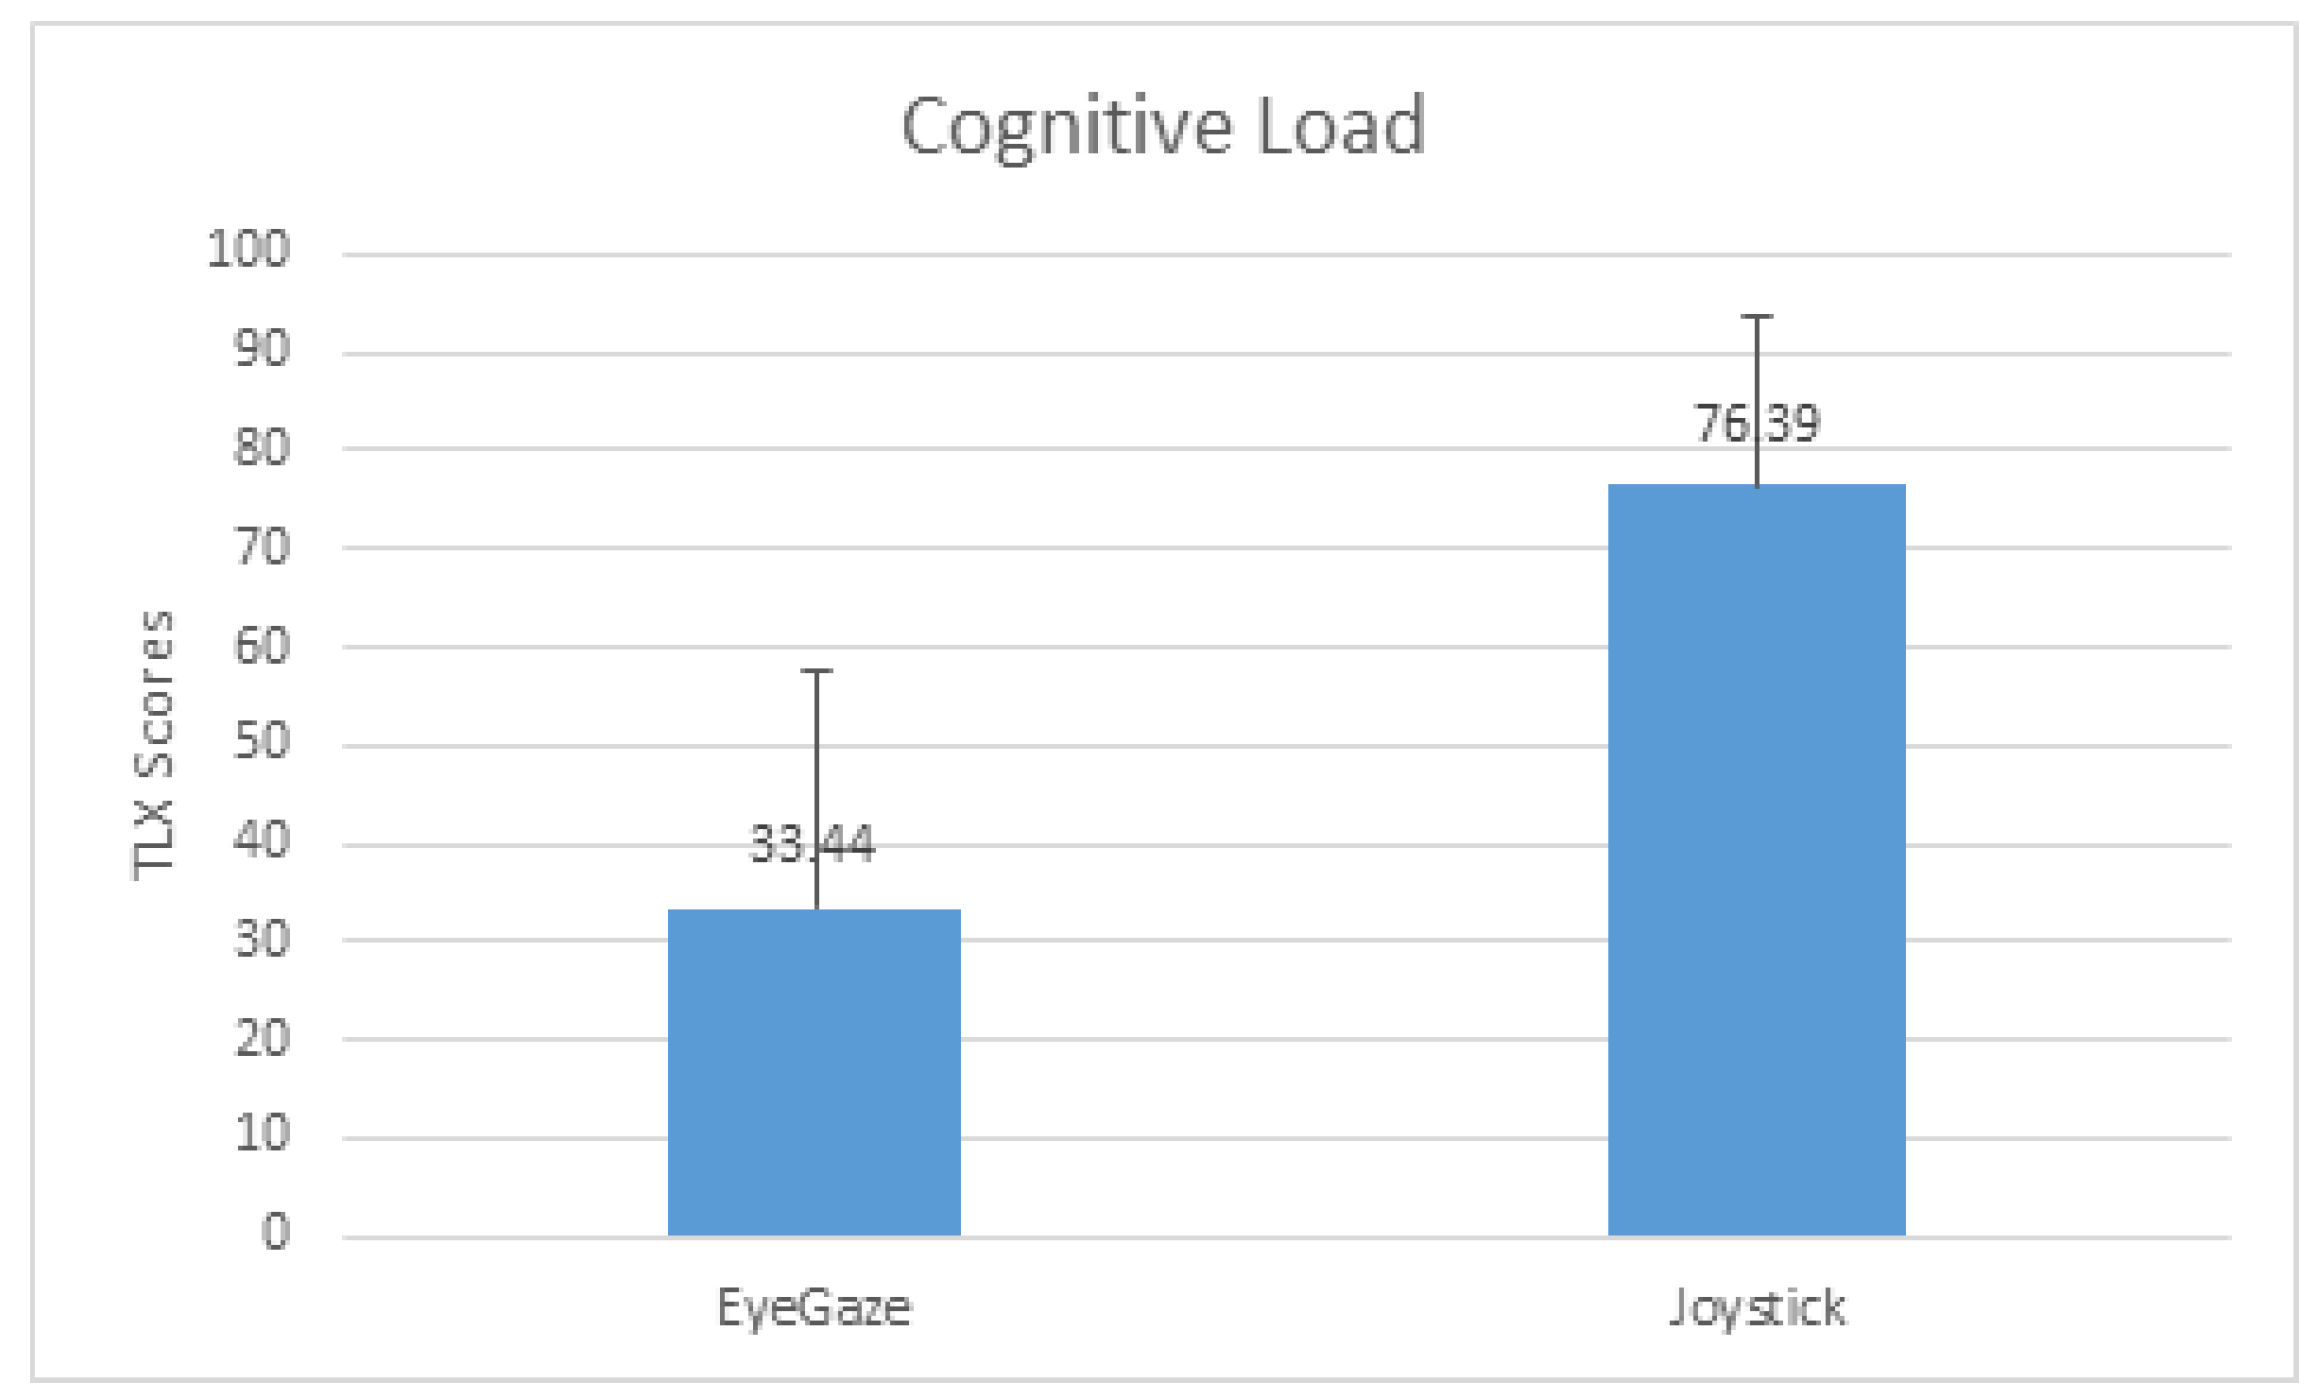
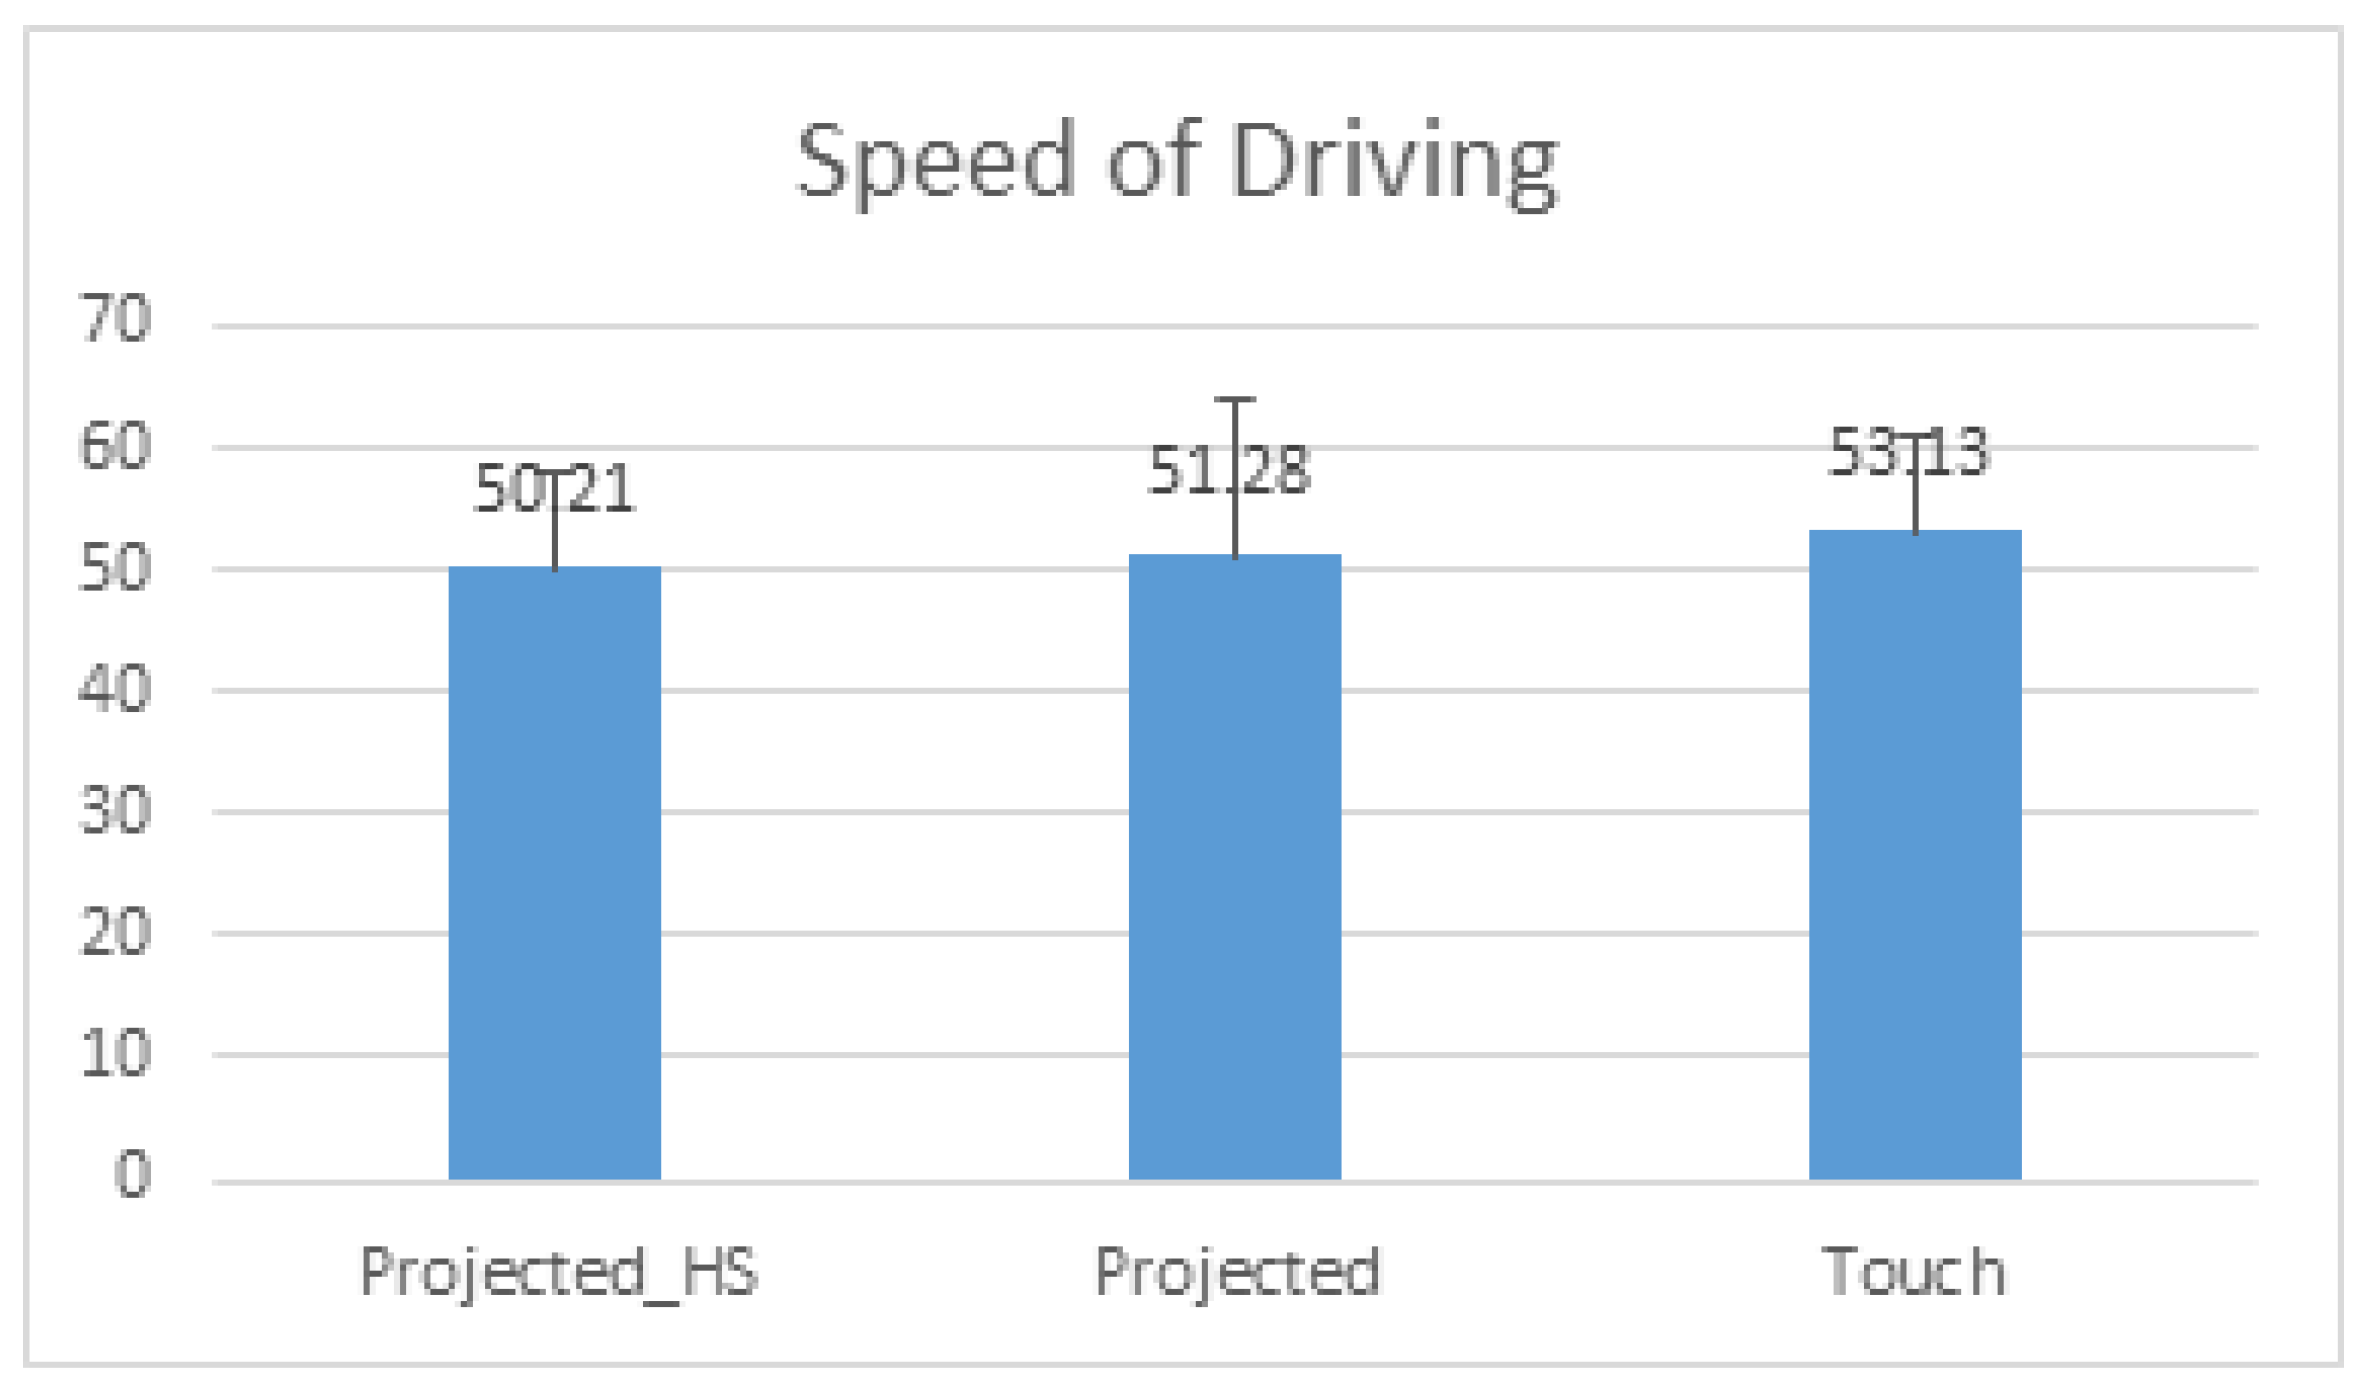
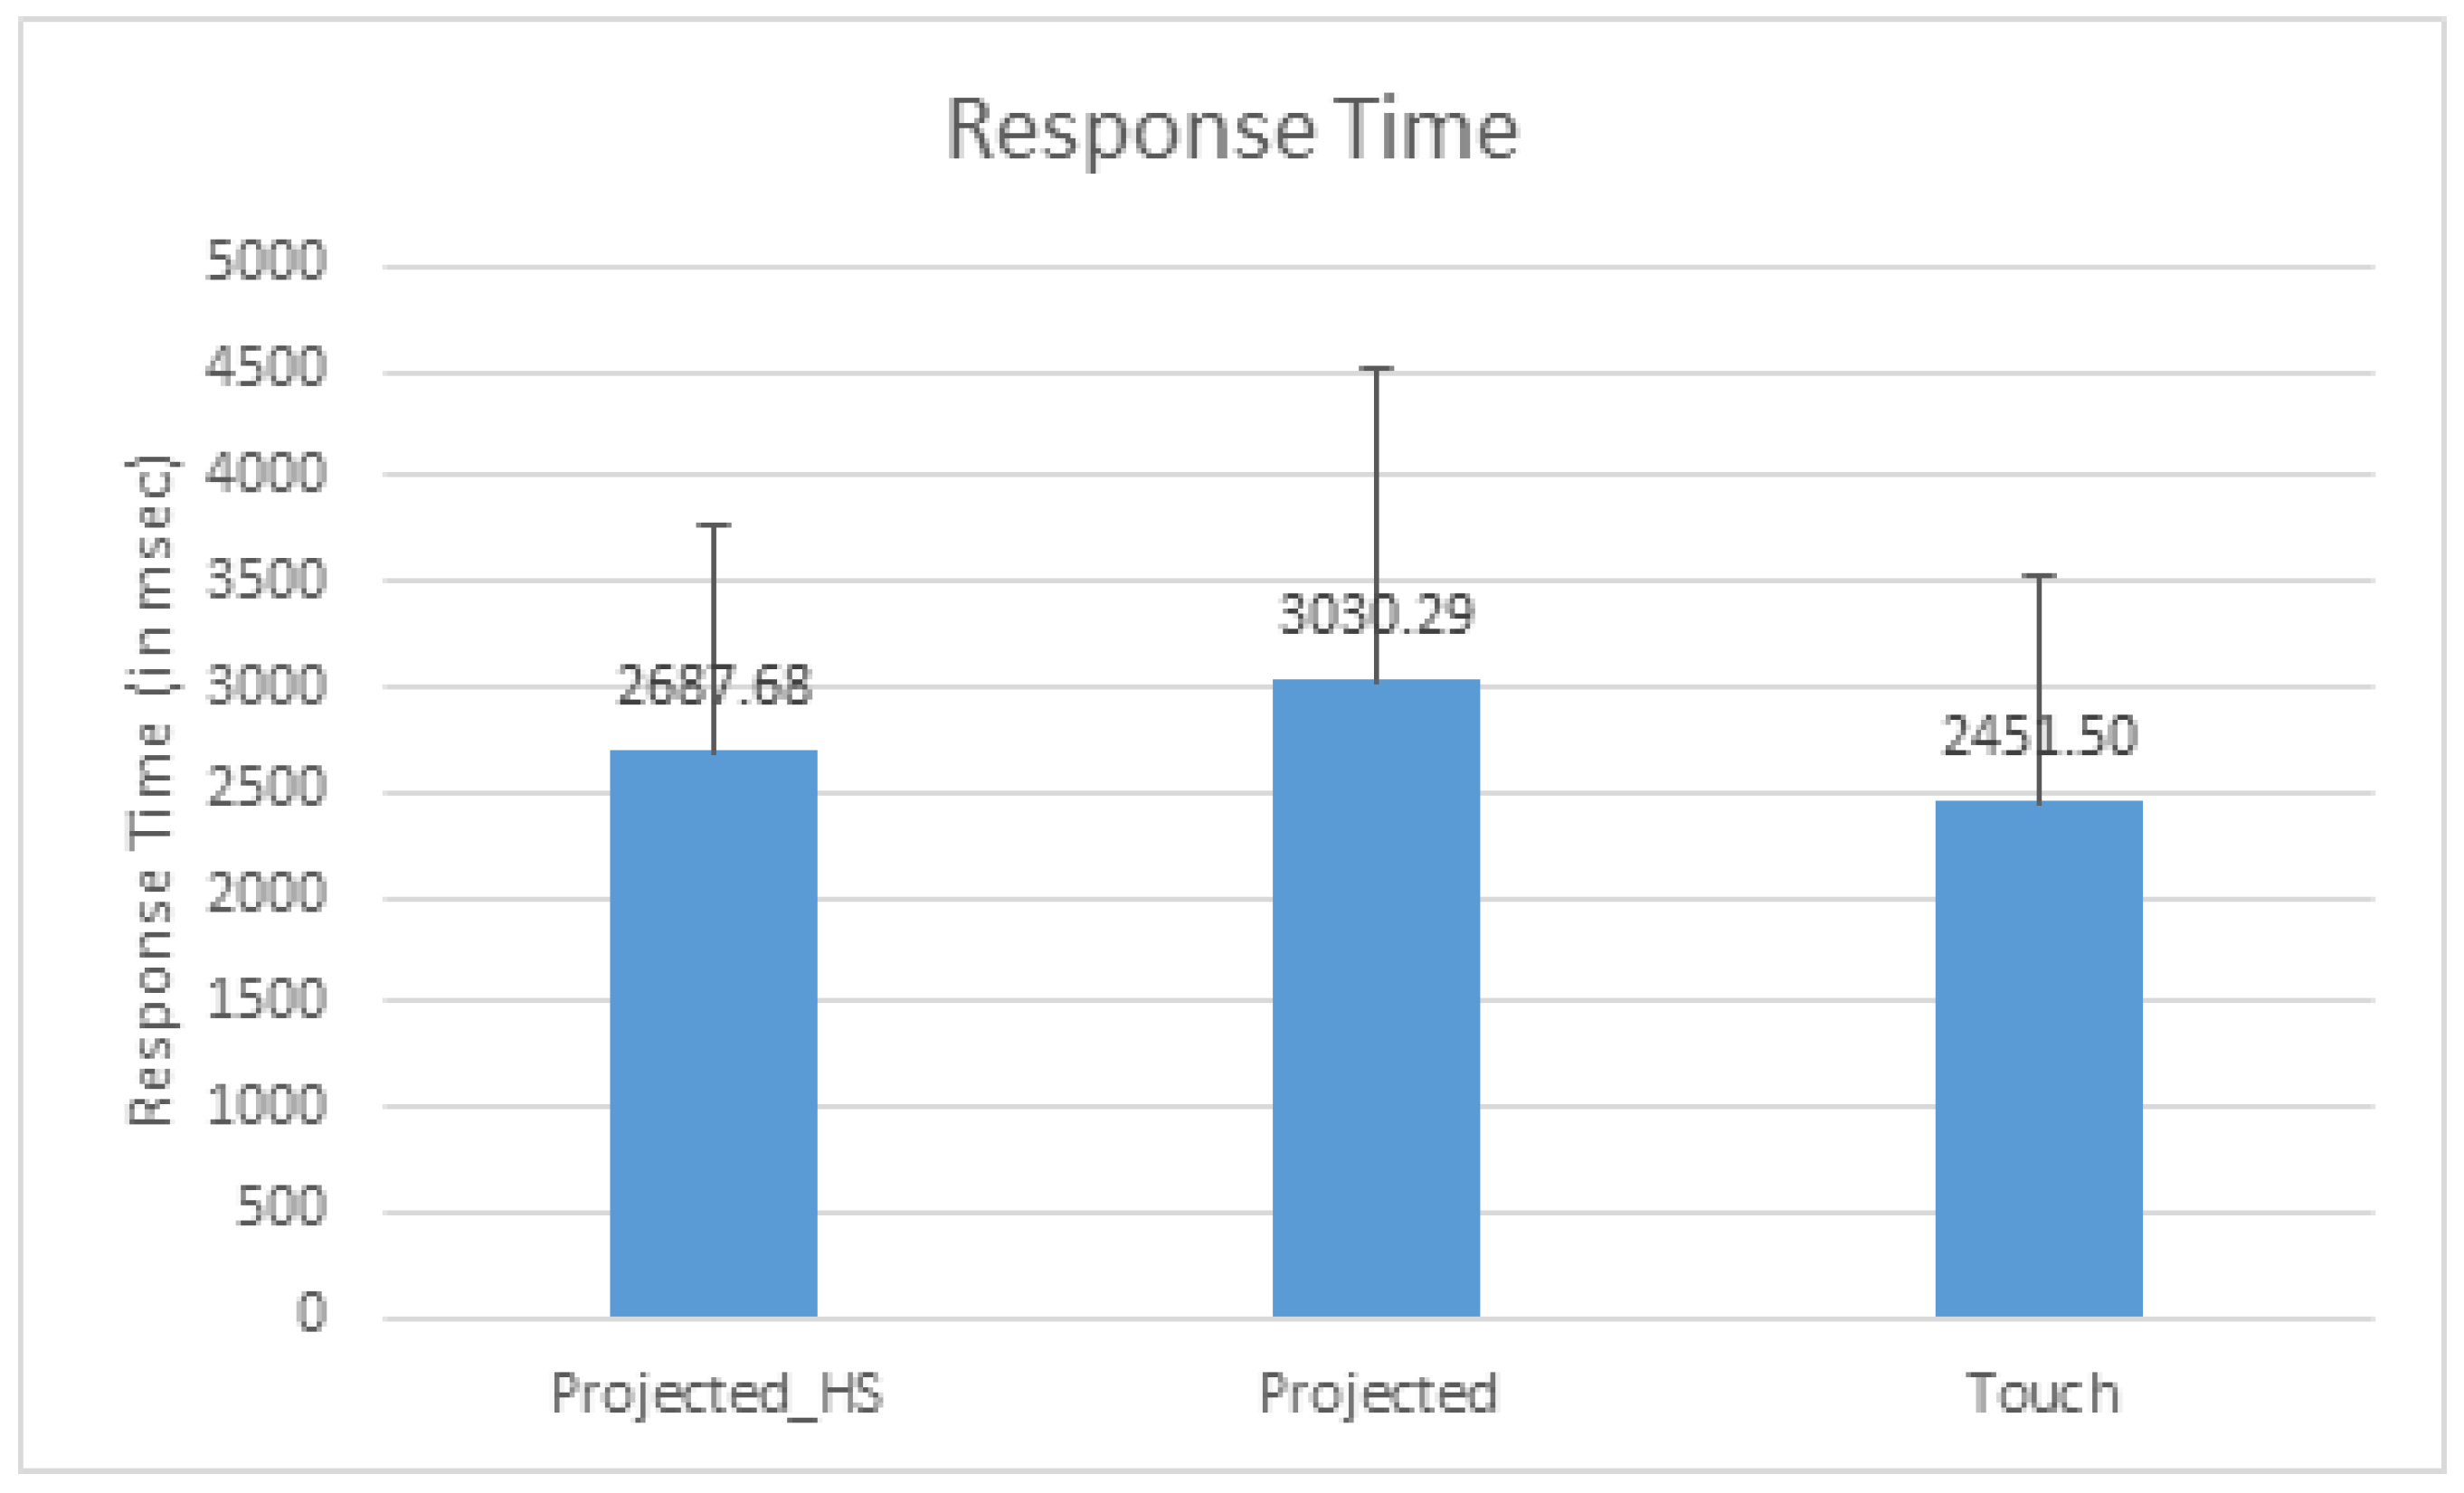
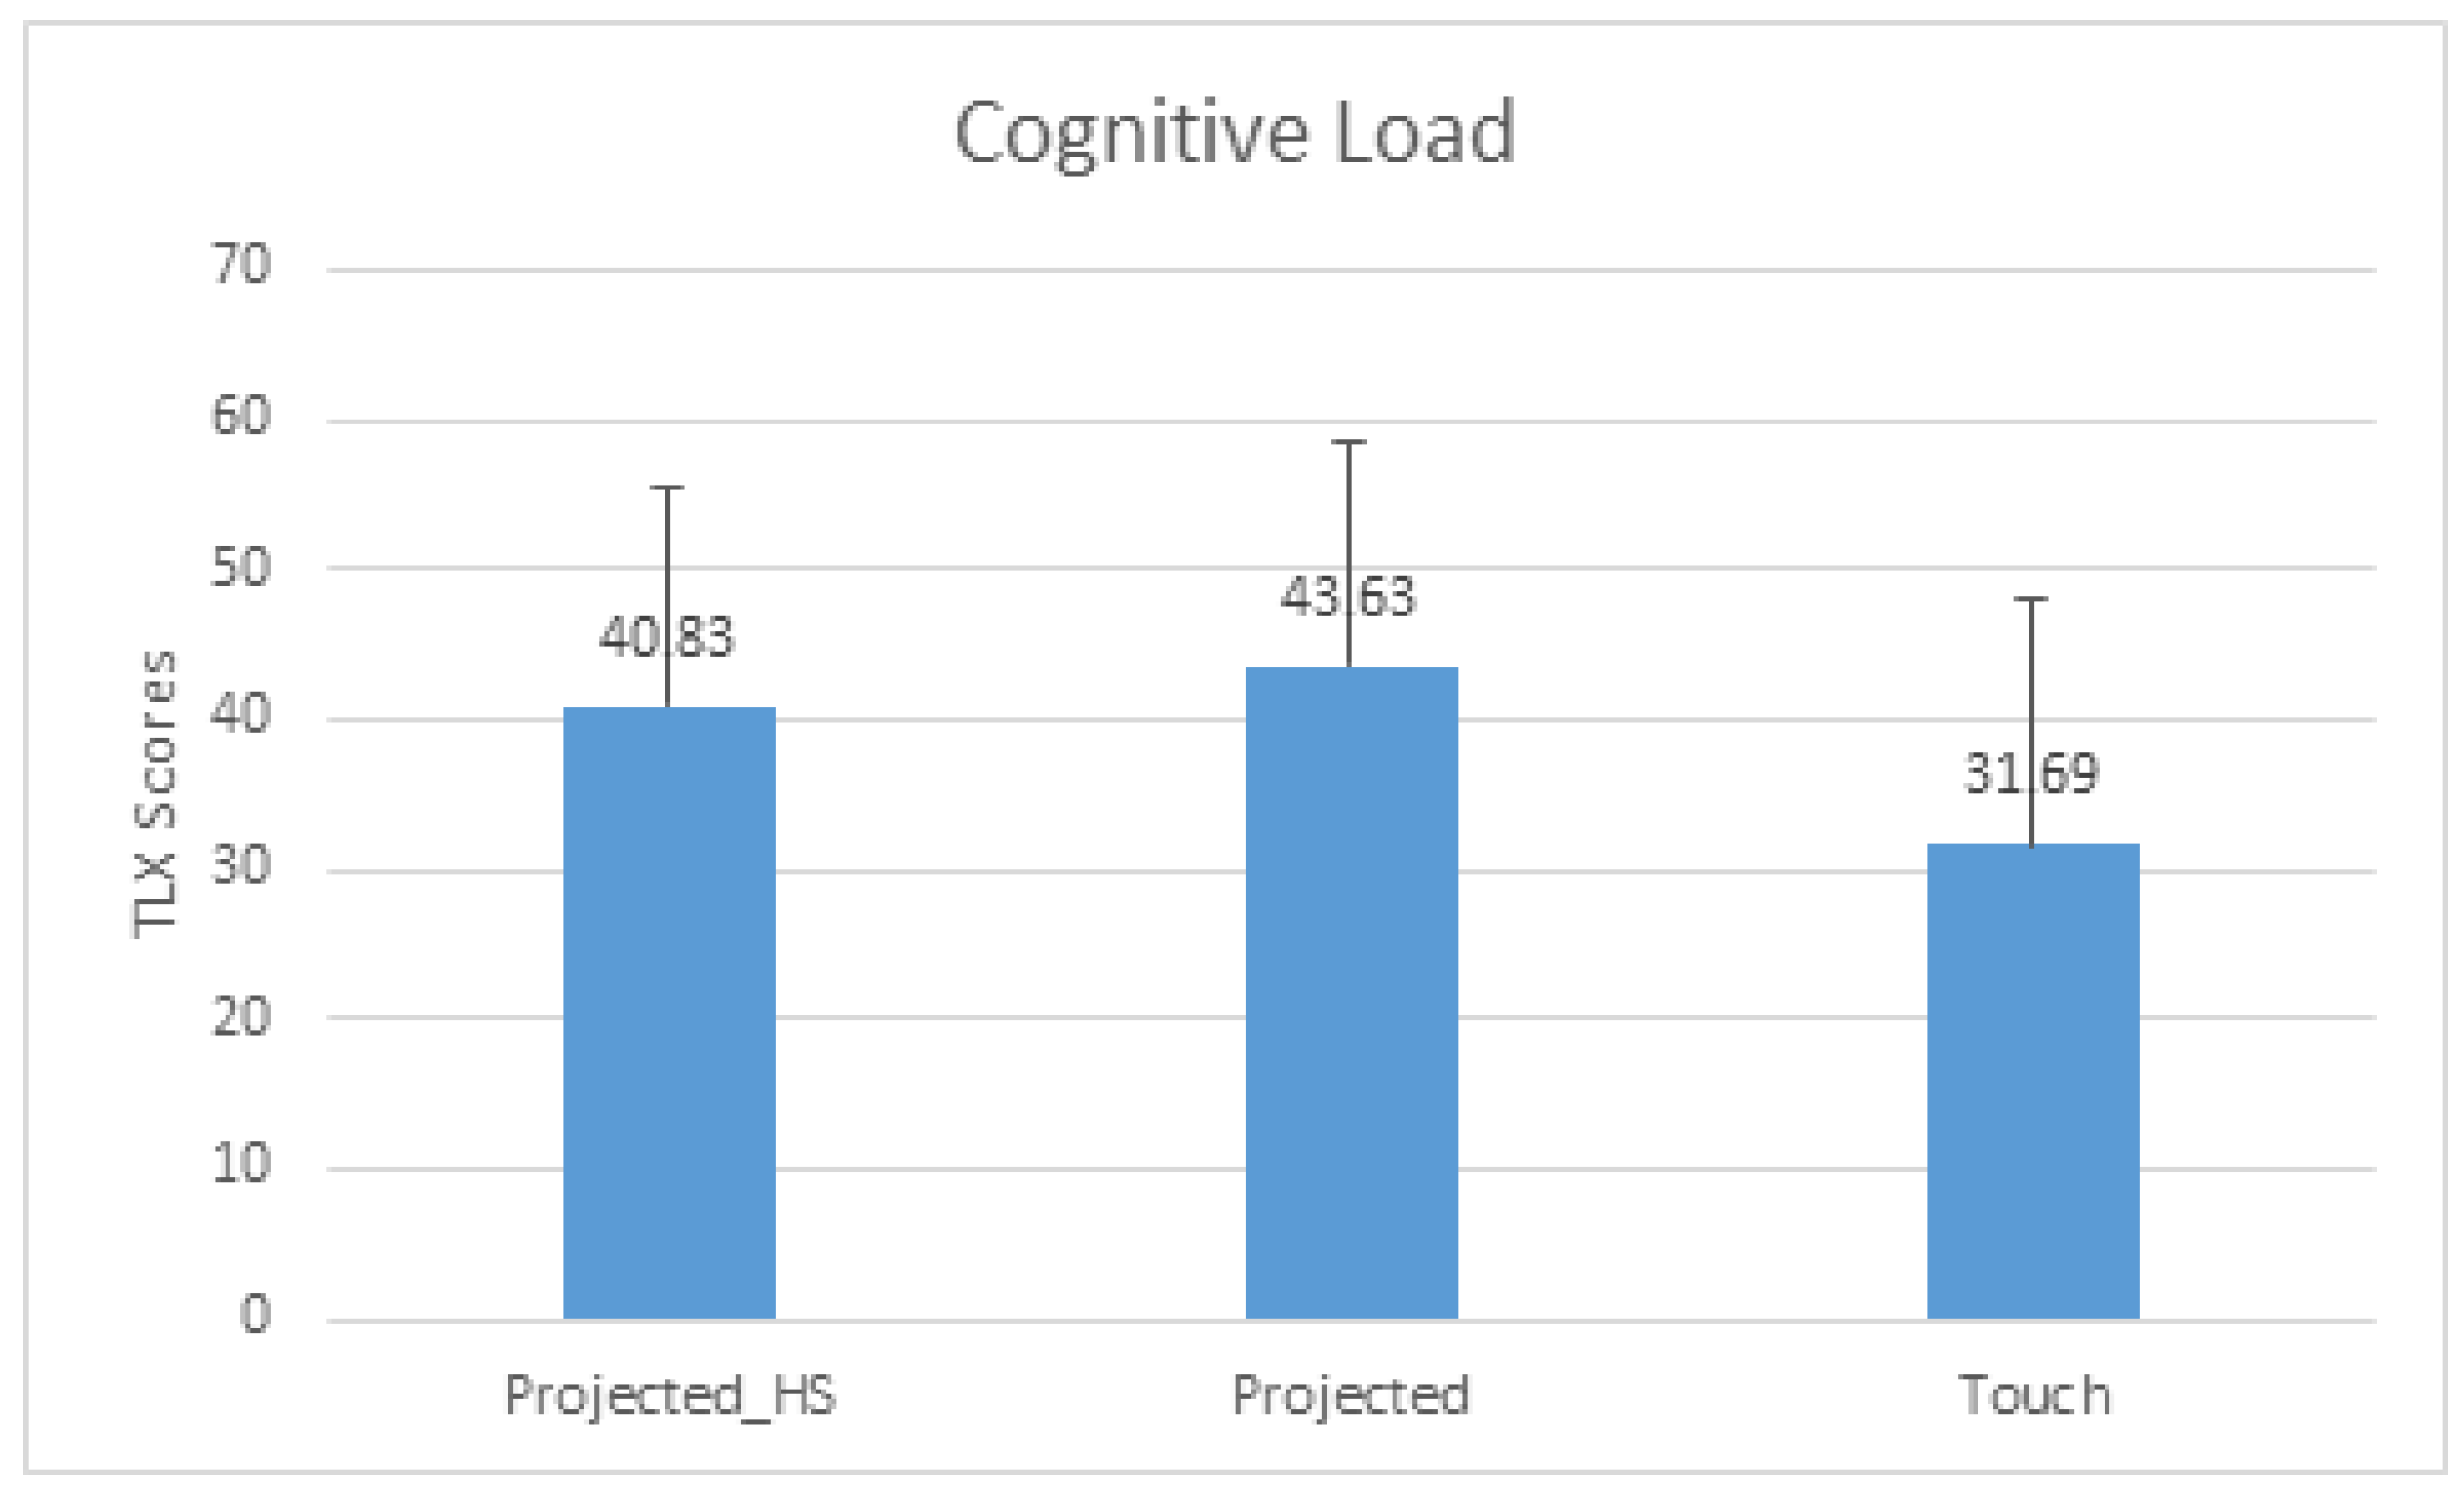
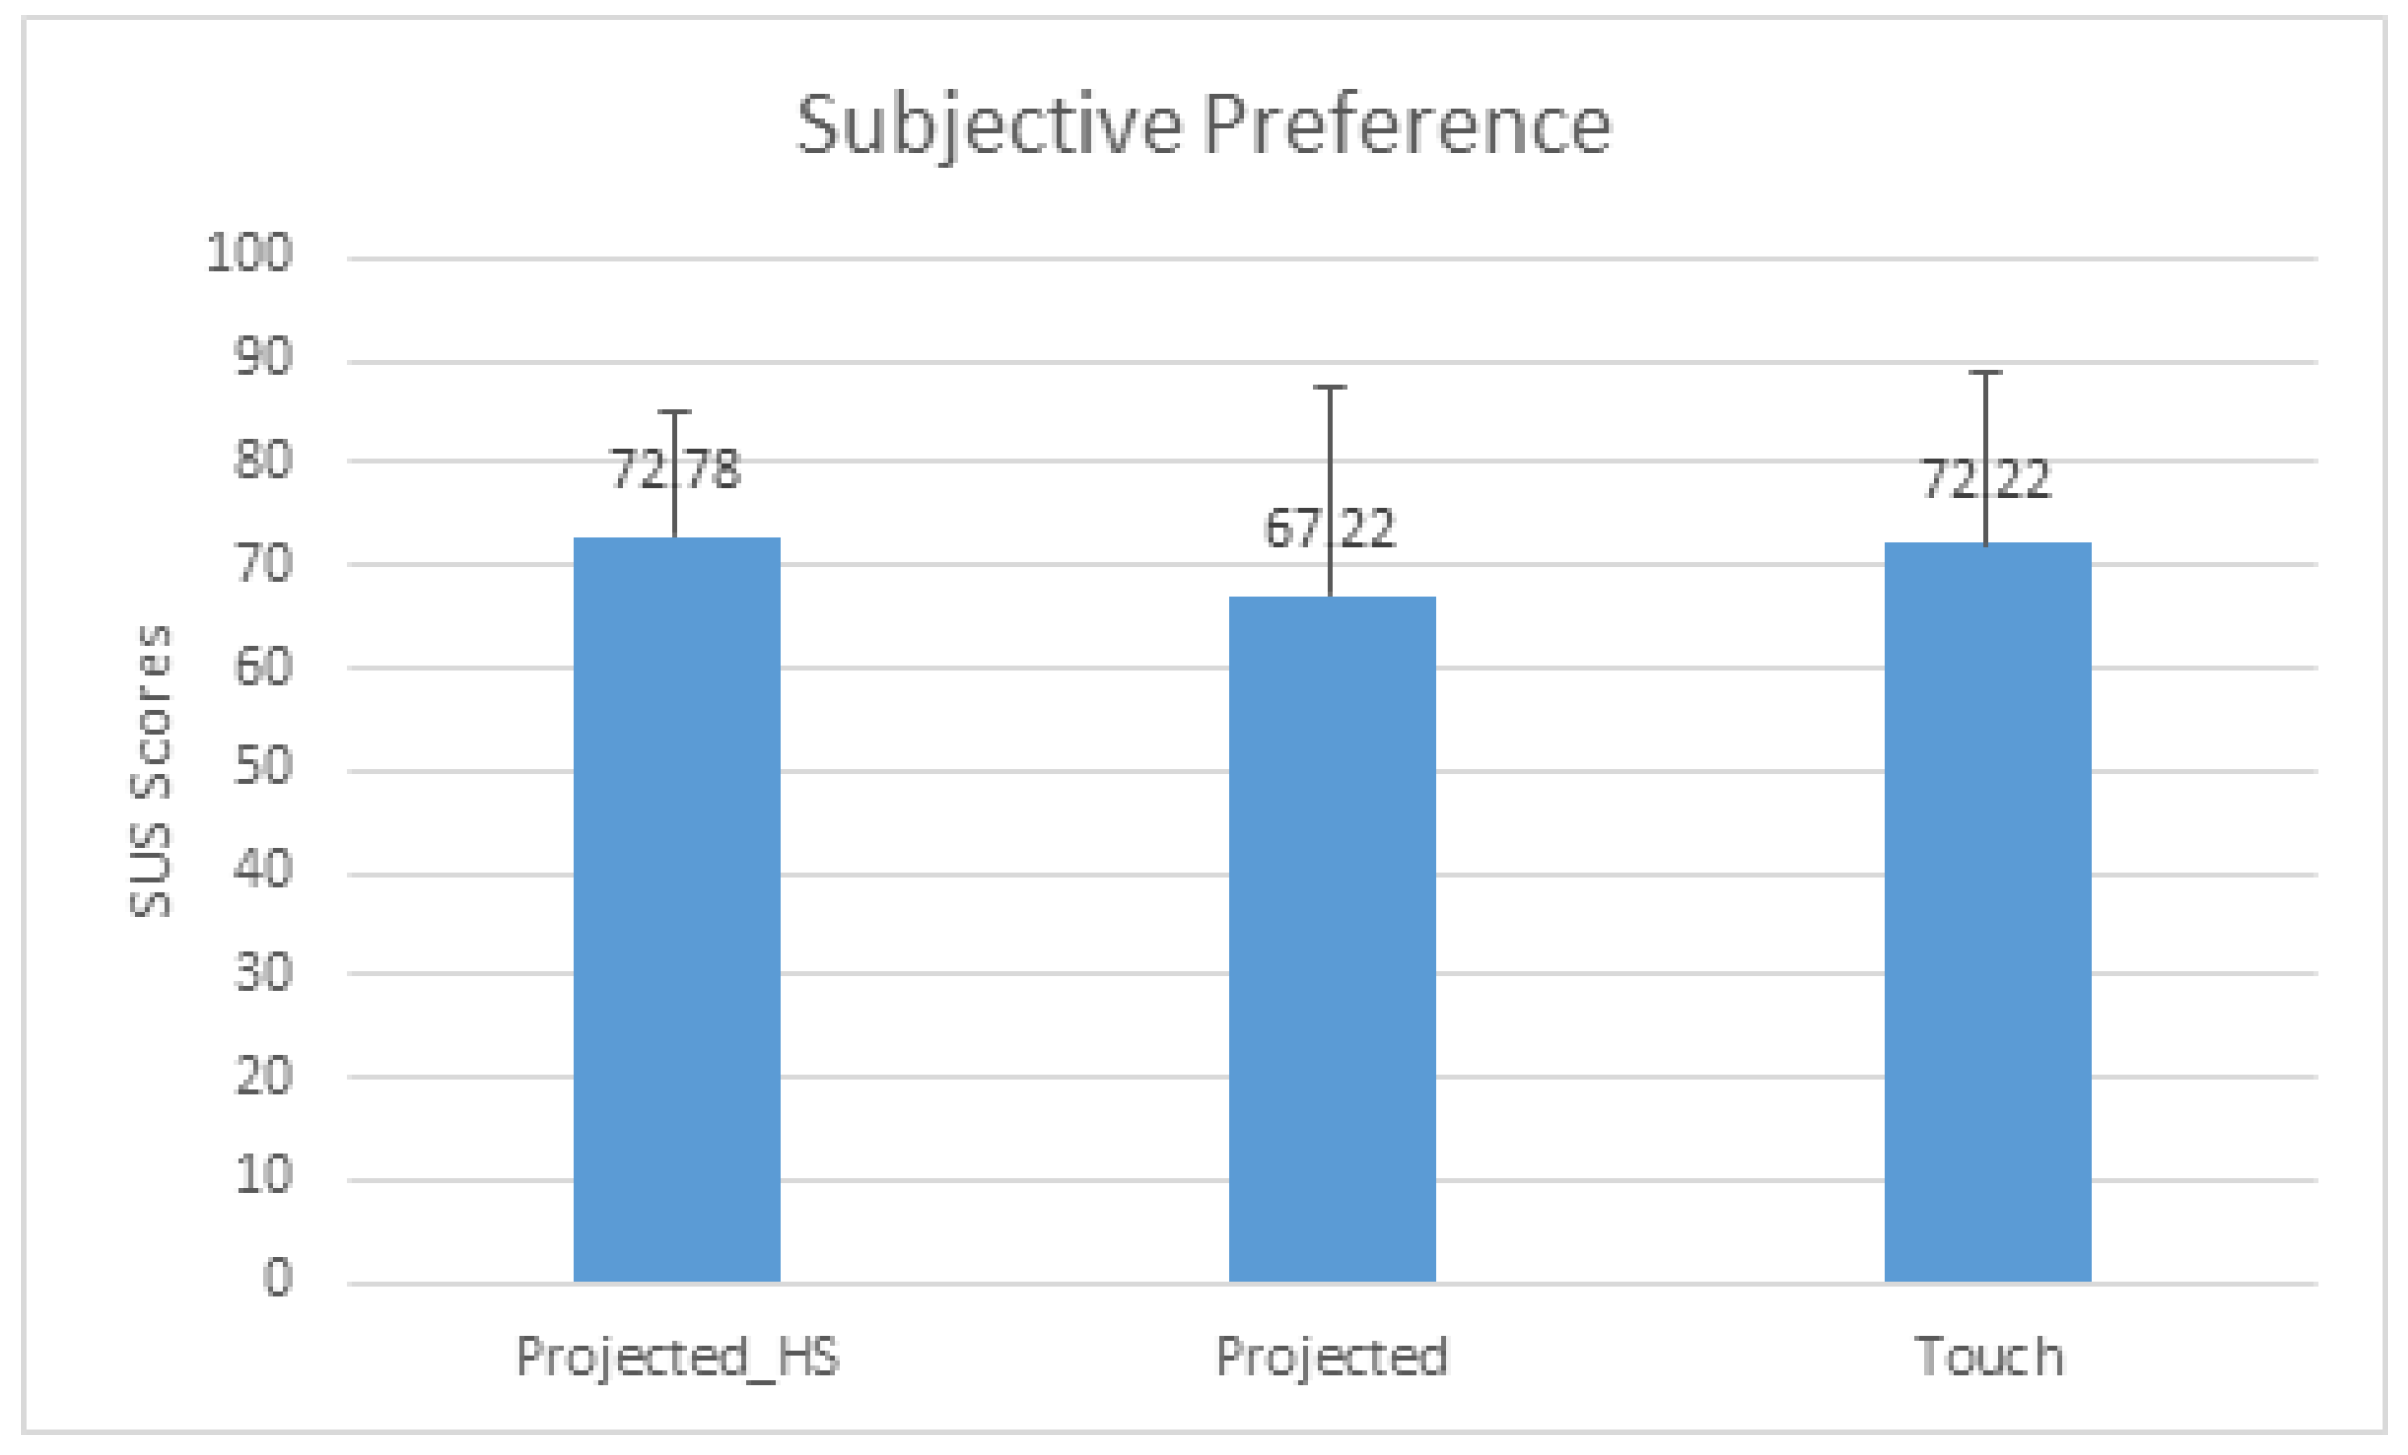
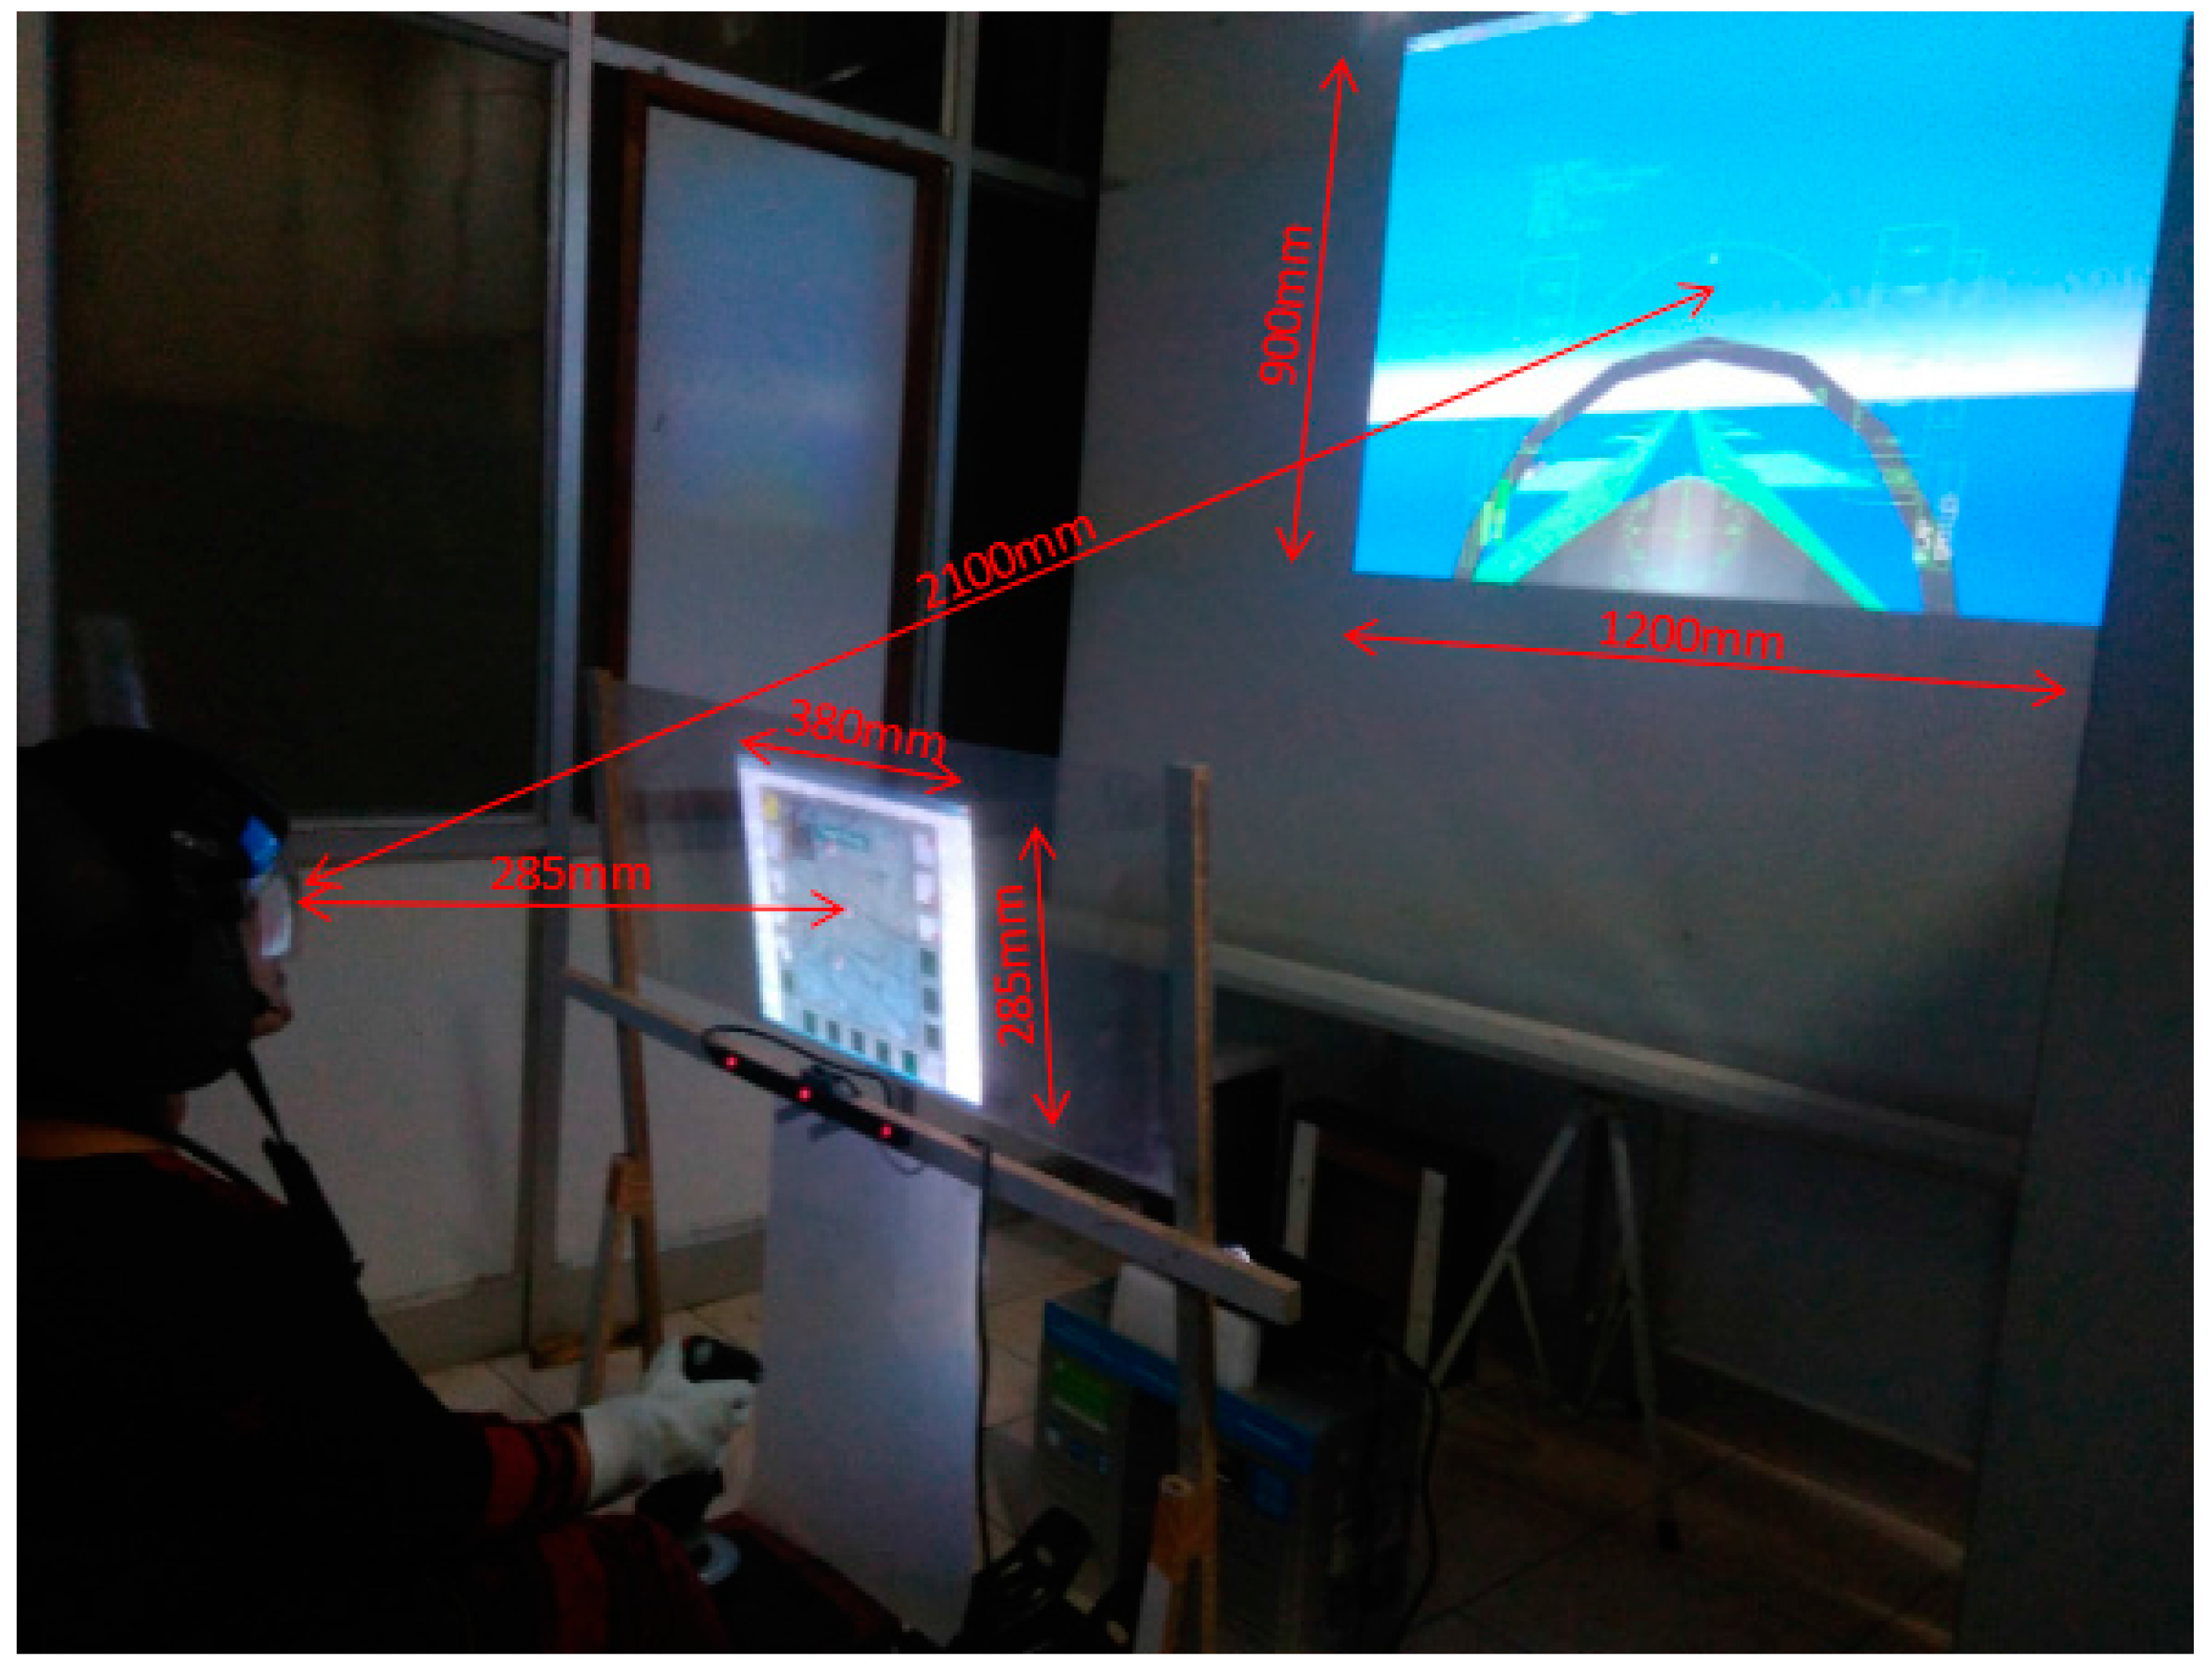
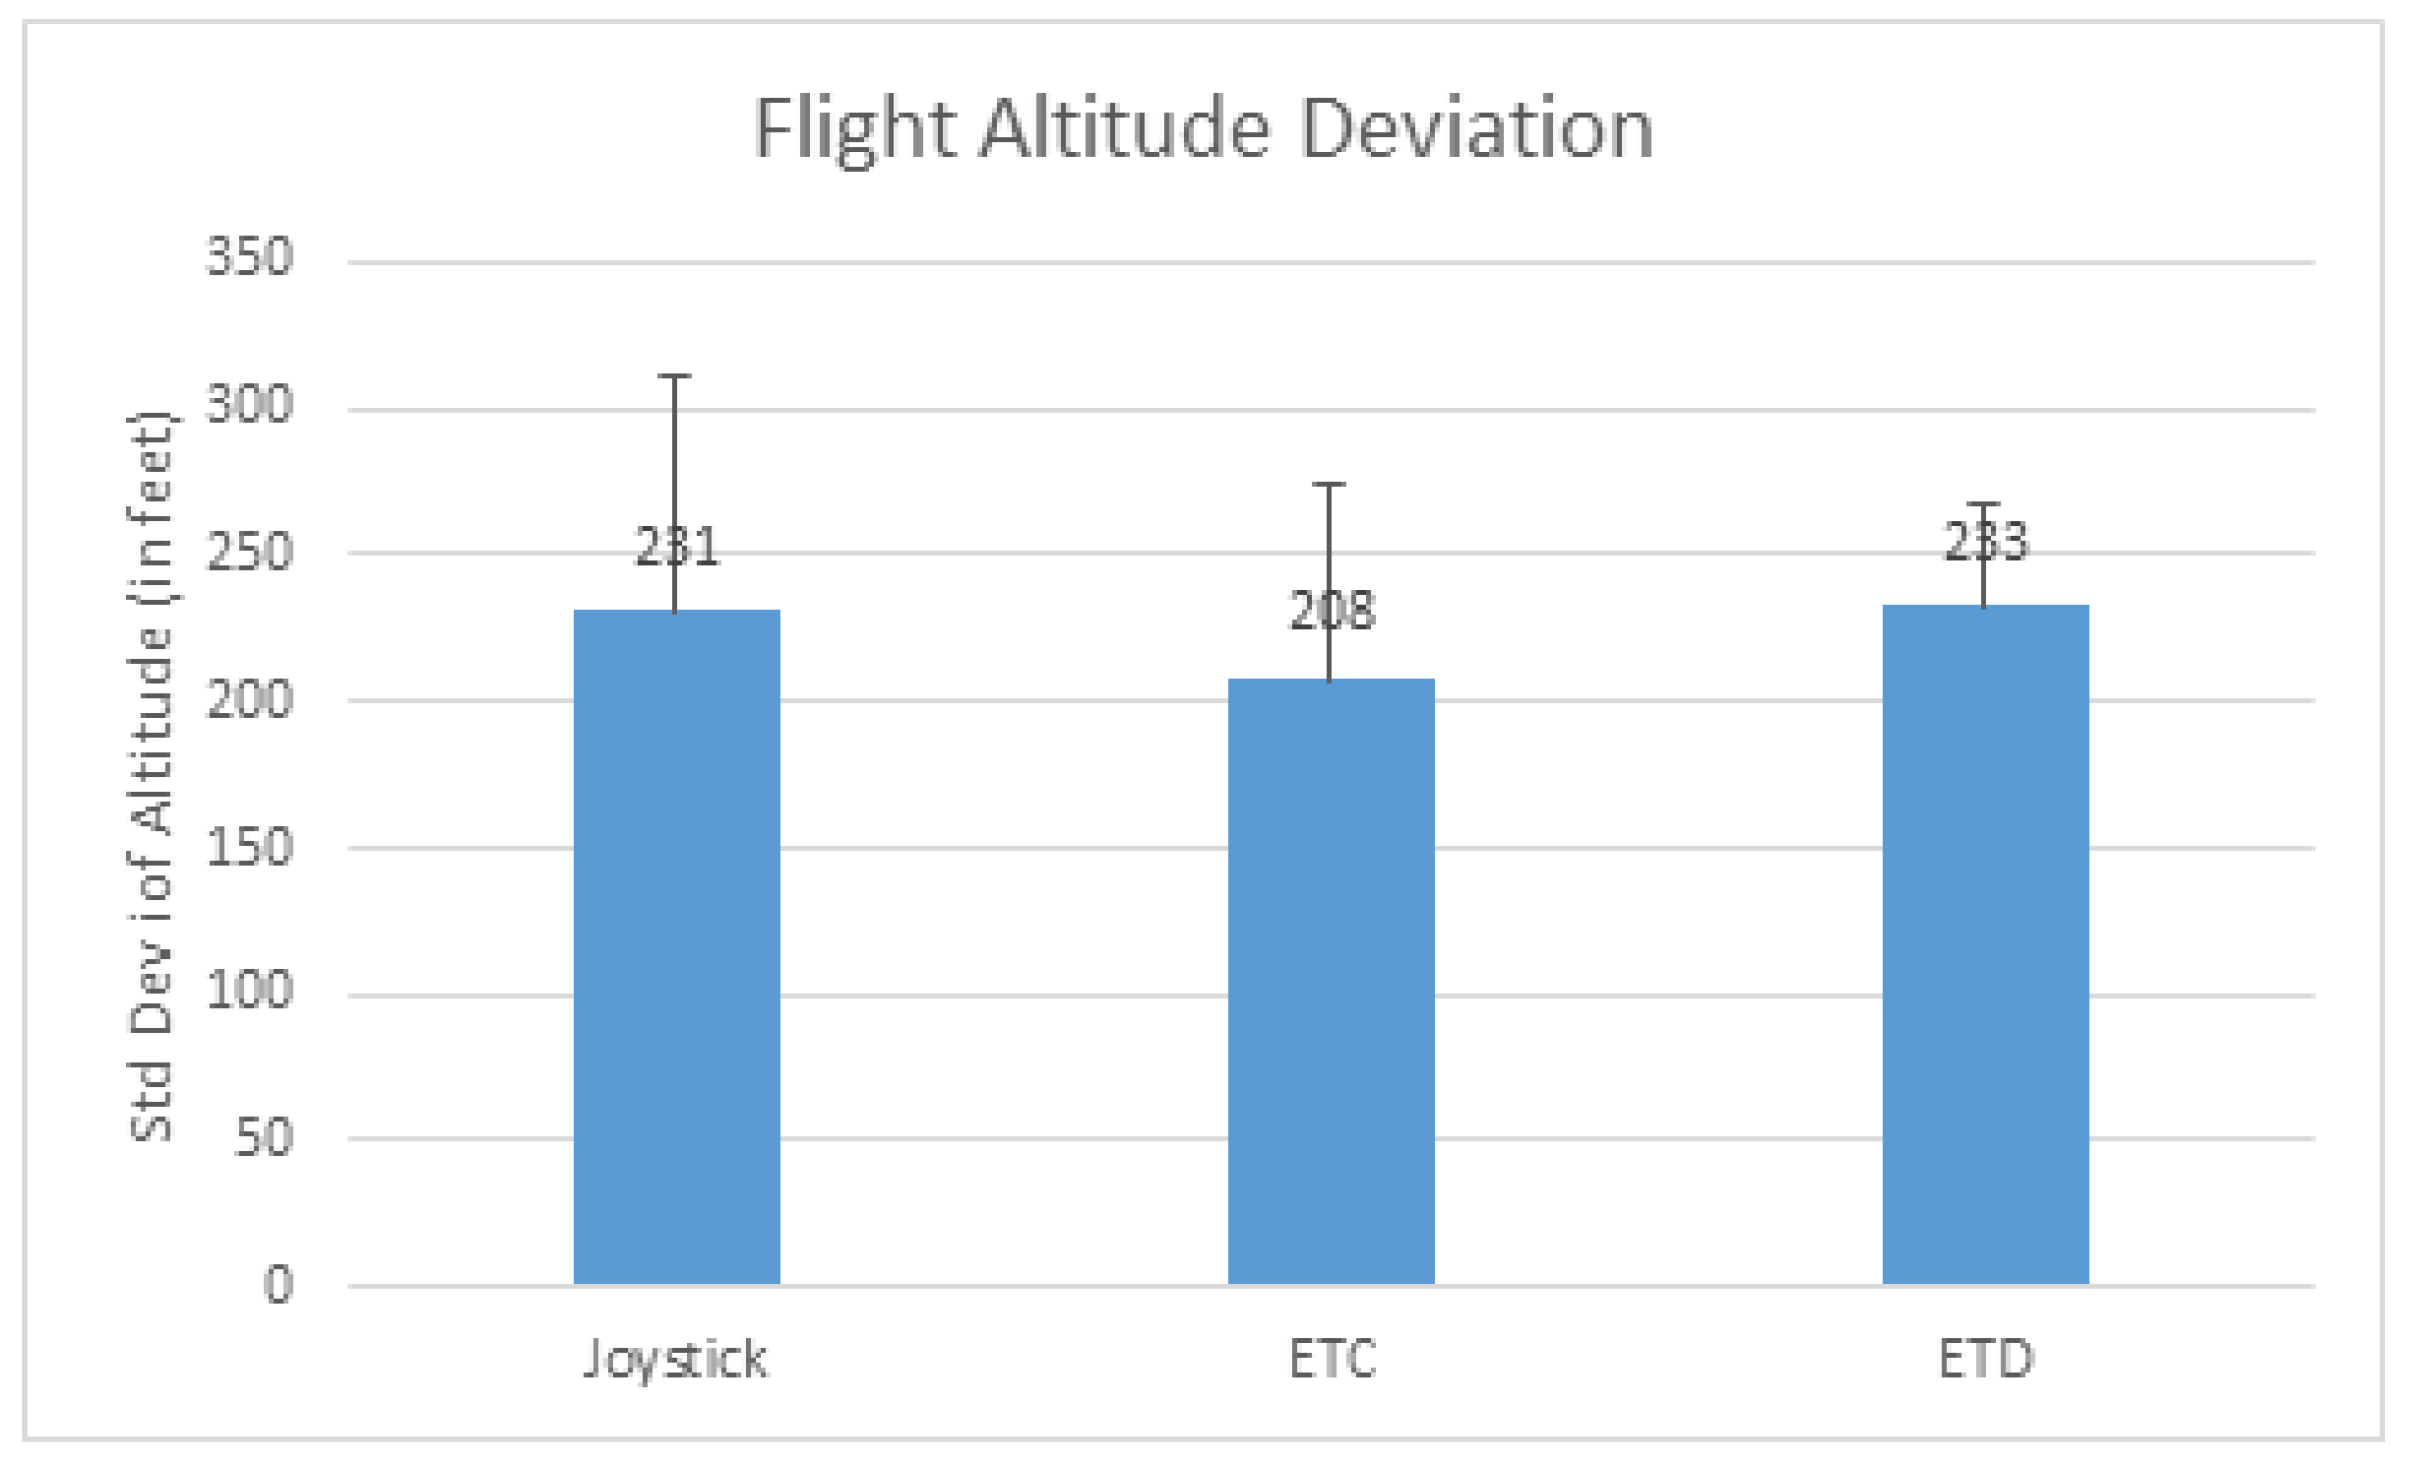
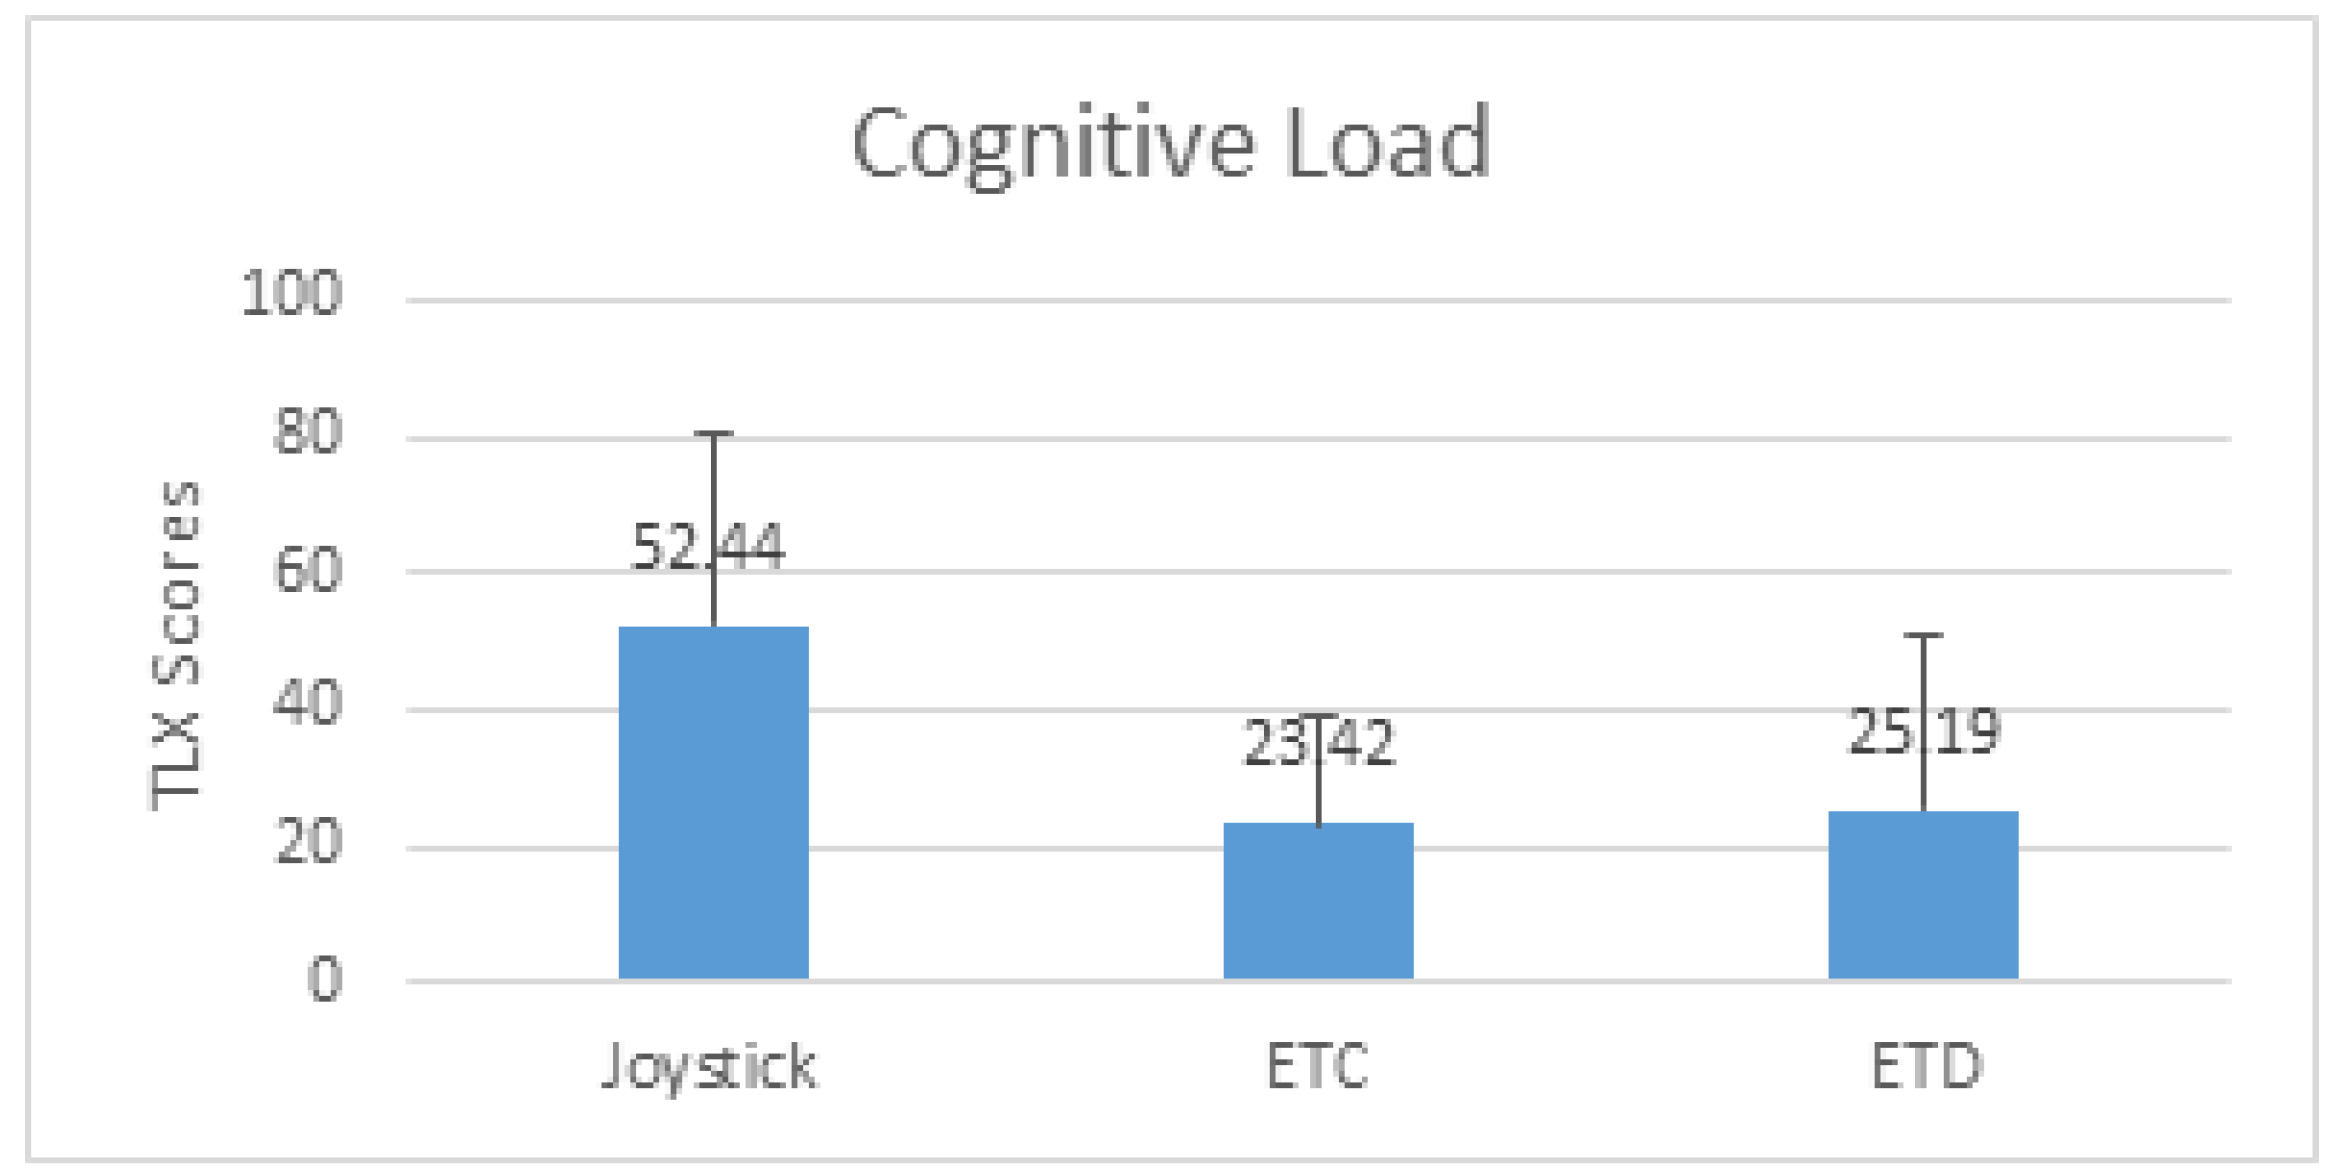
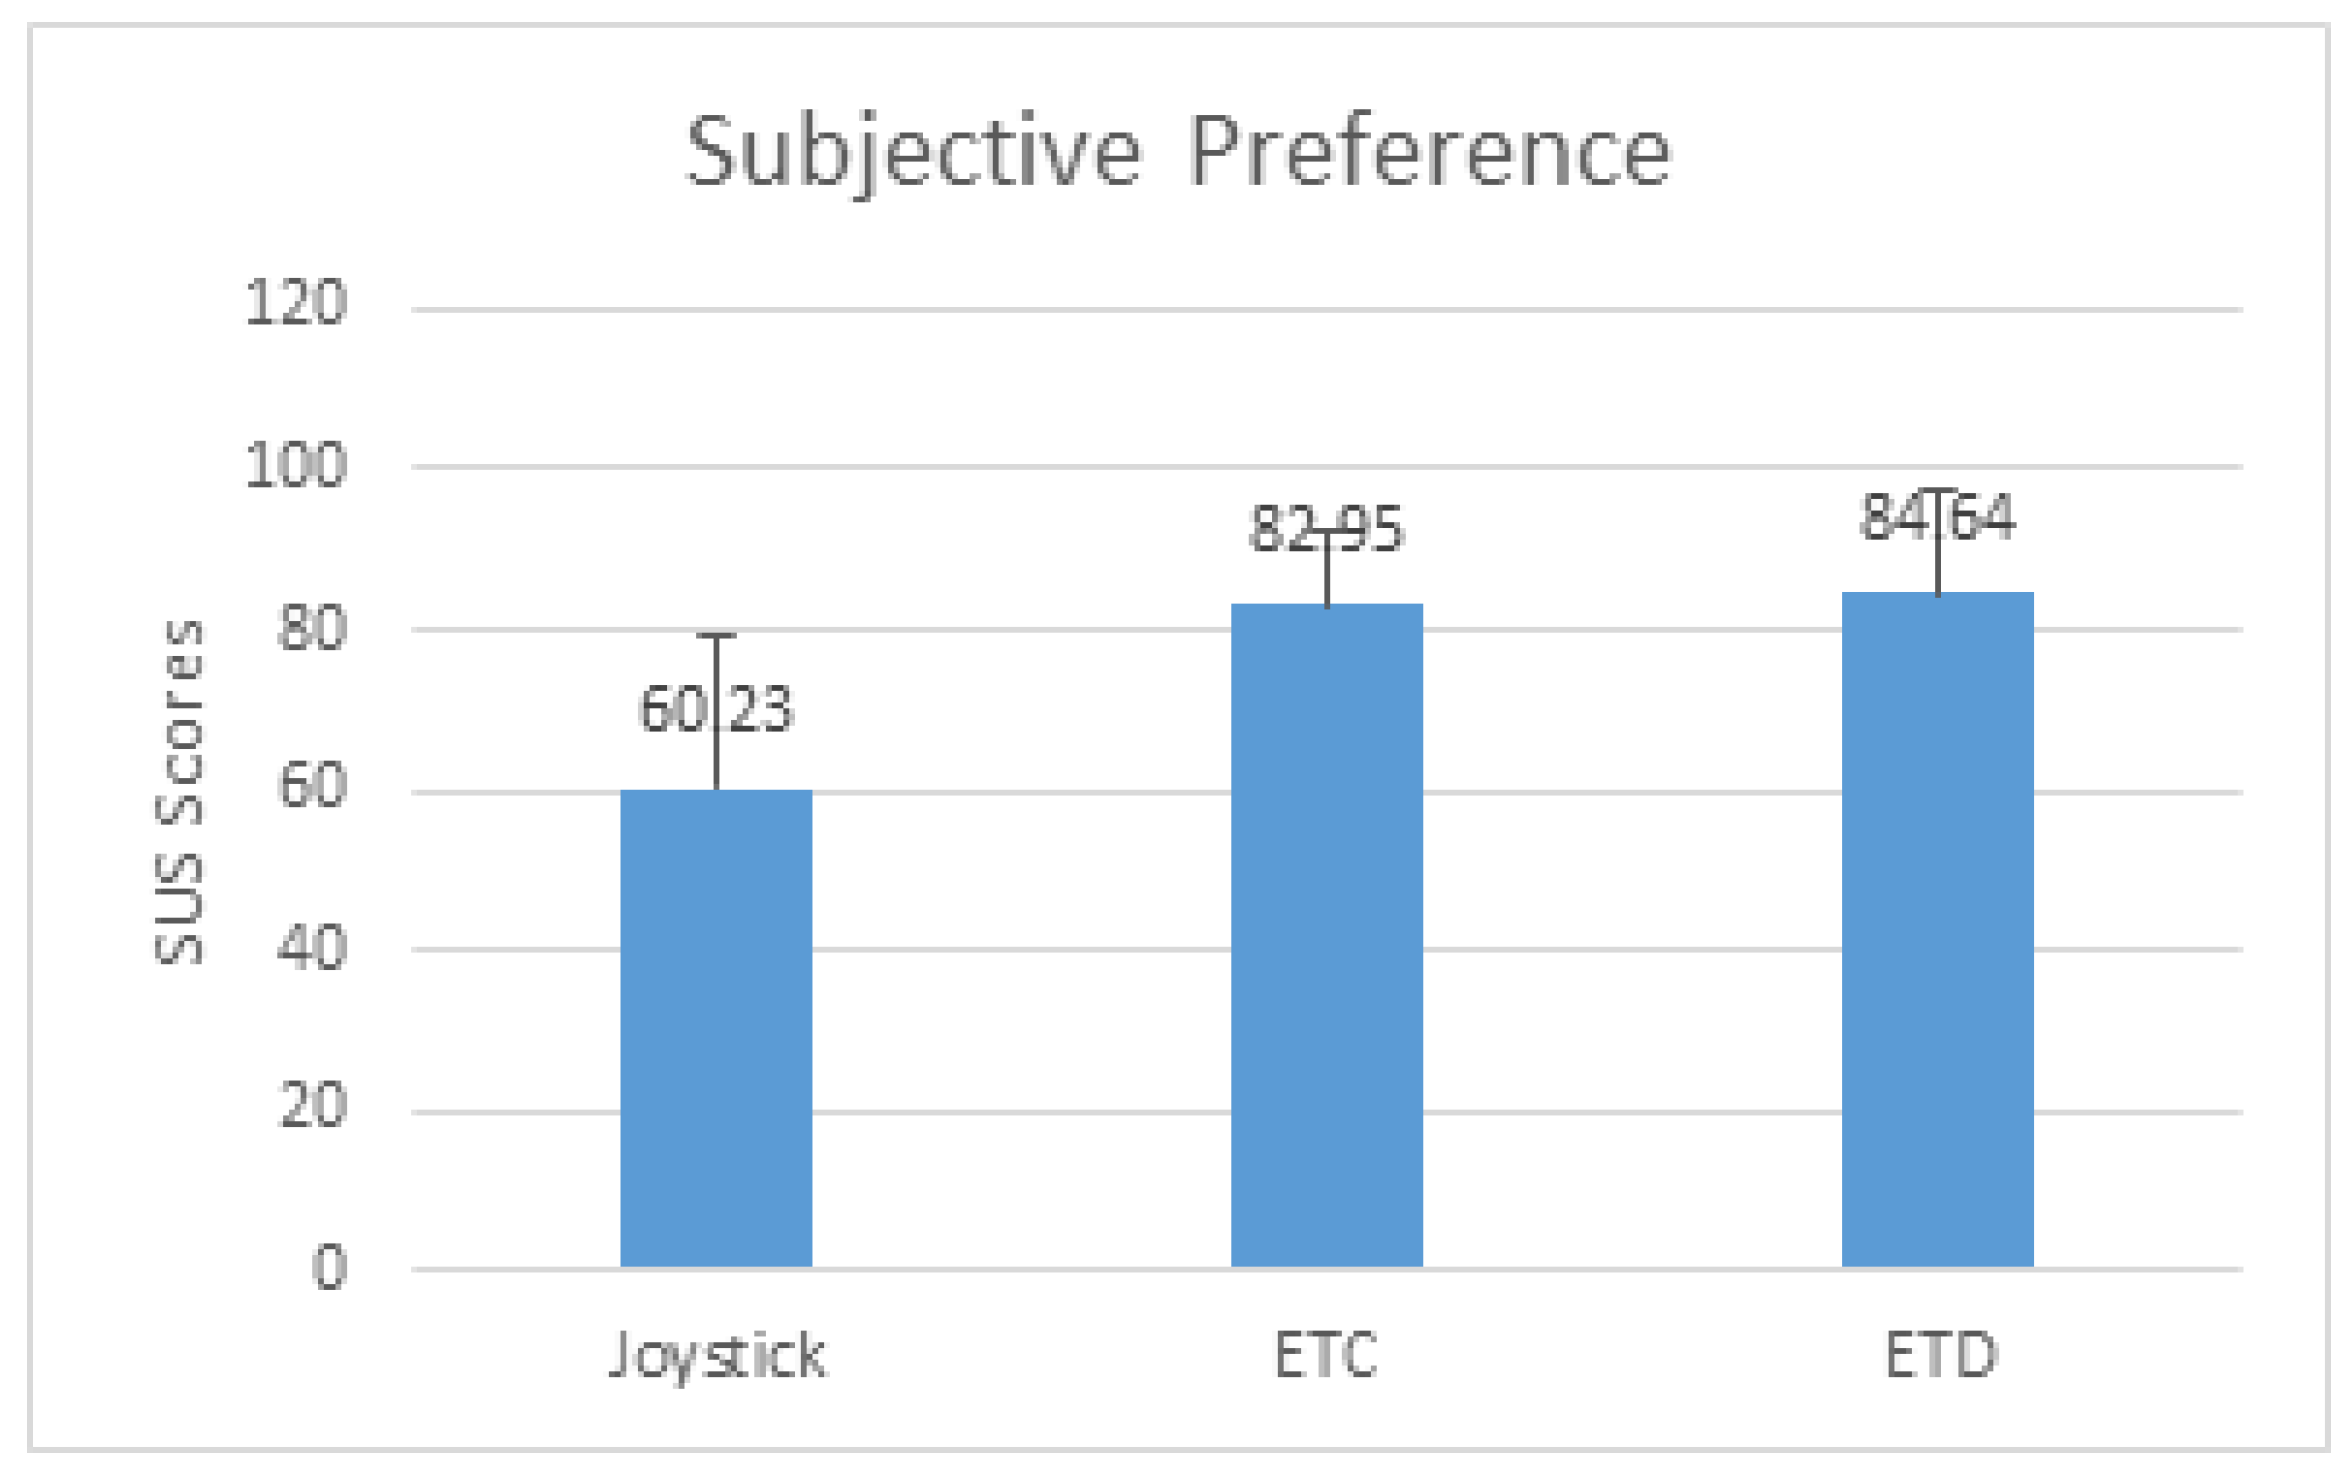
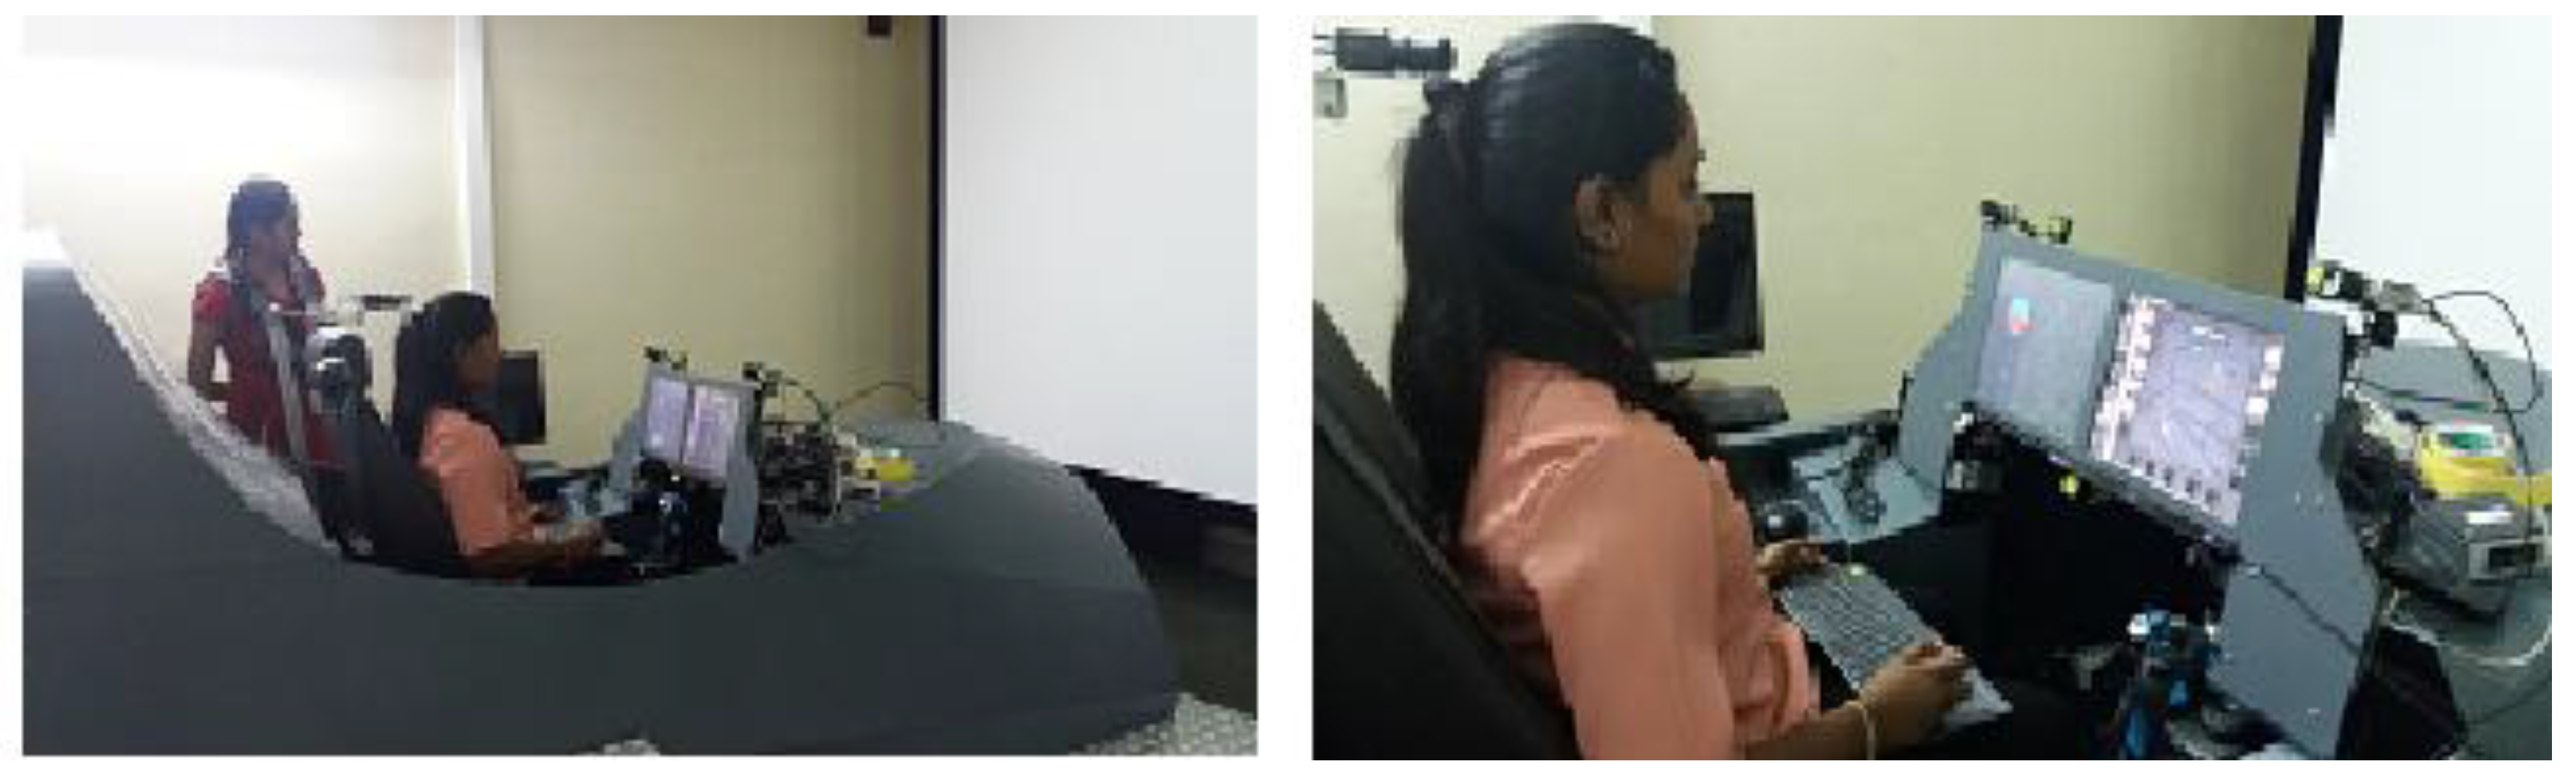
Table 1.
Specification of projection displays.
| ? | Primary Display | Secondary Display |
|---|---|---|
| Projector Model | Dell 1220 | Acer X1185G |
| Resolution (pixel) | 1024 × 768 | 1024 × 768 |
| Size of Projection (mm) | 1200 × 900 | 380 × 295 |
| Distance from Eye (mm) | 2100 | 285 |
Table 2.
Details on pointing targets.
| Width of Target | ||
| Pixels | Size (in mm) | Arc Angle |
| 40 | 14.6 | 3° |
| 45 | 18.7 | 3.4° |
| 55 | 20.4 | 4.1° |
| 60 | 22.3 | 4.5° |
| Distance of Target from the Centre of Screen | ||
| Pixels | mm | Arc Angle |
| 65 | 24.2 | 4.8° |
| 120 | 44.6 | 9.0° |
| 200 | 74.2 | 14.8° |
| 315 | 116.8 | 23.2° |
© 2018 by the authors. Licensee MDPI, Basel, Switzerland. This article is an open access article distributed under the terms and conditions of the Creative Commons Attribution (CC BY) license (http://creativecommons.org/licenses/by/4.0/).
Share and Cite
MDPI and ACS Style
Prabhakar, G.; Biswas, P. Eye Gaze Controlled Projected Display in Automotive and Military Aviation Environments. Multimodal Technol. Interact. 2018, 2, 1. https://doi.org/10.3390/mti2010001
AMA Style
Prabhakar G, Biswas P. Eye Gaze Controlled Projected Display in Automotive and Military Aviation Environments. Multimodal Technologies and Interaction. 2018; 2(1):1. https://doi.org/10.3390/mti2010001
Chicago/Turabian StylePrabhakar, Gowdham, and Pradipta Biswas. 2018. "Eye Gaze Controlled Projected Display in Automotive and Military Aviation Environments" Multimodal Technologies and Interaction 2, no. 1: 1. https://doi.org/10.3390/mti2010001