1. Introduction
Researchers have long argued that digital games are uniquely suited for teaching and training users [
1,
2,
3]. Yet, despite decades of research demonstrating that games can be effective pedagogical tools, we found in a series of studies where many of the features that were typically assumed to be foundational for designing effective educational games were not as important as other factors that past games research has rarely manipulated [
4,
5,
6,
7,
8,
9]. By quantitatively and qualitatively analyzing the design changes made over multiple iterations of two games, in this article, we outline a process to empirically assess iterative game design and identify several new variables for experimental training game research.
Over the course of four years, our team developed two training games, CYCLES Training Center and CYCLES Carnivale, to teach adult intelligence analysts to recognize, discriminate, and mitigate six common cognitive biases (three per game). In creating each game, we utilized iterative prototyping and extensive playtesting to ensure that the games were playable and that the instructions were clear to an audience of ages 21–65, who would be playing the game with an expectation to improve their job-related skills. In three of the experiments for each game, we created multiple versions of the games to test the impact of specific game features, including character customization, narrative, and rewards, on learning outcomes. None of these experimental manipulations, however, appeared to affect the impact of the games. However, our analyses across the multiple experiments showed that each successive game was increasingly effective at training. Consequently, at the end of the development process, we were left with the question of what design changes led to the final iteration of each game being the most effective, given that the variables that were manipulated based on existing educational and gaming training theories did not impact outcomes.
As others have noted, an iterative model that includes multiple opportunities to gather data from play sessions provides valuable insight into how closely the current version of a game accomplishes the game’s learning objectives [
10,
11,
12]. The question that has received less attention, however, is what aspects of iteration and what specific game changes are the most effective at improving learning? In this article, we offer a postmortem analysis of our design process, analyze qualitative and quantitative data, and discuss the design decisions that led to our results. Although this has been done for non-educational games [
13], it has not been applied to training games specifically, particularly with multiple versions of the game available for comparison. We demonstrate that easily accessible data can be used to conduct postmortem analyses for training game analyses, and we offer empirical support for several best practices in game design based on the existing theoretical literature. We also identify several variables through our postmortem analysis, which, in addition to being used for game evaluation, could be used in future experimental studies on educational or training games.
Our multi-method analysis reveals two major themes that guided design choices for both games, namely: balancing teaching, playing, and testing moments in the game; and managing the difficulty of the game challenges, quizzes, and language. In what follows, our quantitative analyses support our qualitative assessment of what we changed with each iteration, providing insight into why each game worked better than its predecessors. Moreover, our analysis identifies several variables that are rarely empirically tested in educational and training games research. Further research into these variables may enhance understanding of what makes for a successful educational or training game.
2. Materials and Methods: CYCLES Training Center and CYCLES Carnivale
The iterative design of each game entailed play testing, pilot testing, and formal experiments (three per game). In creating and testing our first game,
CYCLES Training Center, we developed nine different versions of the game, playtested and piloted with approximately 125 people, and conducted experiments that included 1316 students recruited from three universities, and interviews with 82 of those participants. Our second game,
CYCLES Carnivale, involved creating six versions of the game, 100 play and pilot testers, 1224 experiment participants recruited from three universities, and interviews with 60 of those participants. The details of each experiment are described elsewhere [
4,
5,
6,
7,
8,
9]. In addition to the university participants in the experiments, the play tests and interviews with intelligence analysts provided ongoing feedback on the game mechanics and content.
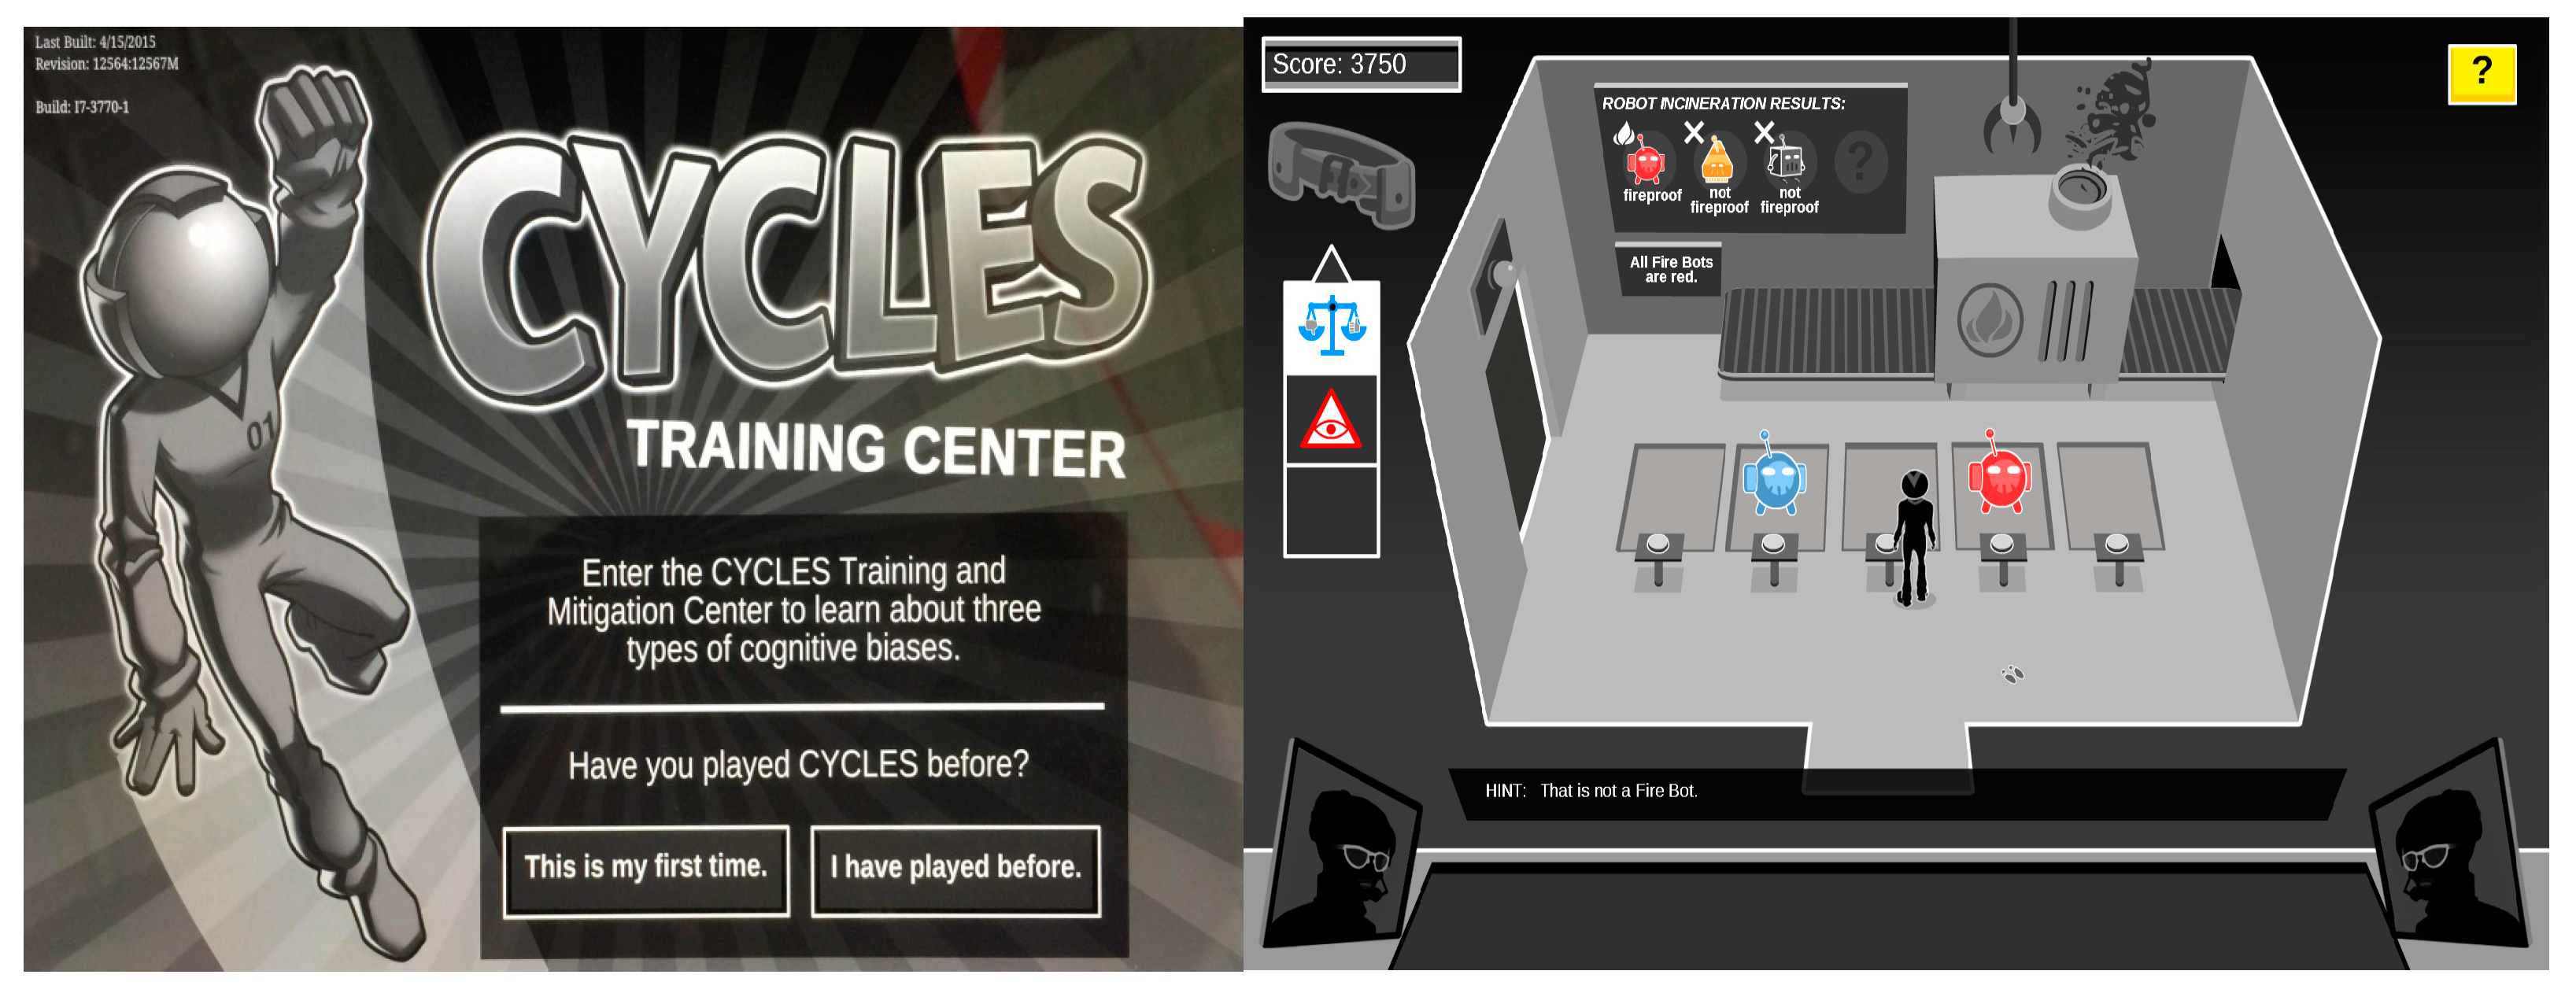
Our first game,
CYCLES Training Center, was a single-player, 30-min puzzle game that had the player infiltrate and survive a series of challenges set in a fictional training center, with guidance from a somewhat sinister host. The game trained players to identify and mitigate three biases, namely: fundamental attribution error (FAE), which is the tendency to blame an individual rather than the environment or context for some action on the part of the individual; confirmation bias (CB), which is the tendency to seek information that confirms a hypothesis and to ignore information that disconfirms it; and bias blind spot (BBS), which is the tendency to not see ourselves as biased. The game was set in a science fiction-like training center, where players interacted with a series of ‘brain bots’ who either exhibited bias (because of their human brains) or who players needed to fix by mitigating their own biases (see
Figure 1).
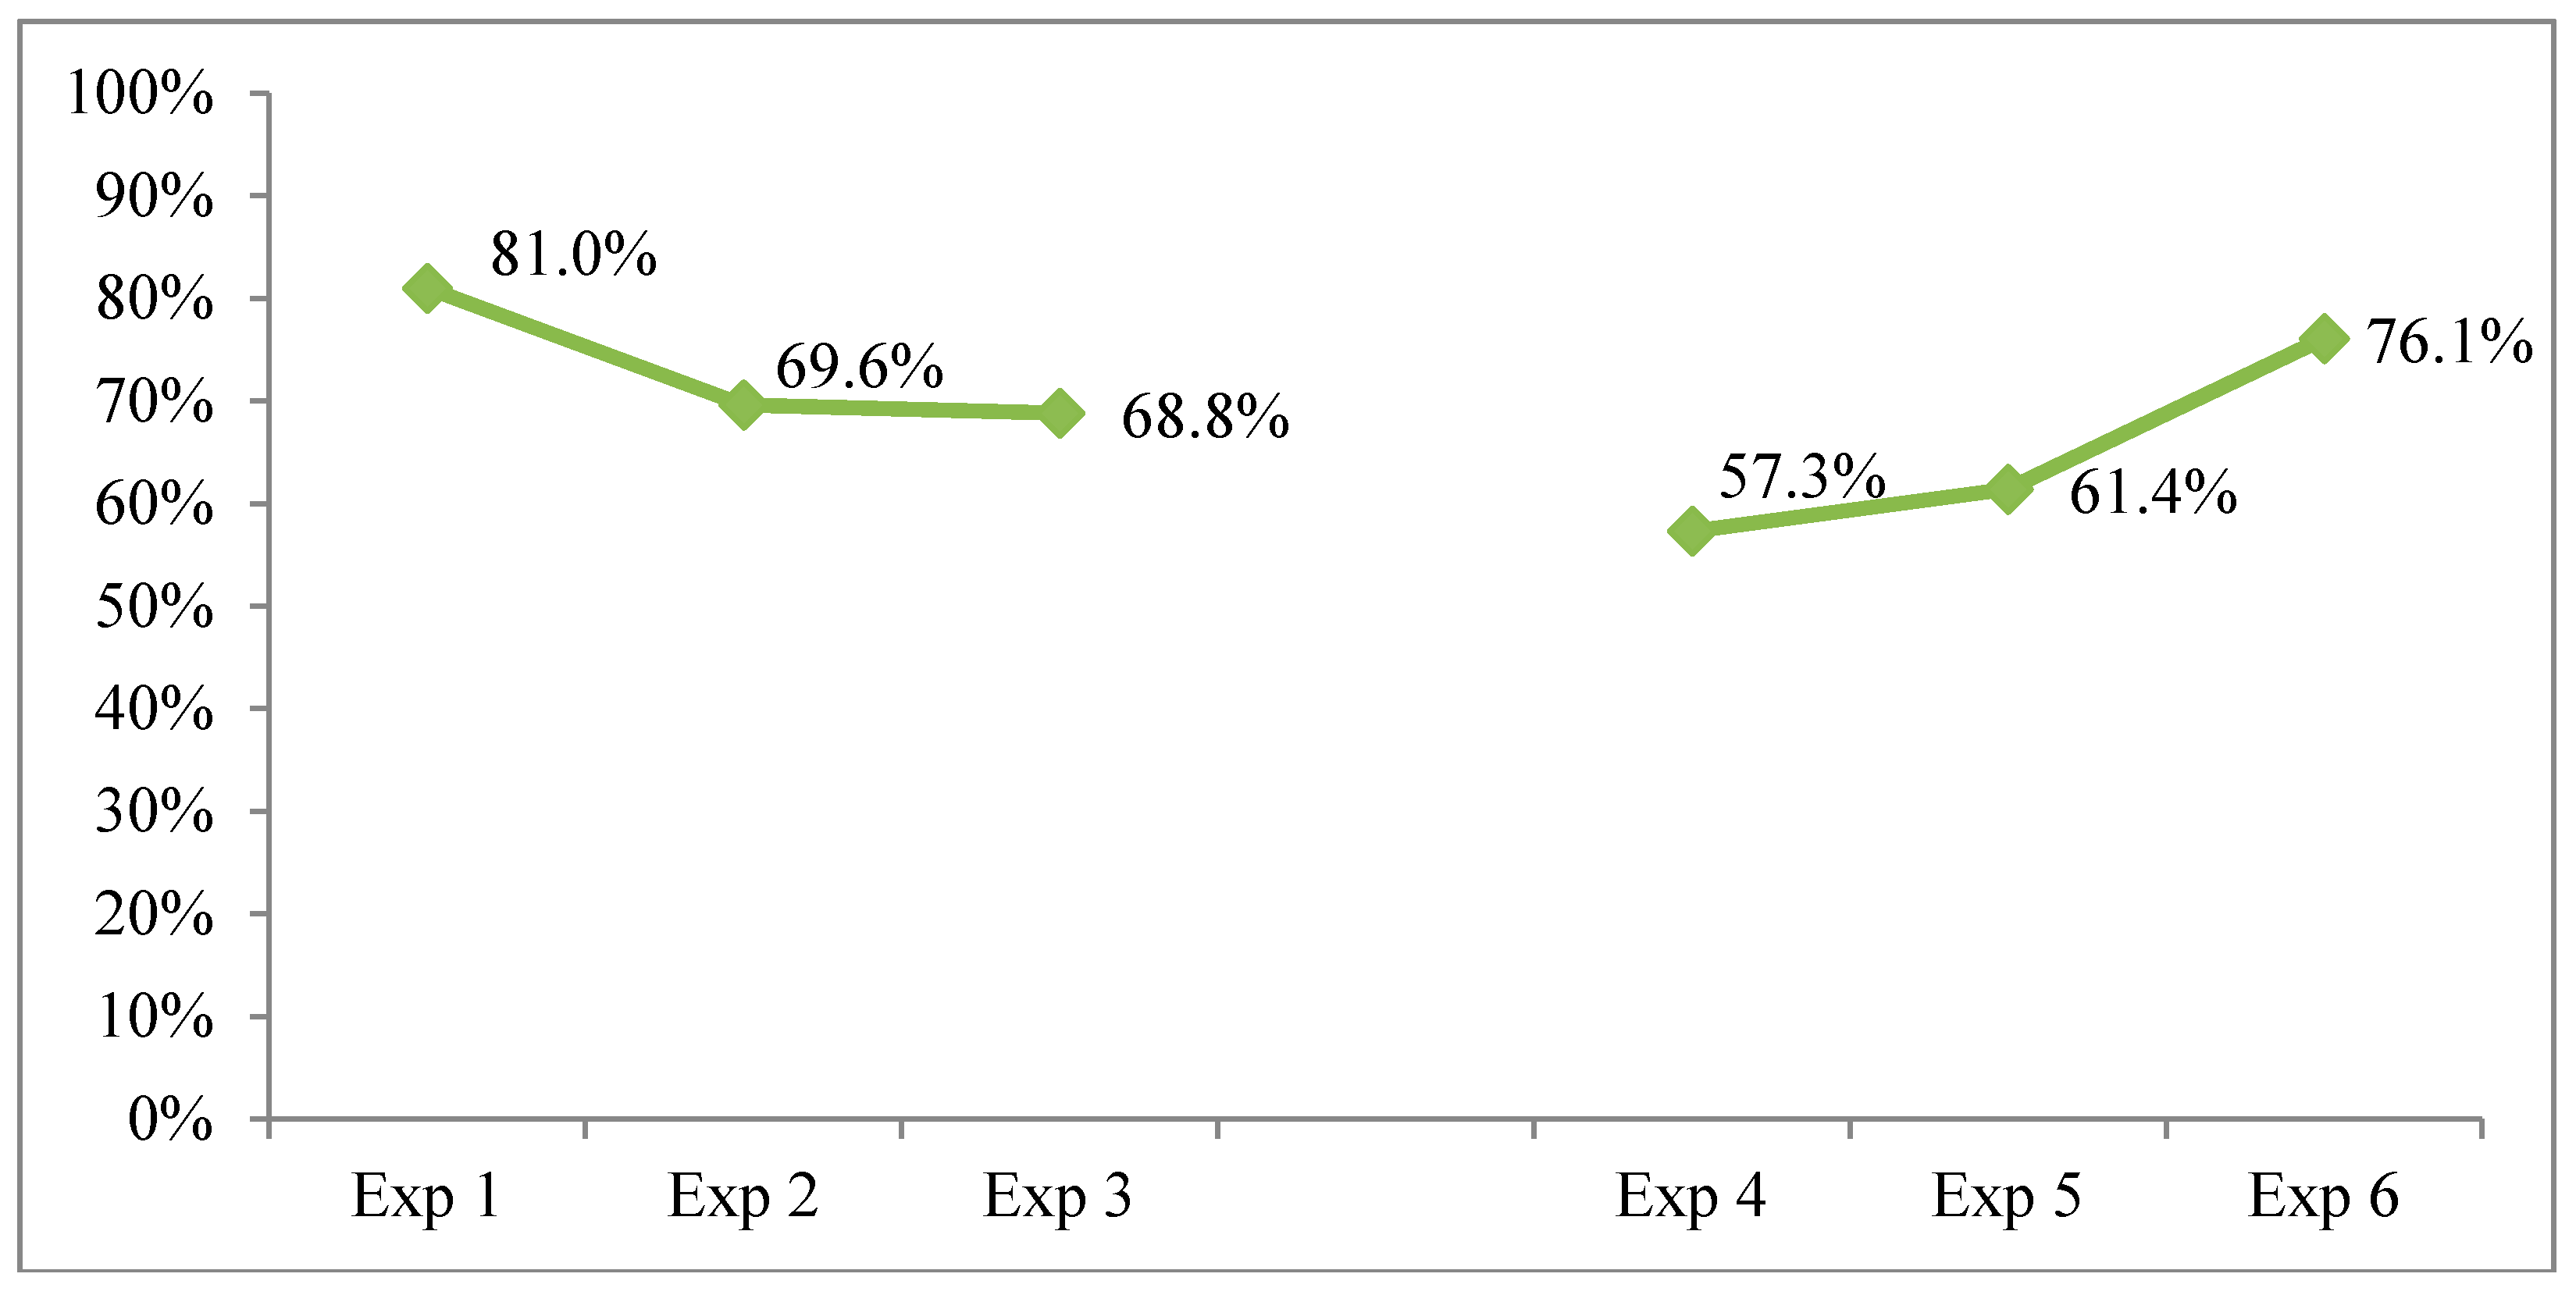
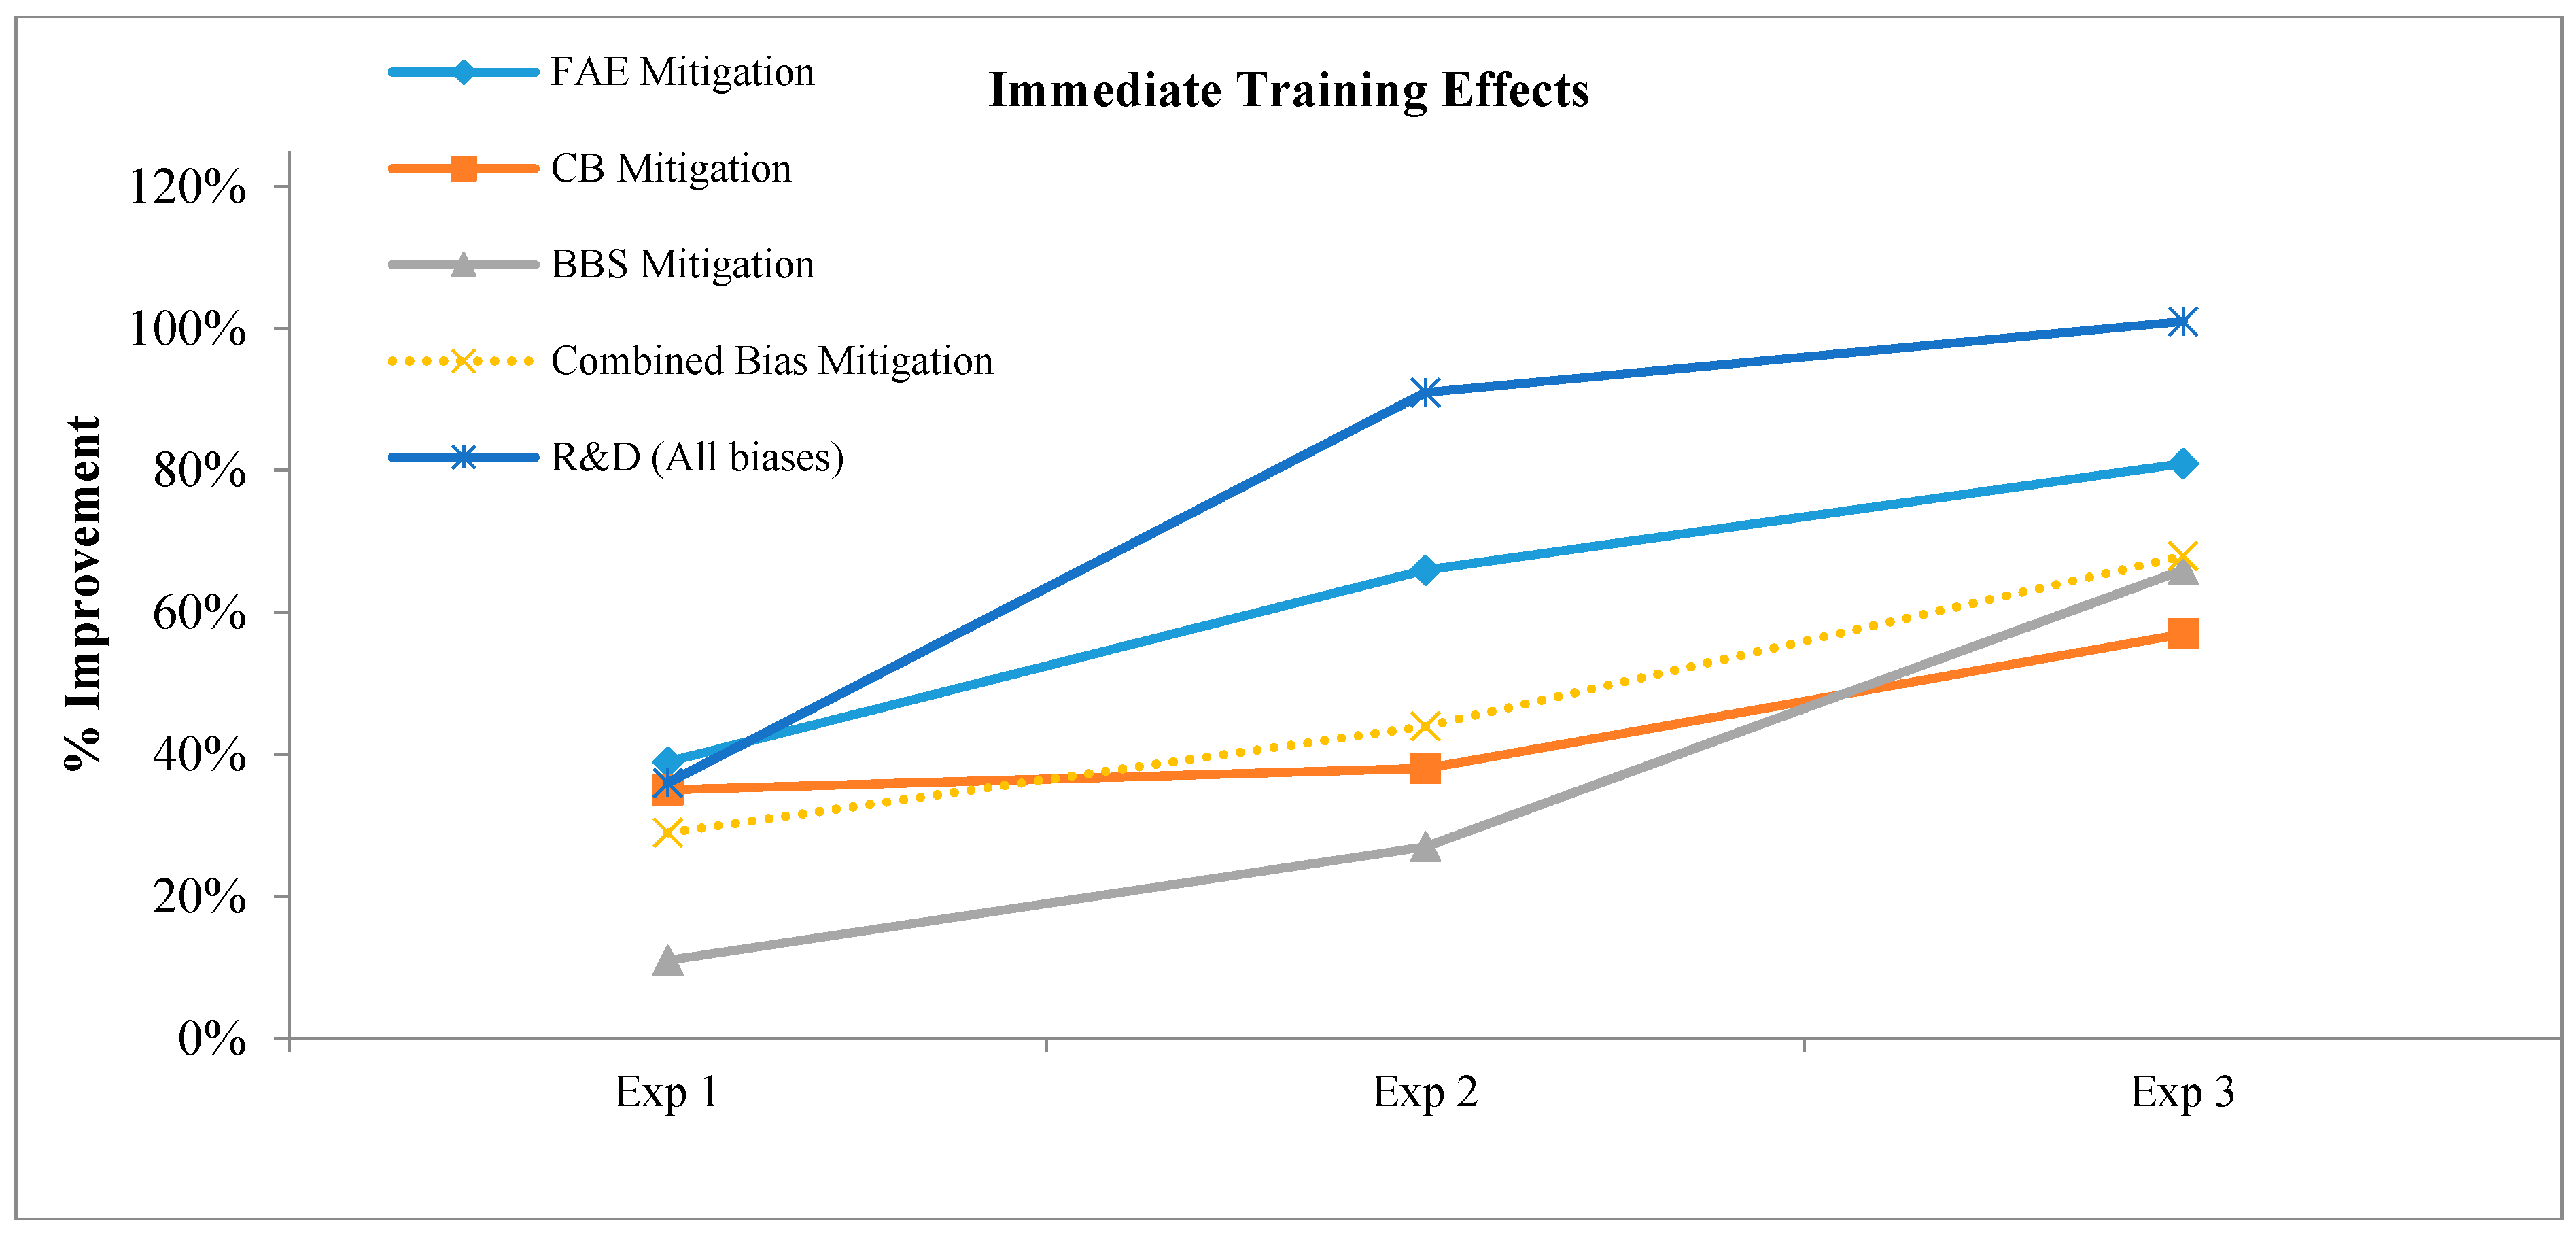
Figure 2 focuses on the best performing game from each experiment and demonstrates that performance (comparing pre- and post-test scores) improved with each experimental cycle.
The best performance for CYCLES Training Center was in our third experiment. Playing the game twice actually resulted in a better performance, but even after playing the game once, the immediate post-test bias mitigation was improved by 68%, and eight weeks later, the bias mitigation was 48%. The game also improved bias recognition and discrimination by 101% immediately and 44% at retention (eight weeks) after only one play-through.
Our second game,
CYCLES Carinvale, was a single-player, 60-min puzzle game that had the player in a sci-fi escape room scenario, having to first learn and then apply skills to escape an asteroid, guided by two eccentric, but helpful hosts. The game trained players in recognition and discrimination (R&D) and in the mitigation of three different biases, including: anchoring bias (AN), which occurs when we place too much weight on a trait or initial piece of information; projection bias (PR), which occurs when we assume that others share the same values and beliefs that we do; and representativeness bias (RB), which occurs when we ignore or miscalculate the actual likelihood of events, such as drawing conclusions based on a limited or misleading set of examples. The original game was set in an alien carnival where players had to mitigate biases to complete various midway challenges in order to repair their ship and leave the planet. The final (and most successful game) was set in Mr. Q’s training academy, where players had to learn to mitigate biases to escape the planet where they had crashed (see
Figure 3). This version of the game also included a structured analytic technique (SAT) component that required players to thoughtfully reflect on their decision-making process [
14].
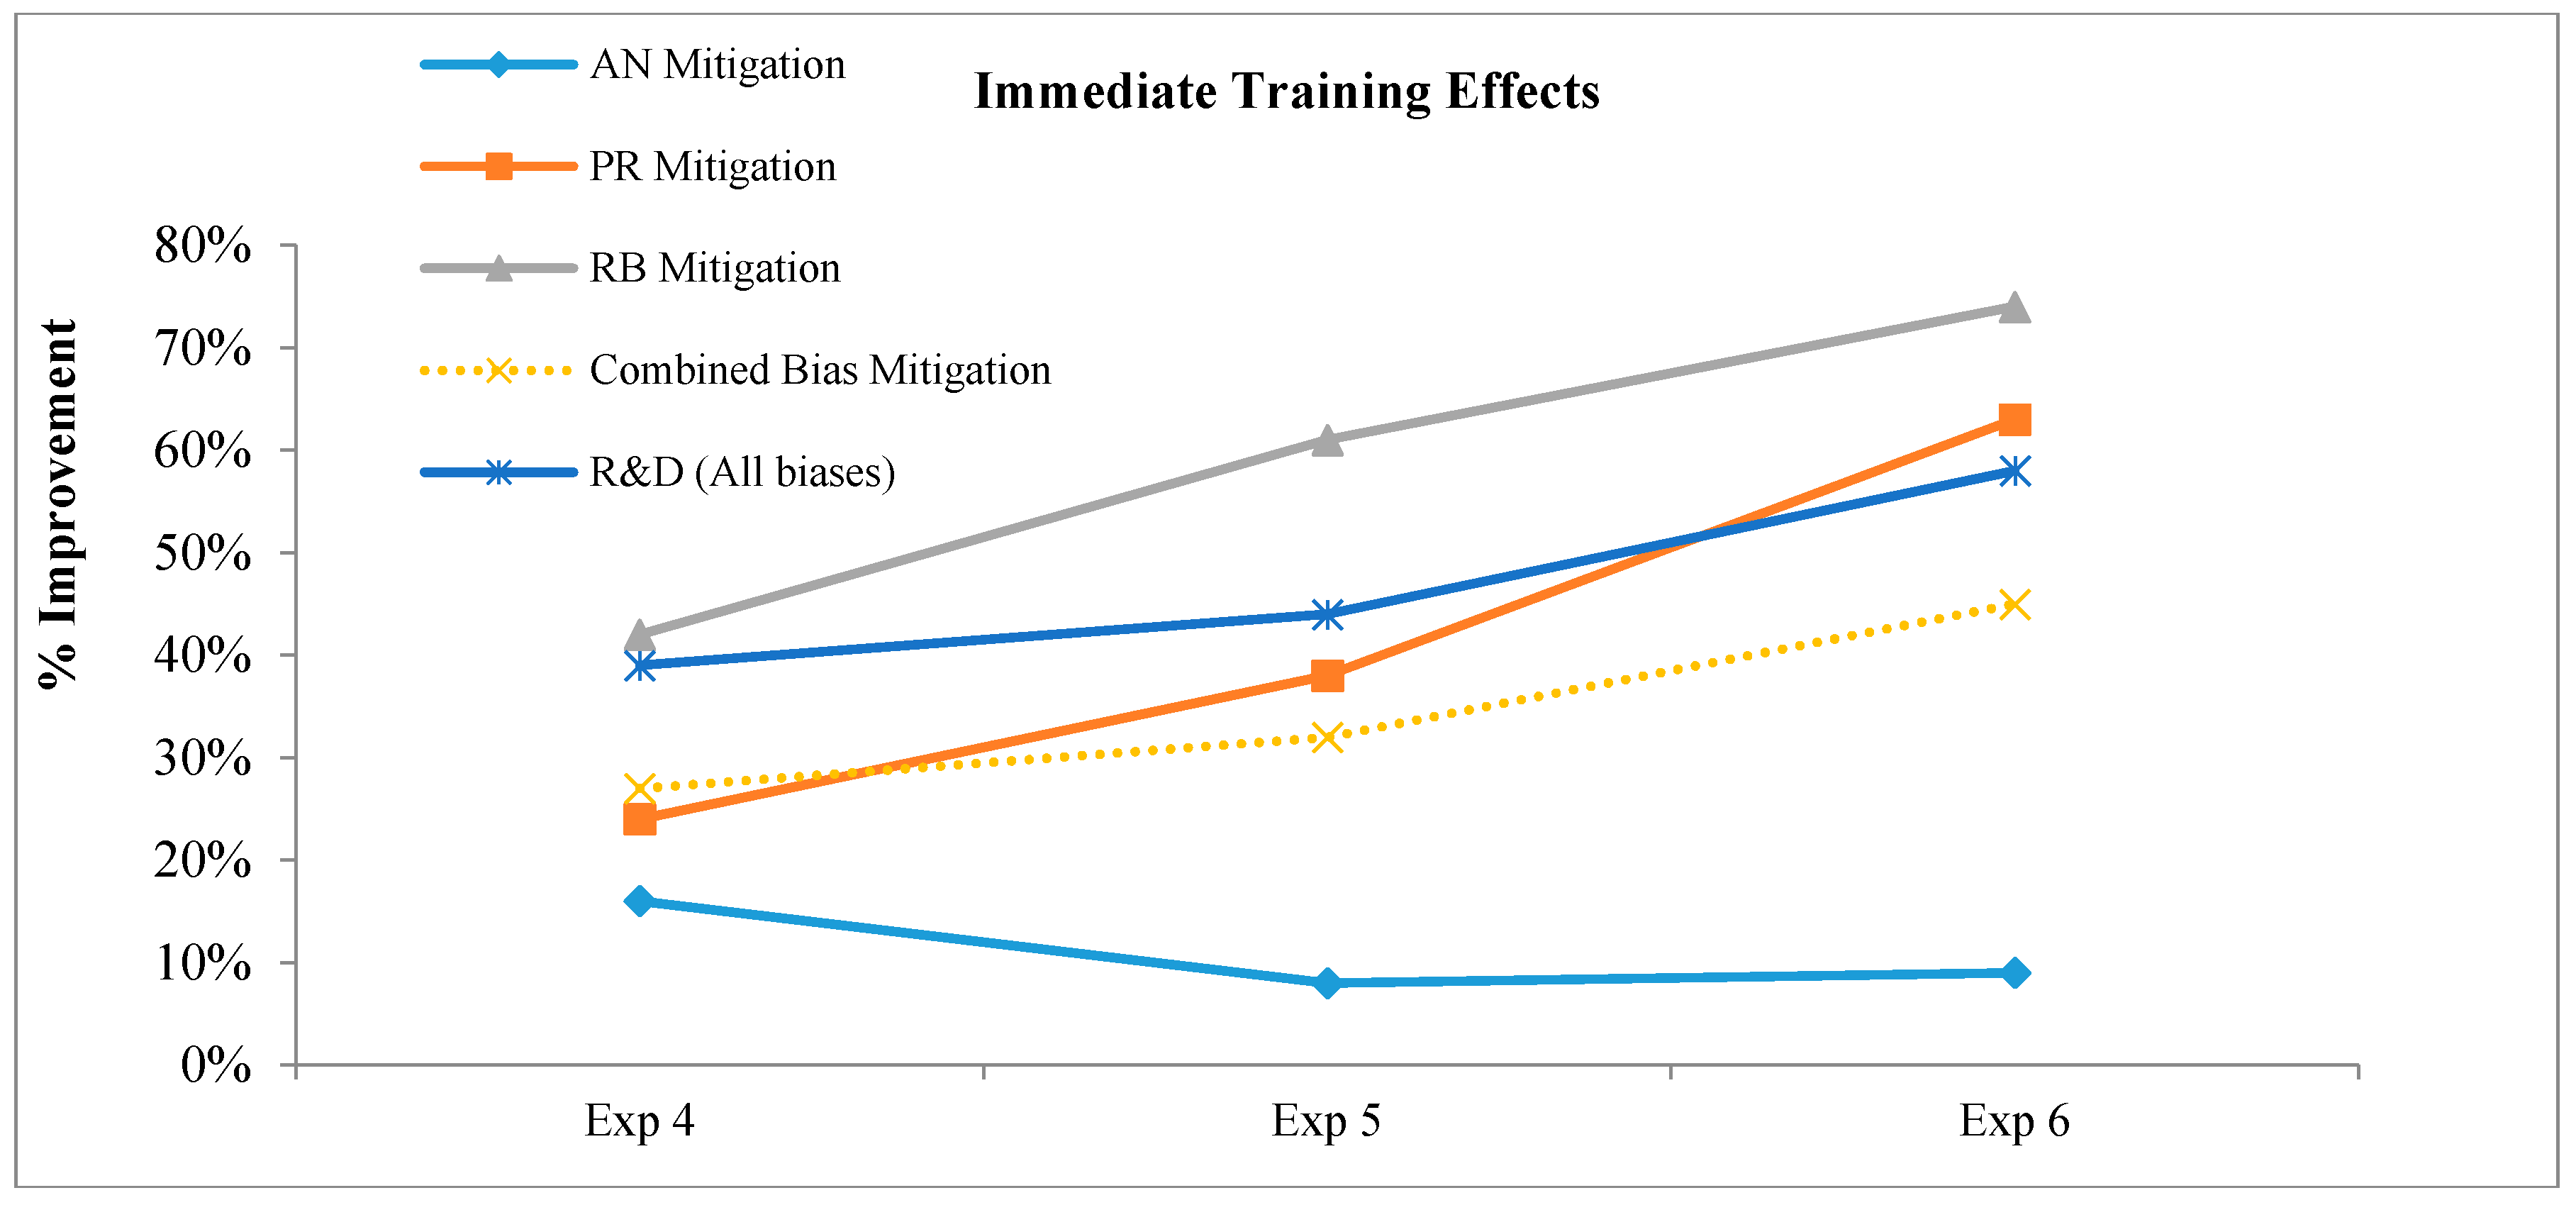
Figure 4 shows that at the immediate post-test bias mitigation steadily improved with each iteration, with the exception of AN, which proved difficult to successfully mitigate.
The best game was the Experiment 6 game, which improved bias mitigation by 45% on the immediate post-test and 31% on retention (twelve weeks later). It also improved recognition and discrimination by 58% on the immediate post-test and 20% at retention.
The game variables (e.g., character customization, rewards, and narrative) that we tested in our experiments had little effect on the outcome measures, but the overall process of game design and adjustment resulted in a much-improved game [
4,
5,
6]. The development process for each game, however, was slightly different. For example, from a cursory analysis of our design notes and games, we believe that we designed
CYCLES Training Center to be harder with each iteration, while we made
CYCLES Carnivale easier with successive iterations. To determine if any elements of the design process led to the final game always being the best (rather than ‘breaking’ the game with constant tweaking), we investigated the following research questions:
RQ1: What changes to the games resulted from the iterative process?
RQ2: Were these changes similar for both games and, if so, do they support the existing best practices in serious game design?
We used survey data, game log data, and a quantitative analysis of the games to pinpoint the specific changes made in the development process and learning outcomes. We also examined the game logs and quantitative analyses of game content to identify the possible effects of the content changes on players’ progress through the game. This helps us to address the following research questions:
RQ3: Is it possible to quantify game changes in a postmortem analysis?
RQ4: Is there any evidence that specific changes account for the progressively better performance of the two games through each iterative cycle?
We begin to answer these questions by examining two specific challenges, one from each game, that were repeatedly adjusted across each iteration to improve the learning outcomes. We then examine the major themes that dominated these changes. We also use interviews and pre- and post-test results from our experiments, lab monitor feedback, playtesting session notes and player feedback, and game click log and timestamp data. Moreover, we conducted qualitative analyses of our design changes and decisions, a content analysis of game segments across each iteration, and quantitatively analyzed the language used in the games. Taken together, these analyses demonstrate the utility of a mixed-method postmortem analysis and an iterative design process, supporting some of the currently proposed best practices in training game design, and suggesting new variables for future experimental research.
3. Results and Discussion
3.1. Case Study #1: CYCLES Training Center Firebot Changes
Firebot, a confirmation bias challenge, was one of the few rooms that was changed at each experimental stage of
CYCLES Training Center. The original Firebot room was designed as a variation of an example test developed by the team to illustrate over-specificity and confirmation bias. In the original demonstration, subjects are given a set of objects and asked to test the objects to determine which ones are blickets. Players demonstrating confirmation bias should only test objects that fit their hypothesis of what a blicket is, basing that belief on both shape or color being necessary features for identity, whereas a single feature (color) was actually the basis for the category label. In this case, after learning that a ‘blicket’ is round and red, seeking the identity of only objects that are both round and red, while failing to test whether objects that are just round or just red also qualify as a ‘blicket’, reflects a confirmation bias [
15]. This initial demonstration was then modified to be incorporated into the flow of the game. In the first game, players were told they would have four rounds of tests to determine which kind of robot could withstand intense heat—a firebot. Each round increased the number of bots to choose from. After each round, players were told whether or not the bot they chose to test was a firebot and the results of their tests were recorded on the back wall of the in-game room. After four rounds, if they tested the same kind of bot more than once, they were warned that they were focusing too much on bots that possessed the same, known features and thus might be exhibiting confirmation bias; if they did not, they were told they successfully avoided the bias. Regardless of their path, players were asked to make a final decision about which of five bots was a firebot. If they did not select the correct bot, they were taken back to the initial test and repeated all four rounds of testing again until they successfully identified the firebot in the final test.
The original goal for the Firebot challenge was to create an “A ha!” moment for players by eliciting confirmation bias through play. The difficulty in adapting the blicket test to the game environment, however, was that players frequently tested unique objects. Early game logs confirmed that fewer players than expected repeatedly chose the decoy, which was a red, round bot, thereby reducing the learning moment we had anticipated. This may be because the exploratory nature of play environments encouraged players to try new potential firebots, rather than continuing to pick similar robots to select the ‘correct’ option. Indeed, Legare [
16] suggests that inconsistent outcomes lead to more exploratory behavior and encourages subjects to generate new hypotheses. Moreover, in our original game, this challenge occurred nearly halfway through the game; thus, the players were already aware of the bias.
In developing the Experiment 2 game, we dramatically revised the Firebot challenge to ensure that players would exhibit a confirmation bias and thus see the bias in action more clearly. Firstly, we moved the challenge to the start of the game, so that players would enter the room with minimal knowledge of CB. Secondly, we reduced the number of testing rounds from four to three, and the number of bots for each round to two, rather than increasing the number in each round. This allowed us to offer more nuanced and detailed feedback on the limited choices players made through each testing stage. We also provided more teaching content about the bias between tests. Thirdly, we changed the first round of tests so that players sent both a yellow, triangular bot and a red, round bot through the incinerator and thus had no reason to test the round, red bot in subsequent rounds. But, we also inserted feedback to encourage players to adopt the hypothesis that firebots are red and actively think about each round as testing this hypothesis. This shifted good reasoning to include actively seeking disconfirming evidence against this known hypothesis. The feedback for each test highlighted how their choices tested the hypothesis and emphasized what a biased or unbiased choice would be. In the final test, players were asked to choose from two bots, a red square (decoy) and yellow circle (the firebot). The final feedback was based on whether the players chose the correct bot and the choices they made in tests two and three. We wanted players to focus on the way they progressed through the tests and how they decided what to test, rather than getting the correct answer. Accordingly, regardless of their final choice, they were not forced to replay it.
In Experiment 3, after the final (third) test of selecting between two bots, players were forced to replay the room if their choices exhibited CB. If they did not exhibit CB in tests two and three, but they still chose the incorrect bot in the final test, they were allowed to continue to the next challenge rather than replay. This was done to focus players on the process of their decision-making, not the accuracy of their final choice. If players continued to demonstrate confirmation bias, however, we wanted to give them a chance to experience mitigation as well. We also adjusted the language about confirming and disconfirming information and the explanation of the bias with the goal of making the concepts easier to understand. Finally, feedback on the final test was conditional and referenced each choice a player made, and whether or not it demonstrated a confirmation bias. These changes supported players’ unbiased decision making, gently encouraged “A ha!” moments without misleading players, explained any biased decision-making, gave players the chance to practice unbiased decision-making, and provided feedback to players on the conceptual content regardless of their performance in the room.
The log data suggests that the changes we made in Experiment 3 were beneficial for players. For example, the average number of attempts at Firebot was reduced from 2.12 in Experiment 1 to 1.29 in Experiment 3 (the range of testing attempts was reduced from 1–11 to 1–2). The players could not repeat the challenge in Experiment 2, although 30% selected the wrong bot on the final test. The data from Experiment 3 suggest that one more test was sufficient to correct the decision-making process. Although the effect of these changes cannot be isolated from the myriad of other changes to the game, we note that the immediate CB mitigation significantly increased by the final game, with a 57% improvement in mitigation on immediate post-test, up from 35% for the first game.
3.2. Case Study #2: CYCLES Carnivale Bottle Blast Changes
Bottle Blast, a representativeness bias challenge, was one of several challenges in CYCLES Carnivale that required players to reveal manually or identify information essential to making an unbiased decision. The players in Bottle Blast were given a choice of three kinds of objects in order to knock over a pyramid of glass bottles. The original options were balls, bricks, and feathers, each of which had a box labelled “ODDS” above it. Players that clicked on all the odds learned that the feather was actually the most likely to knock down the bottles, but the players could not successfully complete the challenge unless they revealed all of the odds before making their selection. The players who failed to do so repeated the challenge. A second round featured three more objects, one of which was a sock that was again most likely to knock down the bottles. To help players who were unaware that they could reveal the odds for each object, a companion character in our Experiment 4 and 5 games reminded players to check the odds after an unsuccessful round.
The biggest issues we faced with this challenge pertained to difficulty and language. Based on the click logs and participant feedback from Experiments 4 and 5, we realized that some of players failed Bottle Blast multiple times before realizing that they could reveal the odds for each object. Our original intention in designing this challenge was to teach players to pay attention to the odds of each option when making a decision. However, the difficulty many of our players had recognizing the need to manually reveal the odds indicated that this approach was too demanding so early in the game. To remedy this in our Experiment 6 game, we made the odds boxes more visually prominent and changed the text from “ODDS’ to “Click to reveal chances”. We made this change after considering that not all of the players would understand what odds meant and that we needed to provide a more explicit set of instructions for what players should do. We also revised the graphical cues to help players see what they needed to click to reveal the odds. If the player did not click the boxes during the second round of play, the boxes flashed red. If the player failed to reveal the odds after three or more attempts, the instructor character (Mr. Q) appeared on the screen and told the player to check all the odds; the odds were subsequently highlighted in a box with arrows pointing down at each one. These changes provided a more responsive experience that allowed players an opportunity to explore on their own, but also intervened when the players were clearly struggling.
Beyond adjusting the difficulty, we added a new teaching segment in the final game that players completed before Bottle Blast. This new segment provided players with a guided introduction to representativeness bias, which they then explored more on their own in Bottle Blast. The data suggest that these changes were beneficial. By looking at the click log data, we found that the average number of attempts on this challenge decreased from 2.93 attempts in Experiment 4 to 1.55 in Experiment 6. In addition, our final game was our best game for representativeness bias mitigation, with 74% at the immediate post-test, up from 42% in the first game.
3.3. Unpacking the Development Process
The above case studies share two common themes, balancing teaching, playing, and testing moments in the game; and managing the difficulty of game challenges, quizzes, and language. These themes drove many other changes we made throughout the game development process. They reflect the need to adjust the feedback amount and type, as well as the games’ interface and graphics to help guide players through the training content, as we explore through a qualitative analysis in another publication [
6]. However, both of these case studies also demonstrate that there are aspects of game design that can be quantified and thus allow for a more nuanced examination of the impact of particular design changes on learning outcomes. In the remainder of this paper, we analyze these changes with qualitative and quantitative data. We highlight several sources of data that teams can use when conducting postmortem training game analysis to better understand how particular changes made during the iterative design process affect the game’s learning outcomes. Moreover, by singling out the specific factors we adjusted, we identify variables for future experimental studies of factors that shape the effectiveness of training games.
3.3.1. Balancing Teaching, Playing, and Testing
One of the key assumptions guiding game-based learning design is that the type of play that games offer promotes a more active, and thus stronger, form of learning [
2,
3,
17]. Indeed, several studies focus on the play aspect of game-based learning and provide only a minimal sense of the type of activities that introduce, frame, or accompany the play spaces these games provide [
18,
19,
20,
21]. Although important, the field’s focus on play has largely ignored the potential significance of the amount of instruction and other activities, such as testing exercises, which are necessary to promote strong learning outcomes in game-based learning.
We can see some of this balancing act in the case studies. In our original designs for Firebot and Bottle Blast, we gave players ample space to play, without much direction. However, because of the goals of our project, we had to ensure that players learned the cognitive bias content in a single short play session, and there are questions about how effectively learning results from situations with minimal guidance [
22]. Giving them too much time to play in any given challenge would slow their progress through the whole game, leaving some players frustrated and exhausted (and thus having learned less). Additionally, post-room explanations of the bias proved inadequate in helping players identify how biases worked in the moments they made decisions. For both challenges, with each iteration, we spent more time explaining how players’ choices related to the biases and gave players less time to experiment for themselves. The learning outcomes were improved, although reducing play did make it feel less game-like for some players, according to our participant interviews. Future research might manipulate the amount of teaching versus the playing time, to determine if there is an ideal balance of exploratory play and explicit instruction.
We also increased the number of quiz questions throughout the game and added additional testing activities in both games. For example, in
CYCLES Training Center, we added word puzzles at the end of each training room that players solved with their knowledge of the bias definitions. We also added a component where players indicated if they were or were not blind to their biases at the end of each transition room (a test for our BBS mitigation strategy).
CYCLES Carnivale initially included multiple-choice quiz questions, word puzzles, and a final review level. In the final iteration, we added review sessions at the end of many of the challenges, where players would answer multiple choice questions about the learning material they just practiced. Research on learning outside of game-based learning contexts suggests that testing enhances learning and provides an important feedback opportunity for learners [
23,
24,
25]. That seemed to be the case in our studies, yet an experimental manipulation of the number and type of teaching moments is crucial to understand how best to use this feature in training games.
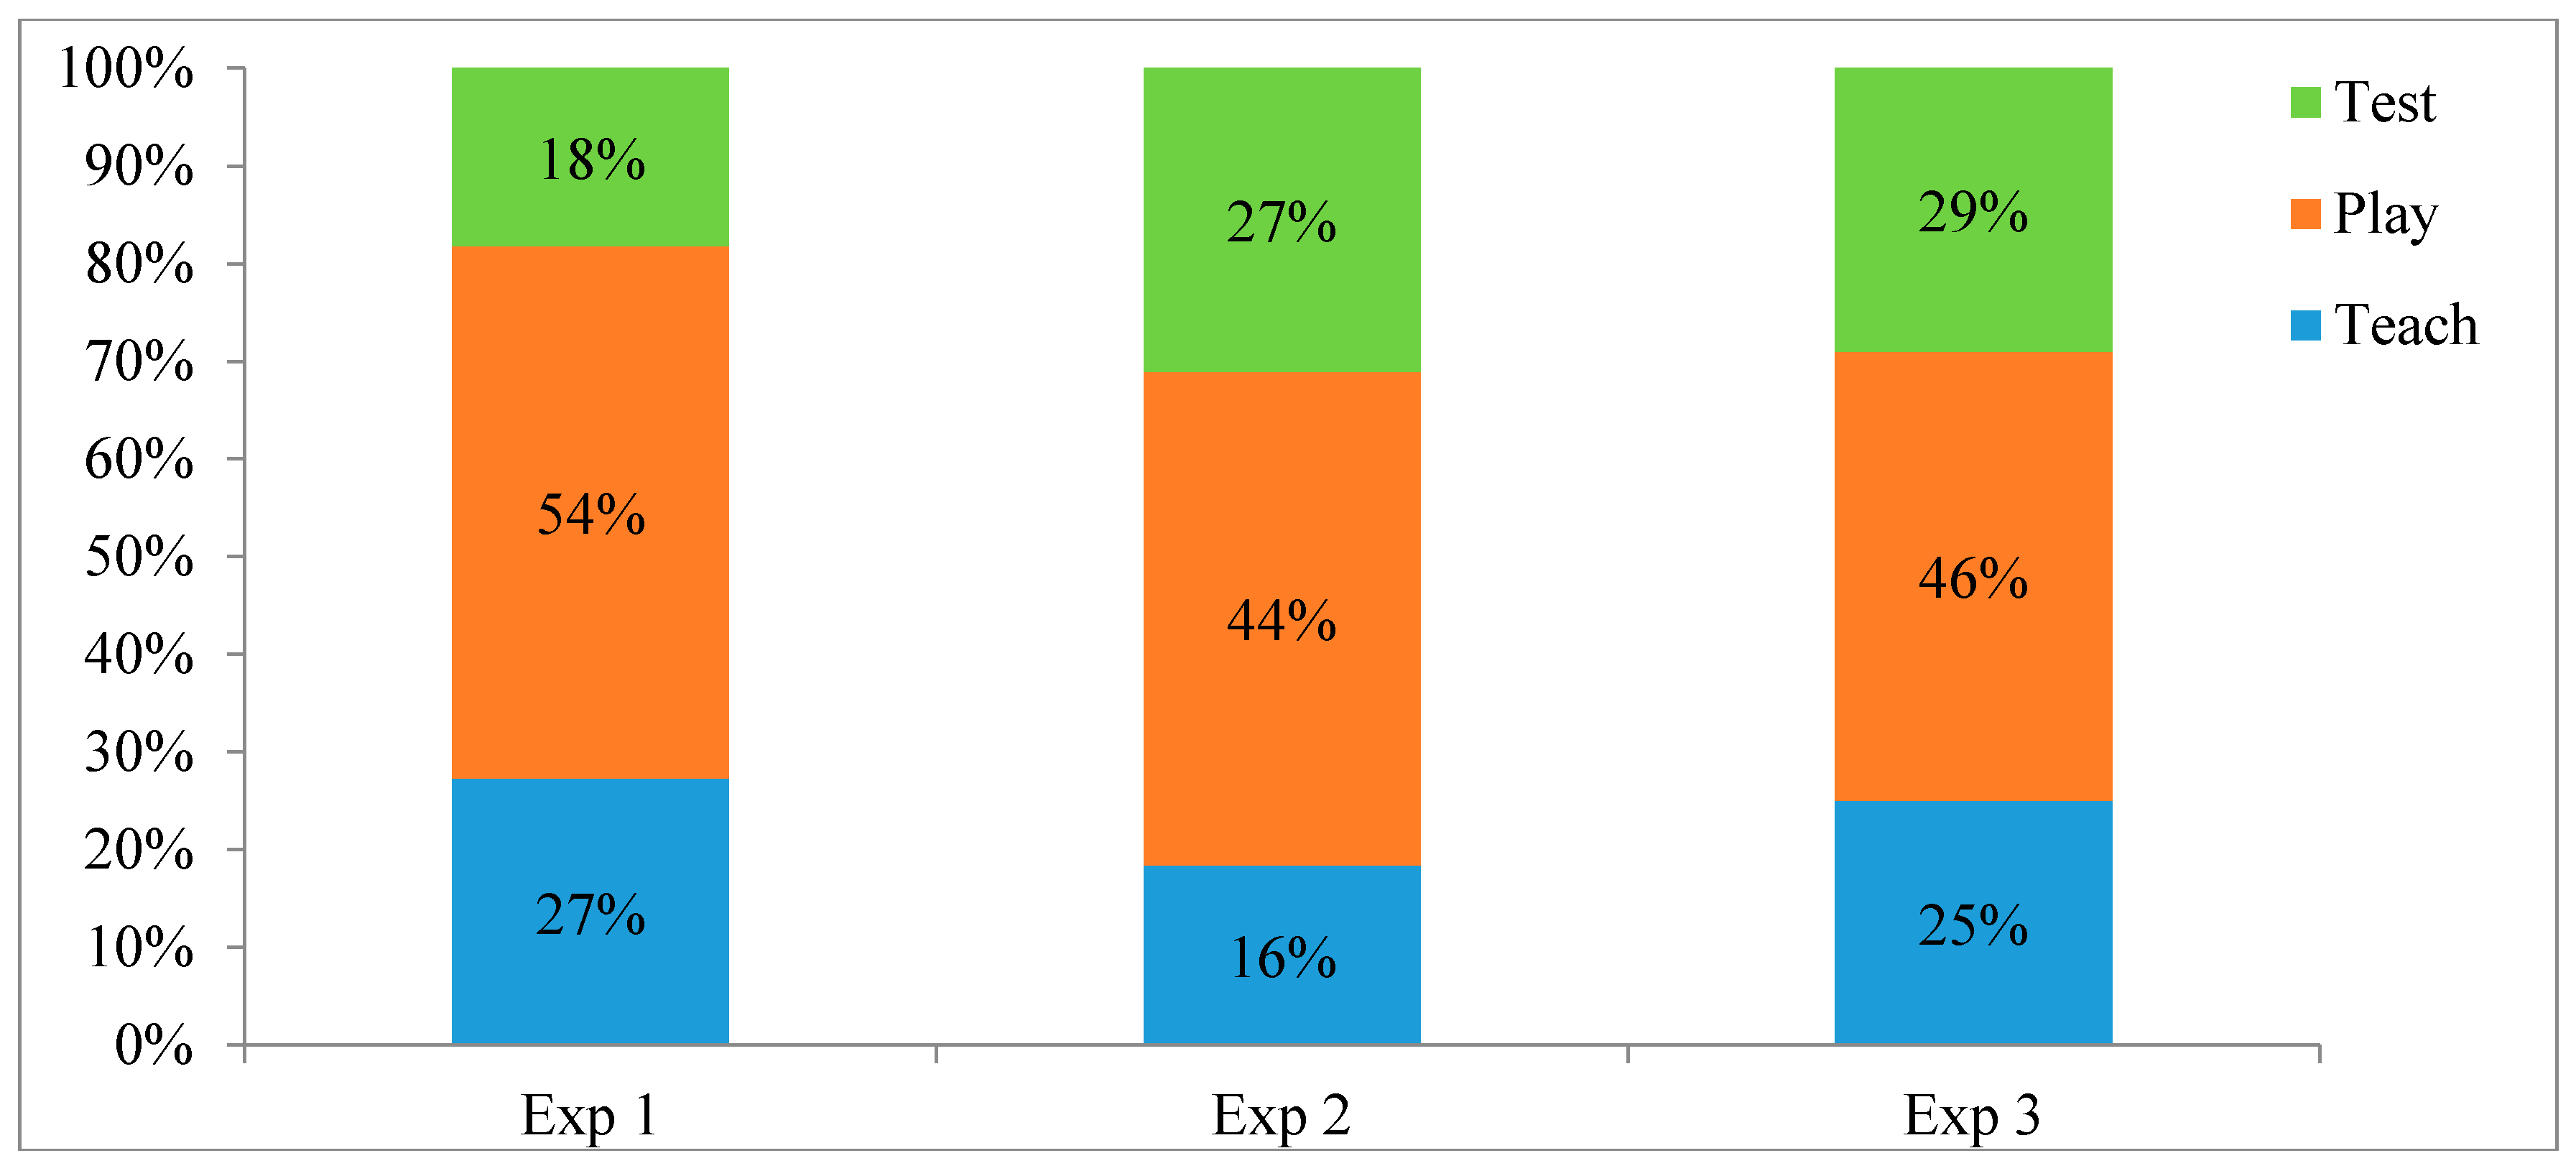
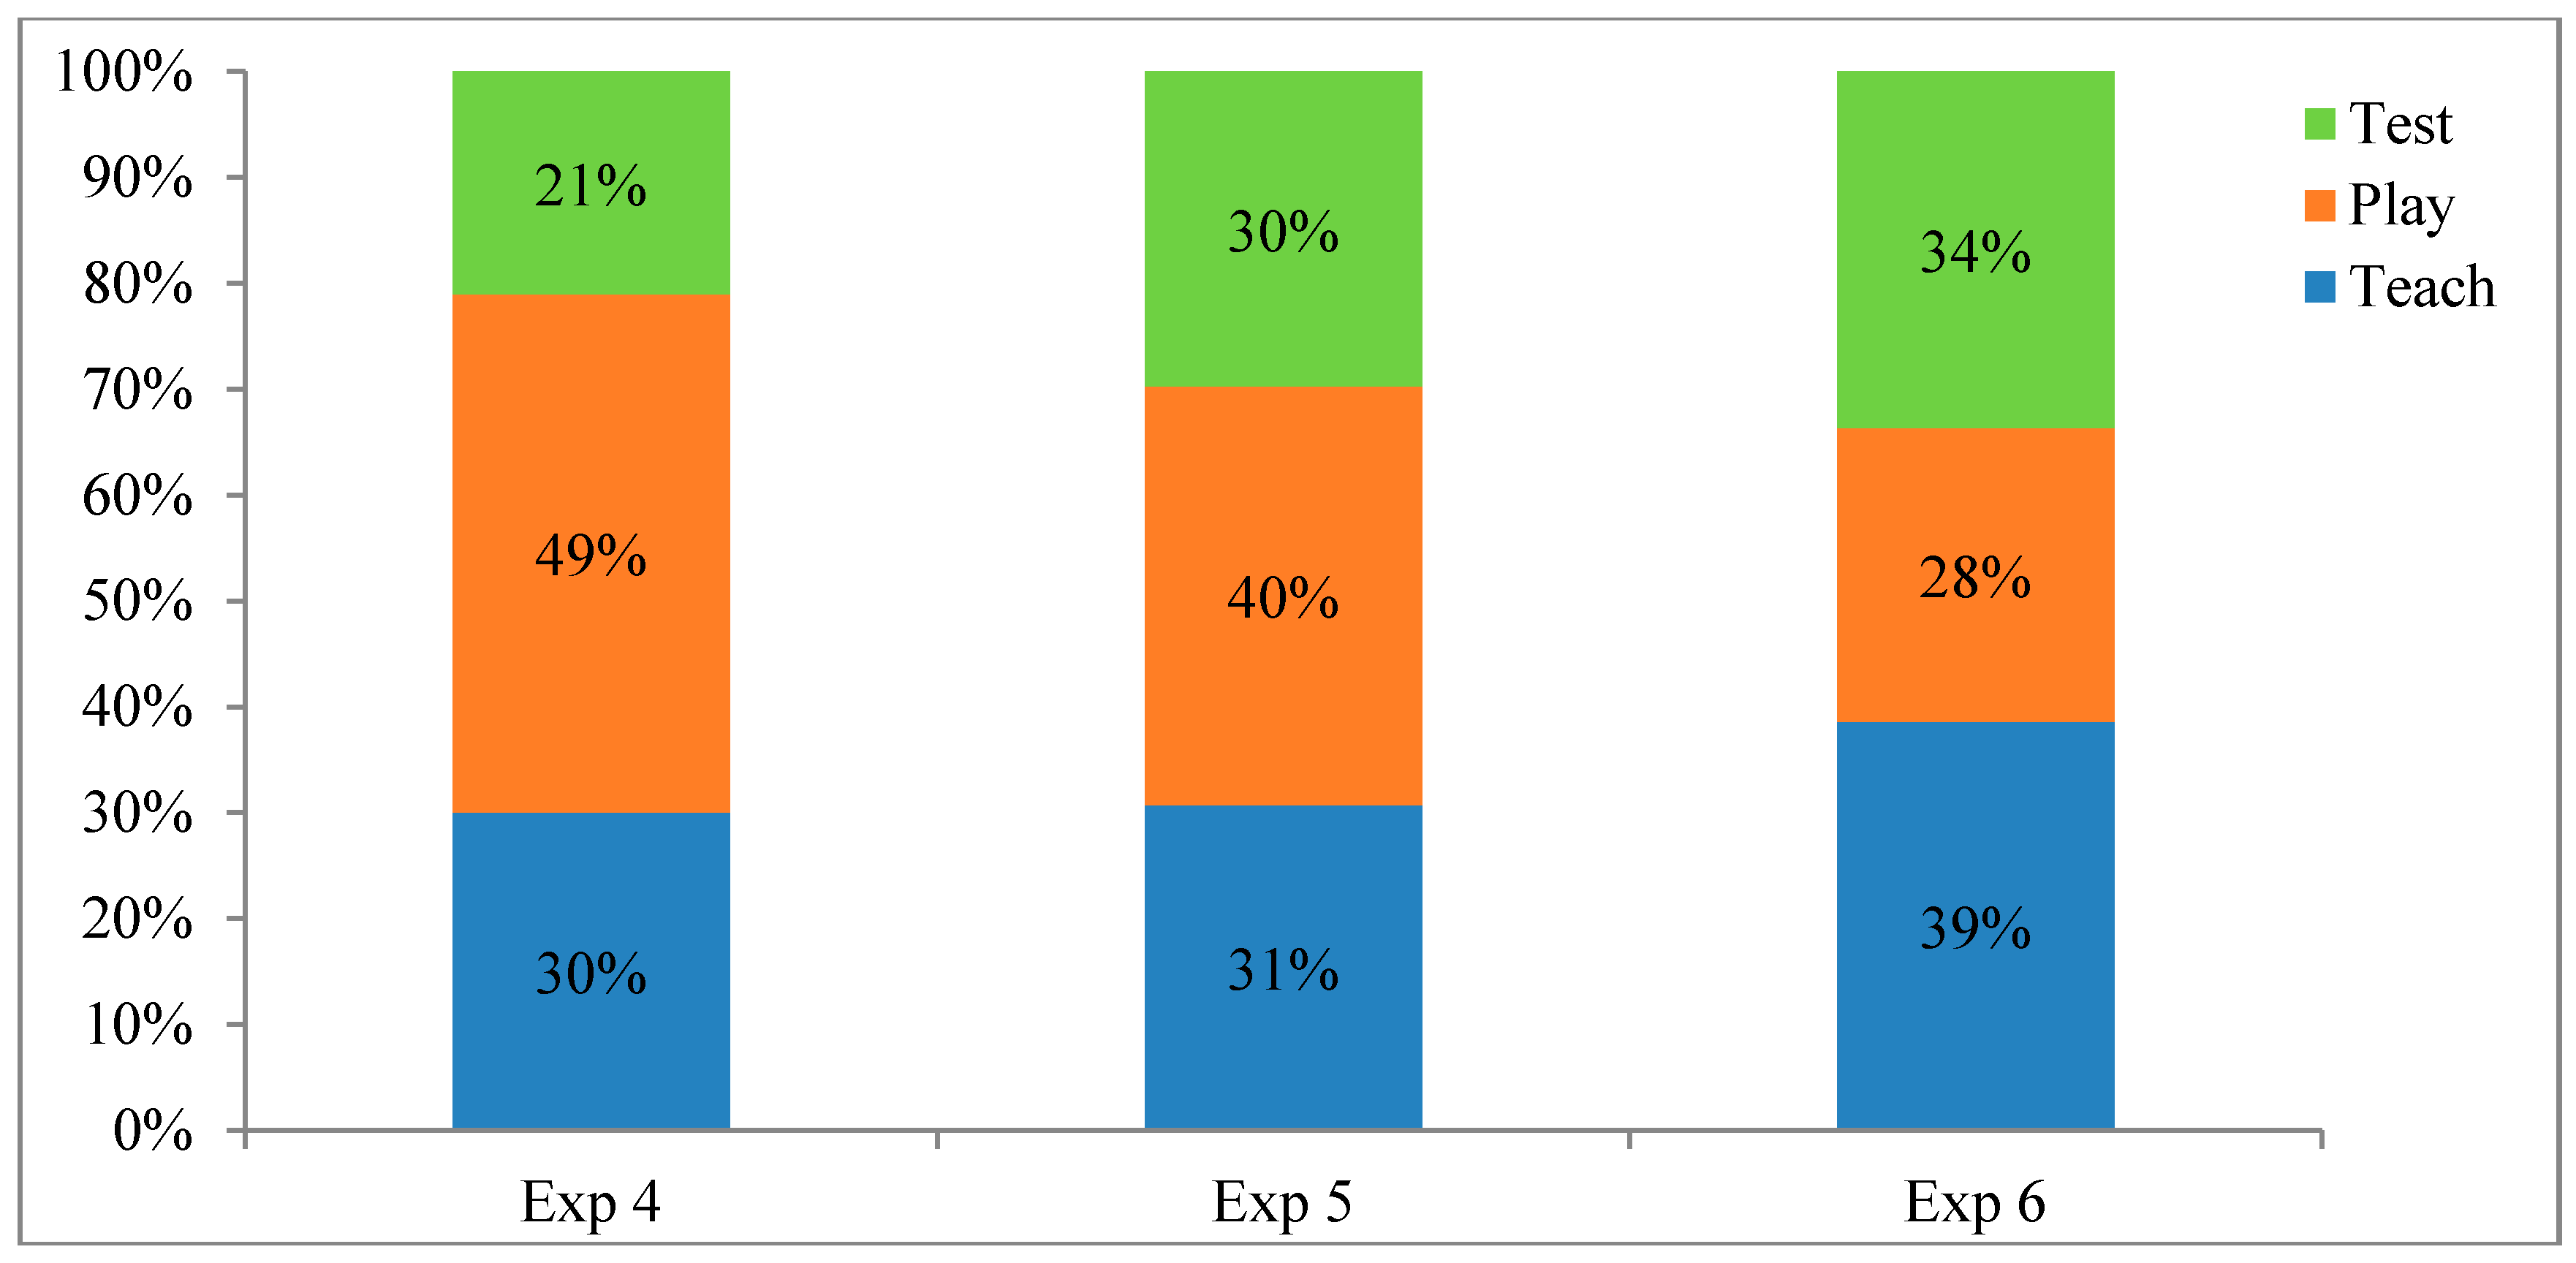
Although we were unable to experimentally test this balance of teaching, playing, and testing, our postmortem analysis demonstrates that the ratio of the game spent on each element changed over the iterative process. To analyze this, we divided each game into segments corresponding to these different types of game content. We then calculated the average amount of time players spent in each of these segments, excluding repeated play-throughs and players who were more than two standard deviations away from the mean. As the game length also changed from iteration to iteration, we then converted these to percentages (See
Figure 5 and
Figure 6).
As
Figure 5 and
Figure 6 indicate, in both games we decreased the amount of playing overall and increased both the teaching and testing. We also spent much more time teaching in our second game compared to the first, largely because those biases were more complex. For that reason, we also suggest there is likely not a ‘correct’ ratio for teaching, playing, and testing. Rather, iterative design, experimental testing, and data analysis are crucial for helping designers find the right balance between all three components for the content they are teaching. Future research could experimentally manipulate these factors, however, to determine if there is an optimal range for balancing these types of content in specific educational and training contexts.
3.3.2. Managing Difficulty
Iteration and testing played a large role in helping us identify the optimal level of challenge in our games. This is consistent with the principles from popular iterative game design models [
10,
11,
12,
26,
27,
28,
29]. Iterative design and testing is particularly important, as players often interact with and make sense of a game in surprising and unpredictable ways. Moreover, for training game projects, an iterative model that includes multiple opportunities to gather data from play sessions, provides valuable insight into how closely the current version of the game accomplishes the game’s learning objectives [
10,
11,
12]. One core requirement for robust outcomes seems to be achieving a sufficient level of difficulty in the learning challenge [
30]. As illustrated in our case studies, each change we made in Firebot and Bottle Blast was to help ensure that players focused on the content they were learning and not on frustrations with the interface or confusion about what the game was asking them to do. In Firebot, we reduced the number of choices players made and altered the text to ensure that the feedback taught the necessary content, regardless of player actions (i.e., even if they always selected the ‘right bot’ they learned about CB). In Bottle Blast, we added visual and textual signifiers to gently nudge players towards clicking the odds if they initially did not. Our cycles of development, play testing, and experimental testing allowed us to achieve the right balance in game challenges, quizzes, and language.
3.3.3. Challenges
Managing the difficulty of the in-game challenges with the difficulty of the training content was one of our main design considerations. Indeed, many game designers consider designing challenging tasks to be a key component of quality game design [
26,
28]. However, the level of challenge a game provides the players must consider their current ability. Many players may find a game that presents them with challenges that are too difficult relative to their current ability to be unfair, thus impeding their motivation to continue playing the game or to seriously engage in the game’s tasks [
31,
32]. Our experience rebalancing the difficulty for both games is consistent with prior research on the need for learning tasks to provide participants with an optimal level of difficulty consistent with their current ability. Guided by these insights, the goal for training game designers is to create games that are challenging but not too difficult or too easy, so as to impede on their motivation and learning [
33,
34,
35].
One of the particular difficulties of our project was that the biases covered in CYCLES Training Center were much easier to explain than the biases addressed in CYCLES Carnivale. Through our iterative design process, we found that we initially made CYCLES Training Center too easy and needed to increase the difficulty of the challenges, whereas we made CYCLES Carnivale too hard and subsequently made it easier by the third iteration. The appropriate level of challenge was not clear from playtesting or designer evaluation alone, highlighting the value of iteration and experimental testing to achieve the proper level of difficulty for both games.
Many of our changes for
CYCLES Training Center were to slow players’ to progress through the game by making the answers to puzzles less obvious or by completing challenges more difficult. This can be thought of as introducing forms of desirable difficulty, the idea that learning is optimal when the challenge is not too easy [
36]. For example, in the Firebot example described previously, although we reduced the number of choices players had to make, we added a great deal of feedback to encourage players to actively reflect on their choices. For FAE, which occurs when events are deemed to be caused by individuals rather than satiations, we added irrelevant objects for players to click on when deciding the root cause of a brain bot’s malfunction. The original rooms had a few possible situational causes and the core mitigation technique for FAE is to always select the situational explanation. Including additional possible causes forced players to more actively think about their selections. Similarly, the final room of the game was a BBS room, where the player had to program a brain bot to realize it is biased, because BBS is the tendency of people to think they are unbiased even if they can see biases in others. If the bot was not properly programmed, it would walk through the ‘unbiased entities’ door and get blown up. This process repeated until the player got a brain bot to walk through the ‘biased entities’ door. To make players spend more time with this lesson, we sped up the bot and thus made it harder to catch before it exploded. We also added additional brain bots with different programming interfaces so that players had more opportunities to demonstrate their knowledge of the core game and BBS lessons.
Click logs data support our qualitative assessment that
CYCLES Training Center became harder (
Table 1). The average time players spent in each room increased between the Experiment 2 and 3 games. Additionally, the average time between clicks increased between the Experiment 1 and Experiment 2 games. Thus, the later versions of the game required players to spend more time making their choices (a key goal in bias mitigation training) and successfully completing the rooms. These changes where associated with an overall improvement in bias mitigation (see
Figure 2).
In contrast, in developing CYCLES Carnivale, our focus was on reducing difficulty. Although players of our original game demonstrated significant learning, we were concerned that our first game provided too little instruction on the biases and mitigation strategies, and exposed players to complex scenarios too quickly. Thus, we added a new introductory tent for RB that introduced players to two RB subtypes with text, and a series of relatively easy scenarios before players engaged in more difficult challenges. Similarly, we added a new introductory tent exclusively devoted to the focalism form of AN. We also revised another quantitative AN challenge that required the players to estimate a value so that the game guided players through each step of the mitigation strategy (finding a midpoint in the range of potential values). In the Experiment 5 version of the challenge, the players calculated a midpoint on their own. For the Experiment 6 version, the game carefully guided players through each step of the mitigation strategy and provided helpful feedback.
For
CYCLES Carnivale, click logs again indicate that we reduced the game’s difficulty (
Table 2). Although the time per room and average minutes per click changed little across experiments, the errors and the attempts per challenge decreased from the Experiment 4 to Experiment 6 game, suggesting that the game was easier to complete. At the same time, we improved learning outcomes and bias mitigation (
Figure 4), suggesting that the diminished difficulty of the challenges may have allowed players to focus on better learning the core content. Future research could attempt to confirm this relationship by experimentally manipulating difficulty.
3.3.4. Quizzes
As previously noted, we also found that having testing moments throughout the games was important for improving R&D. In line with the changes identified above, the CYCLES Training Center quizzes were made more difficult and the CYCLES Carnivale quizzes were made easier with each iteration. In the first Training Center game, the quizzes had simple questions designed to reinforce the teaching from the rooms. With each iteration, we changed the wording to make the questions harder. By the final game, we had replaced several quizzes with more difficult questions that asked players to apply what they had learned about these biases to new, often more complicated real-world scenarios.
The original quiz questions in CYCLES Carnivale provided players with new scenarios to practice identifying or mitigating biases. Many of these scenarios were more difficult to correctly answer, relative to early challenges in the game. For the Experiment 5 game, we added more quiz questions and included even more difficult questions, because in that experimental manipulation, players could skip challenges if they correctly answered the questions. Quizzes included questions where players had to select the ‘best definition’ or the ‘most effective’ mitigation strategy for a specific bias among the choices that required close attention, to determine which one was truly the best option. By Experiment 6, however, we decreased the level of difficulty for the quizzes based on feedback during playtesting. We removed the trickier ‘best definition’ and ‘most effective’ questions and returned to the simpler identify-and-mitigate types of questions from the Experiment 4 game, but with simpler wording than what was used in the original game.
An analysis of the click logs supports our qualitative assessment that we increased the quiz question difficulty in
CYCLES Training Center and decreased the difficulty in
CYCLES Carinvale (
Figure 7). It also demonstrates that there was only a minor change in the difficulty between Experiments 2 and 3, consistent with our qualitative assessment. Also, as we added some difficulty to Experiment 5, it makes sense that there is little change between that game and Experiment 4. The data also suggest that around 70% correct was the ‘sweet spot’ for testing difficulty, although we suggest experimental testing of this in future research.
3.3.5. Language
Learning theory suggests that unnecessarily complex language impedes cognition [
37,
38,
39]. Consequently, we endeavored to provide concrete descriptions and explanations that reflected the multifaceted nature of the biases and our strategies for mitigating them, while simultaneously avoiding overly complex language. We found it difficult to gauge our success at achieving this balance at the outset of the development process for both games. Consequently, as our case studies illustrate, it was only through multiple rounds of iteration and close scrutiny of each iteration’s learning outcomes that we were able to achieve what we consider to be an appropriate balance between communicating nuanced learning content and simplicity of language in our games.
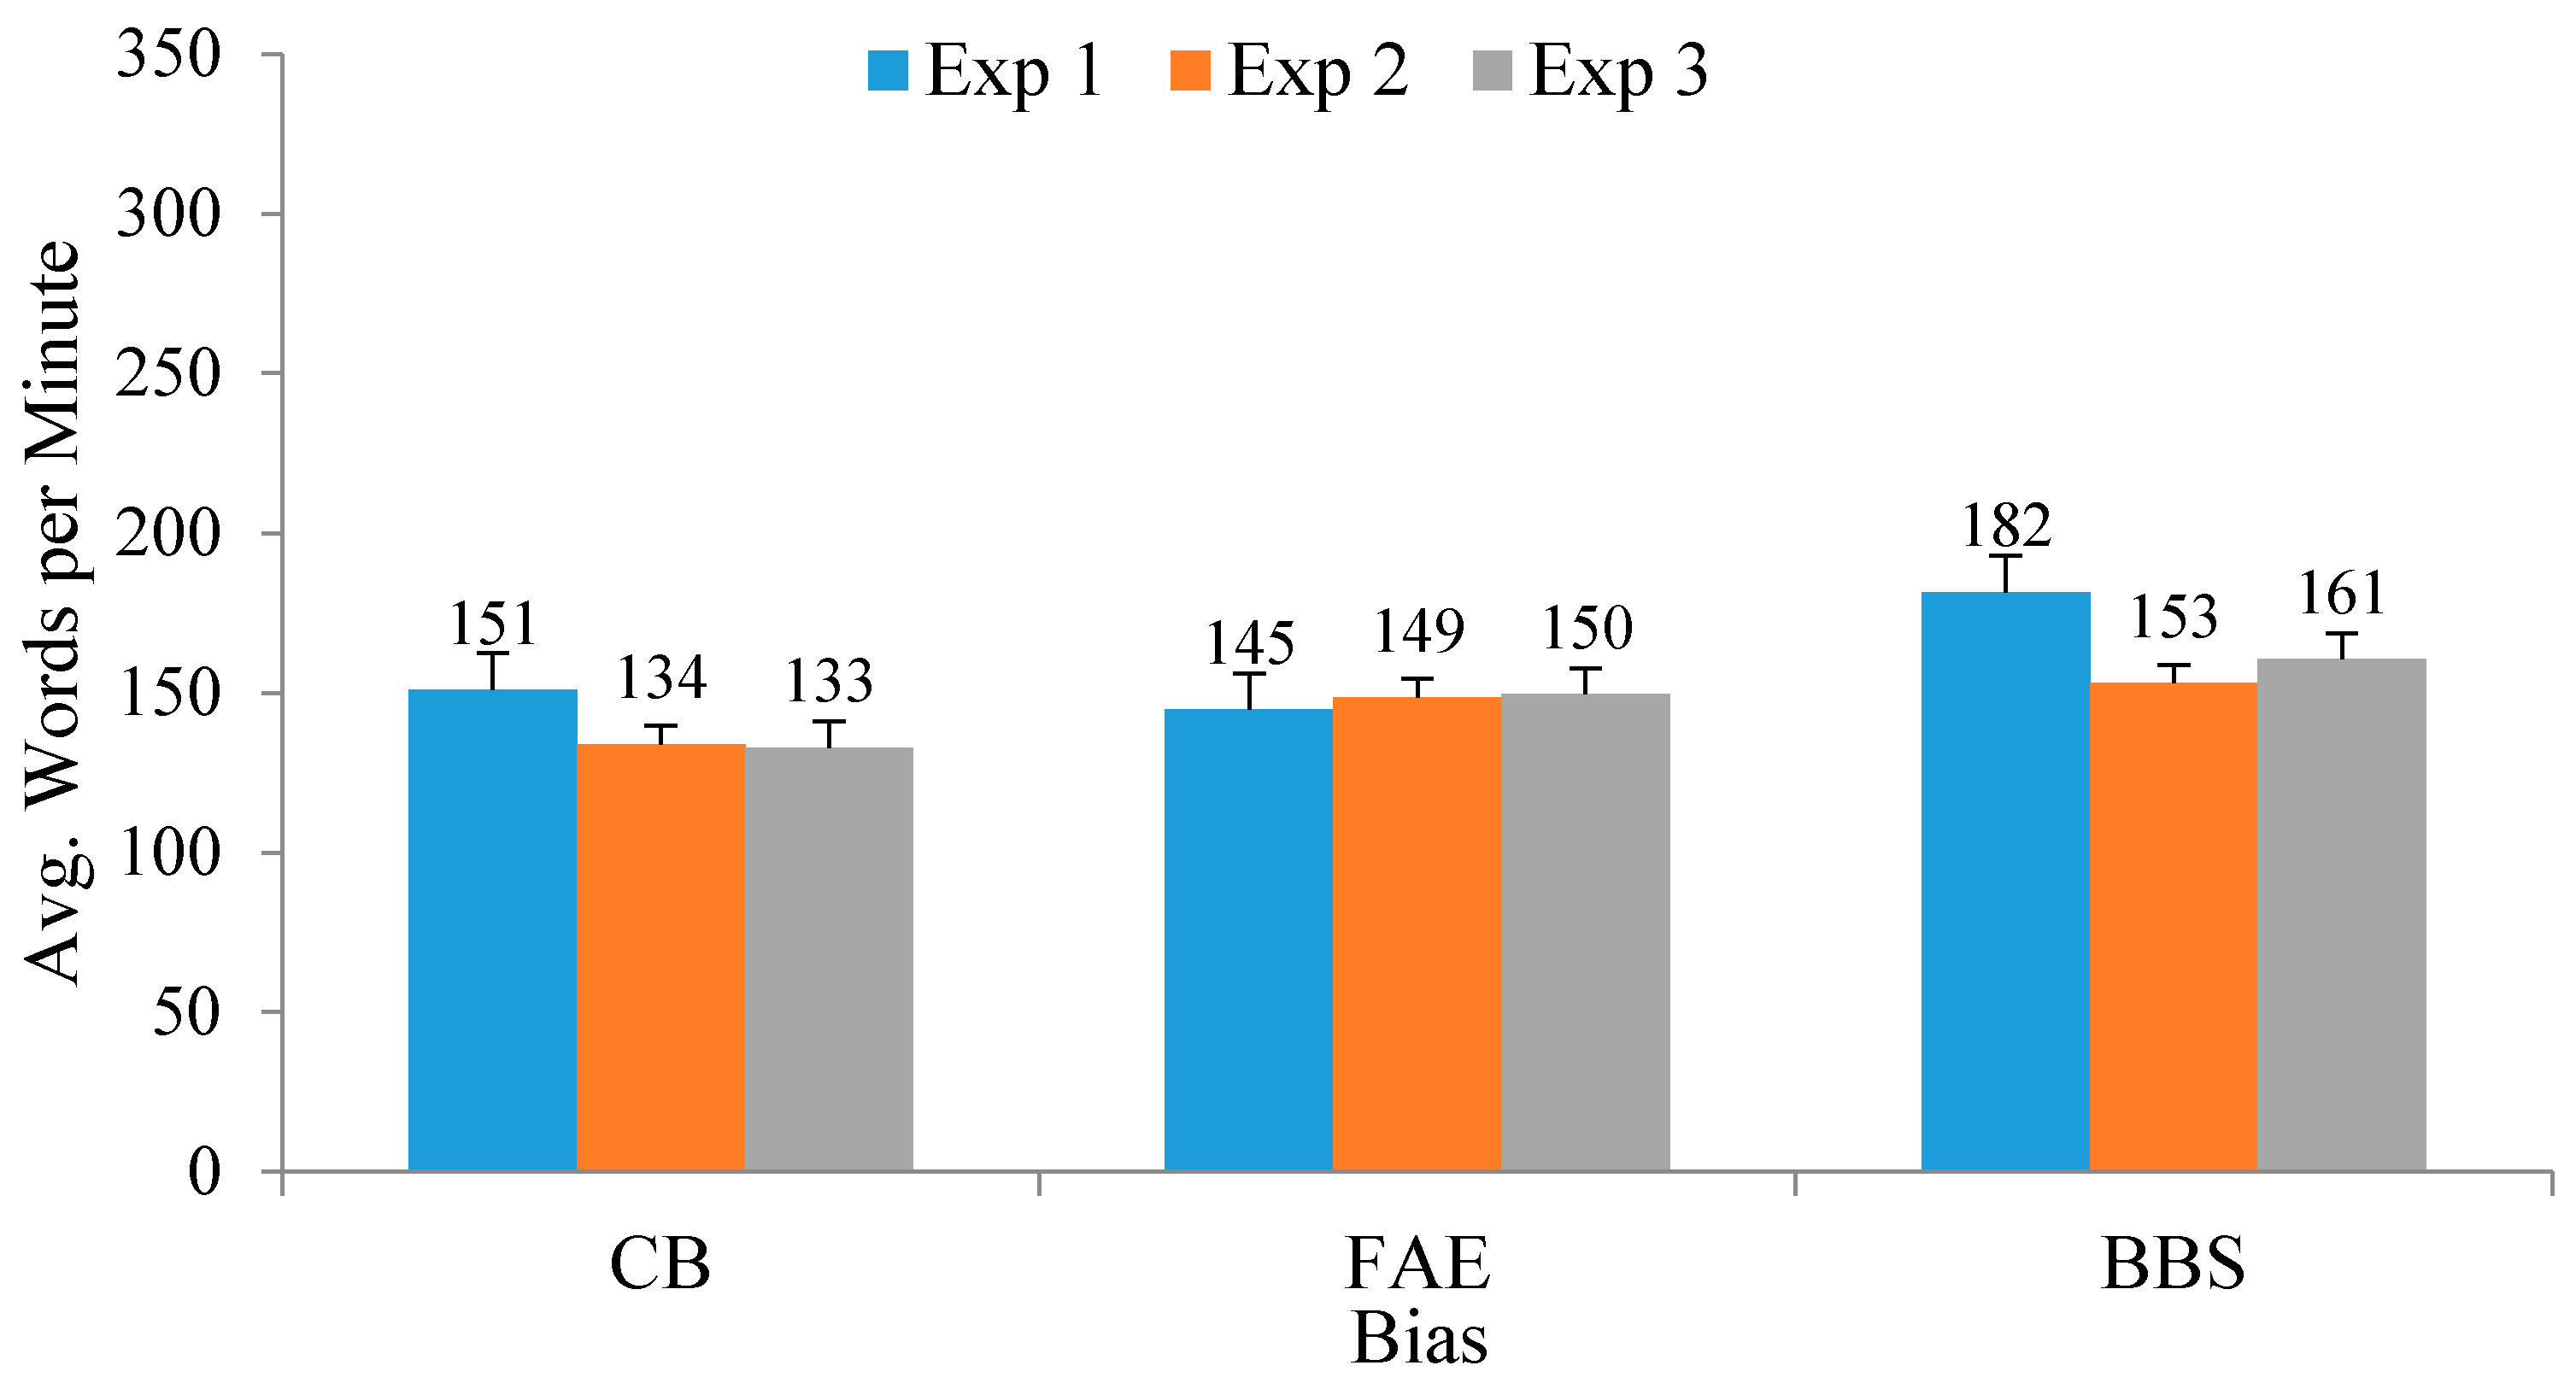
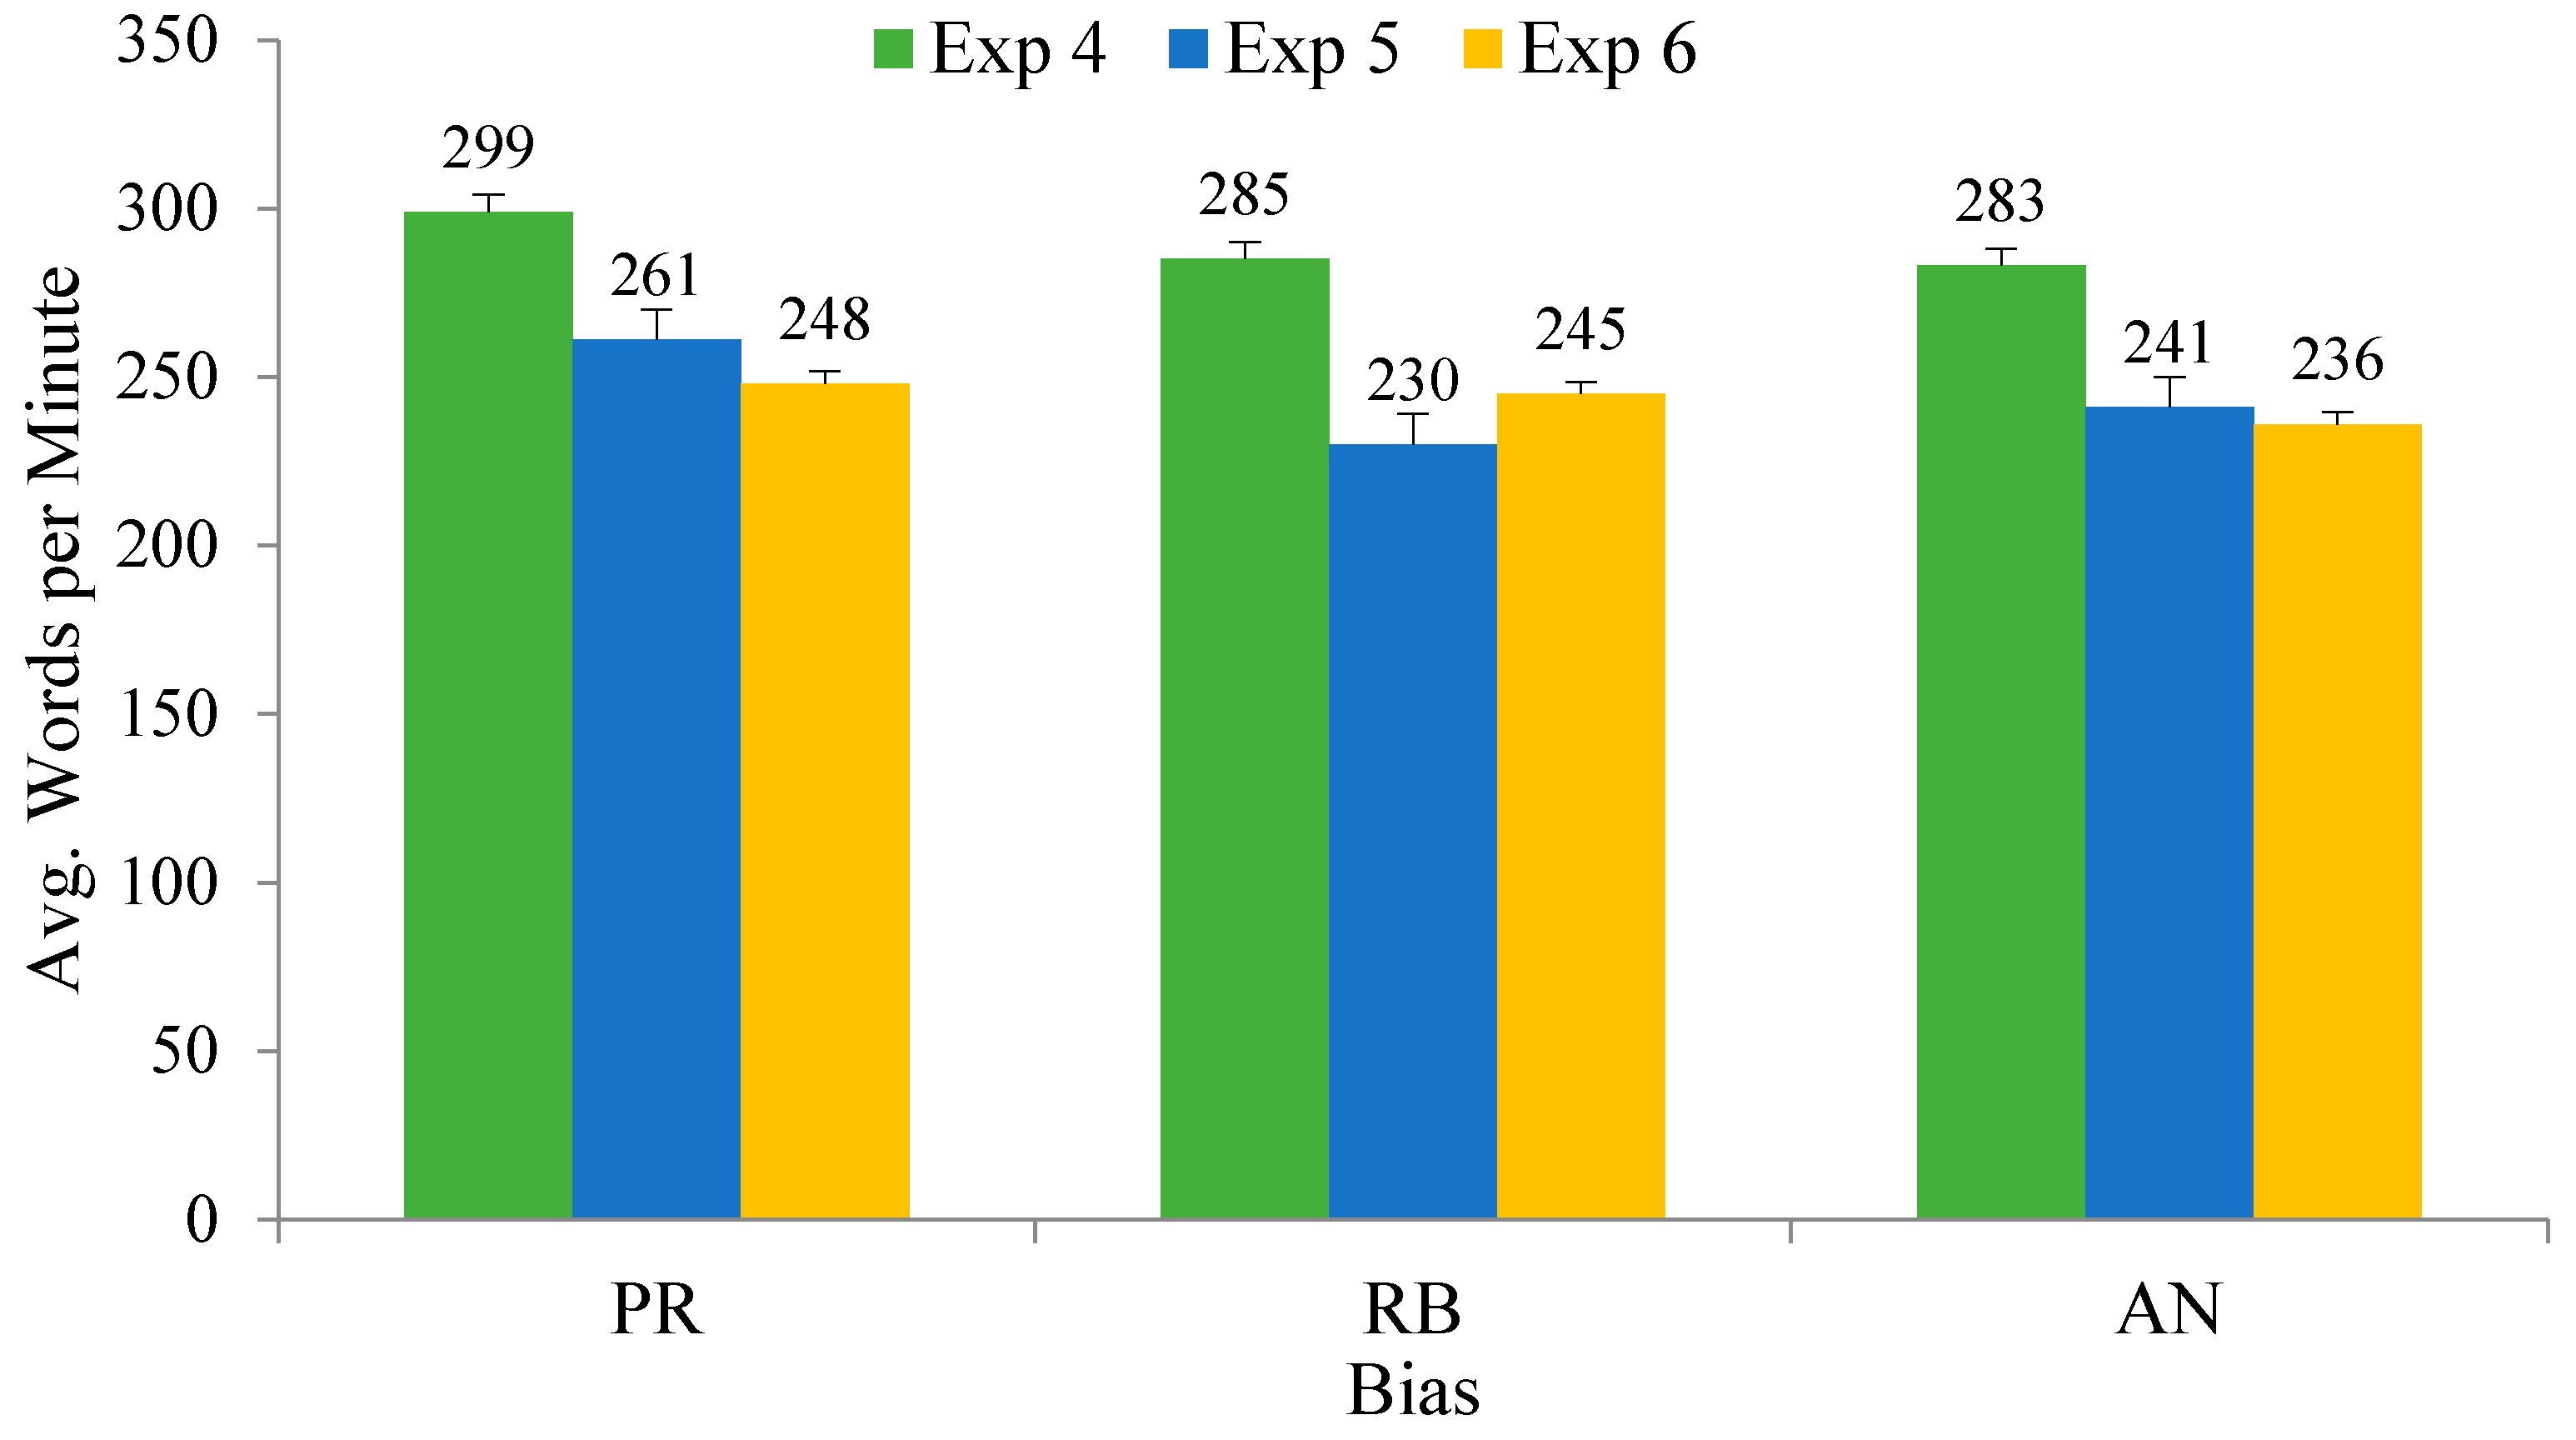
To examine how much we actually altered the language in our games, we analyzed several aspects of the language from the games as part of our postmortem analysis. Our analysis included the number of words, number of unique words, and language comprehension. Firstly, we analyzed the number of words and number of unique words by bias controlling for time using average game component length. For example, for the analysis of the number of words per minute for projection bias (PR), we took the total number of words devoted to the projection bias and divided that by the total time, averaged across the players in projection-focused content.
Figure 8 and
Figure 9 show the average number of words per minute displayed to the players by bias per game.
In CYCLES Training Center, we reduced the number of words we used in confirmation bias (CB) and in bias blind spot (BBS). However, the number of words used in the fundamental attribution error (FAE) challenges remained largely unchanged. This is likely because our testing demonstrated success in teaching FAE, which was easier to explain. In CYCLES Carnivale, we consistently reduced the total number of words per minute for all of the biases. We also used the Flesh–Kincaid reading index to measure language comprehension changes, but that analysis did not reveal important differences. Overall, these findings indicate that we were generally able to simplify the language for the final games by reducing the number of words per minute devoted to explaining these biases to players. Future research might experimentally manipulate these language variables, however, to systematically assess their impact on learning outcomes.
4. Conclusions
Revisiting our research questions, the major changes made throughout the iterative design process were balancing teaching, playing, and testing moments and managing the difficulty level (RQ1). There were some differences in the changes made to each game, however, these were during the iterative development process (RQ2). Firstly, we made CYCLES Training Center progressively harder, while we made CYCLES Carnivale progressively easier. There are two reasons for this. Firstly, the biases for the second game were more challenging to explain and much harder to train players to mitigate. Secondly, as we found ourselves increasing the complexity of the first game, it is possible that we overestimated how complex we needed to make the second game. Iteration and testing were key to discovering the ‘sweet spot’ of challenging players without frustrating them. While we also note that the interface and feedback changes contributed to these outcomes, we were unable to systematically quantify those changes and so did not include them in this mixed-methods analysis.
There were, however, consistent themes in the development process for both games, which correspond with the guidelines in game design literature. Yet these are not variables typically manipulated in the experimental studies of educational and training games. What this postmortem analysis demonstrates, however, is that these are changes that can be assessed empirically (RQ3). Specifically, the amount of time spent between instruction, letting players play, and testing on learning outcomes needs to be experimentally tested to qualify the prevailing assumptions, that play is actually the most important element of games designed to train. Moreover, while all of the game designers struggle with making a game challenging but not too challenging, this analysis suggests that the type of learning content affects how easy or hard a training game such as this should be. Furthermore, this analysis demonstrates that there are key data points that can be used to focus that iterative process. For example, to gain a better sense of the amount of play, we conducted a content analysis that distinguished between the different types of in-game activities in our games, including exploratory play, teaching, and testing. We also relied on a variety of in-game click logs to ascertain each game’s difficulty level, including the average time spent in each challenge, average time between each click, average number of errors per challenge, average number of attempts per challenge, and the average percent of quiz questions correct. Finally, we evaluated the language complexity of our games using the average number of words per minute, as well as the average number of unique words per minute. All of these indicators provide valuable insight and can be easily measured, especially if the necessary components for conducting these types of analyses are incorporated into the initial game design.
Although we know that the final version of each game performed the best in terms of our outcome measures, we have no definitive proof that any of these specific changes account for that improvement (RQ4). We cannot assess their impact on the successfulness of training games without experimental testing. The methods we used to conduct our postmortem, however, could be used to create versions of games that manipulate the balance of teaching, playing, and testing, or the difficulty of challenges, quizzes, and language. Of course, the content, style, and audience for the game will also be important variables to consider. Nonetheless, these data point to and help operationalize game features that could inform the future testing of educational and training games.
Author Contributions
All of the authors contributed to the conceptualization of the experiments, analysis, and game development. The methodology was developed by A.S., R.M.M., J.S.-G., K.K., and B.A.C. The software was developed by E.T.S. and E.M. The formal analysis was performed by B.M., R.M.M., J.S.-G., M.G.R., K.K., and B.A.C. The investigation was performed by A.S., B.M., R.M.M., J.S.-G., J.E.F., K.K., and B.A.C. The data curation was performed by R.M.M., J.S.-G., K.K., and B.A.C. The original draft preparation was done by A.S. and B.M., while review and editing work was done by R.M.M., J.S.-G., M.G.R., K.K. and B.A.C.; The visualization was done by B.M., R.M.M., J.S.-G., K.K., and B.A.C. The supervision was done by R.M.M., J.S.-G., K.K., B.A.C., and T.S. The project administration was handled by J.S.-G. and T.S. Finally, the following authors played a key role in funding acquisition: A.S., R.M.M., J.S.-G., J.E.F., K.K., B.A.C., and T.K.
Funding
This work was supported by the Intelligence Advanced Research Projects Activity (IARPA) via the Air Force Research Laboratory, contract number FA8650-11-C-7176. The views and conclusions contained herein are those of the authors and should not be interpreted as necessarily representing the official policies or endorsements, either expressed or implied, of IARPA, AFRL, or the U.S. Government.
Conflicts of Interest
The authors declare no conflict of interest.
References
- Greenfield, P.M. Mind and Media: The Effects of Television, Video Games and Computers; Psychology Press: New York, NY, USA, 2014. [Google Scholar]
- Gee, J.P. What Video Games Have to Teach Us about Learning and Literacy: Revised and Updated Edition; Macmillan: New York, NY, USA, 2007. [Google Scholar]
- Squire, K. Video Games and Learning: Teaching and Participatory Culture in the Digital Age; Teachers College Press: New York, NY, USA, 2011. [Google Scholar]
- Clegg, B.A.; McKernan, B.; Martey, R.M.; Taylor, S.M.; Stromer-Galley, J.; Kenski, K.; Saulnier, E.T.; Rhodes, M.G.; Folkestad, J.E.; McLaren, E.; et al. Effective Mitigation of Anchoring Bias, Projection Bias, and Representativeness Bias from Serious Game-based Training. Procedia Manuf. 2015, 3, 1558–1565. [Google Scholar] [CrossRef]
- Clegg, B.A.; Collins, F.; Kenski, K.; McLaren, E.; Patterson, J.D.; Saulnier, T.; Shaw, A.; Strzalkowski, T.; Stromer-Galley, J.; Lewis, J.E. Game-Based Training to Mitigate Three Forms of Cognitive Bias. In Proceedings of the Interservice/Industry Training, Simulation, and Education Conference, Orlando, FL, USA, 1–5 December 2014. [Google Scholar]
- Martey, R.M.; Stromer-Galley, J.; Shaw, A.; McKernan, B.; Saulnier, T.; Mclaren, E.; Rhodes, M.; Folkestad, J.; Taylor, S.M.; Kenski, K.; et al. Balancing Play and Formal Training in the Design of Serious Games. Games Cult. 2017, 12, 269–291. [Google Scholar] [CrossRef]
- McKernan, B.; Martey, R.M.; Stromer-Galley, J.; Kenski, K.; Clegg, B.A.; Folkestad, J.E.; Rhodes, M.G.; Shaw, A.; Saulnier, E.T.; Strzalkowski, T. We don’t need no stinkin’ badges: The impact of reward features and feeling rewarded in educational games. Comput. Hum. Behav. 2015, 45, 299–306. [Google Scholar] [CrossRef]
- Shaw, A.; Kenski, K.; Stromer-Galley, J.; Mikeal Martey, R.; Clegg, B.A.; Lewis, J.E.; Folkestad, J.E.; Strzalkowski, T. Serious Efforts at Bias Reduction. J. Media Psychol. 2016, 30, 16–28. [Google Scholar] [CrossRef]
- Martey, R.M.; Shaw, A.; Stromer-Galley, J.; Kenski, K.; Clegg, B.A.; Saulnier, E.T.; Strzalkowski, T. Testing the Power of Game Lessons: The Effects of Art Style and Narrative Complexity on Reducing Cognitive Bias. International Journal of Communication. Available online: http://ijoc.org/index.php/ijoc/article/view/5032/1997 (accessed on 28 May 2018).
- Eladhari, M.P.; Ollila, E.M. Design for research results experimental prototyping and play testing. Simul. Gaming 2012, 43, 391–412. [Google Scholar] [CrossRef]
- Moschini, E. Designing for the smart player: Usability design and user-centered design in game-based learning. Digit. Creat. 2006, 17, 140–147. [Google Scholar] [CrossRef]
- Wenzler, I. The ten commandments for translating simulation results into real-life performance. Simul. Gaming 2009, 40, 98–109. [Google Scholar] [CrossRef]
- Williams, P.; Nesbitt, K.V.; Eidels, A.; Elliot, D. Balancing risk and reward to develop an optimal hot-hand game. Game Stud. 2011, 11. Available online: http://gamestudies.org/1101/articles/williams_nesbitt_eidels_elliott (accessed on 18 June 2018).
- Heuer, R.J.; Pherson, R.H. Structured Analytic Techniques for Intelligence Analysis; CQ Press: Washington, DC, USA, 2010. [Google Scholar]
- Nickerson, R.S. Confirmation bias: A ubiquitous phenomenon in many guises. Rev. Gen. Psychol. 1998, 2, 175–220. [Google Scholar] [CrossRef]
- Legare, C.H. Exploring explanation: Explaining inconsistent evidence informs exploratory, hypothesis-testing behavior in young children. Child Dev. 2012, 83, 173–185. [Google Scholar] [CrossRef] [PubMed]
- Aldrich, C. Learning by Doing: A Comprehensive Guide to Simulations, Computer Games, and Pedagogy in e-Learning and Other Educational Experiences; Wiley: New York, NY, USA, 2005. [Google Scholar]
- Jenson, J.; Taylor, N.; de Castell, S. Epidemic: Learning games go viral. J. Can. Assoc. Curric. Stud. 2011, 8, 28–49. [Google Scholar]
- Muehrer, R.; Jenson, J.; Friedberg, J.; Husain, N. Challenges and opportunities: Using a science-based video game in secondary school settings. Cult. Stud. Sci. Educ. 2012, 7, 783–805. [Google Scholar] [CrossRef]
- Squire, K. From context to content: Videogames as designed experience. Educ. Res. 2006, 35, 19–29. [Google Scholar] [CrossRef]
- Watson, W.R.; Mong, C.J.; Harris, C.A. A case study of the in-class use of a video game for teaching high school history. Comput. Educ. 2011, 56, 466–474. [Google Scholar] [CrossRef]
- Kirschner, P.A.; Sweller, J.; Clark, R.E. Why Minimal Guidance during Instruction Does Not Work: An Analysis of the Failure of Constructivist, Discovery, Problem-Based, Experiential, and Inquiry-Based Teaching. Educ. Psychol. 2010, 41, 75–86. [Google Scholar] [CrossRef]
- Roediger, H.L.; Butler, A.C. The critical role of retrieval practice in long-term retention. Trends Cogn. Sci. 2011, 15, 20–27. [Google Scholar] [CrossRef] [PubMed]
- Roediger, H.L., III; Karpicke, J.D. Test-enhanced learning: Taking memory tests improves long-term retention. Psychol. Sci. 2006, 17, 249–255. [Google Scholar] [CrossRef] [PubMed]
- Rowland, C.A. The effect of testing versus restudy on retention: A meta-analytic review of the testing effect. Psychol. Bull. 2014, 140, 1432–1463. [Google Scholar] [CrossRef] [PubMed]
- Fullerton, T. Game Design Workshop: A Playcentric Approach to Creating Innovative Games, 3rd ed.; CRC Press: Boca Raton, FL, USA, 2014. [Google Scholar]
- Mettler, T.; Pinto, R. Serious Games as a Means for Scientific Knowledge Transfer a Case from Engineering Management Education. IEEE Trans. Eng. Manag. 2015, 62, 256–265. [Google Scholar] [CrossRef]
- Salen, K.; Zimmerman, E. Rules of Play: Game Design Fundamentals; MIT Press: Cambridge, MA, USA, 2003. [Google Scholar]
- Seidman, M.; Flanagan, M.; Kaufman, G. Failed Games: Lessons Learned from Promising but Problematic Game Prototypes in Designing for Diversity. In Proceedings of the 2015 Digital Games Research Association, Lüneburg, Germany, 14–17 May 2015. [Google Scholar]
- Bjork, R.A.; Bjork, E.L. Optimizing treatment and instruction: Implications of a new theory of disuse. In Memory and Society: Psychological Perspectives; Nilsson, L.G., Obta, N., Eds.; Psychology Press: New York, NY, USA, 2013; pp. 109–133. [Google Scholar]
- Malone, T.W.; Lepper, M.R. Making learning fun: A taxonomy of intrinsic motivations for learning. In Aptitude, Learning, and Instruction; Snow, R.E., Farr, M.J., Eds.; Lawrence Erlbaum: Hillsdale, NJ, USA, 1987; Volume 3, pp. 223–253. [Google Scholar]
- Ryan, R.M.; Rigby, C.S.; Przybylski, A. The motivational pull of video games: A self-determination theory approach. Motiv. Emot. 2006, 30, 344–360. [Google Scholar] [CrossRef]
- Garris, R.; Ahlers, R.; Driskell, J.E. Games, motivation, and learning: A research and practice model. Simul. Gaming 2002, 33, 441–467. [Google Scholar] [CrossRef]
- Kiili, K. Digital game-based learning: Towards an experiential gaming model. Internet High. Educ. 2005, 8, 13–24. [Google Scholar] [CrossRef]
- Orvis, K.A.; Horn, D.B.; Belanich, J. The roles of task difficulty and prior videogame experience on performance and motivation in instructional videogames. Comput. Hum. Behav. 2008, 24, 2415–2433. [Google Scholar] [CrossRef]
- Bjork, R.A. Memory and metamemory considerations in the training of human beings. In Metacognition: Knowing about Knowing; Matcalfe, J., Shimamura, A., Eds.; MIT Press: Cambridge, MA, USA, 1994; pp. 185–205. [Google Scholar]
- Martin, E.; Roberts, K.H. Grammatical factors in sentence retention. J. Verbal Learn. Verbal Behav. 1966, 5, 211–218. [Google Scholar] [CrossRef]
- Mikk, J. Sentence length for revealing the cognitive load reversal effect in text comprehension. Educ. Stud. 2008, 34, 119–127. [Google Scholar] [CrossRef]
- Van Weert, J.C.; van Noort, G.; Bol, N.; van Dijk, L.; Tates, K.; Jansen, J. Tailored information for cancer patients on the Internet: Effects of visual cues and language complexity on information recall and satisfaction. Patient Educ. Couns. 2011, 84, 368–378. [Google Scholar] [CrossRef] [PubMed]
© 2018 by the authors. Licensee MDPI, Basel, Switzerland. This article is an open access article distributed under the terms and conditions of the Creative Commons Attribution (CC BY) license (http://creativecommons.org/licenses/by/4.0/).

 ,
, 


