The Communicative Effectiveness of Education Videos: Towards an Empirically-Motivated Multimodal Account


1
Faculty of Linguistics and Literary Sciences, Bremen University, 28359 Bremen, Germany
2
Faculty of Pedagogy and Educational Sciences, Bremen University, 28359 Bremen, Germany
*
Author to whom correspondence should be addressed.
†
These authors contributed equally to this work.
Multimodal Technol. Interact. 2018, 2(3), 59; https://doi.org/10.3390/mti2030059
Submission received: 20 April 2018
/
Revised: 15 August 2018
/
Accepted: 4 September 2018
/
Published: 12 September 2018
(This article belongs to the Special Issue Multimodal Learning)
Abstract
:Educational content of many kinds and from many disciplines are increasingly presented in the form of short videos made broadly accessible via platforms such as YouTube. We argue that understanding how such communicative forms function effectively (or not) demands a more thorough theoretical foundation in the principles of multimodal communication that is also capable of engaging with, and driving, empirical studies. We introduce the basic concepts adopted and discuss an empirical study showing how functional measures derived from the theory of multimodality we employ and results from a recipient-based study that we conducted align. We situate these results with respect to the state of the art in cognitive research in multimodal learning and argue that the more complex multimodal interactions and artifacts become, the more a fine-grained view of multimodal communication of the kind we propose will be essential for engaging with such media, both theoretically and empirically.
1. Introduction
Educational content of many kinds and from many disciplines are increasingly presented in the form of short videos made broadly accessible via platforms such as YouTube. The intended audiences of such videos range from the generally interested public, through school pupils at various levels, to university students. In this article, we argue that understanding how such communication functions effectively (or not) demands a more thorough theoretical foundation in the principles of multimodal communication that is capable of engaging with, and driving, empirical studies. The article introduces the basic concepts of the broad theory of multimodality employed, shows how this can be applied to produce concrete analyses of complex educational videos, and then reports results of empirical studies in which we investigate hypotheses concerning communicative effectiveness that are derived both from general accounts of multimedia instruction and directly from the multimodal analysis. We argue that multimodal analysis of the kind introduced here offers a more fine-grained view of how such communicative artifacts function by characterizing the communicative consequences of all and any of the combinations of expressive forms and strategies mobilized. An account of this kind then complements approaches such as cognitive problem-solving heuristic reasoning, diagrammatic reasoning, or information visualization sense-making by refocusing attention on the workings, mutual interactions, and consequences of the specific communicative resources employed in any artifact analyzed.
We suggest further that educational videos of the kind analyzed constitute an ideal target of research at this time because they are substantially more complex (in terms of their modal diversity) than more restricted communicative forms, such as static information visualizations, while nevertheless remaining simpler than several communicative media now being envisaged and becoming technologically feasible for educational purposes, such as virtual and augmented reality. We consider it unlikely that effective empirical research of these latter forms will be possible without first achieving a strong, empirically well-motivated and theoretically anchored framework for multimodal communication, where theory and empirical investigation are tightly linked. Educational videos therefore constitute a highly beneficial test case for the development of multimodally more sophisticated analytic frameworks and their related empirical methods.
2. The Research Domain: The Rise of Educational Videos and the Challenges They Raise for Effective Research
Despite the rapid growth of both professionally and lay-produced materials for educational purposes, empirical studies investigating their effectiveness have to date produced conflicting results. Both positive and negative findings are documented for a broad variety of alternative design strategies. We argue that a significant reason for this state of affairs is to be found in the fact that there are few theoretical frameworks available that would allow empirical studies to be conducted with the precision necessary for securing robust results, particularly when faced with multimodal complexity involving spoken language, written language, visualizations in diagrammatic and pictorial form, and combinations of all of these scaffolded by metacommunication of various kinds (typically including spoken pointers, manual gestures, dynamic presentation resources such as zooms, slide transitions, gradual text reveals, and so on).
One of the most established frameworks addressing the effectiveness of combining forms of expression for teaching purposes is Mayer’s [1] “Cognitive Theory of Multimedia Learning” (CTML), where 12 guidelines for effective design are proposed. These guidelines make organizational principles explicit which, when followed, should result in an improved learning result. For example, Mayer’s Redundancy Principle states that people learn better from combinations of graphics and narration than from graphics, narration and on-screen text; the Spatial Contiguity Principle states that people learn better when corresponding words and pictures are presented near rather than far from each other on the page or screen; the Temporal Contiguity Principle states that people learn better when corresponding words and pictures are presented simultaneously rather than successively; the Modality Principle states that people learn better from graphics and narrations than from animation and on-screen text; and the Multimedia Principle states that people learn better from words and pictures than from words alone. There are also several principles that refer to the manner of presentation, including a preference for conversational language, presented in a friendly fashion, although not necessarily with an image or picture of the speaker, as well as further principles concerning the avoidance of redundant information (“extraneous words, sounds or pictures”), the provision of explicit organizational cues and “self-pacing”, and prior knowledge of the terminology employed.
This level of granularity raises several problems for the formulation of incisive accounts. Multimodal artifacts are often now sufficiently complex and diverse in the expressive forms that they co-deploy that it is by no means clear whether particular combinations of those expressive forms are obeying the proposed principles or not. More commonly, some groupings will be characterizable as obeying the principles, while others are not. This demands a finer-grained characterization of what is occurring where even traditional distinctions, such as “words” and “image”, need considerable refinement. Recognition of aspects of the problems raised by this kind of strong multimodality is already evident, for example, in Schnotz’s [2] discussion of possible limitations in his proposed integrated model of “text” and “picture” understanding:
“Despite its relative complexity, the integrated model still simplifies things considerably and therefore needs further elaboration. For example, there might exist multiple levels of propositional representation within the verbal channel instead of only one level. The different levels might range from the micropropositions expressed in the text to various levels of macropropositions …. Similarly, there might exist multiple levels of mental models in the pictorial channel ranging from coarse-grained overview models to detailed models with high granularity”.([2], 65–66)
A broadening array of psychological studies showing both interdependence and interference effects across diverse forms of expression, ranging from Paivio’s early dual-coding theory [3] to studies such as Landy and colleagues’ examinations of visual imagery and algebraic equations [4], suggest both that individual sensory channels have their own processing channels and that the interactions between these when processing different expressive forms are still far from clear. Establishing a more differentiating view of presentational forms and their organization supportive of empirical investigations will consequently be a major task taken up below.
Although valuable and still widely used, Mayer’s description is increasingly challenged when the target of analysis becomes in itself multimodally complex; subsequent refinements and extensions to the model have not yet achieved a sufficiently tight theoretical hold of the basic properties of multimodality involved. This substantially complicates the task of performing effective empirical reception studies. Discussions of multimodally complex interactions and presentations vacillate on such basic issues as to whether modes are to be characterized in terms of sensory channels or in terms of presentational forms and adopted models typically assume some compromise position where both play a role ([5], 34–35). Further issues such as limited capacity processing and different kinds of memory and representations certainly require that perceptual properties of the understanding process receive adequate attention; however, the now generally accepted assumption that perception is an active, hypothesis-driven process in its own right demands equally that the sources of such hypotheses be characterized more effectively. For this, the internal organization and functional consequences of presentational forms become increasingly significant factors.
Another area of studies that has focused specifically on the challenges of complex communicative artifacts combining expressive forms with diverse internal organizations is that of “multimodality” itself; this is a broad field with diverse contributing disciplines [6,7], among which Kress and van Leeuwen’s [8] socio-semiotics account has been particularly influential. However, there are several difficulties to be met here as well. Foremost amongst these remains the theoretical and practical underpinnings offered for discussing combinations of expressive resources. Classical analysis in this framework operates by separating out various “semiotic modes”—traditionally illustrated by categories such as “text”, “image”, “sound” and so on—and then attempting to relate the resulting descriptions [9,10]. However, as Bucher [11,12] has argued at length, this approach is problematic precisely because it is often assumed that meanings of semiotic modes can be distinguished in isolation. As shown below, there are strong grounds for pursuing analysis in a more integrative fashion. Difficulties in relating distinct forms of expression can be related back to weaknesses in the definitions of “semiotic mode” found in previous socio-semiotic accounts [13]. These definitions remain largely informal and post hoc. This hinders description because, on the one hand, descriptions tend to conflate formal and functional properties and, on the other hand, functions can often only be determined when combinations of expressive resources are considered: it is simply not the case that “words” can always be analyzed simply as language and then combined with “other” modes. As we illustrate with our examples below, the functions served by “words” in diagrams, graphs, pictures, captions and so on can be quite different; similarly, the functions played by visual materials, such as diagrams, mathematical equations, graphs and so on, can only be ascertained in combination.
A further problematic consequence of much previous descriptive work in the socio-semiotic tradition has been the lack of anchoring in reception studies—which can, again, be related back to the more informal definitions of semiotic modes available because those definitions make it difficult to construct testable hypotheses that may be subjected to empirical investigation. The challenge here can also be seen in the strong claim made by Kress and colleagues that signs are always produced in a manner considered apt by their producers ([14], 101, 121). Although this is generally an aim, actual multimodal presentations are often sufficiently complex that design is itself a challenge and resulting solutions exhibit a range of compromises that are often far from apt. It is therefore necessary that such artifacts and performances be subjected to additional critique based on their actual effects on recipients. Empirical work of this kind is now also being undertaken within the socio-semiotic framework, particularly in the educational domain. Unsworth and Chan [15,16,17], for example, demonstrated that there is much to be gained by combining a more differentiating descriptive basis and empirical work. They did not, however, engage directly with potential cognitive mechanisms or more precise accounts of discourse.
Empirical work addressing details of multimodal educational presentations during online processing within cognitive psychology is also growing in sophistication and depth, including, for example, Craig and coworkers’ [18] investigation of the effects of varying properties of depicted agents, pictorial features and mutual redundancy; Wang and Antonenko’s [19] results concerning the positive effects on attentional guidance, satisfaction, recall and self-reported mental effort of including the instructor in visual presentations; and De Koning and Tabbers’s [20] study of improving the understanding of motion by using visualizations that activated recipients’ own bodily experiences. All of these, and several more that we refer to below, have begun to tease apart distinct facets of the combined multimodal experience and the relationship between presentational forms and uptake. Nevertheless, explicit relationships between presentational forms and their intended discourse function are rarely invoked. Similarly, experimental paradigms that have compared the bare presence or absence of particular “modalities” in composite designs do not necessarily inform us about how such combinations may or may not work when employed for appropriate or inappropriate discourse purposes. Until now, rather inconclusive, and sometimes conflicting, results have been obtained concerning the effectiveness of specific presentational strategies, for example including an instructor in the video or not [19], or the use of animated presentations for dynamic content [20]. We suggest that such divergences in results may be attributed to the lack of detail such analyses have available concerning the micro-organization of multimodal communication. This means that it is not known just what kind of cues are going to be beneficial, when they will be beneficial, and when not.
As hypotheses to be addressed in the current paper, therefore, we consider potential correlations between a rich discourse-motivated multimodal classification and recipient-based assessments of several selected videos. Broadly, we predict that more positive assessments will be made of videos that both prepare their audiences for their messages audiovisually and then use that preparation for presenting new information. The general value of “scaffolding” of this kind is hardly controversial, although just how this discourse function is to be accessed empirically is less clear. Studies since early psychological research concerning the effects of including visual overviews of a scene prior to text comprehension [21], through to work reporting the highly positive consequences of using well designed information graphics in scientific communication [22], all point in similar directions. Related results can also be observed in the context of studies on “media richness” [23], where appropriate combination of media/modalities has been claimed to reduce overall load, although the precise mechanisms by which such processes operate are still in need of considerable clarification.
Our aim in the present paper is consequently to combine a fine-grained characterization of multimodal communicative artifacts, analyzed in particular educational videos, with empirically measured responses to those artifacts. Within this approach, the role of discourse in structuring the inter-relationships across diverse presentational forms will prove central [24], placing previous treatments of “navigational” cues [25] in a new light. We see a detailed and theoretically well-founded exploration of the inter-relationships between intended discourse functions, multimodal presentation strategies, and their take-up by recipients as a prerequisite for effective analysis for all multimodal interactions and artifacts, gaining in importance as those interactions and artifacts increase in complexity. The organization of the paper is then as follows. We first present the general multimodal analytic methodology that we employ, illustrating the method’s application to our data. Second, we discuss specific discourse-oriented hypotheses arising from the resulting multimodal description that support focused empirical investigation. Third, we set out our empirical study in which we obtain several types of recipient-based measures to relate these to our multimodal discourse-based description, before concluding with discussion and suggestions of practical implications of the work and lines of future research.
3. Multimodal Methodology: A Descriptive Framework Derived from Multimodality Theory
The principal difficulty for effective analysis identified above is that the sheer diversity and complexity of interrelationships between multimodal presentation strategies within most current educational materials makes it difficult to derive testable empirical hypotheses that may be applied to broad ranges of distinct material types. Substantial experience in the description and corpus-based analysis of multimodally complex artifacts and performances is, however, now available from the field of multimodality studies. Here, the model set out in detail by Bateman [26,27] and Bateman, Wildfeuer and Hiippala [7] is particularly targeted at formally capturing the tight connection exhibited between expressive forms and the discourse functions of those forms regardless of presentation modality. In this section, we briefly introduce this model and analytic method with respect to our selected data items, showing its application to support empirical investigation.
3.1. The Analytic Method
The data items subjected to analysis in the present paper are educational videos specifically selected to represent the three basic video lecture presentation styles defined by Chorianopoulos and Giannakos [28]: (a) a “talking head and board” or “picture in picture” presentation with a visible instructor and accompanying presentation slides; (b) “slides and animation” voice-over presentation without the video feed of the instructor; and (c) a video capture of a “drawing board” with instructor voice-over (a presentation style made prominent by the Khan Academy). These videos were all selected to address the same broad topic, “statistical correlation”, to facilitate comparison across content, organization, and reception.
The analysis methodology we employed draws on our extensive experience with a broad range of quite varied media, stretching from technical documents to narrative film. A common problem faced by almost all researchers attempting to embark on the analysis of multimodally complex artifacts and performances is setting out clearly the particular kinds of material support that distinct media offer for meaning-making. These media “affordances” are important because they restrict the distinct kinds of presentational forms, or semiotic modes [27,29], that may be mobilized and it is semiotic modes that determine precisely what should subsequently be annotated during data analysis. In [7] (104–110), we identified several dimensions of description capturing essential material properties of media and which lead to different ranges of presentational forms, and consequently allow different kinds of communication strategies. These dimensions include: staticity/dynamicity (i.e., whether the material of the medium allows depictions unfolding in time), dimensionality (2D/3D), immersive-participatory/observational (i.e., whether the user of the medium is situated “within” the depiction or is external to that depiction), immutable/editable (i.e., whether the user of the medium can change depicted content), and permanent/transient (i.e., whether an inscribed depiction remains perceptually accessible or fades with time). A classification of this kind also helps separate out cases of media “embedding” more effectively, so that the individual contributions of the participating media are not conflated. This occurs in several of the videos we analyzed—for example, where a drawing board or a powerpoint presentation is displayed. The affordances of the embedded medium are different to those of the embedding medium (the video itself) and so support different sets of communication strategies.
Our analysis then proceeded in three steps. First, the essential material properties of the media employed were classified along the dimensions just given. Second, the distinct presentational forms, or semiotic modes, mobilized were identified so that the presentational forms occurring in the data can be appropriately annotated. Third, discourse hypotheses licensed by the semiotic modes at work were selected for specific correlational studies, thereby making it possible to triangulate the multimodal description against behavioral and other reception effects. A central claim of the approach is that this general method, proceeding from media affordances, via semiotic modes, to discourse functions, can apply uniformly across all kinds of multimodal communication, thereby offering a more robust foundation for transferring empirical results across distinct forms.
Concrete analysis for time-based media of the kind at issue here (i.e., dynamic, 2D, observational, immutable and partially transient) proceeds by defining “annotation tracks”, or “tiers”, grouped according to semiotic modes. Each semiotic mode defines a set of materially-realized forms that may be identified and consequently tracked across a video. These forms are used to define “controlled vocabularies” that provide labeling schemes that an annotator applies to selected temporal intervals in any video being annotated. In the case of the work described here, these annotation tiers were defined as coding schemes within the ELAN video analysis tool developed by the Max Planck Institute for Psycholinguistics in Nijmegen [30] (https://tla.mpi.nl/tools/tla-tools/elan/). The use of this and similar tools for corpus-based multimodal work is described in detail in Bateman [31]. As is usual within corpus-based discourse studies (e.g., [32]), it is then possible to explore correlations between the coded categories and further categories characterizing discourse distinctions. This is also the methodology pursued here, extended to operate multimodally.
Examples of the presentational forms identified by the semiotic modes at work in the videos considered here include various forms of written representations, such as written language, graphs, tables, and mathematical formulae, as well as “second-order” visual resources for navigation such as circles, underlining, arrows, boxes and other segmentation and connection techniques. In addition, second-order multimodal cohesive resources [33], such as shared colors across related elements, similar or reoccurring forms or “phrasing”, and so on, are also commonly deployed and so are annotated similarly. Finally, if a video display includes a visual display of someone speaking, then all the resources associated with (mediated) face-to-face interaction are potentially relevant. If, however, only a voice-over is used, then the resources associated with non-face-to-face spoken language become relevant. Our analyses of the videos can therefore be seen to provide a fine-grained differentiation of expressive resources that, on the one hand, teases apart the diverse semiotic statuses of the presentational forms used, while, on the other hand, nevertheless remaining capable of revealing similarities when appropriate. Crucially, from the perspective of multimodality research, this highly complex media landscape is already considered the “normal case” and so it is possible to apply a broad range of existing analytic models (e.g., [7]).
3.2. Applying the Methodology: Example Analyses
Data analysis for any video proceeds broadly in the manner just indicated, recording results as tracks within the multi-tier annotation system derived from the semiotic modes and their respective material distinctions. We illustrate the practical process of this annotation as follows, addressing the opening few minutes of the first video from our selected dataset. As described above, the video is first segmented according to the material distinctions recognized, placing segmentations within annotation tiers as required. The distinctions so characterized are considered as basic “behavioral units”, or presentational micro-events (PMEs). These are usually distinguishable bottom-up on the basis of the material distinctions they rely on and top-down on the basis of the ways of making meaningful forms given by the semiotic mode. Annotation is then always in terms of temporal extents ranging over specified subsegments of the analyzed video and is never frame-based; our use of single frames in the figures shown below are therefore solely for the purposes of illustration.
Conceptually, a PME is a perceptually-bounded unit of meaningful behavior that may be distributed across several coordinated sensory channels, but which need not necessarily be so distributed. For example, a cry of pain will be simultaneously expressed in both visual (gestural, body posture, and facial expression) and aural sensory channels, whereas a localization arrow or circle appearing (soundlessly) on a display as occurs in our videos will be purely visual. The granularity of a PME also depends on a recipient’s familiarity with that PME’s semiotic mode and the degree of automatization that holds. Thus, when watching someone writing text, the units will generally be larger and individual pen, pencil, chalk, etc. movements will no longer be differentiated; similarly, larger units hold for spoken language as well.
Turning concretely to our Video 1, the video begins visually with a blank (black) screen which immediately resolves itself to be a digital blackboard with a writing tool because a displayed simulated pen begins writing (white) text in the upper-left of the frame (Figure 1a). The forms marked out by the pen are almost immediately recognizable as letters and so a semiotic mode of written language becomes relevant; this then provides top-down indications of the movements and material traces that need to be considered relevant. Annotation thus includes tiers for written language and one segment is begun as soon as the pen leaves a visible trace. Annotation is always temporally-based in this way and segments characterize individual units as defined by the semiotic mode: that is, for written language, words, clauses, sentences, lines of text, etc. Additional features available for annotation include typographical information, such as the color of the written text, size and so on.
Information of this kind means that recipients can already be predicted to have an approximate media-classification of what is being shown and an accompanying set of expectations about the relevant semiotic modes to apply. That further semiotic modes will be required beyond written text quickly becomes plausible when the pen presents discrete words and numbers that do not combine grammatically and draws a horizontal line beneath the textual elements and a vertical line separating the word “Student” from the numbers. These latter two PMEs, clearly manifested materially as distinct “strokes”, require their own interpretation as they are not motivated by standard written text typography. Thus viewers (and equally analysts) are invited to deduce (or, more accurately, to abductively hypothesize) that the more diagrammatic semiotic mode of “tables” might play a role. Under this hypothesis, the PMEs of written text already identified are made intelligible as the headers of the table. This interplay of bottom-up cues and top-down hypotheses is fundamental to how semiotic modes are seen to operate, both theoretically and in terms of perception. Transcription of this kind is thus of necessity an interpretation on the part of the analyst, albeit one that leads directly to empirical questions for its validation due to the close linking maintained with the material forms present in the data. Automatic recognition and segmentation of particular aspects of rich data of this kind is consequently also an active area of research (cf., e.g., [34]).
The interpretative hypotheses annotated so far are then further strengthened by simultaneously occurring PMEs in the audio-track, where voice-over information accompanies the information visually-presented. Genre expectations that the sound-track and what is being shown will have something to do with one another are immediately confirmed by intermodal cohesive cross-references: for example, the voice-over talks of “four students” having taken a math exam and a statistic exam just as the pen writes “Students” (actually the German equivalent, as the original videos are all in German) followed by the digits 1, 2, 3 and 4 demarcated by whitespace. Following this, the voice-over states “this is the points that the students achieved in the maths exam; which we will label as ‘x”’, while the pen writes (in a different color) the word “Math points” and, separated by whitespace, an “x”—all written to the left of the vertical line drawn previously. Following completion of each written number, the pen moves to the appropriate place to begin writing the next number (Figure 1b).
The result of annotation is then a set of tiers each containing labeled segments of the analyzed videos characterizing the identified PMEs. The ELAN tool provides several forms of access to such tiers as well as export facilities for further statistical processing. An extract of the annotation corresponding to what has been discussed so far is illustrated in Figure 2, depicting two ELAN views on the annotated data. The tiers identified contain the verbally-expressed PMEs, the written language PMEs, graphical PMEs (lines, curves, points, etc.) and “cursor”/“pointer” PMEs, which are times when the cursor is used to direct attention to particular areas of the display. These segments are then used following the constraints given by their particular semiotic modes as evidence for the annotation of more abstract groupings. For example, the existence of a row of text PMEs in a spatial configuration with the two graphical PMEs of a vertical and a horizontal line motivates the adoption of a table as noted above. On this basis, a larger segment can be added into the annotation indicating the temporal interval over which that table is present. Similar steps are taken to identify the graph that later becomes visible in Figure 1e,f. The presence of these units at higher “levels” of annotation can be seen in the final column shown in the spreadsheet view of Figure 2, headed “Visible MacroTheme”; we return to the use of this information below.
Within the general account of multimodality adopted here, therefore, PMEs located within any objects of analysis are always seen as potential cues that license further discourse hypotheses. The specific discourse hypotheses possible are defined by the semiotic modes that apply. Consequently, semiotic modes “claim responsibility” for combinations of PMEs and, in so doing, offer semantic and discoursal interpretations that recipients must evaluate for their contributions to discourse coherence overall [24]. The potential ambiguity here between the activities of recipients and the activities of analysts is quite deliberate: an analysis is evaluated precisely by its correspondence with the interpretative processes that it claims to hold for recipients. That is, when the analytic methodology leads to statements that recipients “must evaluate” particular discourse hypotheses, we are simultaneously asserting that there should be measurable empirical evidence for this evaluation. Within multimodality research such evidence is pursued with a variety of techniques, ranging from questionnaires and corpus-based distributional methods, to physiological measures such as eye-tracking and brain studies (cf., [7], 139–168). For the purposes of the current paper, we focus below on correlations between particularly selected discourse statuses and a variety of reception measures obtained with respect to the videos analyzed.
The analysis of the voice-over during the first seconds of Video 1 consequently indicates that several discourse entities are introduced. These include the students, the fact that they have written two exams, and that those exams each had 50 points (cf. the verbal PMEs displayed in Figure 2). The visual elements on display by this stage are also no doubt sufficient (although this could naturally be subjected to empirical validation whenever necessary) for the video’s intended recipients to mobilize the semiotic mode of tables made up of columns and rows, rather than written language alone. The observed distribution of visual PMEs is thereby considered “explained” (both for the analyst and for the recipients) because the semiotic mode of tables can plausibly claim responsibility for the spatial organization present and assign that organization meaning, increasing overall discourse coherence [24,35].
Analysis and segmentation continue in the manner just described for the rest of Video 1 and for the other videos as well. In the particular case of Video 1, the voice-over and the pen go on to introduce the scores for the statistics exam. That this information will indeed be presented (and is consequently expected, or “predicted”) is motivated both verbally and visually. Verbally, the spoken language establishes right at the outset of the video the topic—or macro-theme as we describe it below ([36], 437–443)—that there will be four students and two exams. Visually, the interpretation of visual PMEs as a table with rows and columns predicts that the cells of that table will be filled. Both sources of evidence thus make it highly likely that information about the scores in the mathematics exam will be followed by scores for the statistics exam. Again, similar to the case for the mathematics scores, the label “y” is then assigned both verbally and visually to the statistic exam scores (Figure 1c). Finally, the distinction between the two sets of scores is explicitly indicated by color cohesion and contrast (mathematics scores in yellow and statistics scores in green), a communicative strategy that is maintained throughout the rest of the video. Such “textual” properties of the presented PMEs are also recorded in the full annotation.
Up until this point in the first video, therefore, the verbal and visual information has been maintained as highly congruent. This should not be considered in any way redundant, however, since it would be unlikely that recipients exposed only to the audio-track would be in a position to retrieve the individual scores. The table therefore functions as an externalized cognitive aid (e.g., [37]) affording not only renewed and repeated access but comparisons and groupings; Hurst [38] argued this to be the main motivation for the historical evolution of tables as a representational device at all. This is also, as we show below, our primary motivation for considering larger visual units of this kind as predictive macro-themes.
The spoken language in Video 1 then makes a shift to a new discourse segment by pausing and beginning a new intonation unit with “Now we want to investigate whether the scores in the maths exam stand in any kind of relation to the scores in the statistics exam”. The remaining screenshots in Figure 1 show the subsequent development where the drawn table is progressively related to a graphical representation supporting discussion of correlation, the main topic of the video as a whole. The fact that there are indeed distinct semiotic modes in play here is also brought out clearly by virtue of the different “semiotic work” that the various PMEs are performing. For example, the horizontal and vertical lines in the table have a very different function to the horizontal and vertical lines in the graph (Figure 1d,e). The numbers in the table also have a very different function to the numbers marking the tick marks along the graph’s axes (Figure 1e,f). This is one of the principal reasons that broad divisions between, for example, “text” and “image” are insufficient: it is in general beneficial to relate PMEs to their “semiotic function” within particular semiotic modes directly. Relations across these representations have nevertheless been clearly expressed in the video and remain explicitly represented in the visual display by means of the color coordination and the discourse history of their introduction, whereby PMEs are bound together both in terms of content and temporal synchronization in their presentation.
The annotation of all the videos we have selected and, indeed, of any video material, proceeds in precisely the same manner: first identifying PMEs across several tiers, and subsequently using these, media knowledge, and genre to postulate semiotic modes that are capable of grouping the PMEs into larger configurations. All of these are captured as labeled annotation segments of the kind illustrated in Figure 2. Particular semiotic modes of page design [39] and mathematical formalism [40] also play major roles in all three videos and are treated similarly to the construction of tables shown above. This has the consequence that is it is relatively straightforward to compare the effectiveness of very different kinds of artifacts, such as the three videos we analyze in this paper.
The extent of the variation in these videos is suggested by the illustrative frames from Videos 2 and 3 reproduced in Figure 3. As explained above, the videos were deliberately selected for their diverging designs despite their similar genres and content matters. Descriptions or analyses that remain too invested in surface details will necessarily find it difficult to contrast such different designs usefully with respect to reasons for their respective effectiveness. In our case, however, they nevertheless remain comparable precisely because their respective PMEs are used to motivate discourse level annotations, as we now explain and illustrate.
3.3. Leveraging off Discourse Descriptions
Fine-grained multitrack analysis of the kind described above makes available considerable detail for subsequent investigation. The audiovisually present PMEs, including those generated by movement, spatial layout and so on, are treated as the surface expressions of developing discourse structures within each video. Discourse as such is modeled within this framework as a dynamically growing discourse structure of the kind formalized by Asher and Lascarides [41] and extended for multimodal descriptions in Bateman and Wildfeuer [24]. This has the important corollary that discourse expectations are made explicit, which in turn supports the formulation of testable hypotheses for recipient studies.
Discourse units and their supporting structures are also considered parts of the overall transcription carried out for the data and so are recorded as integral components of the complete analysis as explained above. Several discourse statuses can be usefully distinguished. For current purposes, we characterize each PME as assuming one of two discourse functions reflecting whether the discourse entity being picked out is new to the discourse structure or is a reference back to an element that has already been introduced. This relatively simple division draws on the well-known linguistic pragmatic categories of “given” and “new” but are extended here to operate regardless of the semiotic mode within which the introduction or reference takes place. Since discourse entities are assumed to constitute the main anchoring points for providing new information, developing these coherently across a discourse is hypothesized below to play a major role for achieving effective reception.
Presenting new information can also be performed for two broad discourse purposes: either that new information may develop the content being communicated in the video directly or it may serve more as a “map”, or guide, for content that is to come. The former discourse function will be labeled here as development and can generally be recognized by virtue of its providing additional content information that elaborates or extends what has been introduced previously. The latter discourse function, labeled here as content scaffolding, is precisely the role taken up by what we introduce above as macro-theme. Macro-themes construct frameworks for interpretation for what is to follow and so are also hypothesized here to be likely indicators of variations in recipient effects.
Verbal macro-themes have been addressed in detail in several linguistic frameworks [36], where they are also known as topic paragraphs, questions-under-discussion, and so on. The generalized discourse function of scaffolding has, however, received relatively little attention in multimodal contexts. Although there are many ways in which scaffolding can be achieved multimodally, all must operate in essentially the same manner to serve their discourse function. In short, the visual information produced needs to be presented so that it can be interpreted as an externalized diagrammatic representation of the upcoming discourse structure. Potential “visual macro-themes” consequently include tables with empty cells, tree structures with nodes to be filled in, mathematical formulas whose parts need to be explained or whose variables have to be replaced with values, as well as straightforward lists of overview bullet points of the discussion to come. It is likely that the effectiveness of any such visual scaffolds will depend on the quality and type of information that is given; minimally the diagrammatic representation should predict topics that will be taken up. Our annotation tiers thus include macro-themes as potential labels for discourse level functions as shown in Figure 2.
Content (i.e., video segments developing content) can also be coded according to whether that content is presented with a supporting visual macro-theme co-present or absent. In the former case, both the visual macro-theme and the information being added to the theme’s scaffold are perceptually accessible; in the latter case, other visual material has replaced the visual macro-theme and so recipients must maintain the connection without perceptual support. These statuses can be extracted straightforwardly from the multi-tier annotations. Each macro-theme annotated is identified by a segment in a corresponding tier. Discourse entities that refer back to the macro-theme may then either be visually present within that segment or disjoint with that segment. In the former case, the macro-theme is co-present; in the latter, it is not. In our annotation, segments of the videos that are performing neither function are left unmarked.
In terms of traditional functional discourse annotations, scaffolding contributions are then PMEs that are “forward-looking”, whereas PMEs performing development work are “backward-looking” (cf. [42], 57–59). Since, in the former, scaffolding, case, direct externalized diagrammatic support for discourse interpretation is offered, below, we empirically investigate the hypothesis that this is one condition that may impact on a video’s effectiveness. When macro-themes are not co-present, interpretation must operate instead via the mental model formed by recipients of the depicted topic structure because the actual diagram is no longer perceptually accessible. We predict that the resulting increase in cognitive load will have reception effects. In both cases, moreover, visual macro-themes can either be presented “all at once”, for example when a presentation slide is shown (Video 3), or themselves be developed progressively, as when the table concerning students and their exam scores was gradually drawn on the presentation device shown in Video 1. We subject these variations to specific empirical investigation below in order to see whether reception effects correlating with distributions of scaffolding and presenting video segments can be isolated.
As an example of this final level of discourse annotation considered in this paper, above, the video segment from Video 1 in Figure 1 shows two visual macro-themes being developed: one layout unit containing the table of exam results, the other showing the graph. These annotations are present in the final column of the spreadsheet representation in Figure 2. The PMEs contributing to the identification of the first layout unit as a table—that is, the first row and the horizontal and vertical lines—are consequently annotated in an additional discourse function tier with the label “scaffolding”; the remaining PMEs before the transition to discussion of the graph are annotated additionally as “developing”. This offers a generalization across the individual kinds of segments labeled in the annotation, which we can subsequently draw on to derive overviews of the discourse development followed in each video analyzed. Similarly, the PMEs setting up the axes and labels for the lower graph visible in the figure receive the classification “scaffolding”, while the actual entry of points in the graph on the basis of the figures in the table are “developing”. The point of transition from scaffolding to developing is determined by considering when recipients have enough information to predict the kind of discourse activity that is to follow: for example, filling in the cells of a table, or placing points on a graph.
3.4. Deriving Empirical Research Hypotheses from Multimodal Descriptions
These annotated discourse functions will now form a central component in our exploratory investigation of our three selected videos below. Our segmentation of the three videos along the tiers we have motivated provides the basis for comparable descriptions. The time intervals over which individual visual macro-themes are perceptually present nevertheless vary according to the designs adopted within the individual videos. A clear case of the “co-present” vs. “non-present” distinction at work can, for example, be seen in Video 3 (cf. Figure 3), where the extent over which a visual macro-theme is visible generally falls together with the presentation of individual slides that the speaker is discussing at any point in the video. Audiences typically orient to what is shown on each slide as a visual scaffold for what is being said (e.g., [43]) and so treating slides as visual macro-themes is well motivated. For Video 2, where there are Prezi-like transitions across slides, the situation is similar: the visual extents of visual macro-themes are the video segments depicting individual frames before panning to the next. The situation for the superficially simpler Video 1 is then actually more complex, as there is only one visual presentation throughout the entire video: that is, the blackboard, which is gradually filled. Here the extent for visual macro-themes was taken following the criteria for layout unit identification set out in Bateman [39] for static documents extended to include their temporal development.
A layout unit is a spatially or spatiotemporally segmented region that is drawn, written or discussed verbally for a corresponding temporal segment of the video. This decision will need to be refined further because discussion and accompanying visual gestures are not necessarily restricted to lie within single layout units; we do not address this further for the current discussion, however. In addition, because in all three videos multiple input “channels” are being expanded simultaneously, it is quite possible for the predicted development of a visual macro-theme to continue verbally while at the same time a new visual macro-theme is being drawn visually: this occurs in Video 1. Further studies of this situation would be beneficial as this might also be expected to lead to higher processing costs. The annotation scheme as described so far already captures such complex configurations, however, because the PME-tiers adopted are independent of one another, in principle supporting closer examination of any combinations required.
The view on the functioning of multimodal messages suggested by this framework is in many respects a logical extension to Mayer’s contention that:
“…the cognitive theory of multimedia learning is based on the idea that learning is an active process in which the learner tries to make sense of the presented material. This sense-making effort is supported when corresponding words and pictures can be mentally integrated in the learner’s working memory”.([1], 87)
The issue is then what presentational strategies assist learners in pursuing the connections that they need to build to combine the information they are being given. This demands in turn a more detailed understanding on the part of producers and analysts of how multimodal messages operate: simply placing elements in proximity to one another is no guarantee that those elements will be combined or even that they should be.
Within multimedia learning research, explicitly placing markers of intended cross-modal connection is known as “signaling” [44]. This is generally assumed to be additional to the primary “content” being communicated and can be achieved, for example, by explicit deictic verbal reference to accompanying visual material, by shared color-coding conventions, and similar generally “cohesive” techniques. Within the approach adopted here and illustrated in this section, discourse guidance of this kind is considered inherent to the workings of semiotic modes. Semiotic mode descriptions consequently claim that signaling is a constant and necessary feature of all multimodal communication: it cannot be “turned off”. This has the important corollary that materials that might traditionally be assumed not to be using signaling are instead often best seen as employing inappropriate signaling, which can then only be compensated for by increased cognitive load. In our concluding discussions below, we return to the somewhat mixed results achieved to date with respect to signaling (Richter et al. [45] performed a comprehensive meta-analysis) in terms of the multimodal perspective we introduce here.
The position of the present multimodal approach is, therefore, that different modes offer explicit cues concerning how any material deployed is to be integrated in the service of the discourse goals being pursued and that these cues are an intrinsic component of discourse organization. This discourse-oriented starting point organizes both our analyses and the hypotheses derived for investigation. Specifically, we investigate empirically in the following section how the three selected videos manage their presentation and development of discourse entities via the presence or non-presence of audiovisual macro-themes. Our particular hypothesis for the present paper is that the effectiveness of the videos should correlate with the patterns of discourse presentations identified in our multimodal annotations. Precisely how viewers of the videos respond to and understand the information presented is thereby established as a well-defined empirical issue.
To conclude, discourse is being assumed to offer ways of managing cognitive loads more effectively, giving rise to interpretative hypotheses on the part of recipients that selectively drive attention allocation. Returning to the notion of “proximity” drawn on by Mayer above, we can see that “proximity” (spatial, temporal and induced by signaling cues) is often a resource employed by semiotic modes for constructing larger communicative units and so results supporting the value of proximity can be predicted to hold—but only in the case that proximity aligns with discourse organization. Proximity that is not functionally motivated by discourse concerns should lead to recipients pursuing unintended interpretative hypotheses and so detract from the effectiveness of any combined message. By these means, we seek to secure a tighter hold on the boundary conditions within which communicative strategies may be expected to yield beneficial results, as we now pursue in more detail by means of our empirical study.
4. The Empirical Study: Research Questions, Experimental Design, Results and Discussion
We organize this section as follows. First, we derive quantitative variables to describe discourse function distributions, namely, according to the videos’ macro-themes, scaffolding segments and developing segments. The statistical descriptions and analyses aim to differentiate the three videos according to these variables. Second, we report an empirical study of the reception of the three videos. In this recipient study, we measured learning outcome and learning experiences for a sample of students who each watched one of the videos. The purpose of the recipient study was to describe differences between the videos according to their subjective and objective learning effectiveness (i.e., if the different videos lead to learning differences at all). Third, we relate the discourse variables to the learning variables to explore how the descriptive differences of the videos’ discourse function distributions may account for differences on the learners’ side.
4.1. Discourse Function Distributions
The three videos were annotated according to the discourse functions as indicated above. The overall ratios of visual macro-theme durations and the total durations classified as scaffolding and developing could then be straightforwardly calculated on the basis of the durations of the annotated segments. The resulting counts are shown in Table 1. Whereas rather similar proportions of scaffolding to developing were obtained for Videos 1 and 3, the proportion for Video 2 was quite different, with a far higher proportional time spent scaffolding and a far lower proportional time spent developing.
The fast panning from frame to frame in Video 2 also gives rise to a very different score for the number of visual macro-themes. Although any such results need to be treated with considerable caution due to the small dataset, a two-way factorial ANOVA with main effects of video (Video 1 vs. Video 2 vs. Video 3) and discourse function (scaffolding vs. developing) and interaction of video and function for the individual annotated segments in the three videos showed highly significant differences in the durations of segments for both main effects and the interaction (all ). Post-hoc Tukey HSD comparisons showed no difference between durations for Video 1 and Video 3, but highly significant differences of both videos with Video 2 (). Although unsurprising overall given the extremely high number of visual macro-themes fragmenting Video 2, pairwise comparison showed the effect to lie primarily within the developing discourse function rather than within that of scaffolding. In further pairwise comparisons within videos, Video 3 showed a significant difference in durations across both discourse functions (adjusted ). Within the other videos, differences in segment durations across the two discourse functions were not found (Video 1: ; Video 2: ).
Video 2 is evidently constructed very differently in terms of its discourse organization, whereas Videos 1 and 3 exhibit broadly comparable proportional allocations of times to scaffolding the presentation and developing on that scaffold. However, we can also use the discourse perspective to focus more closely on the internal distinctive properties of the videos. For example, in addition to comparisons of overall counts of the finished video “product”, the multimodal discourse analysis favors an ongoing, dynamic process perspective. Examining the distributions of scaffolding and development within Video 1 and Video 3 across time shows very different deployments of the discourse functions at work over the course of the presentations. These “profiles” are contrasted graphically in Figure 4.
Video 3 spends considerable time at the outset providing scaffolding with virtually no development: this part of the video states what has been done, where the video fits within the syllabus and what is going to be addressed in the current video. Subsequently, scaffolding contributions relate to the material presented on the slides, which may be hypothesized as a genre-marker for presentations made with respect to pre-prepared materials. The strategy followed in Video 1 is very different. In this case, there is a more equal presentation of scaffolding at the beginning, which is then followed by scaffolding trailing off to very low levels for the latter segments of the video. This may again be a genre-marker for presentations where the content is not pre-prepared but has to be written or drawn in real-time as the presentation proceeds; further studies are clearly necessary.
Given these differences in their multimodal design it is then reasonable to ask if the videos are also differently effective concerning their instructional purpose. That is, how well do recipients learn with the videos and how do recipients rate their experience of that learning? To answer these questions, we conducted the recipient study described in the following subsection.
4.2. The Recipient Study
4.2.1. Method
Participants and Design. Twenty-seven students (age: M = 24.62; SD = 3.75; 25 female) of the University of Bremen, Germany, participated in the study. The experiment followed a one-factorial design applying the educational videos described in the former sections as independent variable. That is, 9 participants watched Video 1 (the screencast), 10 participants watched Video 2 (the Prezi), and 8 participants watched Video 3 (the so-called vodcast).
Materials and Apparatus. The learning material consisted of the three instructional videos on covariance and correlation described in the previous sections and as motivated in Section 3 (Video 1: https://www.youtube.com/watch?v=X7eeyRX35wM; Video 2: https://www.youtube.com/watch?v=IiR84ikYBTY; Video 3: https://www.youtube.com/watch?v=j707PWQo2WU. Last accessed: 20 April 2018.). The videos were displayed on 21” computer monitors using standard Windows PCs. The experiment took place in the department’s computer lab. The videos had been downloaded from YouTube and were presented with a standard media player. Each workplace was equipped with a headset.
Measures. The paper-based test materials consisted of a knowledge test administered as pre- and post-measures and a questionnaire on subjective experiences during learning with the videos. Both, the knowledge test and the learning experiences questionnaire were developed to fit the affordances of the experimental study. The knowledge test aimed to measure participants’ prior knowledge on covariance and correlation. It consisted of 12 items scoring 1 credit each. One item was multiple-choice with three alternatives, all other items were open questions each addressing a single characteristic of the statistical measures of covariance and correlation (e.g., “What does a positive covariance mean?” or “What is the range of values a correlation can take?”). The knowledge test proved to be a sufficiently reliable measure to assess prior knowledge as well as learning outcome as indicated by a Cronbach’s of 0.85 (prior knowledge) and 0.74 (learning outcome), respectively. Prior knowledge and learning outcomes were calculated by summing up the scores of each item. That is, both knowledge measures are treated as continuous parameter values of the participants’ (pre- and post-) knowledge.
The learning experience was addressed with a questionnaire containing seven items that had to be rated on four-point Likert scales. The participants were asked to give ratings from 1 to 4 for each question. Both ends of the scale were verbally anchored. The questions were: (1) Did you like the video? (very much ... not at all); (2) How pleasant was the video? (very much ... not at all); (3) Was the issue stated clearly? (very much ... not at all); (4) Was the pace of presentation appropriate? (very much ... not at all); (5) How is your current mood? (very good ... very bad); (6) How much effort was required for you to answer the knowledge test? (very much ... not at all); (7) How much did you learn from the video? (very much ... nothing at all). The questionnaire also asked if participants employ educational videos for learning and, if yes, for which purposes (preparation for exams, subject matter wrap-up, comprehension problems, other: ...). Finally, the questionnaire gathered socio-demographic data (gender, age, course of studies, and semester). The participants’ estimates on the Likert scales were treated as being quasi-metric (i.e., continuous parameter values) as common in the social sciences.
Procedure. Participants were tested in sessions of 1–4 persons. Participants were randomly assigned to one of the three experimental conditions, i.e., the different videos. Each participant was seated in front of a computer. Before showing the respective video, participants were handed the paper-and-pencil knowledge pre-test. Participants worked on the test for a maximum of 10 min. After the test was collected, participants were asked to put on the headsets and watch an educational video on the subject of covariance and correlation. They were instructed to acquire as much information as possible from the educational video to answer questions on the subject afterwards. After studying the materials, participants were given the knowledge post-test, again for 10 min. Finally, they filled in the questionnaire. An experimental session took about 35–40 min.
4.2.2. Results
One participant (in Condition 1) had to be excluded from the analyses of subjective learning experiences due to an incomplete questionnaire. Hence, the knowledge measures are analyzed with the whole sample (), while the subjective ratings are analyzed with complete datasets.
Before running the analyses, we checked all measures for normal distribution. Although Q-Q-plots did not indicate deviations from normality, a Kolmogorov–Smirnov-Test allowed us to retain the normal distribution assumption only for the knowledge measures (). Assuming normality for the scales of the learning experience questionnaire is not justified by this test (all ). Note, however, that for small sample sizes not only the normal distribution assumption but also the reliability of its tests can be considered problematic and that the intended parametric analyses (see below) can be considered robust against violations of the normal distribution assumption. Nevertheless, we conducted non-parametric tests (where applicable and necessary) as well as parametric tests in order to check if the conclusions based on the parametric analyses were justified or if non-parametric analyses would reveal a different picture of the data.
Learning outcome. Means and standard deviations of credits in the pre- and post-test knowledge measures as well as learning gains (i.e., the differences between pre- and post-test) for all three video conditions are reported in Table 2. To check if the pre-test mean knowledge scores were comparable, we first conducted a one-factorial analysis of variance (ANOVA) with the three video conditions as between-subjects-factor and the participants’ pre-test-scores as dependent variable. This analysis revealed no significant differences between the participants’ prior knowledge in each video condition, . To check if the participants had different knowledge gains depending on which video they had seen we compared the mean pre- and post-knowledge test scores by way of an ANOVA with the three videos as between-subjects-factor and the participants’ pre- and post-test scores as repeated measurement factor.
This analysis revealed a main effect of the repeated measure, (, p < 0.001, partial, ), indicating a significant mean learning gain for the whole sample. A closer look at the individual scores revealed that 21 out of 27 participants indeed scored higher in the post- compared to the pretest. Furthermore, the interaction of the learning gains (repeated measurement factor) with video condition also reached statistical significance, . That is, participants’ learning gains significantly varied between the different videos. Post-hoc least-square differences (LSD) tests revealed the difference in learning gains between Video 2 and Video 3 to be significant () and the difference between Video 1 and Video 2 to only marginally fail significance (). That is, participants watching Video 3 (and Video 1) learned (marginally) more than participants watching Video 2. Since the knowledge measures indicated no deviation from normality it is not necessary to check the validity of these results by way of non-parametric tests.
Learning experience. To contrast objective learning outcome measures with subjective learning experiences, we also analyzed if the participants reported different experiences depending on which video they had seen before. To get an overall picture first, we entered all seven rating scales about liking, design, comprehensibility, pace, mood, effort, and estimated learning gain as dependent measures into a multivariate analysis of variance (MANOVA) with the three videos as between-subjects factor. This analysis revealed the ratings to be significantly different for the three videos, . That is, participants’ learning experiences depend on the video. However, the MANOVA does not indicate which rating scales contribute to this overall effect. Therefore, we conducted ANOVAs for each scale as post hoc tests. These ANOVAs indicate the overall effect to be due to differences concerning the estimated learning gain, , the appropriateness of pace, , and the learners’ mood after watching the respective video, .
For the three significantly different participants’ estimates we conducted further post hoc LSD tests (based on ) which identified the following particular differences between the videos as significant. For the estimated learning gains, the test revealed the following ordering: Video 3 > Video 1 > Video 2. That is, in accordance with the objective learning outcome, participants who watched Video 3 estimated their learning gains significantly higher than participants watching Video 2. Moreover, their estimates were also significantly higher than that of participants watching Video 1. Again, in accordance with the marginal difference in objective learning outcome, participants who watched Video 1 estimated their learning gains to be significantly higher than participants learning with Video 2. Concerning the pace of presentation, participants rated Video 2 to be less appropriate in pace than Videos 1 and 3. Since Video 2 was the shortest of the three videos, it appears to be perceived as too fast compared to the other two. This, again, is in accordance with the lower effectiveness of Video 2 compared to Videos 3 and 1 in terms of learning gains. Finally, concerning the mood, both post hoc LSD tests revealed that the mood of participants who watched Video 3 was better than the mood of participants watching Video 2. The mean values of all ratings are displayed in Figure 5.
Since the assumption of normal distribution for the participants’ estimates might be violated, we checked the validity of the results based on parametric tests by conducting non-parametric analyses as well. Kruskal–Wallis tests for the seven rating scales about liking, design, comprehensibility, pace, mood, effort, and estimated learning gain revealed only two of them to be significantly different between the three video conditions—learning gain: ; and appropriateness of pace: . The learners’ mood, which was identified as significant before, failed statistical significance, although only marginally: . We also conducted non-parametric pairwise post hoc comparisons applying Mann–Whitney-U-tests. Based on , these comparisons reveal exactly the same differences to be significant as the LSD tests. That is, non-parametric analyses yield qualitatively comparable results and, hence, also validate the parametric analyses.
4.3. Correlational Analyses
To pursue further correspondences between multimodal design and its reception, we calculated pairwise correlation coefficients between discourse function variables and the significant recipient variables. We calculated (parametric) Pearson correlation coefficients as well as (non-parametric) Spearman correlation coefficients. Again, both calculations lead to comparable results concerning the significance of correlations. However, the Pearson coefficients provide a more detailed picture concerning the relative magnitude of the correspondences. Therefore, Table 3 reports the resulting 45 Pearson coefficients.
Concerning the multimodal design the lower right part (or the final five columns) of the table complements the analyses of the first part of this section. As these results illustrate, most of the discourse function variables are strongly intercorrelated. For the three duration variables, that is the duration of macro-themes (MT ms, which is almost identical to the total duration of the respective video), the duration of scaffolding segments (Sc ms) and the duration of developing segments (Dv ms), the correlations are obvious since scaffolding and developing are nested within macro-themes. Less obvious, however, are the strong correlations of MT ms with the relative scaffolding (Sc %) and developing (Dv %) segments. These correlations indicate that the durations of the videos are confounded with the relative extent to which each video makes use of the scaffolding and developing function. That is, Video 2 (the Prezi) is not only shorter but spends relatively more time on scaffolding and less time on developing (as was also evident in the analyses in Section 4.1). This reverse relation is also expressed in the lack of significant correlations between Sc ms with MT N and Sc %, respectively. The negative correlation between Sc % and Dv % is again rather obvious as it illustrates the trade-off between these variables within a given time limit. That is, the more time is spent for scaffolding, the less time is left for developing.
Examining the correlation between reception effects in isolation (upper left part or first three rows of Table 3) reveals that there is a considerable overlap between subjective and objective learning gains. That is, students who showed higher learning gains (olg) also perceived their learning as more successful (slg). Furthermore, the differences in the students’ mood significantly correlate with the perceived appropriateness of pace of presentation. That is, the more appropriate the pace of presentation is perceived the better the students’ mood. Keeping in mind that correlations do not indicate the underlying causality, it nevertheless appears reasonable to assume that inappropriate pace of instruction has a detrimental effect on the learners’ mood.
The main purpose of the correlational analyses, however, was to reveal if and how the discourse function variables account for differences in the students’ learning quality. These values are reported in the 24 cells of the lower left part of Table 3. Twenty-one of these 24 pairwise comparisons indicate significant correlations. That is, almost all of the discourse functions realized in the videos contribute to learning quality. The highest correlations for all learner variables are found with MT ms, Dv ms, and Dv % which are actually indistinguishable. Focusing on MT ms alone might lead one to conclude that the mere duration of the videos is already predictive for learning. However, this prediction is apparently qualified not only by the overall (Dv ms) but also by the relative (Dv %) number of developing segments. On the other hand, the continuously negative correlations of Sc % with learning suggests that a high relative amount of scaffolding segments indicates problems with the instructional design of a video. Again, these results need to be treated with considerable caution due to the small sample of videos and the intercorrelations of the discourse function variables in this sample. The hypotheses that can be derived from these preliminary results need to be investigated in further detail with more videos and especially with variations of scaffolding and developing segments while keeping MT ms fairly constant. Nevertheless, the specific multimodal design features of the videos can already be discussed with reference to the present results. This is done in the following section.
5. Evaluation of Results
The functional measures derived from the theory of multimodal discourse appear to align with the results from the recipient-based studies. The general ordering of videos along most of the dimensions tested supports the hypothesis that a balance between scaffolding what will be discussed and developing content on the basis of that scaffold will correlate with favorable impressions. A functional characterization of the discourse also suggests how it may be possible to “reach inside” the moment-by-moment design of videos to identify stages that are working particularly well or badly. The use of classification categories derived from the discourse processes assumed also has allowed measures to be derived that may apply across very different kinds of videos and across equally different modalities. Here, it is clear that a far broader sample of data will need to be considered in order to probe the consequences of discourse distinctions more closely.
The fine-grained descriptions of the videos in terms of their deployment of multimodal discourse strategies already allows more specific critiques or evaluations of the design decisions made, however, Video 2, for example, is made in the style of a Prezi presentation but uses no “frame”-internal dynamics for direction attention in synchrony with the information given verbally. Guidance is sometimes attempted by narrowing the focus to the information that is currently being described verbally so that that information occupies the entire frame. This has as a consequence, however, that a new visual macro-theme is set up with no externalized support for interpretation. This is then reflected in the very high number of visual macro-themes reported in Table 1. As the verbal description moves on, accompanying fast “pans” from one presentation frame to the next make visual continuity impossible. Thus, since each frame is visually separate from the others, there are no visually accessible co-present connections and all discourse interpretation by the viewer must proceed mentally on the basis of the verbal description and memory of any visual presentations given previously. This also precludes fine-grained attention guidance and, when present, such guidance not only establishes no visual coherence across frames but also simultaneously reduces the time available to viewers for constructing any coherence relations necessary. This is not a restriction imposed by Prezi tools, since these are fully capable of supporting synchronized fine-grained visual guidance dynamically within single frames, but Video 2 does not use such techniques.
Again, considered multimodally a further recurrent problem in the design of the video is thrown into relief. The voice-over text is often only loosely connected to what is shown in the individual presentation visual frames: frequently additional information is given verbally that is not visually presented and, equally, there is information presented visually that is not mentioned verbally. This is particularly evident in the annotation since it forces the two discourse functions of scaffolding and developing to diverge across the verbal and the visual information. This is shown in the differences observed between overall visual macro-theme times and the proportions spent scaffolding and developing: substantial portions of the verbal discourse do neither, instead bringing in further information that is not predicted from visual macro-themes and which does not function to scaffold subsequent discussion. This can also be expected to increase cognitive processing load considerably. What is more, visual material present in frames that is unused on initial presentation (i.e., is present in the visual macro-theme but not developed) is sometimes returned to employing the standard Prezi pan-and-zoom in such a way that the original visual context is not accessible. This leaves little opportunity for viewers to make use of any scaffolding that may have been present in the original presentation frame.
An example of this is shown in Figure 6. Although also present in Frame 1, the formula shown in Frame 3 is not mentioned or described in the verbal commentary accompanying Frame 1. Frame 2 is also an elaboration of the second bullet point on Frame 1 concerning measures (“Maß”). The discourse organization as a whole thus shows a divergence between the visually presented information and the verbal expansion of the contents given initially in the first frame. Visually what is shown in Frame 1 could in principle have been set up as a verbovisual scaffold for what follows; this is not done, however. The accompanying verbal text instead simply develops the content further and does not employ metacommentary to document the (probably intended) scaffolding function of Frame 1. The same strategy also occurred with the formula shown in the frame from Video 2 used as an illustration in Figure 3. In general, there is no verbalization of the frame transitions, leaving their motivation and relation to the unfolding discourse structure unspecified.
Video 3 is also clearly different from the other two in its use of an on-screen presenter. Here, it is telling that, as Wang and Antonenko [19] noted:
“despite decades of research on multimedia learning and learning with video specifically, we still know very little about the efficacy of instructor presence in instructional videos …”([19], 82)
In their own study, using eye-tracking methods, they report little difference in performance measures, although the presence of an instructor on-screen did generally improve subjective impressions of perceived learning effect and satisfaction for all tasks and a significant improvement in estimated mental effort with instructor presence for “difficult” topics. This result is itself interesting in regard to the very different eye-fixation behavior that is well known to occur when instructors are present: even relatively small faces on-screen will receive significant fixations. What then is generally still under-investigated is just what the instructors are doing with respect to the overall presentation: on-screen presenters in real instructional videos are rarely simply talking heads; instead they explicitly direct attention, either verbally or by combinations of verbal, visual, and gestural signals, to the unfolding content presented in other modalities. In our analysis, we attempted to gain access to these differential functions via the scaffolding/development annotations, where we see substantial differences in presentational strategies that have in themselves little to do with including a presenter on-screen.
The methods by which an instructor can assist in discourse interpretation are evidently dependent on the medium. In Video 3, for example, there is explicit attention guidance throughout the entire video via scaffolding and not with explicit bodily gestures, such as pointing, towards the visual presentation. Instead, there is the regular use of similar or identical words verbally and visually on the slides, generally offering additional scaffolding of these verbally in an order congruent with their reading-position on the slides, progressive reveals of bullet points synchronized with the spoken presentation, and graphs drawn in real-time with an “electronic” pen so that they appear directly on the visual presentation. These are then developed both verbally and visually with circles, underlinings, arrows, and hand-written words—viewers can see that the instructor is writing and drawing while speaking, although they cannot see the pen or the instructor’s hands while he is manipulating the pen. The only other gestural information provided are co-speech gestures of the kind familiar from studies of face-to-face interaction in general [46]. These are important for following the verbal discourse and its phrasing and emphases, but did not relate directly to the visuals.
In several cases, we can note that the information on the slides would not have been intelligible without verbal accompaniment. For example, after introducing the topic for the session as the measurement of correlations, a slide is presented asking the question “is there a connection?” but without visually specifying what that connection might be between. This information is provided only verbally in the accompanying spoken text (1:15), where the topic is filled out with the introduction of variables which are going to be related. In these segments of the video, therefore, the visual information is a visual summary of what is being said and it is the spoken language that develops the content; here, the visuals can be argued to be informationally redundant but are by no means redundant with respect to their scaffolding role.
The visuals take on more of the communicative load in their own right subsequently when a first content topic discusses what is to be done when variables belonging to different data types (nominal, ordinal, etc.) are to be correlated. At this point, the instructor states the problem while the slide has already visually scaffolded the task with a table showing the four distinct types of data possible (four rows) for two variables (two columns) as well as a further column headed “correlation measure” with empty cells. This gives the visual scaffold that is used for the subsequent development of the topic. The instructor supports this connection throughout by accompanying his verbal descriptions with circles selecting cells in the table, with arrows connecting rows, and answers to the question of which correlation measures to use with methods identified both verbally in handwritten text. This is then a highly appropriate use of the affordances of the visual channel as the information presented relies on parallelisms and contrasts of various kinds: not only is the information well scaffolded, but the ongoing multimodal discourse explicitly preserves connections between scaffold and development. The presence of the visual macro-theme can be expected to substantially transform tasks of visual search; further studies, particularly of dynamic attention allocation during the presentation, would be highly relevant here.
Finally, Video 1 has similar proportional values for scaffolding and development to Video 3 but introduces far fewer informational elements (also indicated indirectly by the lowest number of visual macro-themes). This may have led to more favorable rating for the video in terms of liking, design, and effort, but would certainly have limited the perceived learning gain. Explicit scaffolding of precisely what is going to be learned can be expected to influence evaluations along this dimension positively, and this is carried out in most detail by Video 3.
6. Implications for Practice
Educational videos are employed in a variety of digital learning scenarios such as MOOCs [47,48] and flipped classrooms (e.g., [49]). The results of the present study may hold some potential to contribute to the practice of education videos in these as well as other scenarios. The three videos were chosen to represent basic presentation styles of video lectures (cf. [28]). Regarding the recipient study in isolation, a conclusion that could be drawn would then be to recommend a “picture in picture” or “lecture capture” style for education videos since Video 3 reached the highest objective and subjective learning gains and led to more positive learning experiences. This result is indeed in accordance with other empirical evidence for a positive influence of instructor presence in such videos on attention, emotion, cognitive load, and learning performance (e.g., [19,50]).
However, in the context of the present study, this practical implication is not necessarily valid. The dimensions employed in the multimodal description of the videos (i.e., macro-themes, scaffolding segments, and developing segments) are theoretically independent of surface presentation styles. As was discussed in the previous section, the high number of macro-themes in Video 2 was not a feature or necessity of Prezi. That is, Video 2 is not a bad education video because of its “slides and animation style”. The results of the correlational analyses rather suggest that in educational videos the number of macro-themes and scaffolding segments should be balanced with the content to be developed. The discourse construction strategy profiles (cf. Figure 4) further suggest that scaffolding segments should be placed at appropriate steps in the explanation. From this perspective, the positive effect of instructor presence in our study may well be an artifact of the underlying multimodal structure of the video. Which multimodal structures are appropriate to support learning with educational videos needs to be explored in future studies by either analyzing a broader sample of videos with comparable content in a similar fashion as the present study or by systematically manipulating structural elements such as number and placement of scaffolding segments in experimental studies. Up to now we can only hypothesize that the discourse construction strategy profile of Video 3 represents an example for good video teaching practice.
What also remains to be explored is how closely (surface) presentation styles are practically connected to (deeper level) design features. While there is no theoretical necessity to apply more macro-themes or scaffolding segments in a “slides and animation” video, there might be some “ecological” overlap between these levels. That is, the number of macro-themes may actually be triggered by surface style decisions. To remain with the Prezi example, preparing a “slides and animation” video might seduce a designer to create more or more complex slides and, hence, more macro-themes than when preparing a “picture in picture” presentation. As an empirical as well as practical consequence, this hypothesis can be tested by analyzing a larger sample of the respective video styles with the multimodal account delivered in the present paper.
To date, there is surprisingly little empirical work on the instructional design of education videos in particular (cf. [51]). Recommendations for the design of such videos usually refer to more general multimedia design principles based on Mayer’s CTML [1]. It is arguable whether the transfer of general multimedia principles to the particular design of education videos is straightforward. In the context of the present study, however, the mainly dichotomous principles appear to be insufficient for describing existing videos in their complexity and, hence, providing explanations for learning differences. In fact, all three videos follow some of the principles such as combining visualizations with spoken rather than written text, using signaling techniques (but to a different extent and with different quality), giving (worked) examples, etc. That is, two videos may realize the same quantity of design recommendations and still differ greatly in their learning effectiveness. In sum, the more detailed multimodal analysis of education videos proposed in this paper together with the further research issues raised above may provide more appropriate tools for estimating just how well (or not) particular videos will function.
7. Conclusions and Discussion: Studying Complex Multimodal Communicative Artifacts Empirically
This paper has argued that advances in the study of the communicative effectiveness of complex multimodal artifacts demand a correspondingly well articulated account of the nature and operative mechanisms of semiotic modes. Only with such accounts can sufficiently fine-grained descriptions and analyses of the artifacts under study be provided to drive and evaluate empirical investigation. As an illustration of how such a methodology can be pursued and applied, we have shown how one complex form of multimodal communication—online educational videos—can be analyzed along dimensions of multimodal discourse organization that then correspond with measures of recipient response and evaluation. Much needs to be done to take this research further. Broadening the corpus of functionally annotated stimuli to include a representative range of communicative strategies must clearly be given a high priority. Extending the methods of analysis to make regular use of tools that investigate the fine-grained uptake and processing of materials, such as eye-tracking, must also be an important aim, precisely because the relevant interaction of materials in complex multimodal communication is highly dynamic and cannot be revealed by coarse categories such as presence or absence of particular kinds of materials averaged over an entire artifact. With the kind of multimodal description tools introduced here, it should be possible to engage in empirical research with far tighter functionally-motivated experimental hypotheses than have been possible hitherto.
As one potential example, it is well known that placing the face of an instructor on-screen will claim significant attention. This has been seen as potentially beneficial for social-emotional engagement, while also potentially disadvantageous because the limited capacity of the visual processing channel is stretched. Both positions are inadequate. Placing an interacting agent on-screen within the context of a multimodal presentation will be assumed by recipients to be deliberate, and so the media and genres with which recipients are familiar (e.g., learning situations) will correspondingly drive the discourse hypothesis that the presence of the agent is relevant: that is, recipients expect useful information to be coming from the agent and so will devote attention. That information can by no means be limited to social-emotional support: in real interaction, shared gaze, phrasing, descriptions of visual material, and intonational prominence are inseparable facets of interacting with any other material being presented. Such structuring can be expected to be highly beneficial when appropriately deployed, and equally disruptive when inappropriately employed because recipients will first make an assumption of relevance that is then found to be false, which again predicts increased attention and more disruption.
Similarly, in a detailed meta-study, Eitel and Scheiter [52] reported on a broad range of work that has focused on the question as to whether presenting text before pictures or pictures before texts leads to better comprehension: as in many of these areas and as observed above, previous results concerning a preferential ordering are mixed. Eitel and Scheiter explained this diversity by suggesting that it is not the “modality” that makes the difference but the degree to which the information that is presented first prepares recipients for the information that follows: that is, precisely the extent to which the scaffolding function is supported. They suggested that further studies are needed that manipulate the complexity of the materials presented: to be effective, the material that is presented first should be less complex than that that follows. Complexity is considered in terms of the joint effect of the number of items that need to be held in working memory concurrently and the number of inferences that need to be drawn. In our analysis above, we focused more on the scaffolding function itself as an inherent property of effective discourse and so could address scaffolding that occurs by virtue of co-present, external diagrammatic support in the visual macro-themes annotated.
Finally, as a further example, Craig et al. [18] reported no significant gains with an artificial agent with gesture, but how accurately the gestures reflected the precise visual elements needing attention was unclear. They also reported that briefly highlighting visual elements in a more complex visual presentation by changing color was as effective as full animation, which is again to be expected in the account set out here since temporally appropriate highlighting is a particularly strong discourse signal. In fact, with inappropriate, over-complex, or insufficiently focused full animation, one would expect less effective presentation: any movement present is itself a discourse signal and if not selected for current discourse purposes will increase the cognitive load necessary even to ascertain the intended message. Again, forming discourse hypotheses as a guide for attention allocation is not optional: as Schüler [53] showed, similar problems occur when the visual and textual information conflict: recipients nevertheless attempt integration and then fail because they still expect discourse coherence and adopt the interpretative hypothesis that coherence will be found. The presentations adopted in such materials must therefore always be appropriately designed.
The particular study we have reported on here should therefore be seen as just one potential operationalization of a far broader set of hypotheses that relate reception variables to discourse organization. In general, we predict that the intelligibility of any audiovisual presentation will correlate with the degree to which coordination of expectations is successfully managed in the service of assisting discourse construction. Since this involves many possible dimensions of variation and many kinds of expressive resources, early stages of research of the kind shown here are essential for identifying the most promising lines of future inquiry. On the one hand, for example, verbal, dynamic highlighting and introduction of visual elements can be expected to reduce visual search, thereby easing cognitive load even for complex presentations ([45], 24); on the other hand, however, complex visual presentations still stand as externalized frameworks for supporting interpretation of incoming verbal information—again potentially reducing cognitive load. The more an audiovisual presentation fails to guide attention in this way, the less well that presentation would be predicted to score on a range of reception variables. Establishing expectations concerning presentation strategies may be expected to play a particularly central role for avoiding sensory channel overload: multiple information sources may, for example, be presented visually but if the bulk of these are unfolding following expectation, recipients can reduce their attentional load to monitoring that expectations are continuing to be met. Effects due to appropriate expectation guidance will be further modulated by variables well known from multimedia learning research, such as familiarity with the material presented and so on, and so these must also be controlled for.
More generally, this means that, whenever sources of information are tightly integrated and offer mutual support for further processing, assumptions that spoken language will take capacity on the aural perceptual channel while visual information, including not only visual presentations of instructors but also any text, diagrams, or pictures present, will take capacity on the visual perceptual channel will not suffice as predictors of behavioral measures and learning outcomes. Unequivocal results can only be expected from such assumptions when the communicative situation pushes cognitive and perceptual loads to, or beyond, their limits. It is suggested here, however, that most actual situations of multimodal communication that occur (and which are investigated) are likely to lie within those boundaries precisely because multimodal communication has evolved mechanisms both to work within and to manage those limits effectively. It is then natural that weak models of how multimodal integration operates will as a consequence leave much of the observable variation in any data gathered unaccounted for. The position set out here concerning the enabling role of discourse interpretation is, on the one hand, compatible with, and largely predicts, results concerning combinations of individual aspects of presentations found in the literature, while on the other hand also suggesting how the dynamic allocation of attention during dynamic presentations might be probed more effectively.
To conclude, we return to our opening remarks above, where we considered it unlikely that the increasingly broad and diverse range of media possibilities now becoming available for designing educational materials, ranging from recordings of traditional lectures to highly interactive and immersive forms, can receive effective empirical study without first achieving a strong framework for communication of the kind presented here, in which empirical investigation and theories of multimodal discourse are tightly interwoven. It is consequently similarly important that design principles and our understanding of how such forms operate both rest on shared theoretical and practical frameworks of analysis. Only then will it be possible to extend and generalize results across medial forms while still knowing just when this is appropriate (or inappropriate) and why. This is then the broadest aim of the direction of research set out in the current paper. The multimodal account offers reusable methods that apply to any communicative medium while clarifying just what individual media capabilities bring to the table. Further research must now follow refining both the theoretical tools themselves and the precision of the hypotheses made concerning the effectiveness of the strategies employed. This will allow us to move beyond characterizing which medial alternatives have been adopted and to consider as well just what is being done with those media communicatively.
Author Contributions
Both authors contributed equally to all sections, with the exception of the experimental design and statistical reports in Section 4.2 and Section 4.3, which were produced by F.S.-B.
Funding
This research received no external funding.
Acknowledgments
The authors thank Kathleen Gerst for contributions to the design and execution of the recipient study.
Conflicts of Interest
The authors declare no conflict of interest.
References
- Mayer, R.E. Multimedia Learning; Cambridge University Press: Cambridge, UK, 2001. [Google Scholar]
- Schnotz, W. An Integrated Model of Text and Picture Comprehension. In The Cambridge Handbook of Multimedia Learning, 2nd ed.; Mayer, R.E., Ed.; Cambridge University Press: Cambridge, UK, 2009; pp. 49–69. [Google Scholar]
- Paivio, A. Mental Representations: A Dual Coding Approach; Oxford University Press: London, UK; New York, NY, USA, 1986. [Google Scholar]
- Landy, D.; Allen, C.; Zednik, C. A Perceptual Account of Symbolic Reasoning. Front. Psychol. 2014, 5. [Google Scholar] [CrossRef] [PubMed]
- Mayer, R.E. Cognitive Theory of Multimedia Learning. In The Cambridge Handbook of Multimedia Learning, 2nd ed.; Mayer, R.E., Ed.; Cambridge University Press: Cambridge, UK, 2009; pp. 31–48. [Google Scholar]
- Jewitt, C. (Ed.) The Routledge Handbook of Multimodal Analysis, 2nd ed.; Routledge: London, UK, 2014. [Google Scholar]
- Bateman, J.A.; Wildfeuer, J.; Hiippala, T. Multimodality—Foundations, Research and Analysis. A Problem-Oriented Introduction; Mouton de Gruyter: Berlin, Germany, 2017. [Google Scholar]
- Kress, G.; van Leeuwen, T. Reading Images: The Grammar of Visual Design; Routledge: London, UK; New York, NY, USA, 1996. [Google Scholar]
- O’Halloran, K.L. Interdependence, Interaction and Metaphor in Multisemiotic Texts. Soc. Semiot. 1999, 9, 317–354. [Google Scholar] [CrossRef]
- Painter, C.; Martin, J.R.; Unsworth, L. Reading Visual Narratives: Image Analysis of Children’s Picture Books; Equinox: London, UK, 2013. [Google Scholar]
- Bucher, H.J. Multimodalität—Eine Universalie des Medienwandels. Problemstellung und Theorien der Multimodalitätsforschung. In Neue Medien—Neue Formate. Ausdifferenzierung und Konvergenz in der Medienkommunikation; Number 10 in Interaktiva. Schriftenreihe des Zentrums für Medien und Interaktivität (ZMI), Gießen; Bucher, H.J., Gloning, T., Lehnen, K., Eds.; Campus Verlag: Frankfurt, Germany; New York, NY, USA, 2010; pp. 41–79. [Google Scholar]
- Bucher, H.J. Multimodales Verstehen oder Rezeption als Interaktion. Theoretische und empirische Grundlagen einer systematischen Analyse der Multimodalität. In Bildlinguistik. Theorien—Methoden—Fallbeispiele; Diekmannshenke, H.J., Klemm, M., Stöckl, H., Eds.; Erich Schmidt: Berlin, Germany, 2011; pp. 123–156. [Google Scholar]
- Kress, G.; van Leeuwen, T. Multimodal Discourse: The Modes and Media of Contemporary Communication; Arnold: London, UK, 2001. [Google Scholar]
- Bezemer, J.; Kress, G. Multimodality, Learning and Communication: A Social Semiotic Frame; Routledge: New York, NY, USA; London, UK, 2016. [Google Scholar]
- Unsworth, L. Multiliteracies and multimodal text analysis in classroom work with children’s literature. In New Directions in the Analysis of Multimodal Discourse; Royce, T.D., Bowcher, W.L., Eds.; Lawrence Erlbaum Associates: Mahwah, NJ, USA, 2007; pp. 331–360. [Google Scholar]
- Chan, E. Integrating visual and verbal meaning in multimodal text comprehension: towards a model of intermodal relations. In Semiotic Margins: Reclaiming Meaning; Dreyfus, S., Hood, S., Stenglin, M., Eds.; Continuum: London, UK, 2011; pp. 144–167. [Google Scholar]
- Chan, E.; Unsworth, L. Image-language interaction in online reading environments: Challenges for students’ reading comprehension. Aust. Educ. Res. 2011, 38, 181–202. [Google Scholar] [CrossRef]
- Craig, S.D.; Gholson, B.; Driscoll, D.M. Animated pedagogical agents in multimedia educational environments: Effects of agent properties, picture features, and redundancy. J. Educ. Psychol. 2002, 94, 428–434. [Google Scholar] [CrossRef]
- Wang, J.; Antonenko, P.D. Instructor presence in instructional video: Effects on visual attention, recall, and perceived learning. Comput. Hum. Behav. 2017, 71, 79–89. [Google Scholar] [CrossRef]
- De Koning, B.B.; Tabbers, H.K. Facilitating Understanding of Movements in Dynamic Visualizations: An Embodied Perspective. Educ. Psychol. Rev. 2011, 23, 501–521. [Google Scholar] [CrossRef] [Green Version]
- Zwaan, R.A.; Radvansky, G.A. Situation Models in Language Comprehension and Memory. Psychol. Bull. 1998, 123, 162–185. [Google Scholar] [CrossRef] [PubMed]
- Cheng, K.; Chen, Y.; Larson, K.; Rolandi, M. Proving the value of visual design in scientific communication. Inf. Des. J. 2017, 23, 80–95. [Google Scholar]
- Daft, R.L.; Lengel, R.H. Organizational information requirements, media richness and structural design. Manag. Sci. 1986, 32, 554–571. [Google Scholar] [CrossRef]
- Bateman, J.A.; Wildfeuer, J. A multimodal discourse theory of visual narrative. J. Pragmat. 2014, 74, 180–218. [Google Scholar] [CrossRef]
- Rouet, J.F.; Potelle, H. Navigational Principles in Multimedia Learning. In The Cambridge Handbook of Multimedia Learning, 2nd ed.; Mayer, R.E., Ed.; Cambridge University Press: Cambridge, UK, 2009; pp. 297–312. [Google Scholar]
- Bateman, J.A. The Decomposability of Semiotic Modes. In Multimodal Studies: Multiple Approaches and Domains; O’Halloran, K.L., Smith, B.A., Eds.; Routledge Studies in Multimodality, Routledge: London, UK, 2011; pp. 17–38. [Google Scholar]
- Bateman, J.A. Methodological and theoretical issues for the empirical investigation of multimodality. In Handbuch Sprache im Multimodalen Kontext; Number 7 in Handbooks of Linguistics and Communication Science (HSK); Klug, N.M., Stöckl, H., Eds.; De Gruyter Mouton: Berlin, Germany, 2016; pp. 36–74. [Google Scholar]
- Chorianopoulos, K.; Giannakos, M.N. Usability Design for Video Lectures. In Proceedings of the 11th European Conference on Interactive TV and Video, Como, Italy, 24–26 June 2013; ACM: Como, Italy, 2013; pp. 163–164. [Google Scholar]
- Bateman, J.A. Triangulating transmediality: A multimodal semiotic framework relating media, modes and genres. Discourse Context Med. 2017, 20, 160–174. [Google Scholar] [CrossRef]
- Wittenburg, P.; Brugman, H.; Russel, A.; Klassmann, A.; Sloetjes, H. ELAN: A professional framework for multimodality research. In Proceedings of the LREC 2006—Fifth International Conference on Language Resources and Evaluation, Genoa, Italy, 22–28 May 2006; pp. 1556–1559. [Google Scholar]
- Bateman, J.A. Multimodal Corpus-Based Approaches. In The Encyclopedia of Applied Linguistics; Chapelle, C.A., Ed.; Blackwell Publishing Ltd.: Hoboken, NJ, USA, 2013. [Google Scholar]
- Baker, P.; McEnery, T. (Eds.) Corpora and Discourse Studies: Integrating Discourse and Corpora; Palgrave Macmillan: Houndsmill, UK; New York, NY, USA, 2015. [Google Scholar]
- Tseng, C.; Bateman, J.A. Multimodal Narrative Construction in Christopher Nolan’s Memento: A Description of Method. J. Vis. Commun. 2012, 11, 91–119. [Google Scholar] [CrossRef]
- Bateman, J.A.; Tseng, C.; Seizov, O.; Jacobs, A.; Lüdtke, A.; Müller, M.G.; Herzog, O. Towards next-generation visual archives: Image, film and discourse. Vis. Stud. 2016, 31, 131–154. [Google Scholar] [CrossRef]
- Asher, N.; Lascarides, A. Logics of Conversation; Cambridge University Press: Cambridge, UK, 2003. [Google Scholar]
- Martin, J.R. English Text: Systems and Structure; Benjamins: Amsterdam, The Netherlands, 1992. [Google Scholar]
- De Vries, E.; Demetriadis, S.; Ainsworth, S. External representations for learning: headed towards a digital culture. In Technology-Enhanced Learning: Principles and Products; Balacheff, N., Ludvigsen, S., de Jong, T., Lazonder, A., Barnes, S., Eds.; Springer: Milton Keynes, UK, 2009. [Google Scholar]
- Hurst, M. Towards a theory of tables. Int. J. Doc. Anal. 2006, 8, 123–131. [Google Scholar] [CrossRef]
- Bateman, J.A. Multimodality and Genre: A Foundation for the Systematic Analysis of Multimodal Documents; Palgrave Macmillan: Basingstoke, UK, 2008. [Google Scholar]
- O’Halloran, K.L. Mathematical Discourse: Language, Symbolism and Visual Images; Continuum: London, UK; New York, NY, USA, 2005. [Google Scholar]
- Asher, N.; Lascarides, A. Strategic conversation. Semant. Pragmat. 2013, 6, 1–62. [Google Scholar] [CrossRef] [Green Version]
- Gibbon, D.; Mertins, I.; Moore, R.K. (Eds.) Handbook of Multimodal and Spoken Dialogue Systems. Resources, Terminology and Product Evaluation; Springer Science+Business Media: New York, NY, USA, 2000. [Google Scholar]
- Bucher, H.J.; Niemann, P. Visualizing science: The reception of PowerPoint presentations. Vis. Commun. 2012, 11, 283–306. [Google Scholar] [CrossRef]
- Mautone, P.D.; Mayer, R.E. Signaling as a cognitive guide in multimedia learning. J. Educ. Psychol. 2001, 93, 377–389. [Google Scholar] [CrossRef]
- Richter, J.; Scheiter, K.; Eitel, A. Signaling text-picture relations in multimedia learning: A comprehensive meta-analysis. Educ. Res. Rev. 2016, 17, 19–36. [Google Scholar] [CrossRef]
- Fricke, E.; Bressem, J.; Müller, C. Gesture families. In Body–Language–Communication. An International Handbook on Multmodality in Human Interaction; Number 38/2 in Handbücher zur Sprach- und Kommunikationswissenschaft/Handbooks of Linguistics and Communication Science (HSK); Müller, C., Cienki, A., Fricke, E., Ladewig, S.H., McNeill, D., Bressem, J., Eds.; Mouton de Gruyter: Berlin, Germany; New York, NY, USA, 2014; pp. 1630–1640. [Google Scholar]
- Giannakos, M.N.; Chorianopoulos, K.; Ronchetti, M.; Szegedi, P.; Teasley, S.D. Video-Based learning and open online courses. Int. J. Emerg. Technol. Learn. 2014, 9, 4–7. [Google Scholar] [CrossRef]
- Giannakos, M.N.; Jaccheri, L.; Krogstie, J. Looking at MOOCs rapid growth through the lens of video-based learning research. Int. J. Emerg. Technol. Learn. 2014, 9, 35–38. [Google Scholar] [CrossRef]
- Bishop, J.L.; Verleger, M.A. The flipped classroom: A survey of the research. In Proceedings of the 120th ASEE Annual Conference & Exposition, Atlanta, GA, USA, 23–26 June 2013; pp. 1–18. [Google Scholar]
- Chen, C.M.; Wu, C.H. Effects of different video lecture types on sustained attention, emotion, cognitive load, and learning performance. Comput. Educ. 2015, 80, 108–121. [Google Scholar] [CrossRef]
- Ebner, M.; Schön, S. Lern- und Lehrvideos: Gestaltung, Produktion, Einsatz. In Handbuch E-Learning; 71. Erg. Lieferung; WBV Media: Bielefeld, Germany, 2017; Volume 4, pp. 1–14. [Google Scholar]
- Eitel, A.; Scheiter, K. Picture or Text First? Explaining Sequence Effects when Learning with Pictures and Text. Educ. Psychol. Rev. 2015, 27, 153–180. [Google Scholar] [CrossRef]
- Schüler, A. Investigating gaze behavior during processing of inconsistent text-picture information: Evidence for text-picture integration. Learn. Instr. 2017, 49, 218–231. [Google Scholar] [CrossRef]
Figure 1.
Screen shots of the visual development of Video 1 (00:00–03:00) showing six snapshots (a–e) as the explanation progresses.
Figure 1.
Screen shots of the visual development of Video 1 (00:00–03:00) showing six snapshots (a–e) as the explanation progresses.

Figure 2.
Extract of annotation tiers for the beginning of Video 1 (00:00–01:15).

Figure 3.
Frames from Video 2 (left) and Video 3 (right) illustrating their very different design strategies, both with respect to each other and to Video 1.
Figure 3.
Frames from Video 2 (left) and Video 3 (right) illustrating their very different design strategies, both with respect to each other and to Video 1.

Figure 4.
Comparison of discourse construction strategy profiles (proportions with respect to visual macro-themes) across: Video 1 (left); and Video 3 (right).
Figure 4.
Comparison of discourse construction strategy profiles (proportions with respect to visual macro-themes) across: Video 1 (left); and Video 3 (right).

Figure 5.
Ratings of learning experiences. Note, higher scores indicate a higher agreement to the item (i.e., for the matter of pace it is its appropriateness). * , ** , *** .
Figure 5.
Ratings of learning experiences. Note, higher scores indicate a higher agreement to the item (i.e., for the matter of pace it is its appropriateness). * , ** , *** .

Figure 6.
Three successive presentation frames from Video 2 (with added timestamps) showing loss of visual context between Frame 1 and Frame 3.
Figure 6.
Three successive presentation frames from Video 2 (with added timestamps) showing loss of visual context between Frame 1 and Frame 3.


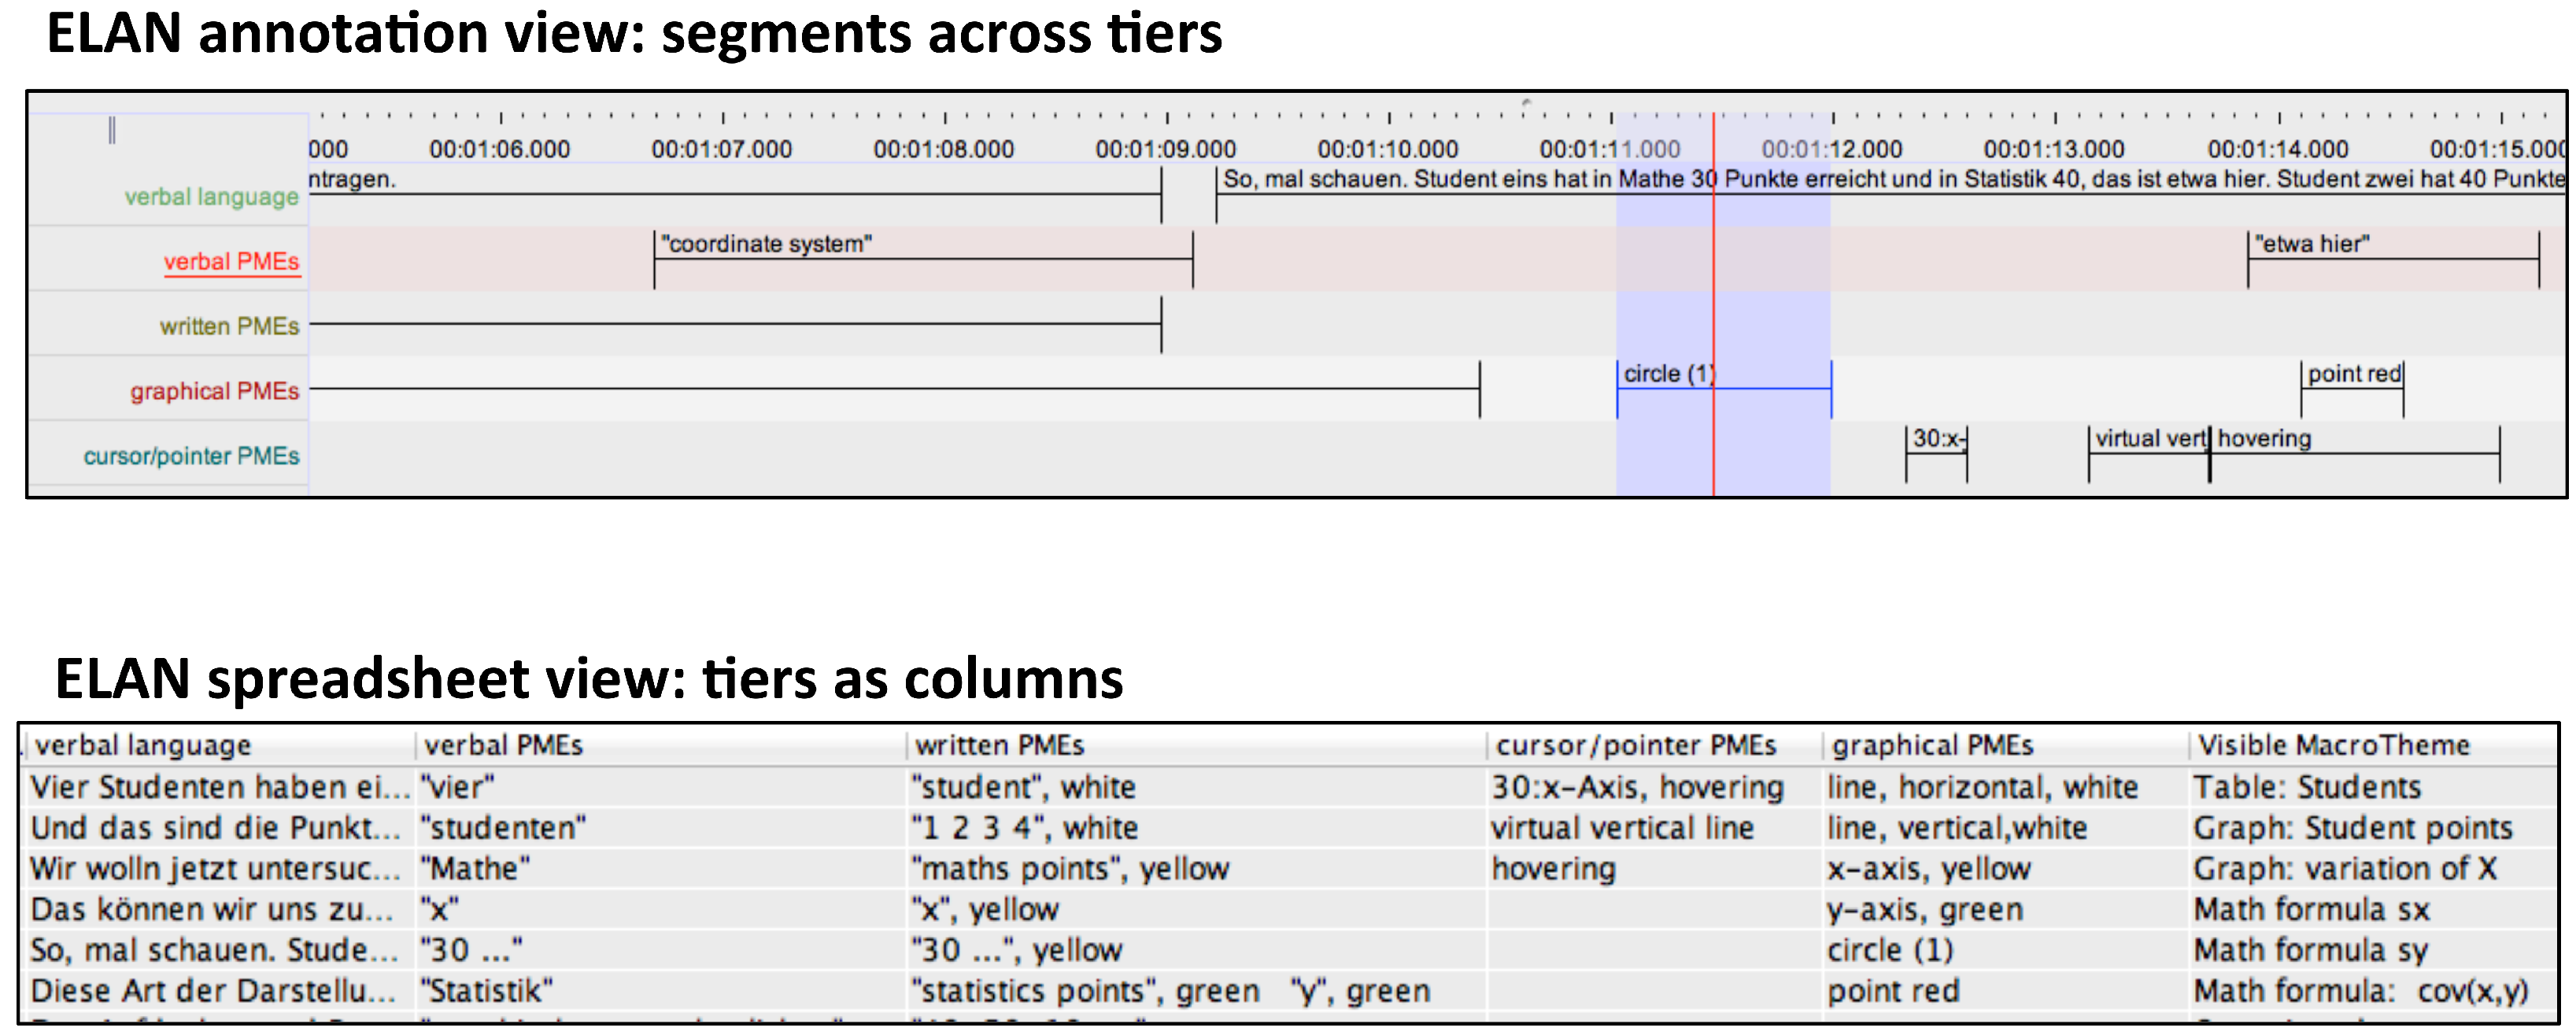
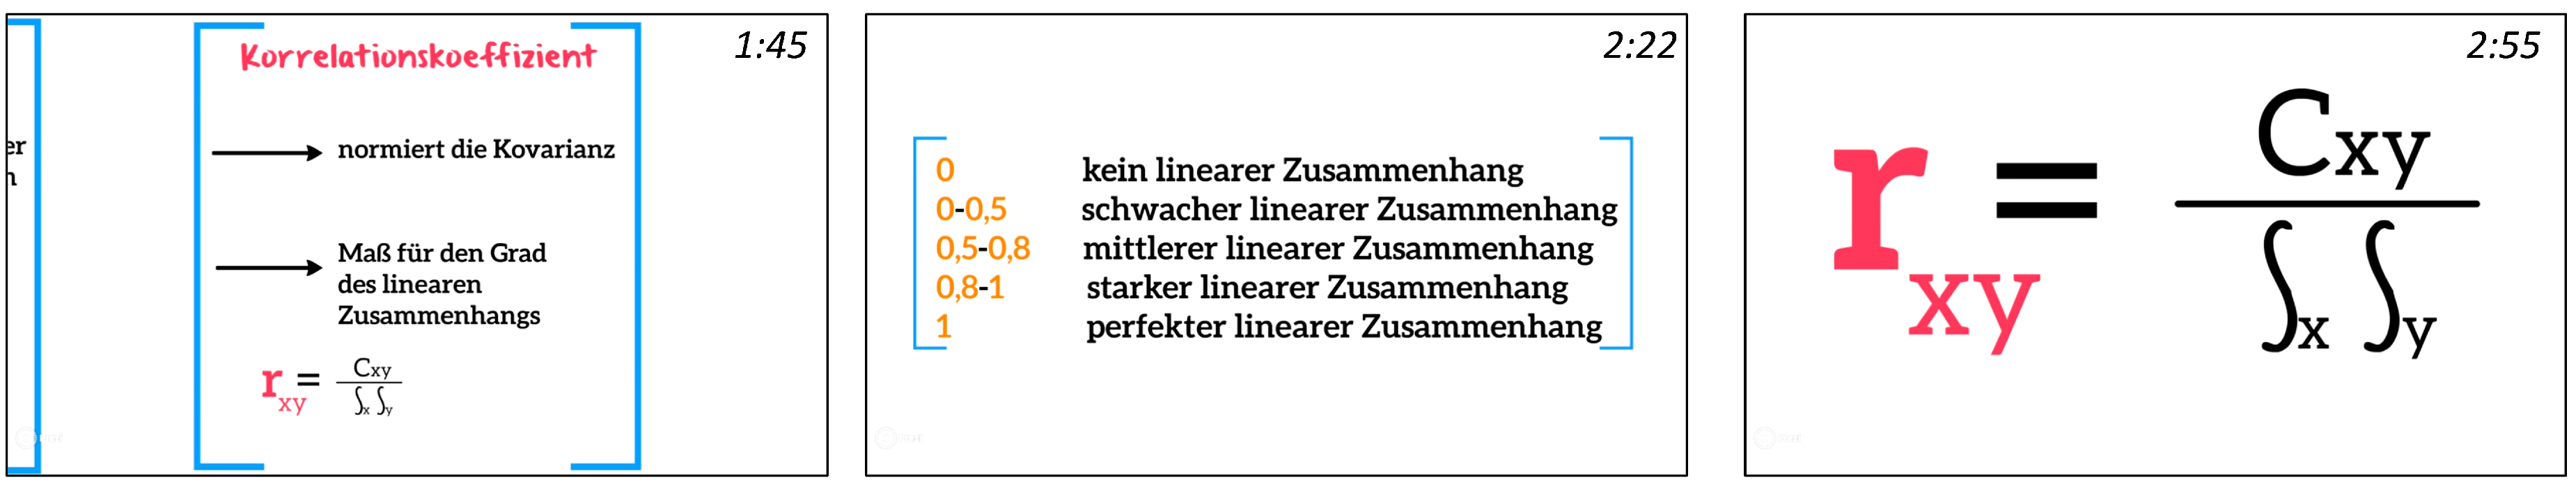
Table 1.
Number and durations of visual macro-themes and durations of scaffolding and developing segments in the three videos. Percentages indicate the ratio with the overall macro-theme durations.
Table 1.
Number and durations of visual macro-themes and durations of scaffolding and developing segments in the three videos. Percentages indicate the ratio with the overall macro-theme durations.
| Macro-Themes | Scaffolding | Developing | ||||
|---|---|---|---|---|---|---|
| N | (ms) | (ms) | % | (ms) | % | |
| Video 1 (Screencast) | 6 | 624,181 | 137,630 | 22.05 | 401,278 | 64.29 |
| Video 2 (Prezi) | 31 | 456,795 | 137,132 | 30.02 | 218,943 | 47.93 |
| Video 3 (Vodcast) | 11 | 714,262 | 171,185 | 23.97 | 499,182 | 69.89 |
Table 2.
Means and standard deviations of knowledge measures: before (pre) and after (post) watching the video, as well as the pre–post difference (gain).
Table 2.
Means and standard deviations of knowledge measures: before (pre) and after (post) watching the video, as well as the pre–post difference (gain).
| Pre | Post | Gain | ||||
|---|---|---|---|---|---|---|
| M | (SD) | M | (SD) | M | (SD) | |
| Video 1 (Screencast) () | 3.33 | (2.22) | 5.39 | (1.60) | 2.06 | (2.17) |
| Video 2 (Prezi) () | 4.75 | (4.12) | 5.40 | (3.57) | 0.65 | (1.60) |
| Video 3 (Vodcast) () | 3.88 | (3.17) | 6.69 | (2.64) | 2.18 | (1.31) |
| Total () | 4.02 | (3.24) | 5.78 | (2.73) | 1.76 | (1.91) |
Table 3.
Correlations of predictor variables with the significant reception variables and intercorrelations among the predictors.
Table 3.
Correlations of predictor variables with the significant reception variables and intercorrelations among the predictors.
| Olg | Slg | Pace | Mood | MT N | MT ms | Sc ms | Sc % | DV ms | |
|---|---|---|---|---|---|---|---|---|---|
| slg | 0.41 * | ||||||||
| pace | 0.25 | 0.38 | |||||||
| mood | −0.02 | 0.37 | 0.45 * | ||||||
| MT N | −0.42* | −0.53 ** | 0.54 ** | −0.33 | |||||
| MT ms | 0.48 * | 0.69 ** | 0.62 ** | 0.47 * | −0.87 *** | ||||
| Sc ms | 0.37 | 0.60 ** | 0.46 * | 0.45 * | −0.35 | 0.77 *** | |||
| Sc % | −0.41 * | −0.51 * | −0.53 ** | −0.32 | 0.99 *** | −0.85 *** | −0.31 | ||
| Dv ms | 0.48 * | 0.69 ** | 0.62 ** | 0.47 * | −0.87 *** | 1.00 *** | 0.77 *** | −0.85 *** | |
| Dv % | 0.48 * | 0.67 ** | 0.62 ** | 0.45 * | −0.92 *** | 0.99 *** | 0.70 *** | −0.90 *** | 0.99 *** |
Note. * , ** , *** ; Olg, objective learning gains; Slg, subjective learning gains; MT, macro-themes; Sc, Scaffolding segments; Dv, Developing segments.
© 2018 by the authors. Licensee MDPI, Basel, Switzerland. This article is an open access article distributed under the terms and conditions of the Creative Commons Attribution (CC BY) license (http://creativecommons.org/licenses/by/4.0/).
Share and Cite
MDPI and ACS Style
Bateman, J.A.; Schmidt-Borcherding, F. The Communicative Effectiveness of Education Videos: Towards an Empirically-Motivated Multimodal Account. Multimodal Technol. Interact. 2018, 2, 59. https://doi.org/10.3390/mti2030059
AMA Style
Bateman JA, Schmidt-Borcherding F. The Communicative Effectiveness of Education Videos: Towards an Empirically-Motivated Multimodal Account. Multimodal Technologies and Interaction. 2018; 2(3):59. https://doi.org/10.3390/mti2030059
Chicago/Turabian StyleBateman, John A., and Florian Schmidt-Borcherding. 2018. "The Communicative Effectiveness of Education Videos: Towards an Empirically-Motivated Multimodal Account" Multimodal Technologies and Interaction 2, no. 3: 59. https://doi.org/10.3390/mti2030059