Article

Comparing Map Learning between Touchscreen-Based Visual and Haptic Displays: A Behavioral Evaluation with Blind and Sighted Users

by
Hari Prasath Palani
1,*,
Paul D. S. Fink
2 and
Nicholas A. Giudice
1,2,*
1
UNAR Labs, Portland, ME 04102, USA
2
VEMI Lab, School of Computing and Information Science, The University of Maine, Orono, ME 04469, USA
*
Authors to whom correspondence should be addressed.
Multimodal Technol. Interact. 2022, 6(1), 1; https://doi.org/10.3390/mti6010001
Submission received: 17 November 2021 / Revised: 7 December 2021 / Accepted: 9 December 2021 / Published: 22 December 2021
(This article belongs to the Special Issue Feature Papers of MTI in 2021)

Abstract

:
The ubiquity of multimodal smart devices affords new opportunities for eyes-free applications for conveying graphical information to both sighted and visually impaired users. Using previously established haptic design guidelines for generic rendering of graphical content on touchscreen interfaces, the current study evaluates the learning and mental representation of digital maps, representing a key real-world translational eyes-free application. Two experiments involving 12 blind participants and 16 sighted participants compared cognitive map development and test performance on a range of spatio-behavioral tasks across three information-matched learning-mode conditions: (1) our prototype vibro-audio map (VAM), (2) traditional hardcopy-tactile maps, and (3) visual maps. Results demonstrated that when perceptual parameters of the stimuli were matched between modalities during haptic and visual map learning, test performance was highly similar (functionally equivalent) between the learning modes and participant groups. These results suggest equivalent cognitive map formation between both blind and sighted users and between maps learned from different sensory inputs, providing compelling evidence supporting the development of amodal spatial representations in the brain. The practical implications of these results include empirical evidence supporting a growing interest in the efficacy of multisensory interfaces as a primary interaction style for people both with and without vision. Findings challenge the long-held assumption that blind people exhibit deficits on global spatial tasks compared to their sighted peers, with results also providing empirical support for the methodological use of sighted participants in studies pertaining to technologies primarily aimed at supporting blind users.

Graphical Abstract

1. Introduction

The proliferation of touchscreen-based devices in recent years presents promising new opportunities to address the longstanding issue of providing non-visual access to graphical materials for blind and visually impaired (BVI) people. According to the most recent estimates, 252 million people worldwide have moderate to severe vision impairment, and 49 million people are legally blind [1,2]. Screen-reading software using text-to-speech engines, such as VoiceOver for Mac/iOS [3] and JAWS for Windows [4], have largely solved the issue of providing access to digital text-based materials for BVI people. By contrast, despite new multimodal interaction methods enabled by touchscreens, there remains a fundamental lack of analogous solutions for providing non-visual, multisensory access to graphical content and non-textual materials. This is problematic as visual graphics serve as a critical format for efficiently conveying complex information across many domains and disciplines (e.g., through graphs, infographics, maps, and scientific simulations). As such, they have become increasingly pervasive in daily life, a trend perpetuated by the convenience and widespread use of handheld touchscreen-based visual displays on computationally powerful smart devices. Given that touchscreen-based smart device usage among the visually impaired population has increased dramatically in recent years, from 12% in 2009 to 82% in 2014 [5], there has been growing interest among researchers and developers to address the BVI graphical access problem by expanding use of this technology through audio-based and vibration-based interactions, as well as combinations of the two. Although promising, these multimodal platforms also offer unique and novel challenges due to the limitations imposed by the underlying touchscreen hardware. Despite being classified as ‘touch displays’, there is in fact little meaningful tactile information or cutaneous feedback passed from the nondescript glass display to its user, as the visually based onscreen information does not have any tangible, physical features. As such, traditional usage scenarios rely on visually dependent output of graphical information, with touch reserved primarily as an input method. To address this limitation, a growing body of work has begun to examine the use of touch/haptic cues as an output modality for applications supporting BVI users. Some notable examples of using touchscreen-based haptics include accessing bar graphs, letter identification, and shape discrimination [6], as well as accessing multi-line data representations [7,8], recognizing shapes and patterns [9,10], and accessing maps [11,12,13,14,15].
We posit that, although promising and worthy of further investigation, haptic rendering on touchscreens presents challenges with respect to: (1) input/perception—ensuring accurate haptic information extraction and encoding, (2) processing/cognition—ensuring the perceived information is accurately interpreted and represented in memory, and (3) output/behavior—ensuring the developed mental representation supports a high level of subsequent performance on behavioral tasks. Although several guidelines have been established throughout the years for abstracting, schematizing, and generating tangible equivalents of visual graphics for traditional (non-touchscreen-based) tangible media such as raised-line drawings [16] and tactile maps [17,18], it would be inappropriate to assume that these guidelines are directly transferrable to touchscreen-based renderings of graphical materials. This is because the physical processes that enable tactile sensation of traditional tangible materials are fundamentally different than those underlying vibration-based interactions, e.g., vibrotactile perception, as is studied here. To clarify, whereas physical tangible materials are primarily perceived through mechanoreceptors activated by pressure-based skin displacement [19], haptic interactions on touchscreens are not pressure driven but primarily involve stimulation of vibration-sensitive Pacinian corpuscles, which are maximally innervated between 200 and 300 hz [7,20]. Owing to the limited intrinsic cutaneous information passed from the glass surface of touchscreen-based devices, haptic perception on touchscreens relies on extrinsic feedback created by innervation of these corpuscles by vibration. The exploratory procedures (EPs) that enable haptic perception of dynamic touchscreen-based approaches differ as well. That is, when interacting with traditional tangible media, such as hard-copy maps and graphs, people most commonly employ one or more of the following three EPs for accessing and extracting graphical information: (1) lateral motion (moving the fingers back and forth across a texture or feature), (2) contour following (tracing an edge of the graphical element), and/or (3) whole-hand exploration of the global shape [21,22,23,24]. By contrast, non-visual information extraction from touchscreens typically involves EPs utilizing just one finger, with strategies including circling around an angle/vertex, zigzagging along a line, contour following, or four-directional scans [12,13,25,26]. Furthermore, even when graphical renderings on touchscreen-based devices have been haptically perceived through these EPs, various other spatio-cognitive challenges may arise, including preserving spatial resolution, integrating temporal information, and overcoming various vulnerabilities due to systematic distortions [7,27]. As such, guidelines for static, tangible materials intended for displays relying on pressure-based information extraction cannot simply be substituted or adopted when implementing dynamic, vibration-based graphical elements for use with touchscreen interfaces. To resolve this issue, several recent studies have started to provide much needed guidelines for the effective use of vibrotactile stimuli on touchscreen-based smart devices [28,29]. Building on this work, we designed a series of psychophysically motivated usability studies to both address the dearth of research in this domain and to provide a set of rigorous design guidelines to support perceptually salient and functionally meaningful interactions for BVI users on this proliferating and natively multimodal computational platform. The results from this work led to the empirical identification of a core set of guidelines and parameters for the design of haptically salient graphical materials optimized for delivery on touchscreens [30,31]. These guidelines are summarized in Table 1.
This article extends and evaluates these basic research findings using a practical use-case scenario: non-visual learning of multimodal/tactile maps. However, this is not a study about the broad efficacy of tactile maps, as the value of these displays for BVI people has been demonstrated for decades [32,33,34]. The following explores previous work related to tactile maps utilizing multisensory cues and the important implications of these interfaces for the processes underlying accurate and efficient navigation.

2. Related Work

The theoretical relevance of previous work related to tactile maps for BVI users can be best understood through the lens of blind spatial cognition. That is, it has been long theorized that BVI individuals are differentially impaired compared to their sighted peers on complex spatial tasks requiring more than route knowledge, such as spatial inferencing, spatial updating, allocentric judgments, and environmental (configurational) learning (see [35,36,37] for reviews). While maps can be used to determine routes, they also provide access to off-route environmental information, such as inter-object relations and global (survey) structure [38,39]. As such, they represent an excellent tool for supporting the complex spatial behaviors known to be most difficult for BVI individuals [38]. Specifically, map use is well suited for facilitating the development of cognitive maps [39], which serve as the allocentric, viewer-independent spatial representations that enable accurate and flexible navigation [39,40]. Previous work has demonstrated that cognitive map development is particularly challenging for BVI navigators, as successful formation requires learning and representing allocentric information and structural knowledge [41,42]. However, when BVI users have access to traditional tactile maps (consisting of raised elements, texture variation, and braille labels [17,18,43]) their spatial learning, cognitive mapping, and wayfinding performance of the depicted environments has been demonstrated to be reliably improved [32,44,45].
Over the years, the traditional tactile map has evolved to incorporate multimodal interfaces, with the seminal work on audio-tactile maps being done in the late 1980s [46]. Since then, many incarnations of accessible digital maps have been developed, most involving some form of multisensory user interface (for review, see [47,48]). These multimodal maps, usually incorporating auditory cues and/ or text-to-speech descriptions coupled with a tactile display, have been shown to be extremely beneficial in supporting BVI spatial behaviors, such as route planning, learning landmark relations, wayfinding, and cognitive mapping. Some examples of multimodal maps that have been tested with BVI users include systems employing a physical map overlay [49,50], a force feedback haptic device [51,52], a dynamic pin array [53,54], and most recently, touchscreen-based vibrotactile feedback [11,14,15]. Approaches utilizing this latest class of multimodal map have demonstrated learning of road networks [11], floor maps of university buildings [14], as well as simple street maps using both mobile and watch-based interfaces [15]. Taken together, these results speak to the powerful utility of multimodal maps rendered on touchscreens for promoting map learning.
The following section describes the general contributions of the current work, which leverages the benefits of touchscreen-based map learning through a vibro-audio map (VAM). Beyond validating the efficacy of the previously established guidelines, our approach leverages the benefits of mobile form factors, compares results against existing gold standards, and provides important theoretical contributions related to cognitive map formation between BVI and sighted users.

3. Contributions

When digital maps are rendered on touchscreen devices, as is done here, they provide additional use-case flexibility for users by conveying scalable spatial information with increased multimodal interaction capabilities, such as through vibration, audio, and kinesthetic feedback. Dense map information that was once confined to the fixed scale of paper, or limited by the size and expense of dedicated hardware solutions like pin arrays or force feedback devices, now fits on users’ existing devices and is capable of multiple interaction methods. However, despite the convenience and new interaction potentials of touchscreen-based smart devices, the vast majority of map information rendered on touchscreens remains reliant on visual information extraction, contributing to the longstanding graphical information access problem for BVI people that motivates this work. To address this issue, the VAM presents graphical (visual) elements to BVI users via a multisensory combination of vibro-tactile and auditory feedback, synthesized through the coupling of hand movements during information extraction [6].
One practical design goal of this paper was to extend previous work employing conceptually similar interfaces used for identifying basic perceptual and usability parameters [12,13,14] to a real-world map-use application, which allows us to evaluate both the efficacy of the VAM and the perceptual parameters used during its optimization for supporting accurate cognitive map development, a more complex spatial skill. Positive results with the VAM across our battery of test measures would not only provide validation for these guidelines to support information access and spatial learning in a real-world scenario, but they also open the door for its usability in supporting many other non-visual applications involving accessing, learning, and representing complex graphical content.
A second motivation of the current work is to compare learning with the VAM against existing gold-standard mapping approaches for both BVI and sighted users (i.e., hardcopy-tactile maps for BVI users and visual maps for sighted users). The outcomes of these comparisons make both basic and applied contributions to our existing knowledge.
First, results provide a metric of cognitive map formation and subsequent test performance accuracy on key spatial behaviors as a function of the map-learning mode (visual vs. tactile). These findings have theoretical relevance. If test performance, which involves a common set of spatial tasks for both conditions, did not reliably differ between the map-learning modes, then the results would provide evidence for the development of a unified spatial representation in the brain. By contrast, results revealing differential performance on these test metrics would challenge the notion of a unified spatial representation, suggesting instead the development of sensory-specific representations from the two map-learning modalities. We predict the former outcome based on a growing body of evidence demonstrating that, when input modalities are matched for information content at learning, a sensory-independent ‘amodal’ spatial representation is formed in memory that supports functionally equivalent behavior, irrespective of the input mode (for review, see [55]).
Second, the results enable us to assess whether there are differences in cognitive mapping and test accuracy after haptic map learning between BVI and sighted participants. This comparison has practical significance because, even though the utility of haptic maps is well established for BVI users, the efficacy of these displays is poorly studied with sighted learners (however, see [56], who found equivalent performance between these groups when learning simple three-leg route maps). Given that a core argument advanced here is that sighted users can also benefit from non-visual displays to support multisensory tasks and eyes-free situations, it is essential that we are able to obtain a robust index of their spatio-cognitive abilities on more complex tasks, as is possible from this experimental design. We argue that more comparisons of this type are needed to advance inclusive design for multimodal technologies and break the de facto assumption that visual interfaces are only relevant to sighted people and tactile and multisensory interfaces are predominately used by blind users. Indeed, all too often, the focus of access technology for BVI people is heavily biased toward totally blind individuals, although people with no usable vision only represent around 5% of the legally blind population [57,58]. In most cases, the non-visual information used by totally blind individuals could be equally relevant to sighted users and visual UI elements could also benefit a broad range of visually impaired people with usable vision; however, these aspects of multisensory design are rarely considered. We posit that inclusion of multisensory UI elements is the single-most beneficial design decision that can be implemented to ensure inclusive, universally designed products. Interestingly, while most of the interactive mapping approaches cited here use multimodal interfaces, very little is discussed in these studies about how the same system could have significant functional utility for a far broader range of users than those tested.
A third contribution of this study is that our design affords an opportunity to directly compare map learning and cognitive mapping accuracy between sighted and BVI users—two groups that are usually studied in isolation. Beyond the interesting theoretical aspect relating to learning with and without visual experience, this comparison speaks to methodological questions about recruiting sighted participants in studies ultimately aimed at developing technologies for BVI users.

4. Materials and Methods

Two studies were conducted to compare performance across a range of spatio-behavioral tasks using the VAM and traditional tactile and visual maps (control conditions). Experiment 1 recruited blind and visually impaired (BVI) participants and compared the VAM against a hardcopy raised tangible map, which is the current gold standard for BVI users. Experiment 2 recruited sighted participants and compared their performance with the VAM against two learning modes: (1) a hardcopy raised tangible interface and (2) a visual interface.

4.1. Experiment 1: Evaluation with BVI Users

The goal of Experiment 1 was to compare performance on a series of spatio-behavioral tasks between learning with the VAM and learning with a traditional hardcopy raised tangible map that was mounted on a touchscreen device. The behavioral test measures were designed such that they required users to perform mental computation, rotation, and inferencing of the ensuing spatial representation built up from the two learning modes. By comparing performance across these two conditions, we were able to assess cognitive map development between learning with the VAM as compared to learning with the hardcopy tactile map. The logic here is that both conditions were matched in terms of the information provided, differing only in whether the haptic interface employed vibrotactile or traditional embossed tactile information. We also ensured a baseline level of learning before moving to the testing phase through use of a criterion learning test (see procedure). Results showing that performance with the VAM is similar/better than the hardcopy tactile condition would affirm that the vibro-audio map (with graphical elements rendered based on guidelines established from our earlier studies) is a viable and functionally equivalent approach. By contrast, findings showing that learning with the VAM leads to significantly worse test performance than the current gold standard would indicate that further investigation and future research must be undertaken to mitigate these deficits.

4.1.1. Participants

A total of 12 blind participants (6 females and 6 males, ages 28–65) were recruited for this experiment (BVI demographic details are presented in Table 2). The studies were reviewed and approved by the University of Maine Institutional Review Board and all participants provided their written informed consent to participate in this study. This sample size was based on what has been found to be appropriate and sufficiently powered from traditional usability studies aimed at assessing the efficacy of assistive technology interface/device functionality [59,60].

4.1.2. Conditions

Two touchscreen-based learning-mode map conditions were designed and evaluated in this study: (1) the vibro-audio map (VAM) and (2) a hardcopy tactile map overlaid on the experimental touchscreen device. Figure 1 illustrates this design via an example of the experimental stimuli as experienced across the two learning-mode conditions.
For the VAM condition, vibrotactile feedback was generated from the device’s embedded electromagnetic actuator, i.e., a linear resonant actuator, which was controlled within the application script developed in the lab. The vibrotactile lines were rendered using a constant vibration—an infinite repeating loop at 250 Hz with 100% power, and the regions (analogous to specific map locations) were rendered using a pulsing vibration—an infinite repeating loop at 250 Hz switching between 75% and 100% power. In addition, the landmarks were also indicated via a continuous audio cue (i.e., 220 Hz sine tone), and speech messages were presented stating the name of the landmark, such as “Start”, “Dead-End”, “Logan Airport”, “Macy’s”. Users’ finger movement behavior was tracked and logged within the device and subsequently used for measuring learning time and analyzing tracing strategies.
For the hardcopy tactile map-learning conditions, tactile analogs of the same stimuli were produced on Braille paper, using a commercial graphics embosser (ViewPlus Technologies, Emprint SpotDot). The paper was then cut to size and mounted on the touchscreen of the Galaxy tablet device (see Figure 1). This map overlay technique allowed for the auditory information to be given in real time, thereby matching the available information content with the VAM. The use of a touchscreen-based tactile overlay also facilitated logging of users’ finger movement, thereby allowing for the measurement of learning time and subsequent analysis of tracing strategy, as was done in the VAM condition.

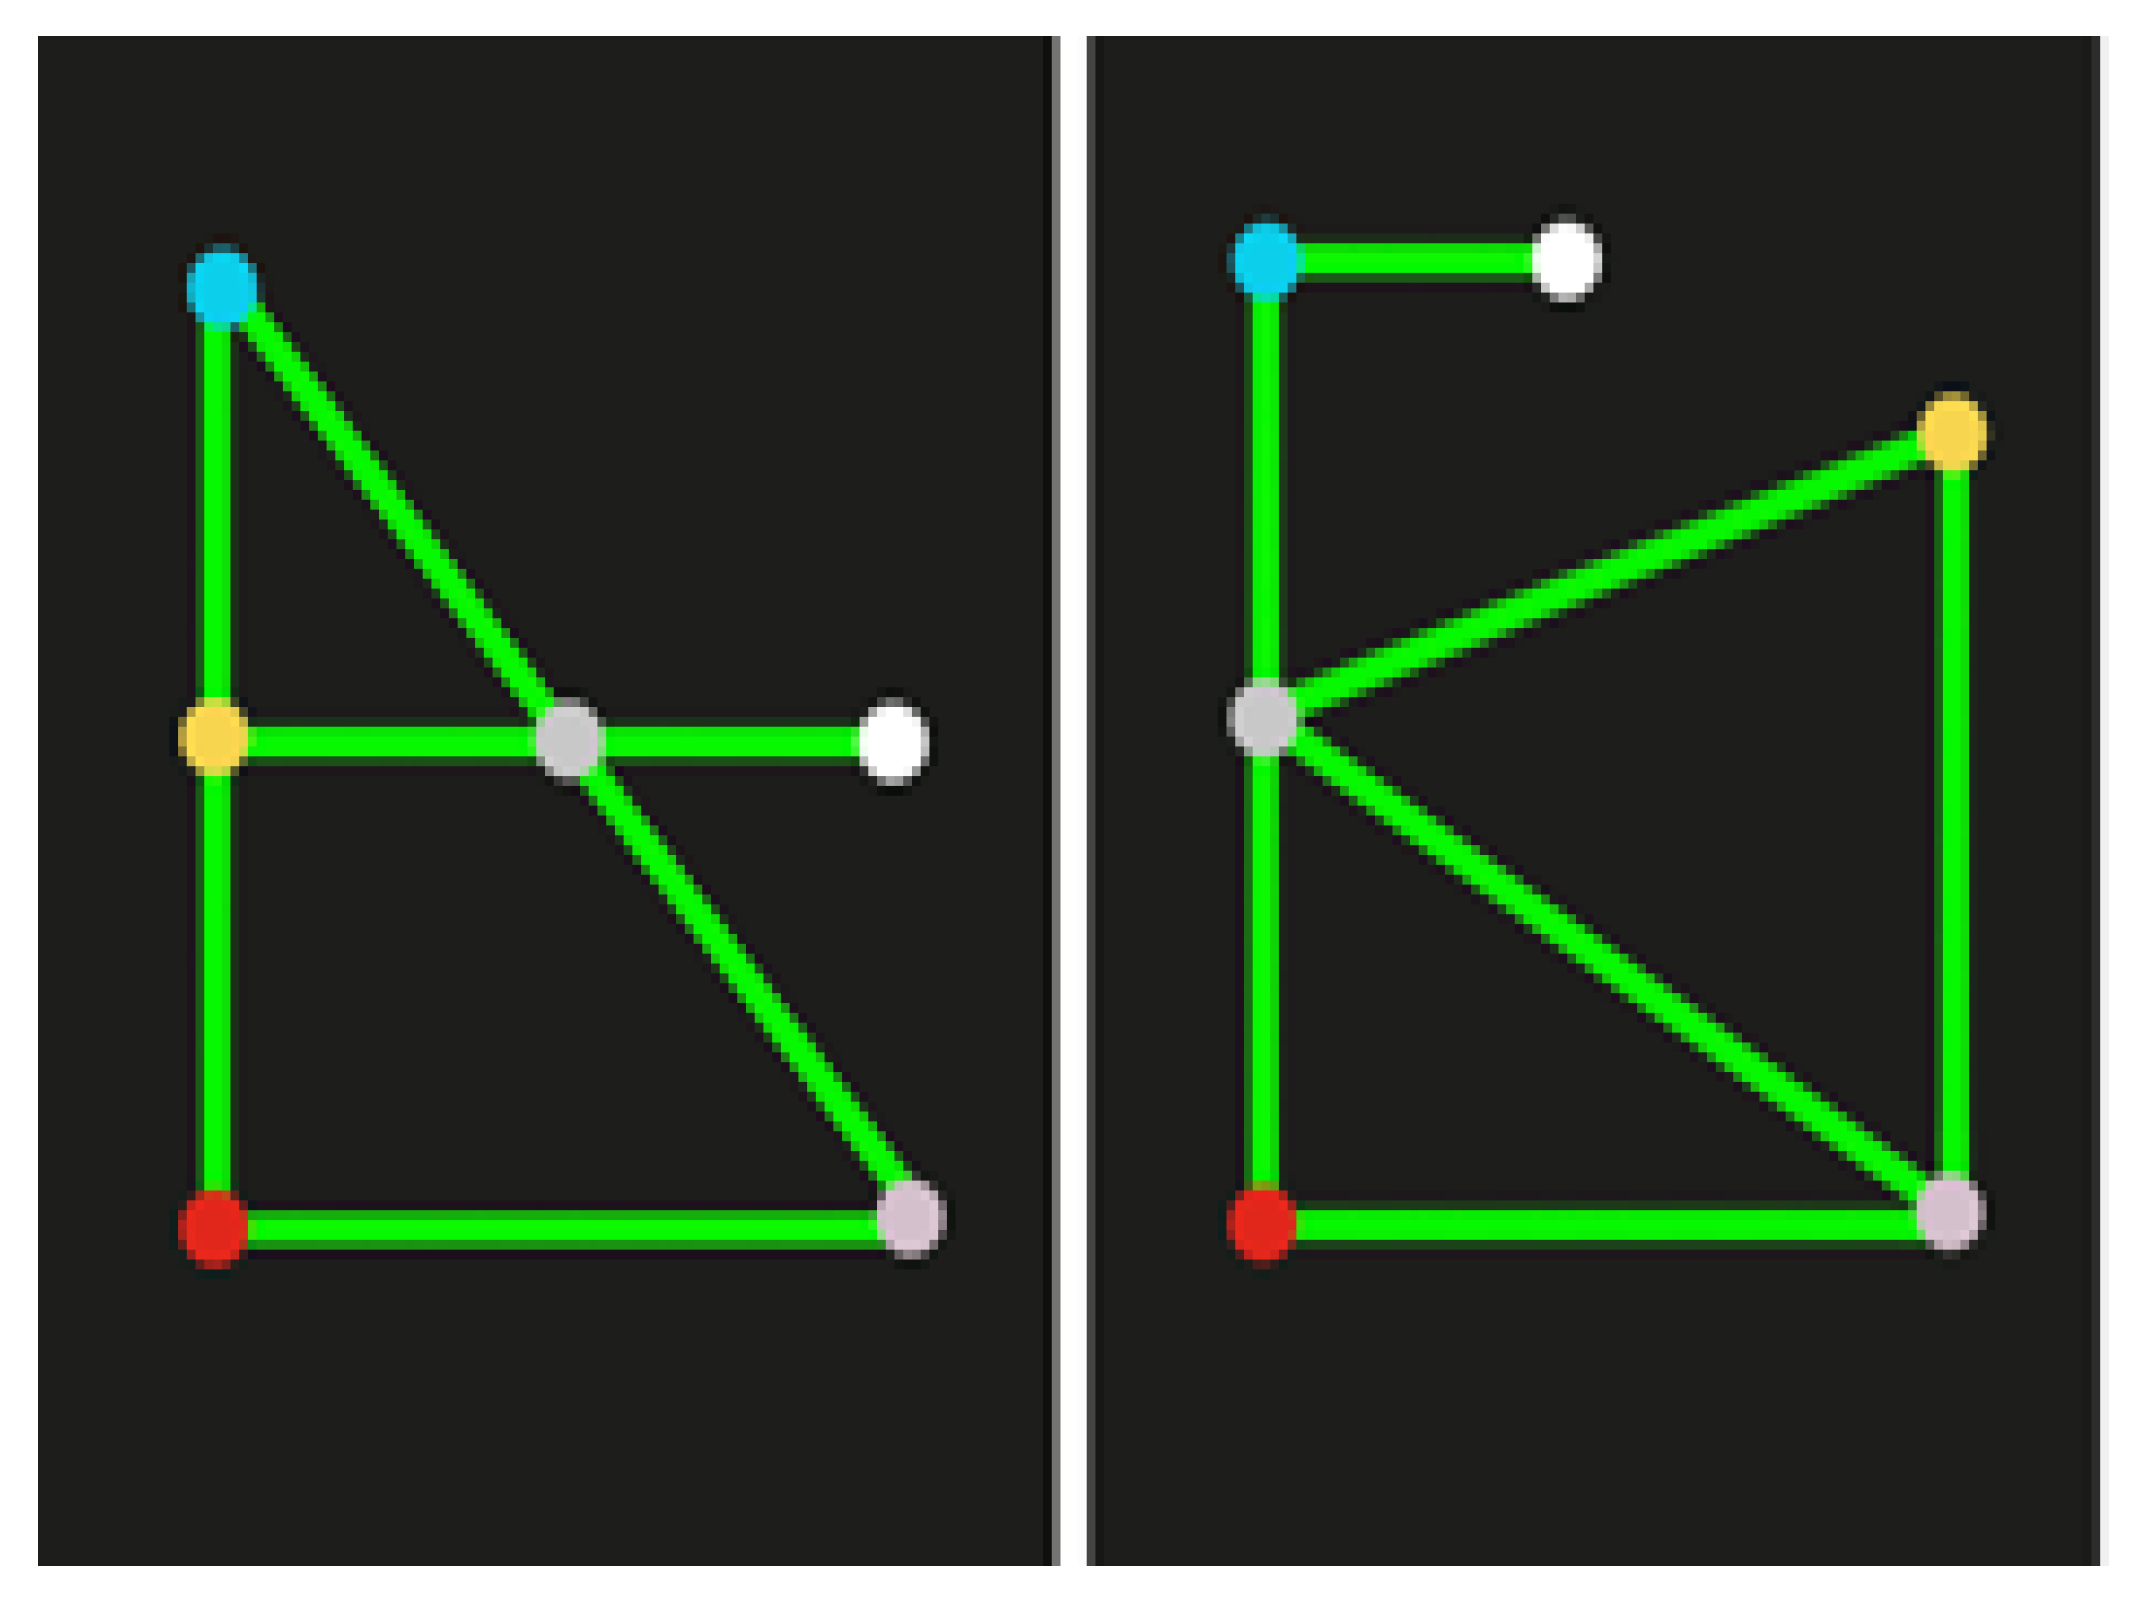
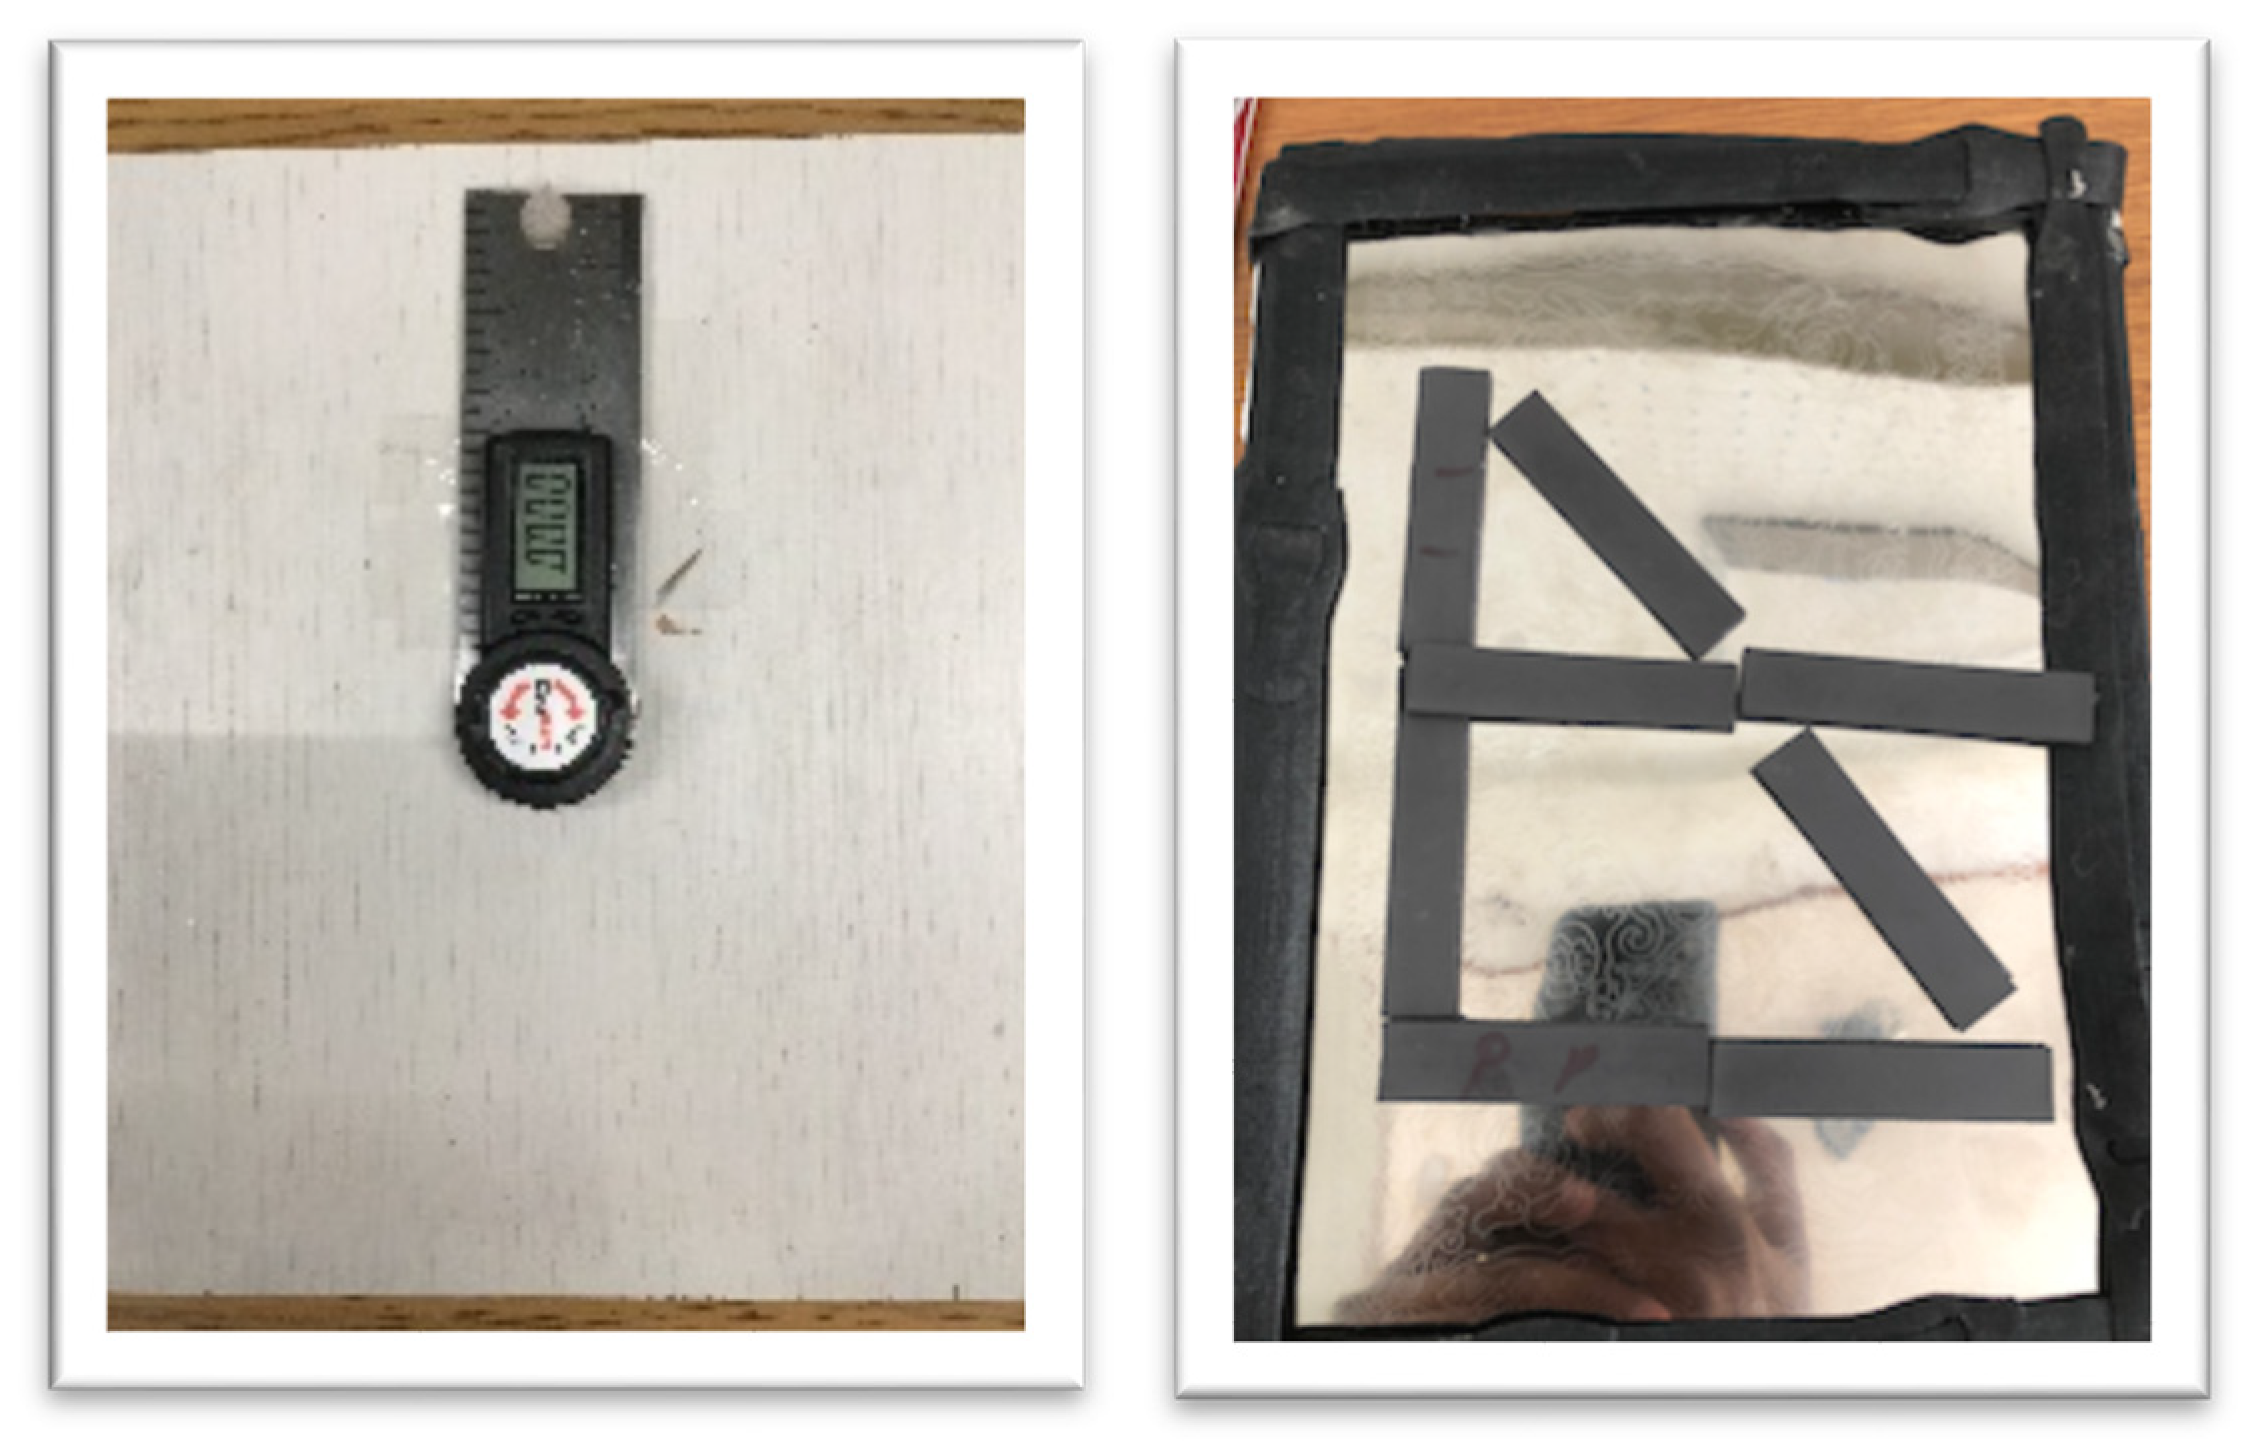
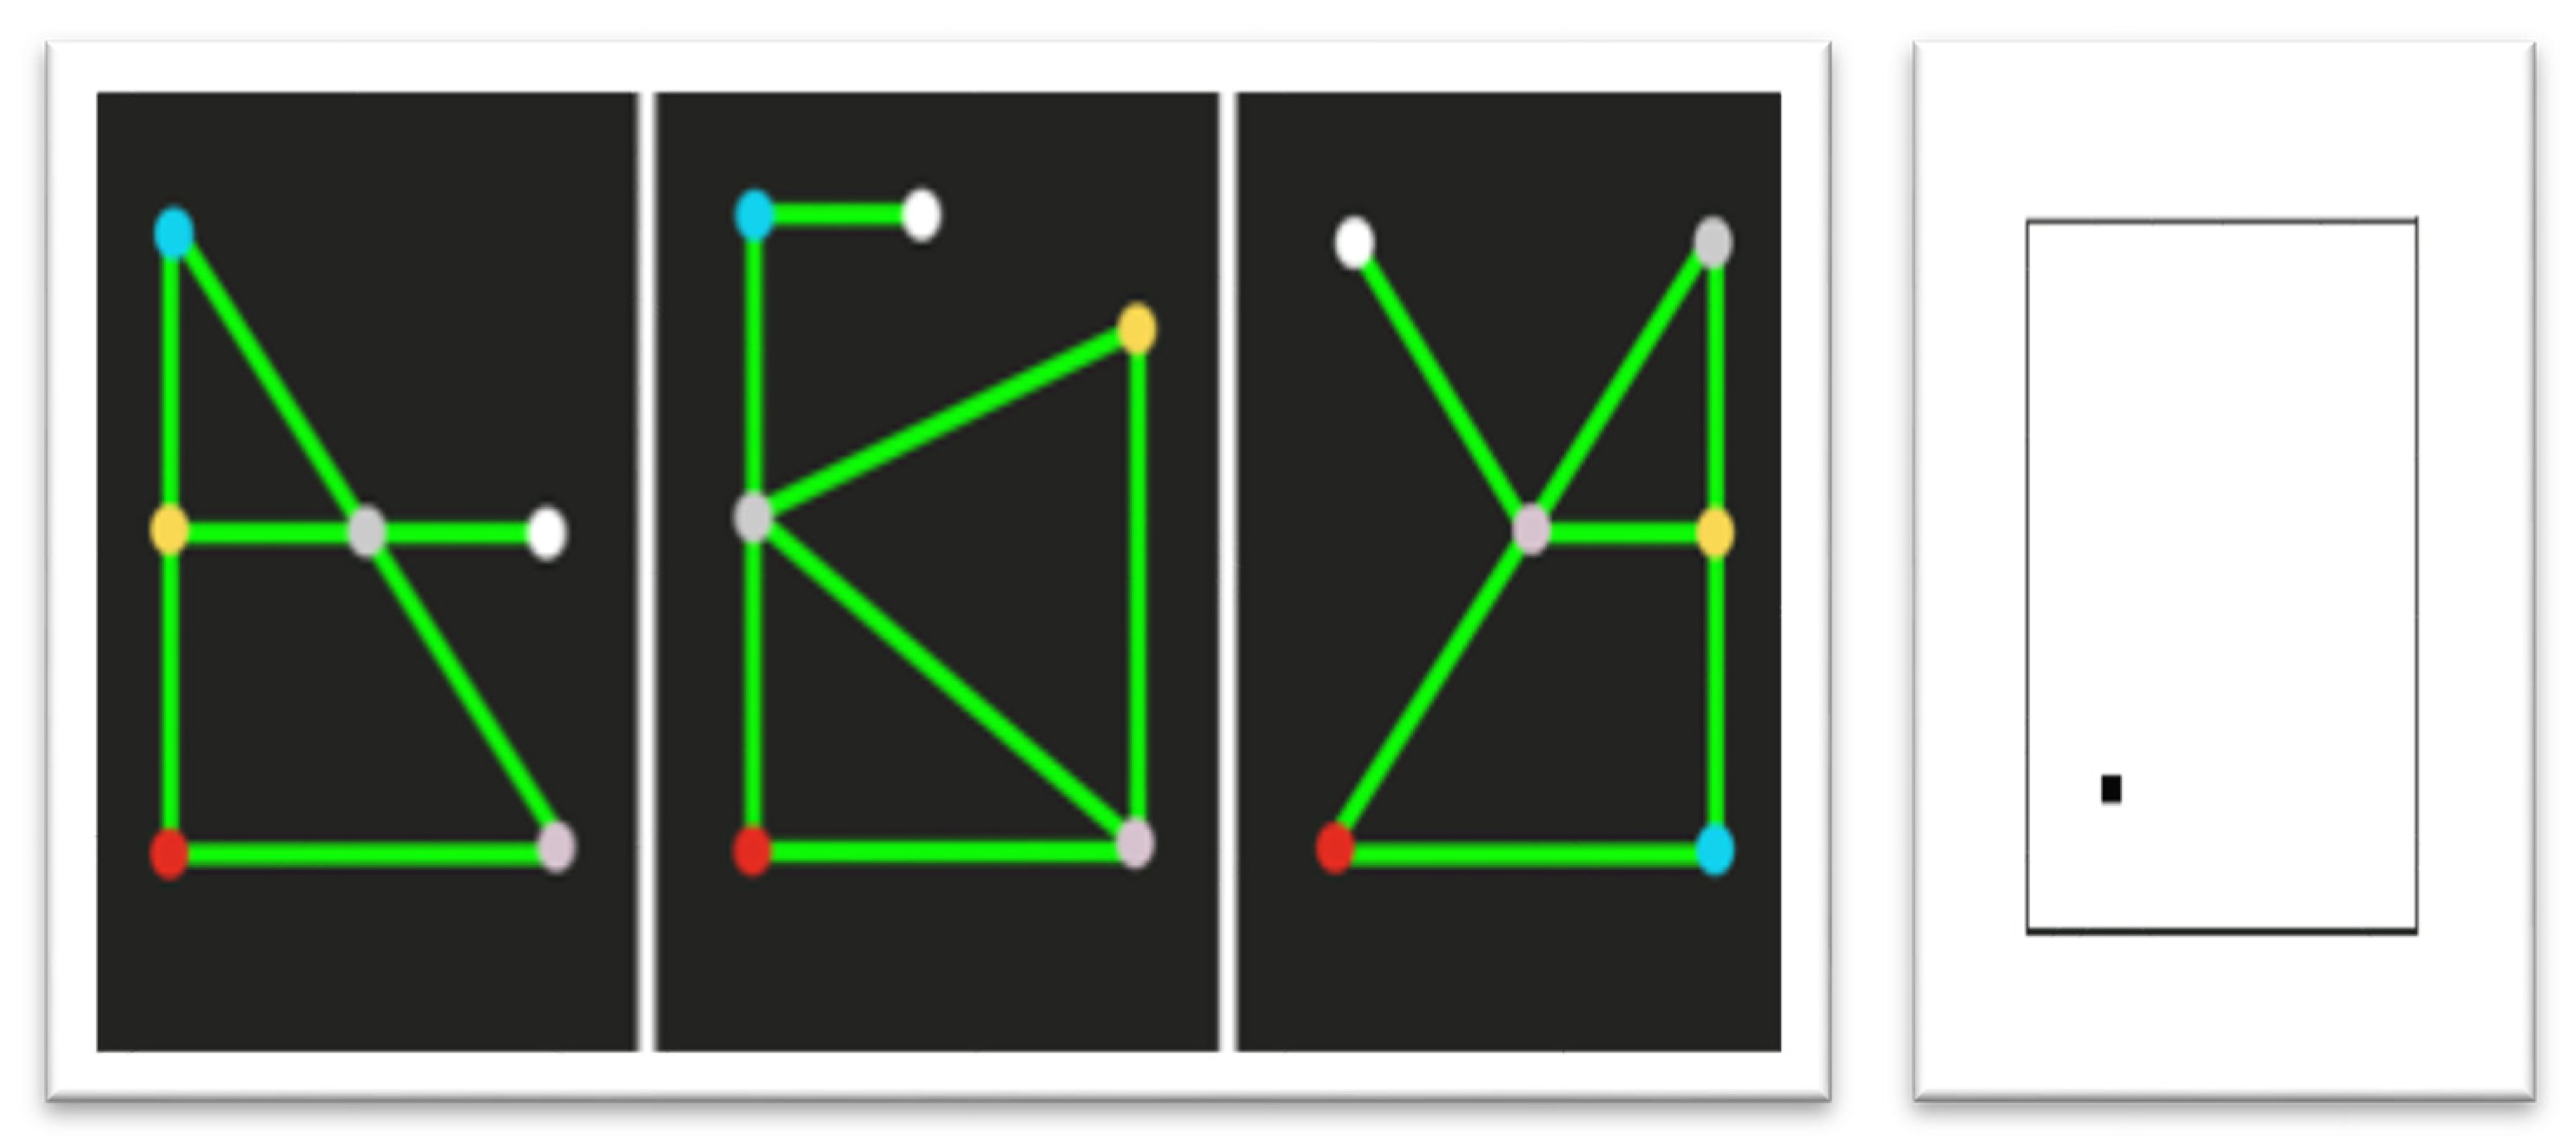
4.1.3. Stimulus and Apparatus

The stimulus set consisted of two different network-style maps (i.e., nodes and links). Each map was designed to represent a navigation scenario in a real-world environment (e.g., tracks and stations of a metro train(s) and shops in a shopping mall). Each map was composed of seven line segments, four landmarks, one dead-end, three two-way junctions, one three-way junction, and one four-way junction. As such, both maps had the same level of complexity but different topology (see Figure 2). In terms of spatial position, the overall width and height of the global structure of the map, the start location, and the horizontal line segment from the start location were matched across all four maps.
The experimental maps were rendered using a Samsung galaxy Tab-3 Android tablet. The graphical lines (e.g., road/transit-path/corridors) were rendered at a width of 4 mm. Intersections of lines (rendered with circles of 0.5-inch radii) indicated landmarks and were further emphasized via an auditory sine tone. Based on this logic, oriented lines were always rendered to be separated at an angle greater than 18° (which corresponds to a cord length of 4 mm). These design decisions were made in accordance with our previously established guidelines and parameters [30,31]. In addition to the experimental maps, two smaller maps (each with three landmarks and four line segments) were designed for use in a practice session.

4.1.4. Procedure

The study followed a within-subjects design with the participants first learning one map from each of the two learning-mode conditions and then performing a set of identical testing tasks. The condition orders were counterbalanced between participants, and the maps were randomized between conditions to eliminate learning/ordering effects. Each condition consisted of a training phase, a learning phase, a learning–criterion test, and a testing phase. To ensure consistency and avoid bias due to residual vision, all participants were blindfolded at the start of each trial.
Training Phase: Each of the map-learning conditions began with two training trials, in which the experimenter demonstrated how to use the map interface for that condition, explained their learning goals, and described how to perform the testing tasks. In the first training trial, participants explored a practice map, with corrective feedback given as necessary. They were instructed to visualize the network map as being analogous to a real-world map (such as a subway map or hotel floor layout depending on the landmarks). For instance, the first map was designed to mimic the Boston metro and included landmarks such as Logan Airport, Harvard Square, South Station, etc. The experimenter then conducted a mock test procedure to demonstrate the testing tasks that would be used during the experimental trials. In the second training trial, participants were blindfolded and were asked to learn the entirety of a practice map. Once the participant indicated that learning was complete (self-paced), the experimenter conducted a practice test phase as would be done in the actual experimental trials. In this phase, the experimenter immediately evaluated the testing tasks and gave corrective feedback as necessary to ensure that participants fully understood the tasks and the interface before moving on to the actual experimental trials. This protracted practice session was meant to limit unintended learning during the experimental trials and was found in previous studies using similar touchscreen-based vibro-audio stimuli to be both effective and important in mitigating subsequent confusion [12,13].
Learning Phase: During the learning phase, participants were first guided by the experimenter to place the index finger of their dominant hand at the start location. They were then instructed to freely explore the map, find the four landmarks, and let the experimenter know when they believed that they had learned the entire map. The names and number of landmarks were not given to them ahead of time, as this was evaluated during the learning–criterion test. Participants did not have any restriction on their hand movements or exploration strategies. This phase was intentionally designed to employ self-paced learning, versus using a fixed learning time, as the focus here was to capture the individual differences in learning behavior with respect to the two map-learning conditions. Once participants indicated that they had completed map learning, the experimenter removed the device and asked the participant to verbally report the number of landmarks on the map, including their names. If participants missed any landmark, they were given an additional 5 min period to re-explore the map. If they then reported correctly, they continued to the testing phase. A correct answer here (i.e., meeting the learning criterion) confirmed that all participants had accessed the entire map and had remembered the targets in each learning-mode condition, meaning that any subsequent differences in testing behavior would not be attributed to lack of information extraction during learning. All participants cleared the learning–criterion test in the first trial and were thus not required to perform additional learning periods.
Testing Phase: This phase consisted of three distinct spatial tasks: (1) a wayfinding task, (2) a pointing task, and (3) a map reconstruction task.
In the wayfinding task, participants were asked to trace the shortest route between two landmarks on the map by inferring and executing routes learned during the learning phase. No routes were specified or instructed during the previous phases, meaning the wayfinding process, if correct, required route planning and execution by accessing an accurate cognitive map. For each wayfinding task, participants were provided with the same map in the same mode they used for learning (i.e., either the VAM or hardcopy map). The experimenter then placed their dominant index finger at one of the landmarks and asked them to trace the shortest route to a designated target/destination landmark, e.g., “you are at Logan Airport, please trace a route to South Station.” In contrast to the learning mode, the landmark names were not indicated via speech output as the participants’ task was to trace the route to the designated target location using the shortest possible route and to state the landmark’s name once at this destination. To ‘walk’ this route, they were instructed to follow the lines of the map without taking shortcuts between lines. In each condition, participants performed a set of four wayfinding trials. Due to time constraints, not all route combinations were covered by each participant on each map, but the four trials covered all six vertices (four landmarks, a start location, and a dead-end) either as a route origin or a destination. This wayfinding task acts as a key measure for assessing cognitive map development as remembering and utilizing landmarks to define position of point(s) and planning and executing routes between these points, especially if previously untraveled, is an excellent indicator of cognitive map formation after map learning [38,39], with similar tasks also advocated for evaluating spatial learning with BVI individuals [37,45].
In the pointing task, participants indicated the allocentric direction between landmarks using a digital pointer affixed to a wooden board (see Figure 3). The pointing task consisted of a set of four pointing trials (e.g., “indicate the direction from elevator to lobby”). Similar to the wayfinding task, not all pairwise combinations were covered in each condition, but all six landmarks were tested (i.e., either pointed from or pointed to) within the four pointing trials per condition. The pointing trials were intentionally designed such that users must compute knowledge of non-route Euclidean information (i.e., perform mental rotation and computation within their cognitive map) to correctly indicate the allocentric direction between landmarks, a computation that is known to be challenging for BVI people, as the task requires use of non-egocentric, off-route spatial knowledge [61,62]. In addition, effective use of reference points is a key component in cognitive map development [63] and the pointing task used here directly measures the cognitive map accuracy by evaluating users’ ability to perform point referencing and accessing of a global spatial representation [63].
In the reconstruction task, participants were asked to reconstruct the map and label the vertices on a stainless-steel canvas mounted on the case of a tablet device (Figure 3). The reconstruction task is the strongest measure for assessing the accuracy of the cognitive map developed during the learning sequence, as correct reconstruction requires all spatial relations to be represented in a survey-type configuration [39]. Participants were asked to use bar-shaped magnets (indicating line segments) that they could affix on the canvas to recreate the map. Since distortion could occur during reconstruction, participants were provided with a reference frame, i.e., the start point was already indicated within the canvas.

4.2. Experiment 2: Evaluation with Sighted Users

Visual impairment is often only associated with people experiencing sensory impairments. However, this logic has neglected a broad range of situations were sighted individuals experience temporary/situational visual impairments. For instance, direct visual access to a touchscreen interface may be occluded in situationally induced impairments and disabilities (SIID) such as with the presence of glare or smoke. Such temporary loss of vision (or visual attention) may also occur in situations where users are multitasking, such as during manipulation of an in-vehicle infotainment display (e.g., interacting with control elements such as menus, buttons, and scroll bars) while also operating a vehicle. It is argued here that during such ‘eyes-free’ situations, haptic feedback can serve as the primary interaction mode for accessing onscreen information, similar to BVI users. Based on this argument, our prior work [30] derived generic haptic parameters and guidelines utilizing both sighted and BVI user groups. Building on the position advanced in this paper, the previously established guidelines involving sighted users should also be evaluated with a practical application (i.e., map learning) to assess the functional utility of this interface for supporting common, daily tasks. Experiment 2 was therefore designed to examine whether our vibro-audio maps (with graphical elements rendered based on the guidelines established from our earlier studies) represent a viable approach for assisting sighted users in situations where eyes-free spatial learning is required. As previously discussed, the inclusion of sighted learners in this way bucks the all-too-common trend of relegating multimodal research to those with sensory impairments and reinforces the value of universal and inclusive design.
Another important rationale for including sighted participants in this study is to address a theoretical question about the efficacy of utilizing blindfolded sighted people as a representative population for testing non-visual interfaces primarily designed for visually impaired users. Sighted participants are often not considered for testing non-visual interfaces, even when the perceptual aspects of the study are optimized for non-visual perception. However, earlier evaluations with the prototype vibro–audio interface across a range of tasks have demonstrated that the ability to access, learn, and mentally represent non-visual graphical material via touchscreen-based vibrotactile feedback is similar between blindfolded sighted and BVI users [12,13,64,65]. In aggregate, these results suggest that the ability to perform perceptual and cognitive tasks can be similar between the two groups, irrespective of visual status and visual experience. Although the results of the previous research found similarity between BVI and blindfolded sighted groups, the studies were primarily focused on perceptual and simple cognitive tasks, and not on behavioral tasks requiring development of cognitive maps to support complex spatial tasks used during real-world spatial learning and wayfinding scenarios, as is done here.
To address this issue, three learning-mode conditions were compared in this study: (1) the VAM, (2) a hardcopy tactile map, and (3) a visual map. The hardcopy condition was included here as a control for the touch modality to allow for a meaningful comparison against the BVI group (Experiment 1). In addition, a visual condition was included as the control condition for comparing cross-modal performance between visual and non-visual (haptic) map learning, something that has been poorly studied. To control the perceptual aspects between the three conditions (i.e., one finger touch access in the VAM and hardcopy condition versus visual access in the visual condition), the visual field of view was matched to the other conditions such that the map elements were provided only through a narrow viewing window of roughly 80 sq. mm that appeared above the participant’s finger contact location on the screen (see Figure 4). This viewing aperture is roughly analogous to the contact patch of the fingertip touching the screen when extracting non-visual information using the VAM. This provision was taken to (1) match the visual and haptic field of view and (2) enforce sequential learning between conditions so the visual map access matched how the information was accessed with the VAM, which relies on the use of the previously discussed EPs for graphical information extraction. Single finger exploration (whether through touch or an analogous visual viewing window) is highly cognitively demanding since it requires increased working memory to understand graphical information in its entirety, as the spatial information must be integrated across space and time during prolonged exploration of the entire map. The logic here is that the level of learning in each condition is information matched and controlled (via a learning criterion test), with the only difference between conditions being the interface for information delivery. This design ensured that the similarity (or difference) in behavioral performance observed at test between the three map-learning conditions is not biased by participant’s visual status or by differential information access between map-learning modes.

4.2.1. Participants

In total, 16 sighted participants (8 females and 8 males, ages 19–32) were recruited for this experiment. Participants were blindfolded during the VAM and the hardcopy condition, but not during the visual condition. The studies were reviewed and approved by the University of Maine Institutional Review Board and all participants provided their written informed consent to participate in this study.

4.2.2. Conditions, Stimulus, and Procedure

Three learning-mode conditions were designed and evaluated for this study: (1) the VAM, (2) a hardcopy map overlay, and (3) a visual interface. The VAM and hardcopy conditions were identical to those used in Experiment 1. For the visual map-learning condition, the visual map elements were provided through an 80 sq. mm viewing window (see Figure 4), which matched the map information that was visually accessible with what could be accessed from the haptic field of view using the VAM. The auditory feedback was identical to the other two conditions, but no extrinsic haptic (vibration) feedback was provided (except for the cutaneous information derived from the finger’s contact with the device’s flat glass screen). Similar to the other conditions, the user’s finger movement behavior was logged within the device and used for measuring learning time and analyzing tracing strategies. In addition to the two maps used in Experiment 1, a third map of equal complexity was included in this study to balance the three conditions. The map represented landmarks along a corridor layout of a hotel building (e.g., elevator, lobby, restroom, and stairwell).
The procedure was similar to that of Experiment 1, where in each of the three conditions, participants learned one map and performed the same subsequent testing tasks (as described in Section 4.1.4). Each condition consisted of a training phase, a learning phase, a learning–criterion test, and a testing phase. The learning and testing phase were identical to Experiment 1, with the only procedural difference being the map reconstruction task. Rather than manipulating physical map elements as in Experiment 1, participants were asked to draw the map and label the vertices on a template canvas (as in Figure 5) matching the size of the device’s screen. This procedural modification was deemed as being more natural for sighted users and, importantly, allowed us to perform more robust map scoring statistics on the reproductions, as described below. Participants were blindfolded (except for the visual condition) during the three phases and were asked to remove it for the reconstruction task. For the visual map condition, participants were allowed visual access during all three study phases. As in Experiment 1, the reconstruction accuracy was measured by comparing the participant’s drawn map from the reconstruction task against the experimental map with discrete scoring, as described in Section 4.1.4. However, map analysis in this experiment also relied on a robust analytic procedure called bi-dimensional regression [66,67]. For this analysis, six anchor points were selected from each of the maps (i.e., start, dead-end, and the four landmarks). The degree of correspondence of these anchor points between the actual map and the reconstructed map were then analyzed based on three factors: (1) scale, (2) theta, and (3) distortion index. The scale factor indicates the magnitude of contraction or expansion of the reconstructed map. The theta value determines how much and in which direction the reconstructed map was rotated with respect to the actual map. The distortion index is a standardized measure of the overall difference between the reconstructed map and original map. This analysis was not appropriate for maps recreated in Experiment 1 as the size (i.e., length) of the magnets used were fixed, leading to unavoidable scale and shape consistencies.

5. Results

Five dependent measures were evaluated as a function of the two map-learning conditions in both experiments: learning time, wayfinding accuracy, wayfinding sequence (a comparison of the routes traced during learning vs. executed during testing), relative directional accuracy, and reconstruction accuracy. A set of repeated measures ANOVAs were conducted on each of the measures, based on an alpha of 0.05. The results are as follows.

5.1. Results from Experiment 1: BVI Users

5.1.1. Learning Time

The learning time for each trial was measured from the log files and is defined as the time from the moment the participant first touched the start location until they verbally indicated that they completed learning, i.e., were confident that they had learned the entire map and landmarks. Overall, the learning time ranged from ~1.5 min to ~9 min, with a mean of ∼6.5 min. Results (Table 3 and Table 4) suggested that the hardcopy map-learning condition was faster than the VAM condition. The greater learning time for the VAM condition (see Figure 6) is not surprising based on previous studies with similar vibro-audio touchscreen-based interfaces [6,12,13]. This finding is attributed to the use of indirect tactual perception, as discussed in Section 1, which involves a slower extraction process that involves associating the vibrational feedback with the on-screen graphical line as opposed to doing so using direct tactual perception through feeling a physically embossed line. Importantly, as evidenced by the similarity in the other test measures, differences in learning time are not related to differences in extent or accuracy of learning.

5.1.2. Wayfinding Accuracy

Wayfinding accuracy was measured by extracting the sequence of users’ finger movements (i.e., the path they traced on the map) from the log files generated in each wayfinding trial at test. There were instances where two landmarks had more than one route option (i.e., an optimal shortest route and a second suboptimal longer route). Both route options are considered here as a correct response. The route efficiency measure was not analyzed separately, as there was only one instance in the VAM condition where participants traced a correct (but suboptimal) route. A discrete scoring was applied based on correctness of user response (i.e., 1 if traced correctly, 0 if not). ANOVA results revealed that the wayfinding accuracy between the two conditions was not statistically different (F (1, 94) = 1.09, p > 0.05). This finding demonstrates that, irrespective of the type of haptic map used during learning, both conditions resulted in functionally similar wayfinding performance, suggesting that the cognitive maps developed from learning with the VAM were as accurate and accessible for supporting subsequent navigation and spatial behaviors as those formed after learning from traditional hardcopy maps.

5.1.3. Wayfinding Sequence

The sequence of landmarks traced by participants during the wayfinding test trials were compared with the sequences of landmarks traced during map exploration during the learning phase. This comparison was carried out to assess whether participants’ wayfinding accuracy at test could be accounted for by tracing of the same route during learning. If participants were merely replicating a route following strategy at test based on recall of that route from the learning phase (e.g., Logan Airport to South Station), it could be argued that their test performance only relied on route knowledge rather than accessing an accurate cognitive map. Route memory is based on simpler spatial computations than cognitive maps, with the former only requiring recall of distance and turn angles vs. inferring routes from a viewer-independent survey-like representation [39]. Neuroimaging evidence supports this behavioral distinction, as the use of route knowledge is served by different underlying neural mechanisms in the brain than the development and use of cognitive maps [68]. As such, this analysis is important for characterizing the nature of the spatial representation built up from map learning. A discrete scoring was applied based on whether the route taken in test trials was also traced during learning (i.e., 1 if traced during learning, 0 if not). As is shown in Table 3, results revealed that a significant percent (i.e., 72% in the VAM condition and 54% in the hardcopy condition) of the routes executed during testing had not been previously experienced during the learning phase. This trend was true for both learning-mode conditions and there was no statistical difference between either condition (F (1, 94) = 3.14, p > 0.05). This outcome clearly suggests that participants were not simply using route memory to perform test trials but were able to perform the wayfinding and spatial inference tasks based on accessing well-formed cognitive maps built up from the learning phase.

5.1.4. Relative Directional Accuracy

Relative directional accuracy was defined as the accuracy in performing allocentric pointing judgments between landmarks. Absolute angular errors were measured by calculating the difference between the angles reproduced by the participants and the actual angles. ANOVA results (see Table 4) revealed that the unsigned error in pointing judgements reliably differed between the two map-learning conditions (F (1, 94) = 4.5, p < 0.05). While pointing accuracy was quite good for both conditions, error after learning with the hardcopy tactile map (M = 9.78°) was statistically worse as compared to learning in the VAM condition (M = 6.5°). This result not only supports the efficacy of the VAM, but it also shows that learning with the VAM actually leads to numerically superior pointing performance than after learning with hardcopy maps, evidence that further supports the veracity of the underlying cognitive map built up from VAM exploration.

5.1.5. Reconstruction Accuracy

Reconstruction accuracy was measured by comparing the participant’s recreated map from the reconstruction task against the experimental map. Reconstruction is a robust measure because it serves as the closest physical representation of the participant’s internal cognitive map, with recreation performance validating if an accurate mental model was developed [35,39,69]. A discrete scoring was employed (i.e., 1 if correct, 0 if not) based on whether participants accurately recreated the global spatial pattern and topology between all lines used to construct the map. The results, as shown in Table 4, revealed that the accuracy in map reconstruction did not reliably differ between the two learning-mode conditions (F (1, 22) = 0, p > 0.05). These null results are important as they suggest that participants were not only able to accurately learn using the prototype VAM, but also that the ability to recreate the physical maps from memory did not differ between VAM and hardcopy tactile map exposure, providing the strongest evidence from our data of functionally equivalent cognitive maps built up from both learning modes.

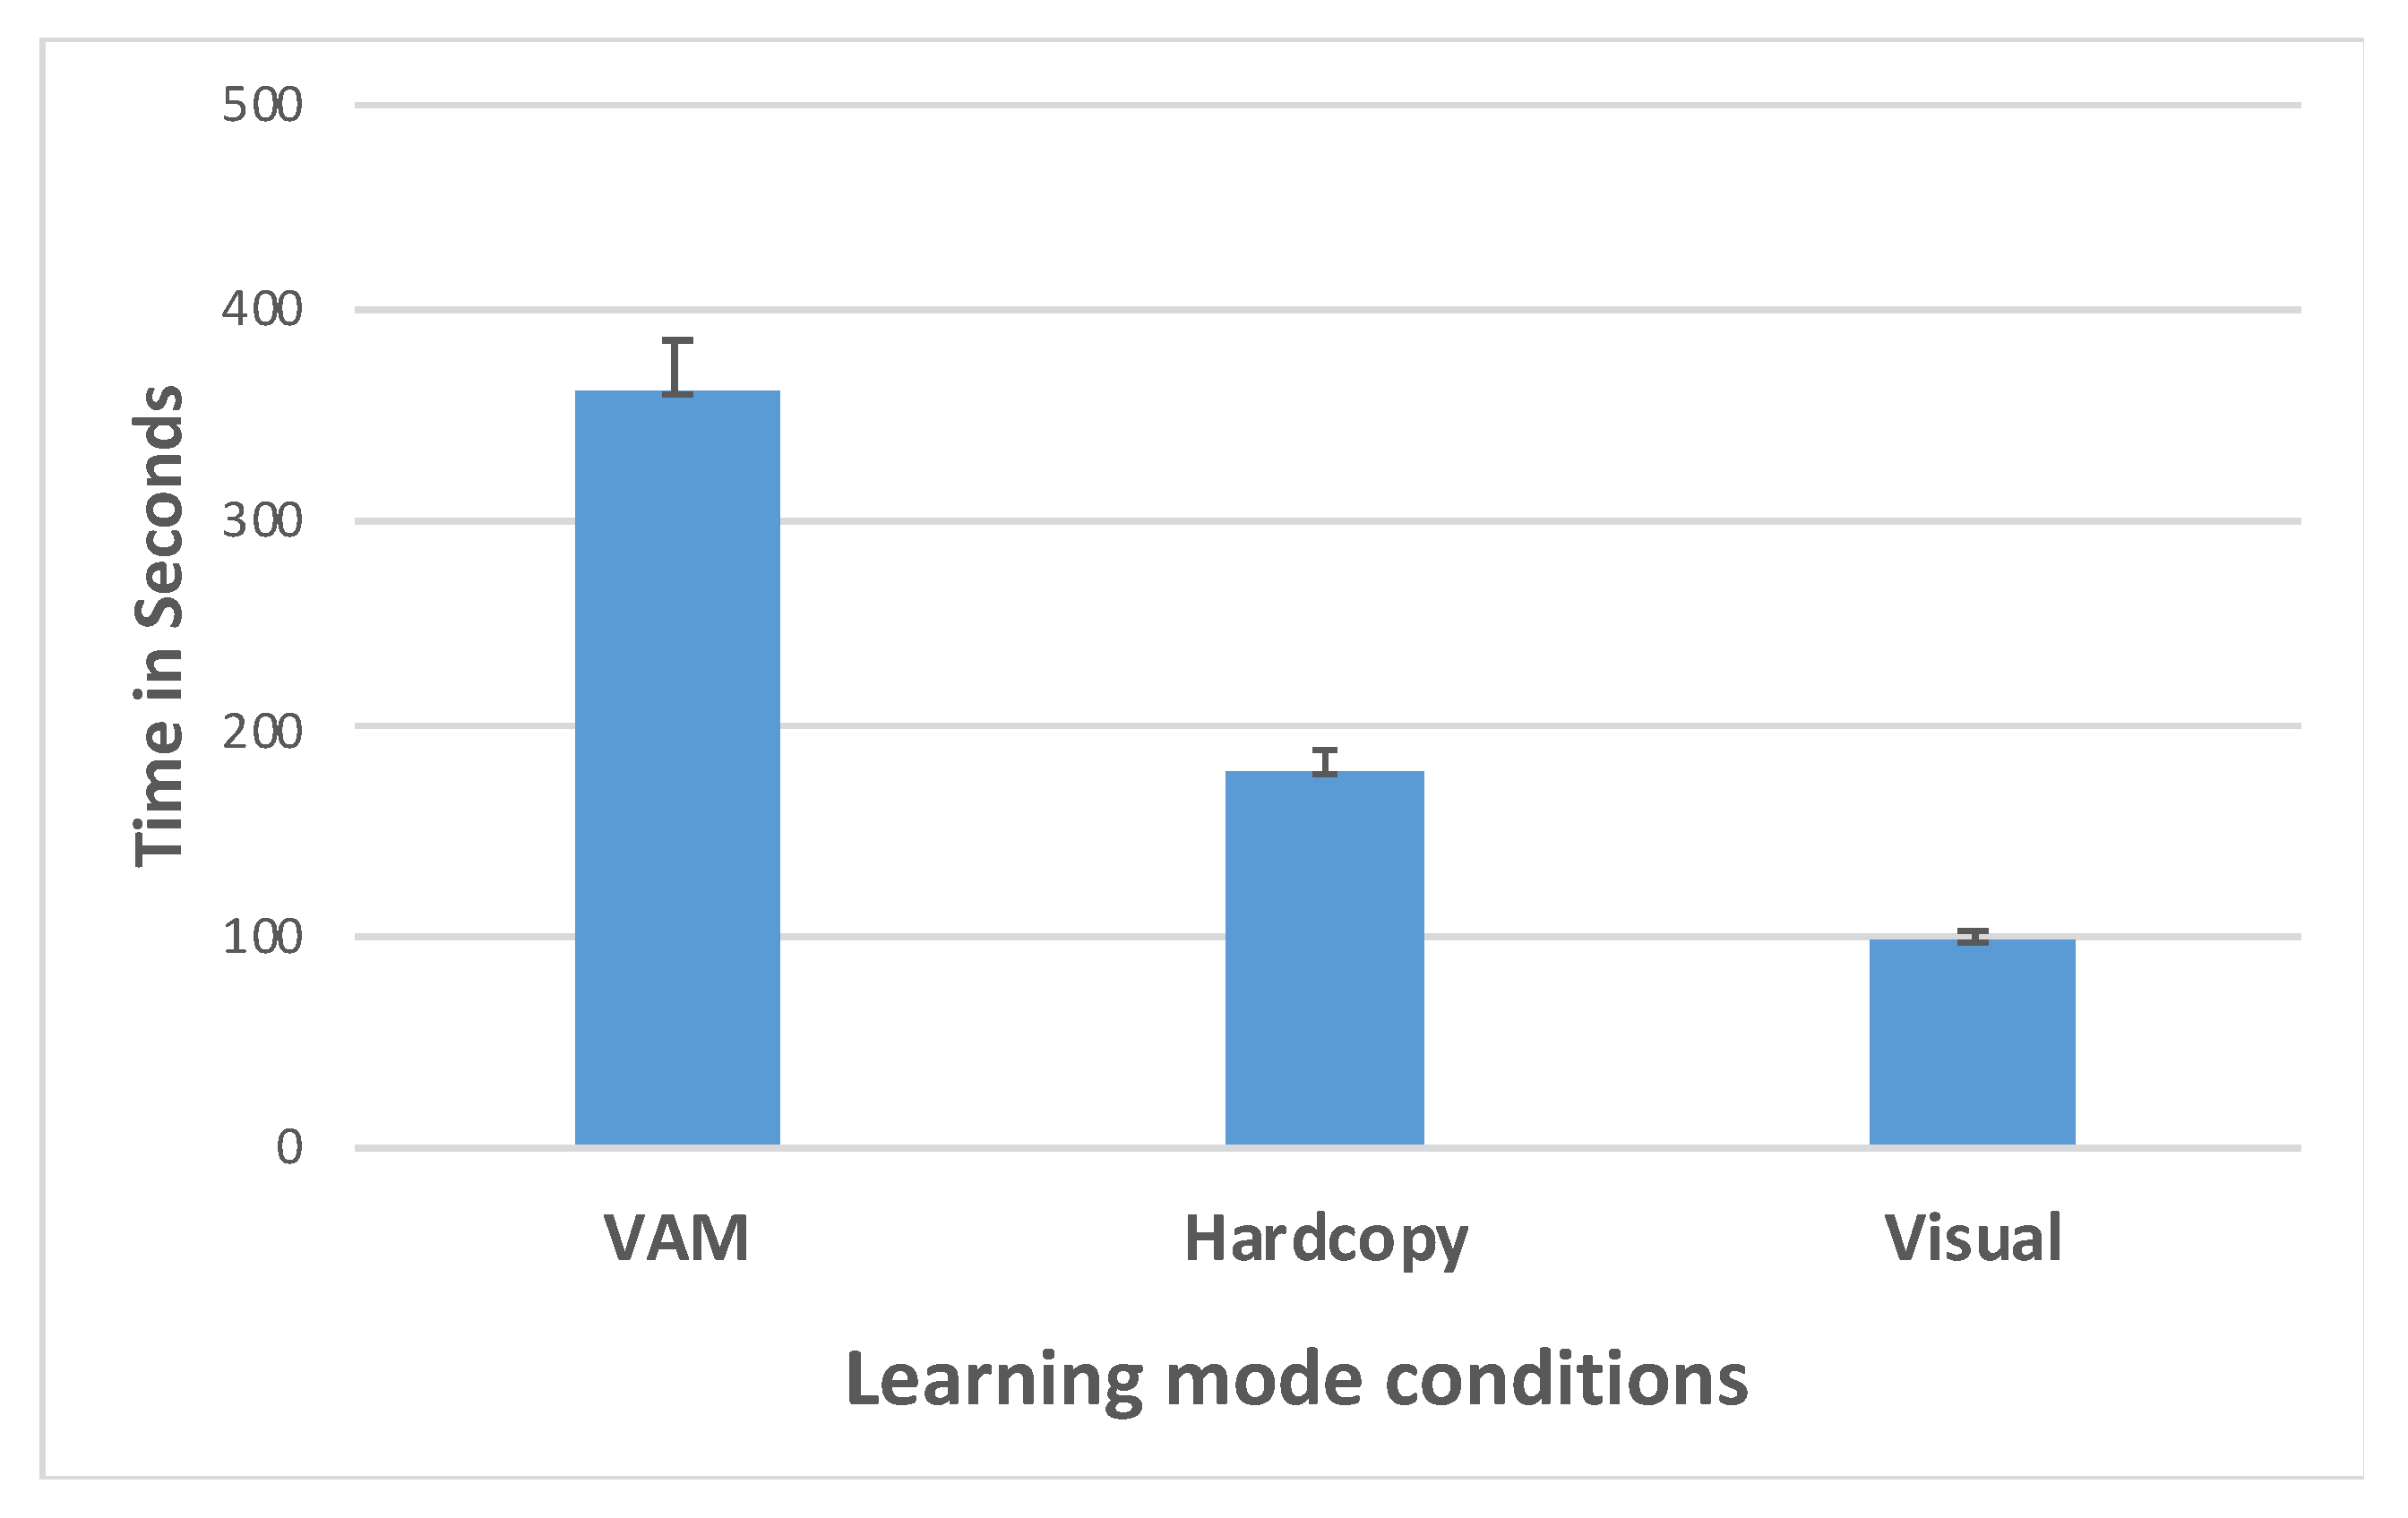
5.2. Results from Experiment 2: Blindfolded Sighted Users

As shown in Table 5 and Table 6, results did not reveal any significant differences between map conditions across any of the performance measures. The only statistical difference was found with learning time, which was not unexpected or particularly meaningful, as discussed in Section 5.1. In aggregate, these null results (except for learning time as shown in Figure 7) are important as they suggest that participants were not only able to accurately learn using the prototype VAM, but that the ensuing cognitive map also supported functionally similar performance to the other two map-learning conditions across all testing measures. Overall, these findings serve as strong evidence supporting cross-modal similarity and demonstrate that haptic feedback is a viable approach for assisting sighted users in situations where eyes-free spatial learning is required.

5.3. Comparison between Participant Groups

As stated earlier, one goal of this study was to compare and examine the similarity/difference in spatio-behavioral performance between the sighted and BVI participant groups. The visual condition from Experiment 2 was excluded for this analysis in order to directly match the Experiment 2 conditions with the analogous conditions from Experiment 1.
A mixed factorial ANOVA comparing the two participant groups (Table 7) across the tested measures between subjects (grouped by learning-mode condition), indicated that performance between the two groups did not statistically differ, except for the learning time measure with hardcopy map learning. In this condition, learning time for sighted participants (M = 178.9 s) was significantly higher than that exhibited by the BVI participants (M = 130 s). This time difference (see Figure 8) could be attributed to more prior experience and increased implicit knowledge of BVI participants with haptic learning than their sighted counterparts. It should be noted that this difference was not observed for the VAM condition, which logically follows as both groups did not have prior experience with the interface. These findings suggest that any observed time differences were not due to a difference in perceptual capability between the groups but rather due to differential experience and familiarity interacting with haptic stimuli. Overall, the most important outcome of this analysis was the finding that the spatio-behavioral test performance across all measures was similar (i.e., statistically indistinguishable) between the two participant groups. These findings provide empirical corroboration in support of our theoretical motivation that, when perceptual parameters of the learning stimuli are matched, it is possible to form accurate cognitive maps that support functionally equivalent behavioral performance between participant groups, irrespective of their visual status.

6. Discussion and Future Work

The overarching goal of this research program is to mitigate the perceptual, cognitive, and behavioral challenges imposed by touchscreen-based information access and to advance the multisensory aspects of this technology as a viable solution for supporting both sighted and visually impaired users in non-visual and/or eyes-free information access scenarios. Previous work has evaluated a range of fundamental parameters supporting accurate perception and interpretation of vibrotactile stimuli on touchscreens and based on these data, a number of core design principles have been advanced for optimizing how graphical materials should be rendered on touchscreen-based smart devices using this mode of haptic interaction [30,31]. The goal of the current work, representing a translational path of the basic research, was to investigate whether schematizing (and rendering) vibro-audio maps based on these previously established guidelines leads to the development of accurate cognitive maps for both sighted and BVI people that support subsequent spatio-behavioral tasks relevant to real-world scenarios, i.e., navigation, wayfinding, and allocentric pointing. To this end, two experiments were conducted that compared map learning and spatio-behavioral performance across a battery of spatial tasks involving both BVI and sighted participants. The most important outcomes from the two experiments are as follows:
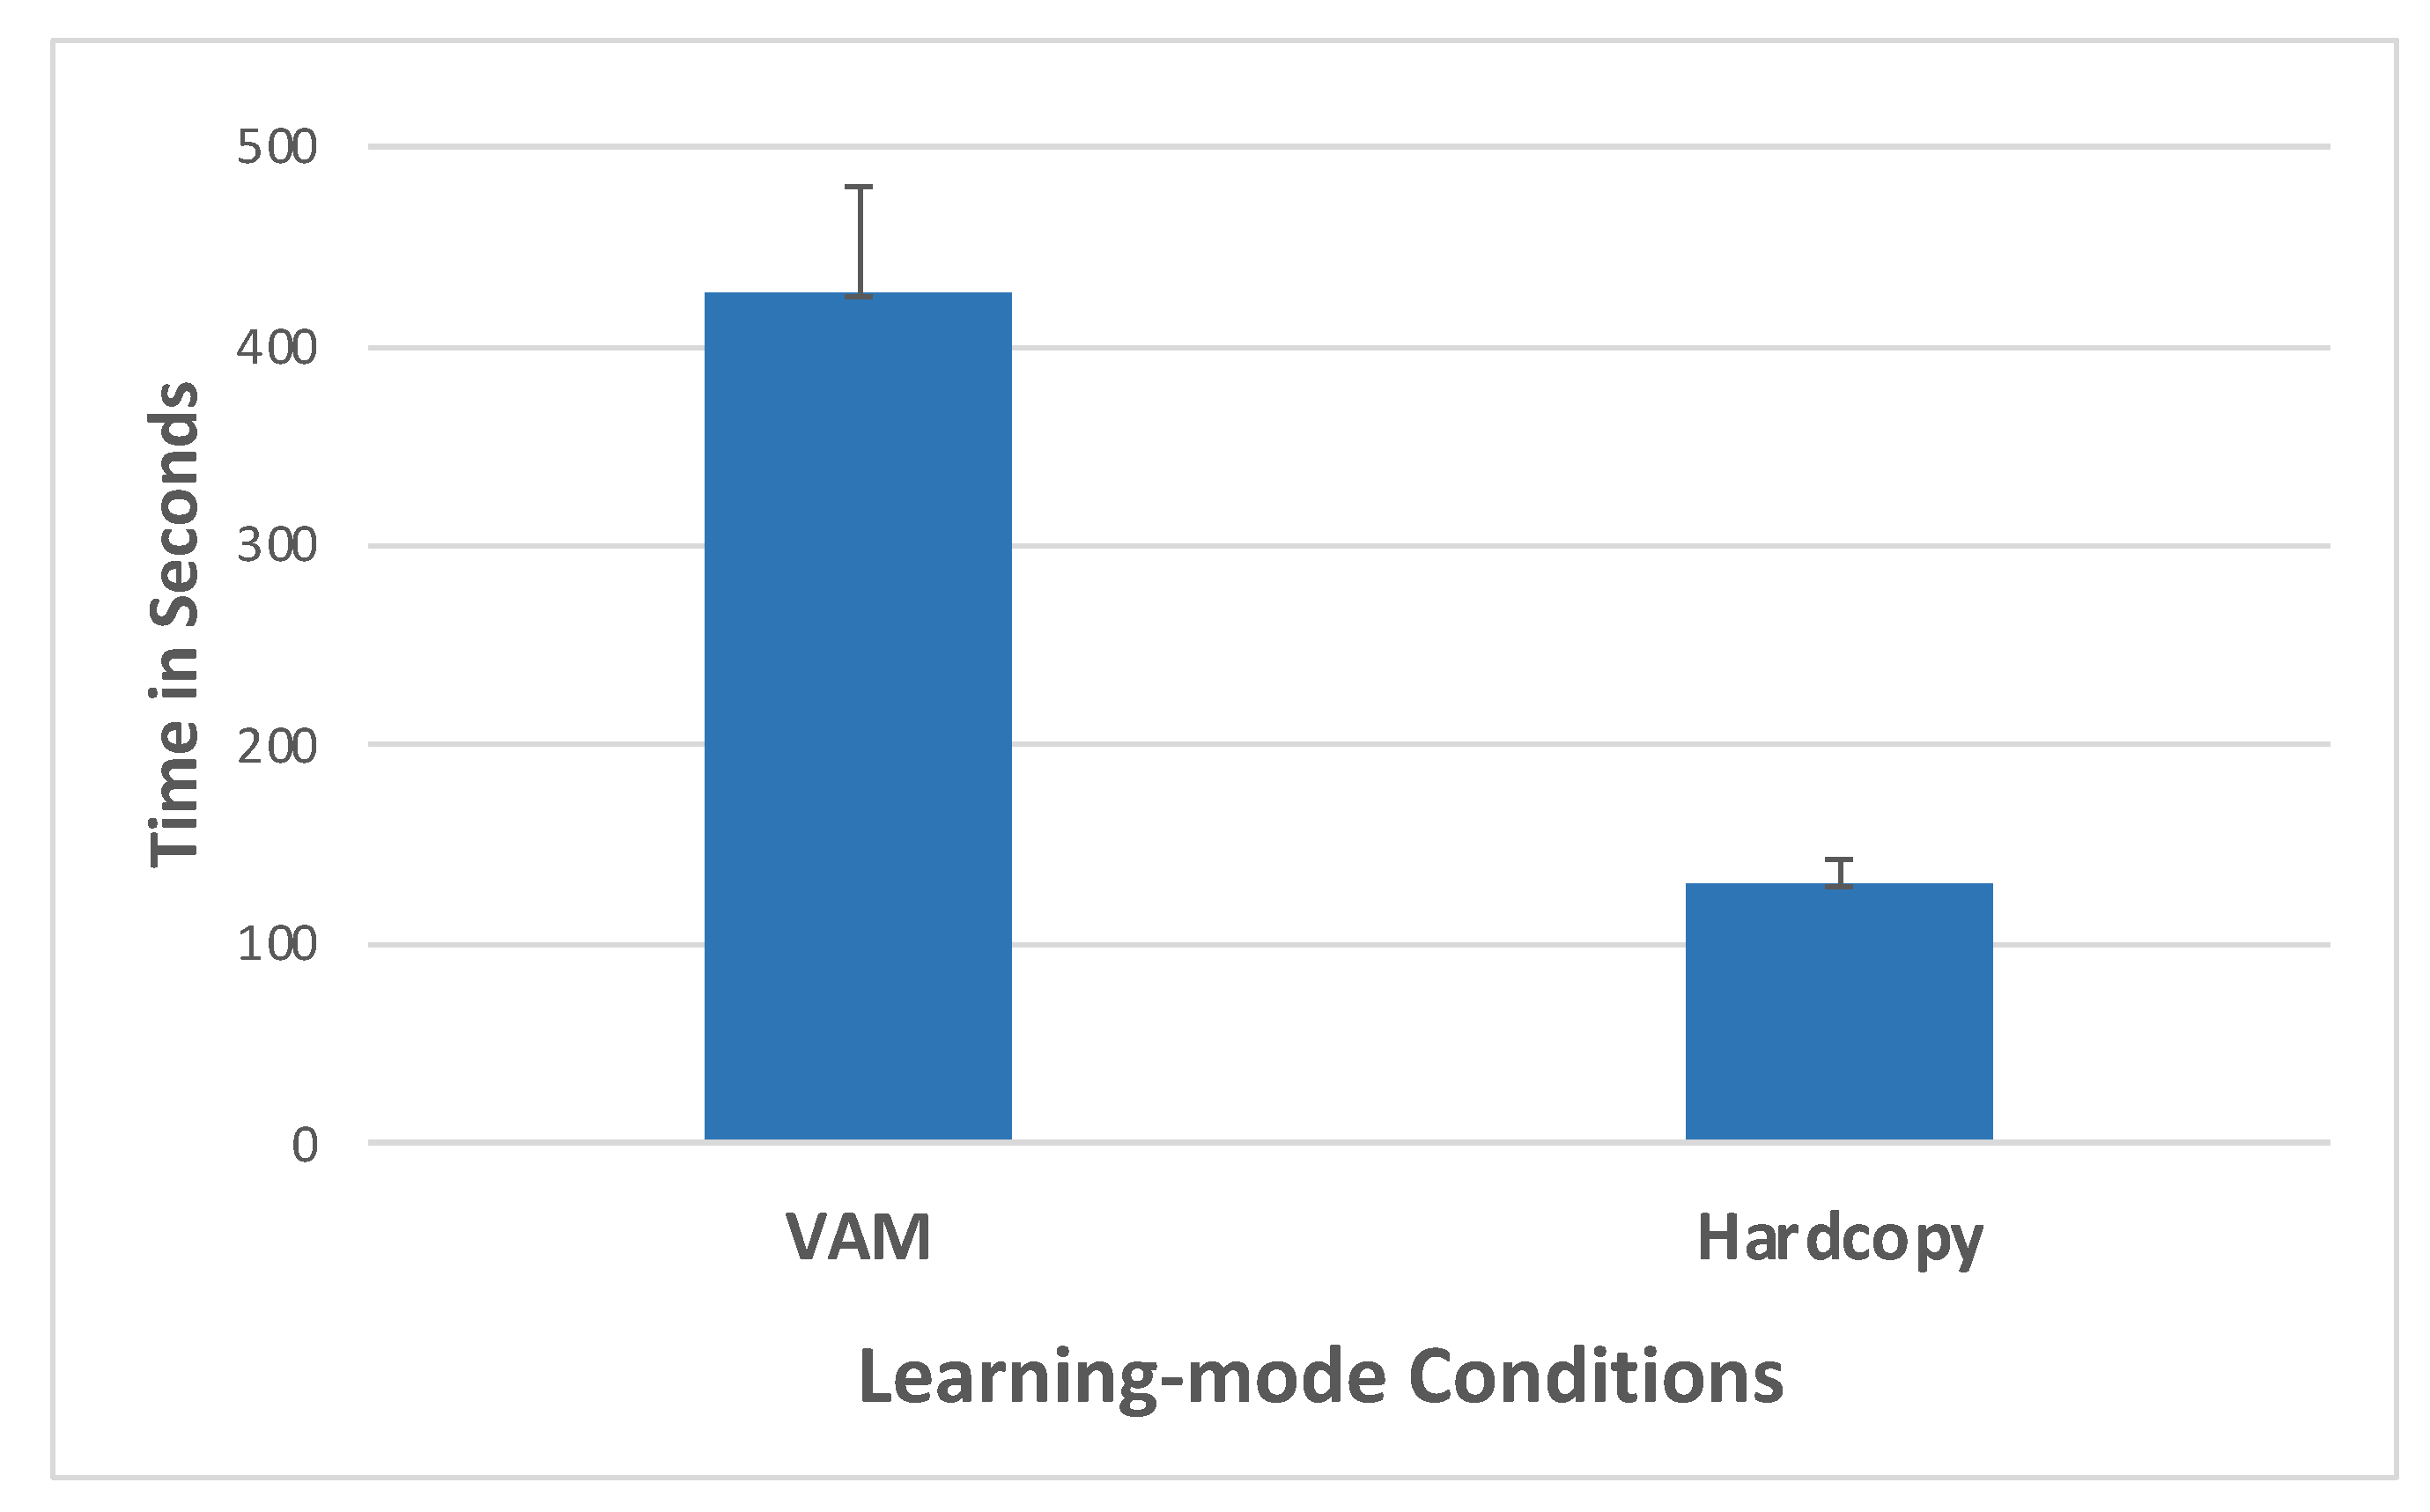
  • Evidence that incorporating our previously established perceptual parameters and design guidelines yield significant performance improvements in learning and spatial behaviors. For example, the pointing errors with the VAM were significantly less than the average ~18° pointing errors reported in an earlier study using a touchscreen-based haptic interface not optimized with the current parameters [13]. Although learning with the VAM took longer than learning with traditional hardcopy tactile maps, these temporal differences were narrowed in the current studies, where learning with the VAM was notably faster than has been found in previous research. For instance, average learning time was ~6.5 min in the current studies, whereas participants in previous work evaluating touchscreen-based vibration and auditory cues not optimized with the parameters took an average of ~15 min to learn maps of similar complexity [11,12,70,71]. Taken together, these findings suggest that the previously established perceptual parameters and design guidelines for use on touchscreen-based non-visual interfaces (e.g., our prototype vibro-audio map) have positively influenced user behavior, both in terms of temporal performance and spatial accuracy.
  • Results provide compelling evidence for the similarity of spatio-behavioral performance across all test measures when using the VAM vs. traditional hardcopy tactile maps. This outcome not only supports the efficacy of the VAM (and touchscreen-based haptic feedback more generally) as a viable new solution for conveying graphical information, but it also suggests that it can be used as effectively as traditional non-visual maps. The similar (or better) behavioral performance observed across testing measures and experiments for the VAM suggests that the cognitive maps built up from VAM learning were at least as accurate as those formed by learning with the hardcopy tactile maps. Beyond supporting the VAM as a viable new interface, this lack of reliable difference is of theoretical interest because the similarity of performance between the two tactile (haptic) conditions speaks to the ability of both channels to support cognitive map development, despite employing information extraction and pick-up from different sensory receptors (pressure-activated mechanoreceptors versus vibration-sensitive Pacinian corpuscles) and feedback mechanisms (intrinsic perceptual feedback as opposed to extrinsic vibratory feedback).
  • Results provide compelling evidence for the similarity of spatio-behavioral performance when using the VAM between BVI participants and blindfolded sighted participants during haptic map learning. The lack of reliable statistical differences observed between Experiments 1 and 2 suggest that non-visual map learning and subsequent spatio-behavioral task performance based on the ensuing cognitive map is not dependent on the presence or absence of vision. We interpret these functionally similar findings between sighted and BVI participants as: (1) Providing support against the conventional view that BVI spatial performance is impoverished with respect to their sighted peers (for reviews, see [36,42,69]). Indeed, the current findings are congruent with a growing body of evidence showing highly similar performance on spatial tasks between these groups when sufficient information is available through non-visual spatial supports [56,72,73]. (2) Showing that sighted users stand to greatly benefit from haptic-based interfaces and increased research interest, especially in eyes-free scenarios. (3) Demonstrating that valid data are possible from blindfolded sighted participants in non-visual studies when sufficient training is provided.
  • The results provide compelling evidence that visual map learning and haptic map learning are functionally equivalent for developing accurate cognitive maps and supporting spatial behaviors when matched for information content. The statistically indistinguishable test performance observed here after haptic and visual map learning in Experiment 2 is consistent with the view that spatial learning from different sensory inputs, when matched for information content as we did here, leads to the development and use of sensory-independent, amodal representations of space in memory [55,74]. The similarity observed between blind and sighted participants across experiments, as discussed in the previous point, provides additional evidence for the notion of developing and accessing of a sensory-independent spatial representation that functions equivalently in the service of action. This interpretation is consistent with a growing corpus of data from other studies comparing performance by blindfolded sighted and BVI users on the same tasks after visual and tactile learning, e.g., of simple route maps [56], bar graphs and shapes [6], indoor floor maps [13], and spatial path patterns [65].
It should be noted that the scope of the current research was regulated to rectilinear line (and polyline) features of graphical materials. The established parameters and guidelines (from our earlier studies) were also based only on rectilinear line-based graphical information. As such, these parameters, guidelines, and results cannot be generalized to other types of graphical elements such as polygons/regions (e.g., rooms in a building, pie charts, geometric shapes, etc.). Outcomes of the current research are a first step towards measurable effects of successful generalized visual-to-haptic schematization. Future work will focus on empirically identifying the parameters and guidelines for other complex graphical elements and their application to additional use scenarios. Similarly, given that the perceptual parameters evaluated in this work utilized vibration as the primary feedback mode, use of other touchscreen-based extrinsic feedback mechanisms (e.g., audio or electrostatic cues), along with enhanced visual cues (e.g., magnification and high-contrast color schemes) for multimodal learners or for people with low or residual vision will be explored in the future.

7. Conclusions

Our research program ultimately aims to address the longstanding graphical access issue faced by millions of blind and visually impaired (BVI) people through development of a viable touchscreen-based multimodal graphical access solution. In aggregate, the combined findings from our research (i.e., the earlier psychophysically motivated usability studies and the two studies presented in this paper) strongly support the importance of, and need for, principled schematization of touchscreen-based graphical materials by considering the perceptual and spatio-cognitive abilities of the human end-user. Optimizing multimodal touchscreen-based interactions on the basis of these findings, as we did here with a haptic (vibrotactile) interface, opens the door to many new non-visual applications. The most immediate impacts being their potential as a solution for providing real-time information access for millions of BVI users, as well as for supporting sighted users needing to perform tasks in the dark or in eyes-free situations.

Author Contributions

Conceptualization, H.P.P. and N.A.G.; methodology, H.P.P. and N.A.G.; software, H.P.P.; writing—original draft preparation, H.P.P.; writing—review and editing, H.P.P., P.D.S.F. and N.A.G.; supervision, N.A.G.; project administration, N.A.G.; funding acquisition, N.A.G. All authors have read and agreed to the published version of the manuscript.

Funding

This research was sponsored by NSF Grants CHS-#1425337 and CHS-#1910603, to N.A.G.

Institutional Review Board Statement

The study was conducted according to the guidelines of the Declaration of Helsinki and approved by the Institutional Review Board (Ethics Committee) of The University of Maine (protocol appl 2014-06-12, original approval date of 18 June 2014).

Informed Consent Statement

Informed consent was obtained from all subjects involved in the study. The datasets generated for this study are available on request to the corresponding author.

Data Availability Statement

Not applicable.

Conflicts of Interest

The authors declare no conflict of interest. The funders had no role in the design of the study; in the collection, analyses, or interpretation of data; in the writing of the manuscript, or in the decision to publish the results.

References

  1. World Health Organization. Visual Impairment and Blindness Fact Sheet; World Health Organization: Geneva, Switzerland, 2018. [Google Scholar]
  2. Bourne, R.R.; Adelson, J.; Flaxman, S.; Briant, P.; Bottone, M.; Vos, T.; Naidoo, K.; Braithwaite, T.; Cicinelli, M.; Jonas, J. Global Prevalence of Blindness and Distance and Near Vision Impairment in 2020: Progress towards the Vision 2020 targets and what the future holds. Investig. Ophthalmol. Vis. Sci. 2020, 61, 2317. [Google Scholar]
  3. Apple. Apple VoiceOver. Available online: www.apple.com/accessibility/voiceover/ (accessed on 10 March 2019).
  4. JAWS. Available online: www.freedomscientific.com (accessed on 10 March 2019).
  5. WebAim. WebAim: Screen Reader User Survey #5 Results. Available online: http://webaim.org/projects/screenreadersurvey5/ (accessed on 8 January 2018).
  6. Giudice, N.A.; Palani, H.; Brenner, E.; Kramer, K.M. Learning Non-Visual Graphical Information using a Touch-Based Vibro-Audio Interface. In Proceedings of the 14th International ACM SIGACCESS Conference on Computers and Accessibility (Assets’12), Boulder, CO, USA, 22–24 October 2012; ACM: New York, NY, USA, 2012; pp. 103–110. [Google Scholar]
  7. Klatzky, R.L.; Giudice, N.A.; Bennett, C.R.; Loomis, J.M. Touch-Screen Technology for the Dynamic Display of 2D Spatial Information Without Vision: Promise and progress. Multisens. Res. 2014, 27, 359–378. [Google Scholar] [CrossRef] [Green Version]
  8. Tennison, J.L.; Gorlewicz, J.L. Non-visual Perception of Lines on a Multimodal Touchscreen Tablet. ACM Trans. Appl. Percept. 2019, 16, 1–19. [Google Scholar] [CrossRef]
  9. Tennison, J.L.; Carril, Z.S.; Giudice, N.A.; Gorlewicz, J.L. Comparing graphical pattern matching on tablets and phones: Large screens are not necessarily better. Optom. Vis. Sci. 2018, 95, 720–726. [Google Scholar] [CrossRef] [Green Version]
  10. Tennison, J.L.; Gorlewicz, J.L. Toward Non-visual Graphics Representations on Vibratory Touchscreens: Shape Exploration and Identification. In Proceedings of the 10th International EuroHaptics Conference, London, UK, 4–7 July 2016; pp. 384–395. [Google Scholar]
  11. Poppinga, B.; Magnusson, C.; Pielot, M.; Rassmus-Gröhn, K. TouchOver map: Audio-tactile exploration of interactive maps. In Proceedings of the 12th International Conference on Human Computer Interaction with Mobile Devices, Lisbon, Portugal, 7–10 September 2010; ACM: Stockholm, Sweden, 2011; pp. 545–550. [Google Scholar]
  12. Palani, H.P.; Giudice, U.; Giudice, N.A. Evaluation of Non-visual Zooming Operations on Touchscreen Devices. In Proceedings of the 10th International Conference of Universal Access in Human-Computer Interaction (UAHCI), Part of HCI International 2016, Toronto, CA, USA, 17–22 July 2016; Antona, M., Stephanidis, C., Eds.; Springer International Publishing: Berlin/Heidelberg, Germany, 2016; pp. 162–174. [Google Scholar]
  13. Palani, H.P.; Giudice, N.A. Principles for Designing Large-Format Refreshable Haptic Graphics Using Touchscreen Devices: An Evaluation of Nonvisual Panning methods. ACM Trans. Access. Comput. (TACCESS) 2017, 9, 1–25. [Google Scholar] [CrossRef]
  14. Giudice, N.A.; Guenther, B.A.; Jensen, N.A.; Haase, K.N. Cognitive mapping without vision: Comparing wayfinding performance after learning from digital touchscreen-based multimodal maps vs. embossed tactile overlays. Front. Hum. Neurosci. 2020, 14, 87. [Google Scholar] [CrossRef] [PubMed] [Green Version]
  15. Grussenmeyer, W.; Garcia, J.; Jiang, F. Feasibility of using haptic directions through maps with a tablet and smart watch for people who are blind and visually impaired. In MobileHCI’16; ACM: Florence, Italy, 2016; pp. 83–89. [Google Scholar]
  16. Braille Authority of North America. Guidelines and Standards for Tactile Graphics; The Braille Authority of North America: Sandra Ruconich, UT, USA, 2010. [Google Scholar]
  17. Rowell, J.; Ungar, S. The world of touch: An international survey of tactile maps. Part 1: Production. Br. J. Vis. Impair. 2003, 21, 98–104. [Google Scholar] [CrossRef]
  18. Rowell, J.; Ungar, S. The world of touch: An international survey of tactile maps. Part 2: Design. Br. J. Vis. Impair. 2003, 21, 105–110. [Google Scholar] [CrossRef]
  19. Johnson, K.O.; Phillips, J.R. Tactile spatial resolution. I. Two-point discrimination, gap detection, grating resolution, and letter recognition. J. Neurophysiol. 1981, 46, 1177–1191. [Google Scholar] [CrossRef] [PubMed]
  20. Loomis, J.M.; Lederman, S.J. Tactual perception. In Handbook of Perception and Human Performance; Boff, K., Kaufman, L., Thomas, J., Eds.; Wiley: New York, NY, USA, 1986; Volume 2, p. 31. [Google Scholar]
  21. Jones, L.A.; Sarter, N.B. Tactile displays: Guidance for their design and application. Hum. Factors 2008, 50, 90–111. [Google Scholar] [CrossRef]
  22. Loomis, J.M. Tactile pattern perception. Perception 1981, 10, 5–27. [Google Scholar] [CrossRef]
  23. Lederman, S.J.; Klatzky, R.L.; Barber, P.O. Spatial and movement-based heuristics for encoding pattern information through touch. J. Exp. Psychol. Gen. 1985, 114, 33–49. [Google Scholar] [CrossRef]
  24. O’Modhrain, S.; Giudice, N.A.; Gardner, J.A.; Legge, G.E. Designing media for visually-impaired users of refreshable touch displays: Possibilities and pitfalls. IEEE Trans. Haptics 2015, 8, 248–257. [Google Scholar] [CrossRef]
  25. Palani, H. Making Graphical Information Accessible Without Vision Using Touch-Based Devices; University of Maine: Orono, ME, USA, 2013. [Google Scholar]
  26. Raja, M.K. The Development and Validation of a New Smartphone Based Non-Visual Spatial Interface for Learning Indoor Layouts; University of Maine: Orono, ME, USA, 2011. [Google Scholar]
  27. Lederman, S.; Klatzky, R. Haptic perception: A tutorial. Atten. Percept. Psychophys. 2009, 71, 1439–1459. [Google Scholar] [CrossRef] [Green Version]
  28. Gorlewicz, J.L.; Tennison, J.L.; Palani, H.P.; Giudice, N.A. The Graphical Access Challenge for People with Visual Impairments: Positions and Pathways Forward. In Interactive Multimedia; IntechOpen: London, UK, 2018; pp. 1–18. Available online: https://www.researchgate.net/publication/330940759_The_Graphical_Access_Challenge_for_People_with_Visual_Impairments_Positions_and_Pathways_Forward (accessed on 7 December 2021).
  29. Tennison, J.L.; Uesbeck, P.M.; Giudice, N.A.; Stefik, A.; Smith, D.W.; Gorlewicz, J.L. Establishing Vibration-based Tactile Line Profiles for Use in Multimodal Graphics. Trans. Appl. Percept. 2020, 17, 1–14. [Google Scholar] [CrossRef]
  30. Palani, H.P.; Fink, P.D.S.; Giudice, N.A. Design Guidelines for Schematizing and Rendering Haptically Perceivable Graphical Elements on Touchscreen Devices. Int. J. Hum. Comput. Interact. 2020, 36, 1393–1414. [Google Scholar] [CrossRef]
  31. Gorlewicz, J.L.; Tennison, J.L.; Uesbeck, P.M.; Richard, M.E.; Palani, H.P.; Stefik, A.; Smith, D.W.; Giudice, N.A. Design Guidelines and Recommendations for Multimodal, Touchscreen-based Graphics. ACM Trans. Access. Comput. (TACCESS) 2020, 13, 1–30. [Google Scholar] [CrossRef]
  32. Bentzen, B.L. Orientation maps for visually impaired persons. J. Vis. Impair. Blind. 1977, 71, 193–196. [Google Scholar] [CrossRef]
  33. Andrews, S.K. Spatial cognition through tactual maps. In Proceedings of the 1st International Symposium on Maps and Graphics for the Visually Handicapped, Washington, DC, USA, 10–12 March 1983; Wiedel, J., Ed.; Association of American Geographers: Washington, DC, USA, 1983; pp. 30–40. [Google Scholar]
  34. Golledge, R.G. Tactual strip maps as navigational aids. J. Vis. Impair. Blind. 1991, 85, 296–301. [Google Scholar] [CrossRef]
  35. Thinus-Blanc, C.; Gaunet, F. Representation of space in blind persons: Vision as a spatial sense? Psychol. Bull. 1997, 121, 20–42. [Google Scholar] [CrossRef] [PubMed]
  36. Schinazi, V.R.; Thrash, T.; Chebat, D.R. Spatial navigation by congenitally blind individuals. Wiley Interdiscip. Rev. Cogn. Sci. 2016, 7, 37–58. [Google Scholar] [CrossRef] [Green Version]
  37. Giudice, N.A.; Long, R.G. Establishing and Maintaining Orientation: Tools, Techniques, and Technologies. In Foundations of Orientation and Mobility, 4th ed.; APH Press: Louisville, KY, USA, 2010; Volume 1, pp. 45–62. [Google Scholar]
  38. Montello, D.R. Navigation. In The Cambridge Handbook of Visuospatial Thinking; Shah, P., Miyake, A., Eds.; Cambridge University Press: Cambridge, UK, 2005; pp. 257–294. [Google Scholar]
  39. Golledge, R.G. Human wayfinding and cognitive maps. In Wayfinding Behavior: Cognitive Mapping and Other Spatial Processes; Johns Hopkins University Press: Baltimore, MD, USA, 1999; pp. 5–45. [Google Scholar]
  40. O’Keefe, J.; Nadel, L. The Hippocampus as a Cognitive Map; Oxford University Press: London, UK, 1978. [Google Scholar]
  41. Golledge, R.G.; Klatzky, R.L.; Loomis, J.M. Cognitive mapping and wayfinding by adults without vision. In The Construction of Cognitive Maps; Portugali, J., Ed.; Kluwer Academic Publishers: Dordrecht, The Netherlands, 1996; pp. 215–246. [Google Scholar]
  42. Millar, S. Understanding and Representing Space: Theory and Evidence from Studies with Blind and Sighted Children; Clarendon Press: Oxford, UK, 1994. [Google Scholar]
  43. Edman, P.K. Tactile Graphics; American Foundation for the Blind: New York, NY, USA, 1992. [Google Scholar]
  44. Blades, M.; Ungar, S.; Spencer, C. Map using by adults with visual impairments. Prof. Geogr. 1999, 51, 539–553. [Google Scholar] [CrossRef]
  45. Ungar, S. Cognitive mapping without visual experience. In Cognitive Mapping. Past, Present, and Future; Kitchin, R., Freundschuh, S., Eds.; Routledge: London, UK, 2000; pp. 221–248. [Google Scholar]
  46. Parkes, D. “NOMAD”: An audio-tactile tool for the acquisition, use and management of spatially distributed information by partially sighted and blind persons. In Proceedings of the Second International Symposium on Maps and Graphics for Visually Handicapped People, London, UK, 20–22 April 1988; pp. 54–64. [Google Scholar]
  47. Ducasse, J.; Brock, A.; Jouffrais, C. Accessible Interactive Maps for Visually Impaired Users. In Mobility of Visually Impaired People; Springer: Berlin/Heidelberg, Germany, 2018; pp. 537–584. [Google Scholar]
  48. Brock, A.; Jouffrais, C. Interactive audio-tactile maps for visually impaired people. ACM SIGACCESS Access. Comput. 2015, 113, 3–12. [Google Scholar] [CrossRef] [Green Version]
  49. Holmes, E.; Jansson, G.; Jansson, A. Exploring auditorily enhanced tactile maps for travel in new environments. New Technol. Educ. Vis. Handicap. 1996, 237, 191–196. [Google Scholar]
  50. Kane, S.K.; Morris, M.R.; Wobbrock, J.O. Touchplates: Low-cost tactile overlays for visually impaired touch screen users. In Proceedings of the 15th International ACM SIGACCESS Conference on Computers and Accessibility, Bellevue, WA, USA, 21–23 October 2013; ACM: New York, NY, USA, 2013; pp. 1–8. [Google Scholar]
  51. Simonnet, M.; Vieilledent, S.; Tisseau, J.; Jacobson, D. Comparing Tactile Maps and Haptic Digital Representations of a Maritime Environment. J. Vis. Impair. Blind. 2011, 105, 222–234. [Google Scholar] [CrossRef]
  52. Kaklanis, N.; Votis, K.; Tzovaras, D. Open Touch/Sound Maps: A system to convey street data through haptic and auditory feedback. Comput. Geosci. 2013, 57, 59–67. [Google Scholar] [CrossRef]
  53. Zeng, L.; Weber, G.H. Exploration of Location-Aware You-Are-Here Maps on a Pin-Matrix Display. IEEE Trans. Hum. Mach. Syst. 2016, 46, 88–100. [Google Scholar] [CrossRef]
  54. Brayda, L.; Leo, F.; Baccelliere, C.; Ferrari, E.; Vigini, C. Updated Tactile Feedback with a Pin Array Matrix Helps Blind People to Reduce Self-Location Errors. Micromachines 2018, 9, 351. [Google Scholar] [CrossRef] [PubMed] [Green Version]
  55. Loomis, J.M.; Klatzky, R.L.; Giudice, N.A. Representing 3D space in working memory: Spatial images from vision, touch, hearing, and language. In Multisensory Imagery: Theory & Applications; Lacey, S., Lawson, R., Eds.; Springer: New York, NY, USA, 2013; pp. 131–156. [Google Scholar]
  56. Giudice, N.A.; Betty, M.R.; Loomis, J.M. Functional equivalence of spatial images from touch and vision: Evidence from spatial updating in blind and sighted individuals. J. Exp. Psychol. Learn. Mem. Cogn. 2011, 37, 621–634. [Google Scholar] [CrossRef] [Green Version]
  57. The Eye Diseases Prevalence Research Group. Causes and prevalence of visual impairment among adults in the United States. Arch. Ophthalmol. 2004, 122, 477–485. [Google Scholar] [CrossRef]
  58. Rosenbaum, P.; Stewart, D. International Classification of Functioning, Disability and Health (ICIDH-2); The World Health Organization: Geneva, Switzerland, 2004; Volume 11, pp. 5–10. [Google Scholar]
  59. Sears, A.; Hanson, V. Representing users in accessibility research. ACM Trans. Access. Comput. 2012, 4, 1–6. [Google Scholar] [CrossRef]
  60. Shneiderman, B.; Plaisant, C.; Cohen, M.; Jacobs, S. Designing the User Interface: Strategies for Effective Human-Computer Interaction, 5th ed.; Addison Wesley: Boston, MA, USA, 2009. [Google Scholar]
  61. Rieser, J.J.; Lockman, J.J.; Pick, H.L., Jr. The role of visual experience in knowledge of spatial layout. Percept. Psychophys. 1980, 28, 185–190. [Google Scholar] [CrossRef]
  62. Passini, R.; Proulx, G. Wayfinding without vision: An experiment with congenitally, totally blind people. Environ. Behav. 1988, 20, 227–252. [Google Scholar] [CrossRef]
  63. Sadalla, E.K.; Burroughs, W.J.; Staplin, L.J. Reference points in spatial cognition. J. Exp. Psychol. 1980, 6, 516–528. [Google Scholar] [CrossRef]
  64. Palani, H.P.; Tennison, J.L.; Giudice, G.B.; Giudice, N.A. Touchscreen-based haptic information access for assisting blind and visually-impaired users: Perceptual parameters and design guidelines. In Advances in Usability, User Experience and Assistive Technology, Part of the International Conference on Applied Human Factors and Ergonomics (AHFE’18); Springer: Cham, Switzerland, 2018; Volume 798, pp. 837–847. [Google Scholar]
  65. Palani, H.P.; Giudice, G.B.; Giudice, N.A. Haptic Information Access on Touchscreen devices: Guidelines for accurate perception and judgment of line orientation. In Proceedings of the International Conference on Universal Access in Human-Computer Interaction, Las Vegas, NV, USA, 15–20 July 2018; Springer: Cham, Switzerland, 2018; pp. 243–255. [Google Scholar]
  66. Tobler, W.R. Bidimensional regression. Geogr. Anal. 1994, 26, 187–212. [Google Scholar] [CrossRef]
  67. Friedman, A.; Kohler, B. Bidimensional regression: Assessing the configural similarity and accuracy of cognitive maps and other two-dimensional data sets. Psychol Methods 2003, 8, 468–491. [Google Scholar] [CrossRef]
  68. Schinazi, V.R.; Epstein, R.A. Neural correlates of real-world route learning. NeuroImage 2010, 53, 725–735. [Google Scholar] [CrossRef]
  69. Giudice, N.A. Navigating without Vision: Principles of Blind Spatial Cognition. In Handbook of Behavioral and Cognitive Geography; Montello, D.R., Ed.; Edward Elgar Publishing: Cheltenham, UK; Northampton, MA, USA, 2018; pp. 260–288. [Google Scholar]
  70. Palani, H.P.; Giudice, N.A. Evaluation of non-visual panning operations using touch-screen devices. In Proceedings of the 16th international ACM SIGACCESS Conference on Computers & Accessibility (ASSETS’14), Rochester, NY, USA, 21–22 October 2014; ACM: New York, NY, USA, 2014; pp. 293–294. [Google Scholar]
  71. Su, J.; Rosenzweig, A.; Goel, A.; de Lara, D.; Truong, K.N. Timbremap: Enabling the visually-impaired to use maps on touch-enabled devices. In Proceedings of the 12th International Conference on Human Computer Interaction with Mobile Devices, Lisboa, Portugal, 7–10 September 2010; pp. 17–26. Available online: https://www.eecg.utoronto.ca/~ashvin/publications/timbermap.pdf (accessed on 7 December 2021).
  72. Loomis, J.M.; Lippa, Y.; Golledge, R.G.; Klatzky, R.L. Spatial updating of locations specified by 3-d sound and spatial language. J. Exp. Psychol. Learn. Mem. Cogn. 2002, 28, 335–345. [Google Scholar] [CrossRef]
  73. Kalia, A.; Legge, G.E.; Giudice, N.A. Learning building layouts with non-geometric visual information: The effects of visual impairment and age. Perception 2008, 37, 1677–1699. [Google Scholar] [CrossRef] [Green Version]
  74. Bryant, K.J. Representing space in language and perception. Mind Lang. 1997, 12, 239–264. [Google Scholar] [CrossRef]
Figure 1. Experimental maps in two learning-mode conditions: vibro-audio map (left) and hardcopy tactile map (right).
Mti 06 00001 g001
Figure 2. Experimental maps rendered on the Samsung galaxy Tab-3 Android tablet.
Mti 06 00001 g002
Figure 3. Pointing device used in the pointing task (left) and the stainless-steel canvas used for the reconstruction task with physical manipulatives (right).
Mti 06 00001 g003
Figure 4. Experimental maps in three learning mode conditions: VAM (left), hardcopy tactile interface (center), and visual interface (right).
Mti 06 00001 g004
Figure 5. Experimental maps rendered on the Samsung Galaxy Tab3 Android tablet (left), a canvas for the reconstruction task with start location (right).
Mti 06 00001 g005
Figure 6. Mean learning time as a function of learning-mode conditions.
Mti 06 00001 g006
Figure 7. Mean learning time as a function of learning-mode conditions.
Mti 06 00001 g007
Figure 8. Mean learning time as a function of learning-mode conditions and participant group (right).
Mti 06 00001 g008
Table 1. Six parameters and guidelines for rendering and schematizing line-based graphical materials on touchscreen devices. Adapted from [30].
Parameter forGuideline
Vibrotactile Line DetectionOn-screen lines must be rendered at a minimum width of 1 mm for supporting accurate detection via haptic feedback
Vibrotactile Gap DetectionAn interline gap width of 4 mm bounded by lines rendered at a width of 4 mm is recommended for discriminating parallel lines.
Discriminating Oriented Vibrotactile LinesA minimum angular separation (i.e., cord length) of 4 mm is recommended for supporting discrimination of oriented lines. Angular elements should be schematized by calculating the minimum perceivable angle (using the formula: θ = 2 arcsin (cord length/2r)).
Vibrotactile Line Tracing and Orientation JudgmentsA minimum line width of 4 mm is necessary for supporting tasks that require line tracing (path following), judging line orientation, and learning of complex spatial path patterns.
Building Mental Representations from Spatial PatternsWhen rendered at a width of 4 mm, users can accurately judge vibrotactile line orientation to an angular interval of 7°.
Feedback Mechanism for Vibrotactile PerceptionUsers prefer vibrotactile feedback as a guiding cue (i.e., used to identify/follow lines) as opposed to a warning cue. This interaction style also leads to better performance.
Table 2. Demographic details of the BVI participants.
SexEtiology of BlindnessResidual VisionAgeOnsetYears (Stable)
MRetinopathy of PrematurityLight/dark perception44Birth44
MRetinopathy of PrematurityNone28Birth28
MLeber’s Congenital AmaurosisLight perception40Birth40
FRetinitis PigmentosaLight/dark perception63Age 1152
FRetinitis PigmentosaLight/dark perception38Birth38
FUnknownLight/dark perception33Age 1716
MRetinitis PigmentosaLight/dark perception48Age 2513
FRetinitis PigmentosaLight/dark perception61Age 1150
MRetinal DetachmentNone61Birth61
FRetinopathy of PrematurityNone57Age 2037
FRetinopathy of PrematurityLight perception43Birth43
MRetinopathy of PrematurityNone48Birth48
Table 3. Mean and standard deviation for tested measures as a function of learning-mode conditions.
MeasuresVAMHardcopy
MeanSDMeanSD
Learning time (in seconds)426.75186.0513043.22
Wayfinding accuracy (in percent)9128.39521.5
Wayfinding sequence (in percent)7245.15450.1
Relative directional error (in angle)6.58.849.7811.95
Reconstruction accuracy (in percent)8338.98338.9
Table 4. ANOVA results for each of the tested measures comparing learning-mode conditions.
MeasuresdffSig.
HypothesisError
Learning time12228.96<0.001
Wayfinding accuracy1941.09>0.05
Wayfinding sequence accuracy1943.14>0.05
Relative directional accuracy1944.50<0.05
Reconstruction accuracy1220.00>0.05
Table 5. Mean and standard deviation for tested measures as a function of learning-mode conditions.
MeasuresVAMHardcopyVisual
MeanSDMeanSDMeanSD
Learning time (in seconds)360.0093.64178.9349.0797.8623.35
Wayfinding accuracy (in percent)95.0022.7096.0018.7098.0013.40
Wayfinding sequence (in percent)68.0047.0048.0050.0066.0047.00
Relative directional error (in angle)5.898.377.7710.745.808.20
Reconstruction accuracy (in percent)71.0046.9086.0036.3086.0036.30
Scale (in percent)88.069.4786.708.1590.338.73
Theta (in degree)3.015.480.683.101.062.77
Distortion Index14.951.4114.741.6315.251.57
Table 6. ANOVA results for each of the dependent tested measures as a function of learning-mode conditions.
MeasuresdffSig.
HypothesisError
Learning time23964.53<0.001
Wayfinding accuracy21650.512>0.05
Wayfinding sequence accuracy21652.813>0.05
Relative directional accuracy21650.816>0.05
Reconstruction accuracy2390.591>0.05
Scale2390.608>0.05
Theta2391.387>0.05
Distortion Index2390.381>0.05
Table 7. ANOVA results comparing the participant groups for each of the dependent tested measures.
MeasuresdfVAMHardcopy
HypothesisErrorfSig.fSig.
Learning time1241.39>0.057.1<0.05
Wayfinding accuracy11021.66>0.050.39>0.05
Wayfinding sequence accuracy11021.08>0.051.542>0.05
Relative directional accuracy11020.57>0.053.516>0.05
Reconstruction accuracy1240.48>0.050.026>0.05
Publisher’s Note: MDPI stays neutral with regard to jurisdictional claims in published maps and institutional affiliations.

