
Data as a Resource for Designing Digitally Enhanced Consumer Packaged Goods


1
Horizon Centre for Doctoral Training, University of Nottingham, Nottingham NG8 1BB, UK
2
Mixed Reality Lab, University of Nottingham, Nottingham NG8 1BB, UK
3
Centre for Additive Manufacturing, University of Nottingham, Nottingham NG8 1BB, UK
*
Author to whom correspondence should be addressed.
Multimodal Technol. Interact. 2022, 6(11), 101; https://doi.org/10.3390/mti6110101
Submission received: 15 September 2022
/
Revised: 6 November 2022
/
Accepted: 9 November 2022
/
Published: 17 November 2022
(This article belongs to the Special Issue Feature Papers in Multimodal Technologies and Interaction—Edition 2023)
Abstract
:The incorporation of digital functionalities into consumer packaged goods (CPG) has the potential to improve our lives by supporting us in our daily practises. However, despite the increasing availability of data about their use, research is needed to explore how these data can be harnessed to create such digital enhancements. This paper explores how consumers can utilise data about interactions with CPGs to conceptualise their enhanced versions. We devised a data-inspired ideation approach, using data visualisations and design cards to facilitate the conceptualisation of enhanced CPGs. Analysing the role of data as expressed through participants’ comments and designs, we found that data served as a basis for the creation of unique concepts imbued with greater consideration for the experiences of others and attention to their own interests. Our study shows the value of empowering consumers through data to broaden and inform their contributions towards the creation of smart products.
1. Introduction
Consumer packaged goods (CPG) (Furthermore, known as fast-moving consumer goods (FMCG)) are disposable, relatively low-price, frequently replenished products such as packaged foods and toiletries. CPGs represent more than half of all consumer spending [1] and are indispensable in countless daily practices [2]. Given the impact these products have on our lives and the increasing availability of Internet of Things (IoT) technologies [3], there has been a greater focus on creating enhanced versions of CPGs which provide additional functionalities tailored to fit their context of use and meet consumer needs [4]. Innovations such as a pill container which reminds one to take their medication [5], a disposable toothbrush which teaches kids about oral hygiene [6], and packaging which provides information about the condition of a product [7] illustrate the capacity of enhanced CPGs to have a positive impact on our lives. They could also help reduce some of the negative aspects associated with CPGs [8]; for example, the value of additional functions could help CPGs transition from disposable packaging to reusable containers, thereby offsetting some of their environmental impacts. Due to the potential of these innovations, the CPG industry—one of the largest sectors in the economy, expected to reach more than $17 trillion by 2025—has made one of its highest priorities the development of enhanced CPGs [9].
However, despite recent research in human–computer interaction (HCI) aimed specifically at enhancing interactions with CPGs [10,11], devising enhanced versions of these goods which actually meet people’s needs remains quite challenging, and the relatively few which are available on the market have thus far experienced only a fleeting interest [12]. Designing for enhanced CPGs may be even more challenging than for more conventional and durable goods (e.g., a watch [13]) due to CPGs’ defining characteristics, including their disposability and frequent need to be repurchased [14], as well as the fact that they are rarely used in isolation, but rather in conjunction with one another as complements [15]. Qualities such as these do not normally lend themselves to the equipment of modern digital technologies.
Emboldened by the capabilities of IoT technologies, contemporary approaches to product development emphasise the value both of involving consumers through participatory design in the early stages of innovation [16], and of utilising data about our practical interactions with everyday objects as a resource for innovation [17]. Given that conceptualisation is the stage argued to have the greatest influence on the level of product innovation [18], it is essential to capture the opinions of consumers as early as possible. However, while it has been demonstrated that providing data about item usage during the design process represents a substantially powerful approach [19], to our understanding this has not yet been applied in the creation of enhanced CPGs.
As one of the most prevalent everyday practises involving CPGs, our work draws upon data on their interactions during the process of cooking. The study presented here seeks to explore how consumers make use of these specific data as a resource with which to design digitally enhanced CPGs. Our primary research question is:
‘How do consumers make use of data about interactions with consumer packaged goods to conceptualise digitally enhanced CPGs?’
Inspired by previous frameworks which have placed data at the centre of the design process [16,17,20], we present a ‘data-inspired ideation’ approach as a tool for participants to explore data on how CPGs are used in practice and to inspire the creation of sketches. We devised a structured workshop to study how participants draw upon the data as well as how they reflect on the influence of this approach on their ideation process. To facilitate the participants’ use of the data, we devised an array of design resources including data visualisations, as well as design cards and a design sheet. Our findings are thus informed by a thematic analysis concerning both the sketches and comments made while drawing them.
The main contribution of this paper is an exploration of how consumers make use of data to design enhanced CPGs. In this regard, we found that participants used the data in three distinct ways: (1) to develop a varied and pragmatic understanding of CPGs, (2) to consider the experiences of others by promoting inclusivity, and (3) to bring to light latent information not intrinsically associated with the data provided. We discuss how the concepts reflected common design topics including digitisation of information and adaptation over innovation. Lastly, we reflect on the details of how consumers utilised the data, and we offer considerations which may be of interest to consumer-mediated innovation. This work demonstrates the merits of our approach, which can be adopted by researchers and designers interested in creating such products.
2. Related Work
This section provides a brief review of some relevant innovations in digitally enhanced CPGs, as well as of data-based design approaches.
2.1. Innovations in CPGs
Regardless of their success on the market, it is important to survey some of the attempted digital enhancements to CPGs in the past. One of the most important areas of innovation for CPGs is focused on incorporating technologies which add functionalities, helping these goods better serve their primary purposes [21]. Enhanced CPGs are envisaged as hybrid products capable of connecting to smart devices and the Internet, and of responding to their interactions [4]. Examples of these products include ketchup bottles which display recipe suggestions in augmented reality [22], and wine bottles equipped with sensors which provide dynamic information to facilitate brand authentication [23].
Enhanced CPGs are becoming a growing topic of interest in HCI as the subfields of human-packaging interaction [11] and human-food interaction [10] have found themselves at the forefront of developments by harnessing properties of the packaging and combining food traditions with IoT technologies to create novel product experiences. Velasco and Spence [11] stressed the importance of developing multisensory consumer-packaging experiences, such as augmented reality applications which can change products’ colour and shape [24]. Altarriba and colleagues [10] cited the opportunity to harmoniously integrate playful and socio-emotionally rich experiences into cooking and eating, thereby adding value to these practices [25].
Nevertheless, research on connecting CPGs to the IoT is still in its infancy, and the relatively few enhanced CPGs created thus far tend to focus on specific aspects of isolated product interactions with insufficient emphasis on their associated practices [26]. CPGs, like any other type of object, lend themselves to a particular set of actions and interactions which need to be understood from the dyadic human-object level to the practical and contextual level [27]. Nonetheless, while a considerable effort has been made towards understanding isolated user-product interactions [26], there have been few attempts to harness empirical findings concerning their use as a design resource.
Data about the practical use of objects can promote more attention being given to their context during product development, allowing for a more comprehensive approach [28]. In one study, researchers identified the methodologies employed in shopping routines, then used those insights to inform the design of proactive shopping systems [29]. In another, a probe was employed to collect information about the disposal of CPGs which in turn was used to predict the lifecycle of essential ingredients [30]. In a third study which tested a scheme for delivering a randomised assortment of produce, researchers identified how people deviated from their standard cooking habits to make use of unexpected ingredients [31]. Such studies on practical CPG interactions have clearly proven valuable for obtaining insights which lead to innovation.
2.2. Data and Design
As important as it is to look at innovations for CPGs, it is also vital to look at past approaches which made use of data for design. Whether it be derived from personal experiences or from more systematic and formal studies, ‘design is and always has been informed by data’ [32]. In user-centred design disciplines, practitioners frequently used data about people’s interactions with objects gathered through a combination of methods such as usability testing, fieldwork, and focus groups, to guide the design of experiences and technologies [33]. More recently, user-centred methods have been enriched through the automated collection of digital information [34]. User analytics are employed, for instance, to identify effective and rewarding digital experiences [35].
Incorporating data into design approaches also promotes the inclusion of a wider diversity of people, with consumers being increasingly sought out for their invaluable knowledge about the practical use of products [36]. Industries are becoming ever more open to crowd-sourced innovation, and are actively promoting the involvement of consumers [37] showing a strong desire to encourage them to become involved in co-design by creating platforms through which they can submit their ideas for review and potential further development. To give a sense of the value of consumer insights, in recent years more than 35% of new products from Procter & Gamble, a major CPG corporation, have implemented elements inspired by ideas stemming from (members of) their consumer base [38].
There has also been a newfound interest in HCI concerning the potential of data collected from IoT devices [39]. In their joint work, van Kollenburg and Bogers [16] developed a design approach which employed data as creative material. In one of their studies, they used a ‘connected baby bottle’ which recorded its own interactions in order to create design probes which provided meaningful information about its use [40]. Researchers have also revealed the intricacies of interpreting data, and have made suggestions to facilitate the process. Gorkovenko and collaborators employed an approach relying on data for the conceptualisation of products [17]. They found that designers eagerly and creatively made use of the data; a result which challenged the view that data may lead to a reduction in human agency.
Data visualisations coupled with design workshops have proven effective in closing the gap between those with and those without the skills to use data effectively to contribute to design [41]. This was revealed by Dove and Jones [42], who explored the use of data visualisations generated by smart-meters to inspire the creation of products and services. They found that less ambiguous visualisations were judged to be more useful than their ambiguous counterparts. Similarly, Seidelin and collaborators [43] have emphasised the relevance of providing data in an accessible manner to overcome the challenges of converting data into a useful resource. They found that data were not taken at face value, but rather that people brought their own understandings and interpretations.
3. Material and Methods
Informed by design research through practice because of its commitment to learning from the lived experience [44], we devised a data-inspired ideation approach which puts data visualisations at the centre of the process. Within the context of our work, we use the word ‘data’ ‘to refer to quantitative and qualitative findings on the use of CPGs in cooking collected from a fieldwork study’. To facilitate an understanding and use of our data, we then presented the findings through data visualisation and devised design resources, including design cards and a design sheet.
The following sections describe the study from which we obtained the data, the data visualisations, the design resources, the workshop structure, and the study sessions.
3.1. Data Visualisations
To collect data about the interactions of CPGs in cooking, we conducted a fieldwork study, which we briefly describe below to provide context for the creation of the data visualisations. We want to emphasise that our goal in this work is not to give a comprehensive account of how CPGs interact in cooking, but rather to present an example of data about CPG interactions in practice, which to our understanding has remained undocumented.
We visited twenty households in the greater [blind for review] area to observe people as they cooked a meal of their choice and which they knew how to prepare by heart. We recorded the sessions on video and collected field notes focusing on their interactions with CPGs. The participants had a mean age of 35 (SD = 12), most of whom mentioned that they cooked regularly, described their skills as average, and expressed that they generally enjoyed cooking. All the participants resided in the United Kingdom and most were British, but the sample included individuals from Europe, North America and Asia. In addition, all the households could be considered middle class. Most of the dishes chosen were relatively common within the country, and some were cooked in multiple sessions by multiple participants, such as: scrambled eggs, shepherd’s pie, and spaghetti bolognese (see Supplementary Materials S1 for more information about the study and sample).
The basis of the analysis consisted of capturing every interaction for each item used during the sessions, including CPGs and utensils. An ‘interaction’ was considered any instance in which a participant had contact with an item. Each item interaction was given a unique identification tag which included its start and end times. The sample consisted of more than 6000 interactions for more than 200 distinct items. We employed a mixed-methods approach [45] to analyse and give a meaningful interpretation to this vast quantity of data, blending summaries from statistical methods with contextual knowledge from field observations (see Supplementary Materials S1 for a more detailed description of the analysis methods).
We focused on different features of CPG interactions including their frequencies, durations, and the point in the session at which they occurred. Informed by the understanding gained from exploratory analysis, we focused on six different features of item usage which we deemed to have the greatest potential for design: (1) activities, which tasks were accomplished; (2) combinations, groups of items commonly used together; (3) consumption, the fraction of an item consumed; (4) interactions, the number of times people interacted with items; (5) situations, problems or remarkable instances of use; and (6) varieties, a description of the items’ classifications and uses.
To present our data in an accessible and understandable manner, we made use of different visualisations informed by narrative visualisations [46] and visualisation representations [47].
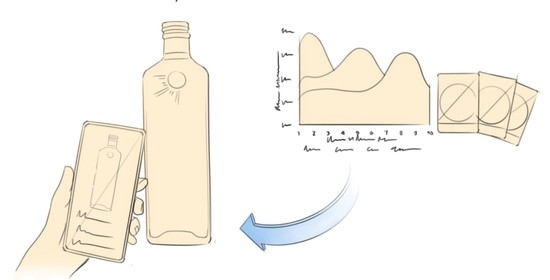
The data on the eight most frequently-used CPGs, as found in the fieldwork, was presented in a persona style board. The board contained four sections: about, activities, combination, and varieties; each of which contained information derived from our findings concerning the six features of item usage mentioned above. Each section displayed more information and a visualisation about the topic featured on the label. Four visualisations were selected, including annotated graphs, network visualisations, thumbnails, and videos; each accompanied by a brief description for context. For example, as shown in Figure 1 for the CPG oil and data activities, a short video of someone adding oil to a hot pan was shown, illustrating one of the most common activities it was involved in, along with contextual information about the person cooking and the meal (see Supplementary Materials S2 for a complete example of visualisations for a CPG).
3.2. Design Resources
The design resources were devised to help laypeople create sketches of enhanced CPGs in spite of their lack of formal, training.
The design cards were inspired by similar cards used in other ideation studies [48,49], and by a previous series of participatory workshops conducted by the first author of this study in collaboration with a large CPG company. In these workshops, participants expressed satisfaction and felt at ease using the cards to ideate product enhancements.
The cards were composed of ten features cards, ten technologies cards, and eight items cards. Each card was rectangular and colour-coded, and had been printed with an image and title; features and technologies cards bore a description as well. Each features card represented a beneficial functionality or attribute which participants could incorporate (Figure 2). Examples included amusement, cooking skills, and efficiency. The technologies cards had a device, software system, or some other technology participants could choose from in order to incorporate the selected features. Examples of these technologies included 3D printing, augmented reality, and motion sense. The items cards contained CPGs which participants could choose to make designs for. Examples included oil, salt, and spaghetti.
This was a horizontally-oriented sheet with a sketching area and four blank sections: one space was reserved for data, and the others for the features, technologies, and items cards, respectively, (Figure 2). Each section had to be filled with at least one piece of data or design card, but participants were free to choose more if they so desired. The design sheet served as a template, facilitating the collection and organisation of elements necessary to create a sketch.
3.3. Workshop Structure
A functional prototype of an interactive website was created in the vector graphics editor Figma to guide participants through the workshop. To ensure adequate progress, the first author of this paper took on the role of facilitator in all sessions, guiding participants and making sure everything was clear. The workshop consisted of eight sequential steps as described below (see Figure 3).
- Relevant themes: Participants were briefly introduced to, then encouraged to discuss, each of the topics of CPGs, cooking, and smart products.
- Sketching introduction: An explanation of sketching was given along with some techniques to help them in making their own. After their completion, a number of the sketches were examined. Participants were advised not to be constrained by any perceived technological limitations.
- Design cards and sheet: The participants received the design cards and design sheet, and were given time to explore them as well as make a hand-drawn copy of the design sheet.
- Design process: The steps for creating a sketch were provided both verbally and in writing. These included ways to make use of data, employ design cards as components for the creation of enhanced CPGs, and integrate these resources within the design sheet to create sketches.
- Data exploration: Participants selected a CPG and explored its data visualisations. They were encouraged to take note of anything they deemed useful for later use in their designs.
- Sketching: Participants created their sketches at their own pace. They were encouraged to draw upon everything they had learned about their chosen CPG.
- Presentation: Participants gave a presentation on their designs and responded to any questions posed by the facilitator.
- Reflection: Participants reflected on, then discussed, how the data had influenced their designs, as well as the value of the workshop process and design cards.
We acknowledge that our approach influenced the way in which participants framed their design process, inasmuch as any approach—even one without apparent structure and guidance—results in participants forming a frame by virtue of their habitual methods of problem-solving [50]. Given the inevitable influence on the way in which participants approach a design task, we aimed at facilitating the use of the data.
4. Workshop Study
In preparation for the workshop, participants were asked to have sheets of paper ready, along with pens, markers, or any other materials suitable for making sketches. The study was conducted online due to health and safety measures in response to the COVID-19 pandemic. Participants joined the online sessions by video conference at a time prearranged at their convenience. Sessions were individual; most having only one participant, but occasionally having two. Prior to sketching, participants received a document containing the design resources for the selected CPGs, which they explored at their own pace. They were asked to sketch two designs, though sketching a single design was acceptable when there was a time constraint. The sessions had an average duration of about 1 h and 30 min. It was approved by the University’s Ethics Committee, and informed consent was obtained from all participants. At the end of the session, participants provided feedback for improving the workshop, and they received a £15 gift card as compensation.
We aimed to get a sample which at least partially represented general consumers having no prior experience in product development. Thirty participants took part in our study, sixteen of whom self-identified as female, thirteen as male, and one as non-binary. The participants had ages ranging from 18 to 55 years old, with the majority of the participants in their 20 s. They were employed in a wide variety of occupations including lecturer, factory worker, engineer, dentist, IT professional, and student (Table 1). All the participants resided in the United Kingdom and most of them were British, although the sample also included individuals from countries in Europe, North America, and Asia. Recruitment was conducted through an advertisement which was shared on mailing lists, social media, and through referrals. To be included in the study, participants needed to be consistent users of CPGs, cook regularly, have experience with smart products, and not have been formally/professionally involved in the development of CPGs. By including direct users of CPGs in our workshop, we aimed to accomplish the participatory design dimension of our study [51]. We decided on the number of participants taking precedence from a sample of similar design workshop studies [43,48,52] as well as using an assessment of data saturation [53] to check whether new ideas were arising after each participant, and stopping when that was no longer the case. We want to emphasise that we were able to collect in-depth data from each participant due to the sessions being mostly individual and that, as has been argued by others, the size of the sample did not prevent the discovery of major themes and generalisation of findings [54].
Data Collection and Analysis
In every session, we collected field notes, made audio and video recordings, and took photographs of the sketches and other materials produced by participants. The audio recordings of each session were transcribed anonymously and in full. We took an exploratory approach to gauge the value of our data visualisations to serve as an aid in sketching enhanced CPGs. This relied on the first-hand nature of the way in which the effects of the data were directly communicated to researchers as found in similar studies [17,55]. Thematic analysis was performed on the transcriptions [56], while polytextual analysis was applied to the sketches [57]. The findings are thus composed of an interweaving of thematic elements obtained from both methods. The transcriptions and sketches were initially encoded independently by one of the authors, and a segment of selected codes was later chosen in collaboration with other researchers to identify any inconsistencies. The codes were then further examined to consolidate and further distill the main themes. The analysis focused on identifying emerging patterns, which we then gradually refined through an iterative process.
5. Results
We give an overview of the most prevalent themes exhibited in the design concepts, and we reflect on the use of both the design cards and workshop structure. This serves as a basis for the following section, in which we unpack participants’ comments and designs how it clearly indicates having been influenced by the data.
5.1. The Creation of Design Concepts
The sketches amounted to a total of 58 designs, each representing a different concept. The most common CPGs participants chose to sketch for were oil (14), spaghetti (10), and minced meat (9). The designs employed a mean of 2 pieces of data, 2.6 features cards, and 2.2 technologies cards. The most commonly used pieces of data were those on activities (37), specific situations (24), and combinations (17). The most commonly incorporated features cards were cooking skills (21), healthy eating (18), and sustainability; and the most commonly used technologies cards, were sensors (44), apps (24), and smart assistants (20).
It was quite apparent that the resources did indeed prove helpful, and the vast majority of participants expressed satisfaction with the design cards and sheet, as well as with the workshop structure in general. Many compensated for their lack of design experience with their their use of the cards and design sheet, often suggesting their ‘outsider’ perspective represented an advantage. As expressed by P06, “they helped me frame my idea, and I am not very good at imagining things”. The cards seemed to have been sufficiently versatile to include every idea suggested and therefore did not limit creativity. As noted by P12, “the cards are broad enough so different things can be included”.
The workshop process led to the creation of unique designs with no two being the same. Even when participants imagined similar structures, they almost always envisioned different functionalities and/or benefits. For example, of the 14 design concepts for oil, 4 of them featured a smart dispenser for more efficient portioning, yet they each served different purposes. The design by P26, for example, integrated the features cooking skills and efficiency, along with the technologies smart assistant and motion sense. By contrast, the design by P23 integrated the features cooking skills and healthy eating, along with the technologies apps and sensors, to focus on an an enhancement which was solely aimed at accurately dispensing the desired amount efficiently.
Despite the uniqueness of each concept, we identified three of the most common benefits which participants intended their enhanced CPGs to provide:
Transmission of knowledge. These designs for CPGs aimed to provide a practical understanding and, subsequently, direct and pragmatic assistance during meal preparation. The facts and guidance that these interactive products seek to deliver are traditionally acquired through direct experience, learning from others, or formal education. Participants expressed that gaining such information would likely improve their skills and be a complement to more conventional ways of learning. Examples of these functionalities include explanations of how to properly use a product, suggestions on how to improve the flavour of a dish, and tips for avoiding common mistakes.
Digitisation of existing functions. These designs often included digitised versions of functions already provided by conventional packaging. Digital components were integrated into the packaging which connected CPGs to nearby smart devices. These functionalities aimed to solve common problems or improve the successful properties of conventional CPGs. Enhancing CPGs was seen in these cases as a way to improve the products without necessarily making radical changes. Examples of such digitised functionalities included automated portion dispensation, accessing product information through augmented reality, and determining product freshness.
Incorporation of values. These designs attempted to incorporate technologies which promote desirable intrinsic values such as sustainability, ethical sourcing, and healthy eating. Participants looked for ways to transform CPGs into more socially-responsible products. They often stated that technology could help consumers to promote business practices which they support, and furthermore could help CPGs overcome some of the most common challenges they face. Strides to promote these values were made by, for example, creating zero-waste refillable subscription services, promoting consumption from local producers, and tracing supply chain networks to ascertain the origins of a product.
5.2. Data Visualisations in the Ideation Process
We found that participants imagined a specific situation of CPG usage which then served as the basis for their sketches. We describe three central themes regarding how data visualisations had direct consequences for the ideation process.
5.2.1. Variety of Interpretations
Participants frequently took multiple, independent perspectives on the same data. These angles of interpretation often had distinctive consequences for design, while generally perceived as opening venues for considering different dimensions of CPGs usage, the resources were also interpreted by some as imposing constraints and leading to designing for certain kinds of situations over others. An example of the latter sentiment was expressed by P13, whose perception was that a piece of data (i.e., about the packaging of oil influencing the way it is handled) could delimit which aspects taken into account and, consequently, reduce the number of innovations which might be imagined.
P13. “It’s almost like you, when you’re showing that video, it’s almost like a leading question. Furthermore, you’re saying to people almost subconsciously, ‘there is a problem here we are going to solve’.”
An opposing opinion was expressed by P16, who stated that this same piece of data expanded their considerations and made them more well-informed.
P16. “Yeah, it will help with that, making the design better at getting different perspectives of looking at the food, maybe from the quality side, from the cost—really the economic side […] the environment side.”
Contrasting interpretations of data visualisations led to rich designs reflecting the individuality of each participant’s perspective. The information about salt being the most commonly-utilised ingredient was interpreted by P03 as illustrating the need to provide ways to ease the purchase of common ingredients, as opposed to P22, who saw this as representing a missed opportunity to use alternative seasonings. The ‘ease-of-purchase’ interpretation led to designing containers which would be part of a subscription-based service for buying bulk salt, milk, eggs, and other frequently-consumed ingredients, while the ‘missed opportunity’ interpretation inspired a smart spice rack which would recommend a blend of spices depending on the food being prepared, as shown in Figure 4.
P22. “I’m just thinking you could do more. Yeah, I mean I know that there were like hundreds of products that were used and salt is the default, which is why it kind of made sense for it to be the gateway drug for the other spices.”
In essence, people created unique and subjective interpretations which were influenced by their own experiences, knowledge, and backgrounds. The interpretations which participants ascribed to the data were highly dependent on the lens through which they chose to view it, as well as the elements on which they chose to focus their attention.
5.2.2. Considering the Practices of Others
People had a variety of reactions when learning about the cooking practices of others, particularly when those methods differed significantly from their own. Some accepted them as simply different, others questioned their own, and a handful even deemed these other practices as inefficient. Nonetheless, participants were still willing to draw inspiration from cooking practices they disagreed with for their designs. P23 objected to the action of returning the remaining half of a minced meat package to the fridge and, as a result, designed a tag for the detection and prevention of product expiration (see Figure 5).
P23. “Yeah, so the people’s behaviour of only using half a pack. I thought if they struggle with waste […] and not knowing after you’ve used it, ‘cause, like, another reason that I would not only use half a pack is because I would not know how long really it would last for.”
Participants realized the limitations of their personal knowledge and recognized that, when attempting to derive inspiration from the data, they could not avoid basing it primarily on their own experiences. The data ignited their curiosity for thinking about the experiences of others, and they expressed having taken into account those whose living conditions differed radically from their own. The sources detailing others’ practices may have helped participants make their sketches more inclusive by considering multiple perspectives as to why something might be valuable. They expressed that, otherwise, their innovations might have been aimed at only one person: namely, themselves. P14 provided an analogy to illustrate how they interpreted the data, as well as how people process disinformation in general.
P14. “[…] without data, it’s very easy to fall into your own… t-to be stuck in your own perceptions of the world, right? […] you extrapolate this to like the way the news works. If you only read The Sun newspaper, you only ever think that immigrants are the big problem of the world, right? However, if you read many different newspapers, maybe you get—have an informed decision.”
In summary, when reasoning about the data, people were forced to consider the circumstances of others and, in doing so, they acquired the resources that led to creating design concepts which likely had a more inclusive range of applications than would have been the case if they had only considered their own experiences. Expanding the set of intended users for a design may have allowed participants to reevaluate their own biases and take a more cautious approach.
5.2.3. Influence of Latent Information
In forming their interpretations, participants related the data to a wide range of ideas which, although perhaps being rather strongly implied, were not actually present within the data visualisations. Participants drew from their own personal knowledge and interests, as well as introduced assumptions which led them to contest, critique, and challenge the data provided. Some participants found the data that was absent to be more telling than that which was actually shown:
P09. “It woke up my interest to know more about history… It would have been interesting, a little bit more history detail. That is why I did not learn anything. However, you know, I think maybe it came from China, did not it? Or originally? Or things like that? […] Maybe it would be nice to know…”
Despite a sentiment that the information given was already widely-known, it brought to their attention a number of related concepts which they became curious to know more about. Their disappointment with the lack of information provided on the package about the history of spaghetti motivated them to create a package equipped with a sensor which would activate an app providing information to the user to more about the origins of pasta.
Other participants seemed to make assumptions about the demographics from which the information came and hypothesized on the future adoption of their designs. For example, data about spaghetti bolognese being one of the most-consumed dishes in the United Kingdom was cited by P15 to justify their position that some British citizens would experience problems with the dish because they have poor cooking skills. In spite of any potential enhancements, the participant believed it unlikely that the average person would be able to improve their cooking skills. Nevertheless, they designed enhancements aimed at helping in this area, proposing a connected pot which stored and dispensed oil, salt, and black pepper to help cook spaghetti as shown in Figure 6.
P15. “At some point, it says that it is the most common dish prepared in the UK. So it’s something that a lot of people might experience problems with, yeah? […] However, how do you make it accessible and easy?”
Overall, participants did not limit their ideation to being influenced exclusively by the information presented or the direct logical implications thereof. They voiced assumptions, invented different contexts, and envisioned possible future ramifications of adopting such technology. Participants’ reflections were not solely about what was explicitly provided, but rather everything which they could associate with data.
6. Discussion
Our study shows that the participants made effective use of data visualisations on CPG interactions to help sketch enhanced CPGs. The data helped bring to the forefront of participants’ minds many of the complexities associated with practical item use. Herein, we discuss the participants’ reasoning and design concepts in an attempt to elucidate the inspiration of the data in their ideation process.
6.1. Using Design Resources in Innovation
Even when participants were told not to be constrained by any utilitarian or technological limitations, their concepts often exhibited incremental rather than radical innovation [58]. Our approach might have influenced participants to form ideas which they felt represented common sense and practicality. Their concepts frequently employed technologies having a similar level of sophistication to those available on the market. It is possible that people attempted to imbue their designs with a sense of familiarity in the hope that the resulting products would be more appealing to others. Similarly, the most common benefits incorporated were those most closely associated with cooking; namely, cooking skills, healthy eating, and sustainability, while a desire to improve cooking skills and eat healthy is something that most of us share, sustainability is a value that is only recently being more tenaciously pursued due to the evolving environmental challenges we face. Designers should be aware that consumers might well unwittingly tend to create products with which they have some degree of familiarity, and if one desires more radical designs, a more directive approach may be required [59].
Our specially-purposed design cards served as a tool to better engage with data. We found that the design cards could be put to better use when presented alongside data visualisations, while neither the cards nor data alone may be enough to foster creativity, per se [60], our work has shown that they hold such potential when combined. We believe that cards can help people plan more clearly which attributes they want their products to have, leaving them free to think about other aspects of design [49]. The strengths of our design cards mirror those highlighted by Mora et al. [48], including facilitating creative combinations of ideas, and easing the design process. The cards helped participants easily navigate through the design process and simplified the integration of insights from data by breaking down sketching into more manageable tasks. One concern could be that the design cards might limit creativity by directing people towards certain designs [60]. However, we found that this was not the case: participants expressed that the cards were general enough to accommodate any ideas they had, and this was reflected in the uniqueness of their design concepts.
Participants adopted a pragmatic approach when creating their sketches, focusing on the practical usage of CPGs. This was evident in designs which aimed to improve cooking skills (transmission of knowledge), facilitate product usage (digitalisation of existing functions), and promote desirable benefits (incorporation of values), among others. data visualisations helped to foster an effective understanding of the information presented, allowing participants to use their newfound knowledge to make informed decisions. The benefits of keeping the circumstances of use at the forefront of participants’ minds have long been of obvious value from a practice perspective (c.f. [28]) as opposed to those in which the product is viewed more abstractly. To better apply data for guidance in the design of enhanced CPGs, designers may do well to employ frameworks, such as the ‘Contextual Wheel of Practice’, in order to promote a better understanding of the hands-on aspects of product usage and support collaboration among users [61].
6.2. Reasoning about Data in Ideation
A singular data point usually had multiple meanings ascribed to it, each supporting different perspectives. The finding that salt was the most commonly used ingredient was cited to justify a design which facilitated its purchase (P03), as well as one which promoted the use of alternative spices (P22). As expressed by Feinberg [62], ‘any “use” of data represents a continuation of its design’, and thus we found that our participants, when forming insights for design, were more prone to giving markedly creative interpretations rather than incorporating only the facts presented, while it might be expected that people would articulate different perspectives and experiences, what we believe is special from a design perspective is how this demonstrates another way in which data could spawn innovation. We feel that the clear reason for the highly subjective interpretations is the personal knowledge which is brought by each individual, and which is crucial in how one ascribes meaning [63].
Data visualisations also helped to amplify the considerations given to others. Through data, participants seemed to envision specific personas for whom they devised their innovations, while some imagined a hypothetical “average” person, others drew from the characteristics of a more specific group. This may promote designs which cater to people with specific needs. Such was the case for P23, who designed a resealable pack of minced meat which they thought could be useful for people interested in promoting environmentally-friendly alternatives. Data seemed to have helped participants consider the perspective of others. As noted by P14, without access to such a wealth of information, the concepts might have been designed solely for themselves. Data can have the potential to broaden horizons and make us think more inclusively [64]. As people reflect on the data, they may be led to a multifaceted understanding, which can support expressing more empathy towards others whose conditions differ from their own [18].
People also challenged or looked beyond the data in order to connect ideas which were perhaps only tangentially related. P15 proposed the idea that poor cooking skills were the reason that spaghetti bolognese was so prevalent. In other instances, participants reacted to perceived gaps in the data by either ignoring the given information or replacing them with their assumptions. There were a number of instances in which the data revived long-forgotten interests which participants once had, but had never found the chance to properly explore, such as when data about spaghetti served as an aide-mémoire for P09 reminding them of their interest in its history. Sometimes, people just wanted a different story—one which they may have felt more comfortable with. This especially happened when they disagreed with the data presented. Given the many ways in which people deviated from the data, design methods should harness the potential this presents by encouraging individuals to lean into their diversity of visions and ideas [65].
6.3. Takeaways
Herein we seek to crystallize the learnings from our study for researchers and designers interested in facilitating data-inspired ideation.
6.3.1. Empowering Consumers’ Innovations through Data
We found that participants readily drew upon and expressed satisfaction with the data visualisations to create their design concepts. As stated by P24, “I was able to kind of use what I learned from the data to put them into the design itself”, while we have an intuitive knowledge of how CPGs are used, we might not remember specific interactions with them due to their being commonly regarded as unimportant details occurring in the background of our everyday lives [66]; however, approaches to design which put data at the centre of the process have shown the value of supplying such information [17,20,40,55,67] to create innovations firmly grounded in empirical insights. To our minds, the effects of including only general consumers in these data-inspired approaches still remain woefully understudied. We contribute to these approaches by showing the value of providing data as a design resource for members of the general public, and demonstrate that consumers are highly capable of using such data for ideation when presented in an accessible manner.
6.3.2. Facilitating Innovation through a Structured Design Process
Our study also contributes to participatory design approaches in which people are generally encouraged to draw upon their experiences to identify problems and create solutions [68]. Designers can improve their approaches by providing data, whether from fieldwork observations or connected devices [17]. Consumers, despite being experts of their own experiences, are a relatively untapped resource when it comes to first-hand knowledge about the practical use of CPGs, and companies are increasingly taking advantage of this by including consumers in the design process. One’s capacity to use their own experience to inform design has until now been feasible only for experts with the training to analyse them in such a way that proves fruitful [69]. The presentation of data in a structured design approach like ours could facilitate the use of personal data and lead to the development of products which both better serve our needs and reflect a greater variety of interests [70]. As expressed by P14, we cannot help but “…be stuck in your own perceptions of the world”. Involving more people in the design process can therefore lead to designing products which more consumers would be more willing to purchase [71].
The design workshops of this study contribute to perspectives in design which aim to incorporate data into their practices. Generally, participants expressed satisfaction with the workshop organisation, and they welcomed a structured process for streamlining the conceptualisation of enhanced CPGs. Overall, this study demonstrates that, through a structured workshop process with effective visualisations, data can be a powerful resource and provide innovation for participants without design experience. We showed that the approach could be flexible enough to accommodate different design objectives, from merely sketching enhanced CPGs to fostering a discussion about the implications of data for design. This is an exploratory study, and the approach would benefit from further testing in different conditions, for example including different data resources and more collaboratively-designed activities.
6.3.3. Harnessing Data Collected through the IoT
The use of data in this study also represents a chance to harness the capacities of the IoT. CPGs are increasingly being incorporated with technologies which allow for the collection of information about their practical use [23]. As we have already seen with other smart devices, there is great potential in digital information to make positive changes in our lives [72]. Showing the potential of data for design can influence not only the development of enhanced CPGs, but also the type of data they might collect [73]. However, designers should be aware that data are not neutral, and that their selection and representation may cause consumers to gravitate towards unintentionally designing for a set of specific purposes [74]. Although not a focus of this study, data in combination with design cards can also be used to spark conversations about issues of great concern for the IoT, including ethics, privacy, and security, which could further promote the development of more conscientious technologies [75].
6.3.4. Caveats concerning Designing Smart Products
We are aware that not all innovations for CPGs have to be digital [76], and that the incorporation of IoT technologies can have negative effects [77]. To the first point, we acknowledge that each situation must be evaluated on a case-by-case basis, and that there are some in which the addition of any technology may be less appropriate [76]. We observed within the designs of participants that not all were heavily-reliant on technology and did not necessarily see much benefit from digital enhancements. To the second issue, while some IoT technologies are difficult to re-utilise and recycle, enhanced CPGs could lead to functionalities which promote sustainability, such as preventing product waste at home as well as in supply chains [77]. Moreover, enhanced CPGs promote the use of more durable containers which lend themselves both to increased reusability and even to the addition of technologies into the packaging itself. On the whole, we believe that our findings still clearly indicate the importance of exploring how data can empower consumers in their efforts to shape product design. Moreover, we recognized that in the field of CPGs, the interests of industry and consumers are often at odds [78]. As per what we have decided to be in the best interest of furthering our research goals, we have made the conscious decision here to effectively shelve industry interests in favour of respecting those of the consumer where the two may be in conflict.
7. Conclusions
In this paper, we presented a data-inspired ideation approach to enable consumers to utilise data for conceptualizing digitally enhanced versions of CPGs. Our findings from participatory workshops suggest that data about the practical uses of CPGs can be successfully utilised by members of the general public to create a wide variety of designs. The data was incorporated into design concepts in markedly distinct ways, clearly reflecting the diversity in participants’ interpretations, greater attention and focus being given to the experiences of others, and indirectly-related ideas which participants associated with the information. Though each design was unique, our analysis revealed that they exhibited common themes relating to the topics of information in design, value-sensitive design, and adaptation rather than innovation. This study represents a step towards devising an approach for designing CPGs which takes into careful consideration their practical and contextual use, and towards demonstrating the value of consumer participation throughout the early stages of product development.
Supplementary Materials
The following supporting information can be downloaded at: https://www.mdpi.com/article/10.3390/mti6110101/s1.
Author Contributions
Conceptualization, methodology, validation, formal analysis, writing—original draft preparation, writing—review and editing, software, investigation, data curation, and visualization, G.B., J.F. and M.B.; supervision J.F. and M.B.; funding acquisition, G.B. and J.F. All authors have read and agreed to the published version of the manuscript.
Funding
The authors are supported by the Engineering and Physical Sciences Research Council [grant numbers EP/P510592/1, EP/T022493/1].
Informed Consent Statement
Informed consent was obtained from all subjects involved in the study.
Data Availability Statement
Data available on request due to restrictions due to privacy considerations.
Acknowledgments
We would like to express my sincere gratitude to the participants who selflessly gave their time and effort through their participation.
Conflicts of Interest
The authors declare no conflict of interest. The funders had no role in the design of the study; in the collection, analyses, or interpretation of data; in the writing of the manuscript; or in the decision to publish the results.
References
- U.S. Bureau of Labor Statistics. Consumer Expenditure in 2018; BLS Reports 1086; U.S. Bureau of Labor Statistics: Washington, DC, USA, 2020.
- Comber, R.; Choi, J.H.-J.; Hoonhout, J.; O’Hara, K. Designing for human–food interaction: An introduction to the special issue on ‘food and interaction design’. Int. J. Hum.-Comput. Stud. 2014, 72, 181–184. [Google Scholar] [CrossRef]
- Biji, K.; Ravishankar, C.; Mohan, C.; Srinivasa Gopal, T. Smart packaging systems for food applications: A review. J. Food Sci. Technol. 2015, 52, 6125–6135. [Google Scholar] [CrossRef] [PubMed]
- Lydekaityte, J. Smart Interactive Packaging as a Cyber-Physical Agent in the Interaction Design Theory: A Novel User Interface. In Proceedings of the IFIP Conference on Human–Computer Interaction, Paphos, Cyprus, 2–6 September 2019; Springer International Publishing: Cham, Switzerland, 2019; pp. 687–695. [Google Scholar] [CrossRef]
- Pillsy. Pillsy|Connected Medication Platform, with Smart Pill Bottle, App and Secure Cloud-Based Platform. Available online: https://www.pillsy.com (accessed on 1 September 2022).
- Pepsodent. Little Brush Big Brush. Available online: https://www.pepsodent.com/bd/little-brush-big-brush.html (accessed on 1 September 2022).
- Poyatos-Racionero, E.; Ros-Lis, J.V.; Vivancos, J.L.; Martínez-Máñez, R. Recent advances on intelligent packaging as tools to reduce food waste. J. Clean. Prod. 2018, 172, 3398–3409. [Google Scholar] [CrossRef]
- Končar, J.; Grubor, A.; Marić, R.; Vučenović, S.; Vukmirović, G. Setbacks to IoT implementation in the function of FMCG supply chain sustainability during COVID-19 pandemic. Sustainability 2020, 12, 7391. [Google Scholar] [CrossRef]
- Company, M. Consumer Packaged Goods. The New Model for Consumer Goods; McKinsey & Company: Atlanta, GA, USA, 2018. [Google Scholar]
- Altarriba Bertran, F.; Wilde, D.; Berezvay, E.; Isbister, K. Playful human-food interaction research: State of the art and future directions. In Proceedings of the Annual Symposium on Computer-Human Interaction in Play, Barcelona, Spain, 22–25 October 2019; Association for Computing Machinery: New York, NY, USA, 2019; pp. 225–237. [Google Scholar] [CrossRef]
- Petit, O.; Velasco, C.; Spence, C. Multisensory Consumer-Packaging Interaction (CPI): The Role of New Technologies. In Multisensory Packaging: Designing New Product Experiences; Velasco, C., Spence, C., Eds.; Palgrave Macmillan: Cham, Switzerland, 2019; pp. 349–374. [Google Scholar] [CrossRef]
- News, E.B. Amazon Stops Selling Dash Buttons. Available online: https://www.bbc.co.uk/news/technology-47416440 (accessed on 1 September 2022).
- Lyons, K. What can a dumb watch teach a smartwatch? Informing the design of smartwatches. In Proceedings of the 2015 ACM International Symposium on Wearable Computers, Osaka, Japan, 7–11 September 2015; pp. 3–10. [Google Scholar]
- Zeeuw van der Laan, A.; Aurisicchio, M. Planned obsolescence in the circular economy. In PLATE: Product Lifetimes and the Environment; IOS Press: Amsterdam, The Netherlands, 2017; pp. 446–452. [Google Scholar] [CrossRef]
- Berumen, G.; Fischer, J.E.; Brown, A.; Baumers, M. Finding Design Opportunities for Smartness in Consumer Packaged Goods. arXiv 2019, arXiv:1909.11754. [Google Scholar]
- Bogers, S.; van Kollenburg, J.; Deckers, E.; Frens, J.; Hummels, C. A Situated Exploration of Designing for Personal Health Ecosystems through Data-Enabled Design. In Proceedings of the 2018 Designing Interactive Systems Conference, DIS ’18, Hong Kong, China, 9–13 June 2018; Association for Computing Machinery: New York, NY, USA, 2018; pp. 109–120. [Google Scholar] [CrossRef]
- Gorkovenko, K.; Burnett, D.J.; Thorp, J.K.; Richards, D.; Murray-Rust, D. Exploring The Future of Data-Driven Product Design. In Proceedings of the 2020 CHI Conference on Human Factors in Computing Systems, CHI ’20, Honolulu, HI, USA, 25–30 April 2020; Association for Computing Machinery: New York, NY, USA, 2020. [Google Scholar] [CrossRef]
- Han, J.; Forbes, H.; Shi, F.; Hao, J.; Schaefer, D. A data-driven approach for creative concept generation and evaluation. In Proceedings of the Design Society: DESIGN Conference, Cavtat, Croatia, 26–29 October 2020; Cambridge University Press (CUP): Cambridge, UK, 2020; Volume 1, pp. 167–176. [Google Scholar] [CrossRef]
- Mortier, R.; Haddadi, H.; Henderson, T.; McAuley, D.; Crowcroft, J. Human-Data Interaction: The Human Face of the Data-Driven Society. SSRN Electron. J. 2014. [Google Scholar] [CrossRef]
- Kun, P.; Mulder, I.; Kortuem, G. Design Enquiry Through Data: Appropriating a Data Science Workflow for the Design Process. In Proceedings of the HCI 2018: The 32nd International BCS Human Computer Interaction Conference, Belfast, UK, 4–6 July 2018; Bond, R., Mulvenna, M., Wallace, J., Black, M., Eds.; BCS Learning and Development Ltd.: Swindon, UK, 2018; pp. 1–12. [Google Scholar] [CrossRef]
- Lydekaityte, J.; Tambo, T. Smart packaging: Definitions, models and packaging as an intermediator between digital and physical product management. Int. Rev. Retail. Distrib. Consum. Res. 2020, 30. [Google Scholar] [CrossRef]
- Petit, O.; Cheok, A.D.; Spence, C.; Velasco, C.; Karunanayaka, K.T. Sensory marketing in light of new technologies. In Proceedings of the 12th International Conference on Advances in Computer Entertainment Technology, ACE ’15, Iskandar, Malaysia, 16–19 November 2015; Association for Computing Machinery: New York, NY, USA, 2015; pp. 1–4. [Google Scholar] [CrossRef]
- Vehmas, K.; Georgoulas, S.; Krco, S.; Hakola, L.; Larizgoitia Abad, I.; Gligoric, N. A Smart Tags Driven Service Platform for Enabling Ecosystems of Connected Objects. In Cognitive Hyperconnected Digital Transformation Internet of Things Intelligence Evolution; River Publishers: Gistrup; River Publishers: Gistrup, Denmark, 2018. [Google Scholar]
- Nishizawa, M.; Jiang, W.; Okajima, K. Projective-AR System for Customizing the Appearance and Taste of Food. In Proceedings of the 2016 Workshop on Multimodal Virtual and Augmented Reality, MVAR ’16, Tokyo, Japan, 16 November 2016; Association for Computing Machinery: New York, NY, USA, 2016. [Google Scholar] [CrossRef]
- Bertran, F.A.; Pometko, A.; Gupta, M.; Wilcox, L.; Banerjee, R.; Isbister, K. The Playful Potential of Shared Mealtime: A speculative catalog of playful technologies for day-to-day social eating experiences. Proc. ACM Hum.-Comput. Interact. CHI PLAY 2021, 5, 1–26. [Google Scholar] [CrossRef]
- Mumani, A.; Stone, R. State of the art of user packaging interaction (UPI). Packag. Technol. Sci. 2018, 31, 401–419. [Google Scholar] [CrossRef]
- Taylor, A.S.; Swan, L. Artful systems in the home. In Proceedings of the SIGCHI Conference on Human Factors in Computing Systems, CHI ’05, Portland, OR, USA, 2–7 April 2005; Association for Computing Machinery: New York, NY, USA, 2005. [Google Scholar] [CrossRef]
- Kuutti, K.; Bannon, L.J. The turn to practice in HCI: Towards a research agenda. In Proceedings of the SIGCHI Conference on Human Factors in Computing Systems, CHI ’14, Toronto, ON, Canada, 26 April–1 May 2014; Association for Computing Machinery: New York, NY, USA, 2014; pp. 3543–3552. [Google Scholar] [CrossRef]
- Hyland, L.; Crabtree, A.; Fischer, J.; Colley, J.; Fuentes, C. “What do you want for dinner?”—Need anticipation and the design of proactive technologies for the home. Comput. Support. Coop. Work. (CSCW) 2018, 27, 917–946. [Google Scholar] [CrossRef]
- Fuentes, C.; Porcheron, M.; Fischer, J.E.; Costanza, E.; Malilk, O.; Ramchurn, S.D. Tracking the Consumption of Home Essentials. In Proceedings of the 2019 CHI Conference on Human Factors in Computing Systems, CHI ’19, Glasgow, UK, 4–9 May 2019; Association for Computing Machinery: New York, NY, USA, 2019; pp. 1–13. [Google Scholar] [CrossRef]
- Verame, J.K.M.; Costanza, E.; Fischer, J.; Crabtree, A.; Ramchurn, S.D.; Rodden, T.; Jennings, N.R. Learning from the Veg Box: Designing Unpredictability in Agency Delegation. In Proceedings of the 2018 CHI Conference on Human Factors in Computing Systems, CHI ’18, Montreal, QC, Canada, 21–26 April 2018; Association for Computing Machinery: New York, NY, USA, 2018; pp. 1–13. [Google Scholar] [CrossRef]
- King, R.; Churchill, E.F.; Tan, C. The ABCs of Using Data. In Designing with Data: Improving the User Experience with A/B Testing, 1st ed.; King, R., Churchill, E.F., Tan, C., Eds.; O’Reilly Media, Inc.: Sebastopol, CA, USA, 2017; pp. 25–80. [Google Scholar]
- Zimmerman, J.; Forlizzi, J.; Evenson, S. Research through design as a method for interaction design research in HCI. In Proceedings of the SIGCHI Conference on Human Factors in Computing Systems, CHI ’17, Denver, CO, USA, 6–11 May 2017; Association for Computing Machinery: New York, NY, USA, 2007; pp. 493–502. [Google Scholar] [CrossRef]
- Dahlstedt, P. Big Data and Creativity. Eur. Rev. 2019, 27, 411–439. [Google Scholar] [CrossRef]
- Gomez-Uribe, C.A.; Hunt, N. The Netflix Recommender System. In ACM Transactions on Management Information Systems; Association for Computing Machinery: New York, NY, USA, 2016; Volume 6, pp. 1–19. [Google Scholar] [CrossRef]
- Russo-Spena, T.; Mele, C. “Five Co-s” in innovating: A practice-based view. J. Serv. Manag. 2012, 23, 527–553. [Google Scholar] [CrossRef]
- Grover, V.; Kohli, R. Cocreating IT value: New capabilities and metrics for multifirm environments. MIS Q. 2012, 36, 225–232. [Google Scholar] [CrossRef]
- Han, C.; Thomas, S.; Yang, M.; Cui, Y. The ups and downs of open innovation efficiency: The case of Procter & Gamble. Eur. J. Innov. Manag. 2019, 22, 747–764. [Google Scholar] [CrossRef]
- Frens, J. Designing for Embodied and Rich Interaction in Home IoT. In Proceedings of the Conference on Design and Semantics of Form and Movement—Sense and Sensitivity, DeSForM’ 2017, Delft, The Netherlands, 17–18 October 2017; InTech: London, UK, 2017. [Google Scholar] [CrossRef]
- Bogers, S.; Frens, J.; van Kollenburg, J.; Deckers, E.; Hummels, C. Connected Baby Bottle. In Proceedings of the 2016 ACM Conference on Designing Interactive Systems, DIS ’16, Brisbane, Australia, 4–8 June 2016; Association for Computing Machinery: New York, NY, USA, 2016. [Google Scholar] [CrossRef]
- D’Ignazio, C. Creative data literacy: Bridging the gap between the data-haves and data-have nots. Inf. Des. J. 2017, 23, 6–18. [Google Scholar] [CrossRef]
- Dove, G.; Jones, S. Using data to stimulate creative thinking in the design of new products and services. In Proceedings of the 2014 Conference on Designing Interactive Systems, Vancouver, BC, Canada, 21–25 June 2014; pp. 443–452. [Google Scholar]
- Seidelin, C.; Dittrich, Y.; Grönvall, E. Foregrounding data in co-design–An exploration of how data may become an object of design. Int. J. Hum.-Comput. Stud. 2020, 143, 102505. [Google Scholar] [CrossRef]
- Koskinen, I.; Zimmerman, J.; Binder, T.; Redstrom, J.; Wensveen, S. Constructive Design Research. In Design Research through Practice: From the Lab, Field, and Showroom, 1st ed.; Koskinen, I., Zimmerman, J., Binder, T., Redstrom, J., Wensveen, S., Eds.; Elsevier: Cambridge, MA, USA, 2011; pp. 1–14. [Google Scholar]
- Creswell, J.W.; Clark, V.L.P. Designing and Conducting Mixed Methods Research; Sage Publications: New York, NY, USA, 2017. [Google Scholar]
- Segel, E.; Heer, J. Narrative Visualization: Telling Stories with Data. IEEE Trans. Vis. Comput. Graph. 2010, 16, 1139–1148. [Google Scholar] [CrossRef]
- Carpendale, S. Evaluating information visualizations. In Information Visualization: Human-Centered Issues and Perspectives; Kerren, A., Stasko, J.T., Fekete, J.D., North, C., Eds.; Springer: Berlin/Heidelberg, Germany, 2008; Volume 4950, pp. 19–45. [Google Scholar] [CrossRef]
- Mora, S.; Gianni, F.; Divitini, M. Tiles: A card-based ideation toolkit for the internet of things. In Proceedings of the 2017 Conference on Designing Interactive Systems, DIS ’17, Edinburgh, UK, 10–14 June 2017; Association for Computing Machinery: New York, NY, USA, 2017; pp. 587–598. [Google Scholar] [CrossRef]
- Wetzel, R.; Rodden, T.; Benford, S. Developing ideation cards for mixed reality game design. In Proceedings of the Transactions of the Digital Games Research Association, ToDiGRA ’17, Melbourne, Australia, 2–6 July 2017; ETC Press: Pittsburgh, PA, USA, 2017; pp. 175–211. [Google Scholar] [CrossRef]
- Paton, B.; Dorst, K. Briefing and reframing: A situated practice. Des. Stud. 2011, 32, 573–587. [Google Scholar] [CrossRef]
- Kensing, F.; Blomberg, J. Participatory design: Issues and concerns. Comput. Support. Coop. Work. (CSCW) 1998, 7, 167–185. [Google Scholar] [CrossRef]
- Nilsson, T.; Crabtree, A.; Fischer, J.; Koleva, B. Breaching the future: Understanding human challenges of autonomous systems for the home. Pers. Ubiquitous Comput. 2019, 23, 287–307. [Google Scholar] [CrossRef]
- Hagaman, A.K.; Wutich, A. How Many Interviews Are Enough to Identify Metathemes in Multisited and Cross-cultural Research? Another Perspective on Guest, Bunce, and Johnson’s (2006) Landmark Study. Field Methods 2016, 29, 23–41. [Google Scholar] [CrossRef]
- Twidale, M.; Randall, D.; Bentley, R. Situated evaluation for cooperative systems. In Proceedings of the 1994 ACM Conference on Computer Supported Cooperative Work, CSCW ’94, Chapel Hill, NC, USA, 22–26 October 1997; Association for Computing Machinery: New York, NY, USA, 1994; pp. 441–452. [Google Scholar] [CrossRef]
- Kun, P.; Mulder, I.; Kortuem, G. Data Exploration for Generative Design Research. In Proceedings of the DRS 2018, Limerick, Ireland, 25–28 June 2018; Storni, C., Leahy, K., McMahon, M., Lloyd, P., Bohemia, E., Eds.; Design Research Society: London, UK, 2018; pp. 1342–1356. [Google Scholar] [CrossRef]
- Braun, V.; Clarke, V. Using thematic analysis in psychology. Qual. Res. Psychol. 2006, 3, 77–101. [Google Scholar] [CrossRef]
- Gleesson, K. Polytextual Thematic Analysis for Visual Data. In Visual Methods in Psychology, 1st ed.; Reavey, P., Ed.; Routledge: East Sussex, UK, 2012; pp. 314–329. [Google Scholar] [CrossRef]
- Si, S.; Chen, H. A literature review of disruptive innovation: What it is, how it works and where it goes. J. Eng. Technol. Manag. 2020, 56, 101568. [Google Scholar] [CrossRef]
- Drakeman, D.; Oraiopoulos, N. The Risk of De-Risking Innovation: Optimal R&D Strategies in Ambiguous Environments. Calif. Manag. Rev. 2020, 62, 42–63. [Google Scholar] [CrossRef]
- Roy, R.; Warren, J.P. Card-based design tools: A review and analysis of 155 card decks for designers and designing. Des. Stud. 2019, 63, 125–154. [Google Scholar] [CrossRef]
- Entwistle, J.M.; Rasmussen, M.K.; Verdezoto, N.; Brewer, R.S.; Andersen, M.S. Beyond the individual: The contextual wheel of practice as a research framework for sustainable HCI. In Proceedings of the 33rd Annual ACM Conference on Human Factors in Computing Systems, CHI ’15, Seoul, Korea, 18–23 April 2015; Association for Computing Machinery: New York, NY, USA, 2015; pp. 1125–1134. [Google Scholar] [CrossRef]
- Feinberg, M. A design perspective on data. In Proceedings of the 2017 CHI Conference on Human Factors in Computing Systems, CHI ’17, Denver, CO, USA, 6–11 May 2017; Association for Computing Machinery: New York, NY, USA, 2017; pp. 2952–2963. [Google Scholar] [CrossRef]
- Tolmie, P.; Crabtree, A.; Rodden, T.; Colley, J.; Luger, E. “This has to be the cats” Personal Data Legibility in Networked Sensing Systems. In Proceedings of the 19th ACM Conference on Computer-Supported Cooperative Work & Social Computing, CSCW ’16, San Francisco, CA, USA, 27 February–2 March 2016; Association for Computing Machinery: New York, NY, USA, 2016; pp. 491–502. [Google Scholar]
- Abascal, J.; Nicolle, C. Moving towards inclusive design guidelines for socially and ethically aware HCI. Interact. Comput. 2005, 17, 484–505. [Google Scholar] [CrossRef]
- Stolterman, E. How system designers think about design and methods. Scand. J. Inf. Syst. 1992, 4, 137–150. [Google Scholar]
- Oyarzún, J.P.; Morís, J.; Luque, D.; de Diego-Balaguer, R.; Fuentemilla, L. Targeted Memory Reactivation during Sleep Adaptively Promotes the Strengthening or Weakening of Overlapping Memories. J. Neurosci. 2017, 37, 7748–7758. [Google Scholar] [CrossRef]
- van Kollenburg, J.; Bogers, S.; Rutjes, H.; Deckers, E.; Frens, J.; Hummels, C. Exploring the Value of Parent Tracked Baby Data in Interactions with Healthcare Professionals. In Proceedings of the 2018 CHI Conference on Human Factors in Computing Systems, CHI ’18, Montreal, QC, Canada, 21–26 April 2018; Association for Computing Machinery: New York, NY, USA, 2018. [Google Scholar] [CrossRef]
- Muller, M.J.; Kuhn, S. Participatory design. Commun. ACM 1993, 36, 24–28. [Google Scholar] [CrossRef]
- Neustaedter, C.; Sengers, P. Autobiographical design in HCI research. In Proceedings of the Designing Interactive Systems Conference, DIS ’12, Newcastle Upon Tyne, UK, 11–15 June 2012; Association for Computing Machinery: New York, NY, USA, 2012. [Google Scholar] [CrossRef]
- Luther, K.; Tolentino, J.L.; Wu, W.; Pavel, A.; Bailey, B.P.; Agrawala, M.; Hartmann, B.; Dow, S.P. Structuring, aggregating, and evaluating crowdsourced design critique. In Proceedings of the 18th ACM Conference on Computer Supported Cooperative Work & Social Computing, CSCW ’15, Vancouver, BC, Canada, 14–18 May 2015; pp. 473–485. [Google Scholar] [CrossRef]
- Shea, K.; Aish, R.; Gourtovaia, M. Towards integrated performance-driven generative design tools. Autom. Constr. 2005, 14, 253–264. [Google Scholar] [CrossRef]
- Wang, J.B.; Cadmus-Bertram, L.A.; Natarajan, L.; White, M.M.; Madanat, H.; Nichols, J.F.; Ayala, G.X.; Pierce, J.P. Wearable sensor/device (Fitbit One) and SMS text-messaging prompts to increase physical activity in overweight and obese adults: A randomized controlled trial. Telemed. e-Health 2015, 21, 782–792. [Google Scholar] [CrossRef] [PubMed]
- Dalsgaard, P.; Dindler, C. Between theory and practice: Bridging concepts in HCI research. In Proceedings of the SIGCHI Conference on Human Factors in Computing Systems, CHI ’14, Toronto, ON, Canada, 26 April–1 May 2014; Association for Computing Machinery: New York, NY, USA, 2014; pp. 1635–1644. [Google Scholar] [CrossRef]
- Meyer, M.; Dykes, J. Reflection on Reflection in Applied Visualization Research. IEEE Comput. Graph. Appl. 2018, 38, 9–16. [Google Scholar] [CrossRef] [PubMed]
- Urquhart, L.D.; Craigon, P.J. The Moral-IT Deck: A tool for ethics by design. J. Responsible Innov. 2021, 8, 94–126. [Google Scholar] [CrossRef]
- Baumer, E.P.; Silberman, M.S. When the implication is not to design (technology). In Proceedings of the 2011 Annual Conference on Human Factors in Computing Systems—CHI ’11, Vancouver, BC, Canada, 7–12 May 2011; ACM Press: New York, NY, USA, 2011; pp. 2271–2274. [Google Scholar] [CrossRef]
- Farhan, L.; Kharel, R.; Kaiwartya, O.; Quiroz-Castellanos, M.; Alissa, A.; Abdulsalam, M. A concise review on Internet of Things (IoT)-problems, challenges and opportunities. In Proceedings of the 2018 11th International Symposium on Communication Systems, Networks & Digital Signal Processing (CSNDSP), Budapest, Hungary, 18–20 July 2018; IEEE: Piscataway, NJ, USA, 2018; pp. 1–6. [Google Scholar] [CrossRef]
- Laran, J. Consumer goal pursuit. Curr. Opin. Psychol. 2016, 10, 22–26. [Google Scholar] [CrossRef]
Figure 1.
An example of data visualisation for the item oil. The left-side board contains all the data for the item oil. The right-side board shows the visualisation for the data on activities.
Figure 1.
An example of data visualisation for the item oil. The left-side board contains all the data for the item oil. The right-side board shows the visualisation for the data on activities.

Figure 2.
Examples of the design cards: features, technologies, and items cards, as well as the design sheet. (images not to scale).
Figure 2.
Examples of the design cards: features, technologies, and items cards, as well as the design sheet. (images not to scale).

Figure 3.
Visual representation of the eight sequential steps involved in the workshop.

Figure 4.
Design by P22 of a “smart spice rack”.

Figure 5.
Design by P23 of a “resealable minced beef pack”.

Figure 6.
Design by P15 of a “smart pasta pot cooker”.


Table 1.
Workshop participants.
| P | Gender | Occupation | Age Range | Region |
|---|---|---|---|---|
| 01 | F | Marketing communicator | 18–25 | Europe |
| 02 | F | Lecturer | 36–45 | North America |
| 03 | M | Architect | 26–35 | North America |
| 04 | F | Homemaker | 26–35 | North America |
| 05 | F | Data analyst | 26–35 | Europe |
| 06 | M | Marketing manager | 26–35 | UK |
| 07 | F | Legal assistant | 18–25 | UK |
| 08 | M | Mechanical engineer | 26–35 | Europe |
| 09 | F | Impact officer | 46–55 | North America |
| 10 | NB | Graduate student | 26–35 | Europe |
| 11 | M | Bartender | 26–35 | Europe |
| 12 | M | Graduate student | 26–35 | UK |
| 13 | F | Psychologist | 36–45 | UK |
| 14 | M | Environmental engineer | 26–35 | UK |
| 15 | F | Food scientist | 26–35 | North America |
| 16 | M | Industrial engineer | 26–35 | Europe |
| 17 | M | Consultant | 26–35 | UK |
| 18 | M | Security analyst | 46–55 | UK |
| 19 | F | Clinical researcher | 26–35 | UK |
| 20 | F | Graduate student | 26–35 | UK |
| 21 | F | Administrative assistant | 26–35 | Europe |
| 22 | M | Graduate student | 26–35 | UK |
| 23 | M | Social researcher | 26–35 | UK |
| 24 | F | Project manager | 36–45 | UK |
| 25 | F | Lecturer | 26–35 | Europe |
| 26 | F | Graduate student | 26–35 | North America |
| 27 | M | Musician | 18–25 | Europe |
| 28 | F | Waitress | 18–25 | UK |
| 29 | M | Software developer | 36–45 | Asia |
| 30 | F | Factory worker | 18–25 | Asia |
Notes: P = participant; M = male; F = Female; NB = Non binary.
Publisher’s Note: MDPI stays neutral with regard to jurisdictional claims in published maps and institutional affiliations. |
© 2022 by the authors. Licensee MDPI, Basel, Switzerland. This article is an open access article distributed under the terms and conditions of the Creative Commons Attribution (CC BY) license (https://creativecommons.org/licenses/by/4.0/).
Share and Cite
MDPI and ACS Style
Berumen, G.; Fischer, J.; Baumers, M. Data as a Resource for Designing Digitally Enhanced Consumer Packaged Goods. Multimodal Technol. Interact. 2022, 6, 101. https://doi.org/10.3390/mti6110101
AMA Style
Berumen G, Fischer J, Baumers M. Data as a Resource for Designing Digitally Enhanced Consumer Packaged Goods. Multimodal Technologies and Interaction. 2022; 6(11):101. https://doi.org/10.3390/mti6110101
Chicago/Turabian StyleBerumen, Gustavo, Joel Fischer, and Martin Baumers. 2022. "Data as a Resource for Designing Digitally Enhanced Consumer Packaged Goods" Multimodal Technologies and Interaction 6, no. 11: 101. https://doi.org/10.3390/mti6110101