

Authoring Moving Parts of Objects in AR, VR and the Desktop

Department of Computer Science, University of Central Florida, 4000 Central Florida Blvd., Orlando, FL 32816, USA
*
Authors to whom correspondence should be addressed.
†
These authors contributed equally to this work.
Multimodal Technol. Interact. 2023, 7(12), 117; https://doi.org/10.3390/mti7120117
Submission received: 1 October 2023
/
Revised: 5 December 2023
/
Accepted: 6 December 2023
/
Published: 13 December 2023
(This article belongs to the Special Issue 3D User Interfaces and Virtual Reality)
Abstract
:Creating digital twins of real objects is becoming more popular, with smartphones providing 3D scanning capabilities. Adding semantics to the reconstructed virtual objects is important to possibly reproduce training scenarios that otherwise could demand significant resources or happen in dangerous scenarios in some cases. The aim of this work is to evaluate the usability of authoring object component behaviors in immersive and non-immersive approaches. Therefore, we present an evaluation of the perceived ease of use to author moving parts of objects under three different conditions: desktop, augmented reality (AR) and virtual reality (VR). This paper provides insights into the perceived benefits and issues that domain experts might encounter when authoring geometrical component behaviors across each interface. A within-subject study is the major contribution of this work, from which is presented an analysis based on the usability, workload and user interface preferences of participants in the study. To reduce confounding variables in the study, we ensured that the virtual objects and the environment used for the evaluation were digital twins of the real objects and the environment that the experiment took place in. Results show that the desktop interface was perceived as more efficient and easier to use based on usability and workload measures. The desktop was preferred for performing component selection but no difference was found in the preference for defining a behavior and visualizing it. Based on these results, a set of recommendations and future directions are provided to achieve a more usable, immersive authoring experience.
1. Introduction
In the development of domain-specific training experiences, there is a requirement for objects to behave as expected for that domain. This creates a need for an expert who can aid with content generation and implementation for the training simulation. It is vital for this content to serve as a digital twin of the real object as it can drastically reduce costs, improve safety or provide a self-contained environment for a trainee. This type of training is grounded in principles of Situated Learning [1] (SL), aiming to exploit the surrounding visual cues as a means to provide a near-to-real-world experience. In this context, augmented reality (AR) and virtual reality (VR) are suitable to take advantage of the principles of SL. Digital information can be presented within the user’s view—in the case of AR, by blending it within the real world. Conversely, VR provides a simulated environment where the perception of the real world could be limited. Desktop represents the traditional user interface in which a 3D environment can be represented using a 2D projection on a plane.
In a given scenario, virtual objects possess attributes and behaviors that can infer some kind of instruction in the scene, such as in [2,3] in the form of audio and visual cues. Conversely, some objects demand more complex actions, such as rotating a knob or pressing a button, as in [4]; opening doors or compartments, as in the examples in [5]; or even deforming the geometries of objects, like the spring scenario from [6].
However, these experts are often not familiar with content generation tools. As such, they have difficulty in authoring a representative simulation with ease. This is further complicated as the means of interaction used are diverse across conditions, such as desktop [2,7,8,9], virtual reality (VR) [3,10,11,12], augmented reality (AR) [2,6,13,14,15] and even combined approaches, as in [16], using desktop and VR together, or in [17], with simulated AR and VR.
In this paper, we analyze solutions to this problem by evaluating affordance frameworks across multiple conditions: AR, VR and desktop (see Figure 1). To do this, we begin with Kallmann et al. [18,19,20,21], which provides an organizational framework called smart objects based on actor–object interactions. This conceptual model identifies different "interaction features" based on the type of data that each contains. Our interest based on this definition is specific to parts, actions and commands. Interactions between users and objects have been captured using computer vision to identify objects’ and users’ demonstrations to record actions, as in the work by Chidambaram et al. [22]. However, these types of interactions do not capture the intrinsic properties of the objects or what a specific object allows one to do, as in GesturAR [6]. We believe that providing a user with a tool to author and record object properties and actions is more suited towards defining object components’ behaviors. While AffordIt! in Masnadi et al. [5] offers a solution to assign affordances and constraints to the intrinsic behaviors of an individual object, it has been not explored how users perceive and perform in non-immersive approaches.
As capturing the geometry of everyday objects is becoming well supported, our main motivation in this study is to explore the authoring of such objects’ moving articulated parts. A 3D reconstructed object is created as a single continuous mesh, which then can be segmented into meaningful parts using artificial intelligence, as shown in George et al. [23] and Shamir et al.’s survey [24], or human in the loop approaches, as seen in [25,26]. These authored behaviors could then be used in training systems within a broader scope. The main question explored in this paper is whether AR and VR afford any real benefit to the authoring of sliding and rotating behaviors of articulated 3D objects.
We seek to identify the advantages and challenges of object behavior authoring tools, whether in situ using AR/VR or computer-aided using traditional interaction techniques. AffordIt! [5] interactions were custom tailored for each interface condition, using a mouse and keyboard for desktop and hand tracking and gestures for AR and VR. Fiducials are used in AR and VR: in AR, for improved precision in the mapping of real objects with the respective digital twins; in VR, to always align the virtual environment to the same physical position within the physical room. The results of this study present users’ preferences, usability and performance while authoring sliding and rotating behaviors of articulated 3D objects in each interface.
Previous research by Kallmann et al. [19,20,21,27] defined object component behaviors in virtual environments. Different aspects were extensively evaluated across different research articles introducing and evaluating virtual object behaviors and their interactions with human agents/actors. Real objects’ behaviors are also explored in the domain of robotics to provide computer agents with instructions to manipulate real-world objects [28,29,30]. AffordIt! [5] continues this research by presenting a technique to author object components behaviors in VR. A current gap exists in whether immersive approaches in VR can be as effective as their desktop counterparts; considering this, we propose an empirical evaluation of these concepts across AR, VR and desktop interfaces. Our research question is as follows: To author objects’ moving parts’ behaviors, can an immersive interface be as effective and usable as a non-immersive approach, with the approach described in this paper?
Our contributions in this paper are as follows:
- The first comparison of AR, VR and desktop for authoring the moving parts of objects;
- The results from a user study to evaluate participants’ performance and preferences.
The main contribution of this paper lies in the user study; the results provide insights into the usability issues and preferences of users when performing the specific tasks proposed within a continuous mesh to author moving parts of virtual objects. Comparing the same technique across different conditions allows practitioners to select the appropriate interface where similar tasks could be implemented.
In the next section, we review the literature on authoring tools across different modalities and the concept of objects’ behaviors. Section 3 covers the materials and methods used for this research, followed by Section 4 presenting the results of the evaluation. Lastly, Section 5, Section 6 and Section 7 discuss the results, limitations, future work and conclusions.
2. Related Work
In this section, we review previous research in VR, AR and desktop authoring tools, as well as object behavior definitions.
2.1. Augmented Reality Authoring Tools
In some cases, AR authoring approaches rely on tracking fiducials to render a virtual object in the viewer’s perspective. Tiles is an early effort by Kato et al. [31] to provide a collaborative scenario where the combination of virtual objects is used to interact with the scene to invoke an outcome. Similarly, in [14], Lee et al. introduce the concept of immersive authoring. Virtual objects in a scene are modified by different UI components associated with tangible fiducial markers. Generally, it was found that the immersive strategy was preferred over non-immersive approaches. In line with this work, Rajaram et al. in [32] explore the use of a regular sheet of paper to enable instructors to create AR educational experiences. The types of assets used were descriptive in nature, either to augment information given on the paper or to visualize a concept. Interestingly, participants found authoring on a handheld AR device more practical and visualizing it on a head-worn display as the more natural experience.
In situ authoring tools are situated in the context of procedural instructions. In the work by Gonzalez et al. [2], a visual authoring tool is presented to add behaviors and interactions to virtual objects in a scene. The behaviors authored in this tool are descriptive (text or audio). In the work by Ng et al. in [13], a set of guidelines is presented for procedurally authored games in AR. The type of non-character behaviors used is non-deterministic to the object’s nature but rather augmentative—for instance, changing visibility using a bounding box as a trigger mechanism. A collaborative role-based approach is proposed in XRDirector [33] by Nebeling et al. Their work focuses on aspects tailored to 3D designers, such as cameras, lightning and animations. In the industrial context, AR is used to create procedural training experiences by demonstration, as in [22,34]. Both approaches were constrained to recording video, audio and the movement of virtual assets. While well received and preferred over the PC, they did not explore behaviors related to the geometric properties of the objects. In the same context, the work by Izquierdo-Domenech et al. [4] and Chidambaram et al. [22] used computer vision to classify objects from the environment. Izquierdo-Domenech et al. [4] present a more automatic approach to adding semantic information to objects in the scene. In this paper, we focus on the evaluation of a human-in-the-loop approach where geometrical constraints are defined by the subject matter expert using an authoring tool, as seen in AffordIt! [5].
Virtual objects are key components when authoring instructions in AR. Jasche et al. in [35] compared two types of AR object visualizations, Concrete (CAR) and Abstract (AAR). CAR involves the use of complete CAD-style meshes, while AAR relates to the use of wire meshes and 3D arrows. The result shows that concrete visualizations induce fewer errors from participants. Our work adopts the concrete visualization for the demonstration of authored behaviors. Intrinsic object properties like stiffness and motion resistance are captured in RealityBrush [15], a novel authoring system that creates virtual replicas of real objects with measured kinetic properties. This work enables a virtual asset to afford two types of actions, poke and push, depending on the force applied. In a similar context, in GesturAR [6], everyday objects are scanned and behaviors are authored by mapping a freehand interaction to an action. Similar to our work, a hinge-joint type of interaction is proposed. However, object component segmentation is not explored.
2.2. Virtual Reality Authoring Tools
Virtual reality provides an ideal environment to simulate real-world conditions when creating identical replicas of the environment. Ipsita et al. in [36] propose VRFromX, a VR authoring tool that allows users to create interactive virtual experiences from a 3D point cloud scan. A region of interest (ROI) is first extracted and then queried to a database of virtual objects. Then, affordances can be enabled in the resulting object. They test the usability of the system in a welding training scenario. In line with this work, Masnadi et al. in AffordIt! [5] focus on behaviors authored in objects’ components. Similarly, an ROI is defined by identifying a component of an object to then enable geometric affordances on it. A preliminary evaluation showed the high usability on the techniques proposed.
ScalAR in [3] provides a holistic approach to scene authoring by tackling the problem of authoring a scenario independently of a room layout configuration. Virtual replicas of the identified objects are used in a VR environment to author semantic-level associations of AR content in each scene. The behaviors authored in this approach are descriptive or augmentative, rather than specific to the objects’ intrinsic properties. In the context of Internet of Things (IoT), Ivy by Ens et al. [10] uses VR for the authoring of intelligent environments. A node-link visual programming interface allows users to author IoT programs and visualize sensor data. Similarly, Zhang et al. [37] propose a visual programming interface to author interactive scenes in VR. Ivy and Flowmatic do not explore objects with geometrical components.
The design of an authoring tool for virtual environments using constructivist principles is explored by Winterbottom and Blake in [11]. Constructivism is grounded on the theory that knowledge is built by the interaction of a user with the environment. Our scope is based on actor–object interaction rather than actor–avatar. Authoring at run time was first explored by Steed et al. [38] using data flow diagrams while immersed to define a virtual object’s behavior. Their authoring was constrained to interactions with input devices. Inspired by this work, our approach allows for in situ tools to visualize the outcome of the authored behavior. Finally, Hayatpur et al. in [12] present three authoring techniques invoking either a plane, ray or point and using hand gestures to define movement constraints on virtual objects.
2.3. Desktop Authoring Tools
Early research in desktop-based authoring tools focused on localizing and mapping fiducial tags to 3D graphic content [39]. We adhere to Kato et al.’s [40] design principle of object affordances matching the physical constraints of the object. DART by MacIntyre et al. [7] and ComposAR [8] developed UI toolkits for the rapid prototyping of AR experiences in a desktop environment. Both approaches provide visual programming and scripting capabilities to associate virtual content with AR tags, from which actions and behaviors can be authored. In the educational context, Zhang et al. in [41] propose an authoring tool for experimental education, a traditional graphical user interface to enable educators to author AR attributes of the virtual experimental equipment. Another alternative toolkit is ARSpot [42], which is built on top of Scratch [43,44], a popular toolkit for children to learn programming concepts and visualize their code within an integrated development environment. Objects’ constraints may be authored by looking at an object’s associations based on their geometries [45,46]. For example, objects may utilize collisions to determine the constraints of movement within a plane, as shown in Oh et al. [47].
A high level of fidelity for AR training applications [48] can only be achieved using lower-level tools such as game engines [49,50]. However, commercial efforts [51,52] provide development environments specific to author aspects of the training. While these systems ease the development pipeline, the learning curve is still high and assets used on these applications need preparation.
2.4. Real and Virtual Objects’ Behaviors
Text, audio, videos, animations, color and visibility are examples of some characteristics that can be authored and associated with virtual objects. A general model for interactions between virtual human agents and objects is proposed by Kallmann et al. in [18]. This work includes the definition of the virtual object space according to four different classes of interaction features: intrinsic object properties, interaction information, object behaviors and expected agent behaviors. A graphical user interface and examples are described in [19]. Furthermore, in Kallmann et al. in [20], the object properties are divided into descriptions, parts and actions. A taxonomy for interactive object behaviors is proposed and demonstrated with a GUI to visually author behaviors as graphical state machines. Yet again, an extension of this model in [21] defines more complex behaviors such as multiple actors interacting with one object and the the actor manipulation of virtual objects introducing the term “smart objects”. The extent of the work by Kallman et al. is demonstrated in a non-immersive environment; our work evaluates immersive approaches and adopts the intrinsic properties of parts and actions for our scope.
Geometric properties are discussed in the work by Thalmann [27], the problem being how to model virtual objects’ interactions with others. Lee et al. in [53] introduce the concept of programming by demonstration. An object behavior is composed of events, context and action components, which they call ACE. This behavior is encoded as a Backus-Naur Form (BNF) notation that is then attached to a virtual object to specify interactivity in the virtual world. Authoring is performed in a desktop interface and visualized in VR, whereas the interface that we use allows a user to author and visualize behaviors from within the VR environment. An additional conceptual model called VR-WISE is presented in Pellens et al. [54], which establishes simple behaviors that, when nested, could produce more complex ones. This work has not been evaluated in a user study. Furthermore, we look to robotics for ways to apply affordance theory to object manipulation [29,30,55].
3. Materials and Methods
The following sections describe the apparatus, experiment and design considerations for this research.
3.1. System Design
Two different sets of hardware devices are used in this experiment. For the desktop condition, we use a 55-inch flat-panel TV display connected to a PC with a dedicated graphics card. For AR and VR, from Varjo Tech USA HQ in Arlington, Virginia, we use the Varjo XR-3 HMD coupled with a pair of SteamVR Base Stations 2.0 for positional tracking, connected to the same PC. A Vive controller is used for configuration by the proctor when aligning to anchored positions. For audio cues, JBL Tune 510BT Wireless Bluetooth On-Ear Headphones are used in all conditions.
Three systems were developed implementing the techniques presented in [5]. The applications were built using Unity3D [49] version 2020.3.30f1. While the interface and interaction techniques are different across the conditions, the functionality remains the same. Our authoring system has four different aspects: (1) select a region of interest (ROI) as a component of a virtual object, (2) attach a perpendicular pull behavior to the ROI, (3) attach a rotation pull behavior to the ROI, (4) visualize the result. Real objects in AR and virtual objects in VR and desktop can interact through collision with a pointer, which spawns a step-by-step menu. The pointer in the desktop condition is the mouse, and for AR and VR, it is a green sphere placed in the index fingers of participants, as can be seen in Figure 2. The pointer triggers events by collision with the UI or objects in the scene. Similarly, an undo option is provided in the UI, which allows participants to easily recover from mistakes. The goal of the study is to perform a fair comparison, as such users use the same authoring techniques across different conditions and environments. Both desktop and VR environments have been captured with LIDAR to simulate the real environment.
3.1.1. AR Application
The AR condition is a video see-through application deployed to a mixed reality head mounted display (HMD). To provide a better sense of depth, an occlusion material was used for the virtual objects and hands. Markers were added to the physical objects to aid mapping between the virtual and real objects. For hand tracking, the Ultraleap [56] package was integrated into the development pipeline. HMD tracking was possible with the integration of SteamVR 2.0 Lighthouses placed on the extreme ends of the physical room.
3.1.2. VR Application
The VR condition is also deployed to a mixed reality HMD. The virtual objects’ materials in this case are textures generated from pictures taken from the real objects and mapped to the 3D scanned geometries. A marker is used to align the objects’ digital twins directly in front of their physical counterpart versions. This was purposely designed to allow participants to safely walk the environment while immersed in the VR scenario. Ultraleap [56] was integrated into this version too, to handle hand tracking. HMD tracking was also provided by the SteamVR 2.0 Lighthouses.
3.1.3. Desktop Application
The desktop application was implemented using the traditional graphical user interface (GUI) paradigm. The tool has similar characteristics to other popular 3D editor tools (see Figure 3). The user interface adheres to the following design principles: graphic layouts, task-related grouping and direct manipulation [57,58]. The main menu follows the graphic design by Fluent 1 from Microsoft [59]. The interaction is performed by a mouse and keyboard. The behaviors authored are equivalent to the ones produced by the AR and VR counterparts.
3.2. UI Design Considerations
The system interaction is designed to provide a 3D UI centered on the object; each virtual object, when selected, spawns a menu (see Figure 4) that allows the user to author the different aspects of the 3D object. Options from the menu and undo action are then contextual to the object being interacted with. Visual guidance is given from the menu using a light blue ring blinking around the possible next button to press if the user wishes to continue authoring.
3.2.1. AR/VR Depth Perception
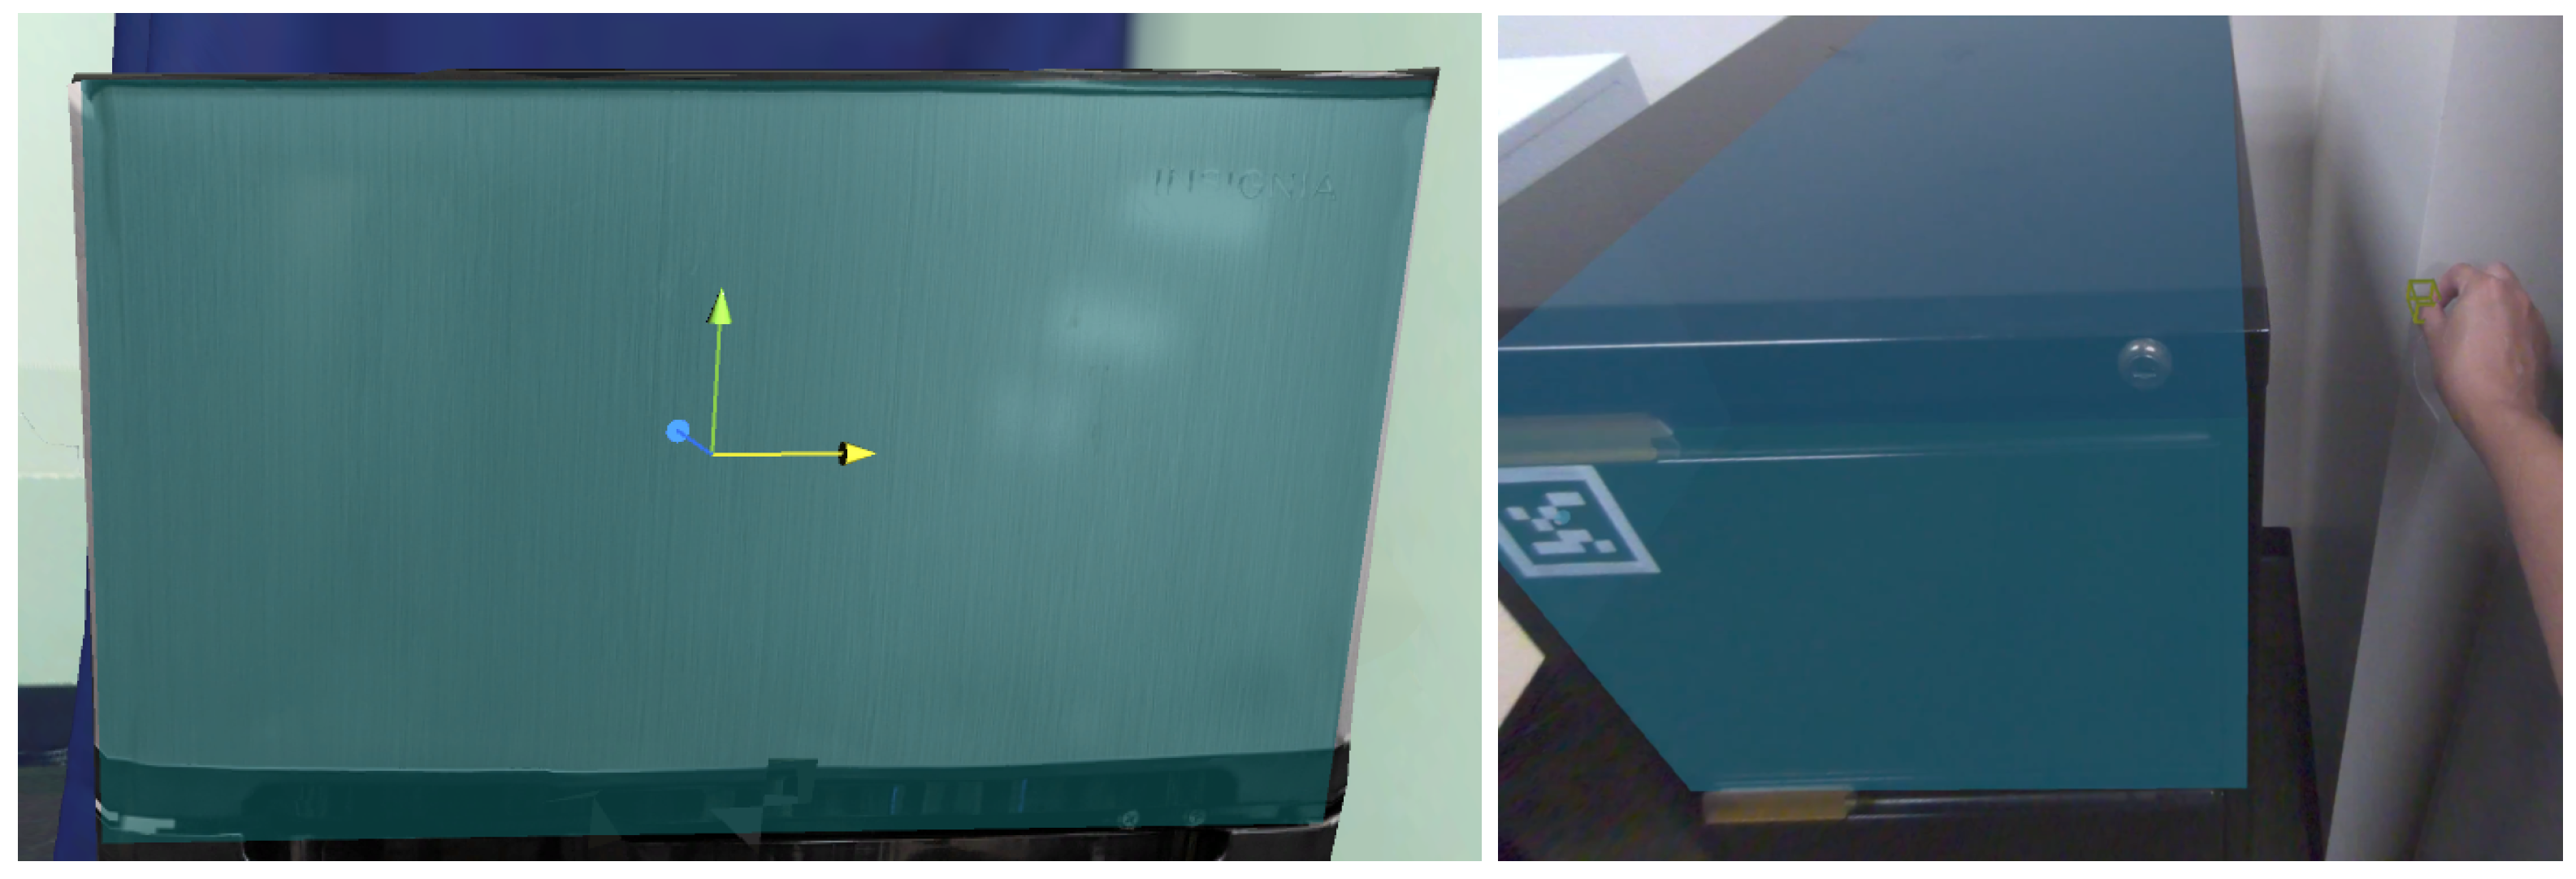
When designing the interface, the perception of depth in AR and VR was analyzed. It was noted in informal pilot studies that participants perceived depth differently in some cases. Distance judgement is extensively explored in research by Masnadi et al. [60] and Pfeil et al. [61], which implies the field of view as a possible factor. In our study, interactions happened at short distances, with the HMD selected for the study having a horizontal FoV of 115. The inter-pupillary distance (IPD) adjustment was configured using the Varjo proprietary software. To mitigate this problem, additional audio and visual cues were provided for participants to better perceive depth. A ray is visible from the index finger to the virtual object, when the pointer is less than 10 cm away from the 3D object or the menu (see Figure 5).
3.2.2. AR/VR Drag and Submit Gestures
The menu is draggable in the three conditions. In desktop, this is done by left clicking and holding the title bar while moving the mouse. For AR and VR, the menu is draggable by using the pinch gesture to the frame surrounding the 3D canvas, which then enables the menu to follow the hand transform until the release gesture is performed [62]. A custom gesture is used as well to submit the component selection and to submit the authoring of a behavior. The gesture is invoked by closing the thumb finger as a clenched fist, as can be seen in Figure 6.
3.2.3. Component Selection Cuboid Manipulation
Once the component selection is completed, transform tools to scale or translate the cuboid are enabled. In desktop, traditional transform gizmos were implemented in the interface (e.g., see left image in Figure 7). For AR and VR, 3D widgets in the form of a cube for scaling and cone for translating were added. These widgets can be invoked from the main menu and, when dragged using a pinch gesture, they scale or translate the cuboid geometry in the direction of the movement, as can be seen in the right image in Figure 7.
3.3. User Study
A comparative study of the three different interface conditions based on concepts from AffordIt! [5] was performed to identify preferences and differences in usability and performance across conditions. We conducted a within-subjects design with one factor and three levels; the conditions were authoring tools deployed in (1) augmented reality, (2) virtual reality and (3) desktop. The order of each condition and the order of objects chosen in the experimental task were randomized to account for order effects. After completing the tasks in each condition, qualitative data were collected using post-condition surveys. A post-experience questionnaire was filled in by participants at the end of the study to gather their interface of preference for four aspects of the system. Post-condition surveys involved the use of custom (see Table 1) and standard questionnaires like NASA-TLX [63] to measure workload and System Usability Scale (SUS) [64] to measure usability. Quantitative data were saved from participants’ interactions with menus and objects during each condition. Time error rates and the frequency of participants undoing an action were recorded using scripts in the applications. Headset and hand tracking information was recorded as well. The user study did not involve simultaneous stands; each session only involved one participant at a time.
3.3.1. Participants and Apparatus
Twenty-one people (10 male, 9 female, 1 non-binary, 1 preferred not to say) aged 18 to 43 () participated in our study. Participants were recruited from a university population from a variety of majors, such as Computer Science, Electrical Engineering, Industrial Engineering, Biomedical Science, etc. All participants were right-handed. Davis’ Likert scale ratings [65] from 1 to 7, with 1 representing “little experience” and 7 “very experienced”, was used to measure the following: overall expertise using computers (), experience in VR () and experience with AR (). The experiment was conducted on a PC (Core i7-11700 CPU, Nvidia RTX 3080Ti graphics card, 32 GB RAM) via a 55-inch flat-panel TV display, and on the Varjo XR-3 HMD. The specifications for the HMD are as follows: horizontal field of view of 115, ultra-low latency, dual 12-megapixel video pass-through at 90 Hz, headset weight 594 g and headband 386 g. From the Varjo base manager configuration settings application, foveated rendering was disabled, the resolution quality was set to high (default)—35PPD, and simple rendering was enabled. Foveated rendering was disabled to achieve a similar frame rate for the AR and VR conditions, and also to avoid extra eye tracking calibration. The inter-pupillary distance was adjusted automatically for each participant.
3.3.2. Study Preparation
The room that the study took place in was 3D scanned using a FARO ultra-portable focus laser scanner set to the highest resolution. The dimensions of the room were (4 × 3)/2 m in a triangular shape free of obstacles. The area is defined by the yellow shaded region in Figure 8. Four objects were scanned using an Artec Eva 3D portable scanner. Three objects and the room background can be seen in Figure 9. The additional object scanned was a microwave, which was used for training participants in the UI. Meshes were generated from the point cloud captured. The virtual environment was an exact replica of the real physical room. The virtual environment was used for the desktop and VR conditions. For the AR condition, the virtual object meshes were used as occlusion material. Moreover, fiducials were taped to the real objects for increased precision when locating them with their digital twins. The rationale behind this decision was to better align the physical and virtual objects and also to recover tracking in the case of drifting. For VR, an additional fiducial was taped to a power plug on the wall, which was used to align the VR environment and to maximize the walking space for the participants inside the same room.
3.4. Participants’ Tasks in Study
The following tasks were required to be completed by participants for each of the virtual and real objects in the scene. The tasks involved segmenting components of a virtual object to then author behaviors on these new parts [5]. Participants performed these tasks using the three interface conditions.
3.4.1. Object Component Selection
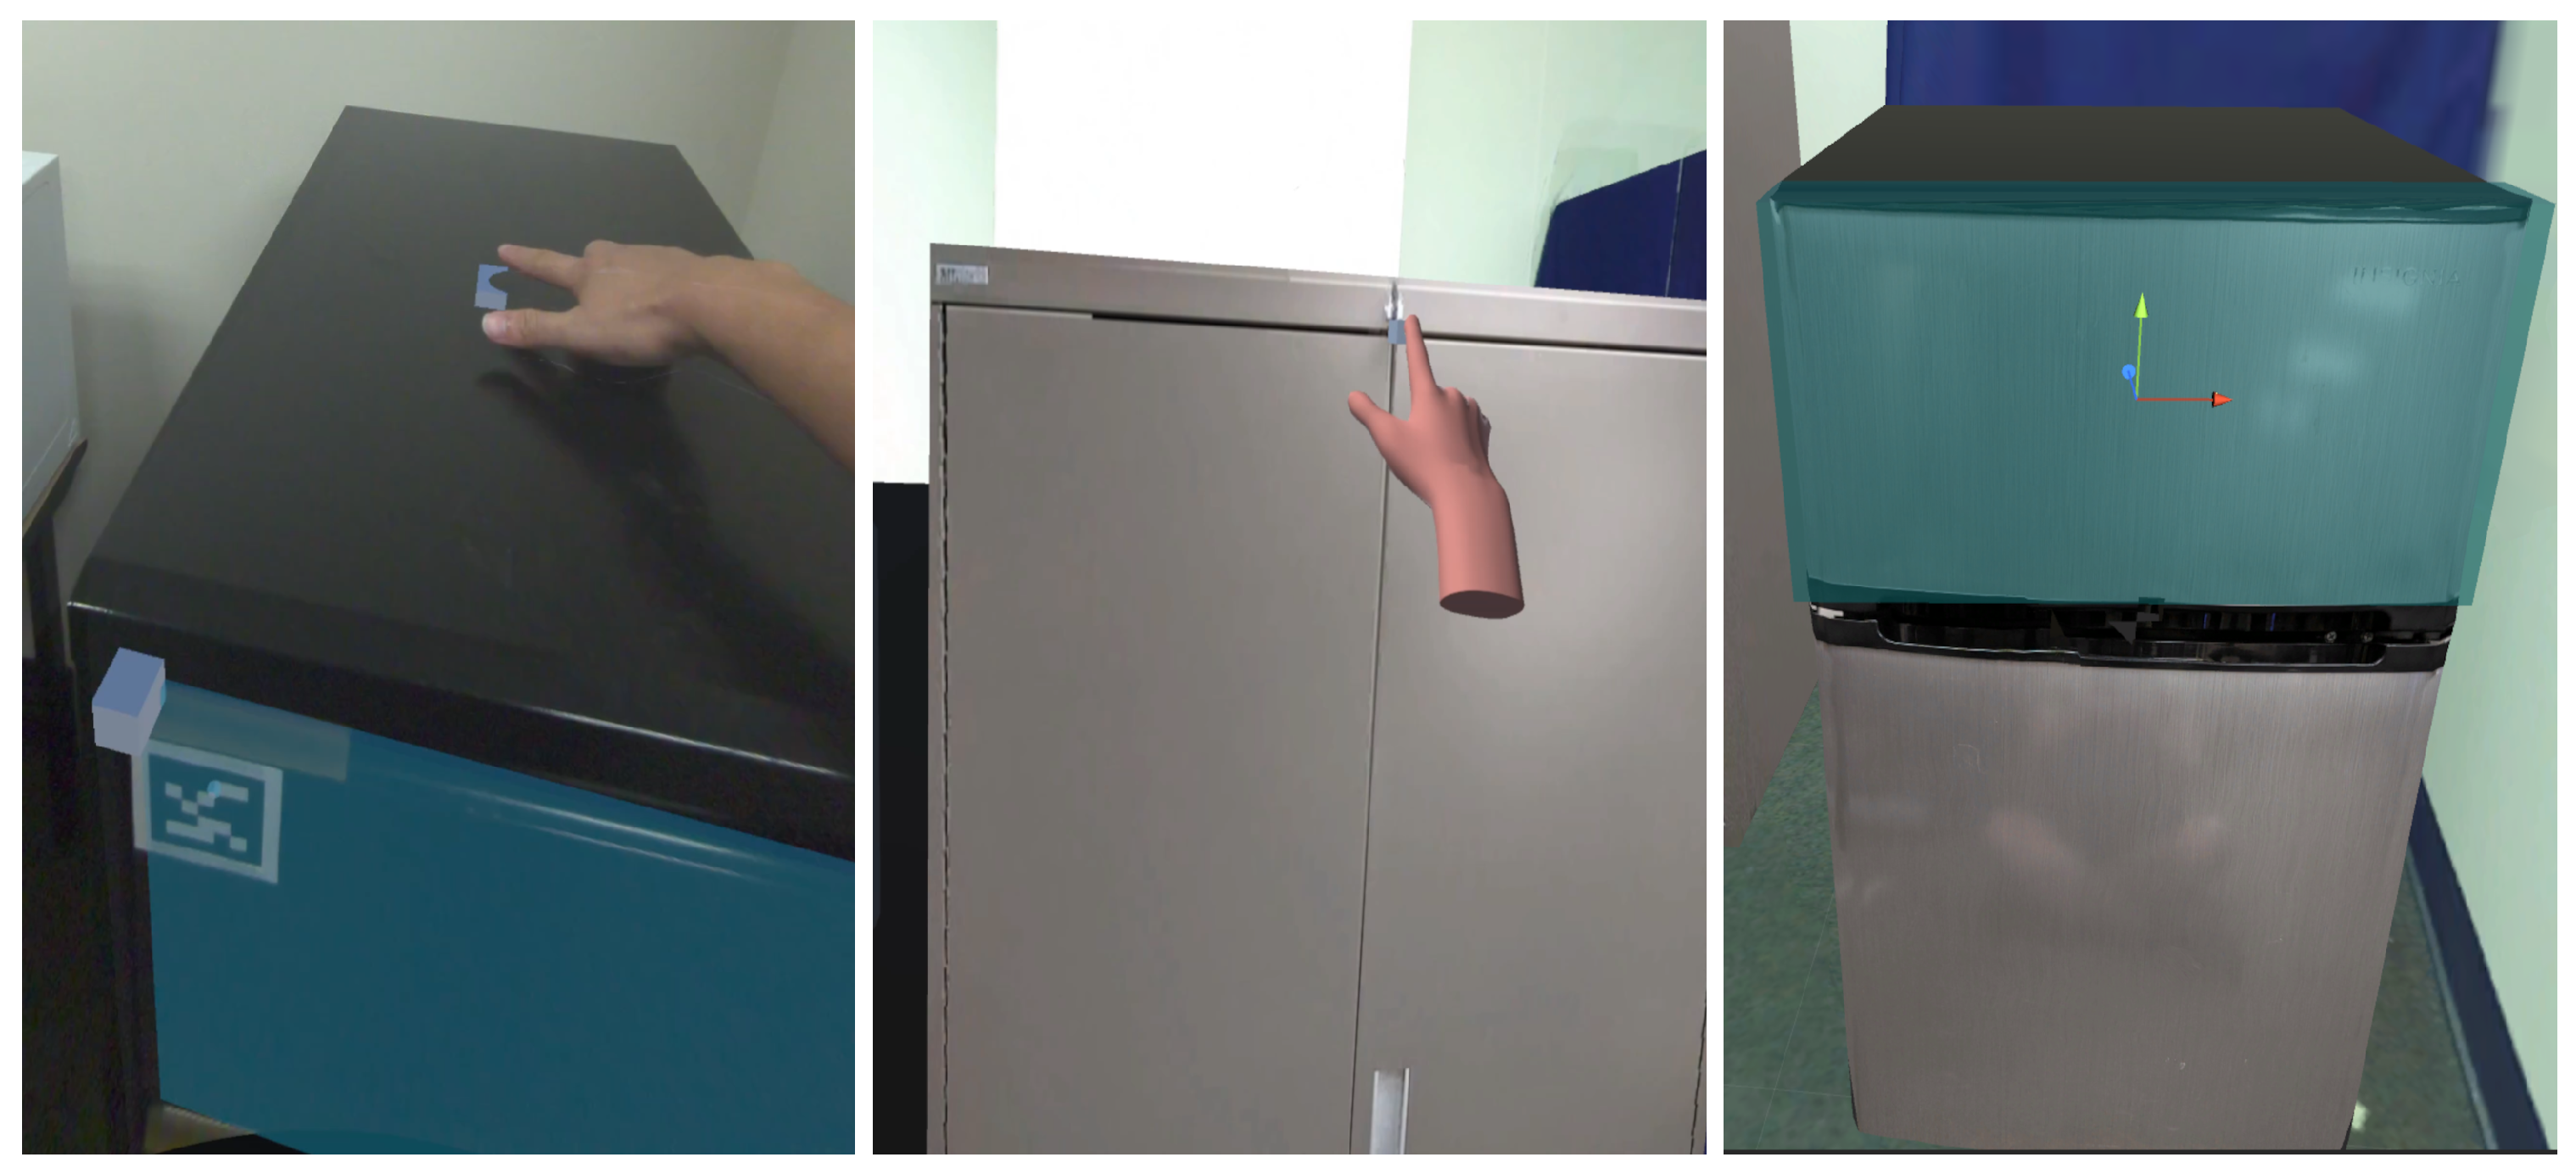
The objective of component selection is to surround the region of interest with a 3D primitive, which will define the part of the virtual object to author behaviors from. For this study, a cubic shape was the primitive chosen due to the geometry of the objects. A cubic shape is defined by three way points, with the first two positioned on opposite corners of the object component, forming a rectangle. A third point completes the cuboid shape in the inside direction of the object, as can be seen in the left image from Figure 10. For AR and VR, the points are placed in the position at which the index fingertip collides with the virtual object. For the desktop, the first two points are positioned by left clicking on top of the object with the mouse. After, the third point will be visible and can be dragged using a translation gizmo. The submit gesture completes the step in AR and VR. In desktop, left clicking the button “Complete Step” from the menu ends the step. The next step is to click “Cut Volume” from the main menu, which creates a new object component instance.
3.4.2. Perpendicular Pulling Behavior
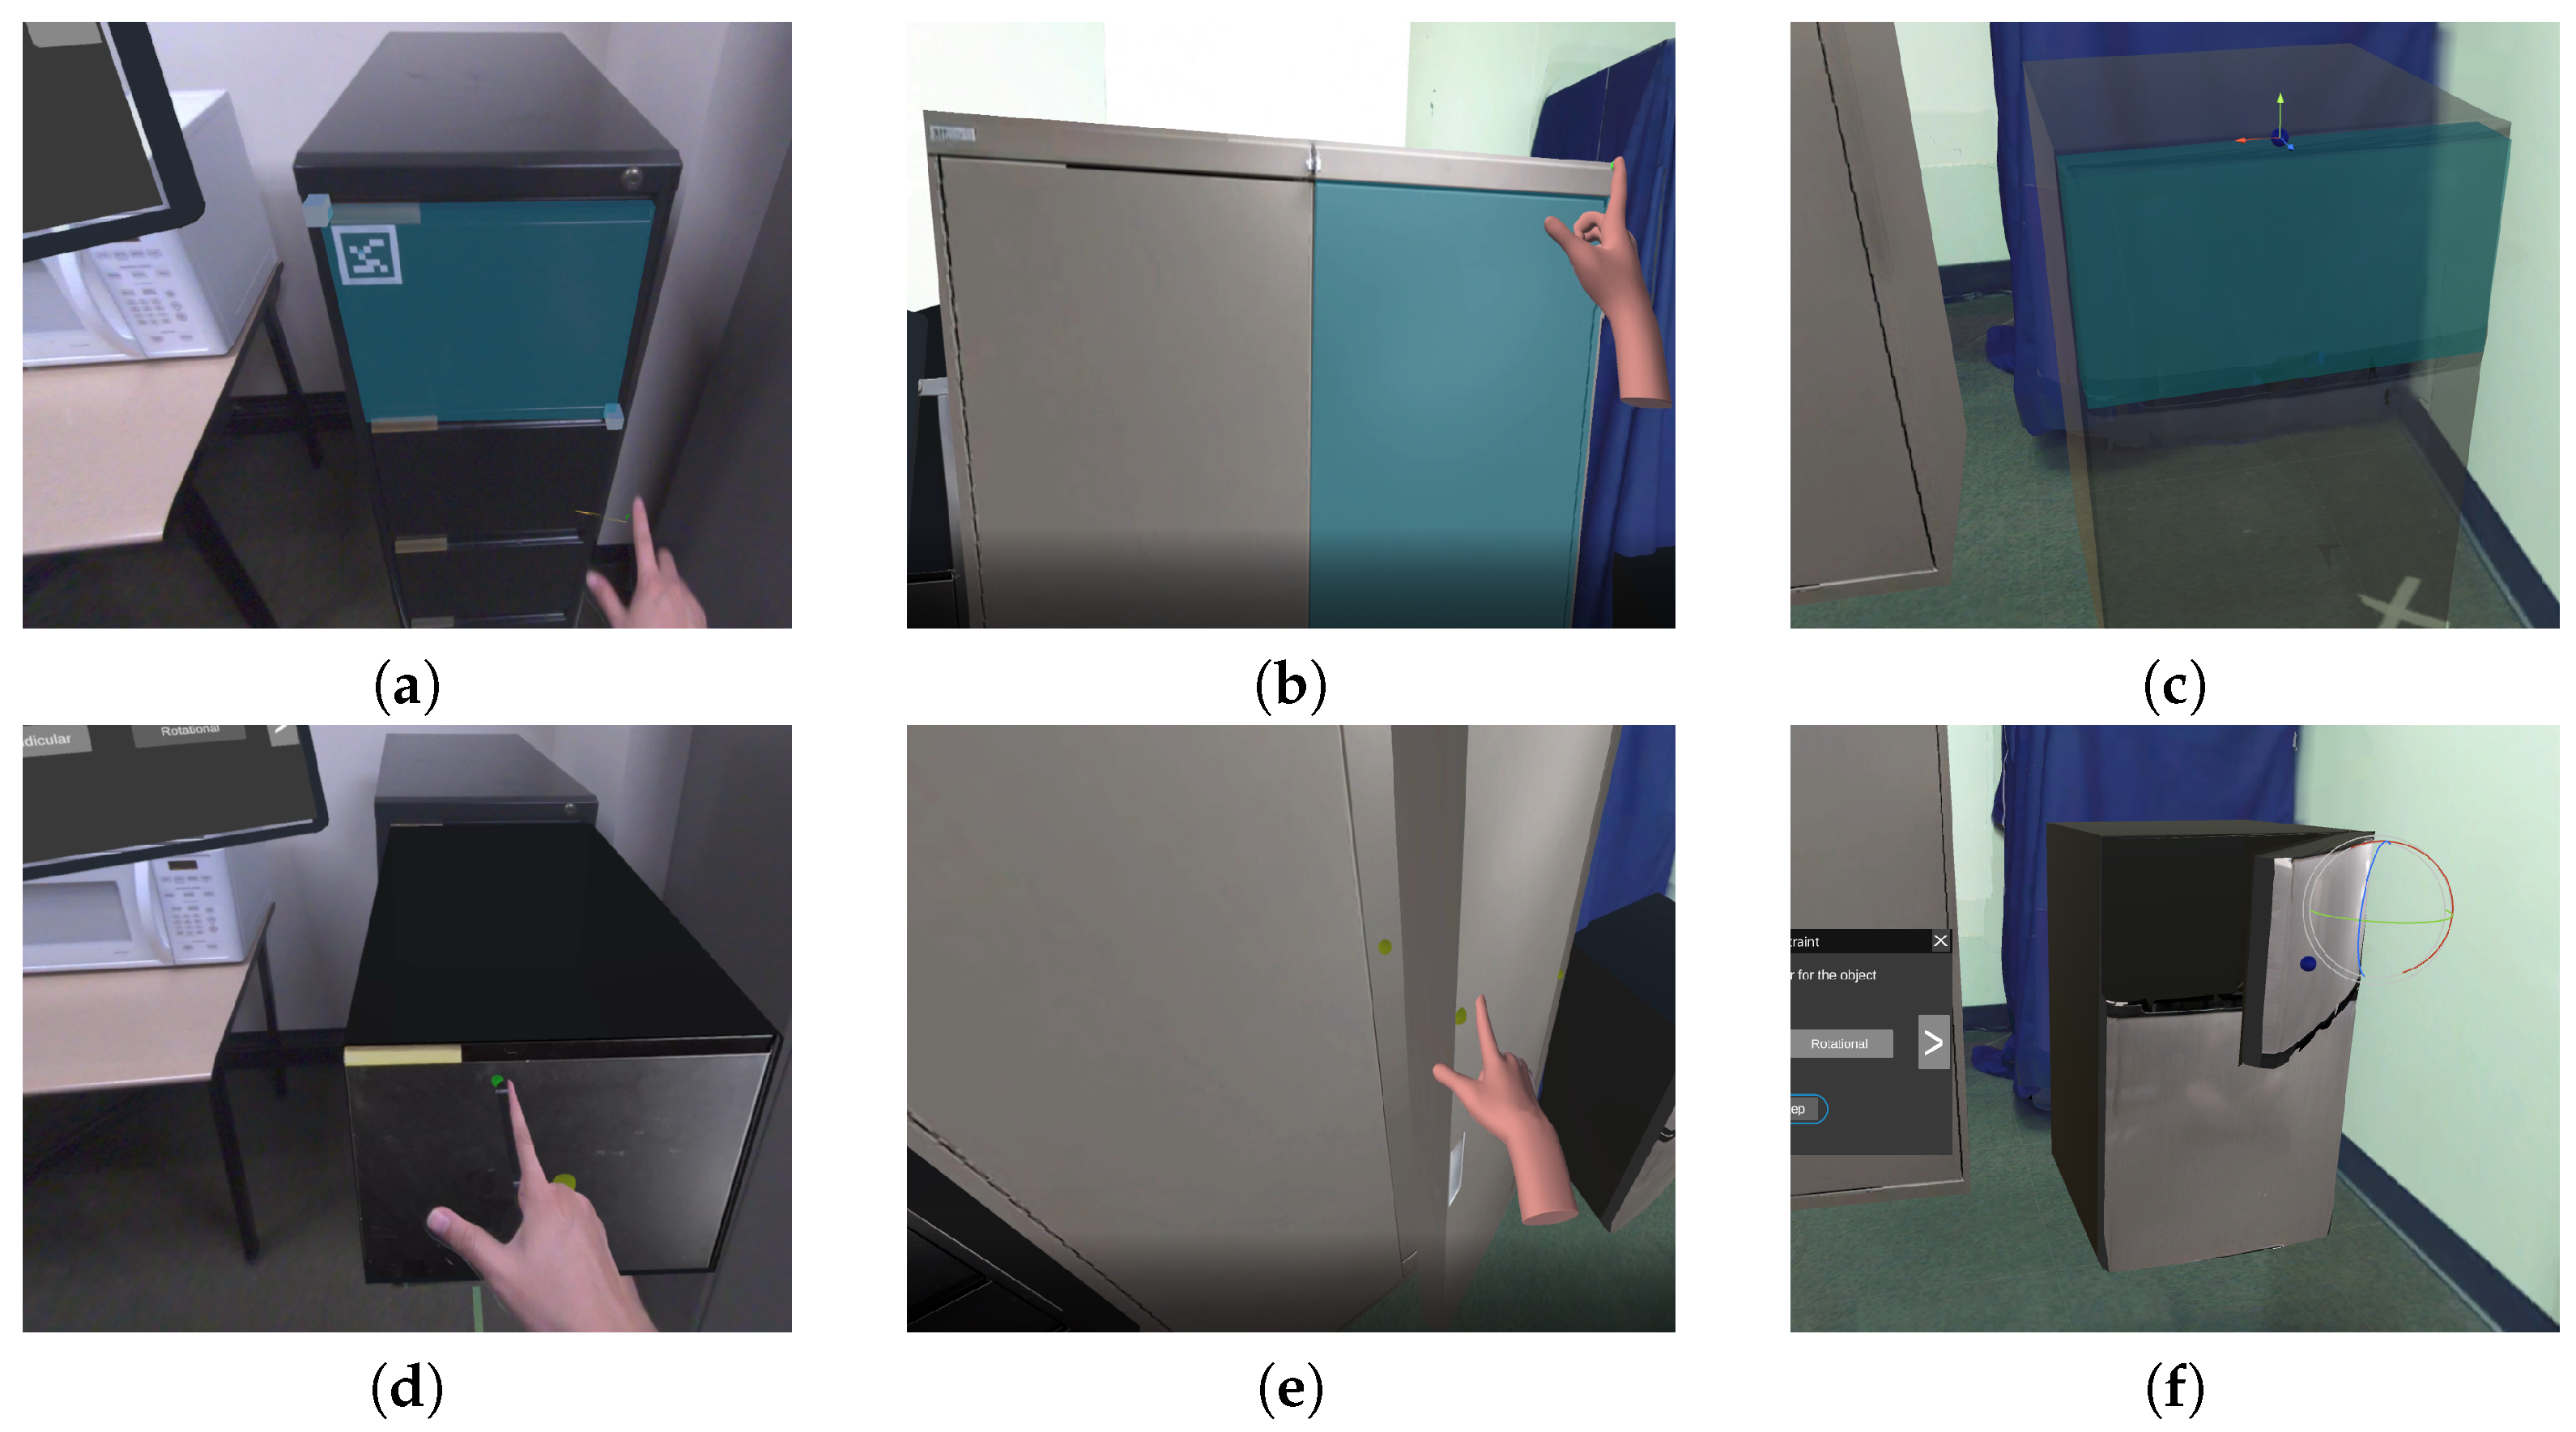
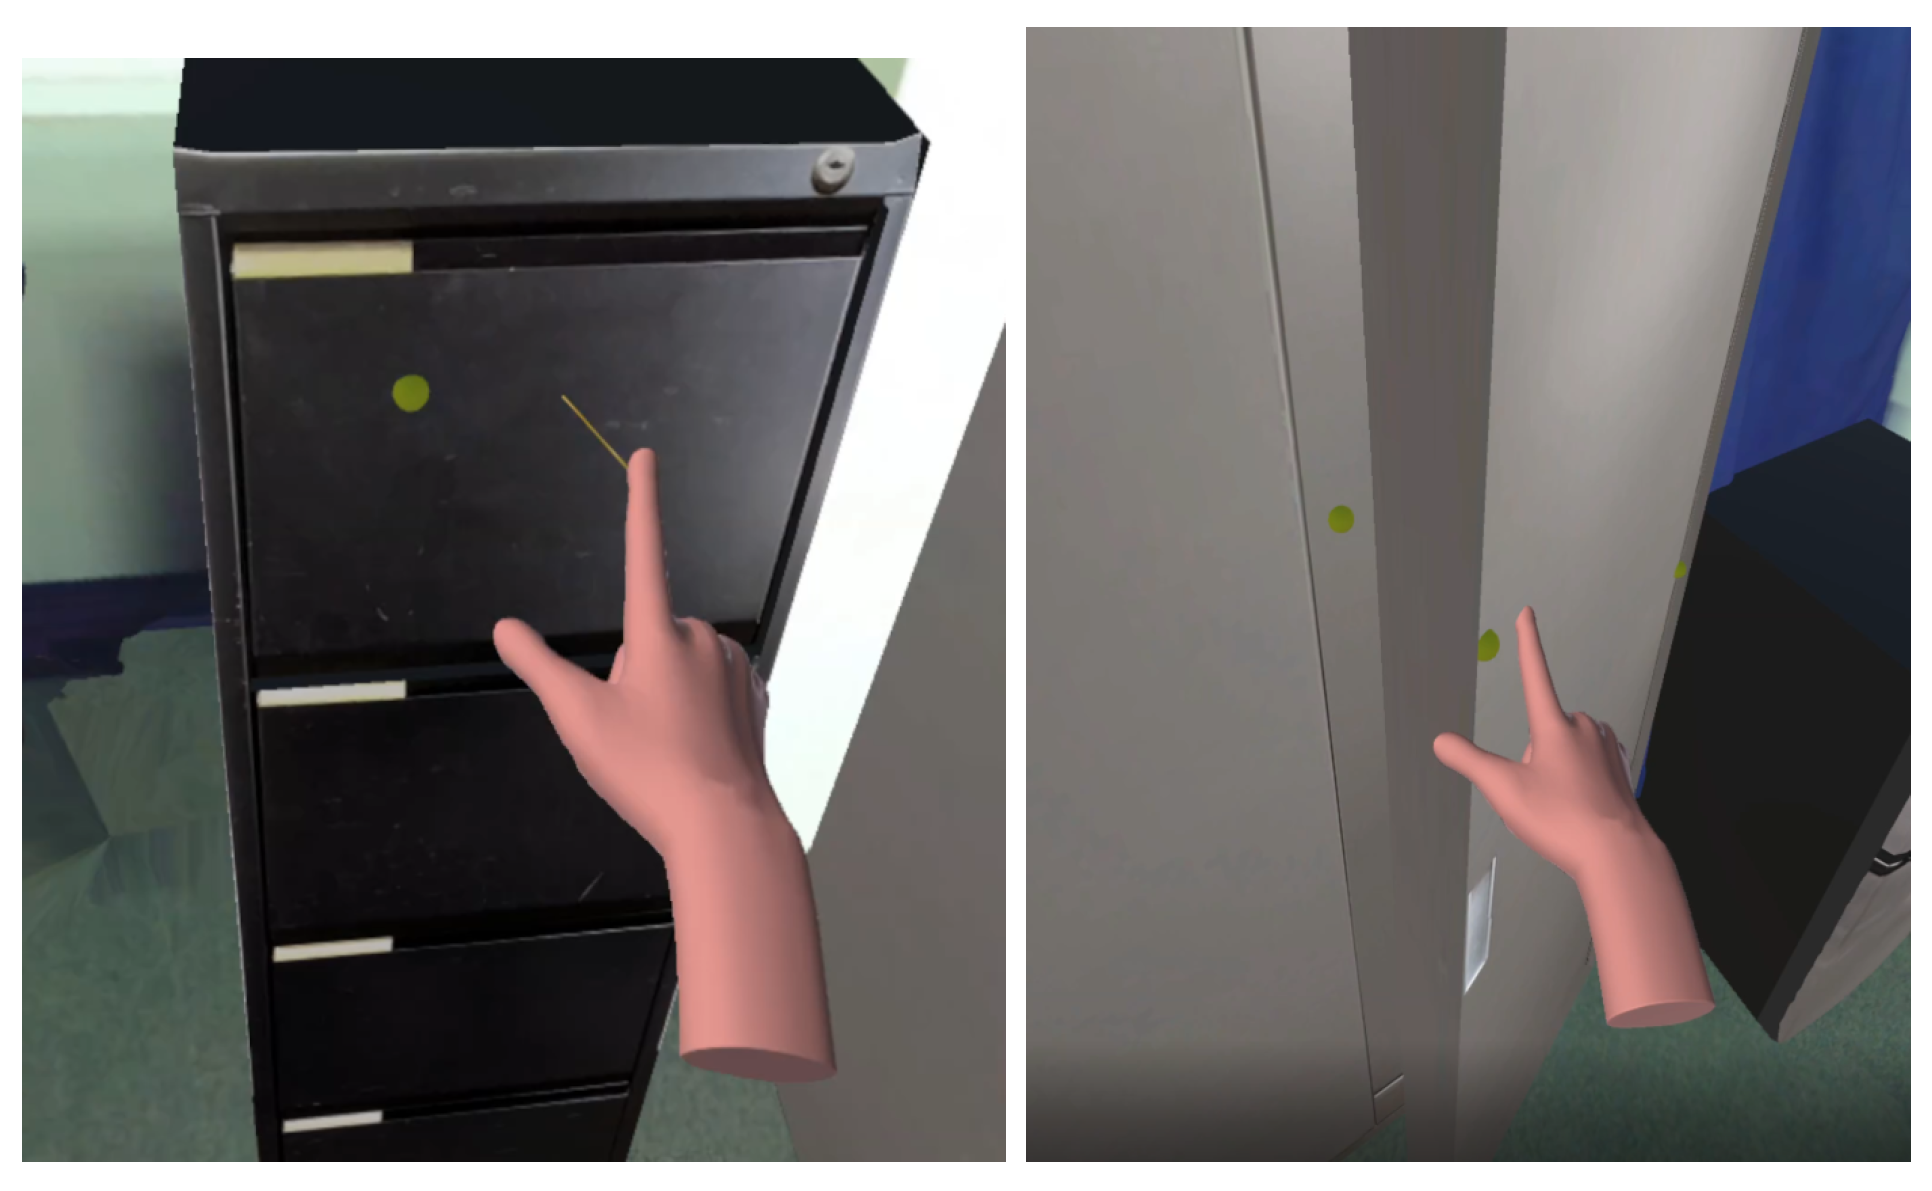
This behavior is generated from placing 5 points on the object component. The first three points define a plane and participants were asked to place the points in a non-linear way. The fourth and fifth point decide the perpendicular movement constraint (see left image in Figure 11). In AR and VR, the result is immediately visualized in 3D (see Figure 1a) and the final fifth point is decided with a submit gesture, explained in Figure 6. In desktop, the fifth point can be dragged with a translation gizmo to then “Complete Step” from the main menu.
3.4.3. Rotational Behavior
A rotation is defined by four points. The first two points establish the rotation axis; the third point is placed at the position from which they would grab the component to open it. The result is shown immediately with the component opening or closing based on the hand movement. In AR and VR, the step is completed by performing a submit gesture at the angle at which the component is opened; this positions the fourth point too. In desktop, a rotation gizmo is spawned around the pivoting axes to rotate the component as desired. The final position is recorded upon left clicking “Complete Step” in the main menu.
3.4.4. Visualize Result
Once a behavior is authored, participants can select from the main menu the option to “Animate” the behavior. The user can then visualize how the component is constrained to move based on the points added to it. The animation can be stopped as well, so as to not cause an additional distraction while authoring the behaviors of a different object.
3.5. Study Procedure
The study was designed to take around 90 min. Each participant was guided to the study room, and, while seated in front of a computer, a consent form was handed to them, explaining the experimental procedure. Upon agreeing to participate, the participant was asked to fill in a demographics and prior experience questionnaire. The problem was then explained for about five minutes to then proceed to the randomly selected condition to start the study. A video tutorial of approximately three minutes before starting each condition was provided to familiarize the participant with the concepts and user interface. Equipment used for the study (head-mounted display and headphones for AR/VR; only headphones for desktop) was then handed to the participant.
For the VR condition, the participant was asked to hold the HMD in front of a tag placed on the wall of the room. The proctor then pressed the primary button on the controller twice. This served to align the virtual scene always to the same position for all participants. The HMD and headphones could then be worn.
For the AR condition, participants wore the HMD and headphones first and then, before interacting with each object, the participant was asked to look for several seconds at a marker on the physical object. In Figure 12, the left image shows a green square that is invoked by the proctor pressing the primary button to start alignment, and a blue square is shown when the object alignment is completed by the proctor with a second primary button press. This is to align the digital twin object to the physical one.
Each intervention was expected to last 10–15 min to minimize the simulator sickness risk. The study started with a training session involving a task similar to the ones performed in the experiment. For AR and VR, during training, the user was asked to perform the thumb gesture 5 times, and each one spawned a green cube for feedback, to familiarize the participant with this interaction. For desktop, instead, participants were asked to familiarize themselves with the camera manager interface. This interface was chosen as it is standard across 3D editing tools, e.g., the Unity3D editor. The study started with users randomly assigning behaviors to each object. The screen session was video-recorded. A post-condition questionnaire was then filled in by the participant to evaluate the interface assigned at the end of the session. Once all conditions were completed, a post-experience questionnaire was provided, to gather preference information and thoughts from the conditions experienced. A complete flow chart of the study procedure can be seen in Figure 13.
4. Results
Quantitative and qualitative data were gathered and analyzed in the study. For quantitative data, time and error rates were collected with scripts during task completion. For qualitative data, standard and custom questionnaires (see Table 1) were filled in by participants based on the user experience in each condition. All participants successfully completed all tasks assigned by the proctor. The goal of the following statistical analysis is to determine differences in usability and performance between participants solving the tasks assigned across the different conditions.
4.1. Time and Error Rates
The time spent by participants while performing the tasks assigned was calculated per condition from the moment that participants pressed the button on the menu to start the object component selection until the moment that they visualized the result by pressing the “Animate” button. This was done for each of the three objects interacted with. The total time distribution is shown in Figure 14 for each condition in the experiment. A Shapiro–Wilk test on each condition time showed that desktop and VR were not normally distributed. Therefore, Friedman’s test was used and revealed no significant differences in the times spent by participants to complete the tasks in AR, VR and desktop . However, a post-hoc analysis using the Wilcoxon signed-rank test for pairs revealed that participants spent significantly more time in AR than desktop () to complete their tasks. No difference was found between the other two pairs.
Error rates were calculated for the object component selection sub-task. The object component behavior definition was performed correctly by all participants. For the cubic shape, the error was calculated using three points from the cube selector. The error was calculated by summing up the Euclidean distances between points positioned by participants with the correct calculated point position. This procedure was repeated on each object. The total error rate distribution can be seen in Figure 15. A Shapiro–Wilk test showed that the data were normally distributed in each condition and non-extreme outlier data points were found. Therefore, a repeated measures ANOVA test was used and revealed that the error measurements were statistically significantly different at the different conditions, , . Post-hoc analyses with Bonferroni adjustment revealed that all the pairwise differences between error measurements were statistically significantly different (); refer to the exact values in Figure 15.
4.2. Usability and Perception
A Friedman’s test followed by a post-hoc analysis using Wilcoxon signed rank tests for pairs was used to analyze the differences between the SUS scores per participant across the three conditions. The SUS score was statistically significantly different across conditions using the Friedman test. The pairwise Wilcoxon signed rank test between interface conditions revealed statistically significant differences in SUS scores between desktop and AR (), desktop and VR () and VR and AR (). The overall usability scores from SUS were for AR (), VR () and desktop ().
Table 2 shows the results for the Likert scale ratings from Table 1. In bold statistical significance. For question 4, a Mann–Whitney U test revealed no significant difference in the perceived weight of the headset between participants in the AR and VR conditions. Question 5, on the other hand, with the same test showed that hand tracking was perceived significantly better in VR (Md = 6, n = 21) than AR (Md = 3, n = 21), (). The rest of the questions are summarized as follows and the results are visualized in Figure 16:
- Participants rated the importance of the task on the desktop significantly higher than if performed in AR.
- Participants reported having significantly more prior experience in desktop than in AR and VR.
- There was no significant difference found in how realistic the participants perceived the objects to be in the scene in each condition.
- Pressing buttons in the UI canvas was more difficult in AR than in desktop and VR.
- Desktop was perceived as significantly easier to use to complete the tasks assigned than AR and VR.
- AR was a significantly less enjoyable experience than VR and desktop.
4.3. Workload
To analyze the workload ratings, we used Friedman’s test followed by a post-hoc analysis using Wilcoxon signed rank tests for pairs (Table 3). Average ratings for workload are summarized in Figure 17 with each subscale represented as follows: Mental Demand (MD), Physical Demand (PD), Temporal Demand (TD), Own Performance (OP), Effort (EF), Frustration Level (FL). From the results that we obtained, we concluded the following:
- Participants perceived the workload similarly between AR and VR in 5 of 6 factors measured.
- Frustration levels were significantly higher between AR and VR.
- AR and VR, when compared to desktop, showed significantly higher workload ratings in 4 of 6 factors measured.
- Performance was perceived significantly better when using the desktop condition than AR.
- No significant difference in temporal demand was found across conditions.
4.4. Preference
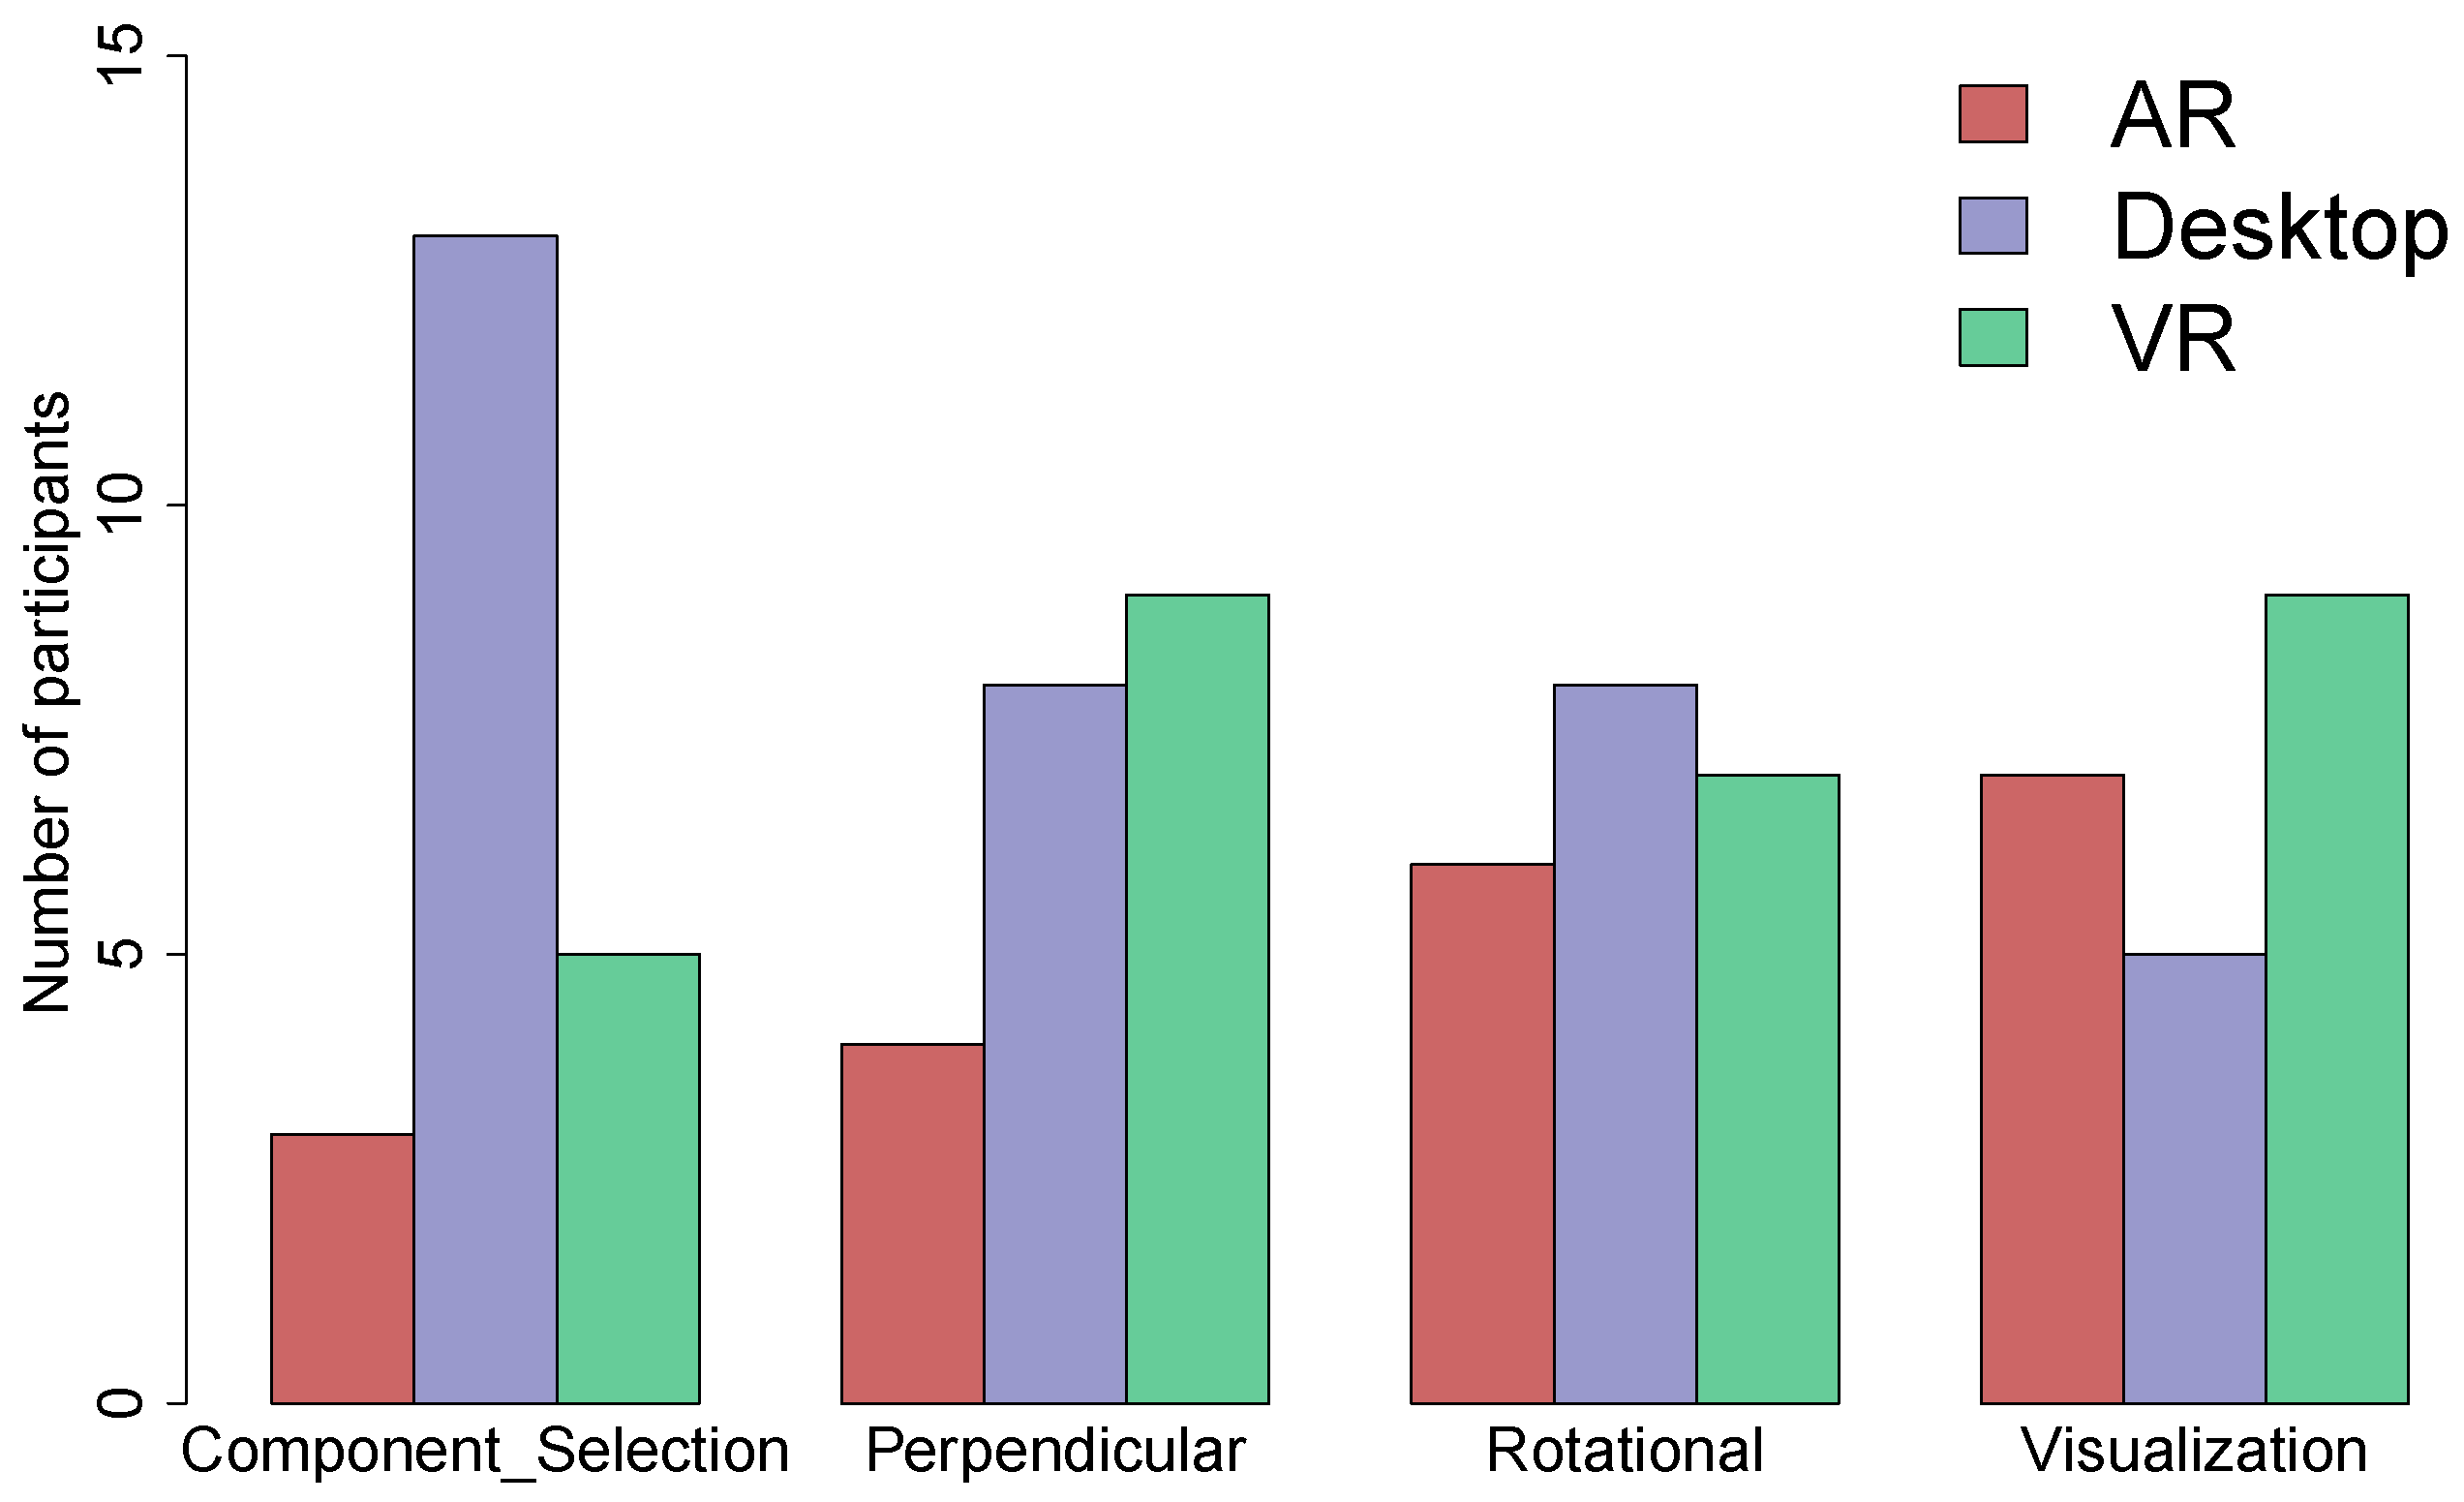
In our preference survey, participants were asked to choose a condition in which they would perform the following actions: (1) add a component selection, (2) add a perpendicular pulling behavior, (3) add a rotation behavior and (4) visualize the outcome. A chi-square goodness-of-fit test was performed to determine whether the proportion of the observed number of subjects choosing a condition was equal to a group with proportions equally distributed. The proportion of subjects’ preference did differ by task 1, . The proportion of subjects choosing a condition did not differ by tasks 2, 3 and 4. Figure 18 shows the preference for each aspect and condition.
5. Discussion
In line with the results from AffordIt! [5], the concepts used to define object components’ behaviors were well received. Overall, participants were able to complete the tasks assigned in the three conditions. A similar interaction workflow was followed and implemented across the three interfaces. The interaction techniques and visualization changed in each condition evaluated.
5.1. Authoring Time
Hand tracking contributed to authoring in AR demanding significantly more time than on desktop. Interestingly, hand tracking in AR was perceived as less accurate than in VR, even though the same component was used. The possible reason behind perceiving hand tracking as an issue in AR is the lack of feedback used for the hand while being tracked in AR. For instance, VR hand tracking loss would involve not seeing the virtual hands at all at any given time. However, in AR, the pointer in the index finger was the only visual cue for hand tracking perceived. When losing tracking in AR, the real hand would still be visible, as opposed to VR, where the hand disappears. Tracking is lost due to participants placing their hands away from the headset view or by the hand being occluded by the real object. In VR, participants intuitively kept their hands in a better position and no occlusion from real objects occurred. Some participants commented on this after the study:
User 19: “AR seemed to be more inconsistent with its tracking compared to VR."
User 2: “AR was really hard to realign my hands and do selections."
5.2. Tasks Requiring Precise Interaction
The object component selection with the cubic shape required participants to look for corners within the object to place points and accurately surround the component with a selector. Desktop provided a clear advantage for such a task. For tasks requiring higher precision, we recommend using a more precise input tool or a completely new interaction technique possibly involving the use of both hands. These results are in line with the work by Rantamaa et al. [66] in the medical context. Participants in AR and VR commented the following.
User 13 while in VR: “It was easy to perform the initial interaction with the object. The challenge was lining up the virtual maker points with the objects edges and not performing the gesture."
User 17 in AR: “The easiest was to measure volume. a challenge was trying to get the points exactly where I wanted them to be."
Despite the lack of precision, some participants in desktop reported issues while estimating the depth of the cube for the component selection. While this was an issue in desktop, they did not report it in AR or VR. Determining the depth for an object component selection involved, in most cases, navigating the scene with the camera or changing the camera perspective, which was reported by five participants to be challenging in desktop.
Desktop participant 16: “I found it easy to select the size of the door at first. It was a bit difficult to calculate how far back the cabinet door went."
The abovementioned issues justify the significant difference between conditions in error measurements (see Figure 15). The desktop distribution’s calculated errors are more compact than for VR and AR.
5.3. Usability
The workload results showed significantly higher ratings for AR and VR. This was expected due to the exertion and greater physical demand when navigating the scene. However, AR presents a higher frustration level than VR and desktop. Similarly, the raw SUS scores are significantly lower for the AR condition, with a mean value below the average. The issues with hand tracking and gesture detection discussed above could have contributed to these scores. The low familiarity of participants with the immersive systems compared to desktop is another factor to consider for these results. Despite this, participants’ comments were positive towards using AR and VR for authoring object component behaviors:
User 4: “authoring through AR and VR seems more immersive and natural rather than desktop, also it resembles a real life experience when it comes to authoring that behavior."
User 2: “Desktop interface is very good! I would use it the most I think. But it is more fun to open a door in 3D. It really feels like I am opening and closing it more there."
User 19: “Authoring in 3D has great advantages from doing the experience. It is a lot easier to navigate to the objects, and with AR, you can physically touch the objects and model them more accurately. I think as tracking improves, it is definitely the next step for modeling objects and is much more intuitive."
5.4. Recommendations for Authoring of Object Components’ Behaviors
For tasks involving precise interactions, this work recommends using a desktop interface. Further research needs to consider higher-precision input tools in 3D that simulate the mouse effect in a desktop environment. The object component selection was by far the most difficult part in AR and VR, and most participants preferred a desktop interface to author such tasks, as seen in Figure 18. Authoring a behavior did not require high precision in the positioning of points. According to the preference scores, participants did not significantly choose one condition or the other for these types of tasks. However, participants found it significantly easier to perform these tasks on the desktop. As for visualizing the authored behavior, no interface was preferred significantly more than the other. This work recommends to author behaviors in desktop and visualize results in 3D immersive environments as it was found to be a more compelling experience, as participants reported post-experience.
User 17: “Augmented reality made it feel more real since real objects were being used, so it was easy visualize it a bit more."
User 14: “AR and VR were pretty similar to me, I feel AR safer since you are interacting with the actual environment but I understand cases were VR would be necessary."
With the increasing detail, realism and graphics capabilities, coupled with hardware that provides a high pixel density and higher resolutions for head-mounted displays, it is interesting to understand how much realism affects the experience, as participant number 18 mentioned in the following comment:
“I think, in AR, it was slightly more difficult to draw the line between reality and what is augmented. In the sense of, I am in this virtual world, but these are real objects made virtual. As a result, the lines were more blurred. In VR, I know it is virtual, even if the world around me is real but I know that I do not have to physically interact with the items. I think that creates a slight mental shift, in terms of accuracy and expected behaviors. For the desktop, I think it is easy to get a feel for the behavior to expect due to the fact that there is no sense of virtual attached to it. It is an item on a desktop and you know what outcome to expect in your behaviors."
Blending highly realistic graphics with reality can change what one expects to do or how an experience is perceived. This work recommends further research into how passive haptics, interaction and graphics fidelity affect user experience, similar to the work by [67] in the golf sport context.
6. Limitations
We acknowledge that there is a limitation in the study given that the systems were tested with one task. In the future, a complete evaluation would involve different types of tasks and objects with different geometries and components within the context of a given scenario.
An additional area for exploration is the seamless use of a 2D canvas for higher-precision tasks within an immersive environment, which could allow us to visualize the authoring outcome as it happens. Blending 2D and 3D interactions could alleviate some of the challenges found in this work. As explained above, limitations in hand tracking could have hindered the results for AR and, to a lesser extent, VR. With a more precise interaction tool, e.g., a stylus, the results would be improved to be comparable to or better than those of desktops. Finally, an additional area for further exploration is how two or more participants would collaborate to author component behaviors beyond sliding and rotating parts on more complex digital twins.
7. Conclusions
This paper evaluated three custom-built applications adopting the AffordIt! concepts [5]. Differences were found across the three interfaces in error measurements, but not in the time spent performing tasks. Significance was only found between AR and desktop for time completion. The desktop interface was favored by participants due to its ease of use and precision. However, participants’ perception of AR and VR was reported as very positive and encouraging from the preference results and interview questions. Visualizing the result of the outcome across conditions did not yield a significant preference, but was well received in comments post-experience. The results show that in order to take full advantage of situated authoring, the excessive workload and low usability need to be improved so as to not be a factor that could hinder the potential benefits of immersive experiences within AR and VR.
For researchers, there is an opportunity to continue exploring authoring in immersive environments on the rest of the taxonomy defined by Kallmann et al. [19,20,21,27] for virtual object behaviors. Improved automatic segmentation [23,24] on open-ended meshes to isolate parts of objects would alleviate some of the authoring process. Finally, surveying the creation of templates that can be applied to semantically similar parts is also an area that needs further work, e.g., the black drawer from the study had four doors; when one behavior is authored, it should be easily replicated to the rest of the doors. For practitioners, we recommend staying with desktop tools for the editing or authoring of these types of behaviors on moving parts and visualizing the result of the authoring within an immersive approach such as VR or AR.
At the current time, desktop is the best-suited interface to author the types of behaviors for the moving parts presented in this paper. However, this preference was only significant in the object component selection and not in the definition of the behavior. Users showed high engagement with and a positive response to the AR/VR experiences, as can be seen in the user comments. Improving usability within 3D user interfaces and reducing the workload are key aspects to push the use of immersive environments for the authoring of objects’ moving parts.
Author Contributions
The work is a product of the intellectual environment of the authors and all members contributed equally to the analytical methods used, to the research concept and to the experimental design. All authors have read and agreed to the published version of the manuscript.
Funding
This work is supported in part by NSF Award IIS-1917728, Northrop Grumman., Unknot.id, and the Florida High Tech Corridor Council Industry Matching Research Program.
Institutional Review Board Statement
The study protocol was approved by the Institutional Review Board of the University of Central Florida with IRB ID: STUDY00004711, Granted: 31 October 2022.
Informed Consent Statement
Informed consent was obtained from all subjects involved in the study.
Data Availability Statement
Data is contained within the article.
Acknowledgments
We thank the anonymous reviewers for their insightful feedback and the ISUE lab members for their support.
Conflicts of Interest
The authors declare no conflict of interest.
References
- Jean, L.; Wenger, E. Situated Learning: Legitimate Peripheral Participation; Cambridge University Press: Cambridge, UK, 1991. [Google Scholar]
- Gonzalez, A.V.; Koh, S.; Kapalo, K.; Sottilare, R.; Garrity, P.; Billinghurst, M.; LaViola, J. A comparison of desktop and augmented reality scenario based training authoring tools. In Proceedings of the 2019 IEEE International Symposium on Mixed and Augmented Reality (ISMAR), Beijing, China, 14–18 October 2019; pp. 339–350. [Google Scholar]
- Qian, X.; He, F.; Hu, X.; Wang, T.; Ipsita, A.; Ramani, K. ScalAR: Authoring Semantically Adaptive Augmented Reality Experiences in Virtual Reality. In Proceedings of the CHI Conference on Human Factors in Computing Systems, New Orleans, LA, USA, 30 April–5 May 2022; pp. 1–18. [Google Scholar]
- Izquierdo-Domenech, J.; Linares-Pellicer, J.; Orta-Lopez, J. Supporting interaction in augmented reality assisted industrial processes using a CNN-based semantic layer. In Proceedings of the 2020 IEEE International Conference on Artificial Intelligence and Virtual Reality (AIVR), Virtual/Online Event, 14–18 December 2020; pp. 27–32. [Google Scholar]
- Masnadi, S.; Vargas, A.; Williamson, B.; LaViola, J. AffordIt!: A Tool for Authoring Object Component Behavior in Virtual Reality. In Proceedings of the 2020 IEEE Conference on Virtual Reality and 3D User Interfaces Abstracts and Workshops (VRW), Atlanta, GA, USA, 22–26 March 2020. [Google Scholar]
- Wang, T.; Qian, X.; He, F.; Hu, X.; Cao, Y.; Ramani, K. GesturAR: An Authoring System for Creating Freehand Interactive Augmented Reality Applications. In Proceedings of the the 34th Annual ACM Symposium on User Interface Software and Technology, Virtual, 10–14 October 2021; pp. 552–567. [Google Scholar]
- MacIntyre, B.; Gandy, M.; Dow, S.; Bolter, J.D. DART: A toolkit for rapid design exploration of augmented reality experiences. In Proceedings of the 17th Annual ACM Symposium on User Interface Software and Technology, Santa Fe, NM, USA, 24–27 October 2004; pp. 197–206. [Google Scholar]
- Seichter, H.; Looser, J.; Billinghurst, M. ComposAR: An intuitive tool for authoring AR applications. In Proceedings of the 7th IEEE/ACM International Symposium on Mixed and Augmented Reality, Cambridge, UK, 15 September 2008; pp. 177–178. [Google Scholar]
- Lucrecia, M.; Cecilia, S.; Patricia, P.; Sandra, B. AuthorAR: Authoring tool for building educational activities based on Augmented Reality. In Proceedings of the Collaboration Technologies and Systems (CTS), 2013 International Conference, San Diego, CA, USA, 20–24 May 2013; pp. 503–507. [Google Scholar]
- Ens, B.; Anderson, F.; Grossman, T.; Annett, M.; Irani, P.; Fitzmaurice, G. Ivy: Exploring Spatially Situated Visual Programming for Authoring and Understanding Intelligent Environments. In Proceedings of the 43rd Graphics Interface Conference, School of Computer Science, University of Waterloo, Waterloo, ON, Canada, 16–19 May 2017; pp. 156–162. [Google Scholar] [CrossRef]
- Winterbottom, C.; Blake, E. Designing a VR interaction authoring tool using constructivist practices. In Proceedings of the 3rd International Conference on Computer Graphics, Virtual Reality, Visualisation and Interaction in Africa, Stellenbosch, South Africa, 3–5 November 2004; pp. 67–71. [Google Scholar]
- Hayatpur, D.; Heo, S.; Xia, H.; Stuerzlinger, W.; Wigdor, D. Plane, Ray, and Point: Enabling Precise Spatial Manipulations with Shape Constraints. In Proceedings of the 32nd Annual ACM Symposium on User Interface Software and Technology, New Orleans, LA, USA, 20–23 October 2019; pp. 1185–1195. [Google Scholar]
- Ng, G.; Shin, J.G.; Plopski, A.; Sandor, C.; Saakes, D. Situated game level editing in augmented reality. In Proceedings of the Twelfth International Conference on Tangible, Embedded, and Embodied Interaction, Stockholm, Sweden, 18–21 March 2018; pp. 409–418. [Google Scholar]
- Lee, G.A.; Nelles, C.; Billinghurst, M.; Kim, G.J. Immersive authoring of tangible augmented reality applications. In Proceedings of the 3rd IEEE/ACM international Symposium on Mixed and Augmented Reality, Arlington, VA, USA, 2–5 November 2004; pp. 172–181. [Google Scholar]
- Kim, H.; Hong, S.; Kim, J.; Jang, T.; Woo, W.; Heo, S.; Lee, B. RealityBrush: An AR authoring system that captures and utilizes kinetic properties of everyday objects. Multimed. Tools Appl. 2021, 80, 31135–31158. [Google Scholar] [CrossRef]
- Holm, R.; Stauder, E.; Wagner, R.; Priglinger, M.; Volkert, J. A combined immersive and desktop authoring tool for virtual environments. In Proceedings of the IEEE Virtual Reality 2002, Orlando, FL, USA, 24–28 March 2002; pp. 93–100. [Google Scholar]
- Gruenefeld, U.; Auda, J.; Mathis, F.; Schneegass, S.; Khamis, M.; Gugenheimer, J.; Mayer, S. VRception: Rapid Prototyping of Cross-Reality Systems in Virtual Reality. In Proceedings of the 2022 CHI Conference on Human Factors in Computing Systems, New Orleans, LA, USA, 30 April–5 May 2022; pp. 1–15. [Google Scholar]
- Kallmann, M.; Thalmann, D. Modeling objects for interaction tasks. In Computer Animation and Simulation’98; Springer: Berlin/Heidelberg, Germany, 1999; pp. 73–86. [Google Scholar]
- Kallmann, M.; Thalmann, D. A behavioral interface to simulate agent-object interactions in real time. In Proceedings of the Proceedings Computer Animation 1999, Geneva, Switzerland, 26–29 May 1999; pp. 138–146. [Google Scholar]
- Kallmann, M.; Thalmann, D. Modeling behaviors of interactive objects for real-time virtual environments. J. Vis. Lang. Comput. 2002, 13, 177–195. [Google Scholar] [CrossRef]
- Kallmann, M. Interaction with 3-d objects. In Handbook of Virtual Humans; Wiley: Hoboken, NJ, USA, 2004; pp. 303–322. [Google Scholar]
- Chidambaram, S.; Huang, H.; He, F.; Qian, X.; Villanueva, A.M.; Redick, T.S.; Stuerzlinger, W.; Ramani, K. Processar: An augmented reality-based tool to create in-situ procedural 2d/3d ar instructions. In Proceedings of the Designing Interactive Systems Conference 2021, Virtual, 28 June–2 July 2021; pp. 234–249. [Google Scholar]
- George, D.; Xie, X.; Tam, G.K. 3D mesh segmentation via multi-branch 1D convolutional neural networks. Graph. Model. 2018, 96, 1–10. [Google Scholar] [CrossRef]
- Shamir, A. A survey on mesh segmentation techniques. Proc. Comput. Graph. Forum 2008, 27, 1539–1556. [Google Scholar] [CrossRef]
- Valentin, J.; Vineet, V.; Cheng, M.M.; Kim, D.; Shotton, J.; Kohli, P.; Nießner, M.; Criminisi, A.; Izadi, S.; Torr, P. Semanticpaint: Interactive 3d labeling and learning at your fingertips. ACM Trans. Graph. (TOG) 2015, 34, 154. [Google Scholar] [CrossRef]
- Nguyen, D.T.; Hua, B.S.; Yu, L.F.; Yeung, S.K. A robust 3d-2d interactive tool for scene segmentation and annotation. IEEE Trans. Vis. Comput. Graph. 2017, 24, 3005–3018. [Google Scholar] [CrossRef] [PubMed]
- Thalmann, D. Geometric issues of object manipulation in task animation and virtual reality. In Expanding the Frontiers of Visual Analytics and Visualization; Springer: Berlin/Heidelberg, Germany, 2012; pp. 339–362. [Google Scholar]
- Masnadi, S.; LaViola, J.J., Jr.; Zhu, X.; Desingh, K.; Jenkins, O.C. A Sketch-Based System for Human-Guided Constrained Object Manipulation. arXiv 2019, arXiv:1911.07340. [Google Scholar]
- Hart, S.; Dinh, P.; Hambuchen, K. The affordance template ROS package for robot task programming. In Proceedings of the 2015 IEEE International Conference on Robotics and Automation (ICRA), Seattle, WA, USA, 26–30 May 2015; pp. 6227–6234. [Google Scholar]
- Jamone, L.; Ugur, E.; Cangelosi, A.; Fadiga, L.; Bernardino, A.; Piater, J.; Santos-Victor, J. Affordances in psychology, neuroscience, and robotics: A survey. IEEE Trans. Cogn. Dev. Syst. 2016, 10, 4–25. [Google Scholar] [CrossRef]
- Poupyrev, I.; Tan, D.; Billinghurst, M.; Kato, H.; Regenbrecht, H.; Tetsutani, N. Tiles: A mixed reality authoring interface. In Proceedings of the (2001) INTERACT 2001 Conference on Human Computer Interaction, Tokyo, Japan, 9–13 July 2001. [Google Scholar]
- Rajaram, S.; Nebeling, M. Paper Trail: An Immersive Authoring System for Augmented Reality Instructional Experiences. In Proceedings of the CHI Conference on Human Factors in Computing Systems, New Orleans, LA, USA, 30 April–5 May 2022; pp. 1–16. [Google Scholar]
- Nebeling, M.; Lewis, K.; Chang, Y.C.; Zhu, L.; Chung, M.; Wang, P.; Nebeling, J. XRDirector: A role-based collaborative immersive authoring system. In Proceedings of the 2020 CHI Conference on Human Factors in Computing Systems, Honoluly, HI, USA, 25–30 April 2020; pp. 1–12. [Google Scholar]
- Lavric, T.; Bricard, E.; Preda, M.; Zaharia, T. An ar work instructions authoring tool for human-operated industrial assembly lines. In Proceedings of the 2020 IEEE International Conference on Artificial Intelligence and Virtual Reality (AIVR), Virtual, 14–18 December 2020; pp. 174–183. [Google Scholar]
- Jasche, F.; Hoffmann, S.; Ludwig, T.; Wulf, V. Comparison of different types of augmented reality visualizations for instructions. In Proceedings of the 2021 CHI Conference on Human Factors in Computing Systems, Virtual, 8–13 May 2021; pp. 1–13. [Google Scholar]
- Ipsita, A.; Li, H.; Duan, R.; Cao, Y.; Chidambaram, S.; Liu, M.; Ramani, K. VRFromX: From scanned reality to interactive virtual experience with human-in-the-loop. In Proceedings of the Extended Abstracts of the 2021 CHI Conference on Human Factors in Computing Systems, Virtual, 8–13 May 2021; pp. 1–7. [Google Scholar]
- Zhang, L.; Oney, S. Flowmatic: An immersive authoring tool for creating interactive scenes in virtual reality. In Proceedings of the 33rd Annual ACM Symposium on User Interface Software and Technology, Virtual, 20–23 October 2020; pp. 342–353. [Google Scholar]
- Steed, A.; Slater, M. A dataflow representation for defining behaviours within virtual environments. In Proceedings of the IEEE 1996 Virtual Reality Annual International Symposium, Santa Clara, CA, USA, 30 March–3 April 1996; pp. 163–167. [Google Scholar]
- Kato, H. ARToolKit: Library for Vision-based Augmented Reality. IEICE Tech. Rep. 2002, 101, 79–86. [Google Scholar]
- Kato, H.; Billinghurst, M.; Poupyrev, I.; Imamoto, K.; Tachibana, K. Virtual object manipulation on a table-top AR environment. In Proceedings of the IEEE and ACM International Symposium on Augmented Reality (ISAR 2000), Munich, Germany, 5–6 October 2000; pp. 111–119. [Google Scholar]
- Zhang, Z.; Li, Z.; Han, M.; Su, Z.; Li, W.; Pan, Z. An augmented reality-based multimedia environment for experimental education. Multimed. Tools Appl. 2021, 80, 575–590. [Google Scholar] [CrossRef]
- Radu, I. AR SPOT: An Augmented-Reality Programming Environment for Children. 2020. Available online: http://ael.gatech.edu/lab/research/arspot (accessed on 10 October 2022).
- Maloney, J.; Burd, L.; Kafai, Y.; Rusk, N.; Silverman, B.; Resnick, M. Scratch: A sneak preview [education]. In Proceedings of the Second International Conference on Creating, Connecting and Collaborating through Computing, 2004, Kyoto, Japan, 29–30 January 2004; pp. 104–109. [Google Scholar]
- Resnick, M.; Maloney, J.; Monroy-Hernández, A.; Rusk, N.; Eastmond, E.; Brennan, K.; Millner, A.; Rosenbaum, E.; Silver, J.; Silverman, B.; et al. Scratch: Programming for all. Commun. ACM 2009, 52, 60–67. [Google Scholar] [CrossRef]
- Smith, G.; Stürzlinger, W. Integration of constraints into a VR environment. In Proceedings of the VRIC’01: Proc. of the Virtual Reality Int’l Conf, Yokohama, Japan, 13–17 March 2001; pp. 103–110. [Google Scholar]
- Uthor, A. 3D scene manipulation with 2D devices and constraints. In Proceedings of the Graphics Interface, Citeseer, Ottawa, ON, Canada, 7–9 June 2001; pp. 135–142. [Google Scholar]
- Oh, J.Y.; Stuerzlinger, W. Moving objects with 2D input devices in CAD systems and desktop virtual environments. In Proceedings of the Graphics Interface 2005. Canadian Human-Computer Communications Society, Victoria, BC, Canada, 9–11 May 2005; pp. 195–202. [Google Scholar]
- Nebeling, M.; Speicher, M. The trouble with augmented reality/virtual reality authoring tools. In Proceedings of the 2018 IEEE International Symposium on Mixed and Augmented Reality Adjunct (ISMAR-Adjunct), Munich, Germany, 17 October 2018; pp. 333–337. [Google Scholar]
- Unity3D. The World’s Leading Platform for Real-Time Content Creation. 2021. Available online: https://unity.com/ (accessed on 10 October 2022).
- Unreal. The World’s Most Open and Advanced Real-Time 3D Creation Tool. 2021. Available online: https://www.unrealengine.com/en-US (accessed on 10 October 2022).
- AR, S. WORKLINK Create Your Own SMART Instructions. 2019. Available online: https://www.scopear.com/products/worklink/ (accessed on 10 October 2022).
- Kaas, E. The NGRAIN Technology Difference Explained a Whitepaper for Technical Evaluators of Visualization and Simulation Technologies; NGRAIN Corporation: Vancouver, BC, Canada.
- Lee, G.A.; Kim, G.J.; Park, C.M. Modeling virtual object behavior within virtual environment. In Proceedings of the ACM Symposium on Virtual Reality Software and Technology, Hong Kong, China, 11–13 November 2002; pp. 41–48. [Google Scholar]
- Pellens, B.; De Troyer, O.; Bille, W.; Kleinermann, F. Conceptual modeling of object behavior in a virtual environment. In Proceedings of the Virtual Concept, Biarritz, France, 8–10 November 2005; pp. 93–94. [Google Scholar]
- Marion, P.; Fallon, M.; Deits, R.; Valenzuela, A.; Pérez D’Arpino, C.; Izatt, G.; Manuelli, L.; Antone, M.; Dai, H.; Koolen, T.; et al. Director: A user interface designed for robot operation with shared autonomy. J. Field Robot. 2017, 34, 262–280. [Google Scholar] [CrossRef]
- Ultraleap. Digital Worlds That Feel Human. 2022. Available online: https://www.ultraleap.com/ (accessed on 10 October 2022).
- Shneiderman, B. Designing the User Interface: Strategies for Effective Human-Computer Interaction, 3rd ed.; Addison-Wesley Longman Publishing Co., Inc.: Boston, MA, USA, 1997. [Google Scholar]
- Apple Computer, I. Macintosh Human Interface Guidelines; Addison-Wesley Publishing Company: Boston, MA, USA, 1992. [Google Scholar]
- Microsoft. Fluent Design System. 2022. Available online: https://www.microsoft.com/design/fluent/ (accessed on 10 October 2022).
- Masnadi, S.; Pfeil, K.; Sera-Josef, J.V.T.; LaViola, J. Effects of Field of View on Egocentric Distance Perception in Virtual Reality. In Proceedings of the CHI Conference on Human Factors in Computing Systems, New Orleans, LA, USA, 30 April–5 May 2022; pp. 1–10. [Google Scholar]
- Pfeil, K.; Masnadi, S.; Belga, J.; Sera-Josef, J.V.T.; LaViola, J. Distance perception with a video see-through head-mounted display. In Proceedings of the 2021 CHI Conference on Human Factors in Computing Systems, Virtual, 8–13 May 2021; pp. 1–9. [Google Scholar]
- Microsoft. Design for Mixed Reality. 2018. Available online: https://docs.microsoft.com/en-us/windows/mixed-reality/design (accessed on 10 October 2022).
- Hart, S.G.; Staveland, L.E. Development of NASA-TLX (Task Load Index): Results of empirical and theoretical research. In Advances in Psychology; Elsevier: Amsterdam, The Netherlands, 1988; Volume 52, pp. 139–183. [Google Scholar]
- Brooke, J. SUS-A quick and dirty usability scale. Usability Eval. Ind. 1996, 189, 4–7. [Google Scholar]
- Davis, F.D. Perceived usefulness, perceived ease of use, and user acceptance of information technology. MIS Q. 1989, 319–340. [Google Scholar] [CrossRef]
- Rantamaa, H.R.; Kangas, J.; Kumar, S.K.; Mehtonen, H.; Järnstedt, J.; Raisamo, R. Comparison of a VR Stylus with a Controller, Hand Tracking, and a Mouse for Object Manipulation and Medical Marking Tasks in Virtual Reality. Appl. Sci. 2023, 13, 2251. [Google Scholar] [CrossRef]
- Franzluebbers, A.; Johnsen, K. Performance benefits of high-fidelity passive haptic feedback in virtual reality training. In Proceedings of the 2018 ACM Symposium on Spatial User Interaction, Berlin, Germany, 13–14 October 2018; pp. 16–24. [Google Scholar]
Figure 1.
These figures show our authoring tool across three different conditions. (a,d) A drawer with 4 doors authoring top door behavior in the AR condition. (b,e) A cabinet with 2 doors, authoring the rotating door in VR. (c,f) A mini-fridge with the top door component segmented and a rotation behavior added in the desktop condition.

Figure 2.
(Left) Hands visualized in AR. (Right) Virtual hands in VR. Green spheres are pointers to interact with elements in the scene.
Figure 2.
(Left) Hands visualized in AR. (Right) Virtual hands in VR. Green spheres are pointers to interact with elements in the scene.

Figure 3.
Desktop interface. In the figure, the cabinet is selected with a left click. The draggable object menu and undo button are visible.
Figure 3.
Desktop interface. In the figure, the cabinet is selected with a left click. The draggable object menu and undo button are visible.

Figure 4.
Step by step menu used across all conditions.

Figure 5.
A ray between the index finger and the menu can be seen in both images: (left) AR and (right) VR.
Figure 5.
A ray between the index finger and the menu can be seen in both images: (left) AR and (right) VR.

Figure 6.
Custom gesture to submit a completed component selection from the drawer.

Figure 7.
(Left) Translate gizmo in desktop interface. (Right) Scale widget being manipulated.

Figure 8.
A top-down view of the room with the shaded area that participants navigated within the experiment.
Figure 8.
A top-down view of the room with the shaded area that participants navigated within the experiment.

Figure 9.
(Left) A picture of the room. (Right) A screenshot of the virtual room from a similar vantage point as in the left image.
Figure 9.
(Left) A picture of the room. (Right) A screenshot of the virtual room from a similar vantage point as in the left image.

Figure 10.
The left image shows the last point added to define the bounds of the drawer component in AR. The middle image shows the first point added to the cabinet in VR. The right image shows the door component selected for the mini-fridge object in desktop.
Figure 10.
The left image shows the last point added to define the bounds of the drawer component in AR. The middle image shows the first point added to the cabinet in VR. The right image shows the door component selected for the mini-fridge object in desktop.

Figure 11.
The left image shows the last point added to define a perpendicular behavior in AR. The right image shows in yellow the points to enable the rotation of the cabinet door in VR.
Figure 11.
The left image shows the last point added to define a perpendicular behavior in AR. The right image shows in yellow the points to enable the rotation of the cabinet door in VR.

Figure 12.
Left image shows feedback for alignment start; middle and right images show feedback for alignment completion.
Figure 12.
Left image shows feedback for alignment start; middle and right images show feedback for alignment completion.

Figure 13.
Flow chart of the experimental procedure.

Figure 14.
Box plot shows the total time distribution in seconds per condition.

Figure 15.
Box plot shows the total error measurement distribution in meters.

Figure 16.
Plot shows the mean values and standard deviations for post-condition Likert ratings from Table 1.
Figure 16.
Plot shows the mean values and standard deviations for post-condition Likert ratings from Table 1.

Figure 17.
Plot shows the mean values and standard deviations for NASA-TLX workload ratings.

Figure 18.
Preference for each of the four aspects.


Table 1.
Post-condition questionnaire. Participants answered these questions on a 7-point Likert scale (1 = not much, 7 = a lot). * Not present in desktop condition.
Table 1.
Post-condition questionnaire. Participants answered these questions on a 7-point Likert scale (1 = not much, 7 = a lot). * Not present in desktop condition.
| # | Question |
|---|---|
| Q1 | Rate the importance of the task using current technology. |
| Q2 | Rate your prior experience using the technology in this study. |
| Q3 | How realistic did you find the virtual objects in the scene? |
| * Q4 | How much did the weight of the headset affected you? |
| * Q5 | How accurate did the hand tracking feel? |
| Q6 | How easy was it to press buttons in the UI? |
| Q7 | How easy was it to define the region for object component selection? |
| Q8 | How easy was it to add a rotation behavior to the selected part of the object? (a) Mini-fridge, (b) cabinet. |
| Q9 | How easy was it to add a perpendicular pull behavior to the selected part of the object? |
| Q10 | I enjoyed using the system overall. |
Table 2.
Results of Friedman’s test and post-hoc analysis for post-condition Likert scale data from Table 1.
Table 2.
Results of Friedman’s test and post-hoc analysis for post-condition Likert scale data from Table 1.
| # | Friedman’s Test | AR vs. VR | AR vs. Desktop | VR vs. Desktop |
|---|---|---|---|---|
| Q1 | ||||
| Q2 | ||||
| Q3 | ||||
| Q6 | ||||
| Q7 | ||||
| Q8a | ||||
| Q8b | ||||
| Q9 | ||||
| Q10 |
Table 3.
Results of Friedman’s test and post-hoc analysis for NASA-TLX workload ratings reported.
| # | Friedman’s Test | AR vs. VR | AR vs. Desktop | VR vs. Desktop |
|---|---|---|---|---|
| MD | ||||
| PD | ||||
| TD | ||||
| OP | ||||
| EF | ||||
| FL |
Disclaimer/Publisher’s Note: The statements, opinions and data contained in all publications are solely those of the individual author(s) and contributor(s) and not of MDPI and/or the editor(s). MDPI and/or the editor(s) disclaim responsibility for any injury to people or property resulting from any ideas, methods, instructions or products referred to in the content. |
© 2023 by the authors. Licensee MDPI, Basel, Switzerland. This article is an open access article distributed under the terms and conditions of the Creative Commons Attribution (CC BY) license (https://creativecommons.org/licenses/by/4.0/).
Share and Cite
MDPI and ACS Style
Vargas González, A.N.; Williamson, B.; LaViola, J.J., Jr. Authoring Moving Parts of Objects in AR, VR and the Desktop. Multimodal Technol. Interact. 2023, 7, 117. https://doi.org/10.3390/mti7120117
AMA Style
Vargas González AN, Williamson B, LaViola JJ Jr. Authoring Moving Parts of Objects in AR, VR and the Desktop. Multimodal Technologies and Interaction. 2023; 7(12):117. https://doi.org/10.3390/mti7120117
Chicago/Turabian StyleVargas González, Andrés N., Brian Williamson, and Joseph J. LaViola, Jr. 2023. "Authoring Moving Parts of Objects in AR, VR and the Desktop" Multimodal Technologies and Interaction 7, no. 12: 117. https://doi.org/10.3390/mti7120117