
Similarities and Differences between Immersive Virtual Reality, Real World, and Computer Screens: A Systematic Scoping Review in Human Behavior Studies

Abstract
:1. Introduction
- RQ1:
- “What are the main differences between HMD VR, screen-based VR, and the real world mentioned in the current literature?”
- RQ2:
- “What are the expected consequences of these differences?”
- RQ3:
- “How extensive are these differences?”
2. Related Work and Theoretical Foundation
2.1. Categories
2.1.1. Category I—Perception
2.1.2. Category II—Interaction
2.1.3. Category III—Sensing and Reconstructing Reality
2.1.4. Subcategories
2.2. Compared Settings
- Screen: as monoscopic displays in all different sizes as they are commonly used on a PC or tablet;
- HMD VR: as all kinds of head mounted displays that visually isolate the user from the environment. Content can range from interactive stereoscopic 3D computer graphics to 360° video or photos; and
- Real world: as the world that seems to exist.
3. Methodology
3.1. Risk of Bias
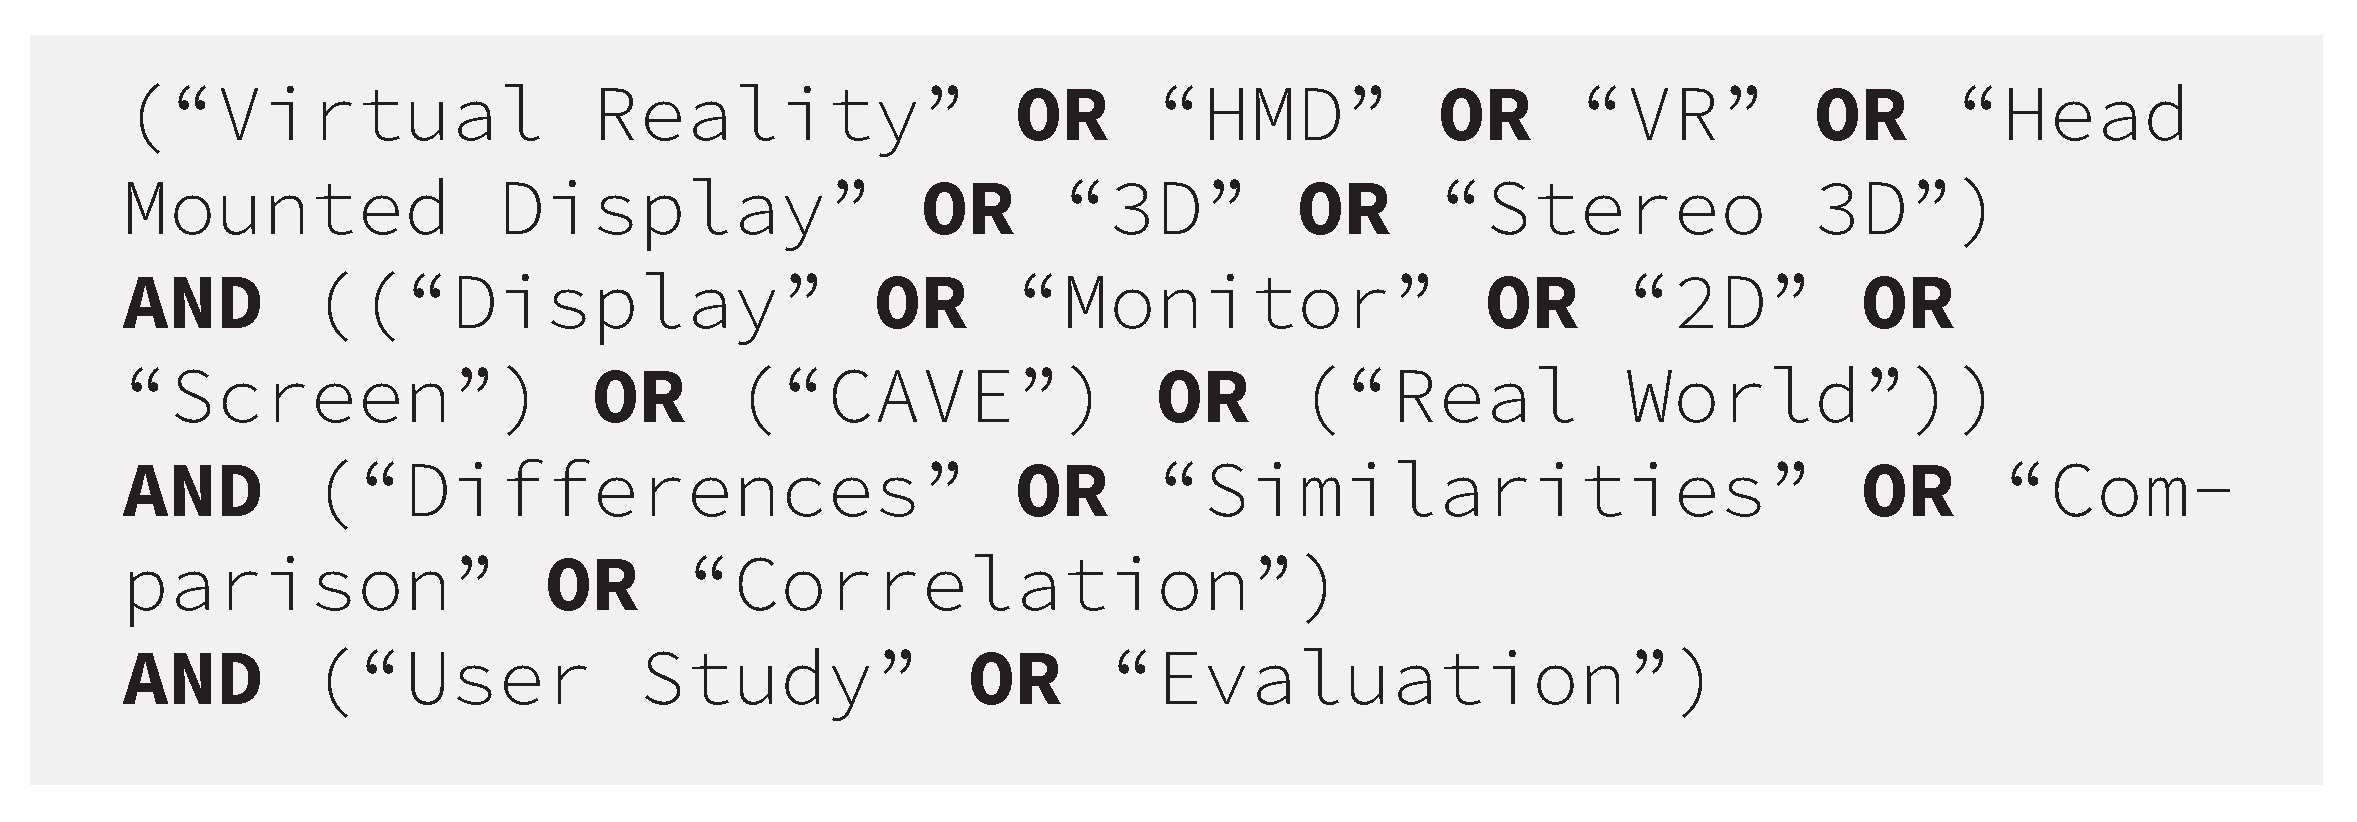
3.2. Query Development and Search
- The search engine must be thematically relevant. We included search systems from the fields of computer sciences, social psychological studies, behavioral studies, health sciences, and multidisciplinary studies with a focus on computer science and medicine;
- All search systems need to be able to make use of boolean operators in search strings (we used only OR; AND; NOT) [32]; and
- Are capable of more complex search terms (e.g., are able to make use of more than seven boolean separated search strings).
3.3. Preregistration
4. Screening, Selection, and Assignment Procedure
- Stage 1:
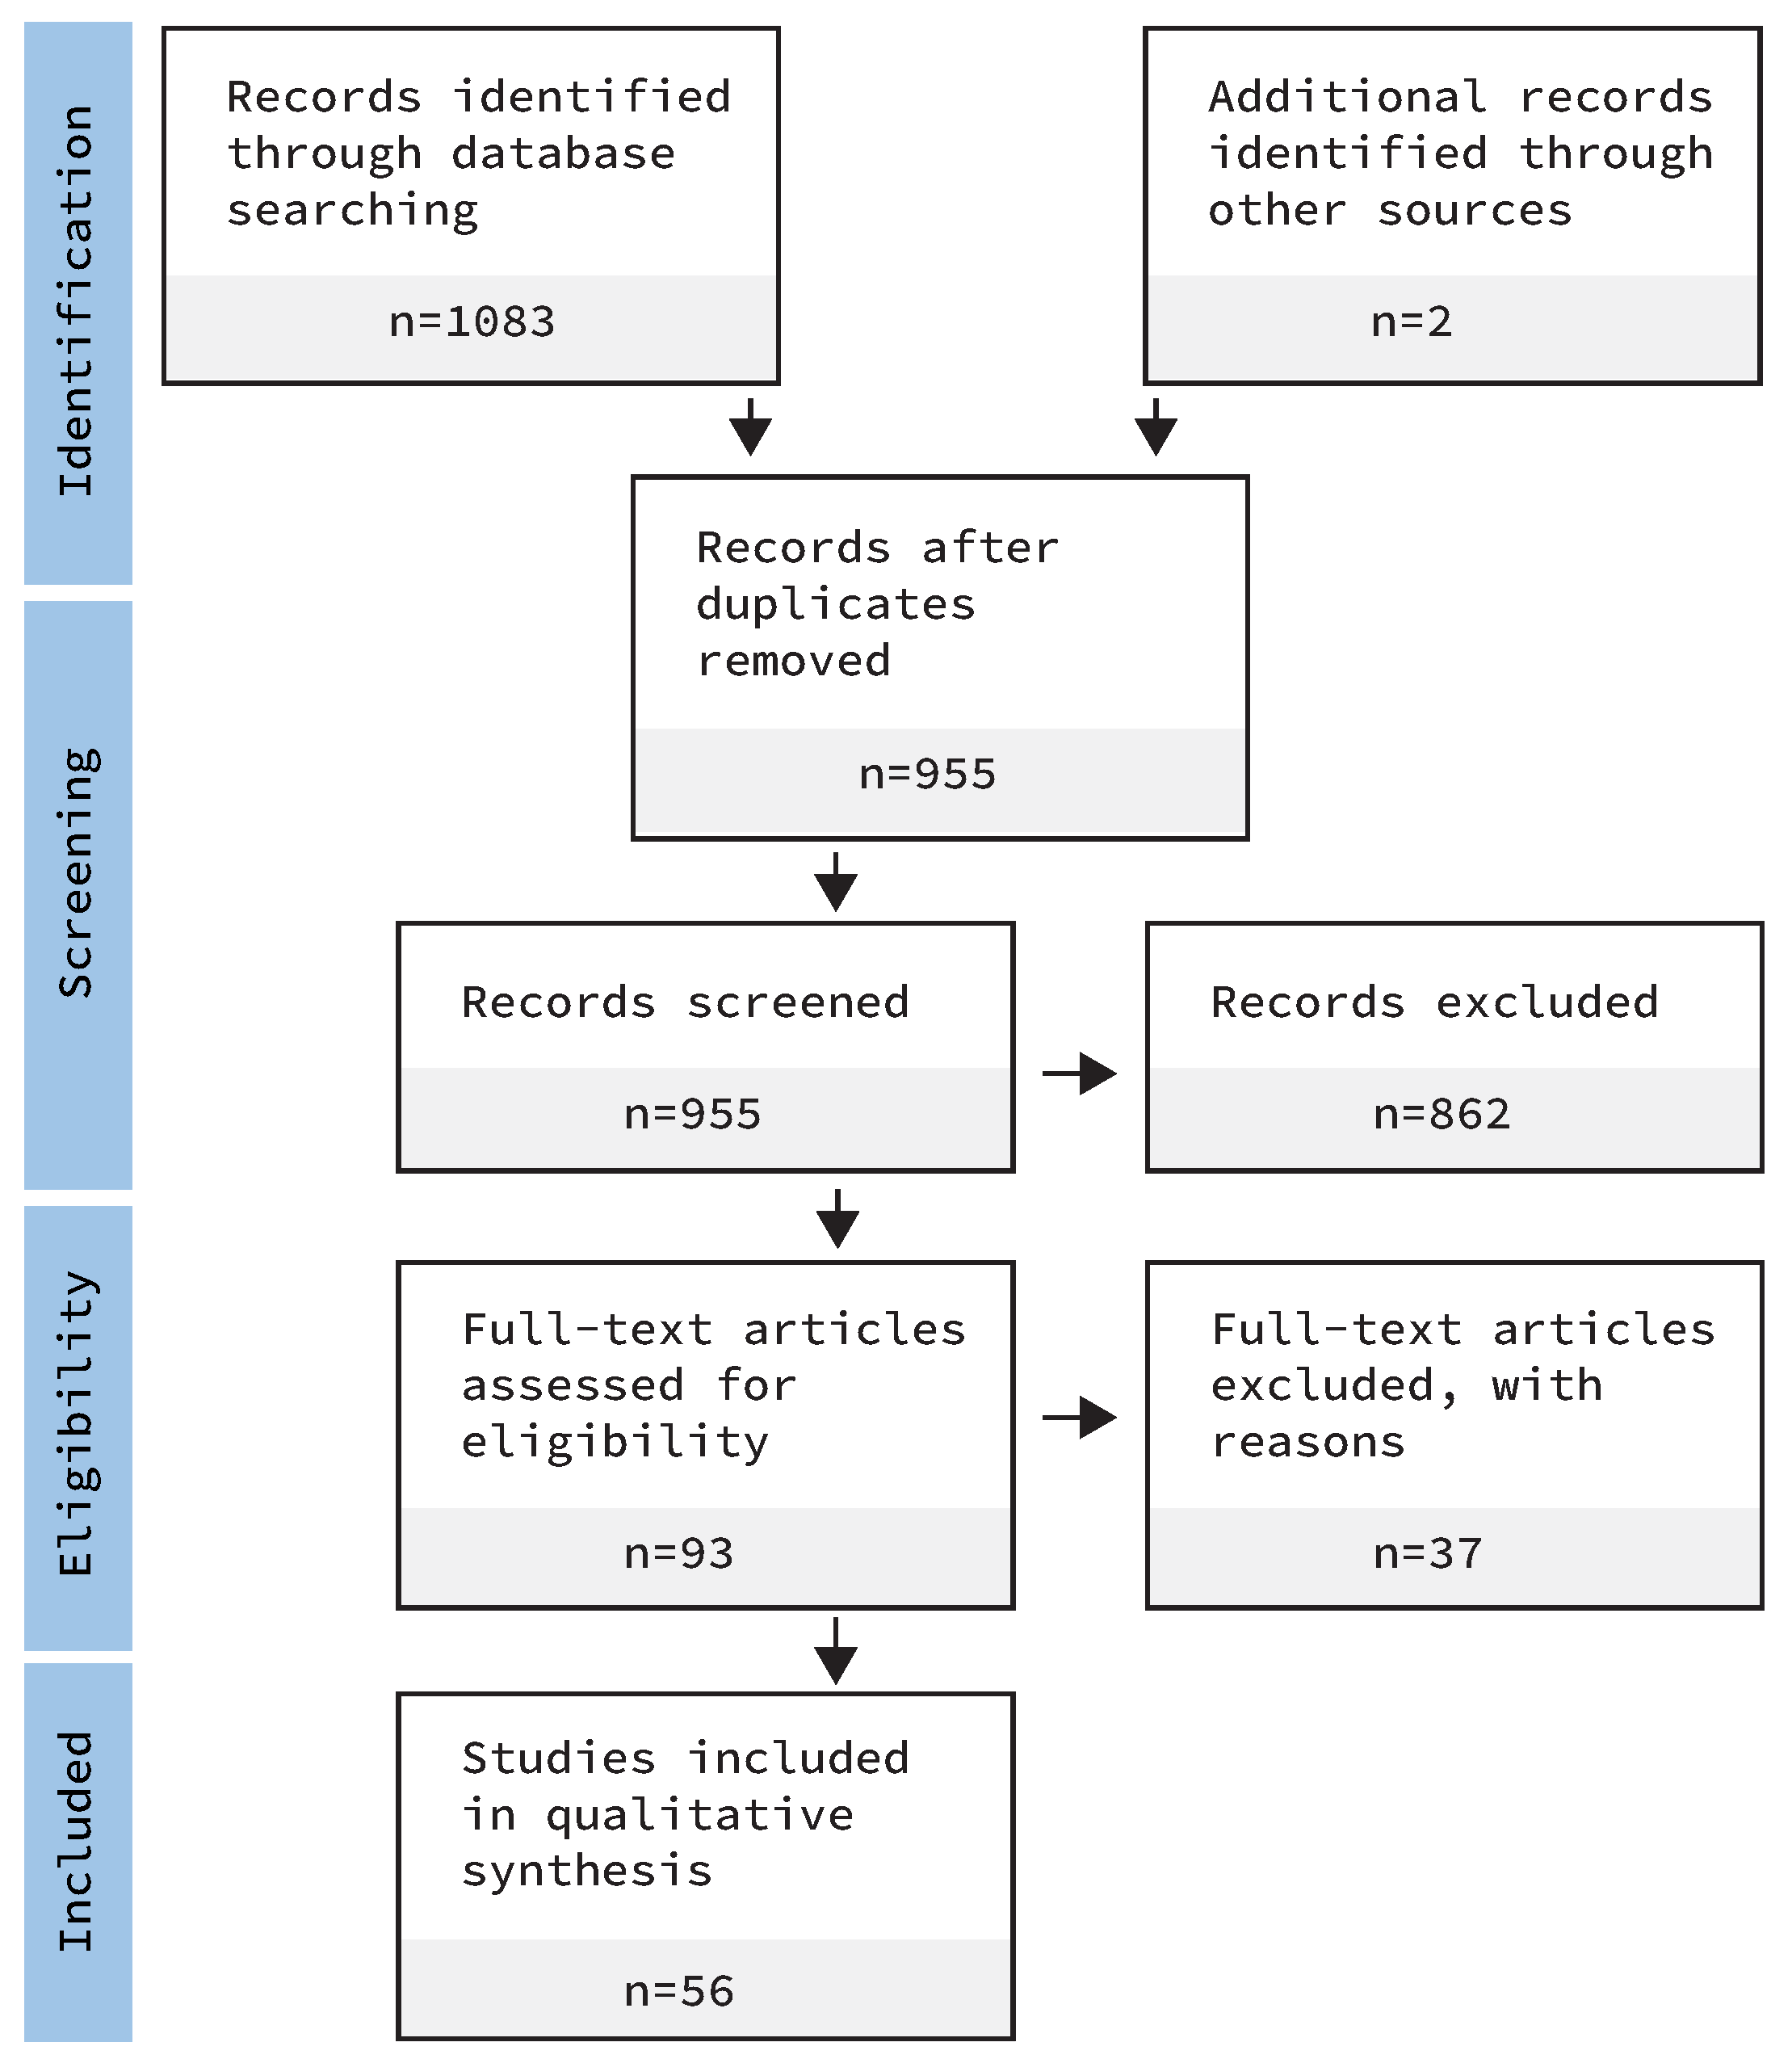
- Immediately after searching the respective databases, the results were filtered by year (published after 2013) if this was not possible with the search string.
- Stage 2:
- The abstracts of each record were screened according to the following selection and deselection criteria: All articles related to the IVT we defined were selected (see Section 2.2 for definitions). If any of the research articles used augmented reality (AR) instead of VR, it was rejected. If an article compared both VR and AR, it was not rejected. It is also a balancing act to make the search query as broad as possible and as narrow as necessary. As a result, many articles were found that made a comparison with an HMD VR environment and not with another IVT. These articles were also rejected. If something other than the above IVT was compared, it would also be rejected. Languages other than English were rejected. Articles that did not adequately document their research or explain the reasoning behind their conclusions were rejected based on the “unsound methods” rejection criterion.
- Stage 3:
- The accessibility of all papers was checked. At this stage, we had to reject two more papers because they were not accessible.
- Stage 4:
- All remaining papers were screened according to the data extraction suggested by [20] and selected or deselected accordingly. The following information was entered into the data extraction form for each paper selected after screening the abstract. Here a derivation to the pre-registration has been made. The entry fields after field 13.“Bibtex entry” were added because they were mentioned in many study descriptions and are, in our opinion, a valuable addition to the mapping of the research landscape:
- Author(s)
- Year of publication
- Source of origin / country (if accessible)
- Aims/purpose
- Study population
- Sample Size
- Methodology
- Intervention Type (IVT) / Tech. Used
- Concept
- Duration of intervention
- How outcomes are measured
- Key findings
- Bibtex entry
- What is compared
- VR hardware used
- Other hardware
- Annotations
- Software used
4.1. Postprocessing
4.2. Prisma Flow Diagram
5. Results
- ▲ Advantageous in relation to the screen or real world;
- ▼ Disadvantageous in relation to the screen or real world;
- ► Similar in relation to the screen or real world if there is no significant difference; and
- ■ Undecided if no clear tendency can be inferred, but there is a significant difference.
5.1. Hard- and Software Setup
5.2. Study Population and Duration
5.3. Questionnaires Used
5.4. Study Design
5.5. Mapping the Field
5.6. Advantages and Disadvantages in General
5.7. Advantages and Disadvantages per Category
5.7.1. Interaction Category
5.7.2. Perception Category
5.7.3. Sensing and Reconstructing Reality Category
5.8. Possible Consequences
5.9. Corresponding and Contradictory Findings
5.9.1. Single Findings HMD VR × Real World
- Efficiency
- Most studies report no significant differences in task completion time (No. 3, 6, 9, 11), error rates (No. 12), or entry accuracy (13). Eye-gaze input (No. 15), felt individual performance (No. 4), and task-related focus (No. 5) are reported to be advantageous in HMD VR. HMD VR is disadvantageous as some studies found reaches to be less efficient (No. 7), higher time to task completion in VR (No. 8), slower object placement (No. 1), and slower touch input (No. 14).
- Interaction
- Interaction skills show no significant difference (No. 18, 19) and similar qualitative feedback (No. 20) between VR and the real world.
- Simulator Sickness
- Higher simulator sickness is reported in VR (No. 21).
- Usability
- Usability results are mixed, with no significant differences found in some studies (No. 22) and lower scores for ease of use in VR in others (No. 23).
- Usefulness
- VR-based aging simulation is found to have the same potential as real-world aging suits in terms of usefulness (No. 24).
- User Experience
- No significant difference in user experience is reported between VR and the real world (No. 25).
- Workload
- Workload results are mixed, with some studies reporting no significant differences in cognitive load (No. 26, 30) and others reporting higher mental demand (No. 27) and lower workload in VR (No. 31).
- Aesthetics
- No difference in aesthetic preferences between VR and the real world (No. 32).
- Emotions
- Emotion findings are mixed, with no significant difference between VR and video for most emotion arousal (No. 33) but stronger fear in VR (No. 34).
- Engagement
- Engagement findings are varied, with no difference in engagement (No. 35), rapport (No. 37), co-presence (No. 38), and interpersonal trust (No. 39). Yet, one study reported lower engagement in VR (No. 36).
- Learning
- No significant learning differences between learning (No. 40, 41, 52) but contradicting results exist (No. 51).
- Motion Sickness
- More symptoms of “focus difficulty”, “general discomfort”, “nausea", and “headache” in VR (No. 42), but no difference in accommodation response (No. 43).
- Presence
- Presence findings are mixed, with no significant difference in presence (No. 44) but a higher sense of presence in VR (No. 45).
- Realism
- No significant differences between evaluation based on real user (supernumerary) in real world and avatars (No. 46), but lower natural feeling in VR (No. 47).
5.9.2. Single Findings HMD VR × Screen
- Efficiency
- With 10 results in favor for HMD VR, results in the efficiency subcategory shows a clear tendency towards HMD VR.
- Overview
- Overview also leans towards VR, with results showing that data overview and data depiction (No. 22, 23) are more intuitive in VR.
- Immersion, Experience
- Studies report higher immersion in VR (No. 50, 55, 56, 57) and lower frustration levels (No. 51), but also disadvantages such as a lower quality of experience (No. 75, 79) and a decrease in immersion at the narrative level (No. 58).
- Learning
- Learning presents mixed results. Some studies suggest no significant differences in correct insights (No. 59), others suggest fewer correct insights in VR (No. 60). Others still report fewer deep insights from VR (No. 62), less learning in VR (No. 64), but also higher recall of information about tasks in VR (No. 63) and higher motivation in learning (No. 65).
- Presence
- Presence in VR is generally found to be higher (No. 68, 69, 70, 71, 73, 74), although two studies report no significant difference (No. 67, 72).
- Satisfaction
- Data exploration is considered more satisfying in VR (No. 77) and VR is found to be more engaging (No. 78).
- Workload
- Workload results are mixed, some studies report a lower workload in VR (No. 82, 84, 88), but others indicate higher cognitive load (No. 85, 86, 89).
6. Discussion and Future Directions
- In proportion, there are more findings that show similarities between HMD VR × real world than there are findings that show differences between the HMD VR and the real world. Especially for the “interaction” category as well as for the “perception” category. Only in the “sensing and reconstructing reality” category did we find more differences than similarities. This is different for HMD VR × screen, where we collected more findings showing differences between the HMD VR × screen environment for the interaction and perception categories. The sensing and reconstructing reality category is evenly distributed;
- For both entities, there are findings that need to be considered further. For example, in HMD VR × screen, learning shows mixed results (two in favor of HMD VR, two undecided, and three against). This may indicate that typical learning scenarios cannot be transferred “as is” to HMD VR, but that content and presentation type have to be adapted to the particularities of the system in order to take advantage of the specific benefits of HMD VR. This is different for HMD VR × real world where we find two results that now show differences between the two entities that could mean easier adoption; and
- When we compare the results from HMD VR with those from the real world, we observe numerous findings reporting increased symptoms of “focus difficulty”, “general discomfort”, “nausea", and “headache”. As technology advances, we anticipate significant improvements in the design and functionality of VR systems. We predict that these advancements will effectively mitigate these prevalent issues through improved display technology, enhanced ergonomics, which includes reduced weight, an elevated user experience, and greater customization, as well as innovative algorithmic solutions;
- With an average of 28 participants (SD: 22), the study population is rather small and predominantly male.
- (Attention) control is important (e.g., phobia therapy or learning situations);
- Participants are exposed to dangerous situations (e.g., firefighter training);
- Replication and sharing is useful (applies to almost any discipline except sensitive data such as patient information);
- Processes are difficult or impossible to perform in the real world (e.g., taking participants “back in time” as in reminiscence therapy); and
- Cost-efficiency is desired (e.g., participants could be recruited from anywhere in the world as long as they own an HMD).
Author Contributions
Funding
Conflicts of Interest
Abbreviations
| CAVE | Cave automatic virtual environments |
| HMD | Head-mounted display |
| IVT | Intervention types |
| PRISMA | Preferred reporting items for systematic reviews and meta–analyses |
| VR | Virtual reality |
References
- Zheng, J.; Chan, K.; Gibson, I. Virtual reality. IEEE Potentials 1998, 17, 20–23. [Google Scholar] [CrossRef]
- Wann, J.P.; Rushton, S.; Mon-Williams, M. Natural problems for stereoscopic depth perception in virtual environments. Vis. Res. 1995, 35, 2731–2736. [Google Scholar] [CrossRef]
- Fossataro, C.; Rossi Sebastiano, A.; Tieri, G.; Poles, K.; Galigani, M.; Pyasik, M.; Bruno, V.; Bertoni, T.; Garbarini, F. Immersive virtual reality reveals that visuo-proprioceptive discrepancy enlarges the hand-centred peripersonal space. Neuropsychologia 2020, 146, 107540. [Google Scholar] [CrossRef] [PubMed]
- Hepperle, D.; Ödell, H.; Wölfel, M. Differences in the Uncanny Valley between Head-Mounted Displays and Monitors. In Proceedings of the 2020 International Conference on Cyberworlds (CW), Caen, France, 29 September–1 October 2020. [Google Scholar] [CrossRef]
- Siess, A.; Wölfel, M. User color temperature preferences in immersive virtual realities. Comput. Graph. 2019, 81, 20–31. [Google Scholar] [CrossRef]
- Cruz-Neira, C.; Sandin, D.J.; DeFanti, T.A.; Kenyon, R.V.; Hart, J.C. The CAVE: Audio visual experience automatic virtual environment. Commun. ACM 1992, 35, 64–72. [Google Scholar] [CrossRef]
- Biocca, F. Media and the laws of the mind (Preface). In Being There Concepts, Effects and Measurements of User Presence in Synthetic Environments, 5th ed.; Riva, G., Davide, F., IJsselsteijn, W., Eds.; IOS Press: Amsterdam, The Netherlands, 2003; Volume 5, pp. V–VII. [Google Scholar]
- Lohre, R.; Bois, A.J.; Athwal, G.S.; Goel, D.P.; on behalf of the Canadian Shoulder and Elbow Society (CSES)*. Improved Complex Skill Acquisition by Immersive Virtual Reality Training: A Randomized Controlled Trial. JBJS 2020, 102, e26. [Google Scholar] [CrossRef] [PubMed]
- Cardenas, I.S.; Letdara, C.N.; Selle, B.; Kim, J.H. ImmersiFLY: Next Generation of Immersive Pilot Training. In Proceedings of the 2017 International Conference on Computational Science and Computational Intelligence (CSCI), Las Vegas, NV, USA, 14–16 December 2017; pp. 1203–1206. [Google Scholar] [CrossRef]
- Grabowski, A.; Jankowski, J. Virtual Reality-based pilot training for underground coal miners. Saf. Sci. 2015, 72, 310–314. [Google Scholar] [CrossRef]
- Neumann, D.L.; Moffitt, R.L.; Thomas, P.R.; Loveday, K.; Watling, D.P.; Lombard, C.L.; Antonova, S.; Tremeer, M.A. A systematic review of the application of interactive virtual reality to sport. Virtual Real. 2018, 22, 183–198. [Google Scholar] [CrossRef]
- Bordeleau, M.; Stamenkovic, A.; Tardif, P.A.; Thomas, J. The Use of Virtual Reality in Back Pain Rehabilitation: A Systematic Review and Meta-Analysis. J. Pain 2021, 23, 175–195. [Google Scholar] [CrossRef]
- Oberhauser, M.; Dreyer, D. A virtual reality flight simulator for human factors engineering. Cogn. Technol. Work 2017, 19, 263–277. [Google Scholar] [CrossRef]
- Tadayon, R.; Gupta, C.; Crews, D.; McDaniel, T. Do Trait Anxiety Scores Reveal Information About Our Response to Anxious Situations? A Psycho-Physiological VR Study. In Proceedings of the 4th International Workshop on Multimedia for Personal Health and Health Care, HealthMedia’19, New York, NY, USA, 21 October 2019; pp. 16–23. [Google Scholar] [CrossRef]
- Rizzo, A.; Cukor, J.; Gerardi, M.; Alley, S.; Reist, C.; Roy, M.; Rothbaum, B.O.; Difede, J. Virtual Reality Exposure for PTSD Due to Military Combat and Terrorist Attacks. J. Contemp. Psychother. 2015, 45, 255–264. [Google Scholar] [CrossRef]
- Yoon, J.; Byun, E.; Chung, N.S. Comparison of Space Perception between a Real Environment and a Virtual Environment. Proc. Hum. Factors Ergon. Soc. Annu. Meet. 2000, 44, 515–518. [Google Scholar] [CrossRef]
- Santos, B.S.; Dias, P.; Pimentel, A.; Baggerman, J.W.; Ferreira, C.; Silva, S.; Madeira, J. Head-mounted display versus desktop for 3D navigation in virtual reality: A user study. Multimed. Tools Appl. 2008, 41, 161–181. [Google Scholar] [CrossRef]
- Milgram, P.; Takemura, H.; Utsumi, A.; Kishino, F. Augmented reality: A class of displays on the reality-virtuality continuum. In Telemanipulator and Telepresence Technologies; Das, H., Ed.; SPIE: Boston, MA, USA, 1995. [Google Scholar] [CrossRef]
- Liberatore, M.J.; Wagner, W.P. Virtual, mixed, and augmented reality: A systematic review for immersive systems research. Virtual Real. 2021, 25, 773–799. [Google Scholar] [CrossRef]
- Peters, M.D.; Godfrey, C.M.; Khalil, H.; McInerney, P.; Parker, D.; Soares, C.B. Guidance for conducting systematic scoping reviews. Int. J. Evid. Based Healthc. 2015, 13, 141–146. [Google Scholar] [CrossRef]
- Moher, D.; Liberati, A.; Tetzlaff, J.; Altman, D.G. Preferred Reporting Items for Systematic Reviews and Meta-Analyses: The PRISMA Statement. PLoS Med. 2009, 6, e1000097. [Google Scholar] [CrossRef] [PubMed]
- Hettiarachchi, A.; Wigdor, D. Annexing Reality. In Proceedings of the 2016 CHI Conference on Human Factors in Computing Systems, San Jose, CA, USA, 7–12 May 2016. [Google Scholar] [CrossRef]
- Simeone, A.L.; Velloso, E.; Gellersen, H. Substitutional Reality. In Proceedings of the 33rd Annual ACM Conference on Human Factors in Computing Systems—CHI’15, Seoul, Republic of Korea, 18–23 April 2015. [Google Scholar] [CrossRef]
- Azmandian, M.; Hancock, M.; Benko, H.; Ofek, E.; Wilson, A.D. Haptic Retargeting. In Proceedings of the 2016 CHI Conference on Human Factors in Computing Systems, San Jose, CA, USA, 7–12 May 2016. [Google Scholar] [CrossRef]
- Guo, Y.; Zhang, J.; Cai, J.; Jiang, B.; Zheng, J. CNN-based Real-time Dense Face Reconstruction with Inverse-rendered Photo-realistic Face Images. IEEE Trans. Pattern Anal. Mach. Intell. 2019, 41, 1294–1307. [Google Scholar] [CrossRef] [PubMed]
- Caserman, P.; Garcia-Agundez, A.; Konrad, R.; Göbel, S.; Steinmetz, R. Real-time body tracking in virtual reality using a Vive tracker. Virtual Real. 2018, 23, 155–168. [Google Scholar] [CrossRef]
- Rus-Calafell, M.; Garety, P.; Sason, E.; Craig, T.J.K.; Valmaggia, L.R. Virtual reality in the assessment and treatment of psychosis: A systematic review of its utility, acceptability and effectiveness. Psychol. Med. 2017, 48, 362–391. [Google Scholar] [CrossRef]
- Munn, Z.; Peters, M.D.J.; Stern, C.; Tufanaru, C.; McArthur, A.; Aromataris, E. Systematic review or scoping review? Guidance for authors when choosing between a systematic or scoping review approach. BMC Med. Res. Methodol. 2018, 18, 143. [Google Scholar] [CrossRef]
- Rosenthal, R. The file drawer problem and tolerance for null results. Psychol. Bull. 1979, 86, 638–641. [Google Scholar] [CrossRef]
- Freitas, V. Parsifal. 2020. Available online: https://github.com/vitorfs/parsifal (accessed on 14 April 2023).
- Gusenbauer, M.; Haddaway, N.R. Which academic search systems are suitable for systematic reviews or meta-analyses? Evaluating retrieval qualities of Google Scholar, PubMed, and 26 other resources. Res. Synth. Methods 2019, 11, 181–217. [Google Scholar] [CrossRef] [PubMed]
- Cole, C.L.; Kanter, A.S.; Cummens, M.; Vostinar, S.; Naeymi-Rad, F. Using a Terminology Server and Consumer Search Phrases to Help Patients Find Physicians with Particular Expertise. Stud. Health Technol. Inform. 2004, 107, 492–496. [Google Scholar] [CrossRef]
- James, P. 3 Years Ago the Oculus Rift DK1 Shipped, Here’s a Quick Look Back. 2017. Available online: https://www.roadtovr.com/3-years-ago-the-oculus-rift-dk1-shipped-heres-a-quick-look-back/ (accessed on 14 April 2023).
- Hart, S.G.; Staveland, L.E. Development of NASA-TLX (Task Load Index): Results of empirical and theoretical research. Hum. Ment. Workload 1988, 1, 139–183. [Google Scholar]
- Witmer, B.G.; Singer, M.J. Measuring Presence in Virtual Environments: A Presence Questionnaire. Presence 1998, 7, 225–240. [Google Scholar] [CrossRef]
- Brooke, J. SUS: A “quick and dirty” usability scale. In Usability Evaluation in Industry; Jordan, P.W., Thomas, B., McClelland, I.L., Weerdmeester, B., Eds.; Taylor and Francis Group: Oxfordshire, UK, 1986. [Google Scholar]
- Auer, S.; Gerken, J.; Reiterer, H.; Jetter, H.C. Comparison Between Virtual Reality and Physical Flight Simulators for Cockpit Familiarization. In Proceedings of the Mensch und Computer 2021, Ingolstadt, Germany, 5–8 September 2021. [Google Scholar] [CrossRef]
- Elor, A.; Thang, T.; Hughes, B.P.; Crosby, A.; Phung, A.; Gonzalez, E.; Katija, K.; Haddock, S.H.D.; Martin, E.J.; Erwin, B.E.; et al. Catching Jellies in Immersive Virtual Reality: A Comparative Teleoperation Study of ROVs in Underwater Capture Tasks. In Proceedings of the 27th ACM Symposium on Virtual Reality Software and Technology, Osaka, Japan, 8–10 December 2021. [Google Scholar] [CrossRef]
- Clifford, R.M.S.; McKenzie, T.; Lukosch, S.; Lindeman, R.W.; Hoermann, S. The Effects of Multi-sensory Aerial Firefighting Training in Virtual Reality on Situational Awareness, Workload, and Presence. In Proceedings of the 2020 IEEE Conference on Virtual Reality and 3D User Interfaces Abstracts and Workshops (VRW), Atlanta, GA, USA, 22–26 March 2020. [Google Scholar] [CrossRef]
- Broucke, S.V.; Deligiannis, N. Visualization of Real-Time Heterogeneous Smart City Data Using Virtual Reality. In Proceedings of the 2019 IEEE International Smart Cities Conference (ISC2), Casablanca, Morocco, 14–17 October 2019; pp. 685–690. [Google Scholar]
- Millais, P.; Jones, S.L.; Kelly, R. Exploring Data in Virtual Reality. In Proceedings of the Extended Abstracts of the 2018 CHI Conference on Human Factors in Computing Systems, Montreal, QC, Canada, 21–26 April 2018. [Google Scholar] [CrossRef]
- Narasimha, S.; Scharett, E.; Madathil, K.C.; Bertrand, J. WeRSort: Preliminary Results from a New Method of Remote Collaboration Facilitated by Fully Immersive Virtual Reality. Proc. Hum. Factors Ergon. Soc. Annu. Meet. 2018, 62, 2084–2088. [Google Scholar] [CrossRef]
- Cai, S.; Ke, P.; Narumi, T.; Zhu, K. ThermAirGlove: A Pneumatic Glove for Thermal Perception and Material Identification in Virtual Reality. In Proceedings of the 2020 IEEE Conference on Virtual Reality and 3D User Interfaces (VR), Atlanta, GA, USA, 22–26 March 2020. [Google Scholar] [CrossRef]
- Bahceci, O.C.; Pena-Rios, A.; Gupta, V.; Conway, A.; Owusu, G. Work-in-Progress-Using Immersive Virtual Reality in Field Service Telecom Engineers Training. In Proceedings of the 2021 7th International Conference of the Immersive Learning Research Network, Eureka, CA, USA, 17 May–10 June 2021. [Google Scholar] [CrossRef]
- Li, Z.; Wang, J.; Yan, Z.; Wang, X.; Anwar, M.S. Anwar, M.S. An Interactive Virtual Training System for Assembly and Disassembly Based on Precedence Constraints. In Advances in Computer Graphics; Springer Nature Publishing: Cham, Switzerland, 2019; pp. 81–93. [Google Scholar] [CrossRef]
- Pece, F.; Tompkin, J.; Pfister, H.; Kautz, J.; Theobalt, C. Device effect on panoramic video+context tasks. In Proceedings of the 11th European Conference on Visual Media Production, London, UK, 13–14 November 2014. [Google Scholar] [CrossRef]
- Harman, J.; Brown, R.; Johnson, D. Improved Memory Elicitation in Virtual Reality: New Experimental Results and Insights. In Human-Computer Interaction-INTERACT 2017; Springer Nature Publishing: Cham, Switzerland, 2017; pp. 128–146. [Google Scholar] [CrossRef]
- Laugwitz, B.; Held, T.; Schrepp, M. Construction and Evaluation of a User Experience Questionnaire. In Lecture Notes in Computer Science; Springer: Berlin/Heidelberg, Germany, 2008; pp. 63–76. [Google Scholar] [CrossRef]
- Schölkopf, L.; Lorenz, M.; Stamer, M.; Albrecht, L.; Klimant, P.; Hammer, N.; Tümler, J. Haptic feedback is more important than VR experience for the user experience assessment of in-car human machine interfaces. Procedia CIRP 2021, 100, 601–606. [Google Scholar] [CrossRef]
- Pettersson, I.; Karlsson, M.; Ghiurau, F.T. Virtually the Same Experience? In Proceedings of the 2019 on Designing Interactive Systems Conference, San Diego, CA, USA, 23–28 June 2019. [Google Scholar] [CrossRef]
- Lewis, J.R. IBM computer usability satisfaction questionnaires: Psychometric evaluation and instructions for use. Int. J. Hum. Comput. Interact. 1995, 7, 57–78. [Google Scholar] [CrossRef]
- Schubert, T.; Friedmann, F.; Regenbrecht, H. The Experience of Presence: Factor Analytic Insights. Presence Teleoperators Virtual Environ. 2001, 10, 266–281. [Google Scholar] [CrossRef]
- Pinto, D.; Peixoto, B.; Krassmann, A.; Melo, M.; Cabral, L.; Bessa, M. Virtual Reality in Education: Learning a Foreign Language. In Advances in Intelligent Systems and Computing; Springer Nature Publishing: Cham, Switzerland, 2019; pp. 589–597. [Google Scholar] [CrossRef]
- Lewis, J.R. An after-scenario questionnaire for usability studies. ACM SIGCHI Bull. 1991, 23, 79. [Google Scholar] [CrossRef]
- Jennett, C.; Cox, A.L.; Cairns, P.; Dhoparee, S.; Epps, A.; Tijs, T.; Walton, A. Measuring and defining the experience of immersion in games. Int. J. Hum. Comput. Stud. 2008, 66, 641–661. [Google Scholar] [CrossRef]
- Liang, H.; Chang, J.; Deng, S.; Chen, C.; Tong, R.; Zhang, J.J. Exploitation of multiplayer interaction and development of virtual puppetry storytelling using gesture control and stereoscopic devices. Comput. Animat. Virtual Worlds 2016, 28, e1727. [Google Scholar] [CrossRef]
- Lessiter, J.; Freeman, J.; Keogh, E.; Davidoff, J. A Cross-Media Presence Questionnaire: The ITC-Sense of Presence Inventory. Presence Teleoperators Virtual Environ. 2001, 10, 282–297. [Google Scholar] [CrossRef]
- Ryan, R.M.; Rigby, C.S.; Przybylski, A. The Motivational Pull of Video Games: A Self-Determination Theory Approach. Motiv. Emot. 2006, 30, 344–360. [Google Scholar] [CrossRef]
- Perrin, A.; Ebrahimi, T.; Zadtootaghaj, S.; Schmidt, S.; Müller, S. Towards the need satisfaction in gaming: A comparison of different gaming platforms. In Proceedings of the 2017 Ninth International Conference on Quality of Multimedia Experience (QoMEX), Erfurt, Germany, 31 May–2 June 2017; pp. 1–3. [Google Scholar]
- Bradley, M.M.; Lang, P.J. Measuring emotion: The self-assessment manikin and the semantic differential. J. Behav. Ther. Exp. Psychiatry 1994, 25, 49–59. [Google Scholar] [CrossRef]
- Marques, T.; Vairinhos, M.; Almeida, P. How VR 360º Impacts the Immersion of the Viewer of Suspense AV Content. In Proceedings of the 2019 ACM International Conference on Interactive Experiences for TV and Online Video, TVX ’19, New York, NY, USA, 5–7 June 2019; pp. 239–246. [Google Scholar] [CrossRef]
- Kennedy, R.S.; Lane, N.E.; Berbaum, K.S.; Lilienthal, M.G. Simulator Sickness Questionnaire: An Enhanced Method for Quantifying Simulator Sickness. Int. J. Aviat. Psychol. 1993, 3, 203–220. [Google Scholar] [CrossRef]
- Weidner, F.; Hoesch, A.; Poeschl, S.; Broll, W. Comparing VR and non-VR driving simulations: An experimental user study. In Proceedings of the 2017 IEEE Virtual Reality (VR), Los Angeles, CA, USA, 18–22 March 2017; pp. 281–282. [Google Scholar] [CrossRef]
- Lombard, M.; Ditton, T.; Weinstein, L. Measuring Presence: The Temple Presence Inventory. Presented at the Twelfth International Workshop on Presence, Los Angeles, California, USA. 2009. Available online: http://matthewlombard.com/ISPR/Proceedings/2009/Lombard_et_al.pdf (accessed on 14 April 2023).
- Bishop, C.; Esteves, A.; McGregor, I. Head-mounted displays as opera glasses: Using mixed-reality to deliver an egalitarian user experience during live events. In Proceedings of the 19th ACM International Conference on Multimodal Interaction—ICMI 2017, Glasgow, UK, 13–17 November 2017. [Google Scholar] [CrossRef]
- Markland, D.; Hardy, L. On the Factorial and Construct Validity of the Intrinsic Motivation Inventory: Conceptual and Operational Concerns. Res. Q. Exerc. Sport 1997, 68, 20–32. [Google Scholar] [CrossRef] [PubMed]
- Kim, H.K.; Park, J.; Choi, Y.; Choe, M. Virtual reality sickness questionnaire (VRSQ): Motion sickness measurement index in a virtual reality environment. Appl. Ergon. 2018, 69, 66–73. [Google Scholar] [CrossRef]
- O’Brien, H.L.; Toms, E.G. The development and evaluation of a survey to measure user engagement. J. Am. Soc. Inf. Sci. Technol. 2009, 61, 50–69. [Google Scholar] [CrossRef]
- Sanaei, M.; Machacek, M.; Eubanks, J.C.; Wu, P.; Oliver, J.; Gilbert, S.B. The Effect of Training Communication Medium on the Social Constructs Co-Presence, Engagement, Rapport, and Trust. In Proceedings of the 28th ACM Symposium on Virtual Reality Software and Technology, Tsukuba, Japan, 29 November–1 December 2022. [Google Scholar] [CrossRef]
- Franklin, A.E.; Burns, P.; Lee, C.S. Psychometric testing on the NLN Student Satisfaction and Self-Confidence in Learning, Simulation Design Scale, and Educational Practices Questionnaire using a sample of pre-licensure novice nurses. Nurse Educ. Today 2014, 34, 1298–1304. [Google Scholar] [CrossRef]
- Hoang, T.; Greuter, S.; Taylor, S. An Evaluation of Virtual Reality Maintenance Training for Industrial Hydraulic Machines. In Proceedings of the 2022 IEEE Conference on Virtual Reality and 3D User Interfaces (VR), Christchurch, New Zealand, 12–16 March 2022. [Google Scholar] [CrossRef]
- Lanier, M.; Waddell, T.; Elson, M.; Tamul, D.; Ivory, J.; Przybylski, A. Virtual reality check: Statistical power, reported results, and the validity of research on the psychology of virtual reality and immersive environments. Comput. Hum. Behav. 2019, 100, 70–78. [Google Scholar] [CrossRef]
- Takahashi, N.; Inamura, T.; Mizuchi, Y.; Choi, Y. Evaluation of the Difference of Human Behavior between VR and Real Environments in Searching and Manipulating Objects in a Domestic Environment. In Proceedings of the 2021 30th IEEE International Conference on Robot Human Interactive Communication, Vancouver, BC, Canada, 8–12 August 2021. [Google Scholar] [CrossRef]
- Zavlanou, C.; Lanitis, A. Product Packaging Evaluation Through the Eyes of Elderly People: Personas vs. Aging Suit vs. Virtual Reality Aging Simulation. In Human Systems Engineering and Design; Springer Nature Switzerland AG: Cham, Switzerland, 2018; pp. 567–572. [Google Scholar] [CrossRef]
- Han, H.; Lu, A.; Wells, U. Under the Movement of Head: Evaluating Visual Attention in Immersive Virtual Reality Environment. In Proceedings of the 2017 International Conference on Virtual Reality and Visualization (ICVRV), Zhengzhou, China, 21–22 October 2017; pp. 294–295. [Google Scholar]
- Ebrahimi, E.; Babu, S.V.; Pagano, C.C.; Jörg, S. An Empirical Evaluation of Visuo-Haptic Feedback on Physical Reaching Behaviors During 3D Interaction in Real and Immersive Virtual Environments. ACM Trans. Appl. Percept. 2016, 13, 1–21. [Google Scholar] [CrossRef]
- Mathur, J.; Miller, S.R.; Simpson, T.W.; Meisel, N.A. Identifying the Effects of Immersion on Design for Additive Manufacturing Evaluation of Designs of Varying Manufacturability. In Proceedings of the Volume 5: 27th Design for Manufacturing and the Life Cycle Conference (DFMLC), St. Louis, MO, USA, 14–17 August 2022. [Google Scholar] [CrossRef]
- Mathis, F.; Vaniea, K.; Khamis, M. RepliCueAuth: Validating the Use of a Lab-Based Virtual Reality Setup for Evaluating Authentication Systems. In Proceedings of the 2021 CHI Conference on Human Factors in Computing Systems, Yokohama, Japan, 8–13 May 2021. [Google Scholar] [CrossRef]
- Ma, C.; Han, T. Combining Virtual Reality (VR) Technology with Physical Models – A New Way for Human-Vehicle Interaction Simulation and Usability Evaluation. In HCI in Mobility, Transport, and Automotive Systems; Krömker, H., Ed.; Springer Nature Switzerland AG: Cham, Switzerland, 2019; pp. 145–160. [Google Scholar]
- Chew, J.Y.; Okayama, K.; Okuma, T.; Kawamoto, M.; Onda, H.; Kato, N. Development of A Virtual Environment to Realize Human-Machine Interaction of Forklift Operation. In Proceedings of the 2019 7th International Conference on Robot Intelligence Technology and Applications (RiTA), Daejeon, Republic of Korea, 1–3 November 2019; pp. 112–118. [Google Scholar]
- Verwulgen, S.; Goethem, S.V.; Cornelis, G.; Verlinden, J.; Coppens, T. Appreciation of Proportion in Architecture: A Comparison Between Facades Primed in Virtual Reality and on Paper. In Advances in Human Factors in Wearable Technologies and Game Design; Springer Nature Publishing: Cham, Switzerland, 2019; pp. 305–314. [Google Scholar] [CrossRef]
- Liao, D.; Zhang, W.; Liang, G.; Li, Y.; Xie, J.; Zhu, L.; Xu, X.; Shu, L. Arousal Evaluation of VR Affective Scenes Based on HR and SAM. In Proceedings of the 2019 IEEE MTT-S International Microwave Biomedical Conference (IMBioC), Nanjing, China, 6–8 May 2019; Volume 1, pp. 1–4. [Google Scholar]
- Ostrander, J.K.; Tucker, C.S.; Simpson, T.W.; Meisel, N.A. Evaluating the Effectiveness of Virtual Reality As an Interactive Educational Resource for Additive Manufacturing. In Proceedings of the Volume 3: 20th International Conference on Advanced Vehicle Technologies 15th International Conference on Design Education, Quebec City, QC, Canada, 26–29 August 2018. [Google Scholar] [CrossRef]
- Keller, T.; Brucker-Kley, E.; Wyder, C. Virtual reality and its impact on learning success. In Proceedings of the 16th International Conference Mobile Learning 2020, Sofia, Bulgaria, 2–4 April 2020; pp. 78–86. [Google Scholar]
- Guo, J.; Weng, D.; Fang, H.; Zhang, Z.; Ping, J.; Liu, Y.; Wang, Y. Exploring the Differences of Visual Discomfort Caused by Long-term Immersion between Virtual Environments and Physical Environments. In Proceedings of the 2020 IEEE Conference on Virtual Reality and 3D User Interfaces (VR), Atlanta, GA, USA, 22–26 March 2020. [Google Scholar] [CrossRef]
- Diederichs, F.; Niehaus, F.; Hees, L. Guerilla Evaluation of Truck HMI with VR. In Virtual, Augmented and Mixed Reality. Design and Interaction; Springer Nature Switzerland AG: Cham, Switzerland, 2020; pp. 3–17. [Google Scholar] [CrossRef]
- Vazquez, C.; Xia, L.; Aikawa, T.; Maes, P. Words in Motion: Kinesthetic Language Learning in Virtual Reality. In Proceedings of the 2018 IEEE 18th International Conference on Advanced Learning Technologies (ICALT), Mumbai, India, 9–13 July 2018. [Google Scholar] [CrossRef]
- Agethen, P.; Link, M.; Gaisbauer, F.; Pfeiffer, T.; Rukzio, E. Counterbalancing virtual reality induced temporal disparities of human locomotion for the manufacturing industry. In Proceedings of the 11th Annual International Conference on Motion, Interaction, and Games, Limassol, Cyprus, 8–10 November 2018. [Google Scholar] [CrossRef]
- Franzluebbers, A.; Johnsen, K. Performance Benefits of High-Fidelity Passive Haptic Feedback in Virtual Reality Training. In Proceedings of the Symposium on Spatial User Interaction—SUI’18, Berlin, Germany, 13–14 October 2018. [Google Scholar] [CrossRef]
- Bialkova, S.; Ettema, D. Cycling renaissance: The VR potential in exploring static and moving environment elements. In Proceedings of the 2019 IEEE 5th Workshop on Everyday Virtual Reality (WEVR), Osaka, Japan, 23–24 March 2019; pp. 1–6. [Google Scholar]
- Christensen, D.J.R.; Holte, M.B. The Impact of Virtual Reality Training on Patient-Therapist Interaction. In Lecture Notes of the Institute for Computer Sciences, Social Informatics and Telecommunications Engineering; Springer International Publishing AG: Cham, Switzerland, 2018; pp. 127–138. [Google Scholar] [CrossRef]
- Safikhani, S.; Holly, M.; Kainz, A.; Pirker, J. The Influence of in-VR Questionnaire Design on the User Experience. In Proceedings of the 27th ACM Symposium on Virtual Reality Software and Technology, Osaka, Japan, 8–10 December 2021. [Google Scholar] [CrossRef]
- Wagner Filho, J.A.; Rey, M.F.; Freitas, C.M.D.S.; Nedel, L. Immersive Visualization of Abstract Information: An Evaluation on Dimensionally-Reduced Data Scatterplots. In Proceedings of the 2018 IEEE Conference on Virtual Reality and 3D User Interfaces (VR), Tuebingen/Reutlingen, Germany, 18–22 March 2018; pp. 483–490. [Google Scholar]
- Petrykowski, M.; Berger, P.; Hennig, P.; Meinel, C. Digital Collaboration with a Whiteboard in Virtual Reality. In Proceedings of the Future Technologies Conference (FTC) 2018; Springer Nature Switzerland AG: Cham, Switzerland, 2018; pp. 962–981. [Google Scholar] [CrossRef]
- Kratz, S.; Rabelo Ferriera, F. Immersed remotely: Evaluating the use of Head Mounted Devices for remote collaboration in robotic telepresence. In Proceedings of the 2016 25th IEEE International Symposium on Robot and Human Interactive Communication (RO-MAN), New York, NY, USA, 26–31 August 2016; pp. 638–645. [Google Scholar]
- Andersen, B.J.H.; Davis, A.T.A.; Weber, G.; Wunsche, B.C. Immersion or Diversion: Does Virtual Reality Make Data Visualisation More Effective? In Proceedings of the 2019 International Conference on Electronics, Information, and Communication (ICEIC), Auckland, New Zealand, 22–25 January 2019. [Google Scholar] [CrossRef]
- Franzluebbers, A.; Li, C.; Paterson, A.; Johnsen, K. Virtual Reality Point Cloud Annotation. In Proceedings of the 2022 ACM Symposium on Spatial User Interaction, Online, 1–2 December 2022. [Google Scholar] [CrossRef]
- Zhang, X.; He, W.; Wang, S. Manual Preliminary Coarse Alignment of 3D Point Clouds in Virtual Reality. In Communications in Computer and Information Science; Springer Nature Switzerland AG: Cham, Switzerland, 2021; pp. 424–432. [Google Scholar] [CrossRef]
- Hombeck, J.; Meuschke, M.; Zyla, L.; Heuser, A.J.; Toader, J.; Popp, F.; Bruns, C.J.; Hansen, C.; Datta, R.R.; Lawonn, K. Evaluating Perceptional Tasks for Medicine: A Comparative User Study Between a Virtual Reality and a Desktop Application. In Proceedings of the 2022 IEEE Conference on Virtual Reality and 3D User Interfaces (VR), Christchurch, New Zealand, 12–16 March 2022. [Google Scholar] [CrossRef]
- Keighrey, C.; Flynn, R.; Murray, S.; Murray, N. A Physiology-based QoE Comparison of Interactive Augmented Reality, Virtual Reality and Tablet-based Applications. IEEE Trans. Multimed. 2020, 23, 333–341. [Google Scholar] [CrossRef]
- Watson, D.; Fitzmaurice, G.; Matejka, J. How Tall is that Bar Chart? Virtual Reality, Distance Compression and Visualizations. In Proceedings of the 2021 Graphics Interface Conference, Virtual Event, 28–29 May 2021; Canadian Information Processing Society: Mississauga, ON, Canada. [Google Scholar] [CrossRef]
- Nishimura, T.; Hirai, K.; Horiuchi, T. Color Perception Comparison of Scene Images between Head-Mounted Display and Desktop Display. In Proceedings of the International Display Workshops, Sapporo, Japan, 27–29 November 2019; p. 1148. [Google Scholar] [CrossRef]
- Nebeling, M.; Rajaram, S.; Wu, L.; Cheng, Y.; Herskovitz, J. XRStudio: A Virtual Production and Live Streaming System for Immersive Instructional Experiences. In Proceedings of the 2021 CHI Conference on Human Factors in Computing Systems, Yokohama, Japan, 8–13 May 2021. [Google Scholar] [CrossRef]
- Fujii, R.; Hirose, H.; Aoyagi, S.; Yamamoto, M. On-Demand Lectures that Enable Students to Feel the Sense of a Classroom with Students Who Learn Together. In Human Interface and the Management of Information. Information Presentation and Visualization; Springer Nature Switzerland AG: Cham, Switzerland, 2021; pp. 268–282. [Google Scholar] [CrossRef]
- Makransky, G.; Terkildsen, T.S.; Mayer, R.E. Adding immersive virtual reality to a science lab simulation causes more presence but less learning. Learn. Instr. 2019, 60, 225–236. [Google Scholar] [CrossRef]
- Thorn, J.; Pizarro, R.; Spanlang, B.; Bermell-Garcia, P.; Gonzalez-Franco, M. Assessing 3D Scan Quality Through Paired-comparisons Psychophysics. In Proceedings of the 2016 ACM on Multimedia Conference—MM’16, Amsterdam, The Netherlands, 15–19 October 2016. [Google Scholar] [CrossRef]
- Horvat, N.; Škec, S.; Martinec, T.; Lukacevic, F.; Perišic, M. Comparing virtual reality and desktop interface for reviewing 3D CAD models. In Proceedings of the Design Society: International Conference on Engineering Design, Delft, The Netherlands, 5–8 August 2019; pp. 1923–1932. [Google Scholar] [CrossRef]
- Qadir, Z.; Chowdhury, E.; Ghosh, L.; Konar, A. Quantitative Analysis of Cognitive Load Test While Driving in a VR vs. Non-VR Environment. In Lecture Notes in Computer Science; Springer Nature Switzerland AG: Cham, Switzerland, 2019; pp. 481–489. [Google Scholar] [CrossRef]
- Colombo, V.; Bocca, G.; Mondellini, M.; Sacco, M.; Aliverti, A. Evaluating the effects of Virtual Reality on perceived effort during cycling: Preliminary results on healthy young adults. In Proceedings of the 2022 IEEE International Symposium on Medical Measurements and Applications (MeMeA), Messina, Italy, 22–24 June 2022. [Google Scholar] [CrossRef]
- Ugwitz, P.; Šašinková, A.; Šašinka, v.; Stachoň, Z.; Juřík, V. Toggle toolkit: A tool for conducting experiments in unity virtual environments. Behav. Res. Methods 2021, 53, 1581–1591. [Google Scholar] [CrossRef]
- Grübel, J.; Weibel, R.; Jiang, M.H.; Hölscher, C.; Hackman, D.A.; Schinazi, V.R. EVE: A framework for experiments in virtual environments. In Spatial Cognition X; Springer International Publishing AG: Cham, Switzerland, 2016; pp. 159–176. [Google Scholar]
- Vasser, M.; Kängsepp, M.; Magomedkerimov, M.; Kilvits, K.; Stafinjak, V.; Kivisik, T.; Vicente, R.; Aru, J. VREX: An open-source toolbox for creating 3D virtual reality experiments. BMC Psychol. 2017, 5, 4. [Google Scholar] [CrossRef] [PubMed]
- Wolfel, M.; Hepperle, D.; Purps, C.F.; Deuchler, J.; Hettmann, W. Entering a new Dimension in Virtual Reality Research: An Overview of Existing Toolkits, their Features and Challenges. In Proceedings of the 2021 International Conference on Cyberworlds (CW), Caen, France, 28–30 September 2021. [Google Scholar] [CrossRef]


| Search System | Url |
|---|---|
| ACM Digital Library | https://dl.acm.org/ |
| Arxiv only 2020 | https://arxiv.org/ |
| IEEE Xplore | https://ieeexplore.ieee.org/ |
| Ovid | https://ovidsp.dc1.ovid.com/ovid-a/ovidweb.cgi 1 |
| Scopus | https://www.scopus.com/home.uri |
| Wiley Online Library | https://onlinelibrary.wiley.com/ |
| HMD VR in Comparison to: | |||||||||
|---|---|---|---|---|---|---|---|---|---|
| Category | Real World | Screen | |||||||
| Sub-Cat. | ▲ | ► | ■ | ▼ | ▲ | ► | ■ | ▼ | |
| Interaction | Efficiency | 3 | 10 | 0 | 4 | 10 | 7 | 0 | 2 |
| Interaction | 0 | 3 | 0 | 0 | 2 | 0 | 0 | 0 | |
| Overview | 0 | 0 | 0 | 0 | 2 | 0 | 0 | 0 | |
| Physical Demand | 0 | 0 | 0 | 0 | 0 | 0 | 0 | 1 | |
| Simulator Sick. | 0 | 0 | 0 | 1 | 0 | 0 | 0 | 0 | |
| Usability | 0 | 1 | 0 | 1 | 0 | 3 | 0 | 2 | |
| Usefulness | 0 | 1 | 0 | 0 | 0 | 0 | 0 | 0 | |
| User Experience | 0 | 1 | 0 | 0 | 0 | 0 | 0 | 0 | |
| Workload | 1 | 2 | 0 | 3 | 0 | 1 | 0 | 0 | |
| ∑ | 4 | 18 | 0 | 9 | 14 | 11 | 0 | 5 | |
| % | 13 | 58 | 0 | 29 | 47 | 38 | 0 | 16 | |
| Perception | Aesthetics | 0 | 1 | 0 | 0 | 0 | 0 | 0 | 0 |
| Accuracy | 0 | 0 | 0 | 0 | 1 | 0 | 0 | 0 | |
| Color | 0 | 0 | 0 | 0 | 0 | 0 | 2 | 0 | |
| Efficiency | 0 | 0 | 0 | 0 | 3 | 0 | 1 | 0 | |
| Emotions | 0 | 1 | 1 | 0 | 0 | 0 | 0 | 0 | |
| Engagement | 0 | 4 | 0 | 1 | 3 | 3 | 0 | 0 | |
| Experience | 0 | 0 | 0 | 0 | 1 | 0 | 0 | 0 | |
| Frustration | 0 | 0 | 0 | 0 | 3 | 0 | 0 | 1 | |
| Immersion | 0 | 0 | 0 | 0 | 3 | 0 | 0 | 1 | |
| Learning | 0 | 2 | 0 | 0 | 2 | 2 | 0 | 3 | |
| Motion Sickness | 0 | 1 | 0 | 1 | 0 | 0 | 0 | 0 | |
| Perception | 0 | 0 | 0 | 0 | 0 | 1 | 0 | 0 | |
| Presence | 1 | 1 | 0 | 0 | 6 | 2 | 0 | 0 | |
| Qual. of Exp. | 0 | 0 | 0 | 0 | 0 | 0 | 0 | 1 | |
| Realism | 0 | 1 | 0 | 1 | 1 | 0 | 0 | 0 | |
| Satisfaction | 0 | 0 | 0 | 0 | 2 | 0 | 0 | 0 | |
| Simulator Sickness | 0 | 0 | 0 | 0 | 0 | 0 | 0 | 1 | |
| Spatial Perception | 0 | 0 | 0 | 0 | 1 | 0 | 0 | 0 | |
| Workload | 1 | 0 | 0 | 0 | 4 | 2 | 0 | 4 | |
| ∑ | 2 | 11 | 1 | 3 | 33 | 10 | 3 | 11 | |
| % | 12 | 65 | 6 | 18 | 58 | 18 | 5 | 19 | |
| Sensing and Reconstr. | Accuracy | 0 | 0 | 0 | 0 | 1 | 1 | 1 | 0 |
| Autonomy | 0 | 0 | 0 | 0 | 1 | 0 | 0 | 0 | |
| Efficiency | 0 | 0 | 0 | 0 | 0 | 1 | 0 | 0 | |
| Flexibility | 1 | 0 | 0 | 0 | 0 | 0 | 0 | 0 | |
| Haptics | 0 | 1 | 0 | 0 | 0 | 0 | 0 | 0 | |
| Interaction | 1 | 0 | 0 | 0 | 0 | 0 | 0 | 0 | |
| Learning | 1 | 0 | 1 | 0 | 0 | 0 | 0 | 0 | |
| Locomotion | 0 | 0 | 0 | 1 | 0 | 0 | 1 | 0 | |
| Overview | 0 | 0 | 0 | 0 | 1 | 0 | 0 | 0 | |
| Physi. Response | 0 | 0 | 0 | 0 | 0 | 1 | 0 | 0 | |
| Realism | 0 | 1 | 0 | 0 | 0 | 0 | 0 | 0 | |
| Reconstruction | 1 | 0 | 1 | 0 | 0 | 0 | 0 | 0 | |
| Spatial Perception | 0 | 2 | 0 | 3 | 0 | 1 | 0 | 1 | |
| Transferability | 0 | 0 | 1 | 0 | 0 | 0 | 0 | 0 | |
| Usability | 0 | 0 | 0 | 1 | 0 | 0 | 0 | 0 | |
| ∑ | 4 | 4 | 3 | 5 | 3 | 4 | 2 | 1 | |
| % | 25 | 25 | 19 | 31 | 30 | 40 | 20 | 10 | |
| Male | Female | Diverse | Not Defined | Age Min–Max | |
|---|---|---|---|---|---|
| Average | 16.95 | 10.66 | 0.05 | 27.61 | 22–39 |
| SD | 13.45 | 11.35 | 0.21 | 4.14 | 8–18 |
| n | 38 | 38 | 2 | 22 | 25 |
| ∑ | 644 | 405 | 2 | 574 | x |
| No. | Questionnaire | Origin | Used In |
|---|---|---|---|
| 7 | Task Load Index (TLX) by NASA | [34] | [37,38,39,40,41,42,43] |
| 4 | System Usability Scale (SUS) | [36] | [38,44,45,46] |
| 2 | Witmer and Singer’s Presence Questionnaire | [35] | [42,47] |
| 2 | User Experience Questionnaire (UEQ) | [48] | [49,50] |
| 2 | IBM CSUQ System Usability | [51] | [42,47] |
| 1 | IGroup Presence Questionnaire (IPQ) | [52] | [39,53] |
| 1 | After-Scenario Questionnaire (Satisfaction) | [54] | [53] |
| 1 | Immersive Experience Questionnaire (IEQ) | [55] | [56] |
| 1 | ITC-Sense of Presence Inventory | [57] | [50] |
| 1 | Player Experience of Need Satisfaction (PENS) Questionnaire | [58] | [59] |
| 1 | Self-Assessment Manikin (SAM) | [60] | [61] |
| 1 | Simulator Sickness Questionnaire | [62] | [63] |
| 1 | Temple Presence Inventory (TPI) | [64] | [65] |
| 1 | Intrinsic Motivation Inventory (IMI) | [66] | [38] |
| 1 | Virtual Reality Sickness Questionnaire (VRSQ) | [67] | [38] |
| 1 | User Engagement Scale | [68] | [69] |
| 1 | Satisfaction and Self-Confidence in Learning (SSCL) | [70] | [71] |
| Sub-Category | Tend | Finding | No. | Corr. | Contra. | Reference | |
|---|---|---|---|---|---|---|---|
| Interaction | Efficiency | ▼ | Sig. slower in object placement | 1 | [73] | ||
| Efficiency | ► | VR based aging simulation has same potential as RR aging suits in terms of effectiveness | 2 | [74] | |||
| Efficiency | ► | No sig. difference in time to task completion | 3 | 9 | 8;29 | [42] | |
| Efficiency | ▲ | Sig. higher felt individual performance in VR | 4 | [42] | |||
| Efficiency | ▲ | Higher task-related focus in VR | 5 | [75] | |||
| Efficiency | ► | No difference in task completion time when adding visuo-haptic feedback | 6 | [76] | |||
| Efficiency | ▼ | Reaches were less efficient in the VR | 7 | [76] | |||
| Efficiency | ▼ | Higher time to task completion in VR | 8 | 29 | 9 | [76] | |
| Efficiency | ► | No sig. difference in time to task completion | 9 | 3 | 8;29 | [77] | |
| Efficiency | ► | No sig. difference in score | 10 | [77] | |||
| Efficiency | ► | No sig. difference in reading performance | 11 | [37] | |||
| Efficiency | ► | No sig. difference in error rates | 12 | [37] | |||
| Efficiency | ► | No sig. differences for entry accuracy | 13 | [78] | |||
| Efficiency | ▼ | Sig. slower touch input in VR | 14 | [78] | |||
| Efficiency | ▲ | Sig. faster eye-gaze input in VR | 15 | [78] | |||
| Efficiency | ► | No sig. difference in finding an object | 16 | [73] | |||
| Efficiency | ► | No sig. difference for grasping time and head movement | 17 | [73] | |||
| Interaction | ► | No sig. difference in interaction skills | 18 | 19;22 | 23 | [79] | |
| Interaction | ► | Operation behavior of the same task in VE is highly correlated to that in RR (r > 0.90), which suggests VR successfully induces operation behavior, which is similar to the real operation behavior | 19 | 18; 22 | 23 | [80] | |
| Interaction | ► | Similar qualitative feedback in VR and real world condition | 20 | [78] | |||
| Simulator Sickness | ▼ | Sig. higher simulator sickness | 21 | [37] | |||
| Usability | ► | No sig. diff in usability | 22 | 18; 19 | 23 | [42] | |
| Usability | ▼ | Sig. lower score for ease of use | 23 | 18;19;22 | [49] | ||
| Usefulness | ► | VR-based aging simulation has same potential as RR aging suits in terms of usefulness | 24 | [74] | |||
| User Exp. | ► | No sig. difference in user experience | 25 | [50] | |||
| Workload | ► | No sig. difference in cognitive load | 26 | [77] | |||
| Workload | ▼ | Sig. higher metal demand in VR | 27 | [37] | |||
| Workload | ▼ | Sig. higher physical demand in VR | 28 | [37] | |||
| Workload | ▼ | Sig. higher time to task completion | 29 | 8 | 3;9 | [37] | |
| Workload | ► | No sig. difference in workload | 30 | 31 | [78] | ||
| Workload | ▲ | Sig. lower workload in VR | 31 | 30 | [42] | ||
| Perception | Aesthetics | ► | No difference in aesthetics preferences | 32 | [81] | ||
| Emotions | ► | No sig. difference between VR and video for each emotion arousal except fear | 33 | 34 | [82] | ||
| Emotions | ■ | Sig. stronger fear in VR | 34 | 33 | [82] | ||
| Engagement | ► | No difference in engagement | 35 | 36 | [65] | ||
| Engagement | ▼ | Sig. lower engagement in VR | 36 | 35 | [69] | ||
| Engagement | ► | No difference in rapport | 37 | [69] | |||
| Engagement | ► | No difference in co-presence | 38 | 44 | 45 | [69] | |
| Engagement | ► | No difference in interpersonal trust | 39 | [69] | |||
| Learning | ► | No learning differences between learning additive manufacturing in RR and VR | 40 | 41;52 | 51 | [83] | |
| Learning | ► | No difference in learning success | 41 | 40;52 | 51 | [84] | |
| Motion Sick. | ▼ | Sig. more symptoms of “focus difficulty”; “general discomfort”; “nausea”; “headache” for VR | 42 | [85] | |||
| Motion Sick. | ► | No difference on accommodation response | 43 | [85] | |||
| Presence | ► | No sig. diff in presence | 44 | 38 | 45 | [42] | |
| Presence | ▲ | Higher sense of presence in VR | 45 | 44 | [65] | ||
| Realism | ► | No sig. differences between evaluation based on real user (supernumerary) in real world and avatars | 46 | [78] | |||
| Realism | ▼ | Sig. lower natural feeling | 47 | [49] | |||
| Sens. and Recons. | Flexibility | ▲ | VR is advantageous compared to aging suits in terms of flexibility | 48 | [74] | ||
| Haptics | ► | No sig. difference in material identification when using the TAGlove compared to perceiving the real physical objects | 49 | [43] | |||
| Interaction | ▲ | VR improves the external validity | 50 | [86] | |||
| Learning | ▲ | VR kinesthetic experiences were more memorable and helped participants retain a larger number of words, despite any confounding elements that hindered their initial learning gain | 51 | 40;41;52 | [87] | ||
| Learning | ■ | Participants first remembered sig. more words in the text-only conditon (RR); a week later, the amount of words remembered between text-only and VR with kinesthetic motion was equal | 52 | 40;41 | [87] | ||
| Locomotion | ▼ | Significantly higher travel times in VR | 53 | [88] | |||
| Realism | ► | No difference in realism | 54 | [65] | |||
| Reconstruction | ■ | Transfer of motor skills from RR to VR not given | 55 | [89] | |||
| Reconstruction | ▲ | VR studies completely support literature on real-life bike rides | 56 | [90] | |||
| Spatial Perc. | ▼ | VR less accurate in distance estimation | 57 | 58 | [76] | ||
| Spatial Perc. | ▼ | VR less correct in depth judgements | 58 | 57 | [76] | ||
| Spatial Perc. | ► | No difference in distance estimation when adding visuo haptic feedback | 59 | [76] | |||
| Spatial Perc. | ▼ | Sig. difference in behavior | 60 | [73] | |||
| Spatial Perc. | ► | No sig. difference in distance traveled | 61 | [73] | |||
| Transferability | ■ | Difference between therapist with experience in handling VR and therapists that had no prior experience; therapists with experience handled the patients the same as in conventional therapy whereas without experience they did not | 62 | [91] | |||
| Usability | ▼ | VR generates fewer answers directly related with the mockup and more related to the surrounding | 63 | [86] |
| Sub-Category | Tend | Finding | No. | Corr. | Contra. | Reference | |
|---|---|---|---|---|---|---|---|
| Interaction | Efficiency | ▼ | Sig. slower filling out questionnaire in VR | 1 | 5 | 3;7;10;12;17 | [92] |
| Efficiency | ▲ | Data exploration to be more successful in VR | 2 | 11;22;23;77;4 | [41] | ||
| Efficiency | ► | No sig. difference in time to task completion | 3 | 7;9;10;12 | 5;1;17 | [42] | |
| Efficiency | ► | Data distinction similar | 4 | [40] | |||
| Efficiency | ▼ | Time to task completion larger (slower) in VR | 5 | 1 | 3;7;10;12;17 | [93] | |
| Efficiency | ▲ | Performed better for design thinking tasks in VR | 6 | [94] | |||
| Efficiency | ► | No difference in time to task completion | 7 | 3;9;10;12 | 5;1;17 | [95] | |
| Efficiency | ▲ | Reduced task error rate in VR | 8 | [95] | |||
| Efficiency | ► | No differences in task completion time | 9 | 3;7;10;12 | 5;1;17 | [46] | |
| Efficiency | ► | No sig. difference in time to task completion | 10 | 3;7;9;12 | 5;1;17 | [47] | |
| Efficiency | ▲ | VR more efficient in data exploration | 11 | 2;22;23;4 | [96] | ||
| Efficiency | ► | No sig. difference in time to task completion | 12 | 3;7;9;10 | 5;1;17 | [77] | |
| Efficiency | ► | No sig. difference in score | 13 | [77] | |||
| Efficiency | ▲ | Sig. faster in annotation task | 14 | [97] | |||
| Efficiency | ▲ | Sig. faster in counting | 15 | [97] | |||
| Efficiency | ▲ | Sig. faster in time to task completion | 16 | 17 | 3;5;7;9;10;12 | [98] | |
| Efficiency | ▲ | Sig. faster in time to task completion | 17 | 16 | 3;5;7;9;10;12 | [38] | |
| Efficiency | ▲ | Sig. performance increase | 18 | 14;15;19 | [38] | ||
| Efficiency | ▲ | Sig. faster in VR | 19 | 14;15;18 | [99] | ||
| Interaction | ▲ | Interaction is more intuitive in VR | 20 | 21;22;23 | 26 | [40] | |
| Interaction | ▲ | Better interaction quality | 21 | 20 | [45] | ||
| Overview | ▲ | Data overview is easier in VR | 22 | 20;23 | 26 | [40] | |
| Overview | ▲ | Data depiction more intuitive in VR | 23 | 20;22 | 26 | [40] | |
| Phys. Demand | ▼ | VR data exploration required significantly more physical demand | 24 | 82 | [41] | ||
| Usability | ► | No sig. difference in usability | 25 | 26;27;32 | 28;29;31 | [42] | |
| Usability | ► | No difference in intuitive controls | 26 | 25;27;32 | 28;29;31 | [59] | |
| Usability | ► | No sig. difference in usability | 27 | 25;26;32 | 28;29;31 | [47] | |
| Usability | ▼ | Sig. lower score in system usability scale questionnaire | 28 | 29 | 25;26;27 | [44] | |
| Usability | ▼ | VR is sig. harder to use | 29 | 28 | 25;26;27;31 | [100] | |
| Workload | ► | No sig. difference in cognitive load | 30 | [77] | |||
| Usability | ▲ | Sig. better usable | 31 | 20 | 25;26;27;28 | [38] | |
| Usability | ► | No sig. difference in usability | 32 | 25;26;32 | 28;29;31 | [92] | |
| Perception | Accuracy | ▲ | Participants were better in estimating size in larger scales in VR | 33 | 34;35;36 | 99 | [101] |
| Accuracy | ▲ | Participants were better in estimating size in smaller scales in VR | 34 | 33;35;36 | 99 | [101] | |
| Accuracy | ▲ | Less error in height estimation in VR | 35 | 33;34;36 | 99 | [101] | |
| Accuracy | ▲ | Sig. lower error rate for shape and distance estimation | 36 | 33;34;34 | 99 | [99] | |
| Color | ■ | Higher luminance and chroma perception in VR | 37 | [102] | |||
| Color | ■ | Higher amount of retinal illuminance in VR | 38 | [102] | |||
| Efficiency | ▲ | Sig. higher felt individual performance in VR | 39 | 40;42 | [42] | ||
| Efficiency | ▲ | VR improves perceived collaborative success | 40 | 39;42 | [95] | ||
| Efficiency | ▲ | Sig. better perceived content organization | 41 | 77 | [71] | ||
| Efficiency | ■ | Participants reported subjectively that they performed best in rich VR environment while they actually were not | 42 | 39;40 | [101] | ||
| Engagement | ■ | Spent more time on the storytelling process when using VR | 43 | [56] | |||
| Engagement | ▲ | Sig. higher engagement in VR | 44 | 54 | [69] | ||
| Engagement | ► | No difference in rapport | 45 | [69] | |||
| Engagement | ► | No difference in co-presence | 46 | [69] | |||
| Engagement | ► | No difference in interpersonal trust | 47 | [69] | |||
| Engagement | ▲ | VR was considered more engaging | 48 | [103] | |||
| Engagement | ▲ | Sig. more interest and enjoyment | 49 | 44;54 | [38] | ||
| Experience | ▲ | Higher immersion in VR | 50 | 55;56;57 | 58 | [45] | |
| Frustration | ▲ | Lower frustration levels in VR | 51 | [40] | |||
| Frustration | ▲ | Sig. higher in perceived enjoyment | 52 | [71] | |||
| Frustration | ▼ | Sig. higher frustration | 53 | 44;54 | [92] | ||
| Frustration | ▲ | Sig. more fun in VR | 54 | 44;49 | [104] | ||
| Immersion | ▲ | Data immersion is larger in VR | 55 | 50;56;57 | 58 | [40] | |
| Immersion | ▲ | More immersive experience in VR | 56 | 50;55;57 | 58 | [56] | |
| Immersion | ▲ | Perceptual immersion higher in VR | 57 | 50;55;56 | 58 | [61] | |
| Immersion | ▼ | Immersion on narrative level lower in VR | 58 | 50;55;56;57 | [61] | ||
| Learning | ► | No differences in correct insights | 59 | 60 | [41] | ||
| Learning | ▼ | Less incorrect insights through VR | 60 | 59 | [41] | ||
| Learning | ► | No differences in hypotheses generated | 61 | 62 | [41] | ||
| Learning | ▼ | Fewer deep insights from within VR | 62 | 61 | [41] | ||
| Learning | ▲ | User in VR can recall more information | 63 | 64 | [47] | ||
| Learning | ▼ | Learned less in VR | 64 | 63 | [105] | ||
| Learning | ▲ | Sig. higher motivation in learning | 65 | [71] | |||
| Perception | ► | No difference in mesh resolution preferences | 66 | [106] | |||
| Presence | ► | No sig. difference in presence | 67 | 72 | 68;69;70;71;73 | [42] | |
| Presence | ▲ | Higher presence in VR | 68 | 69;70;71;73 | 67;72 | [59] | |
| Presence | ▲ | Higher presence in VR condition | 69 | 68;70;71;73 | 67;72 | [47] | |
| Presence | ▲ | Higher presence in VR | 70 | 69;70;71;73 | 67;72 | [105] | |
| Presence | ▲ | Sig. stronger sense of presence | 71 | 69;70;71;73 | 67;72 | [38] | |
| Presence | ► | No sig. difference in presence | 72 | 67 | 68;69;70;71;73 | [92] | |
| Presence | ▲ | Sig. higher feeling of professor talking | 73 | 69;70;71;73 | 67;72 | [104] | |
| Presence | ▲ | Sig. higher feeling of talking to class with others | 74 | 69;70;71;73 | 67;72 | [104] | |
| Experience | ▼ | VR offers lower quality of experience | 75 | 79 | [100] | ||
| Realism | ▲ | Meshes were perceived sig. more realistic | 76 | [106] | |||
| Satisfaction | ▲ | Data exploration to be more satisfying in VR | 77 | 2;11;22;23 | [41] | ||
| Satisfaction | ▲ | VR the most engaging | 78 | 49 | [93] | ||
| Sim. Sick. | ▼ | VR induced sig. higher simulator sickness | 79 | 75 | [63] | ||
| Spat. Perc. | ▲ | Better spatial perception in VR | 80 | 33;34;35;36 | 99 | [107] | |
| Workload | ▼ | VR shows elevation in electrodermal activity | 81 | [100] | |||
| Workload | ▲ | Sig. lower workload in VR | 82 | 84;88 | 83 | [42] | |
| Workload | ► | No differences in workload | 83 | 82 | [40] | ||
| Workload | ▲ | VR required less effort | 84 | 82;88 | 83 | [93] | |
| Workload | ▼ | Higher cognitive load in VR | 85 | 86;89 | [108] | ||
| Workload | ▼ | Higher cognitive load in VR | 86 | 85;89 | [105] | ||
| Workload | ► | No sig. difference in physical performance | 87 | [109] | |||
| Workload | ▲ | Sig. lower effort | 88 | 82;84 | 83 | [38] | |
| Workload | ▼ | Sig. higher mental demand in VR | 89 | 85;86 | [92] | ||
| Workload | ▲ | Sig. higher concentration rate in VR | 90 | [104] | |||
| Sens. Rec. | Accuracy | ■ | Perceived accuracy higher despite similar results | 91 | [93] | ||
| Accuracy | ► | No differences in completion accuracy | 92 | [46] | |||
| Accuracy | ▲ | Higher classification accuracy (EEG) in VR | 93 | [108] | |||
| Autonomy | ▲ | Higher Autonomy in VR | 94 | [59] | |||
| Efficiency | ► | No sig. differences in lane change performance | 95 | [63] | |||
| Locomotion | ■ | Users in VR condition walked further | 96 | [47] | |||
| Overview | ▲ | VR improves quality of view | 97 | [95] | |||
| Phys. Resp. | ► | No sig. differences regarding physiological repsonses | 98 | 87 | [63] | ||
| Spat. Perc. | ► | No difference in distance perception between all conditions | 99 | 33;34;35;36;80 | [93] | ||
| Spat. Perc. | ▼ | Sig. lower realism in VR | 100 | [92] |
Disclaimer/Publisher’s Note: The statements, opinions and data contained in all publications are solely those of the individual author(s) and contributor(s) and not of MDPI and/or the editor(s). MDPI and/or the editor(s) disclaim responsibility for any injury to people or property resulting from any ideas, methods, instructions or products referred to in the content. |
© 2023 by the authors. Licensee MDPI, Basel, Switzerland. This article is an open access article distributed under the terms and conditions of the Creative Commons Attribution (CC BY) license (https://creativecommons.org/licenses/by/4.0/).
Share and Cite
Hepperle, D.; Wölfel, M. Similarities and Differences between Immersive Virtual Reality, Real World, and Computer Screens: A Systematic Scoping Review in Human Behavior Studies. Multimodal Technol. Interact. 2023, 7, 56. https://doi.org/10.3390/mti7060056
Hepperle D, Wölfel M. Similarities and Differences between Immersive Virtual Reality, Real World, and Computer Screens: A Systematic Scoping Review in Human Behavior Studies. Multimodal Technologies and Interaction. 2023; 7(6):56. https://doi.org/10.3390/mti7060056
Chicago/Turabian StyleHepperle, Daniel, and Matthias Wölfel. 2023. "Similarities and Differences between Immersive Virtual Reality, Real World, and Computer Screens: A Systematic Scoping Review in Human Behavior Studies" Multimodal Technologies and Interaction 7, no. 6: 56. https://doi.org/10.3390/mti7060056