
Exploring the Educational Value and Impact of Vision-Impairment Simulations on Sympathy and Empathy with XREye

 , , , and
Abstract
:1. Introduction
Q1: Are the vision-impairment simulations provided by XREye able to increase sympathy and empathy for people with vision impairments?
Q2: Are vision-impairment simulations such as XREye useful for educating people about the effects of vision impairments on perception?
- Assessing the educational value of vision-impairment simulations such as XREye;
- Evaluating the effectiveness of XREye to increase sympathy and empathy towards people with vision impairments;
- Investigating the possible benefits immersive experiences can provide for these purposes;
- Presenting our approach to simulate achromatopsia (severe loss of color vision, commonly also referred to as “color blindness”) in XR.
2. Related Work
2.1. XR and Vision Impairments
2.2. XR for Sympathy and Empathy
3. Vision-Impairment Simulations
3.1. Refractive Errors: Myopia, Hyperopia, Presbyopia
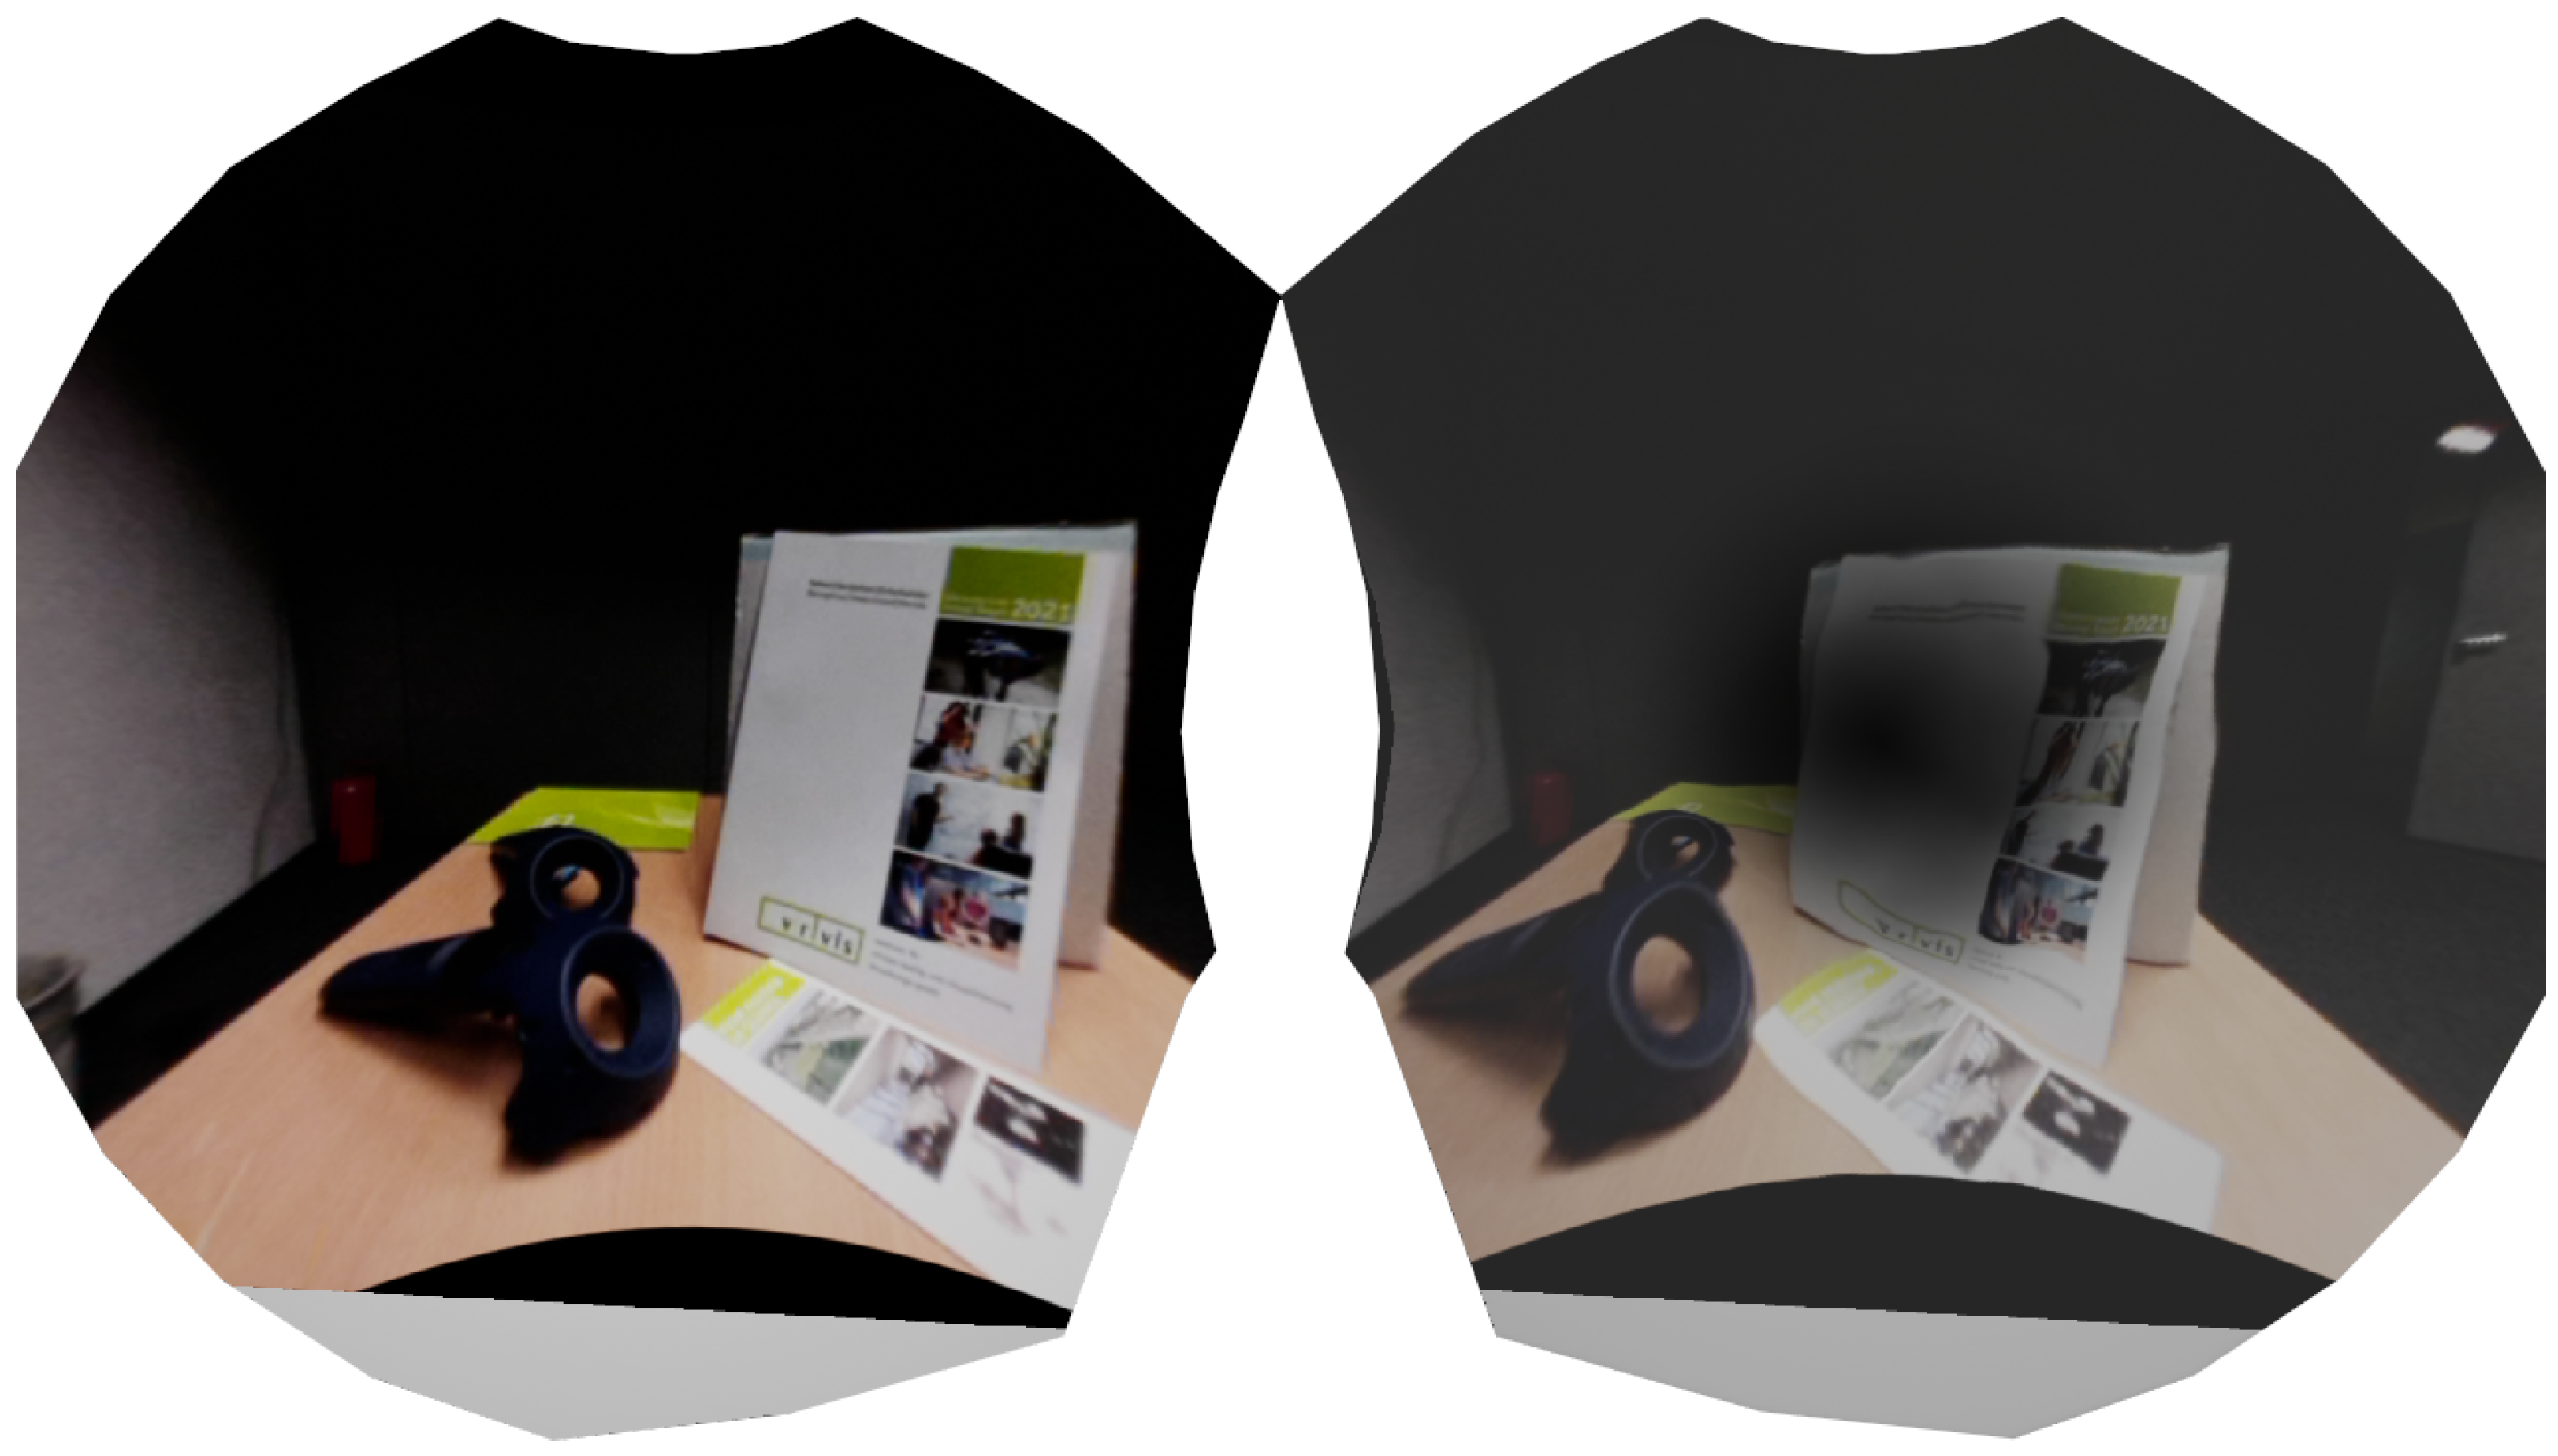
3.2. Cornea Disease
- Blurry vision;
- Sensitivity to light; and
- Cloudy vision.
- VA reduction;
- Contrast reduction;
- Color shift;
- Texture blending; and
- Bloom or glare.
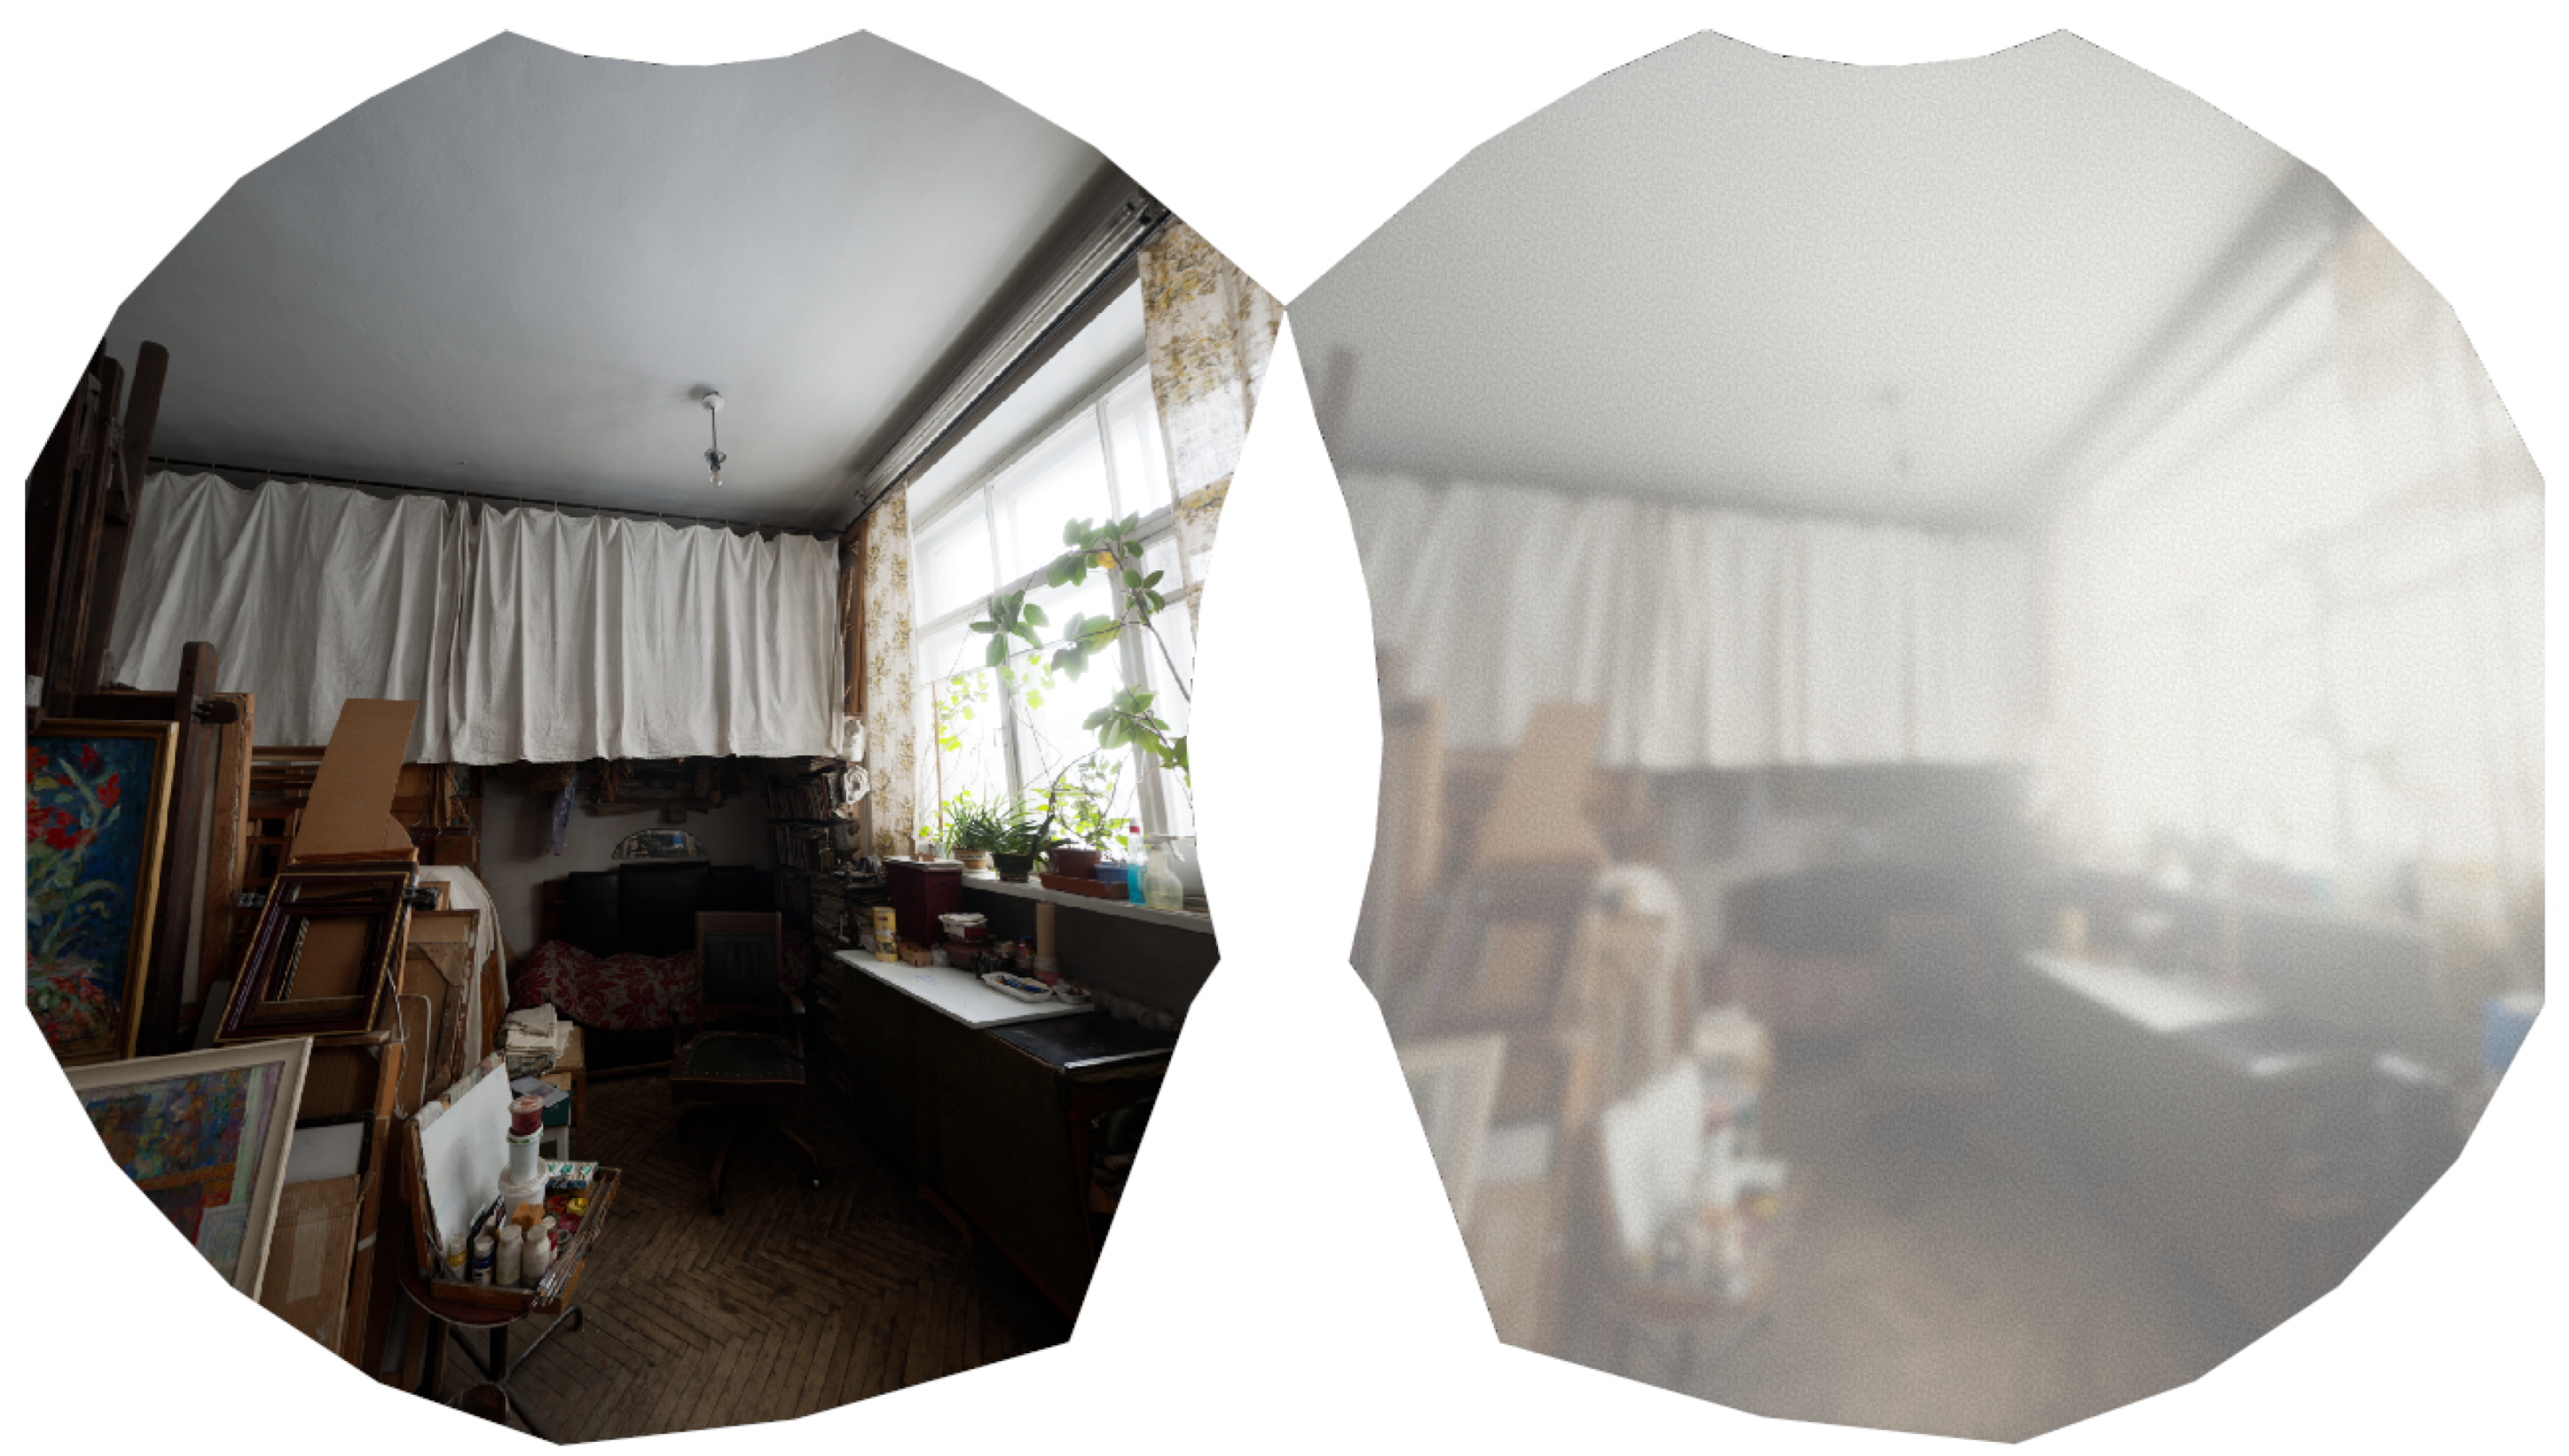
3.3. Age-Related Macular Degeneration
- Blurry vision;
- Distorted vision (where straight lines are often perceived as wavy or crooked);
- Faded and less bright colors;
- Reduced contrast sensitivity; and
- Loss of central vision.
- VA reduction (optional);
- Distortion;
- Desaturation;
- Contrast reduction; and
- Texture blending.
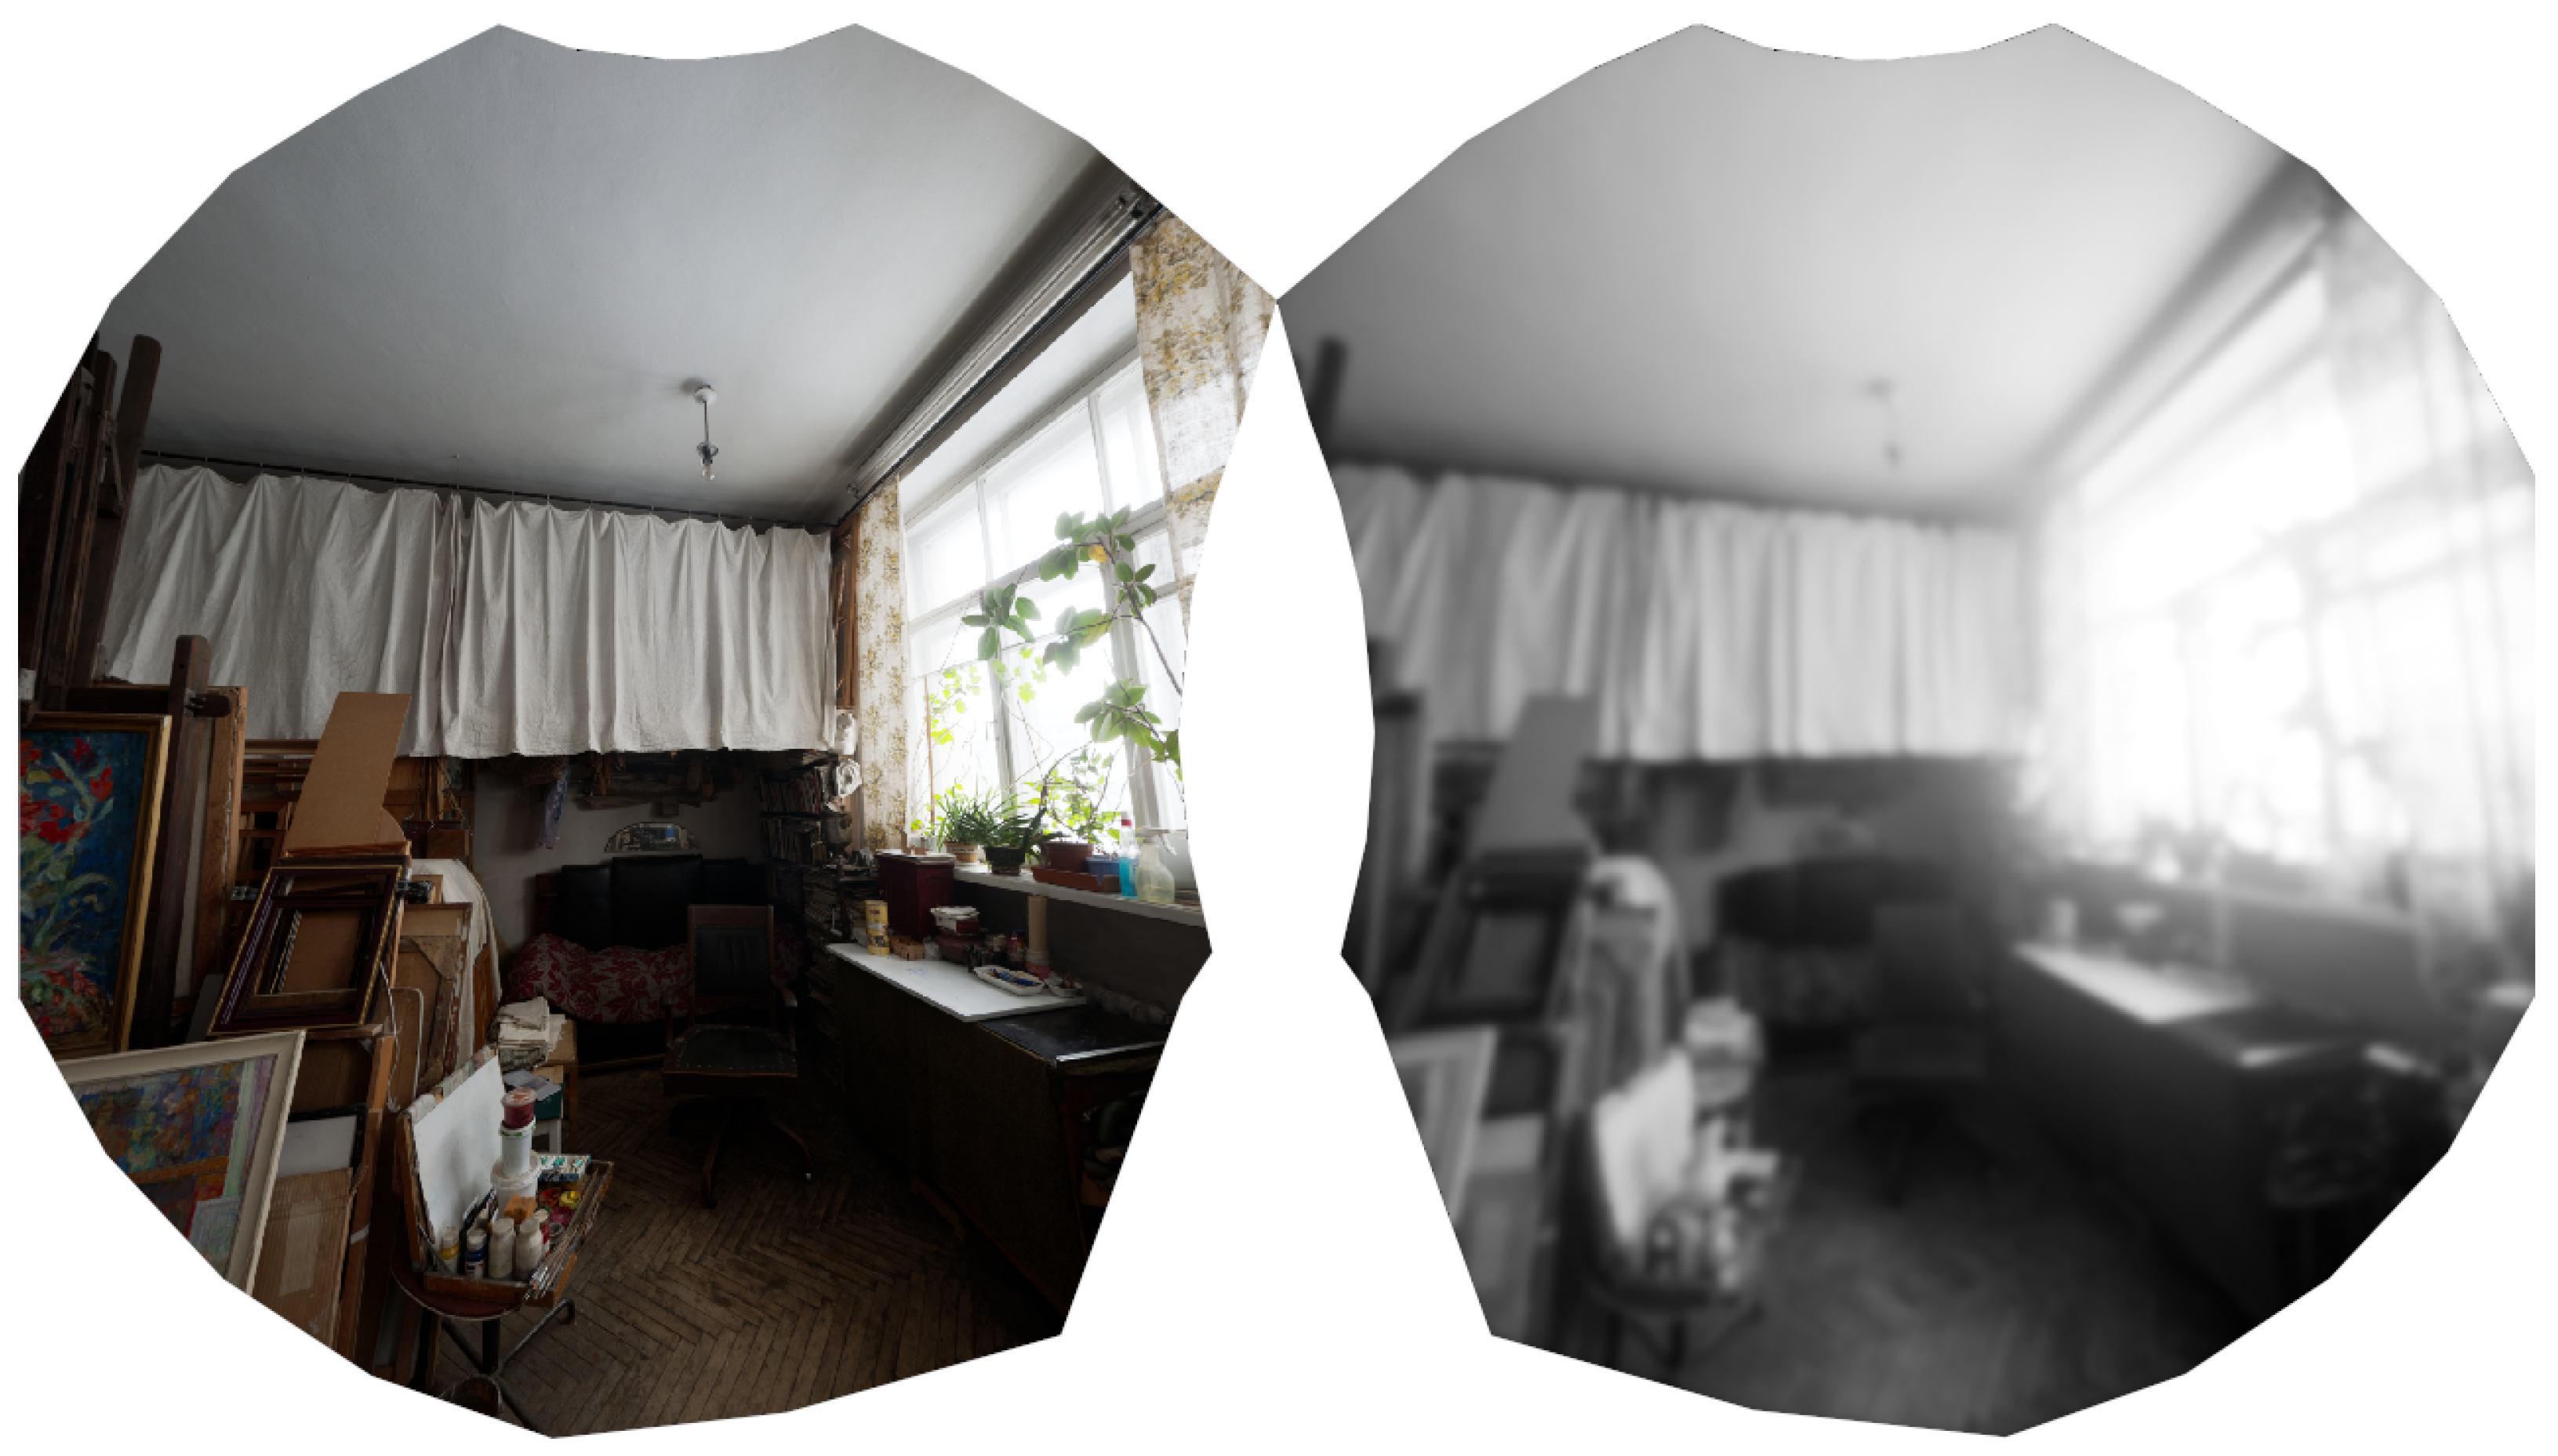
3.4. Achromatopsia
- Blurry vision;
- Achromatic vision; and
- Sensitivity to light.
- Desaturation;
- VA reduction; and
- Bloom or glare.
4. Expert Study
4.1. Participants
4.1.1. Study Protocol
4.1.2. Questionnaire
5. Results
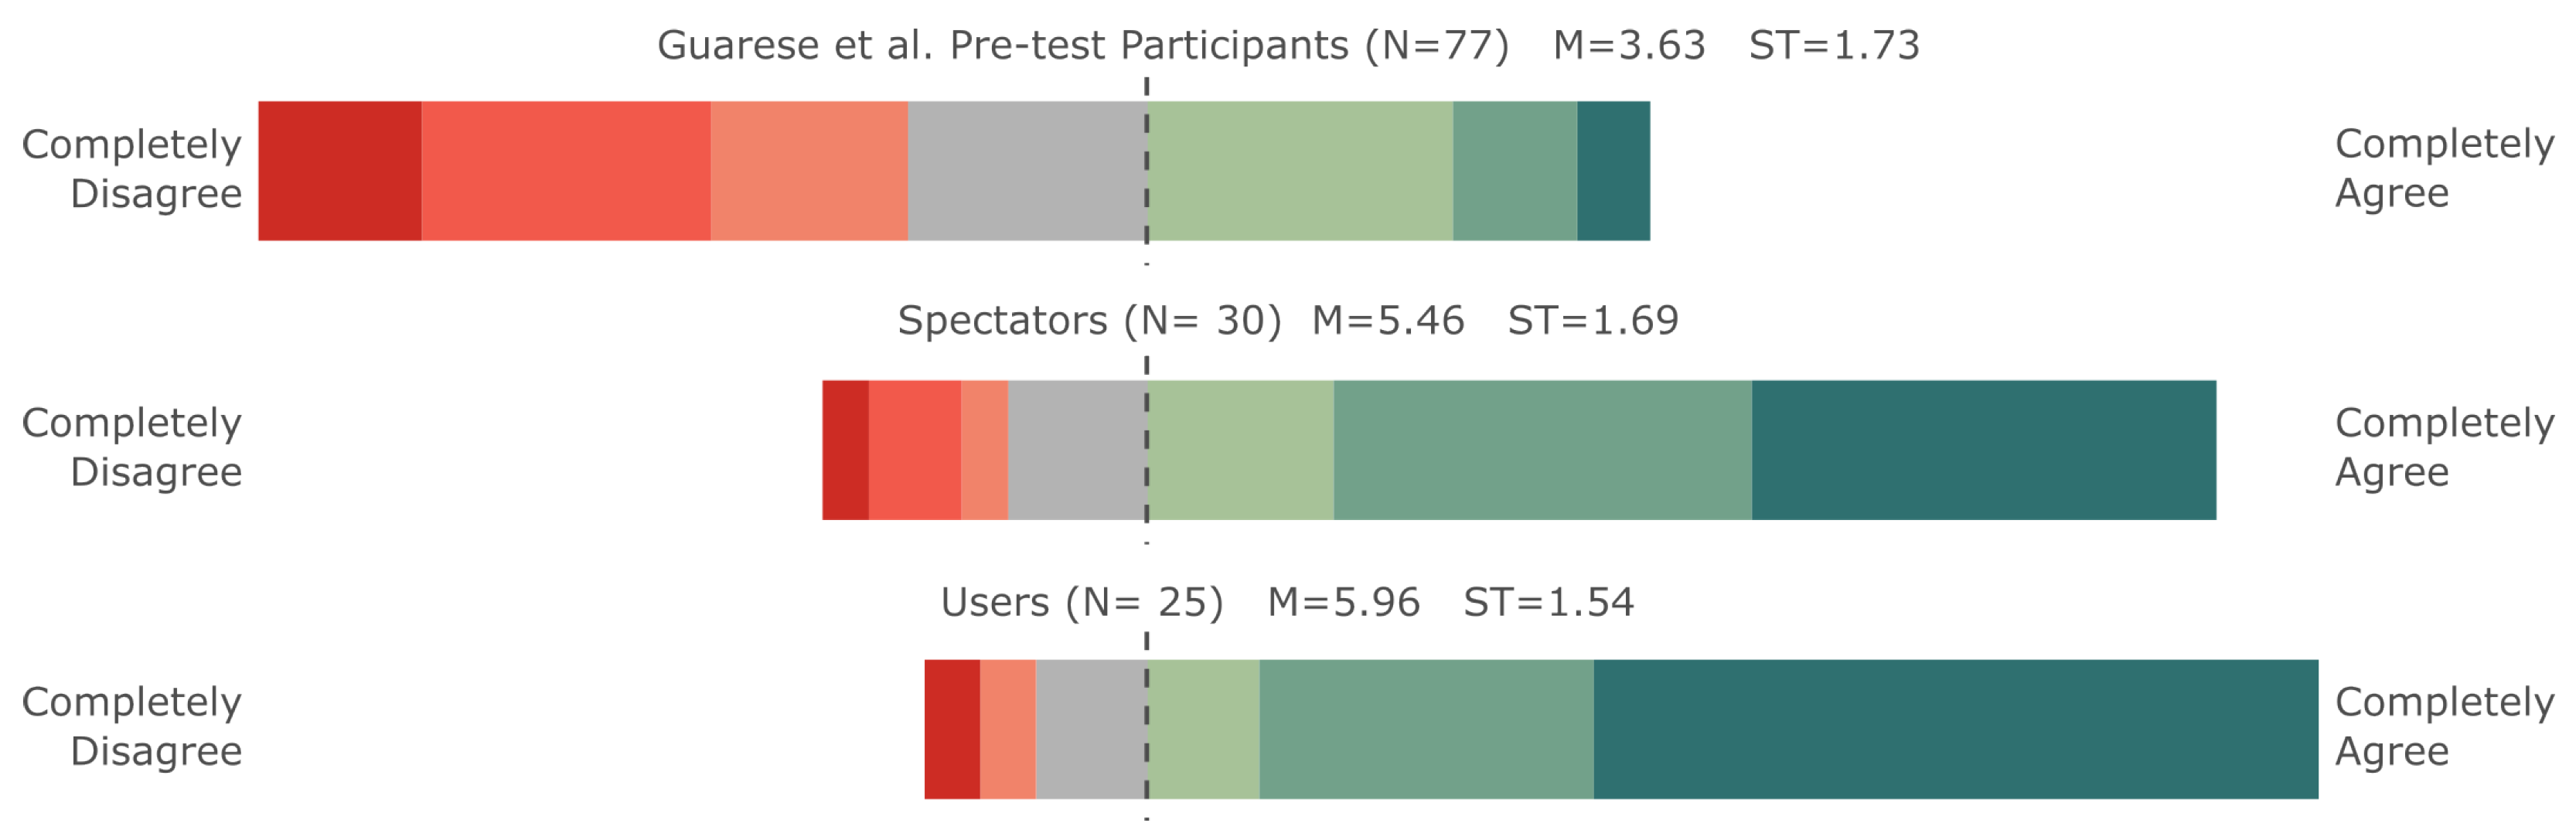
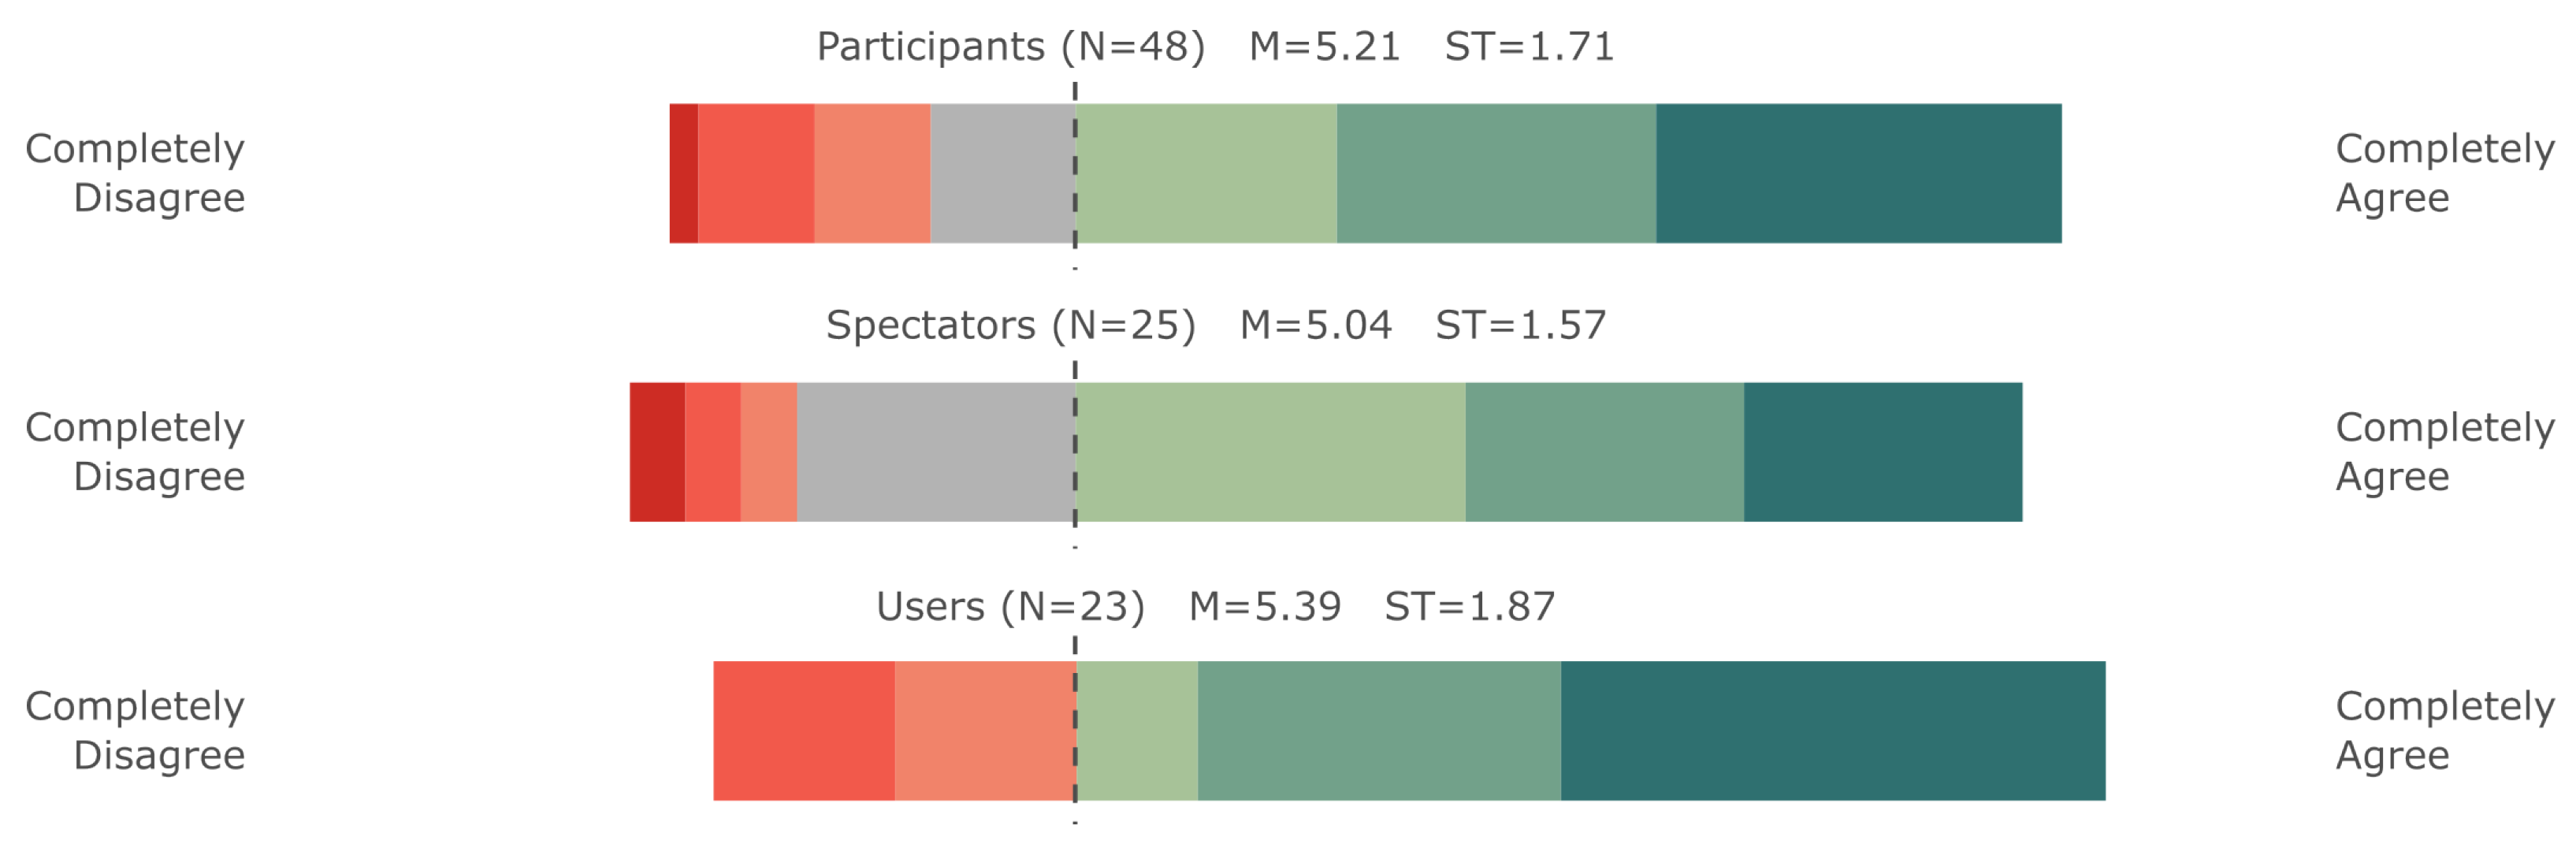
5.1. Evaluating the Effects of XREye on Sympathy and Empathy
Statistical Evaluation
5.2. Evaluating Educational Value
6. Discussion
6.1. Sympathy and Empathy
6.2. The Educational Value
6.3. Qualitative Feedback
Exploratory Post Hoc Analysis
6.4. Future Work
7. Conclusions
Author Contributions
Funding
Informed Consent Statement
Data Availability Statement
Acknowledgments
Conflicts of Interest
Abbreviations
| XR | Extended reality |
| VR | Virtual reality |
| AR | Augmented reality |
| HDR | High-dynamic range |
| HWD | Head-worn display |
| VA | Visual acuity |
| AMD | Age-related macular degeneration |
References
- World Health Organization. World Report on Vision; World Health Organization: Geneva, Switzerland, 2019. [Google Scholar]
- National Eye Institute (NEI). Eye Conditions and Diseases. Available online: https://www.nei.nih.gov/learn-about-eye-health/eye-conditions-and-diseases (accessed on 5 May 2023).
- Apple, L.; Apple, M.; Blasch, D. The artificial reduction of visual cues as a means of preparing training programs for low vision clients. Low Vis. Abstr. 1976, 2, 4–6. [Google Scholar]
- Bozeman, L.A.; Chang, C.H.S. Central field loss in object-system and low-vision simulation. Bull. Spec. Educ. 2006, 31, 207–220. [Google Scholar]
- Banks, D.; McCrindle, R. Visual eye disease simulator. In Proceedings of the 7th ICDVRAT with ArtAbilitation, Maia, Portugal, 8–10 September 2008. [Google Scholar]
- Jones, P.R.; Ometto, G. Degraded Reality: Using VR/AR to simulate visual impairments. In Proceedings of the 2018 IEEE Workshop on Aug. and Virt. Realities for Good, Reutlingen, Germany, 18 March 2018; pp. 1–4. [Google Scholar] [CrossRef] [Green Version]
- Aballéa, S.; Tsuchiya, A. Seeing for yourself: Feasibility study towards valuing visual impairment using simulation spectacles. Health Econ. 2007, 16, 537–543. [Google Scholar] [CrossRef] [PubMed]
- Krösl, K.; Bauer, D.; Schwärzler, M.; Fuchs, H.; Suter, G.; Wimmer, M. A VR-based user study on the effects of vision impairments on recognition distances of escape-route signs in buildings. Vis. Comput. 2018, 34, 911–923. [Google Scholar] [CrossRef]
- Krösl, K.; Elvezio, C.; Hürbe, M.; Karst, S.; Wimmer, M.; Feiner, S. ICthroughVR: Illuminating cataracts through virtual reality. In Proceedings of the 2019 IEEE Conference on Virtual Reality and 3D User Interfaces (VR), Osaka, Japan, 23–27 March 2019; IEEE: Piscataway Township, NJ, USA, 2019; pp. 655–663. [Google Scholar]
- Krösl, K.; Elvezio, C.; Hürbe, M.; Karst, S.; Feiner, S.; Wimmer, M. XREye: Simulating visual impairments in eye-tracked XR. In Proceedings of the 2020 IEEE Conference on Virtual Reality and 3D User Interfaces Abstracts and Workshops (VRW), Atlanta, GA, USA, 22–26 March 2020; IEEE: Piscataway Township, NJ, USA, 2020; pp. 830–831. [Google Scholar]
- Krösl, K.; Elvezio, C.; Luidolt, L.R.; Hürbe, M.; Karst, S.; Feiner, S.; Wimmer, M. CatARact: Simulating cataracts in augmented reality. In Proceedings of the 2020 IEEE International Symposium on Mixed and Augmented Reality (ISMAR), Porto de Galinhas, Brazil, 9–13 November 2020; IEEE: Piscataway Township, NJ, USA, 2020; pp. 682–693. [Google Scholar]
- Krösl, K. Simulating Cataracts in Virtual Reality. In Digital Anatomy: Applications of Virtual, Mixed and Augmented Reality; Springer: Berlin/Heidelberg, Germany, 2021; pp. 257–283. [Google Scholar]
- Krösl, K. Simulating Vision Impairments in Virtual and Augmented Reality. Ph.D. Thesis, TU Wien, Vienna, Austria, 2020. [Google Scholar]
- Werfel, F.; Wiche, R.; Feitsch, J.; Geiger, C. Empathizing audiovisual sense impairments: Interactive real-time illustration of diminished sense perception. In Proceedings of the 7th Augmented Human International Conference, Geneva, Switzerland, 25–27 February 2016; ACM: New York, NY, USA, 2016; p. 15. [Google Scholar]
- Choo, K.T.W.; Balan, R.K.; Wee, T.K.; Chauhan, J.; Misra, A.; Lee, Y. Empath-d: Empathetic design for accessibility. In Proceedings of the 18th International Workshop on Mobile Computing Systems and Applications, Sonoma, CA, USA, 21–22 February 2017; pp. 55–60. [Google Scholar]
- Kim, W.; Choo, K.T.W.; Lee, Y.; Misra, A.; Balan, R.K. Empath-d: Vr-based empathetic app design for accessibility. In Proceedings of the 16th Annual International Conference on Mobile Systems, Applications, and Services, Munich, Germany, 10–15 June 2018; pp. 123–135. [Google Scholar]
- Choo, K.T.W.; Balan, R.K.; Lee, Y. Examining Augmented Virtuality Impairment Simulation for Mobile App Accessibility Design. In Proceedings of the 2019 CHI Conference on Human Factors in Computing Systems, Glasgow, UK, 4–9 May 2019; pp. 1–11. [Google Scholar]
- Zimmerman Low Vision Simulation Kit. 2013. Available online: https://www.lowvisionsimulationkit.com (accessed on 30 October 2020).
- Zagar, M.; Baggarly, S. Low vision simulator goggles in pharmacy education. Am. J. Pharm. Educ. 2010, 74, 83. [Google Scholar] [CrossRef] [PubMed]
- Wood, J.; Chaparro, A.; Carberry, T.; Chu, B.S. Effect of simulated visual impairment on nighttime driving performance. Optom. Vis. Sci. 2010, 87, 379–386. [Google Scholar] [CrossRef] [PubMed] [Green Version]
- Hwang, A.D.; Tuccar-Burak, M.; Goldstein, R.; Peli, E. Impact of oncoming headlight glare with cataracts: A pilot study. Front. Psychol. 2018, 9, 164. [Google Scholar] [CrossRef] [PubMed]
- Meyer, G.W.; Greenberg, D.P. Color-defective vision and computer graphics displays. IEEE Comput. Graph. Appl. 1988, 8, 28–40. [Google Scholar] [CrossRef]
- Brettel, H.; Viénot, F.; Mollon, J.D. Computerized simulation of color appearance for dichromats. JOSA A 1997, 14, 2647–2655. [Google Scholar] [CrossRef] [PubMed] [Green Version]
- Viénot, F.; Brettel, H.; Mollon, J.D. Digital video colourmaps for checking the legibility of displays by dichromats. In Color Research & Application: Endorsed by Inter-Society Color Council, the Colour Group (Great Britain), Canadian Society for Color, Color Science Association of Japan, Dutch Society for the Study of Color, the Swedish Colour Centre Foundation, Colour Society of Australia, Centre Français de la Couleur; John Wiley & Sons, Inc.: Hoboken, NJ, USA, 1999; Volume 24, pp. 243–252. [Google Scholar]
- Simulate Your Vision For Family, Friends, and Eye Doctors. Available online: https://visionsimulations.com (accessed on 30 October 2019).
- Goodman-Deane, J.; Langdon, P.M.; Clarkson, P.J.; Caldwell, N.H.; Sarhan, A.M. Equipping designers by simulating the effects of visual and hearing impairments. In Proceedings of the 9th International ACM SIGACCESS Conference on Computers and Accessibility, Tempe, AZ, USA, 15–17 October 2007; pp. 241–242. [Google Scholar]
- Aaron Leventhal. NoCoffee—Vision Simulator for Chrome. 2013. Available online: https://accessgarage.wordpress.com/ (accessed on 30 October 2019).
- Lewis, J.; Brown, D.; Cranton, W.; Mason, R. Simulating visual impairments using the Unreal Engine 3 game engine. In Proceedings of the Serious Games and Applications for Health, Braga, Portugal, 16–18 November 2011; IEEE: Piscataway Township, NJ, USA, 2011; pp. 1–8. [Google Scholar]
- Lewis, J.; Shires, L.; Brown, D. Development of a visual impairment simulator using the Microsoft XNA Framework. In Proceedings of the 9th International Conference on Disability, Virtual Reality & Associated Technologie, Laval, France, 10–12 September 2012. [Google Scholar]
- Väyrynen, J.; Colley, A.; Häkkilä, J. Head mounted display design tool for simulating visual disabilities. In Proceedings of the 15th International Conference on Mobile and Ubiquitous Multimedia, Rovaniemi, Finland, 12–15 December 2016; ACM: New York, NY, USA, 2016; pp. 69–73. [Google Scholar]
- Zavlanou, C.; Lanitis, A. Virtual Reality-Based Simulation of Age-Related Visual Deficiencies: Implementation and Evaluation in the Design Process. In Proceedings of the International Conference on Human Interaction and Emerging Technologies, Nice, France, 22–24 August 2019; Springer: Berlin/Heidelberg, Germany, 2019; pp. 262–267. [Google Scholar]
- Jones, P.R.; Somoskeöy, T.; Chow-Wing-Bom, H.; Crabb, D.P. Seeing other perspectives: Evaluating the use of virtual and augmented reality to simulate visual impairments (OpenVisSim). Npj Digit. Med. 2020, 3, 1–9. [Google Scholar] [CrossRef] [Green Version]
- Zhang, Q.; Barbareschi, G.; Huang, Y.; Li, J.; Pai, Y.S.; Ward, J.; Kunze, K. Seeing our Blind Spots: Smart Glasses-based Simulation to Increase Design Students’ Awareness of Visual Impairment. In Proceedings of the 35th Annual ACM Symposium on User Interface Software and Technology, Bend, OR, USA, 29 October– 2 November 2022; pp. 1–14. [Google Scholar]
- Novartis Pharma, A.G. ViaOpta Simulator. 2018. Available online: https://www.viaopta-apps.com/ViaOpta-Simulator.html (accessed on 19 September 2019).
- Braille Institute of America. VisionSim by Braille Institute. Available online: https://apps.apple.com/us/app/visionsim-by-braille-institute/id525114829 (accessed on 30 October 2019).
- Paananen, V.; Kiarostami, M.S.; Lee, L.H.; Braud, T.; Hosio, S. From Digital Media to Empathic Reality: A Systematic Review of Empathy Research in Extended Reality Environments. arXiv 2022, arXiv:2203.01375. [Google Scholar]
- Escalas, J.E.; Stern, B.B. Sympathy and Empathy: Emotional Responses to Advertising Dramas. J. Consum. Res. 2003, 566. [Google Scholar] [CrossRef]
- Bevan, C.; Green, D.P.; Farmer, H.; Rose, M.; Cater, K.; Fraser, D.S.; Brown, H. Behind the Curtain of the “Ultimate Empathy Machine": On the Composition of Virtual Reality Nonfiction Experiences; Association for Computing Machinery: New York, NY, USA, 2019. [Google Scholar] [CrossRef] [Green Version]
- Campbell, D.; Lugger, S.; Sigler, G.S.; Turkelson, C. Increasing awareness, sensitivity, and empathy for Alzheimer’s dementia patients using simulation. Nurse Educ. Today 2021, 98, 104764. [Google Scholar] [CrossRef] [PubMed]
- Adefila, A.; Graham, S.; Clouder, L.; Bluteau, P.; Ball, S. myShoes—The future of experiential dementia training? J. Ment. Health Train. Educ. Pract. 2016, 11, 91–101. [Google Scholar] [CrossRef]
- Oh, S.Y.; Bailenson, J.; Weisz, E.; Zaki, J. Virtually old: Embodied perspective taking and the reduction of ageism under threat. Comput. Hum. Behav. 2016, 60, 398–410. [Google Scholar] [CrossRef]
- Guarese, R.; Pretty, E.; Fayek, H.; Zambetta, F.; van Schyndel, R. Evoking empathy with visually impaired people through an augmented reality embodiment experience. In Proceedings of the 2023 IEEE Conference Virtual Reality and 3D User Interfaces (VR), Shanghai, China, 25–29 March 2023. [Google Scholar]
- VRVis Research Center. HILITE. Available online: http://www.vrvis.at/projects/hilite (accessed on 10 May 2019).
- National Eye Institute (NEI). Refractive Errors. Available online: https://www.nei.nih.gov/learn-about-eye-health/eye-conditions-and-diseases/refractive-errors (accessed on 18 December 2019).
- National Eye Institute (NEI). Corneal Conditions. Available online: https://www.nei.nih.gov/learn-about-eye-health/eye-conditions-and-diseases/corneal-conditions (accessed on 4 May 2019).
- Shoemaker, J.A. Vision Problems in the US: Prevalence of Adult Vision Impairment and Age-Related Eye Disease in America; National Eye Institute: Bethesda, MD, USA, 2002. [Google Scholar]
- Chung, S.T.; Legge, G.E. Comparing the shape of contrast sensitivity functions for normal and low vision. Investig. Ophthalmol. Vis. Sci. 2016, 57, 198–207. [Google Scholar] [CrossRef] [PubMed]
- Thévin, L.; Machulla, T. Three Common Misconceptions about Visual Impairments. In Proceedings of the 2020 IEEE Conference on Virtual Reality and 3D User Interfaces Abstracts and Workshops (VRW), Atlanta, GA, USA, 22–26 March 2020. [Google Scholar]
- Austria, S. Teaching Staff. 2022. Available online: https://www.statistik.at/en/statistics/population-and-society/education/teaching-staff (accessed on 10 May 2019).


| Item # | Topic | Questionnaire Item |
|---|---|---|
| 8 | Sympathy (ARS-2) | |
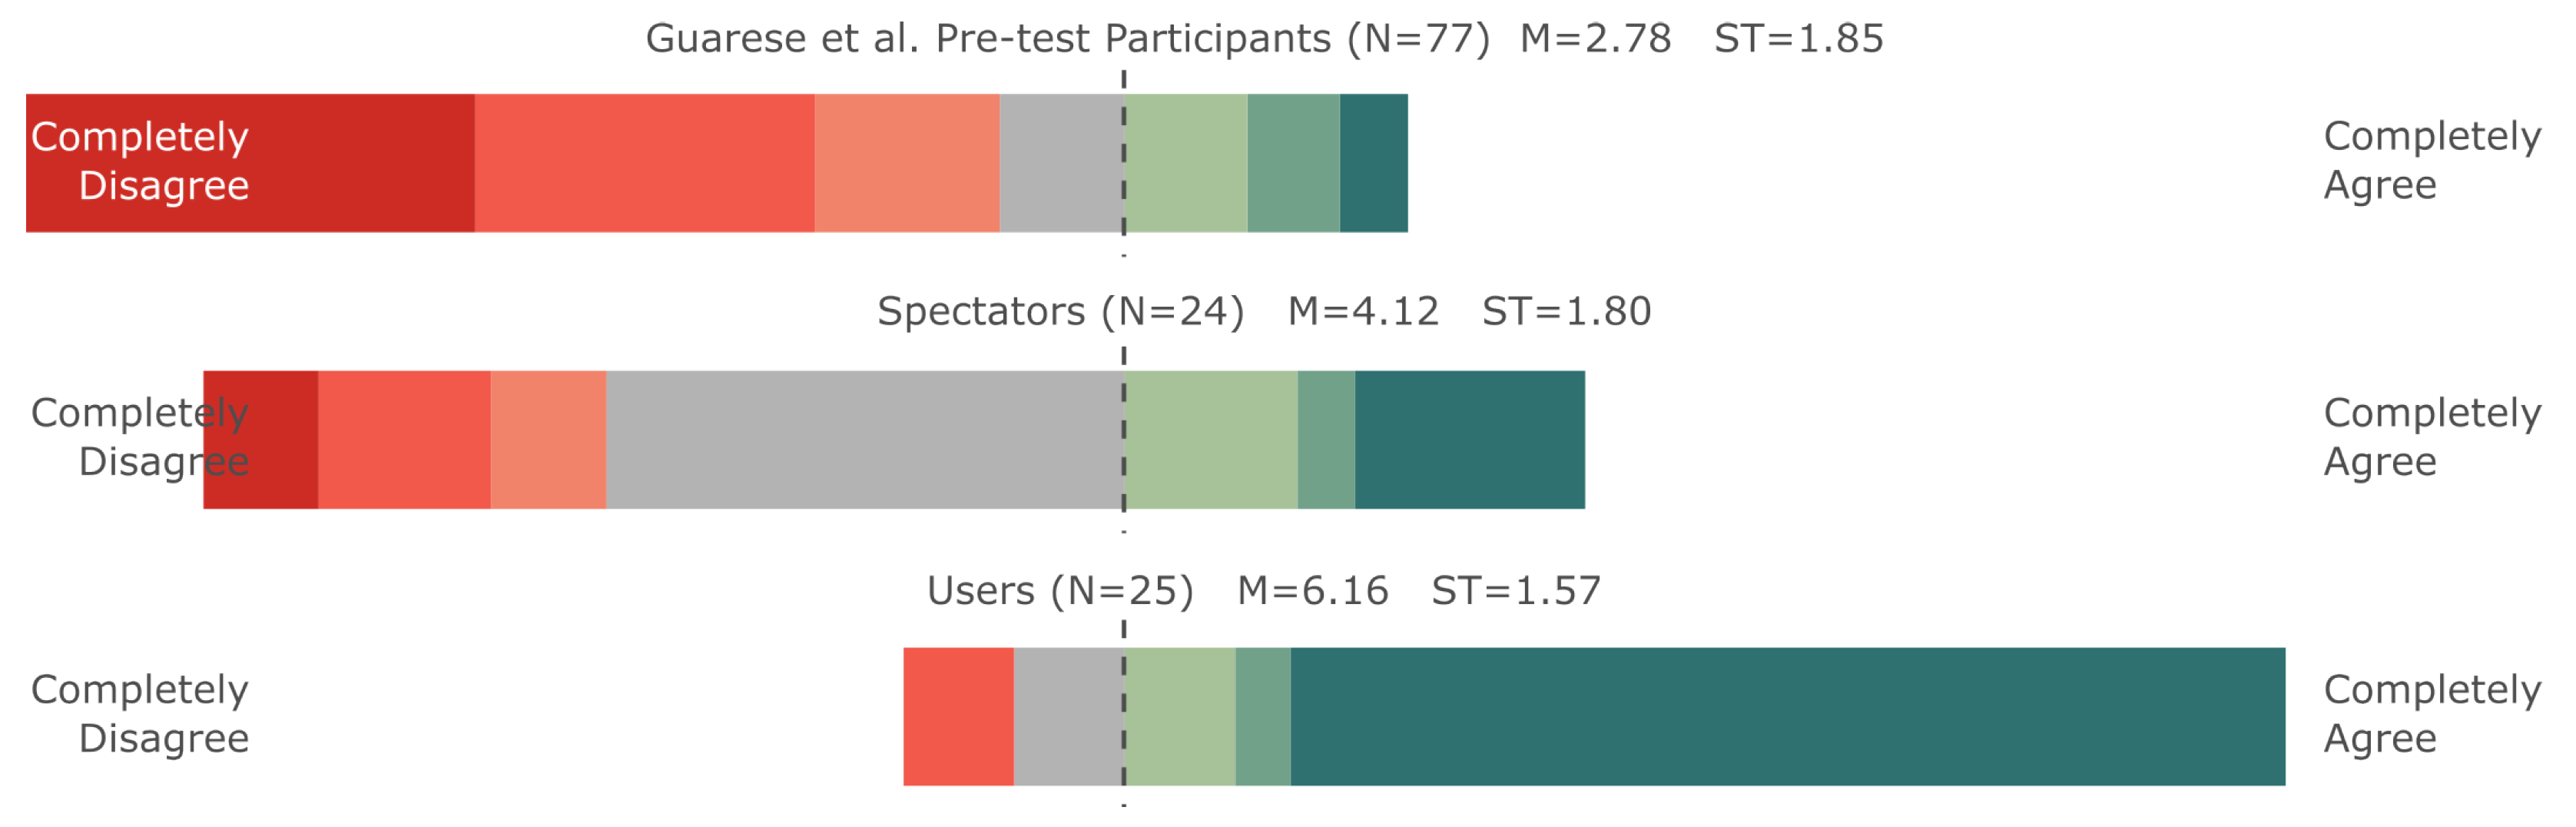
| Expert Study (Adapted ARS III) | Based on what was happening in the experiment, I understood what is bothering blind and visually impaired people in their day-to-day tasks. | |
| Guarese et al. [42] pre-test (Adapted ARS II) | Based on what was happening in my experiences, I understood what was bothering blind and visually impaired people in their day-to-day tasks. | |
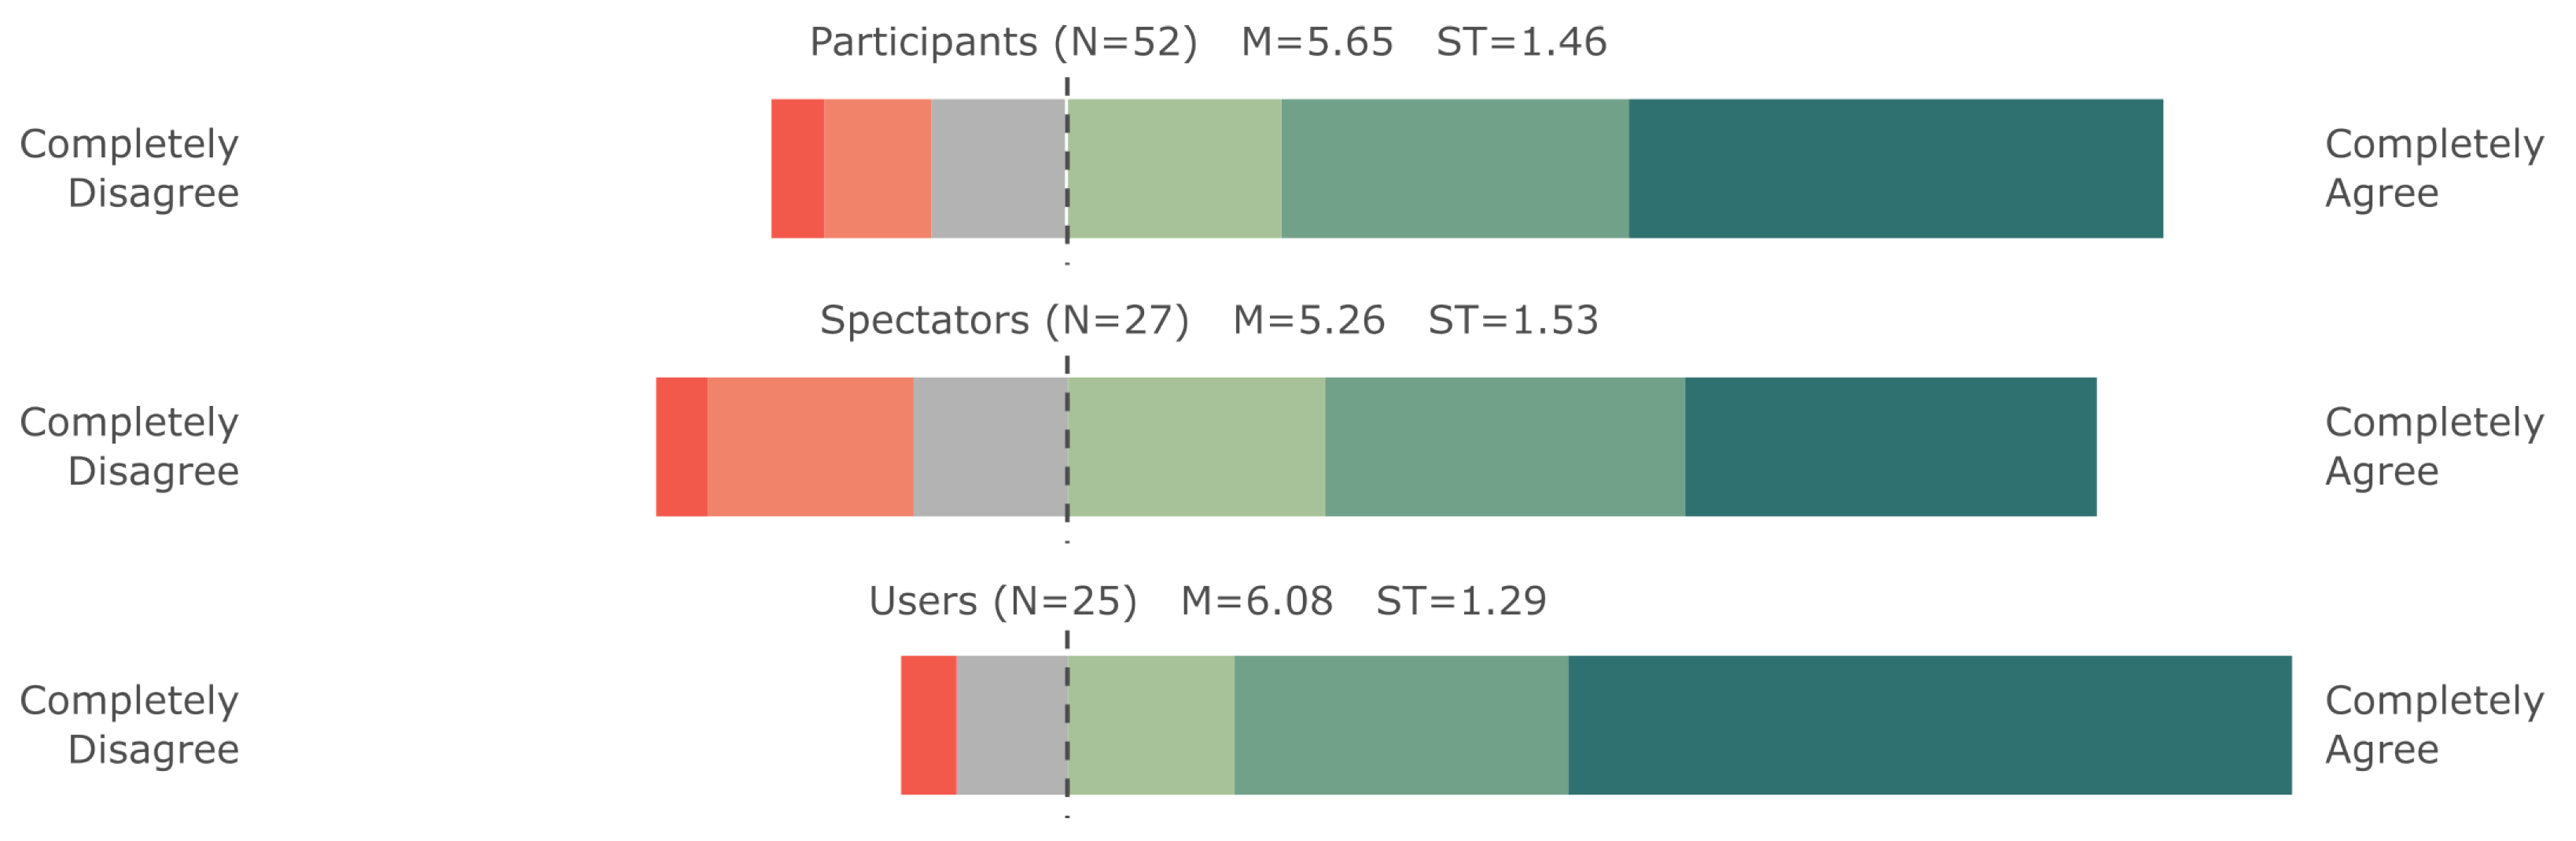
| 9 | Sympathy (ARS-5) | |
| Expert Study (Adapted ARS III) | I was able to recognize the problems that blind and visually impaired people have in their day-to-day tasks. | |
| Guarese et al. [42] pre-test (Adapted ARS II) | I was able to recognize the problems that blind and visually impaired people had in my experiences with them. | |
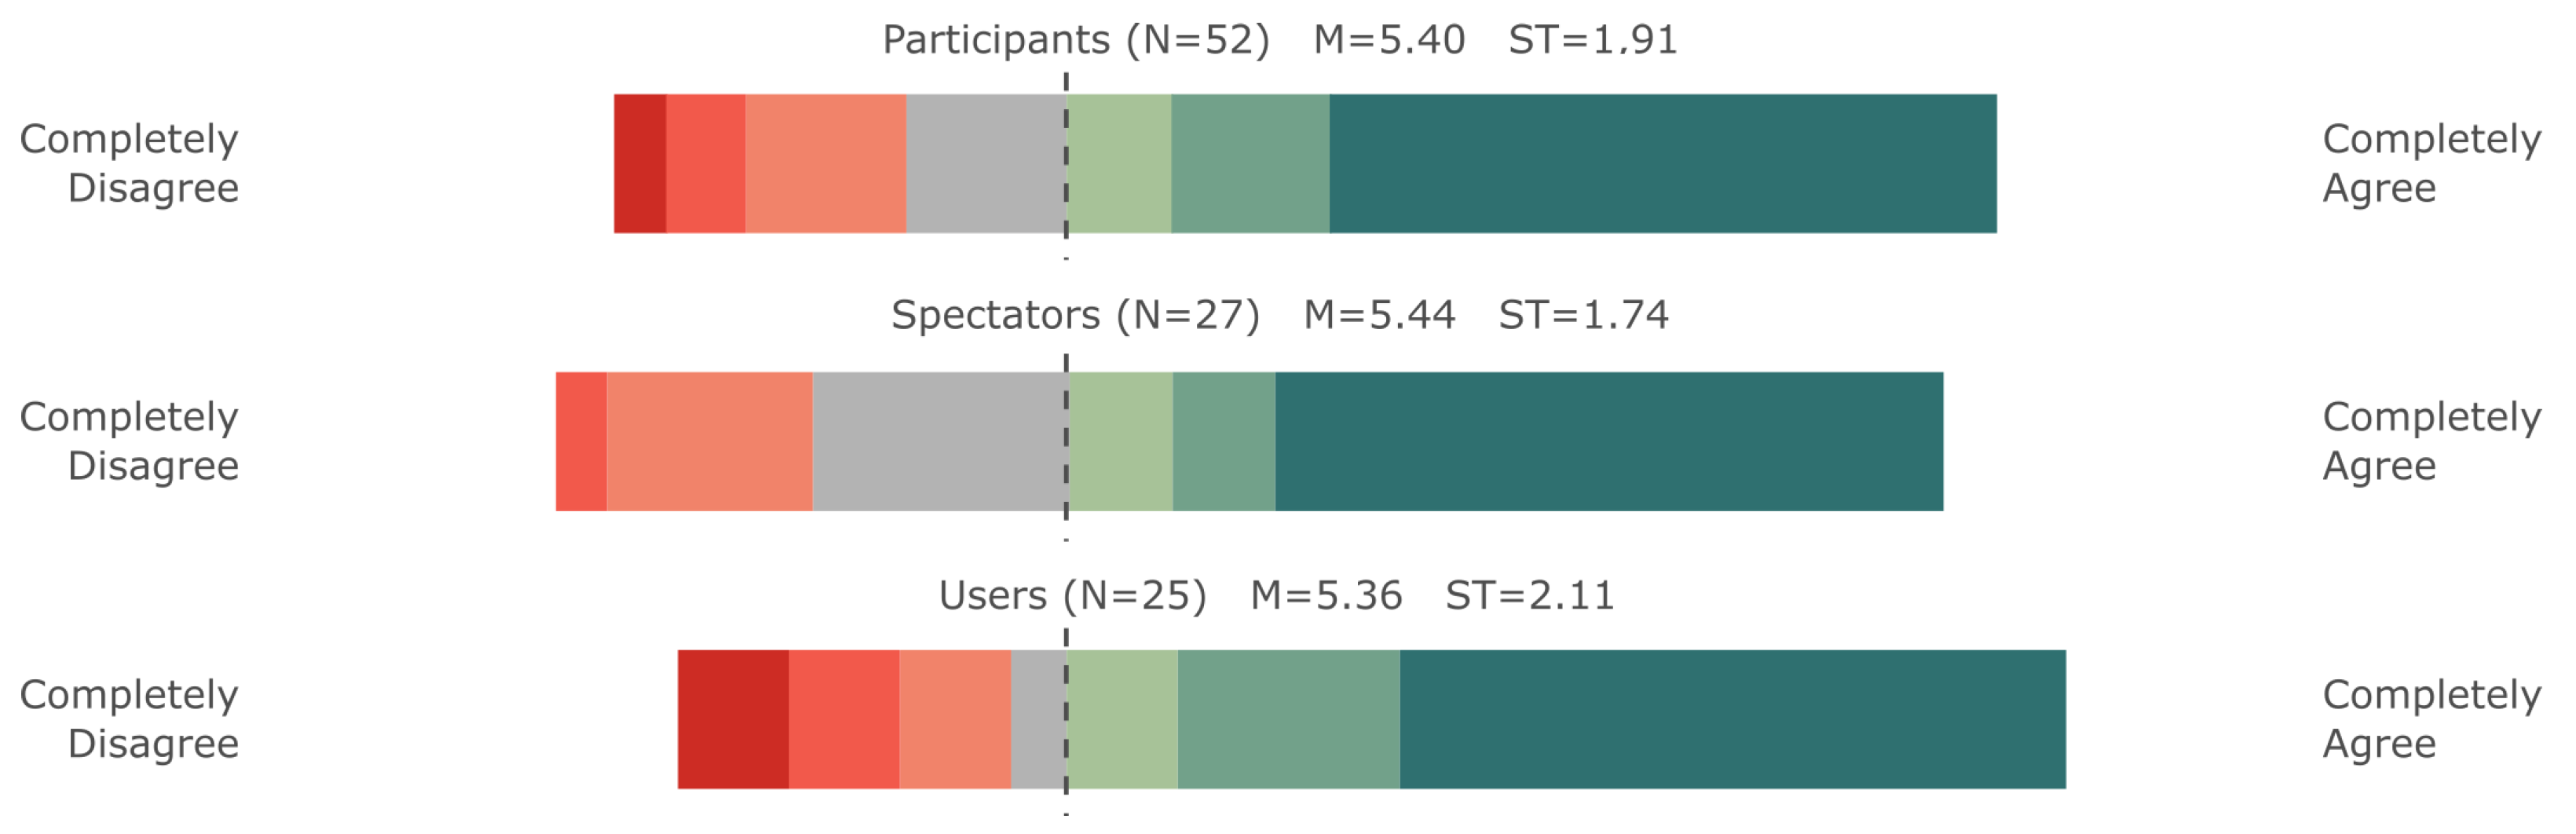
| 10 | Empathy (ARE-3) | |
| Expert Study (Adapted ARS III) | While experiencing the simulation, I felt as though I had a visual impairment. | |
| Guarese et al. [42] pre-test (Adapted ARS II) | While perceiving the day-to-day tasks of blind and visually impaired people, I felt as though those events were happening to me. | |
| New Expert Study Items | ||
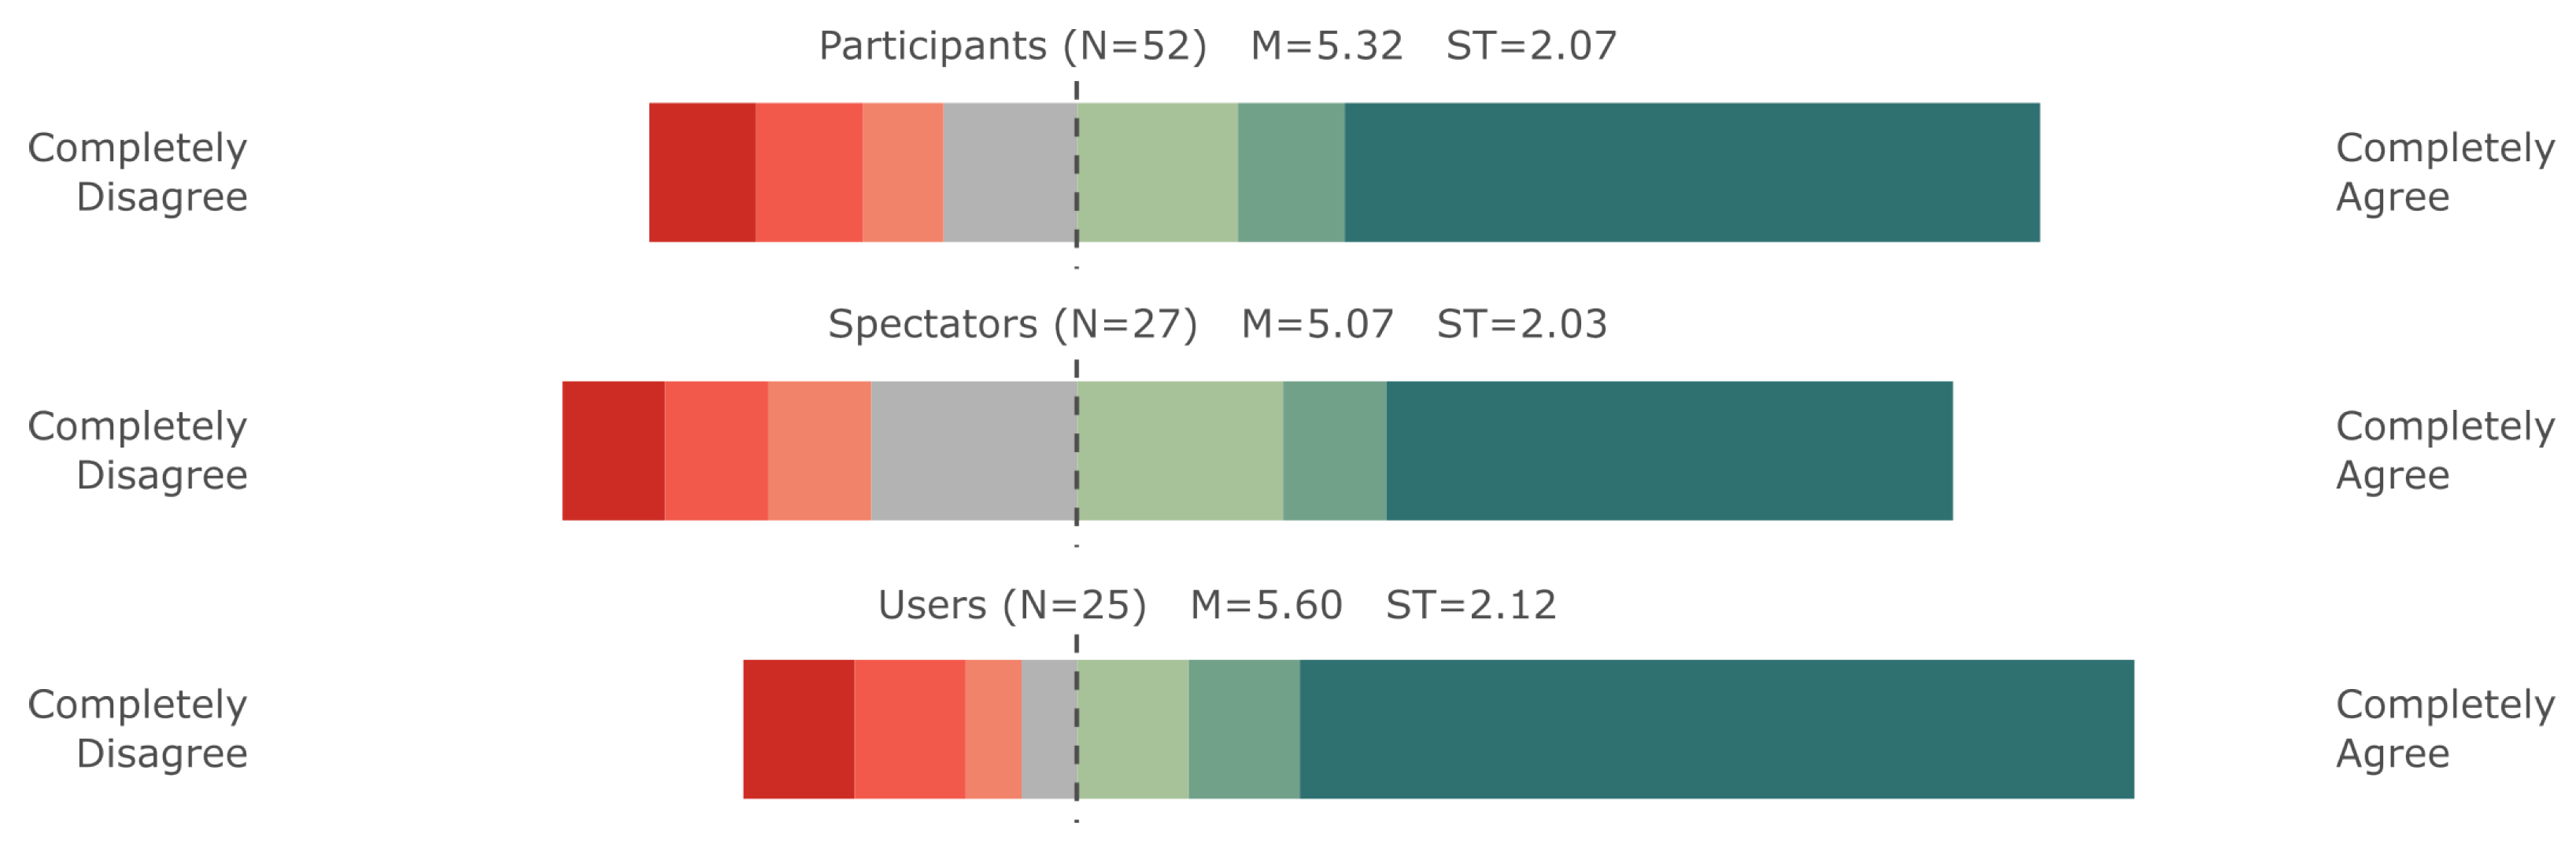
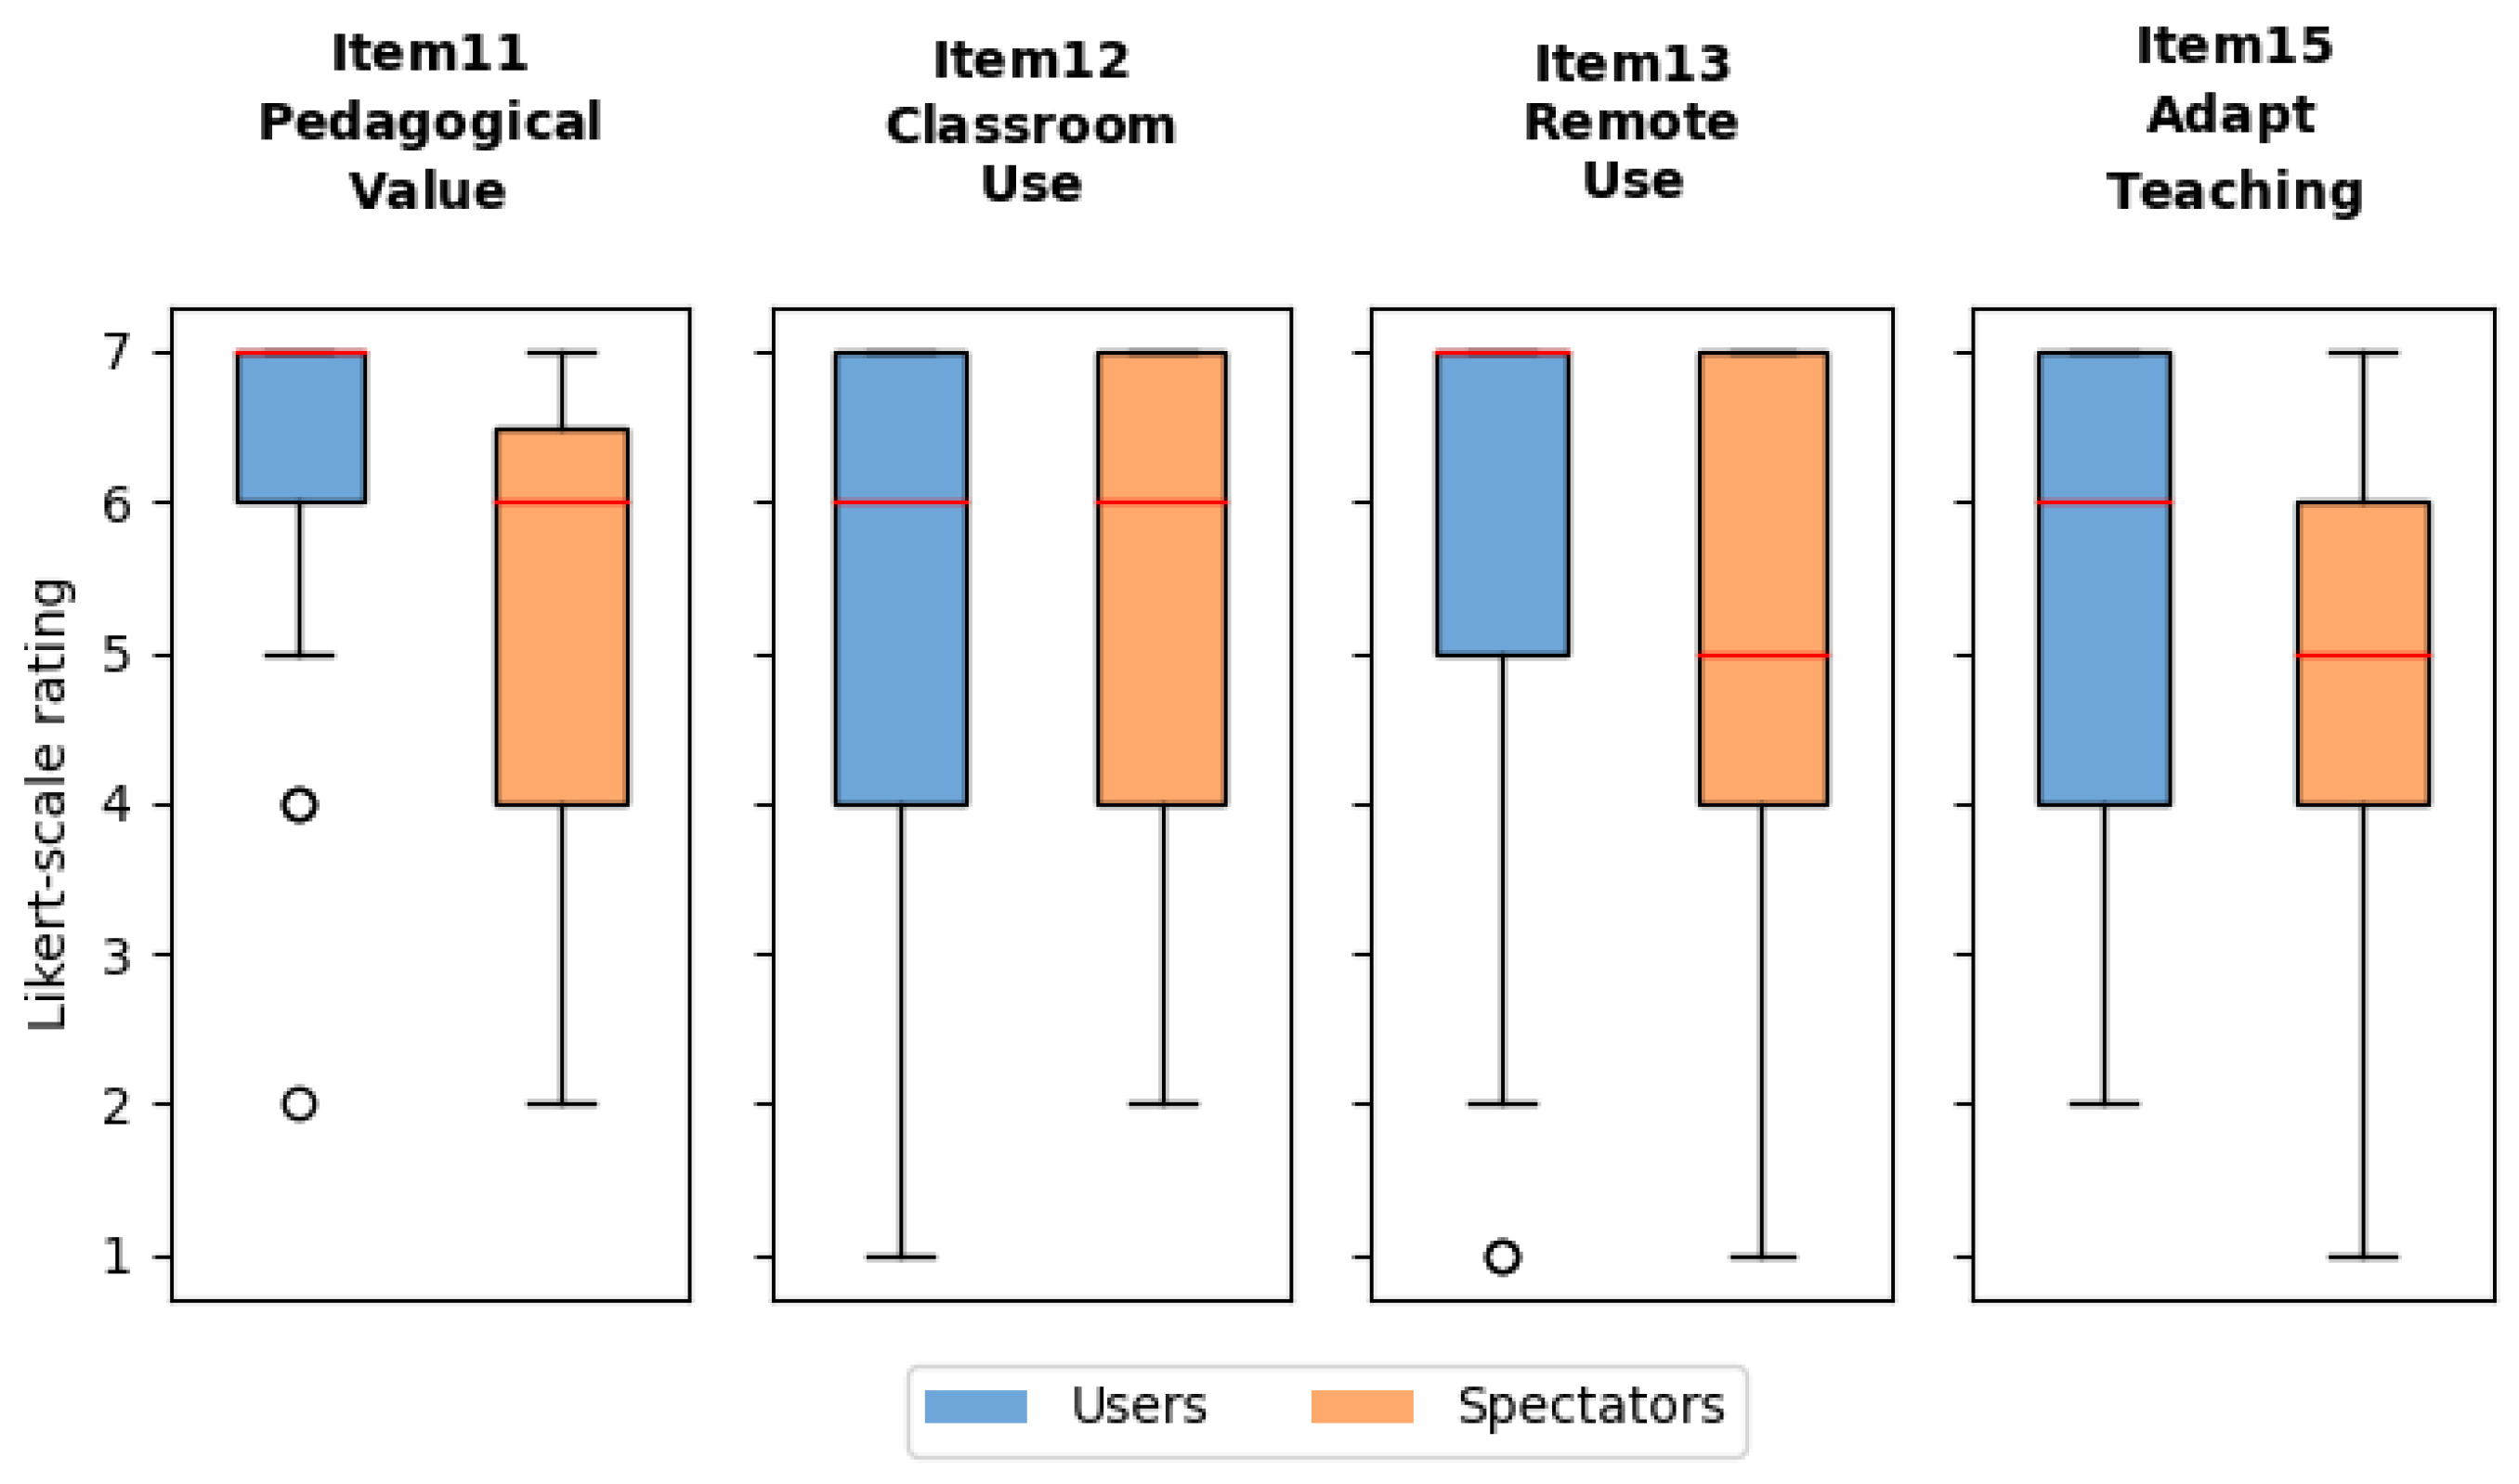
| 11 | Pedagogical Value | I think that there is pedagogical value in the XREye simulation and similar technologies. |
| 12 | Classroom Use | I would use XREye or similar technologies to help teach students in a classroom setting about the lived experiences of individuals with vision impairments. |
| 13 | Remote Use | I would use XREye or similar technologies to help teach students in a remote-learning setting (students using it at home) about the lived experiences of individuals with vision impairments. |
| 15 | Adapt Teaching | After the experiment, in the case of having a blind or visually impaired student, would you consider adapting your teaching methods or using assistive technologies? |
| Item # | Users vs. Guarese et al. Pre-Test PCPs | Effect Size | Power | Spectators vs. Guarese et al. Pre-Test PCPs | Effect Size | Power |
|---|---|---|---|---|---|---|
| 8 (Sympathy) (ARS-2) | p < 0.001 | 0.690 | 0.999 | p < 0.001 | 0.560 | 0.992 |
| 9 (Sympathy) (ARS-5) | p < 0.001 | 0.465 | 0.878 | 0.001 | 0.400 | 0.824 |
| 10 (Empathy) (ARE-3) | p < 0.001 | 0.801 | 1.000 | 0.001 | 0.416 | 0.811 |
| Item # | Users vs. Spectators | Effect Size | Power |
|---|---|---|---|
| 8 (Sympathy (ARS-2)) | 0.180 | 0.203 | 0.095 |
| 9 (Sympathy (ARS-5)) | 0.537 | 0.094 | 0.021 |
| 10 (Empathy (ARE-3)) | p < 0.001 | 0.602 | 0.923 |
| Item # | Users vs. Spectators | Effect Size | Power |
|---|---|---|---|
| 11 (Pedagogical Value) | 0.034 | 0.332 | 0.301 |
| 12 (Classroom Use) | 0.961 | 0.009 | |
| 13 (Remote Use) | 0.243 | 0.178 | 0.069 |
| 15 (Adapt Teaching) | 0.250 | 0.191 | 0.072 |
Disclaimer/Publisher’s Note: The statements, opinions and data contained in all publications are solely those of the individual author(s) and contributor(s) and not of MDPI and/or the editor(s). MDPI and/or the editor(s) disclaim responsibility for any injury to people or property resulting from any ideas, methods, instructions or products referred to in the content. |
© 2023 by the authors. Licensee MDPI, Basel, Switzerland. This article is an open access article distributed under the terms and conditions of the Creative Commons Attribution (CC BY) license (https://creativecommons.org/licenses/by/4.0/).
Share and Cite
Krösl, K.; Medeiros, M.L.; Huber, M.; Feiner, S.; Elvezio, C. Exploring the Educational Value and Impact of Vision-Impairment Simulations on Sympathy and Empathy with XREye. Multimodal Technol. Interact. 2023, 7, 70. https://doi.org/10.3390/mti7070070
Krösl K, Medeiros ML, Huber M, Feiner S, Elvezio C. Exploring the Educational Value and Impact of Vision-Impairment Simulations on Sympathy and Empathy with XREye. Multimodal Technologies and Interaction. 2023; 7(7):70. https://doi.org/10.3390/mti7070070
Chicago/Turabian StyleKrösl, Katharina, Marina Lima Medeiros, Marlene Huber, Steven Feiner, and Carmine Elvezio. 2023. "Exploring the Educational Value and Impact of Vision-Impairment Simulations on Sympathy and Empathy with XREye" Multimodal Technologies and Interaction 7, no. 7: 70. https://doi.org/10.3390/mti7070070
APA StyleKrösl, K., Medeiros, M. L., Huber, M., Feiner, S., & Elvezio, C. (2023). Exploring the Educational Value and Impact of Vision-Impairment Simulations on Sympathy and Empathy with XREye. Multimodal Technologies and Interaction, 7(7), 70. https://doi.org/10.3390/mti7070070