1. Introduction
1.1. Combustor–Turbine Interaction
The high temperatures at the turbine inlet of a gas turbine require efficient cooling techniques. The use of cooling air is intended to be as small as possible as it constitutes a penalty to the engine efficiency. In addition, legislative requirements to lower NO
emissions in aero engines have favored the application of lean-premixed combustors (Lazik et al. [
1]).
This paradigm change challenges turbine design and requires new design guidelines. One can observe a fuller radial temperature profile and increased hot-streaks due to less dilution air and, in addition, residual swirl at the turbine inlet with influence on the stagnation line, the trajectory of coolant flows and the cycle efficiency (Schmid [
2]). The stronger interaction poses restrictions to the combustor design: to maintain the predictability of the turbine flow, swirl levels in the combustor are limited, even though higher swirl levels might be desired for the optimization of the combustion process, according to Turrell et al. [
3]. An upstream effect of the turbine on the combustor flow was identified by Klapdor [
4] up to one axial chord length ahead of the vane leading edge (LE).
Schmid et al. [
5] numerically examined a high-pressure turbine (HPT) stage with aerodynamic boundary conditions of an aero-engine lean combustor and detected increasing heat transfer levels and decreasing stage efficiency compared to a low-turbulent, axial inflow. Stator pressure loss increases by 70% for swirling inflow. The influence of turbulence intensity is modeled separately. The results show a significant impact on performance, almost equal to superimposed swirl. Qureshi et al. [
6] observed a great impact of swirl orientation and clocking on endwall heat transfer: both a significant increase or a slight decrease in Nusselt numbers can occur. They determine local divergence and convergence of wall streamlines and as a consequence, an accumulation or dissipation of boundary layer fluid to be responsible.
Recent experimental work in the field of combustor–turbine interaction is also described by Jacobi et al. [
7]. They investigate the outflow from a can combustor into a vane row. A turbulence intensity of 35% and a movement of the stagnation line is observed. Furthermore, an additional vortex system develops due to the low pressure in the swirler core with leading edge clocking. This triggers the formation of a secondary flow-like feature, which is attenuated and intensified by the residual swirl of the combustor. The vortex travels, depending on the swirl orientation, towards the casing or the hub and interacts with the passage vortex to form a loss core. This aspect is observed by Turrell et al. [
3] as well.
1.2. Tracing of Turbomachinery Flows
Cha et al. [
8] have investigated the migration of the burner core using a passive CO
tracer, which was fed through the fuel injectors into the combustor. They determined a pronounced concentration profile at the turbine inlet, resembling a hot streak location. Butler et al. [
9] studied the propagation of a CO
-streak through a vane row. Accordingly, the hot streak is distorted, but its spatial extent does not increase significantly across the vane row. Flow tracing has been applied by Schrewe [
10], Feiereisen et al. [
11] and Lefrancois et al. [
12] to study the propagation of purge flow in low pressure turbines. The results of the last-mentioned working group have been identified to be transferable to engine conditions (Boutet-Blais et al. [
13]).
The density ratio of coolant injection investigations for scaled experimental conditions is a parameter of influence that allows for an independent variation of blowing ratio
M and momentum ratio
I, as described by Thole et al. [
14]. Aside from using a temperature difference, the density variation can be achieved with a foreign gas as a coolant. Jones [
15] presented an overview of goals and aspects that needed to be taken into account for film cooling experiments.
Thomas and Povey [
16] presented a
scalar tracking method for the efficient numerical investigation and optimization of the film cooling effectiveness of single cooling holes.
1.3. Scope and Aim of the Investigation
Flow tracing of the test rig’s coolant flows is part of a comprehensive investigation of the aerothermal effects of combustor–turbine interaction at TU Darmstadt (Schmid et al. [
2,
5], Krichbaum et al. [
17], Werschnik et al. [
18,
19,
20], Hilgert et al. [
21], Wilhelm et al. [
22]). The method is dedicated to improving the general understanding of the baseline flow field and to assess losses and flow features to coolant flows. Moreover, it allows to isolate the effect of the swirler on the losses from the coolant flow in the complex vane outlet flow field.
2. Experimental Setup
2.1. Test Rig Description—The Large Scale Turbine Rig
The Large Scale Turbine Rig (LSTR) was configured as a scaled-up 1.5-stage low Mach number turbine and in a closed-loop configuration. The test rig features a nozzle guide vane (NGV) row with 24 vanes. The rotor row has 36 squealer-tip blades. An outlet guide vane row with 34 vanes directs the flow towards the exhaust casing. The main flow was provided by a radial compressor which delivers a mass flow of about 9.5 kg/s. The secondary air flow was provided by an accessory radial compressor which supplied a mass flow of up to 0.9 kg/s at a pressure ratio of 1.7.
The mass flows and the rotor speed were adjusted according to the ambient conditions to maintain the Reynolds number of the system constant at , based on NGV exit velocity and chord length. The associated change of the Mach number is low and can be neglected because the flow to be treated is incompressible. The temperature of secondary and main flow could be adjusted independently using two water driven heat exchangers.
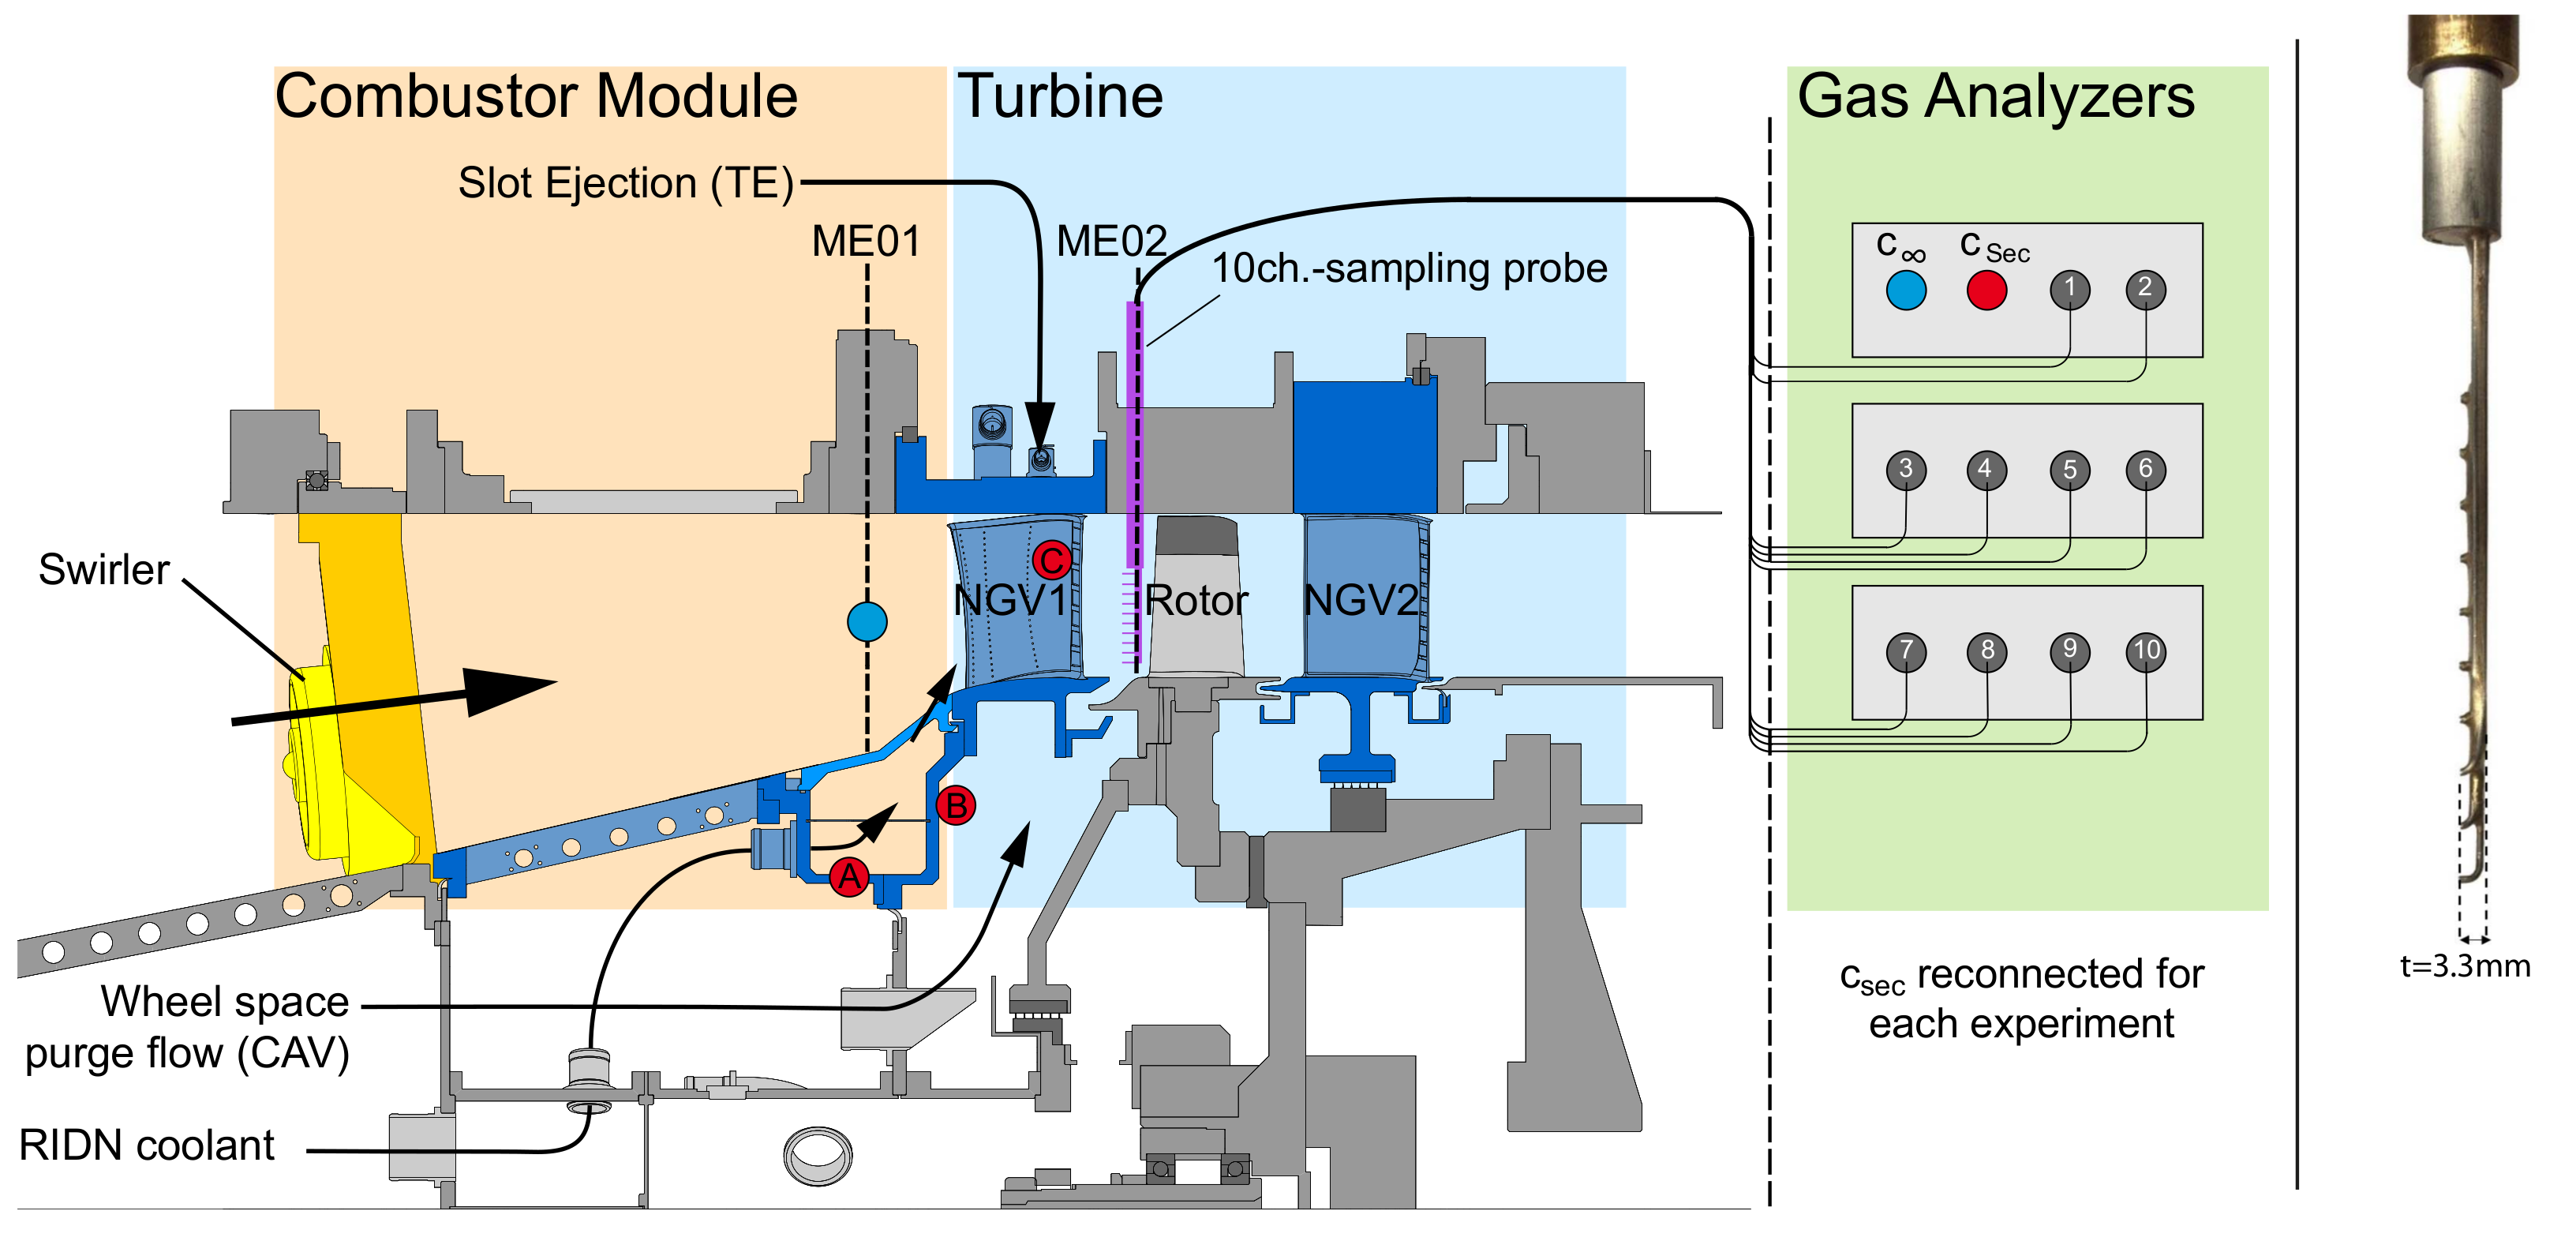
2.2. Coolant Flows
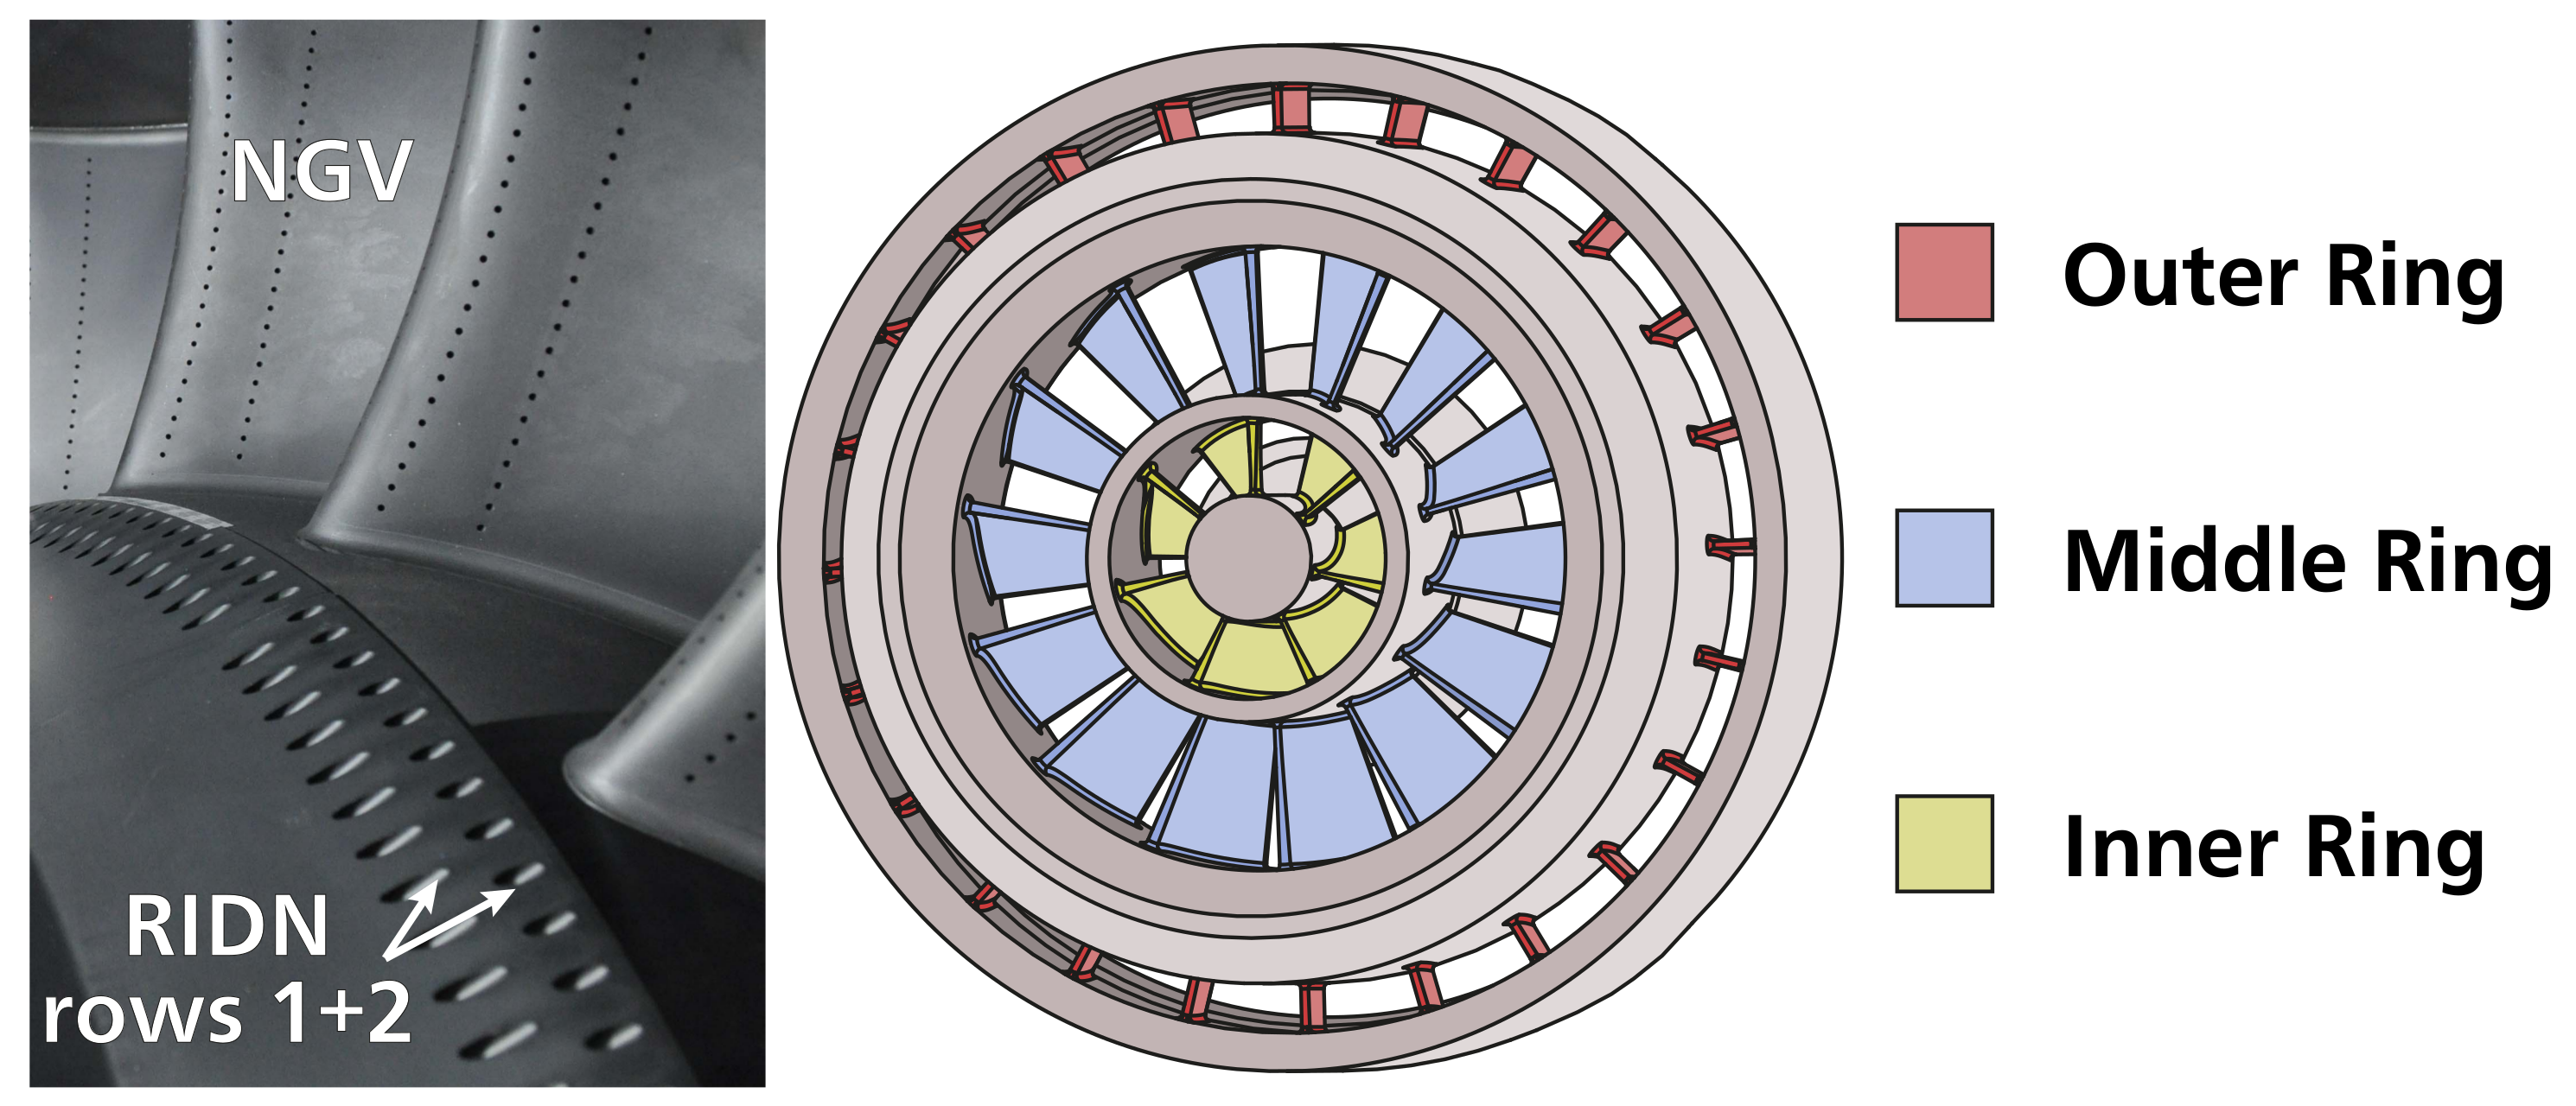
The rig featured a hub side coolant injection (denoted “RIDN”), consisting of a staggered double row of cylindrical holes. A view into the test section is shown in
Figure 1. There were 19 (upstream row) and 20 (downstream row) holes per swirler passage with an axial and circumferential hole spacing of 3D and an L/D ratio of 6.5. The holes were inclined by 60
to the axial direction and 20
to the hub wall. They were supplied by four 90
plenum chambers, which each contained two meshes for homogenization.
The mass flow distribution to the holes has been measured with a pitot probe to have a variation of less than 2%. The vanes were film cooled and contained a coolant ejection through seven slots at the trailing edge, denoted as “TE”-flow. Moreover, purge flow has been supplied to the NGV-rotor wheel space cavity flow (abbreviated CAV in the following). All coolant flows were held constant during the experiments, except for the Rear Inner Discharge Nozzle (RIDN) flow, for which three different mass flow ratios (MFRs) have been studied (only MFR 3 for swirl, cf.
Table 1 with Equation (
1)). For MFR 0, no mass flow was supplied to the holes and they were left uncovered.
was held constant throughout the measurements: The main mass flow
was reduced by the value of
. In the experiment, the density ratio between coolant and main flow is not matched to engine conditions. To ensure similarity, the blowing rate is set to comparable values instead. This means in consequence, that for all injection cases, the momentum ratio is increased with respect to the engine.
2.3. Large Scale Turbine Rig Swirler
The LSTR swirler was modeled based on the
Engine-3-E-swirler (Klinger et al. [
23]) and consists of three concentric rings with curved blades (
Figure 1). Two inner rings with high airflow turning angles of 50
created a strong swirl in the counter-clockwise direction with respect to the main flow direction. This high swirl forms a recirculation zone, which is typical for a lean combustor: in the real engine, it enhances the mixing of fuel and air and helps to maintain flame stability. The flow is then accelerated by the combustion. In the test rig, this acceleration is modeled by a tapered main annulus. The whirl angles are attenuated to realistic value in the turbine inlet plane whereby the characteristic pressure distortion is maintained. The outer blade ring is used to adjust the swirl to the desired level at the turbine inlet with a low turning angle of
, i.e., counter-rotating to the two inner rings. With the correlation of Gupta et al. [
24] for flat vane swirlers, an initial swirl number of 0.6 is calculated. Twelve swirlers were placed within the measurement section and two clocking positions have been studied: leading edge clocking (SWL) and passage clocking (SWP).
2.4. Five Hole Probe Measurements
Five hole probe (5HP) data have been acquired in measurement planes ME01 and ME02 (cf.
Figure 2), i.e., upstream and downstream of the NGV row. ME01 was located 0.9 C
upstream of the leading edge (LE) and ME02 one chord length downstream of the trailing edge (TE) in the flow direction. The cobra-type probe has a head diameter of 1.6 mm and was calibrated in a free stream wind tunnel. The probe was traversed along the radial direction at a fixed angular position on the rig. The circumferential resolution was realized by a simultaneous angular adjustment of three casing rings, which carry swirler modules and both vane rows in steps of 1
. The radial and angular traverses result in a measurement grid of 672 data points for the baseline configuration, whereas 1302 data points were acquired for the configurations SWP/SWL to cover the required two vane passages. Data have been recorded for 10 s after a settling time of 2 s with a sampling rate of 10 Hz. A Pressure Systems NetScanner 9116 (provided by DMT Druckmesstechnik GmbH, Bad Bentheim, Germany) with a measurement range of 5 psi has been used. The total pressure distribution in ME01 (SWL/SWP) and ME02 (AX, SWP/SWL) is assessed with Equation (
2). It corrects for the change in test cell ambient pressure
during each measurement day. The coolant inlet energy is not considered in this equation at the inlet of the row, because the measurement plane is located upstream of the injection. Therefore, only settings using identical coolant mass flow are compared in the following.
2.5. Flow Tracing
To study the propagation of coolant flows in the turbine, gas concentration measurements have been used. CO was added to one of the coolant flows (RIDN, TE, CAV) at a time and contours of this particular coolant flow could be determined. Other than that, the operating point remained constant. A secondary air exhaust was used to exchange a part of the air flow to the environment. In this way, a steady CO concentration was achieved in both main and secondary flow. Using three Emerson XStream XEGP (Emerson Electric Company, St. Louis, MO, USA) four-channel gas analyzers, this concentration could be measured. The reference concentration in both main () and the secondary flow () was measured. An increased CO concentration at a level of about 18,000 ppm was achieved in the secondary flow. The main flow CO was kept at a constant level of about 2000 ppm. The change in air density due to CO is negligible.
To study the propagation of coolant flows within the main annulus, a sampling probe with 10 channels was used in ME02 (
Figure 2). The probe was turned into the average main flow direction, deduced from the 5HP measurement. An isokinetic sampling rate was desired but could not be achieved by the extraction pump in the sampling system. Thus, the maximum possible flow rate was used for all channels. Calculating the mixing effectiveness
with Equation (
3), the distribution of the coolant flow could be quantified as well:
The concentration
is measured at mid span in ME01 through a pitot probe and
is measured in the coolant flow of interest in each measurement: for RIDN-seeding, it was monitored in the lower coolant supply plenum (red marker, labeled “A” in
Figure 2); for TE-seeding, in the aft plenum chamber of the NGV (marker “C”); and in the stationary wall of the NGV-rotor wheel space for CAV-seeding (marker “B”). Additionally, pressure taps on the vane LE have been used to sample the RIDN coolant concentration, allowing to trace the propagation of the coolant in the form of the film cooling effectiveness
with the definition identical to
.
3. Numerical Simulations
The baseline configuration with axial inflow and MFR 3 has also been investigated in a numerical simulation making use of a scalar tracking method. The aim was to compare the numerical predictions with the experiments and to validate the model of RIDN flow features.
3.1. Scalar Tracking Method
The scalar tracking method introduced by Thomas and Povey [
16] is used for the simulations in this work. It enables an analysis of the contributions of individual cooling holes to the overall film cooling effectiveness. A passive scalar, which does not influence the flow, is associated with each cooling hole to be investigated. Each scalar is then tracked in the mixed-out flow to determine the individual concentrations of coolant in the main flow. The steady-state transport of a scalar
is described by
The scalar diffusivity
is set to the effective turbulent thermal diffusivity
in order to make the scalars diffuse according to the thermal field. The two parts describe the laminar and turbulent thermal diffusivity, respectively. The boundary condition for
on all inlets
j is set to
so that on each inlet only one corresponding scalar is active. It can be shown that an individual scalar is equal to the ratio of cooling mass flow
from hole
i to the mixed mass flow
. The sum of all scalars is therefore equal to the ratio of the entire coolant mass flow to the mixed-out mass flow
. Using the continuity and energy equation over the complete cooled system, it can be shown that the sum of all scalars equals the adiabatic cooling effectiveness
The derivation of this equation requires an incompressible flow with . These conditions can be assumed with very small errors in isothermal, low Mach number rigs such as the LSTR. Note that at a sufficiently large distance to the wall, diffusion is determined mainly by turbulence. In this region, the diffusion of the scalars into the main flow is thus equal to that of CO if the turbulent Lewis number is . Additionally, the density difference of the seeded coolant flow is negligible because the fraction of CO is very small. Therefore, the diffusion of the scalars in the simulation can be compared to the diffusion of the coolant air in the experiments.
In order to use this method in a Computational Fluid Dynamics (CFD) simulation, an inlet to the domain must be assigned to each cooling hole. Therefore, cavities adjacent to the cooling holes need to be removed in the numerical model. Inlet boundary conditions for the flow from these holes are drawn from a simulation where the coolant plenum is included, i.e., at least two simulations are necessary for each configuration. Comparison of endwall film cooling effectiveness and of pitch-wise averaged flow variables between the simulations with and without cavity showed very small differences. On an evaluation plane in the vane passage, maxima showed a difference of 0.0068% for total pressure and 0.0064% for total temperature. The biggest differences of velocity could be found on an evaluation plane right after the RIDN injection where the differences in velocity maxima amounted to 4.4%. The effect of removing the coolant plenum on the flow solution is therefore negligible.
In theory, there should be no difference between and . In practice, differences can occur when scalar and energy equation convergence differ. In the simulations for this work, the scalar equations showed a better convergence than the energy equation. The qualitative differences observed in the distributions of the two quantities were negligible, i.e., and showed the same patterns on the examined surfaces. The differences in peak values of and on the hub surface amounted to 5.3%.
3.2. Numerical Setup
As mentioned in the previous paragraph, the application of the scalar tracking method requires running two successive simulations, one including the RIDN-plenum connected to the cooling holes and a second one without this plenum using flow profiles from the first simulation as inlet conditions at the cut-off locations. In the setup for this work, only the NGV1 domain from ME01 to ME02 was modeled (cf.
Figure 2) in order to reduce computational time. The first simulation included the RIDN plenum as well as the vane inner coolant cavities which were removed in the second simulation. Due to requirements on the installation of the endwall plates, the geometry of the RIDN holes is not periodic for all vanes but every two vanes a cooling hole is missing. This has been included in the numerical model. The geometry was meshed using the unstructured grid generator Centaur 11.0 by Centaursoft [
25] that creates a surface mesh using triangles, a prism mesh in the boundary layer and a tetrahedral mesh in the rest of the domain. Information on the numerical grid as reported by the CFX solver is reported in
Table 2. The influence of the discretization error was investigated in a grid study by refining the tetrahedra of the NGV1 mesh resulting in four meshes with 13 M, 23 M, 32 M and 52 M cells. Turbulent quantities at ME02 were influenced most by the mesh resolution of the tetrahedra. As a compromise between computation time and accuracy, the second finest grid from this study was selected for a further study of surface mesh resolution. The triangles on the surface of this mesh were then locally refined in the areas of interest on the vane surface with high gradients and coarsened in other areas, resulting in the final 33 M cell mesh.
The steady and incompressible simulations were run with the commercial CFD solver ANSYS CFX [
26]. Inlet conditions to the flow domain were axial inflow, and constant total pressure and temperature according to the measurement conditions. Turbulence intensity and length scale were specified based on hot wire measurements obtained during a different experimental campaign of this setup (Wilhelm et al. [
22]). At the outlet, a mass flow was specified. Inlet conditions for the cooling holes were the static temperature, turbulent kinetic energy and dissipation rate, as well as the three velocity components extracted from the previous simulation. The walls were set to no-slip and adiabatic and the NGV row was modeled periodically. Turbulence was modeled using the k-
-SST turbulence model by Menter [
27] assuming a fully turbulent flow. All conservation equations were discretized using the “High Resolution” discretization scheme in CFX and the simulations were run for 1000 iterations. Effective averaged discretization orders for the energy and momentum equations were above 0.9 and for the turbulent quantities above 0.7.
4. Results—Baseline Case of Axial Inflow to the Turbine
Experimental results are presented for the baseline configuration with axial inflow first to characterize the specifics of the NGV flow field in the test rig. The results are also compared to numerical predictions. In this configuration, the swirlers have been removed from the annulus. The propagation of the coolant flows is analyzed and losses in the NGV are correlated. The axial inflow has a turbulence intensity of about 1%, measured with a hot-wire-probe and the inflow boundary layer thickness is measured with a pitot probe to 2.5
/D (Werschnik et al. [
20]).
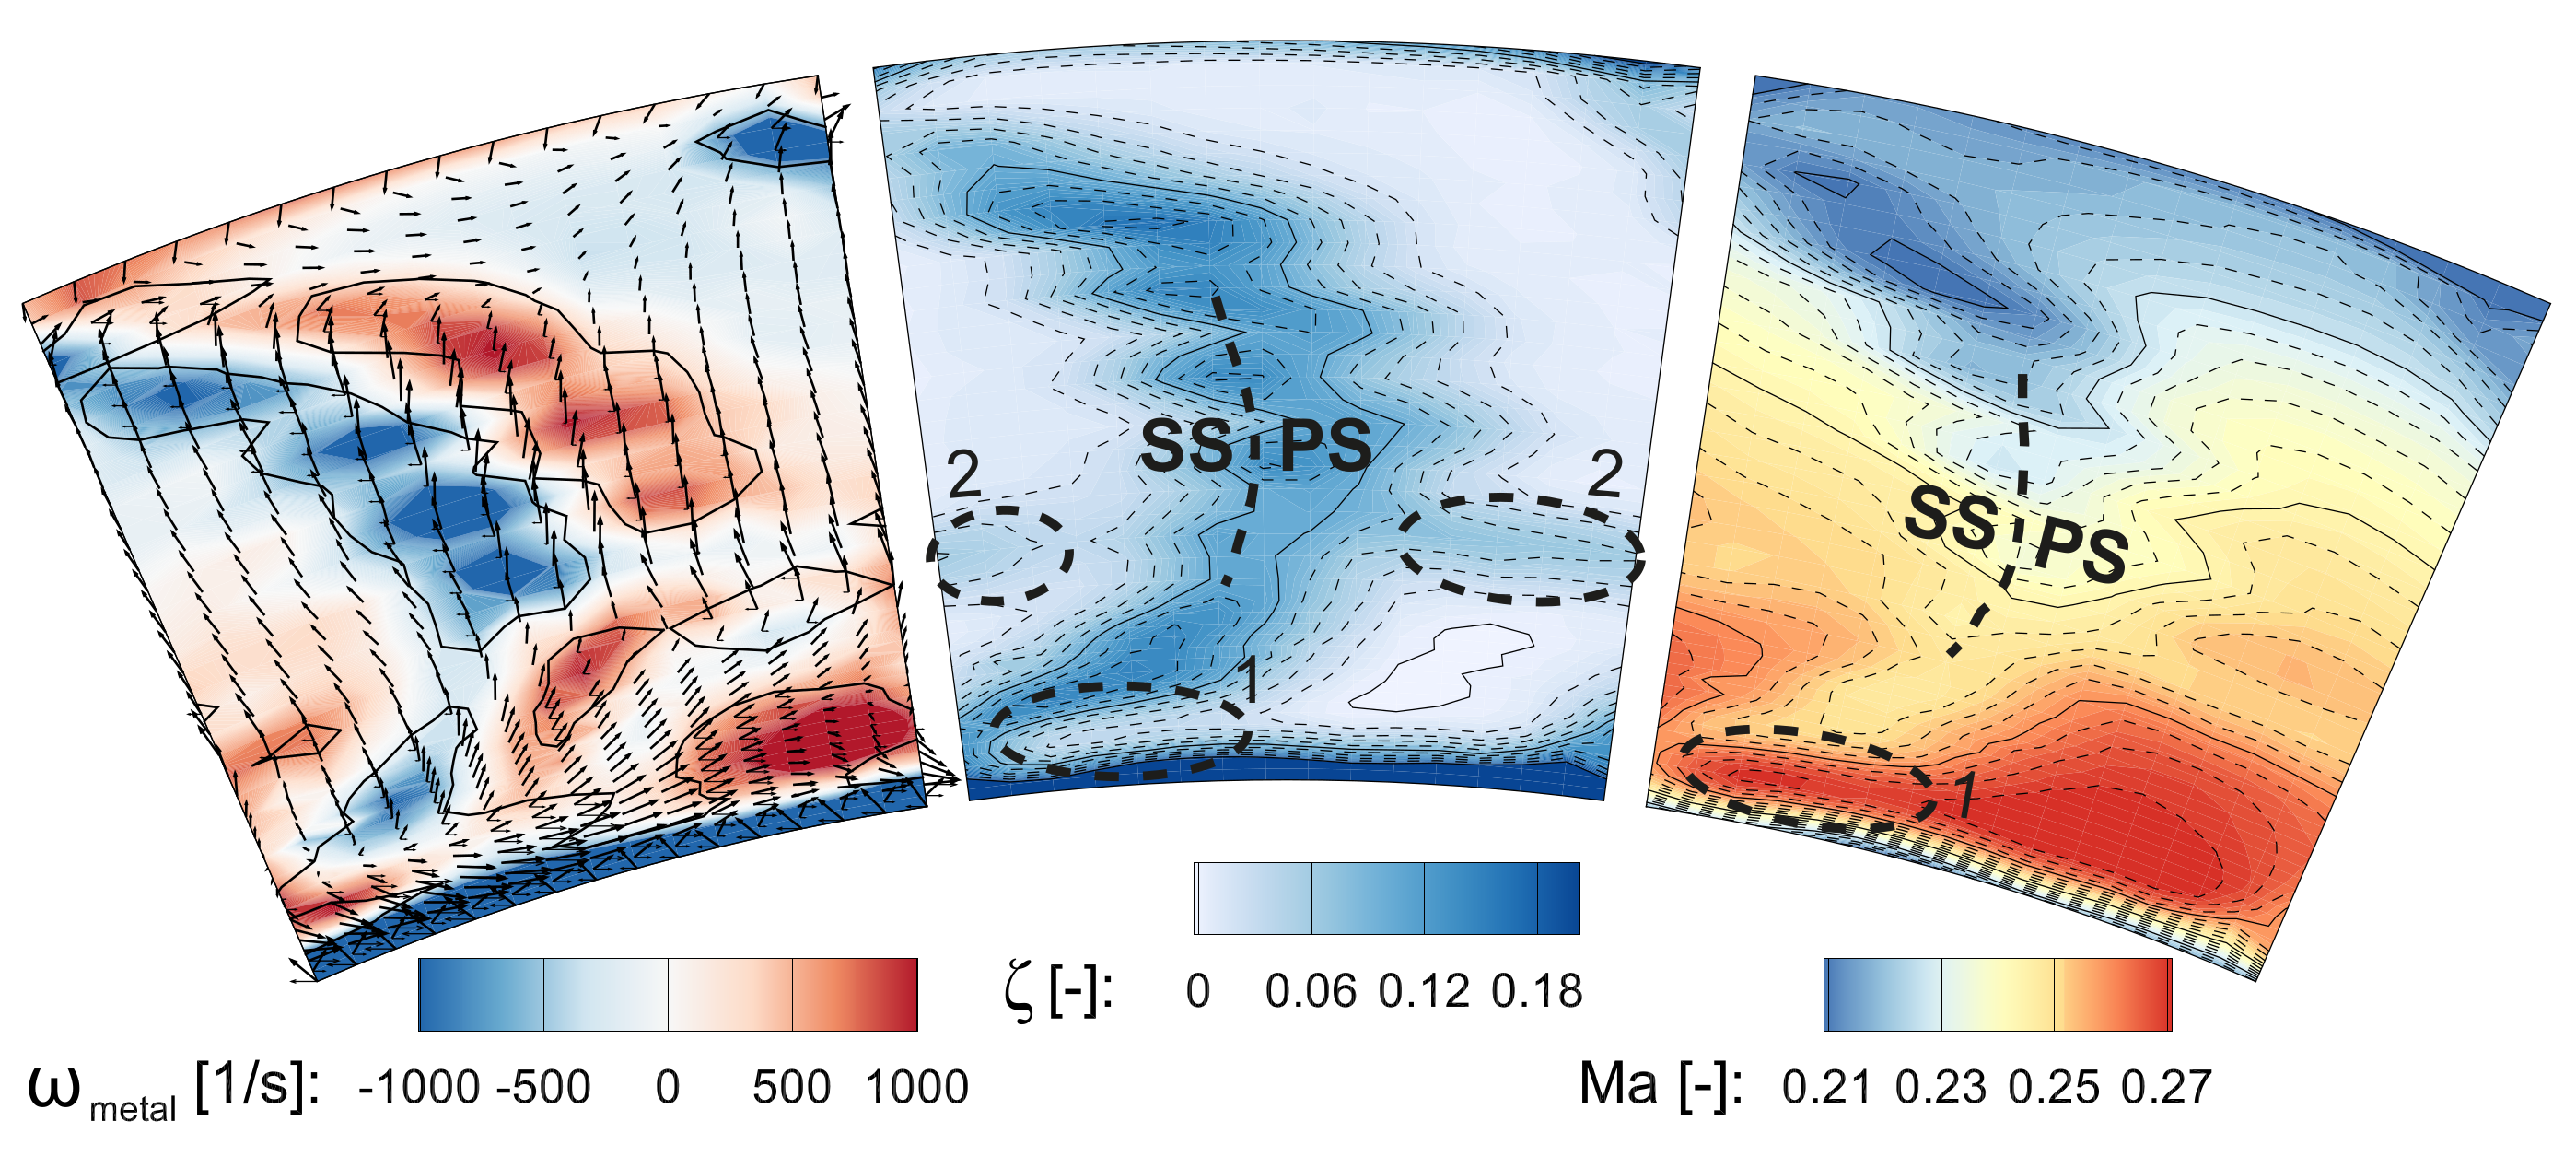
4.1. Nozzle Guide Vane Exit Flow Field
The dominant flow feature for axial (AX) inflow in ME02 is the wake of the stator, which shows seven spots of high
along the suction side/pressure side line, indicated in
Figure 3. They are a result of a strong interaction of the seven trailing edge slots with the main flow, indicated by the contour of the in-plane vorticity
in ME02 (Equation (
7)). Moreover, a loss core, highlighted with number “2” is detected in the passage at about 30% span height. It is not present without RIDN coolant injection and moves to higher span positions with increased MFR. The third loss core, labeled “1” does not show high pressure losses at MFR 3. However, without RIDN injection, there is a large maximum in
in this region. The loss core completely disappears at MFR 5 and the Mach number is increased to the value of the passage center. A loss band is detected all along the hub endwall up to a span height of 5%.
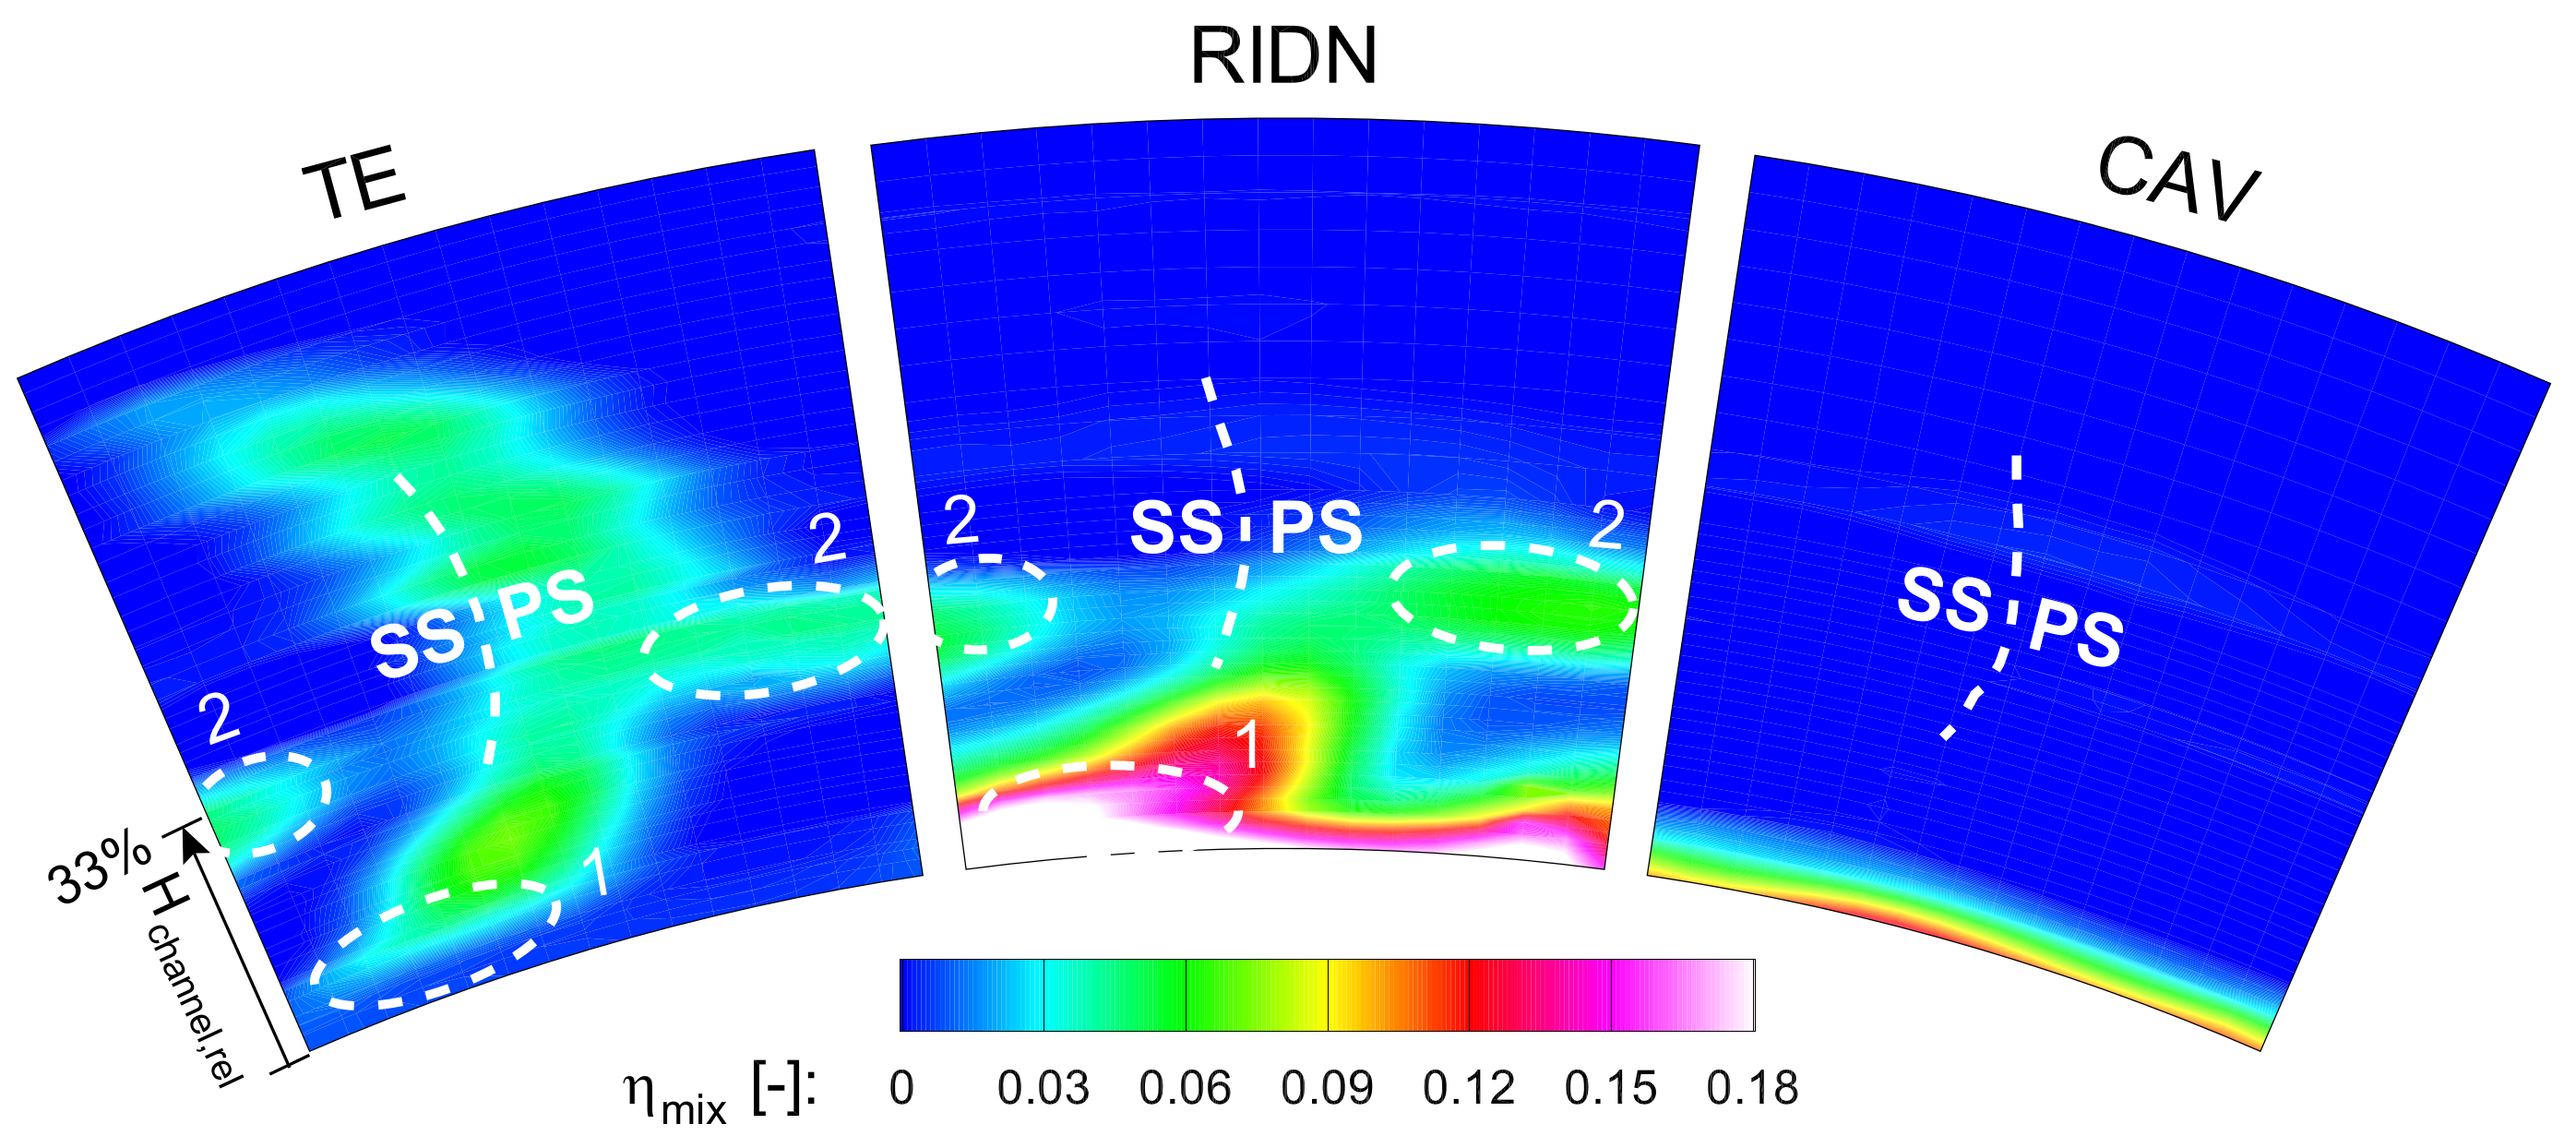
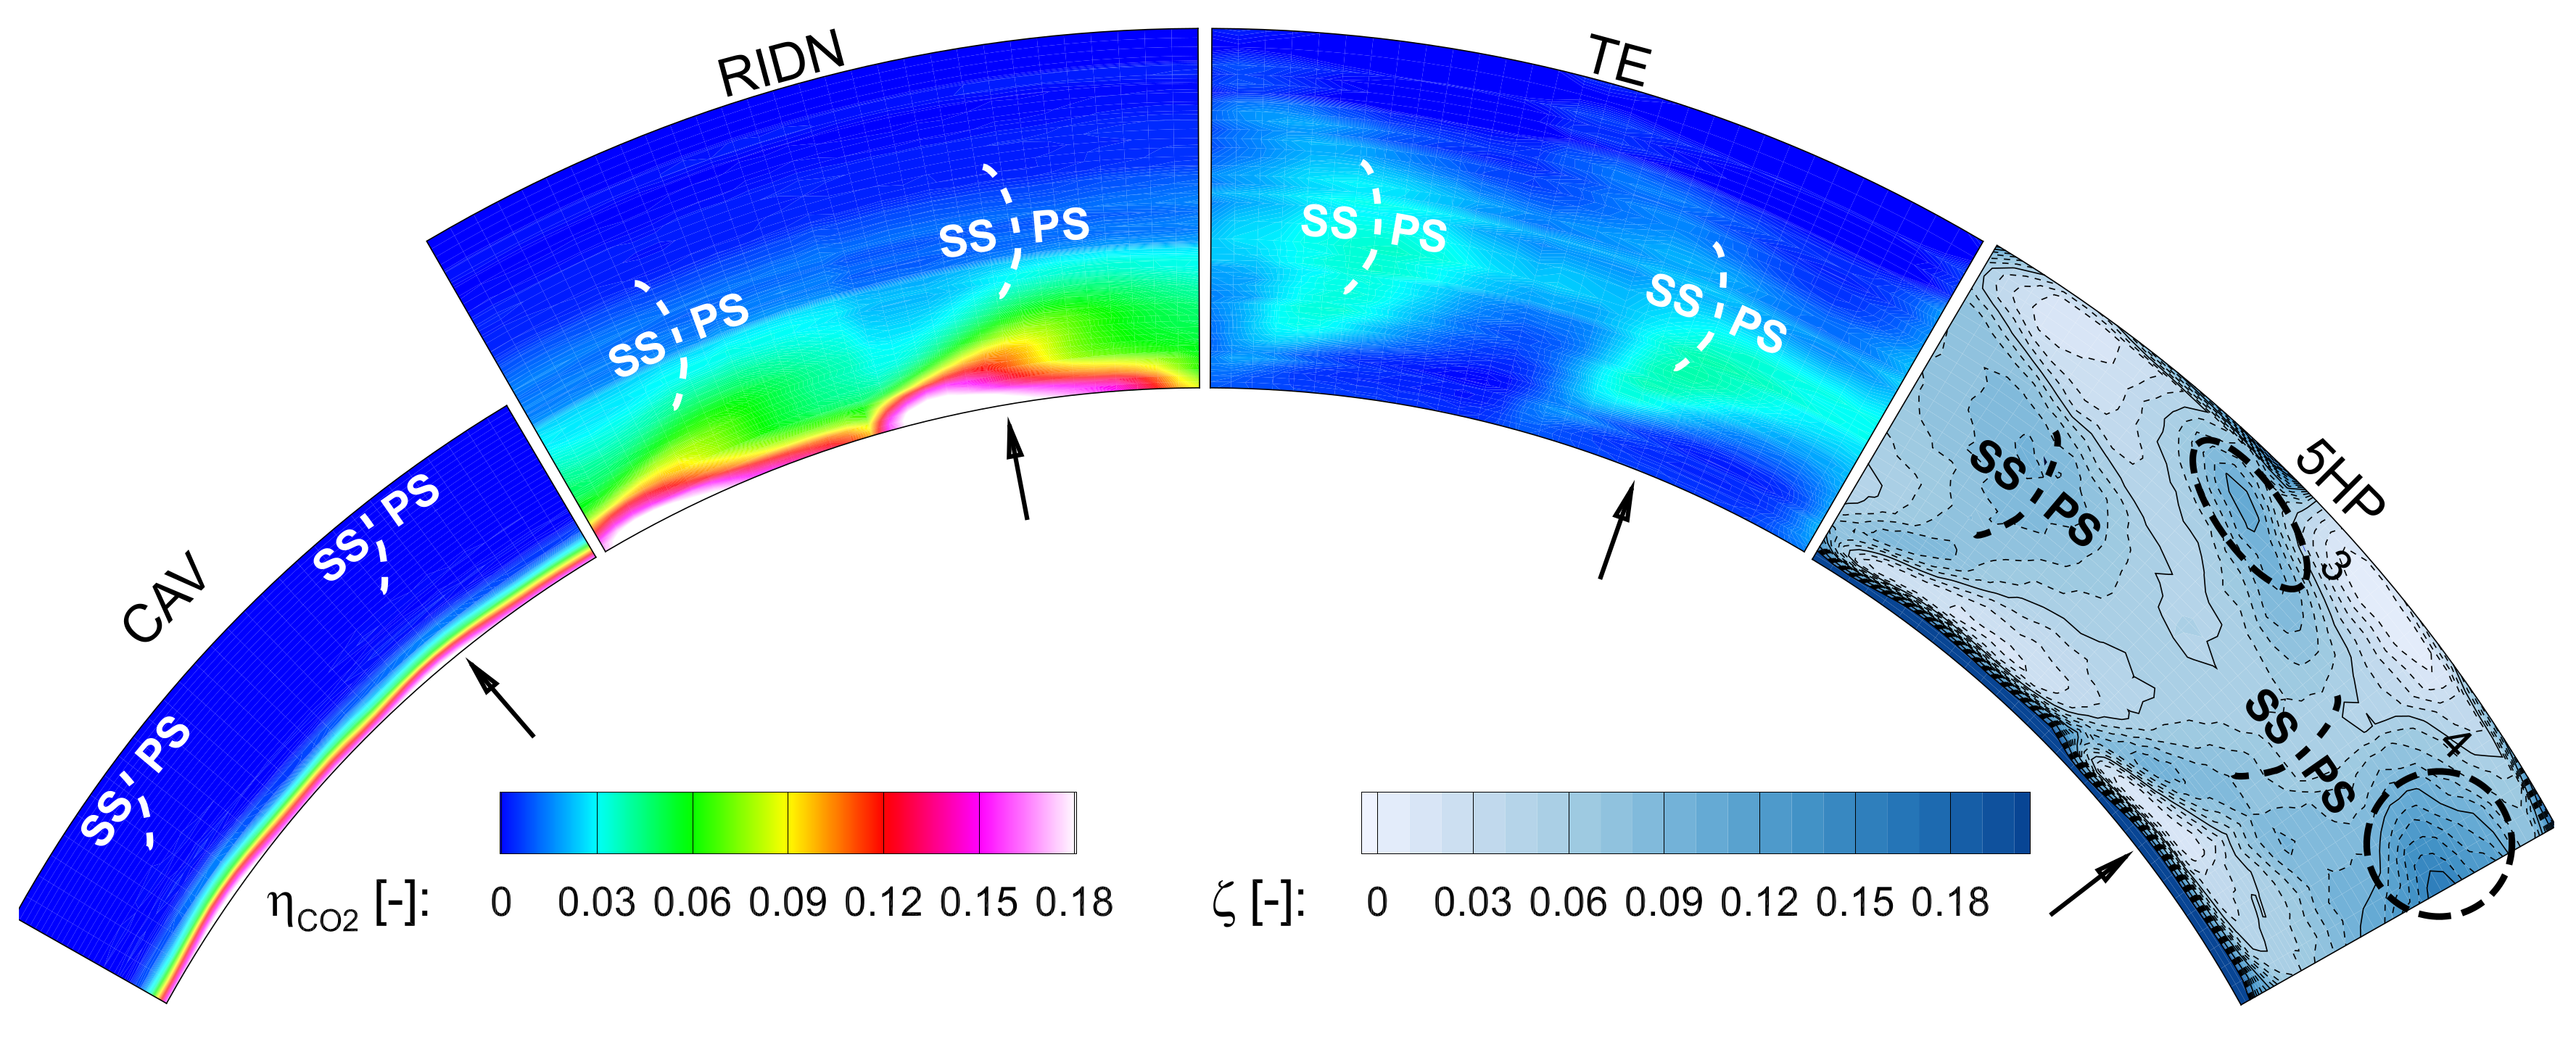
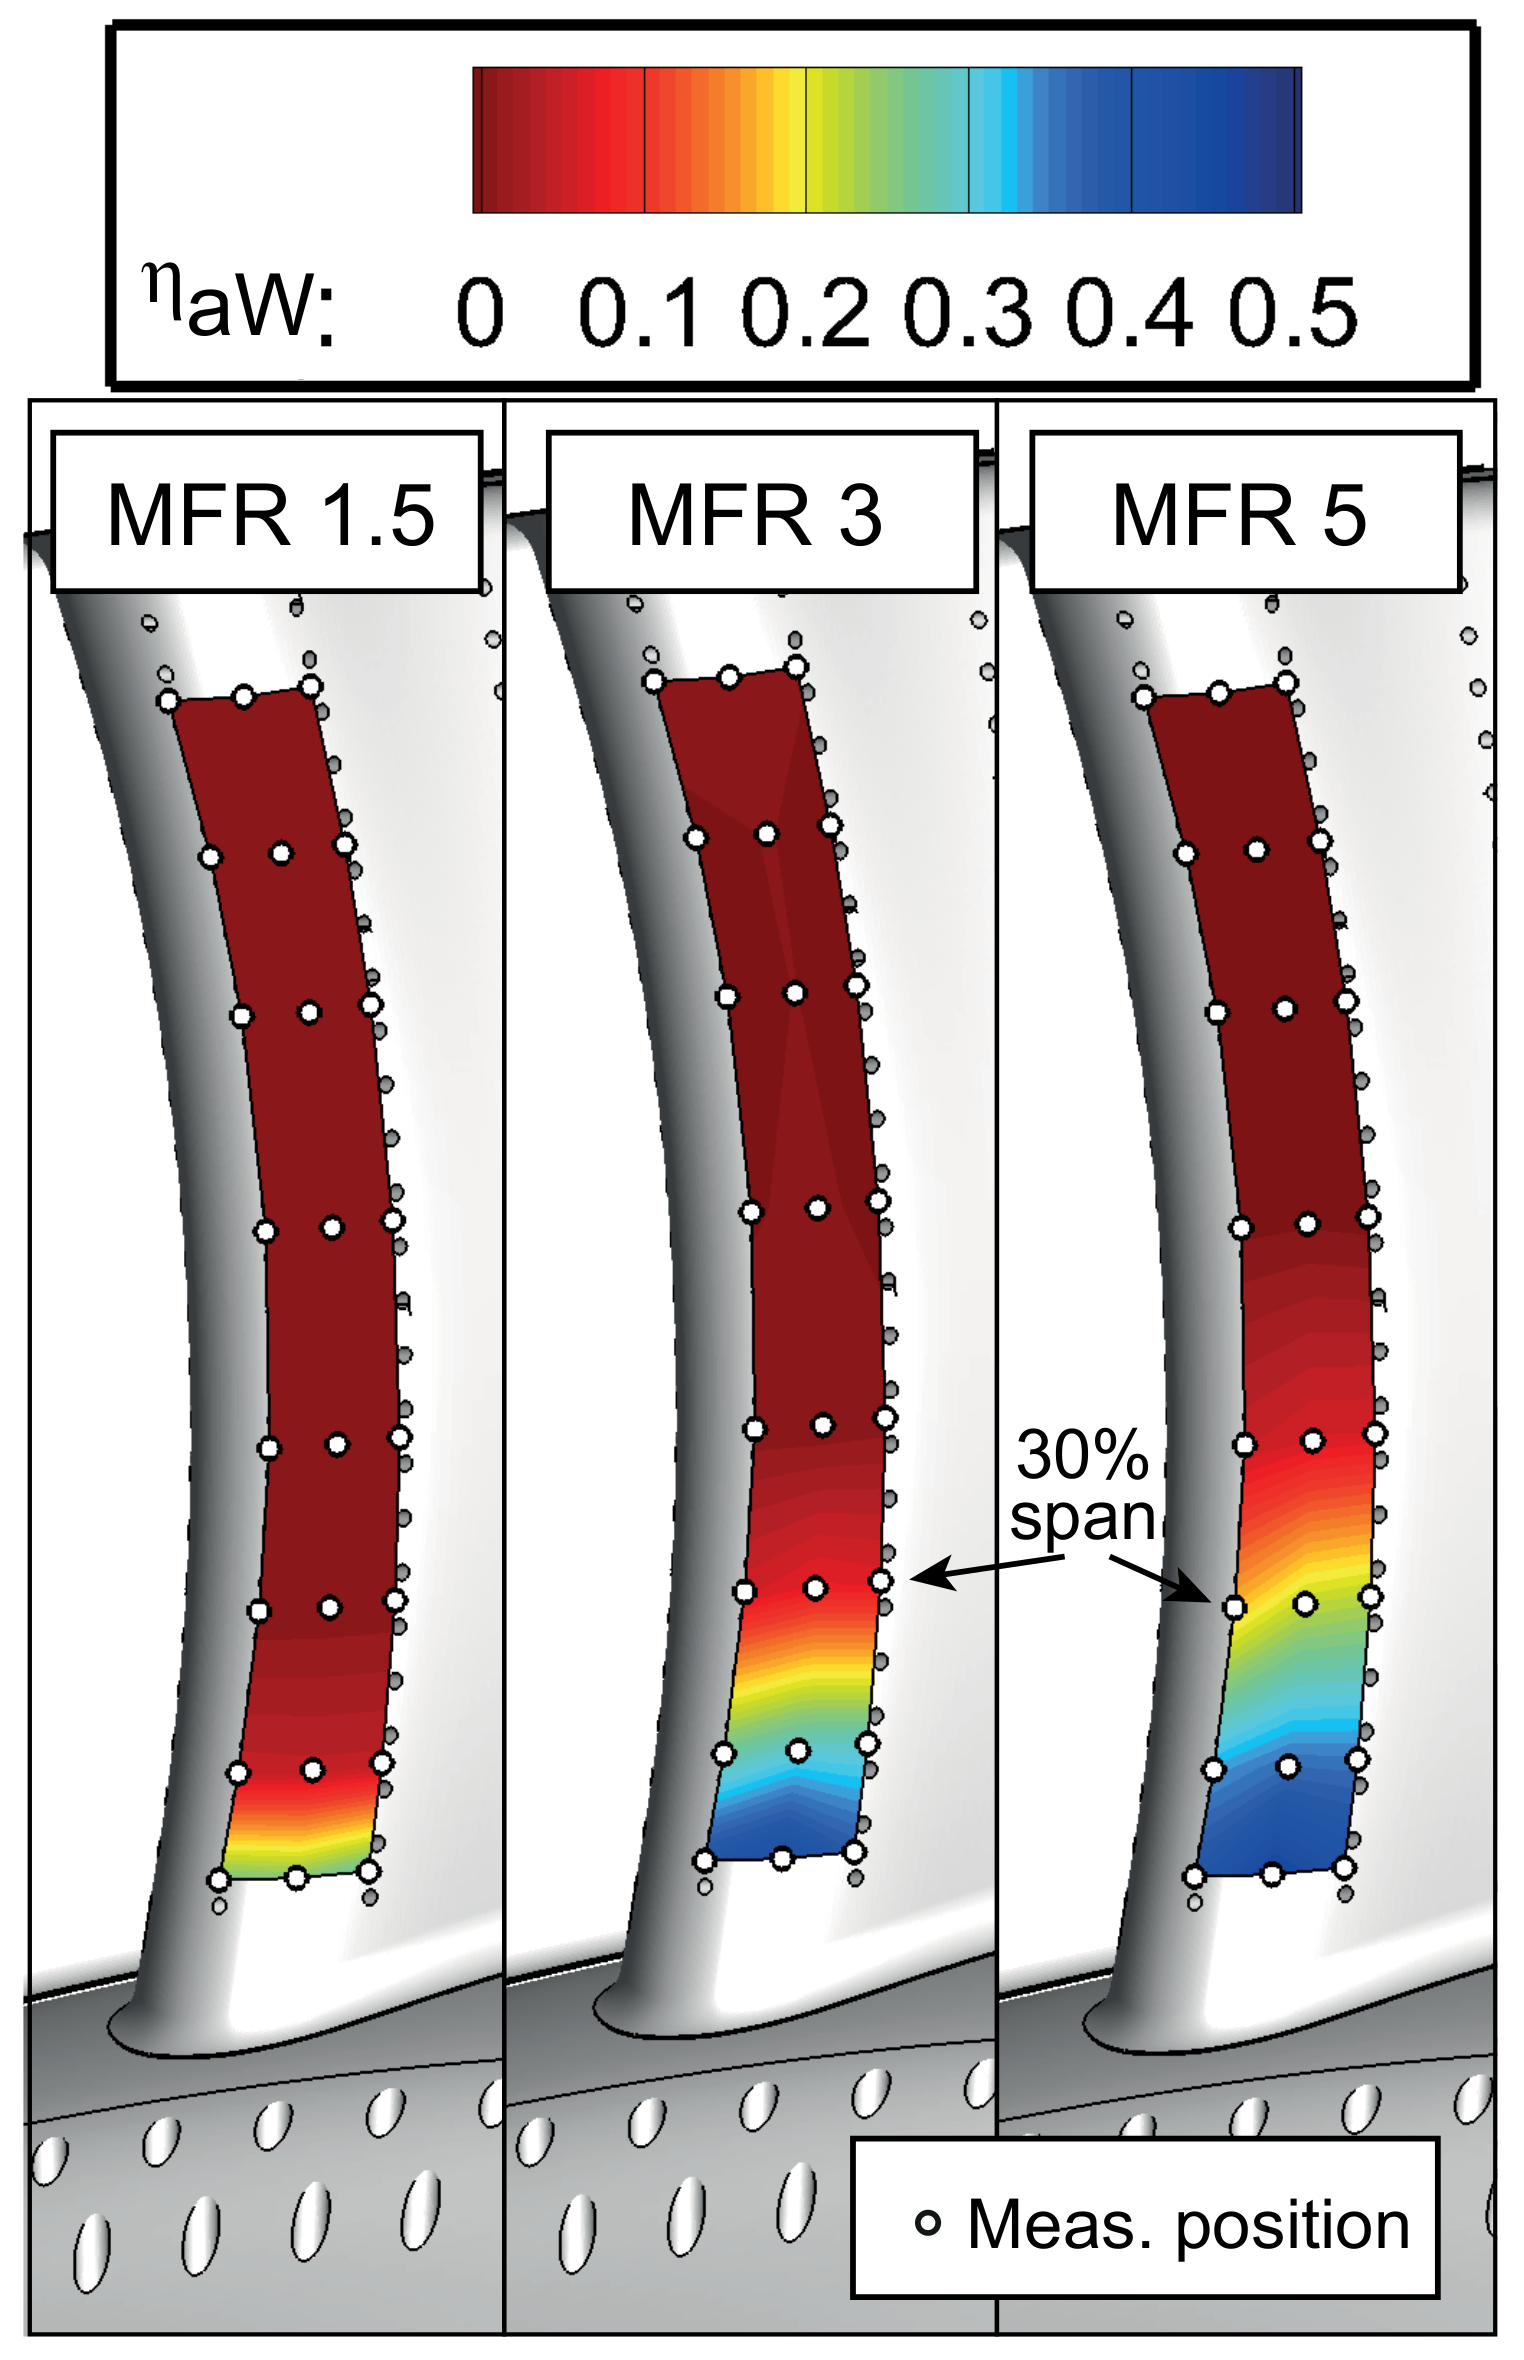
4.2. Propagation of Coolant Flows
With increasing MFR, the coolant reaches up to 30% span height. It is mentioned that this coolant effect is only due to the RIDN coolant. The airfoil film cooling has been ejected, but not seeded with CO
. In the NGV exit flow, for RIDN-seeding, a coolant accumulation in area “1” (
Figure 4) is observed. Also, at a span height of 33%, the RIDN flow is detected in the loss core “2”. The TE-seeding shows that TE-coolant is also accumulated in this region (
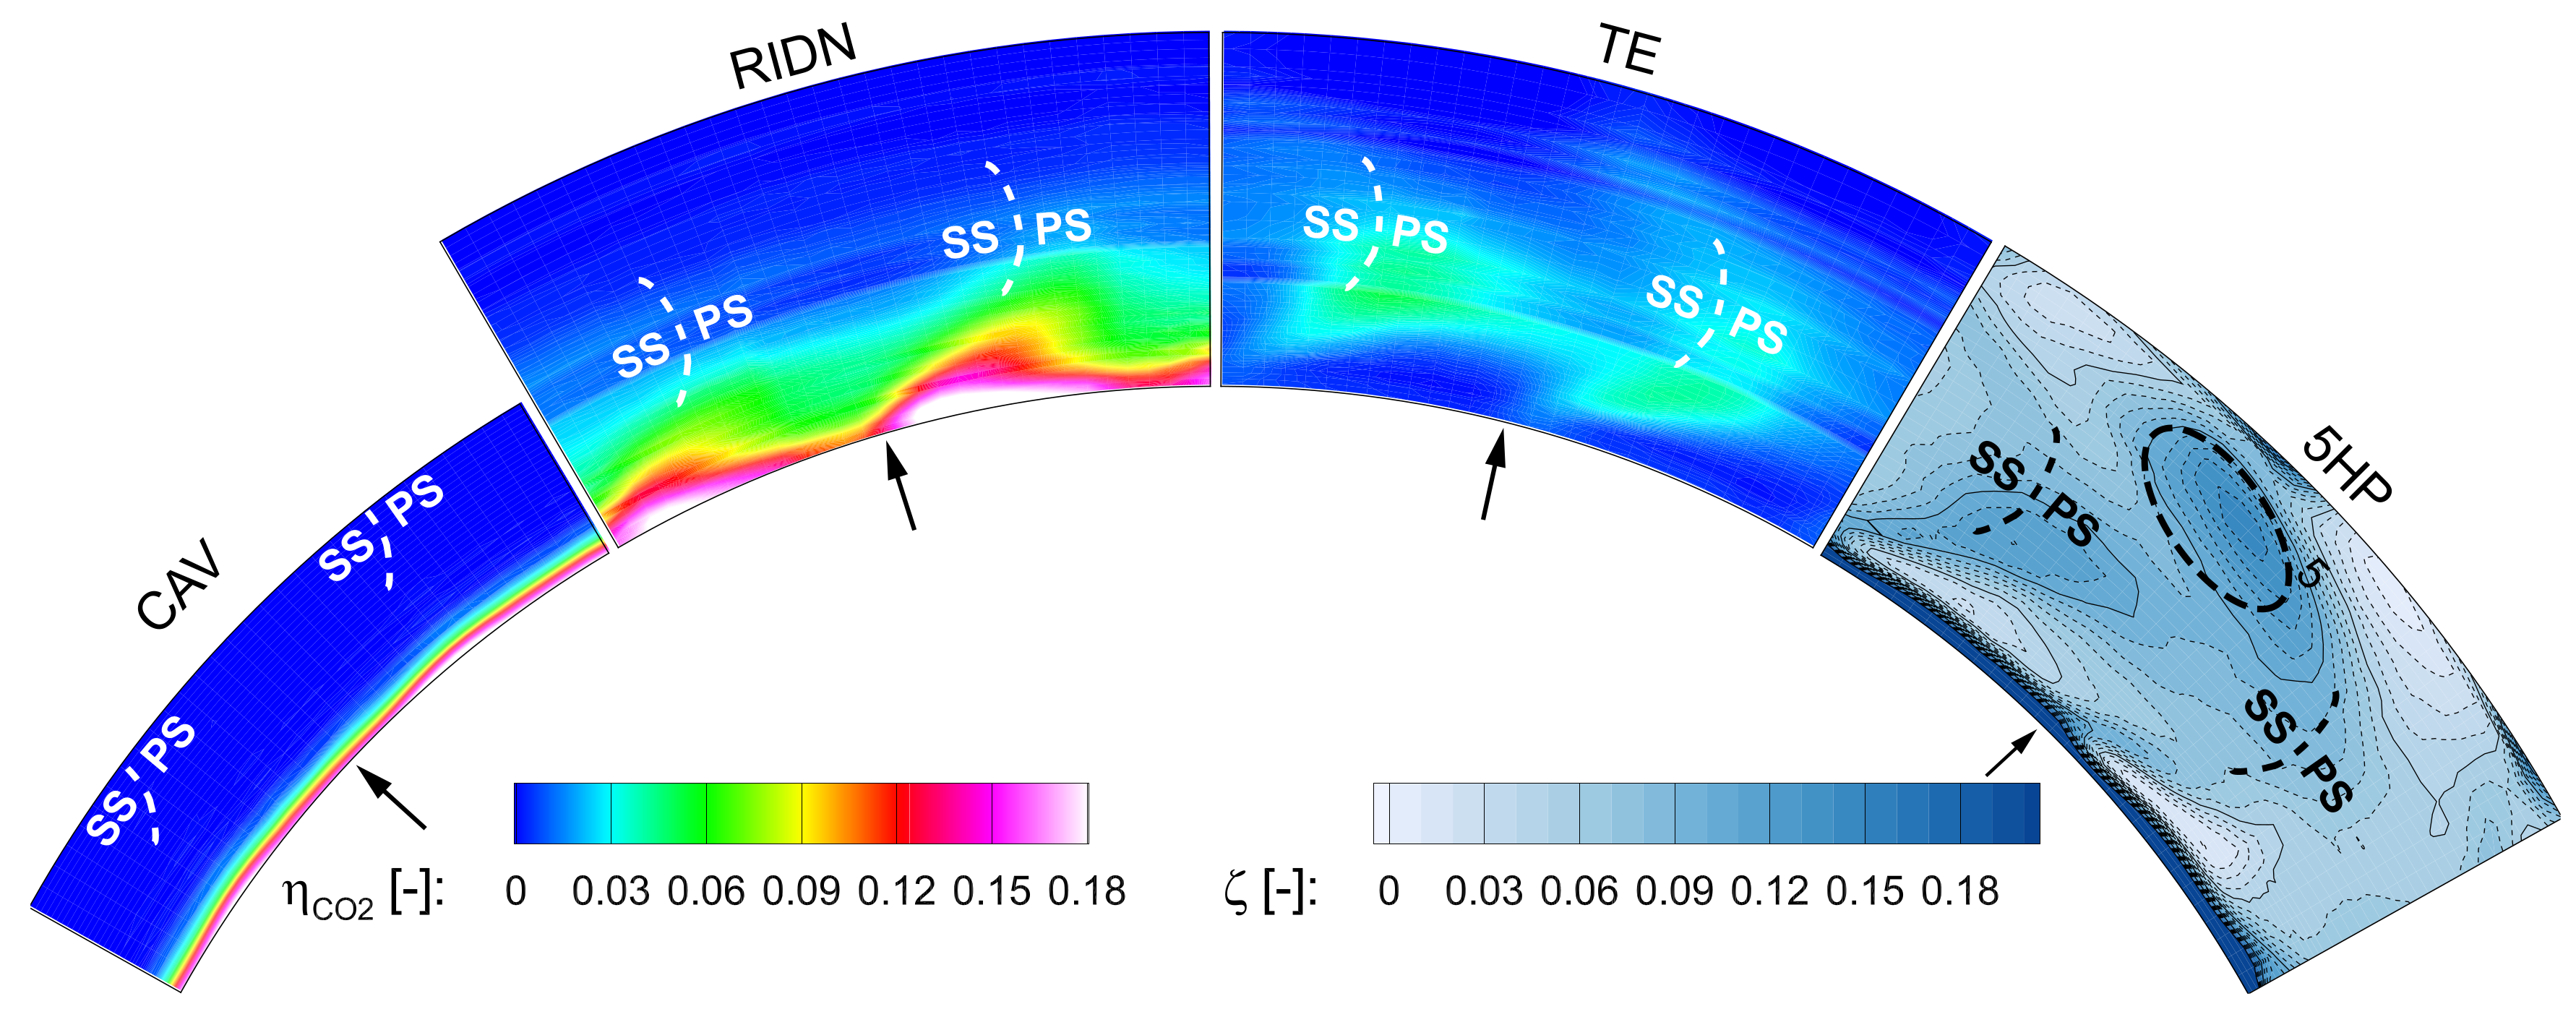
Figure 5). Furthermore, the TE-coolant is detected in the NGV wake at the position of the seven loss cores. The CAV-seeding indicates that in ME02 it remains close to the hub and at the position of the circumferential pressure loss at the hub. The RIDN coolant is observed to wrap up on the leading edge, as the
-contours in
Figure 6 indicate. A similar behavior has been observed by Thomas [
28].
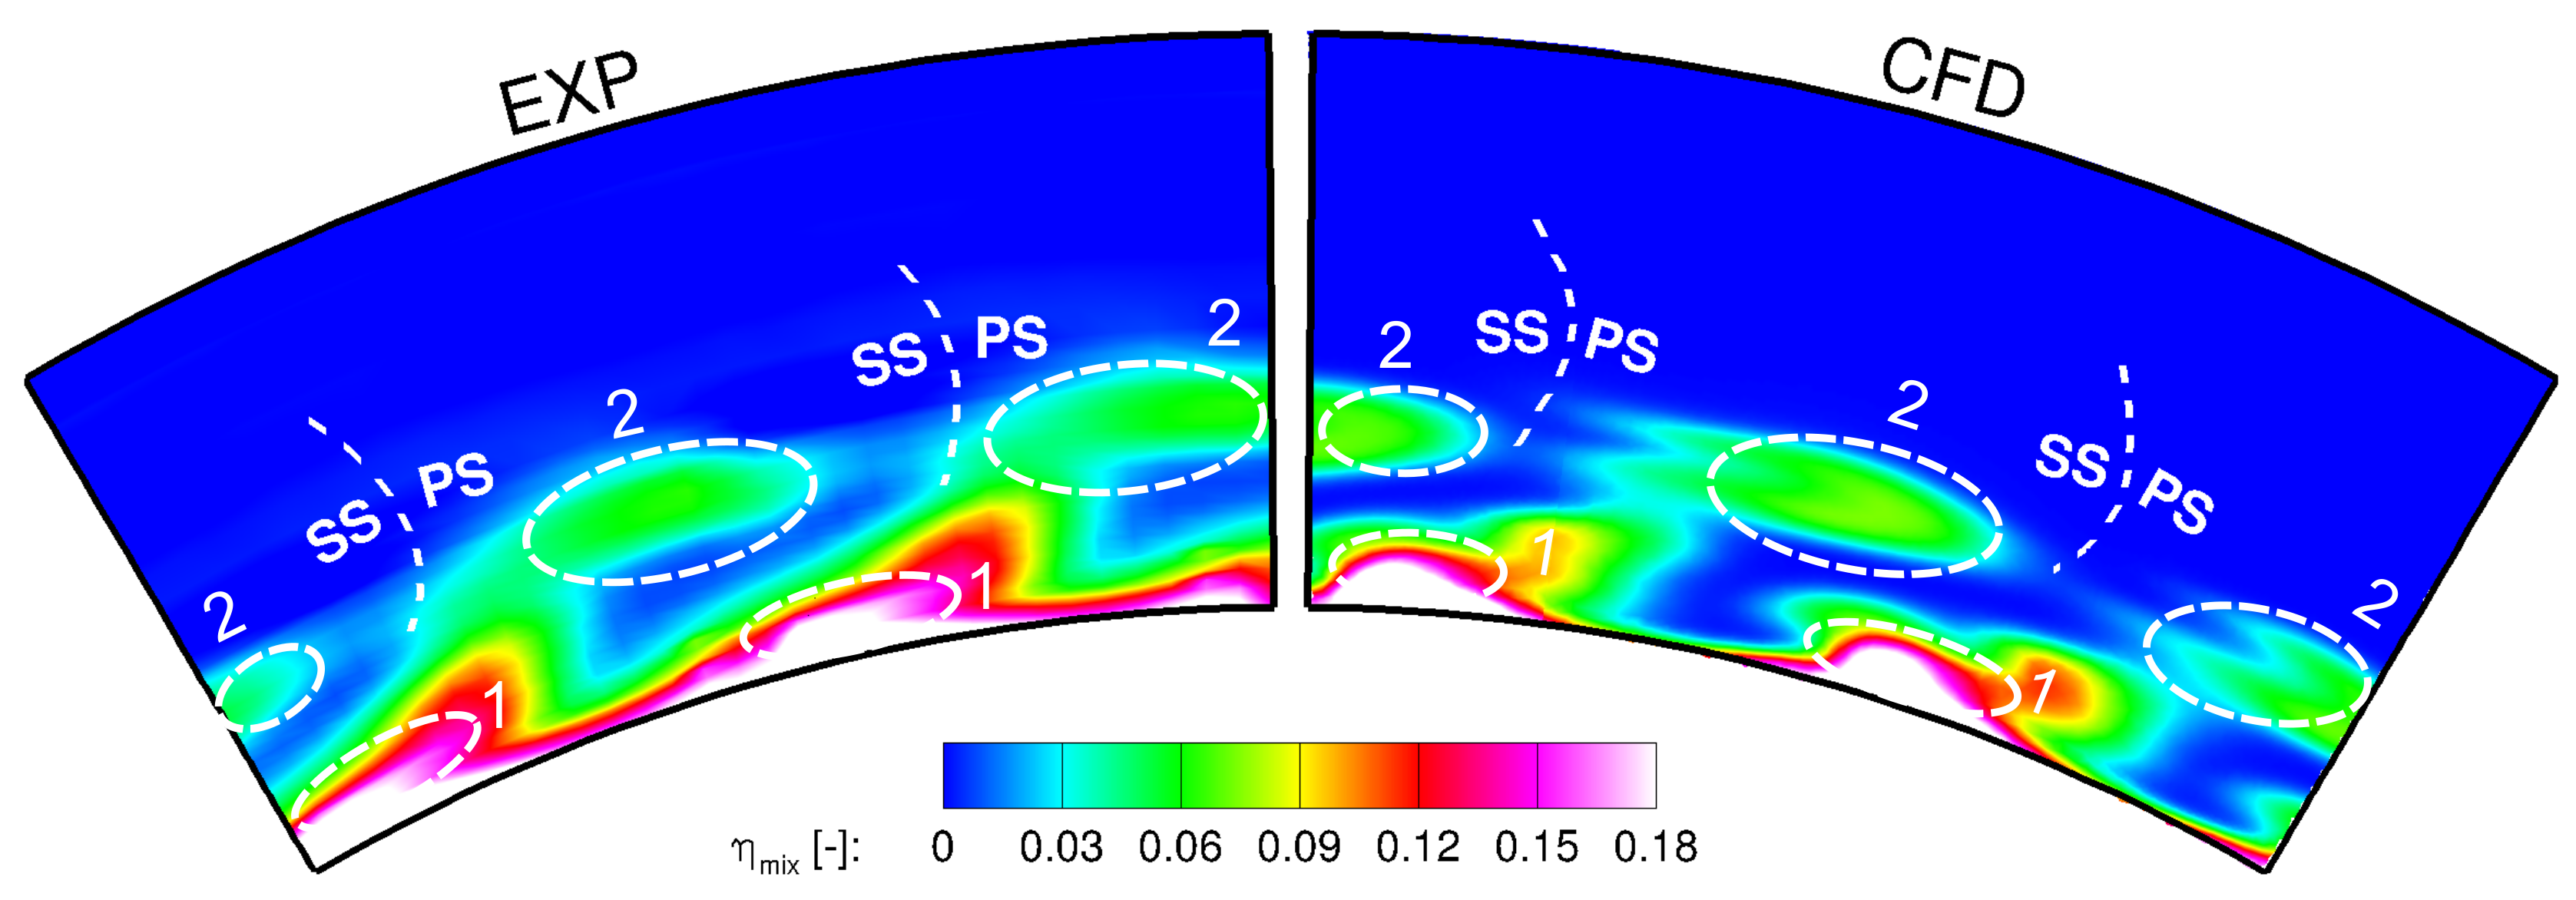
4.3. Comparison between Experiment and CFD
A comparison between the measured CO
data and CFD for axial inflow with MFR 3 in ME02 is shown circumferentially and area-averaged in
Figure 7 and spatially resolved in
Figure 8. The main flow features as well as the level of CO
concentration in the CFD prediction agree well with the experimental values. The zone of medium CO
concentration of 5% due to a wrapping-up of RIDN air at the vane leading edge (region “2” in
Figure 7 and
Figure 8) is predicted by CFD at the same position as indicated by experiments. Also, the zone of high CO
concentration of 18% from the pressure side (PS)/hub corner (region “1” in
Figure 8) can be seen in the CFD prediction at the same location.
As mentioned above, a cooling hole is missing for every other vane. This is visible in a slight non-periodicity of the numerical results in the area between regions labeled “1” and “2”. In the experiments, this is not visible because the measurements took place in a fully equipped vane passage. Further differences are expected to be mainly due to different inlet boundary conditions as well as general modeling errors of the CFD.
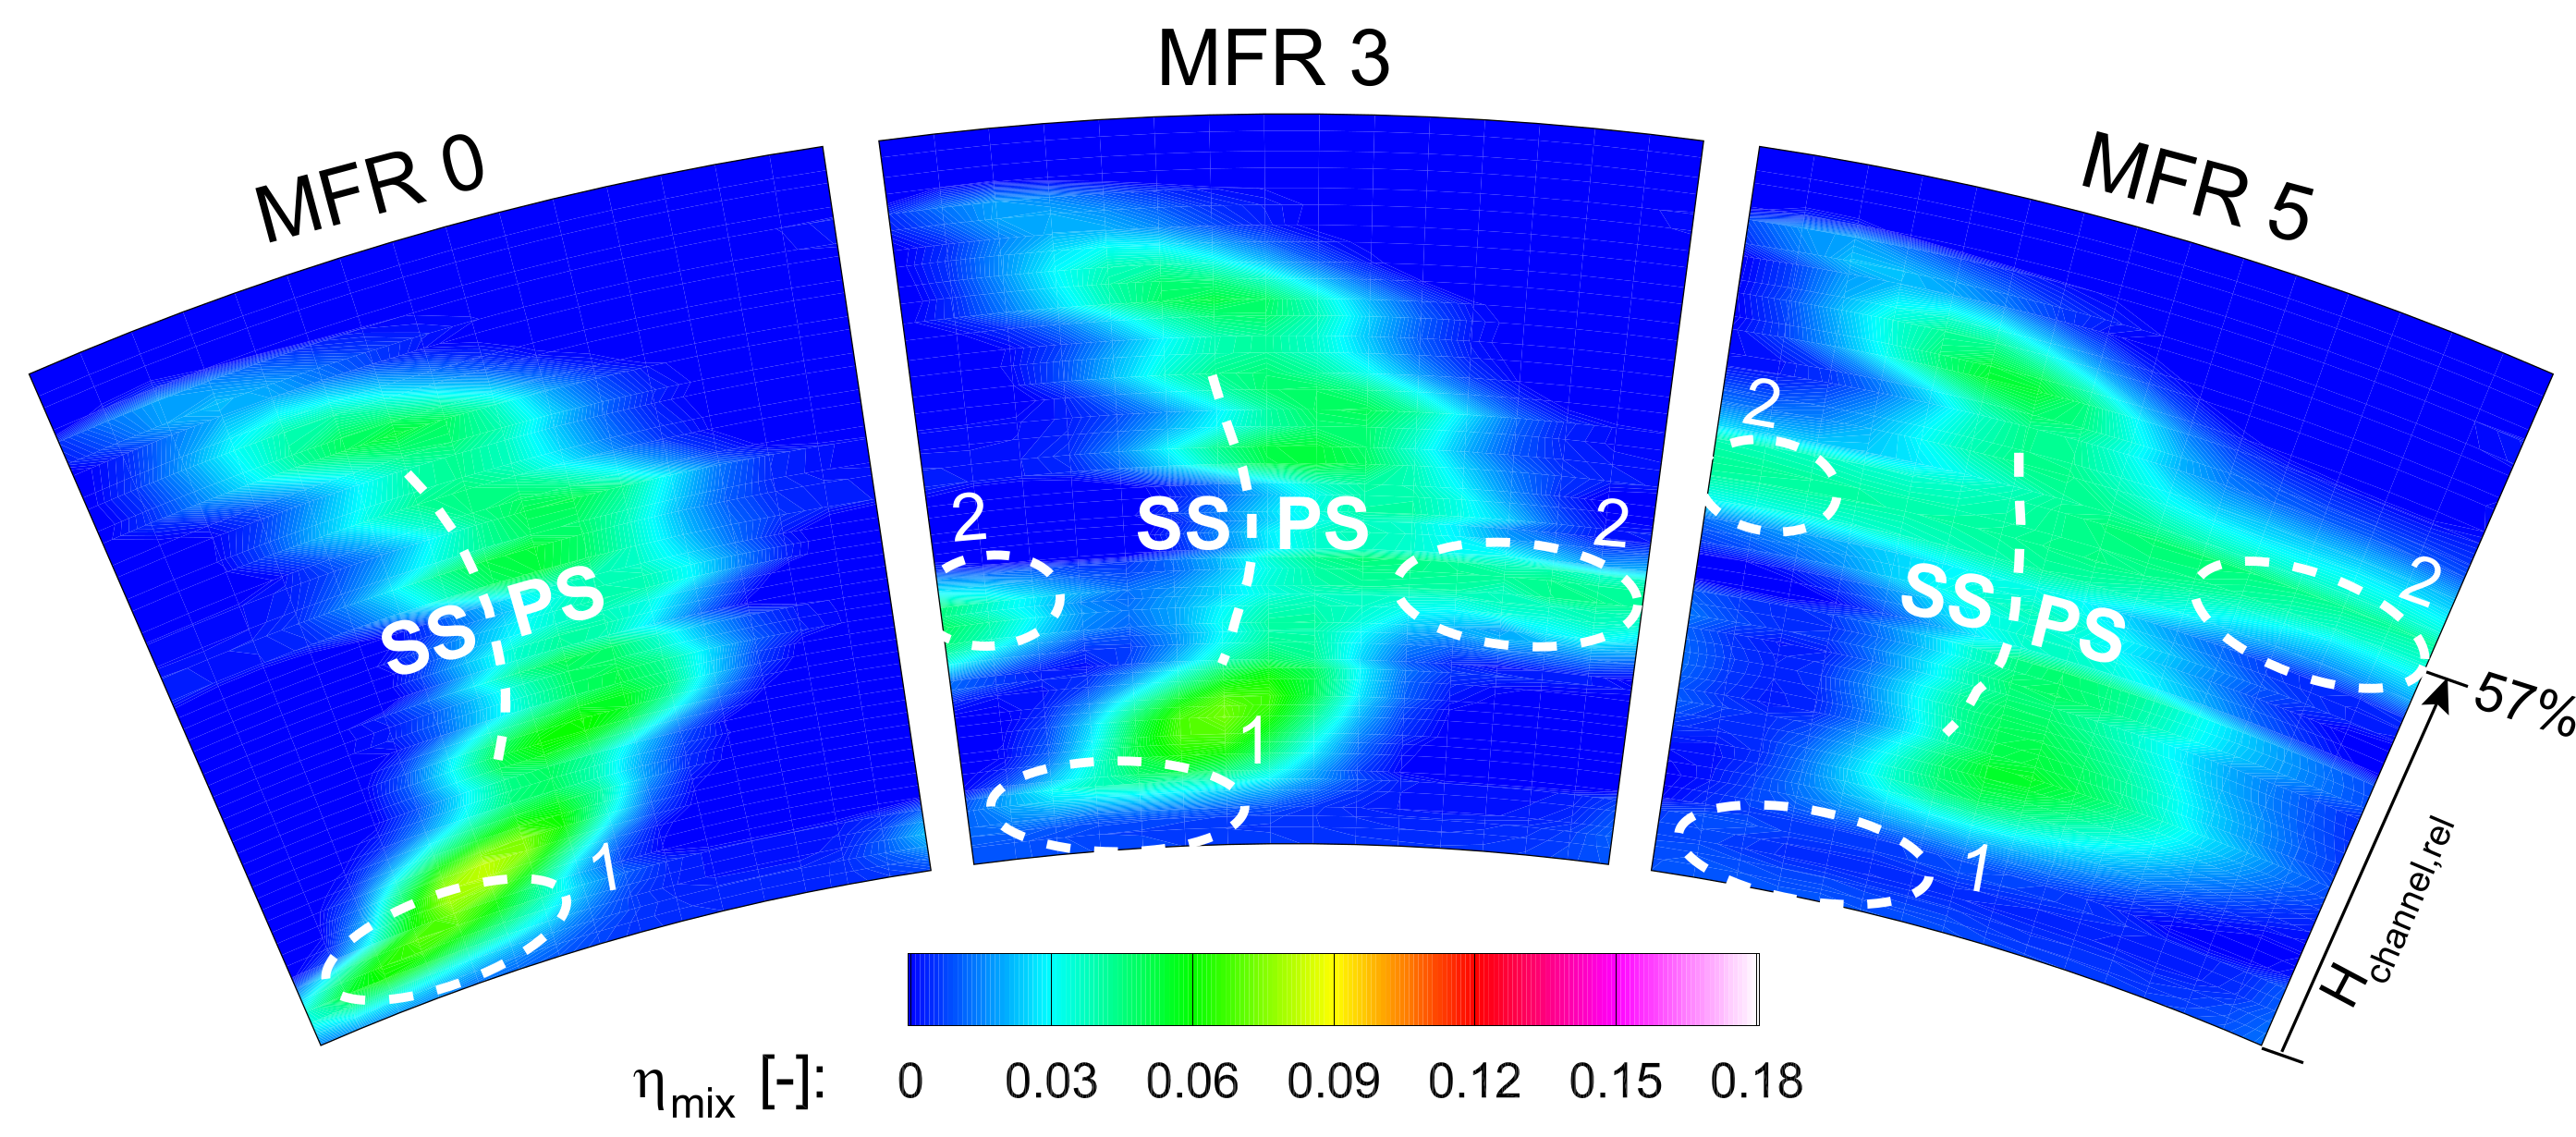
4.4. Coolant Mass Flow Ratio Variation
The MFR variation shows the loss core “2” to move upward to higher span-wise positions, exemplary shown for TE-seeding (
Figure 5).
Similarly, it is observed for RIDN-seeding (not shown). In area “1”, no TE-coolant is detected in the vicinity of the hub endwall anymore for MFR 3 and 5. The Mach number as mentioned before, is increased. For MFR 5, the loss core “2” is detected at 57% span height. As shown in Werschnik et al. [
20], the high momentum carries the coolant to the pressure side and based on the radial equilibrium, the near-endwall flow is from the suction side (SS) to the PS, contrary to the flow situation in an uncooled passage. The increased, large pitch-wise redistribution of coolant flows into the passage flow is a compensation movement of the vortex initiated by the RIDN injection at the LE. Consequently, it is detected in the passage center.
4.5. Flow Model for the Baseline Configuration
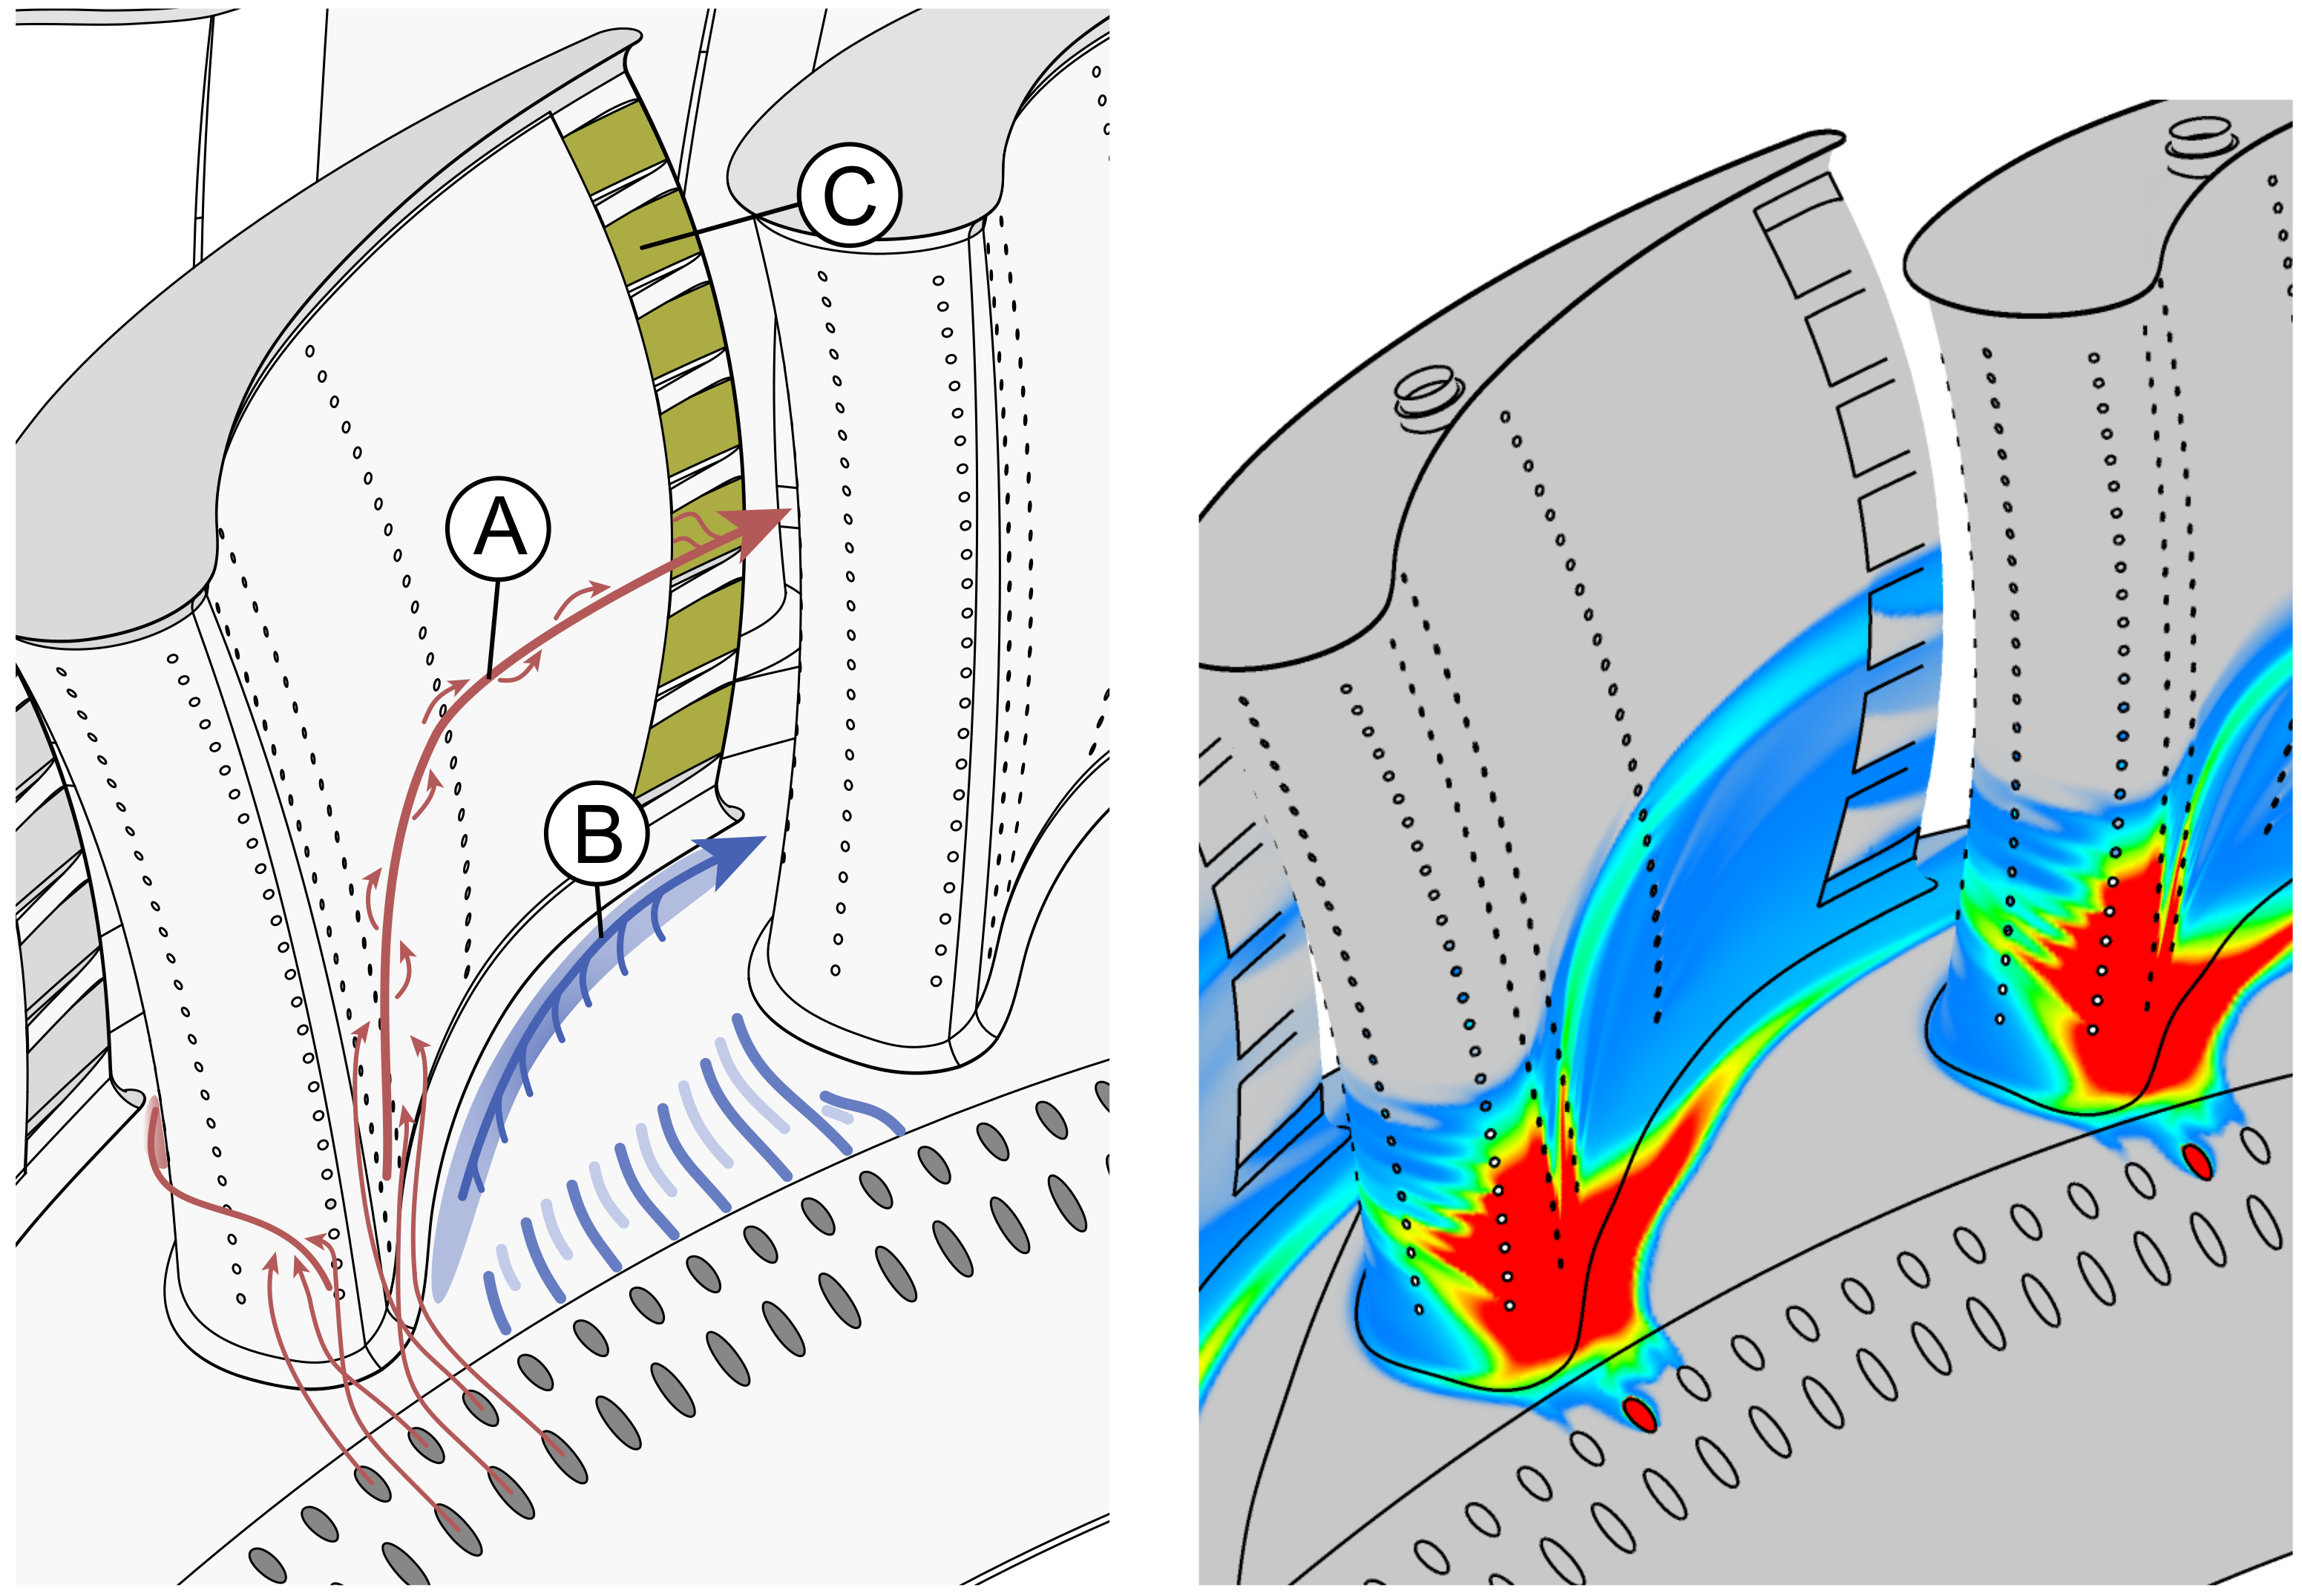
The results for the reference configuration allow the development of a flow model illustrating the RIDN flow features (
Figure 9). The RIDN coolant wraps up on the leading edge due to its surplus in momentum. The flow divides at the stagnation point and a vortex rolls up (label Ⓐ) along the pressure side. The high momentum carries the RIDN coolant across the passage into the pressure side corner (Ⓑ), as measured by Werschnik et al. [
20] and causes the near endwall flow to travel from SS to PS, according to the radial equilibrium. The RIDN coolant is further washed up on the pressure side, as indicated in the figure until it reaches the TE-ejection slots (Ⓒ). As a compensating movement to the near-endwall flow direction from SS to PS, vortex Ⓐ carries both RIDN and TE-coolant into the passage center at the vane exit, identified by the high RIDN-coolant concentration in region “2”. All blowing rates studied are greater than one and consequently the model applies for all cooled settings in this investigation.
The flow model is confirmed by CFD prediction as shown in the right panel of
Figure 9 where the adiabatic film cooling effectiveness resulting from a single cooling hole ahead of the vane leading edge is shown. It can be seen that the air from this hole is transported to all regions with elevated film cooling effectiveness, in particular the PS vortex Ⓐ and the accumulation in the PS/hub corner Ⓑ.
5. Results—Swirling Inflow to the Turbine
Swirling inflow has been investigated for SWL and SWP at MFR 3. The LSTR swirler increases the turbulence intensity in the turbine inlet plane (ME01) to an average of 35%, normalized with the local effective velocity ( Werschnik et al. [
20]).
5.1. Swirler Flow Field and Nozzle Guide Vane Losses
Downstream of the swirler core, a total pressure deficit is observed. Similar to literature findings by Schmid et al. [
5] and Klapdor [
4], no upstream effect of the NGV can be detected at the inlet plane. Pressure and velocity contours are observed to sustain their shape and clock with the swirler. The effect of adjacent swirlers combines and in ME01, a negative
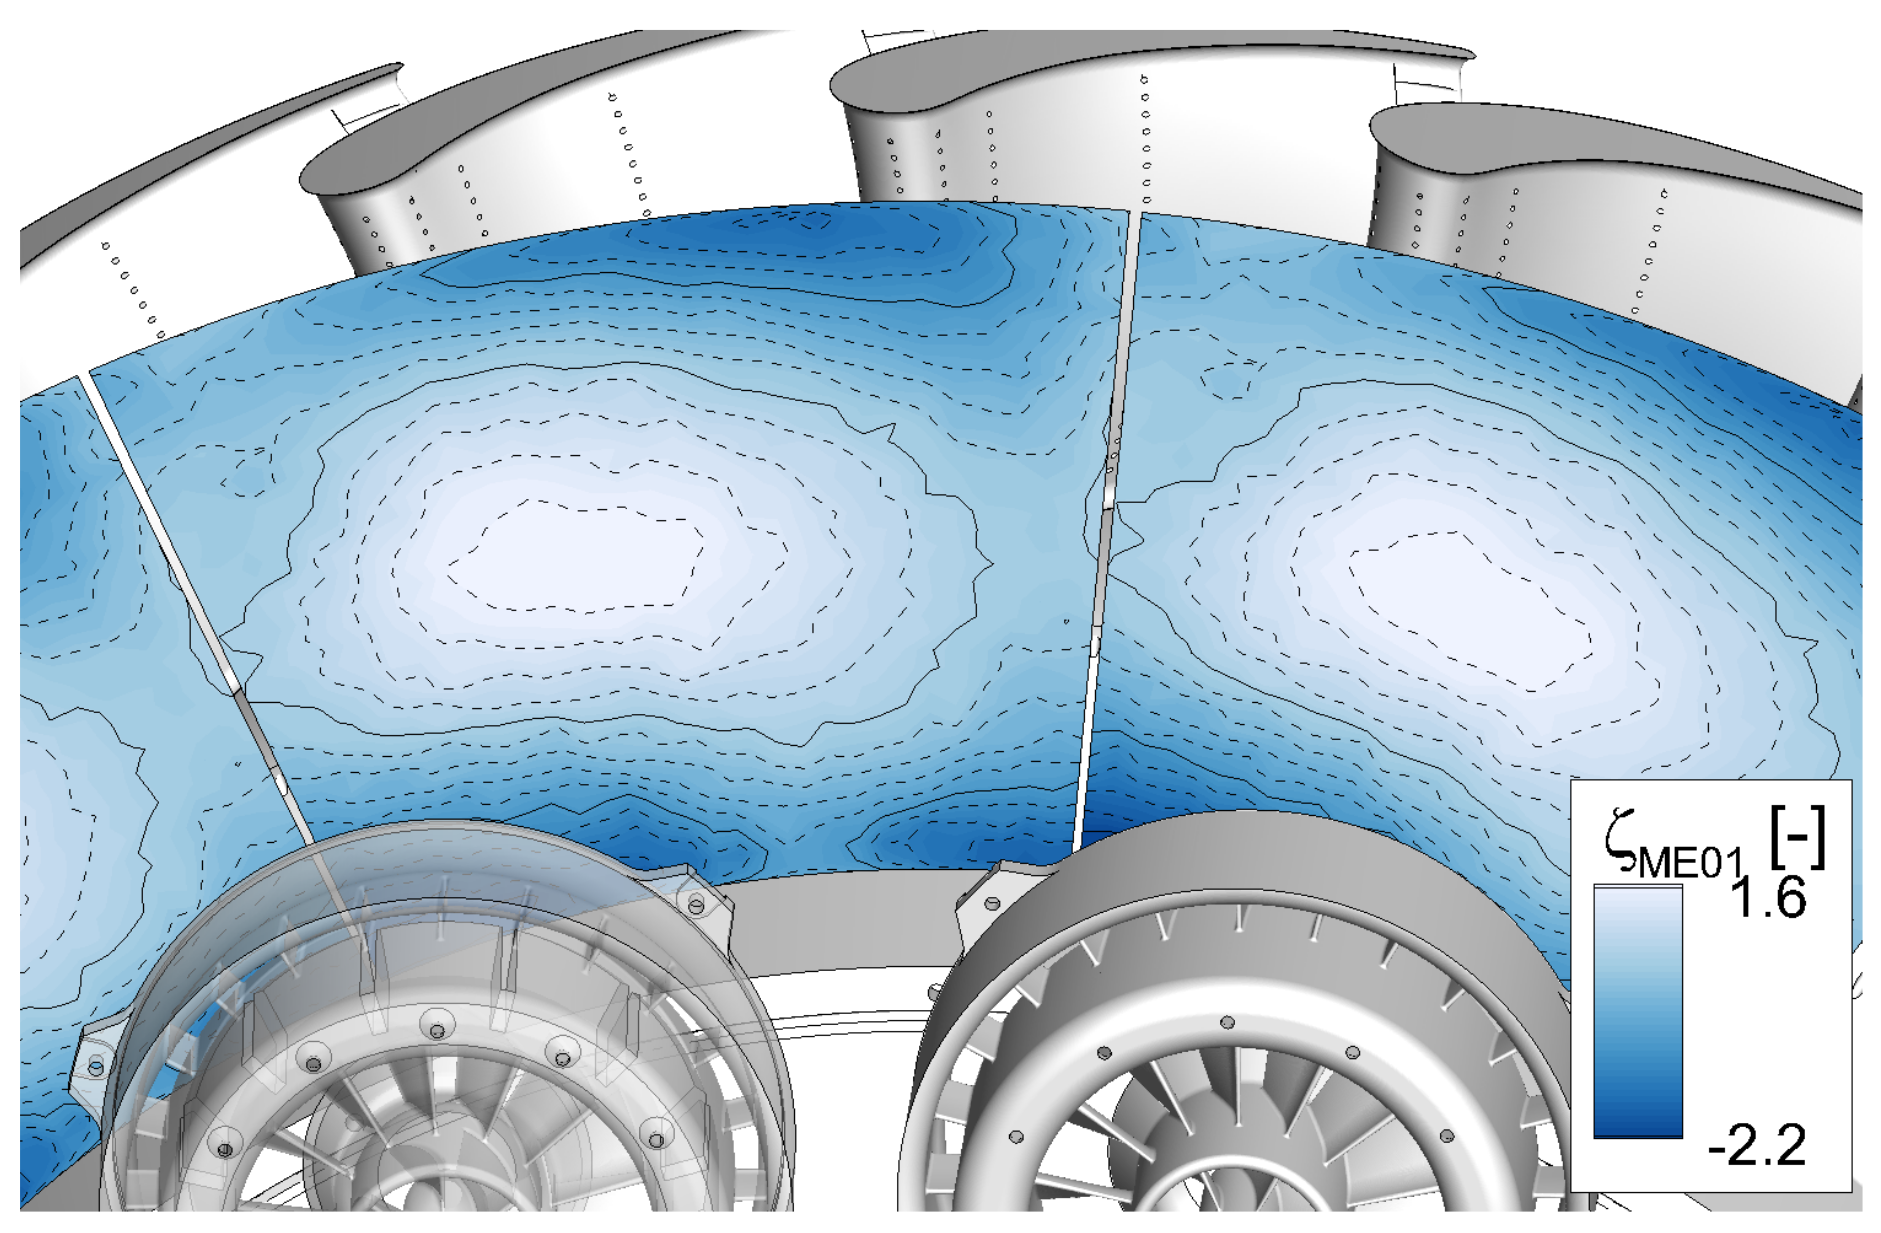
level, i.e., superior total pressure, is observed near both endwalls. A low pressure band is found in the central annulus (cf.
Figure 10). The swirler core is shifted to the left of the swirler axis in ME01. This phenomenon is commonly observed for annular combustor geometries and, as Vagnoli and Verstraete [
29] illustrate, the swirl core moves in the direction of the whirl component near to the casing, which for the present investigation is counter-clockwise.
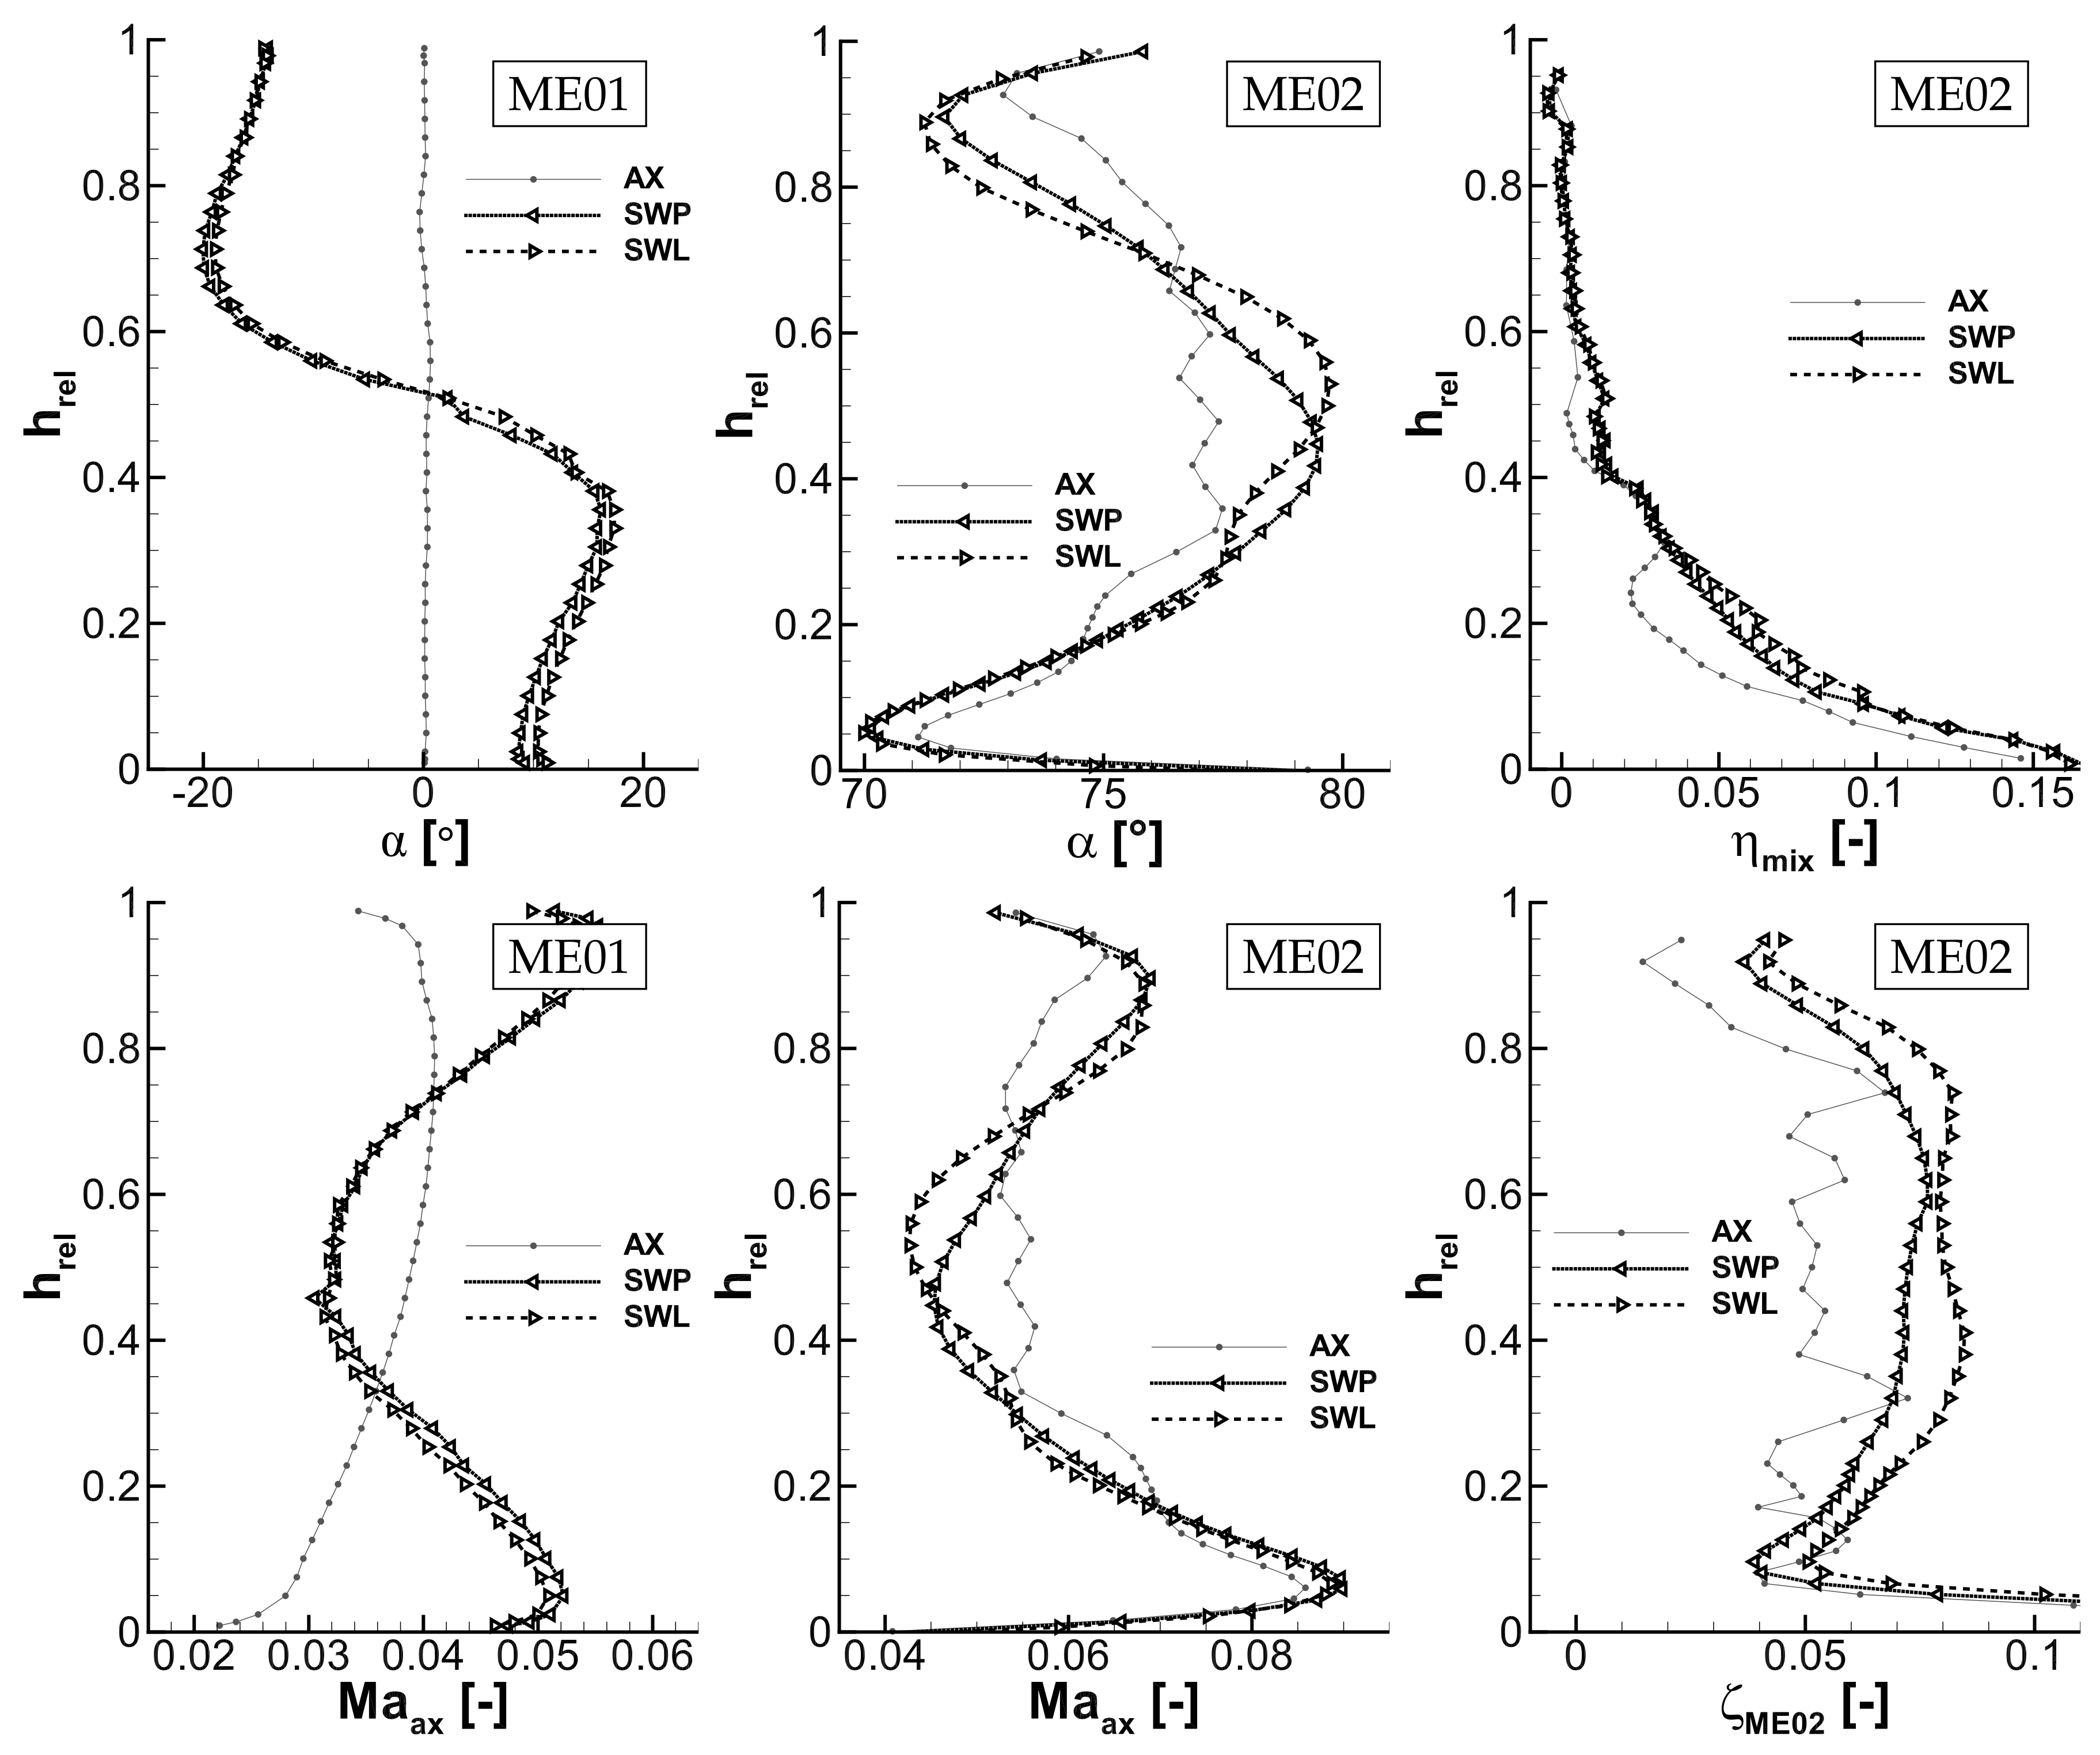
The flow field downstream of the NGV in ME02 changes significantly. The pitch-wise, area-averaged inlet whirl angle (
Figure 11) in ME01 shows values of up to 20
near the casing and 15
near the hub. The relative channel height h
is calculated at the NGV TE plane, disregarding the rim real. However, the exit flow in ME02 shows underturning by 2–4
near both endwalls and increased turning by 3
in the center and shows clocking influence. This is associated to the span-wise mass flow redistribution that is imposed by the swirler. While the NGV is robust to the inflow angles, the mass flow redistribution is transported through the vane row, resulting in off-design exit flow. Pressure loss
increases from 5.4 (baseline) to 6.5% (SWP) and 7.3% (SWL) on average. The profile has smoother characteristics compared to the baseline. The increased mixing with applied swirl is illustrated by
with an increased level in the main annulus. The RIDN air remains close to the endwall for the baseline inflow. This agrees with the observation by Werschnik et al. [
20] of reduced endwall film cooling effectiveness with applied swirl.
The loss structure of the trailing slot ejection is no longer dominating in the contour. Instead, for SWL clocking, the peak for
is observed at 80 to 90% span height (labeled “5” in
Figure 12). It is a result of a vortex that develops due to the radial
gradient at the turbine inlet. At the LE, this gradient triggers a secondary flow feature: the swirler causes positive incidence near the casing and negative incidence near the hub and thereby the stagnation line moves. A span-wise pressure gradient results and causes the vortex to travel towards the casing, as illustrated by Jacobi et al. [
7]. Contrary to Jacobi’s experiment, a radial
gradient with a central annulus minimum at the turbine inlet is also observed for SWP clocking at the LE. Consequently, the vortex and loss core is also observed for SWP inflow (
Figure 13, label “3”). The global
minimum passes the NGV row relatively unchanged and is detected as a pressure loss at 65 to 75% span height, labeled “4” in
Figure 13 in accordance with Andreini et al. [
30].
5.2. Propagation of Coolant Flows
Because of the baseline measurements, the wheel space purge flow was only expected up to a limited span height and only the lower half of the annulus was studied to reduce measurement time. Both for SWP and SWL clocking, the CAV-seeding reveals a propagation of wheel space purge flow only to the lower 6% span height of the main annulus. This is slightly increased, compared to the baseline. The level at similar span height is also slightly increased. The shape of the distribution remains similar, with increased span height and level in the passage center.
For RIDN-seeding, the coolant is observed to propagate to similar span height positions as for the baseline. It is, however, mixed to a greater extent with a more homogenous distribution in the main annulus. Unlike before, the coolant is not observed to accumulate in the stator wake in such a distinct way but is distributed more homogeneously in the lower third of the annulus. This is observed for both clocking positions in a similar manner.
The swirling inflow favors mixing of the coolant and main flow: for example, the position of the trailing edge wake is hardly visible anymore and the level is so low that the contour is compromised by the measurement accuracy of the technique. The TE-flow is observed with a higher level below the annulus mid span. This is a result of the TE-flow coolant plenum supply: the vane coolant flows are fed from the casing side, entering through a relatively small tube. Therefore, a static pressure gradient is measured in the plenum, with higher pressure towards the hub side. This, in conjunction with the radial static pressure gradient with lower values near the hub in the main flow, favors an increased slot ejection at lower span height. Again, for both clocking positions, the observations are similar, with greater differences between both measurement passages for SWL clocking.
None of the coolant flows is accumulated in regions “3”, “4” and “5”. Therefore, it can be verified that these losses originate from the swirler inflow and not from any coolant flow.
6. Measurement Uncertainty
The uncertainty surrounding the gas concentration measurements has been assessed by a Gaussian error propagation method. The accuracy of the gas analyzers was specified to 1% of the measurement range by the manufacturer. This yields a relative accuracy of greater than 20%, dominated by the low concentration level. The technique is therefore only suitable to assess the qualitative distribution.
Other factors that may influence the signal reading are, for example, the ambient temperature in the test cell and the sampling flow rate. They could not be assessed quantitatively, but great care was taken to keep their influence unchanged during all measurement runs. In addition, the gas analyzers have been calibrated before each measurement day using a test gas to overcome a potential gain shift.
The 10 channel probe can only be aligned with the averaged flow direction. Therefore, when high radial or whirl angles occur, the recorded data might be compromised. To assess this aspect, the probe was installed at a free stream wind tunnel and total pressure measurements were conducted with all ten positions. Probe inflow angles of less than 10, as they are observed during the measurements, were determined as being insignificant for a correct reading and hence it is assumed that the sampled CO concentration is not compromised either.
7. Conclusions
The influence of the combustor exit flow on the NGV row has been examined in the LSTR. The study gives insight into the complex flow field of a fully-cooled vane row featuring RIDN endwall cooling, airfoil cooling and trailing edge ejection as well as NGV-rotor wheel space purge flow. Associated flow features and pressure losses are identified and their origin specified.
The RIDN coolant injection influences the vane flow field significantly and causes additional loss in the passage flow while reducing losses at the hub. Additional loss is observed at up to 57% span height for MFR 5. A flow model has been developed with a vortex triggered by the RIDN injection that is washed up the pressure side and also carries part of the TE-flow into the passage.
The experiments have been accompanied by a numerical simulation with good agreement of the results. The use of a scalar-tracking method allows the identification of the cooling contribution of individual coolant holes. The CFD validates the flow model presented based on the measurement results.
The combustor outflow is responsible for off-design exit flow with underturning near both endwalls and increased turning in the center due to the imposed mass flow redistribution. Pressure loss increases from 5.4 to 6.5% (SWP) and 7.3% (SWL) in the NGV exit flow and is not dominated by the stator wake anymore. Instead, additional losses are observed. A clocking influence is detected as the peak pressure loss is transported further towards the casing for SWL clocking. Mixing of RIDN and main flow is increased with applied swirl, and between 3% and 4% higher levels are measured in the lower half of the main annulus at the same MFR. It could be assessed that the additional losses originate from the interaction of the swirler outflow with the vane row and not from the coolant flow interaction.
Acknowledgments
The work reported was partly funded within the framework of the “AG Turbo” by the Federal Republic of Germany, Ministry for Economic Affairs and Energy, according to a decision of the German Bundestag (FKZ: 03ET2013K) as well as by Rolls-Royce Deutschland GmbH and Ansaldo Energia. Their technical and financial support is appreciated.
Author Contributions
Holger Werschnik, Janina Herrmann and Heinz-Peter Schiffer conceived and designed the experiments; Marius Schneider and Dimitri Ivanov conducted the numerical simulations; Holger Werschnik and Janina Herrmann performed the experiments and analyzed the data; Christoph Lyko contributed resources and input from Rolls-Royce Deutschland; Holger Werschnik and Marius Schneider wrote the paper.
Conflicts of Interest
Rolls-Royce Deutschland and Ansaldo Energia as funding sponsors provided input into the general scope of interest in the study and the decision to publish the results. They had no direct role in the collection, analysis or interpretation of data.
Nomenclature
| Latin | |
| c | Concentration [ppm] |
| heat capacity at constant pressure [J/(kgK)] |
| C | Chord length [mm] |
| CAV | Wheel space purge flow |
| CFD | Computational Fluid Dynamics |
| D | Cooling hole diameter [mm] |
| h | Channel height [m] |
| k | Thermal conductivity [W/(mK)] |
| Lewis number [kg/s] |
| LSTR | Large Scale Turbine Rig |
| LE/TE | Leading Edge / Trailing Edge |
| Mass flow [kg/s] |
| M | Blowing ratio [-] |
| Mach number [-] |
| ME | Measurement plane |
| MFR | Mass flow ratio [%] |
| NGV | Nozzle Guide Vane |
| P | Pressure [Pa] |
| Turbulent Prandtl number [-] |
| PS/SS | Pressure Side/Suction Side |
| RIDN | Rear inner discharge nozzle |
| SWL/SWP | Leading edge/Passage Swirl |
| T | Temperature [K] |
| TE | Trailing edge slot injection |
| u | Velocity [m/s] |
| 5HP | Five Hole probe |
| Greek | |
| Whirl angle [] |
| Diffusivity [m/s] |
| Boundary layer thickness [mm] |
| Mixing effectiveness / Film cooling eff. [-] |
| Vorticity [1/s] |
| Pressure loss coefficient [-] |
| Eddy viscosity [m/s] |
| Density [kg/m] |
| Passive scalar [-] |
| Subscripts | |
| ax | axial |
| aW | adiabatic wall |
| c | RIDN coolant flow property |
| inlet | Turbine Inlet |
| ME0i | Referring to plane i |
| mix | Mixed out |
| probe | Probe measurement value |
| rel | Relative |
| s | Static quantity |
| t | Stagnation quantity |
| tc | Test cell |
| ∞ | Main flow property |
References
- Lazik, W.; Doerr, T.; Bake, S.; van de Bank, R.; Rackwitz, L. Development of Lean-Burn Low-NOx Combustion Technology at Rolls-Royce Deutschland. In Proceedings of the ASME Turbo Expo 2008: Power for Land, Sea, and Air, Berlin, Germany, 9–13 June 2008; pp. 797–807. [Google Scholar]
- Schmid, G. Effects of Combustor Exit Flow on Turbine Performance And Endwall Heat Transfer; Forschungsberichte aus dem Institut für Gasturbinen, Luft- und Raumfahrtantriebe; Shaker: Aachen, Germany, 2015; Volume 2. [Google Scholar]
- Turrell, M.D.; Stopford, P.J.; Syed, K.J.; Buchanan, E. CFD Simulation of the Flow Within and Downstream of a High-Swirl Lean Premixed Gas Turbine Combustor. In Proceedings of the ASME Turbo Expo 2004: Power for Land, Sea, and Air, Vienna, Austria, 14–17 June 2004; pp. 31–38. [Google Scholar]
- Klapdor, E.V. Simulation of Combustor-Turbine Interaction in a Jet Engine. Ph.D. Thesis, Technische Universität Darmstadt, Darmstadt, Germany, 2011. [Google Scholar]
- Schmid, G.; Krichbaum, A.; Werschnik, H.; Schiffer, H.P. The Impact of Realistic Inlet Swirl in a 1.5 Stage Axial Turbine. In Proceedings of the ASME Turbo Expo 2014, Dusseldorf, Germany, 16–20 June 2014; p. V02CT38A045. [Google Scholar]
- Qureshi, I.; Smith, A.D.; Povey, T. HP Vane Aerodynamics and Heat Transfer in the Presence of Aggressive Inlet Swirl. J. Turbomach. 2013, 135, 021040. [Google Scholar] [CrossRef]
- Jacobi, S.; Mazzoni, C.; Chana, K.; Rosic, B. Investigation of Unsteady Flow Phenomena in First Vane Caused by Combustor Flow with Swirl. In Proceedings of the ASME Turbo Expo 2016: Turbomachinery Technical Conference and Exposition, Seoul, South Korea, 13–17 June 2016; p. V02DT44A028. [Google Scholar]
- Cha, C.M.; Hong, S.; Ireland, P.T.; Denman, P.; Savarianandam, V. Experimental and Numerical Investigation of Combustor-Turbine Interaction Using an Isothermal, Nonreacting Tracer. J. Eng. Gas Turbines Power 2012, 134, 081501. [Google Scholar] [CrossRef]
- Butler, T.; Sharma, O.P.; Joslyn, H.D.; Dring, R.P. Redistribution of an inlet temperature distortion in an axial flow turbine stage. J. Propuls. Power 1989, 5, 64–71. [Google Scholar] [CrossRef]
- Schrewe, S. Experimental Investigation of the Interaction between Purge and Main Annulus Flow upstream of a Nozzle Guide Vane in a Low Pressure Turbine. Ph.D. Thesis, Technische Universität Darmstadt, Darmstadt, Germany, 2014. [Google Scholar]
- Feiereisen, J.; Paolillo, R.; Wagner, J. UTRC turbine rim seal ingestion and platform cooling experiments. In Proceedings of the 36th AIAA/ASME/SAE/ASEE Joint Propulsion Conference and Exhibit, Las Vegas, NV, USA, 24–28 July 2000. [Google Scholar]
- Lefrancois, J.; Boutet-Blais, G.; Dumas, G.; Krishnamoorthy, V.; Mohammed, R.; Yepuri, G.B.; Felix, J.; Caron, J.F.; Marini, R. Prediction of Rim Seal Ingestion. In Proceedings of the International Symposium on Air Breathing Engines 2011 (ISABE 2011), Gothenburg, Sweden, 12–16 September 2011; American Institute of Aeronautics and Astronautics (AIAA): Reston, VA, USA, 2011. [Google Scholar]
- Boutet-Blais, G.; Lefrancois, J.; Dumas, G.; Julien, S.; Harvey, J.F.; Marini, R.; Caron, J.F. Passive Tracer Validity for Cooling Effectiveness Through Flow Computation in a Turbine Rim Seal Environment. In Proceedings of the ASME 2011 Turbo Expo: Turbine Technical Conference and Exposition, Vancouver, BC, Canada, 6–10 June 2011; pp. 821–831. [Google Scholar]
- Thole, K.A.; Sinha, A.K.; Bogard, D.G.; Crawford, M.E. Mean Temperature Measurements of Jets with a Crossflow for Gas Turbine Film Cooling Application. In Rotating machinery–Transport phenomena, Proceedings of the 3rd International Symposium on Transport Phenomena and Dynamics of Rotating Machinery (ISROMAC-3), Honolulu, HI, USA, 1–4 April 1990; Hemisphere Publishing: New York, NY, USA; pp. 69–85.
- Jones, T.V. Theory for the use of foreign gas in simulating film cooling. Int. J. Heat Fluid Flow 1999, 20, 349–354. [Google Scholar] [CrossRef]
- Thomas, M.; Povey, T. A novel scalar tracking method for optimising film cooling systems. Proc. Inst. Mech. Eng. A J. Power Energy 2015, 230, 3–15. [Google Scholar] [CrossRef]
- Krichbaum, A.; Werschnik, H.; Wilhelm, M.; Schiffer, H.P.; Lehmann, K. A Large Scale Turbine Test Rig for the Investigation of High Pressure Turbine Aerodynamics and Heat Transfer with Variable Inflow Conditions. In Proceedings of the ASME Turbo Expo 2015, Montreal, QC, Canada, 15–19 June 2015; p. V02AT38A032. [Google Scholar]
- Werschnik, H.; Krichbaum, A.; Schiffer, H.P.; Lehmann, K. The Influence of Combustor Swirl on Turbine Stator Endwall Heat Transfer and Film Cooling Effectiveness in a 1.5-Stage Axial Turbine. In Proceedings of the 22nd International Symposium on Air Breathing Engines 2015 (ISABE 2015), Phoenix, AZ, USA, 25–30 October 2015. [Google Scholar]
- Werschnik, H.; Steinhausen, C.; Schiffer, H.P. Robustness of a Turbine Endwall Film Cooling Design to Swirling Combustor Inflow. AIAA J. Propuls. Power 2017, 33, 917–926. [Google Scholar] [CrossRef]
- Werschnik, H.; Hilgert, J.; Wilhelm, M.; Bruschewski, M.; Schiffer, H.P. Influence of Combustor Swirl on Endwall Heat Transfer and Film Cooling Effectiveness at the Large Scale Turbine Rig (LSTR). J. Turbomach. 2017, 139, 181007. [Google Scholar] [CrossRef]
- Hilgert, J.; Bruschewski, M.; Werschnik, H.; Schiffer, H.P. Numerical Studies on Combustor-Turbine Interaction at the Large Scale Turbine Rig (LSTR). In Proceedings of the ASME Turbo Expo 2017, Charlotte, NC, USA, 26–30 June 2017; p. V02AT40A028. [Google Scholar]
- Wilhelm, M.; Schmidt, M.; Schiffer, H.P.; Lyko, C. Influence of Combustor Swirl on Turbulence at the Large Scale Turbine Rig (LSTR). In Proceedings of the 23rd International Symposium on Air Breathing Engines 2017 (ISABE 2017), Manchester, UK, 3–8 September 2017. [Google Scholar]
- Klinger, H.; Lazik, W.; Wunderlich, T. The Engine 3E Core Engine. In Proceedings of the ASME Turbo Expo 2008: Power for Land, Sea, and Air, Berlin, Germany, 9–13 June 2008; pp. 93–102. [Google Scholar]
- Gupta, A.K.; Lilley, D.G.; Syred, N. Swirl Flows; Energy and Engineering Science Series; Abacus Press: Kent, UK, 1985. [Google Scholar]
- Centaur. CENTAUR Hybrid Grid Generator v11.0.1. Available online: https://www.centaursoft.com/ (accessed on 24 August 2017).
- CFX. Solver Theory Guide. Release 17.0; ANSYS: Canonsburg, PA, USA, 2016. [Google Scholar]
- Menter, F.R. Two-Equation Eddy-Viscosity Turbulence Models for Engineering Applications. AIAA J. 1994, 32, 1598–1605. [Google Scholar] [CrossRef]
- Thomas, M. Optimization of Endwall Film-Cooling in Axial Turbines. Ph.D. Thesis, University of Oxford, Oxford, UK, 2014. [Google Scholar]
- Vagnoli, S.; Verstraete, T. Numerical Study of the Combustor - Turbine Interaction Using Coupled Unsteady Solvers. In Proceedings of the 22nd International Symposium on Air Breathing Engines 2015 (ISABE 2015), Phoenix, AZ, USA, 25–30 October 2015. paper no. ISABE2015-20179. [Google Scholar]
- Andreini, A.; Bacci, T.; Insinna, M.; Mazzei, L.; Salvadori, S. Hybrid RANS-LES Modeling of the Aero-Thermal Field in an Annular Hot Streak Generator for the Study of Combustor-Turbine Interaction. In Proceedings of the ASME Turbo Expo 2016, Seoul, Korea, 13–17 June 2016; p. V05BT17A006. [Google Scholar]
Figure 1.
Test rig view on Rear Inner Discharge Nozzle (RIDN) coolant injection and the nozzle guide vane (NGV) row (left) and schematic of the Large Scale Turbine Rig (LSTR) swirler (right).
Figure 1.
Test rig view on Rear Inner Discharge Nozzle (RIDN) coolant injection and the nozzle guide vane (NGV) row (left) and schematic of the Large Scale Turbine Rig (LSTR) swirler (right).
Figure 2.
Measurement locations for flow tracing. The reference measurement position in the main flow (blue) and secondary flow (red) are illustrated. The 10-channel sampling probe head is shown on the right.
Figure 2.
Measurement locations for flow tracing. The reference measurement position in the main flow (blue) and secondary flow (red) are illustrated. The 10-channel sampling probe head is shown on the right.
Figure 3.
Five hole probe (5HP) results for axial (AX) inflow, mass flow ratio (MFR) 3 in NGV exit plane ME02.
Figure 3.
Five hole probe (5HP) results for axial (AX) inflow, mass flow ratio (MFR) 3 in NGV exit plane ME02.
Figure 4.
Flow tracing MFR 3, propagation of the coolant flows.
Figure 4.
Flow tracing MFR 3, propagation of the coolant flows.
Figure 5.
Flow tracing, varied MFR, trailing edge (TE) seeding.
Figure 5.
Flow tracing, varied MFR, trailing edge (TE) seeding.
Figure 6.
Film cooling effectiveness on the leading edge due to RIDN injection, varied MFR.
Figure 6.
Film cooling effectiveness on the leading edge due to RIDN injection, varied MFR.
Figure 7.
Comparison of circumferentially, area-averaged mixing effectiveness of measurements and Computational Fluid Dynamics (CFD) in ME02.
Figure 7.
Comparison of circumferentially, area-averaged mixing effectiveness of measurements and Computational Fluid Dynamics (CFD) in ME02.
Figure 8.
Comparison of flow tracing MFR 3 (left) and CFD predictions (right) of the propagation of the RIDN coolant flows.
Figure 8.
Comparison of flow tracing MFR 3 (left) and CFD predictions (right) of the propagation of the RIDN coolant flows.
Figure 9.
Model of RIDN coolant flow features: (left) RIDN flow evokes vortex (label Ⓐ) at the leading edge, that carries coolant flow up on the pressure side surface and is also fed by trailing edge flow coolant (label Ⓑ). The coolant accumulates in the pressure side corner due to the high momentum (label Ⓑ); (right) Comparison with CFD predictions of coolant flow from a single RIDN hole in front of the vane leading edge.
Figure 10.
Turbine inlet plane, ME01, passage oriented swirl (SWP) inflow, contour for MFR 3.
Figure 10.
Turbine inlet plane, ME01, passage oriented swirl (SWP) inflow, contour for MFR 3.
Figure 11.
Pitch-wise area-averaged whirl angles and axial Mach numbers for both inlet (ME01) and exit flow (ME02); and -profile in ME02. All shown for MFR 3.
Figure 11.
Pitch-wise area-averaged whirl angles and axial Mach numbers for both inlet (ME01) and exit flow (ME02); and -profile in ME02. All shown for MFR 3.
Figure 12.
NGV exit plane, SWL, MFR 3, CAV-/RIDN-/TE-seeding and loss contours from 5HP measurements. Arrows indicate the swirler core position.
Figure 12.
NGV exit plane, SWL, MFR 3, CAV-/RIDN-/TE-seeding and loss contours from 5HP measurements. Arrows indicate the swirler core position.
Figure 13.
NGV exit plane, SWP, MFR 3, CAV-/RIDN-/TE-seeding and loss contours from 5HP measurements. Arrows indicate the swirler core position projected in the flow direction.
Figure 13.
NGV exit plane, SWP, MFR 3, CAV-/RIDN-/TE-seeding and loss contours from 5HP measurements. Arrows indicate the swirler core position projected in the flow direction.
Table 1.
Coolant injection parameters.
Table 1.
Coolant injection parameters.
| Parameter | Case 1 | Case 2 | Case 3 | Case 4 |
|---|
| MFR (%) | 0 | 1.5 | 3 | 5 |
| M (-) | - | 1.7 | 3.5 | 5.9 |
Table 2.
Mesh Quality Parameters.
Table 2.
Mesh Quality Parameters.
| Number of Cells | Prism Layers | Y+ | Min. | Percentage of Cell Angles <50 |
|---|
| Vane | Holes | Endwalls | Avg. | Max. | Cell Angles |
|---|
| 33 M | 10 | 10 | 15 | 1.65 | 9.78 | 4.5 | 1% |
© 2017 by the authors. Licensee MDPI, Basel, Switzerland. This article is an open access article distributed under the terms and conditions of the Creative Commons Attribution (CC BY-NC-ND) license (https://creativecommons.org/licenses/by-nc-nd/4.0/).


