Article

Topological Signature of 19th Century Novelists: Persistent Homology in Text Mining

by
Shafie Gholizadeh
*,†,
Armin Seyeditabari
and
Wlodek Zadrozny
Department of Computer Science, UNC Chatlotte, Charlotte, NC 28223, USA
*
Author to whom correspondence should be addressed.
Current address: Department of Computer Science, University of North Carolina at Charlotte, Charlotte, NC 28223, USA.
Big Data Cogn. Comput. 2018, 2(4), 33; https://doi.org/10.3390/bdcc2040033
Submission received: 23 September 2018 / Revised: 8 October 2018 / Accepted: 15 October 2018 / Published: 18 October 2018
(This article belongs to the Special Issue Big Data and Cognitive Computing: Feature Papers 2018)

Abstract

:
Topological Data Analysis (TDA) refers to a collection of methods that find the structure of shapes in data. Although recently, TDA methods have been used in many areas of data mining, it has not been widely applied to text mining tasks. In most text processing algorithms, the order in which different entities appear or co-appear is being lost. Assuming these lost orders are informative features of the data, TDA may play a significant role in the resulted gap on text processing state of the art. Once provided, the topology of different entities through a textual document may reveal some additive information regarding the document that is not reflected in any other features from conventional text processing methods. In this paper, we introduce a novel approach that hires TDA in text processing in order to capture and use the topology of different same-type entities in textual documents. First, we will show how to extract some topological signatures in the text using persistent homology-i.e., a TDA tool that captures topological signature of data cloud. Then we will show how to utilize these signatures for text classification.

1. Introduction

A common approach in Topological Data Analysis (TDA) is to capture the shape or the underlying structure of shapes in data. Using topology in data science is mostly new, though computational topology and computational geometry existed in applied mathematics for many years. Only recently, TDA has been considered as an alternative to the conventional machine learning algorithms. Specifically, TDA is been considered to deal with high-dimensional noisy data sets. Here the common approach is to capture the shapes as the main characteristics of data and dismiss the rest as noise or irrelevant information. New contributions on TDA often target clustering, dimensionality reduction or descriptive modeling. In other word, wherever the shape and/or the structure of shapes in data is worth-full, TDA may provide reasonable solutions.
TDA methods have not been widely applied to natural language processing and subsequently text mining. There is no evidence to believe this is due to the weakness of topology in text processing. Of course it is not easy to define meaningful shapes in textual documents. But still, it may address some the challenges in text mining. The majority of algorithms in text processing and information retrieval are based on bag of words models which would not consider the order of tokens and the flow of language. There have been efforts in traditional machine learning to include the order information in feature selection step, e.g., by including parts of speech tags or parts of the parse tree. But still these ideas are not enough to capture the real value of orders in the text. Thus, there is still a huge gap between the capability of current text mining algorithms and the importance of order in text documents. This is exactly where topological data analysis may help. It can be useful to design more efficient order-preserving algorithms in text analysis.
Here we introduce a novel algorithm that hires TDA tools for text classification. We will show how the value of the orders (topology of words) in the text may play a role in classification tasks. To evaluate the capabilities of our idea, we use a set of different long novels by different novelists, we look for the topological features in the graph of main characters (persons) in each novel. Such graphs are constructed only based on the positions each character is appearing in a novel. For each novel, such a graph is actually a context-free product of the main characters. It measures only the co-appearance of characters though the novel and contains no additional information regarding each character. Then comparing with the other graphs of novels by different novelists, we will try to predict the author. Obviously, this is a metaphoric problem statement. Nevertheless, the results might be extended to more applied problems in different applications of text processing. But even before that, it is important to show that the topological signatures exists in the text. Also it is important to show these signatures are worth of extracting. Thus, we need a reliable answer to the metaphoric problem statement as the proof of concept. We see our contributions as follow: (a) examining the feasibility of TDA in text processing; (b) providing a framework to extract topological features without using bag-of-words models; and (c) investigating how the topological features in a document may serve as the fingerprint of the writer.

2. Background

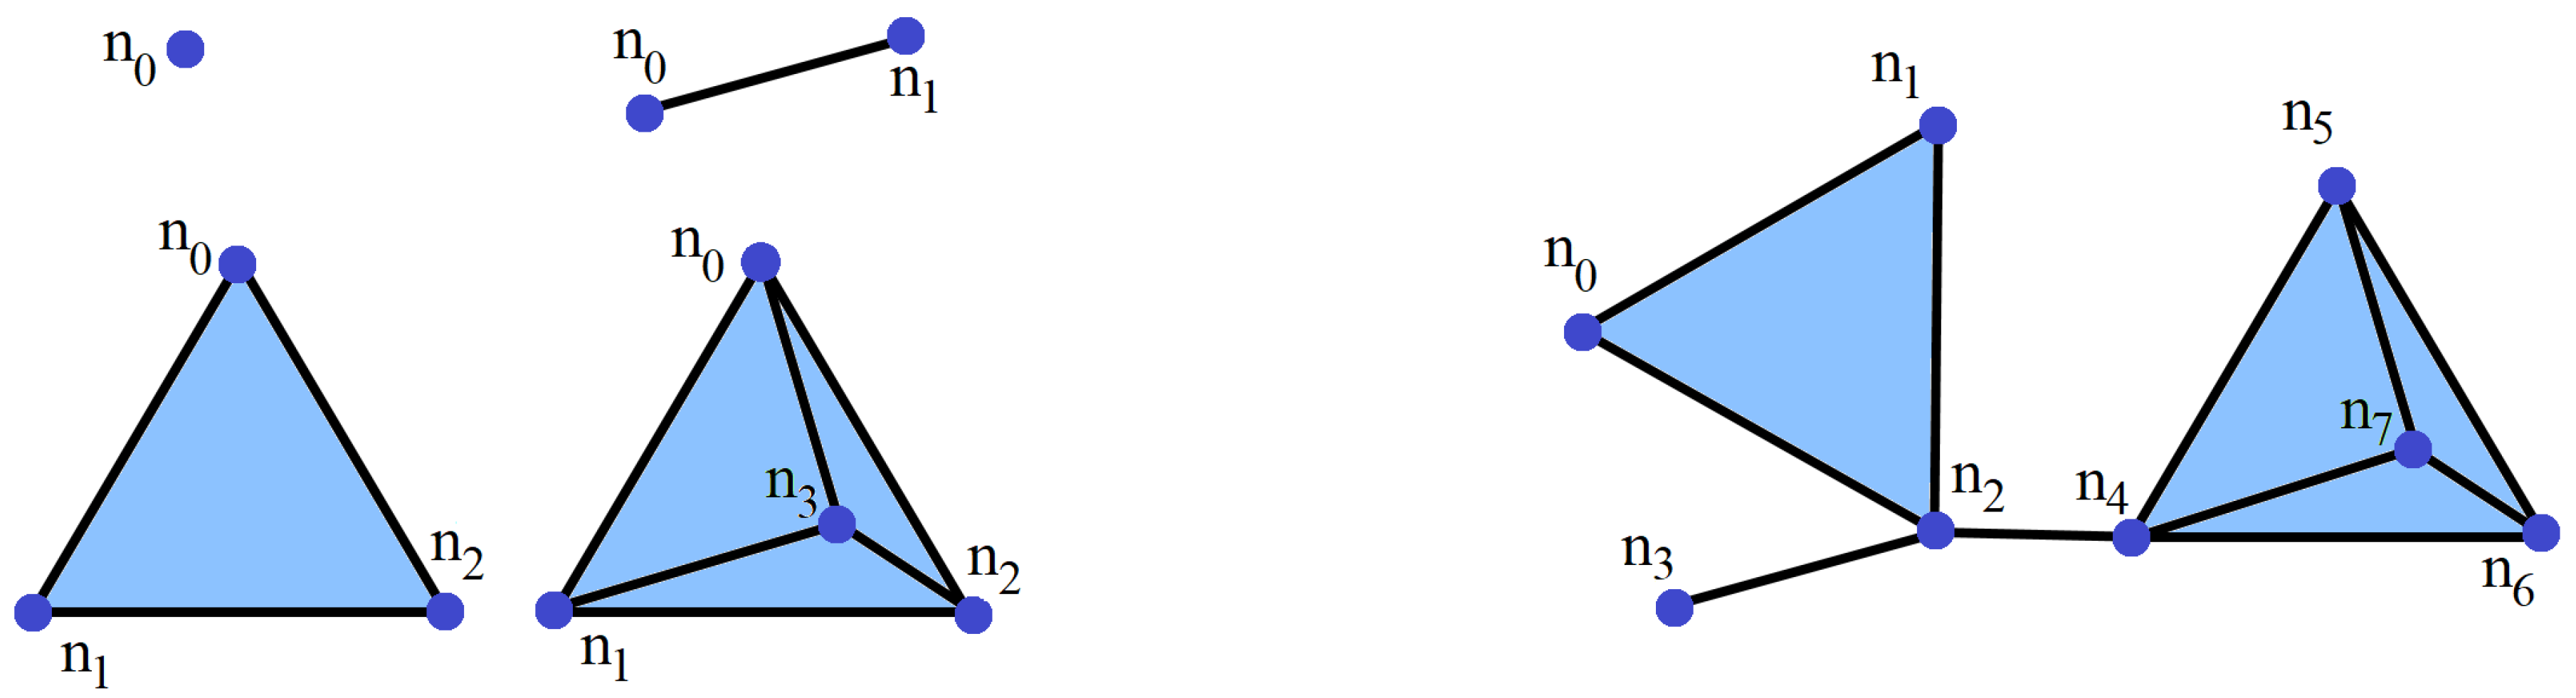
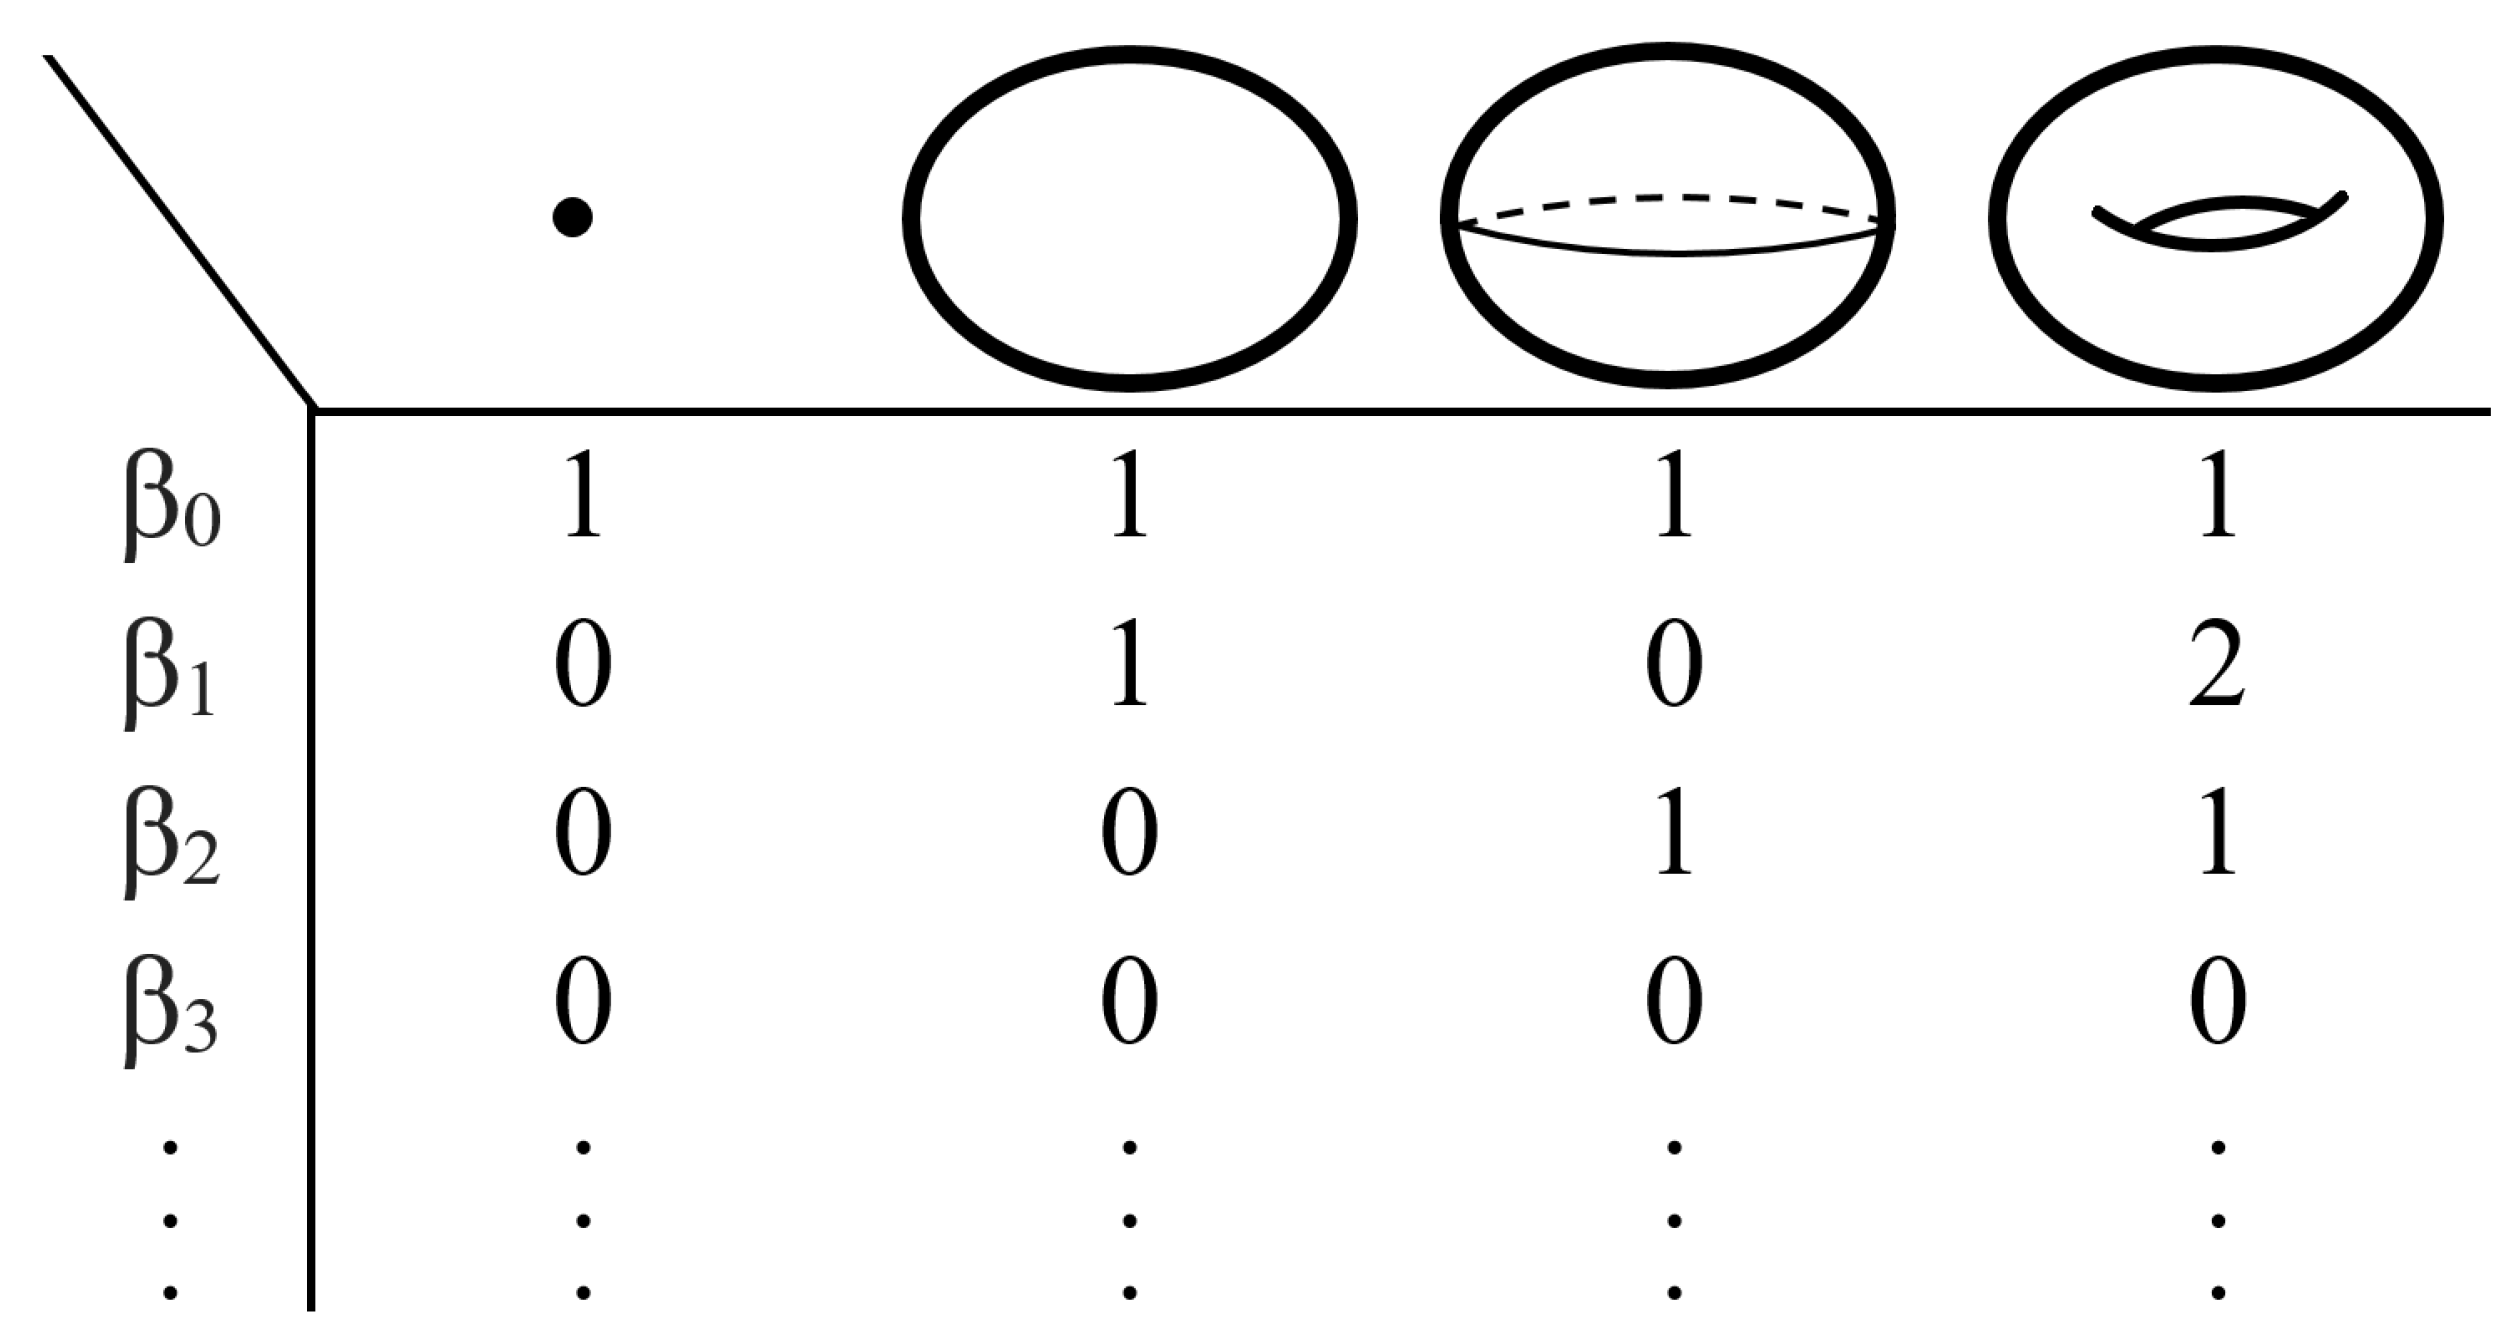
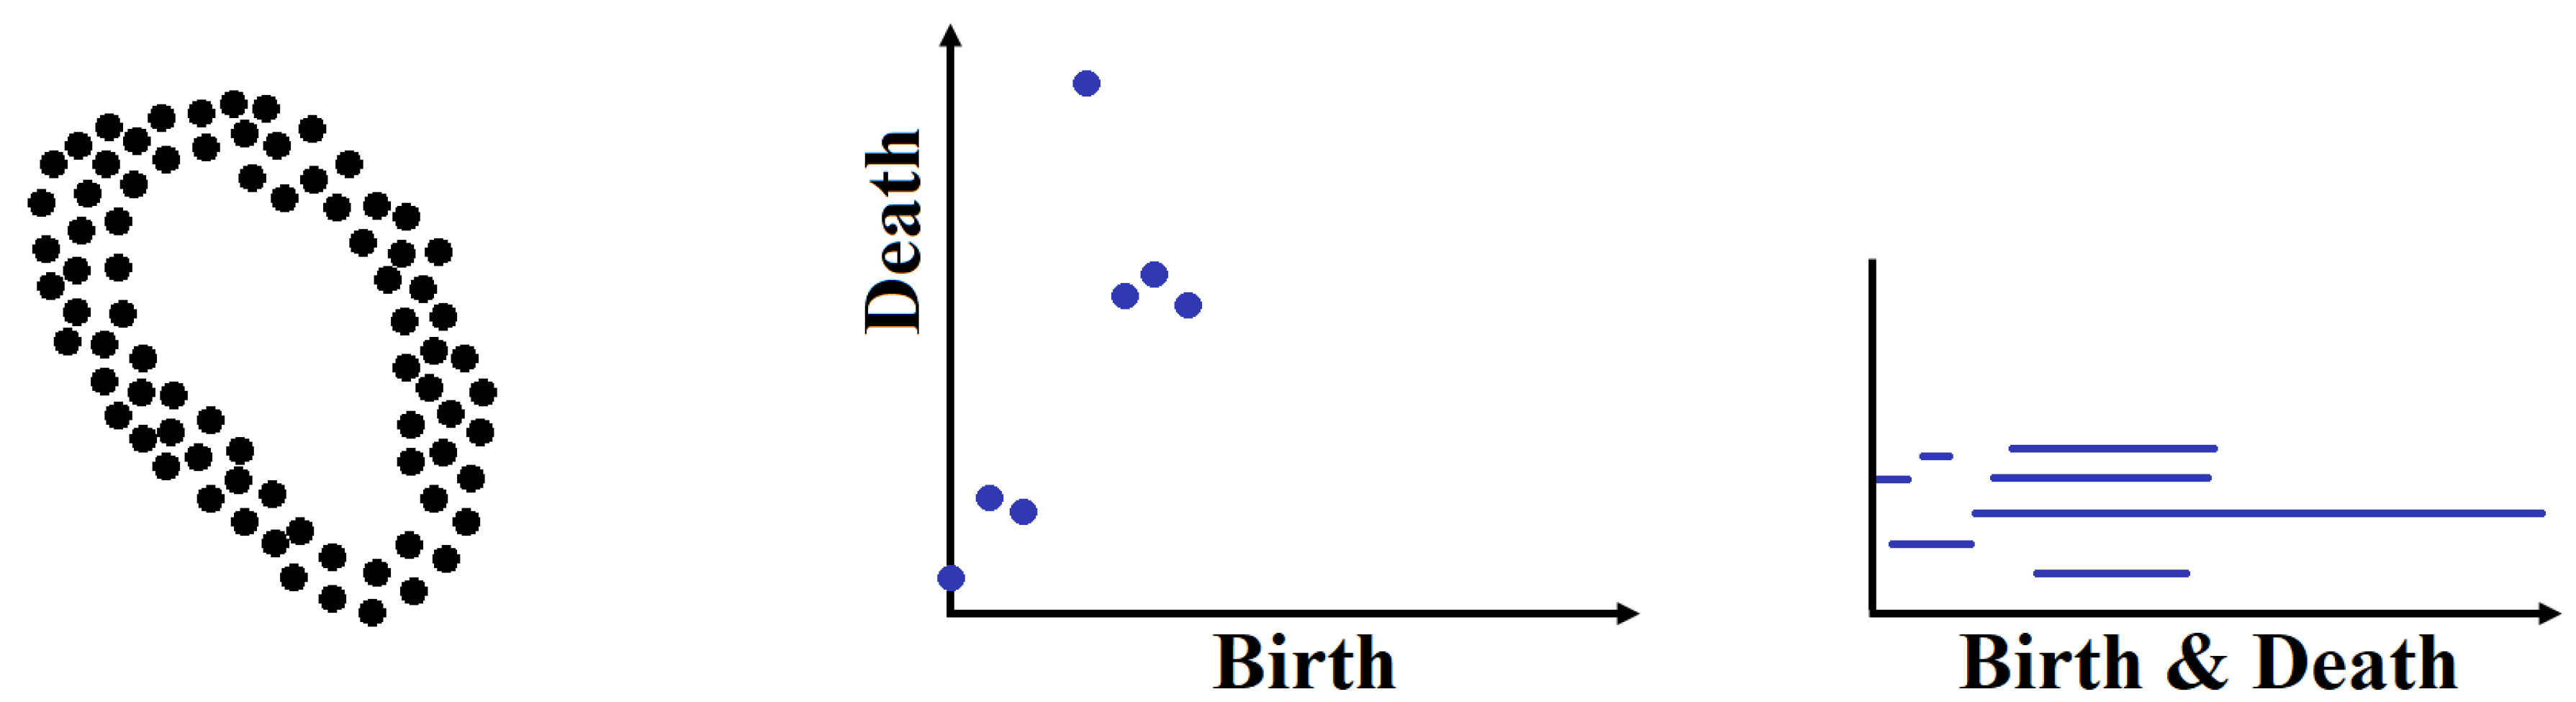
2.1. Fundamental Definitions

In topological data analysis, data cloud is often viewed in the form of Simplicial Complexes. Here a Simplex may denote to a single data point (0-simplex), a line between two data point (1-simplex), a triangle (2-simplex), etc. Generally, a subset consisted of ( k + 1 ) data point is called an k-simplex. Additionally, ( 1 ) -simplex describes an empty set [1]. A simplicial complex is a set of the simplices. Any subset of a simplex in the simplicial complex is also in the simplicial complex. A few instance of k-simplices and an example of a simplicial complex is shown in Figure 1.
In data science, high dimensional data sets often come in the form of data cloud, a large set of data points in high-dimensional space. Thus, we need some techniques to translate these records into a meaningful topological structure, similar to the visual interpretation that makes a set of close yet discrete points meaningful (e.g., distinguishing a continues shape out of discrete points). The technique to do this procedure in TDA is called Persistent Homology [2,3,4,5]. Note that Homology refers to the set of holes in the shape at each dimension. One may measure these holes in the terms of Betti numbers. These numbers keep all topological properties of a shape, while they contain no additional geometric characteristics. The ith Betti number is defined as the number of i-dimensional holes a in simplicial complex [2,6]. More specifically, β 0 is the number of connected component, β 1 is number of 1-D holes and β 2 is the number of 2-D voids, etc. Betti numbers for some topological shapes are shown in Figure 2. In our study we only focus on β 0 and β 1 , i.e., number of components and number of loops respectively.
Persistent homology is a tool in topological data analysis that captures topological signature of data cloud. Decreasing the spatial resolution, one may connect all data points that are close enough to each other. This way they may construct a loop. Finally, these data points get closer to each other and a subset of k different points may get close enough to each other to be assumed as a k-simplex which contains no loop (no hole). We may require each two point in the simplex to be in a fixed range (radius) of each other. Increasing this radius gradually, many loops (or equivalently holes) may appear and disappear in each dimension. The persistence diagram captures the birth and the death of all holes in a certain dimension [2]. Alternatively, the birth and the death of holes can be shown with barcodes where the lifetime of holes are being captured and plotted in one dimensional bars [7,8]. An example of these barcodes is shown in Figure 3. Here the information structure based on thresholding distances is called Rips Filtration [9]. In Rips complex, any k-simplex is consisted of k nodes whose pairwise distance is less than or equal to the threshold. Decreasing spatial resolution implies that the playground is Euclidean distance, while we may easily replace it with other metrics. Nonetheless, many different popular filtrations in TDA usually follow the same logic. For a comprehensive review of the concepts in TDA, we will refer the reader to [4,6,10].

2.2. Related Work

Wagner et al. in [11] used flag complex over vector space representation of corpus to compute similarities among documents. The authors mostly focused on efficiency of computing homology on high-dimensional sparse matrices in text mining. They proposed a novel path: using cosine distance as the distance measure, thresholding the distance and decreasing the threshold gradually to detect all the complete sub-graphs (called cliques) in the resulted graph. A flag complex is the set of all complete sub-graphs of the graph. Here, discrete Morse theory was used to compress the Flag complexes and compute Betti numbers.
Zhu in [12] introduces a new application of persistent homology in text mining and suggested a novel text representation. The methodology begins with dividing a document to a fixed number of different blocks of text, calculating a vector representation for each block (tf-idf). Then an undirected graph is being constructed based on cosine similarity of each two blocks. Each block is presented as a node. Moreover, if and only if the cosine similarity between two block is more than a certain threshold, an edge between the corresponded nodes will represent their relation. Decreasing the threshold from zero to the global maximum of similarities, one can quantify the changes on the resulted graph via persistent homology. The author focused in β 0 and β 1 only to study the number of clusters and holes. Intuitively, number of holes (or equivalently number of loops) is a good sign of “tie-back” in the document and the persistence diagram or barcode of β 1 may reveal it. Obviously, here the information structure (called Similarity Filtration) follows the same logic as Rips filtration, considering angular distance of nodes (text blocks) as the metric. Since this method ignores the order of blocks in the document, the author tries to inject the order into the model assuming there should exist an edge between each pair of subsequent text blocks, no matter what the threshold is. This assumption forces the model always to consider the order of text blocks. This modified filtration is called Similarity Filtration with Time Skeleton (SIFTS). The method is applied on nursery rhymes as ideal repetitive documents and in contrast some other stories. SIFTS was also applied on a set of writings consisted of two major groups, child-writing and adolescent-writing. Since the significance difference between the groups might be the result of larger writings in the adolescent group, the process was repeated in this group with the truncated version of writings of appropriate length. The difference in the number of holes was still significant, though the smallest angular threshold for the appearance of holes was not anymore significantly different in the groups. Doshi and Zadrozny in [13] utilized SIFTS for movie genre detection on the IMDB data set of movie plot summaries. The authors showed how persistent homology can significantly improve the classification results and concluded that it TDA can be a reliable tool for discourse classification.
Guan et al. in [14] proposed an unsupervised method of key-phrase extraction that prunes the semantic graph of candidate phrases via homology analysis. Usually in document summarizing for clustering, classification or information retrieval, a relatively large set of candidate phrases is being pruned and sorted by ranks based on supervised approaches. The authors constructed the graph of candidate phrases by connecting the phrases that share at least a certain portion of common tokens (words). Then a topological collapsing algorithm [15] is used to remove dominated vertices iteratively. Note that a vertex v i is dominated by v j if and only if the set of v i ’s neighbors is a subset of the set of v j ’s neighbors. Intuitively, if all the neighbors of a vertex (phrase) are connected to another vertex, we may assume the latter phrase can explain the same concept better or at least no worse. The author evaluated the method on SemEval-2010 data set Corpus and NUS corpus and reported higher performance (precision, recall and F 1 ) than the traditional methods.
Almgren et al. in [16] discussed the feasibility of TDA for social network analysis. More specifically, the authors utilized persistent homology for image popularity prediction. They used Word2Vec to convert the captions of random images from Instagram to 300 dimensional numeric vectors and calculated the cosine similarities among those vectors. Then the authors used Mapper algorithm [17] to cluster the images. They reported a monotonic increase in the ratio of popularity over the cluster. In their extended study [18] they formulated the problem statement as predicting images’ popularity and reported that TDA outperforms conventional clustering algorithms such as k-means and hierarchical clustering.
There are a few other works in which topological data analysis has been applied to natural language processing and text mining. Chiang in [19] suggested that quantifiers over simplicial complex stand as an efficient and effective clustering algorithm for high dimensional data such as vector space representation of a corpus. Torres-Tramón et al. in [20] developed a topic detection method in Twitter data. The authors hired Mapper algorithm to map the vector space (i.e., term frequency matrix) to a sequence of graph representations. Then the most frequent features in the most connected components are retrieved as the best candidates to be interesting topics. Zadrozny and Garbayo in [21] introduced a sheaf model to distinguish contradictions and disagreements among textual documents. They assumed that underlying theories in documents may have shared quantifiers and predicates which can construct partial orders (a sheaf model). In such partial orders, the global sections and local sections will determine the level of disagreement.
In the few instances where persistent homology has being utilized for text mining, the topology is defined over vector space (bag-of-words) representation. Yet in textual documents, there exist some other features to feed into the persistent homology. These features may provide the information that is not reflected in bag-of-words products. In this paper, we take a different approach that ignores vector space representation. Potentially, another advantage is that once the topological features are extracted independently from bag-of-words products, there is a higher chance that they carry some additive information. This is particularly important when one tries to extend the framework of this paper to a hybrid model which considers topological and non-topological features simultaneously.

3. Methodology

More than the any text processing literature, our work is inspired by the recent developments on the application of TDA in time series analysis [22,23,24,25,26]. In these works usually persistent homology is hired to study the changes in the topology of d-dimensional time series or the delay embedding of 1-dimensional time series. In many of these studies, if we replace a time series (a sequence of data) with a long text document (another sequence of data), the idea still might be valid, though the application has changed. Recall that even in the first attempt to apply TDA in the area of natural language processing [12], Zhu tries to consider the order of text blocks, though the defined order is simply injected to the model. Still the main idea of using TDA to capture “the order” in the text is quite novel. Looking at text documents as the sequences of different entities may enable us to capture the ordered appearances and more importantly co-appearances of implied or directly mentioned entities (e.g., names, topics, etc.). This is where TDA may play a role as the interpreter of ordered data. Moreover, the same techniques as in topological signal processing are applicable here.
To provide an example of how TDA may capture the order in the text documents, we chose 75 novels from Gutenberg Project by six novelists of the romanticism era in nineteenth century. We propose a novel method that uses persistent homology to predict the author only based on the graph of the main characters in the novel. The list of authors and the number of books that we used from each one can be seen in Table 1. For each book we downloaded the text version, and removed extra information such as metadata and the table of content. To extract the appearance of characters through the novel, we used Stanford CoreNLP API’s [27] named entity recognizer (NER). The books were split by sentence, tokenized, and annotated with named entity tags. Then we extracted each entity tagged as “PERSON” with its position in the book based on its order in the list of all tokens in the document. Through this process we created a list associated to each book consisting of every character in the novel and the place that they appeared in the book in order of appearance. To reduce the noise, we kept only the indices of 10 most important (i.e., the most frequent) characters in each novel.
To define the distance between two characters in a novel (e.g., character A and character B), we use the set of indices in the novel where each of them appear. Let I denote the corresponding indices for character A and J denote the corresponding indices for character B. In Equation (1), assuming m n , to have an equal number of indices, we use a subset of indices in J. Let J * denote to the chosen indices of J.
I = ( i 1 , i 2 , , i n ) J = ( j 1 , j 2 , , j m ) J * = ( j 1 * , j 2 * , , j n * )
In the algorithm to choose J * elements, we try to minimize the distance between the elements of I and J * in the similar positions as in Equation (2). Here the constraint guarantees that exactly n unique indices are being chosen from J.
j x * = argmin j y | j y i x | x { 1 , , n } , y { 1 , , m } j x * j t * t { 1 , , ( x 1 ) }
Now we can define the distance between character A and character B as in Equation (3). Here I ˜ and J ˜ are the normalized version of I and J * respectively, where each element in I and J * is divided by the novel length, i.e., total number of words in the novel. We use the expanded or contracted versions of I ˜ and J ˜ where each of their elements is raised to the power of p—that would be I ˜ ( p ) and J ˜ ( p ) respectively. In the equation, W D 0.5 is Wasserstein distance of order 0.5 . Note that for t = 0 the function measures the distance between the original vectors I ˜ and J ˜ . The order 0.5 pushes the function to be more sensitive to the closer element-wise distances. In addition, using different values for parameter t enables us to focus on closer characters at the beginning of the novel ( t > 0 ) or closer characters at the end of the novel ( t < 0 ). This may reveal different topological signature of each novelist.
D i s t a n c e t ( A , B ) = W D 0.5 ( I ˜ ( 1 + t ) , J ˜ ( 1 + t ) )
Using pair-wise distances among characters in each novel, we utilized Rips filtration and constructed the persistence diagrams for each novel. For each novel, using three different choices of t ( t = 0 , ϵ , a n d + ϵ ) may consider different scenarios and cover almost all the topological characteristics for any choice of t. In practice, we used ϵ = 0.1 and for each novel constructed three persistence diagrams based on distances defined in Equation (3). For persistence diagrams and quantify over them we used R package T D A [28]. Some samples of persistence diagrams (where t = 0 ) are shown in Figure 4.
Having the persistence diagrams for all the novels, each time we select two novelists and calculate the distances among all the novels we have for those two novelists. To quantify the difference between each pair of novels, we can simply use their persistence diagrams. To measure the difference between two persistence diagrams, we used Wasserstein distance [29] of order one at dimension one and dimension zero. Then the distance between two novels (e.g., X and Y) is defined by Equation (4). As mentioned before, we have three different persistence diagrams each novel based on three different choices of t. Also, each of these diagrams covers two dimensions 1 and 0. Let P D t 1 and P D t 0 denote the persistence diagrams based on the distances with parameter t at dimension 1 and 0 respectively. In other word, P D t 1 only considers loops and P D t 0 only considers components. Then let W D denote the Wasserstein distance of order one between two persistence diagrams.
D i s t a n c e t ( X , Y ) = W D { P D t 0 ( X ) , P D t 0 ( Y ) } + W D { P D t 1 ( X ) , P D t 1 ( Y ) } D i s t a n c e ( X , Y ) = { t { ϵ , 0 , + ϵ } D i s t a n c e t ( X , Y ) 2 } 1 2

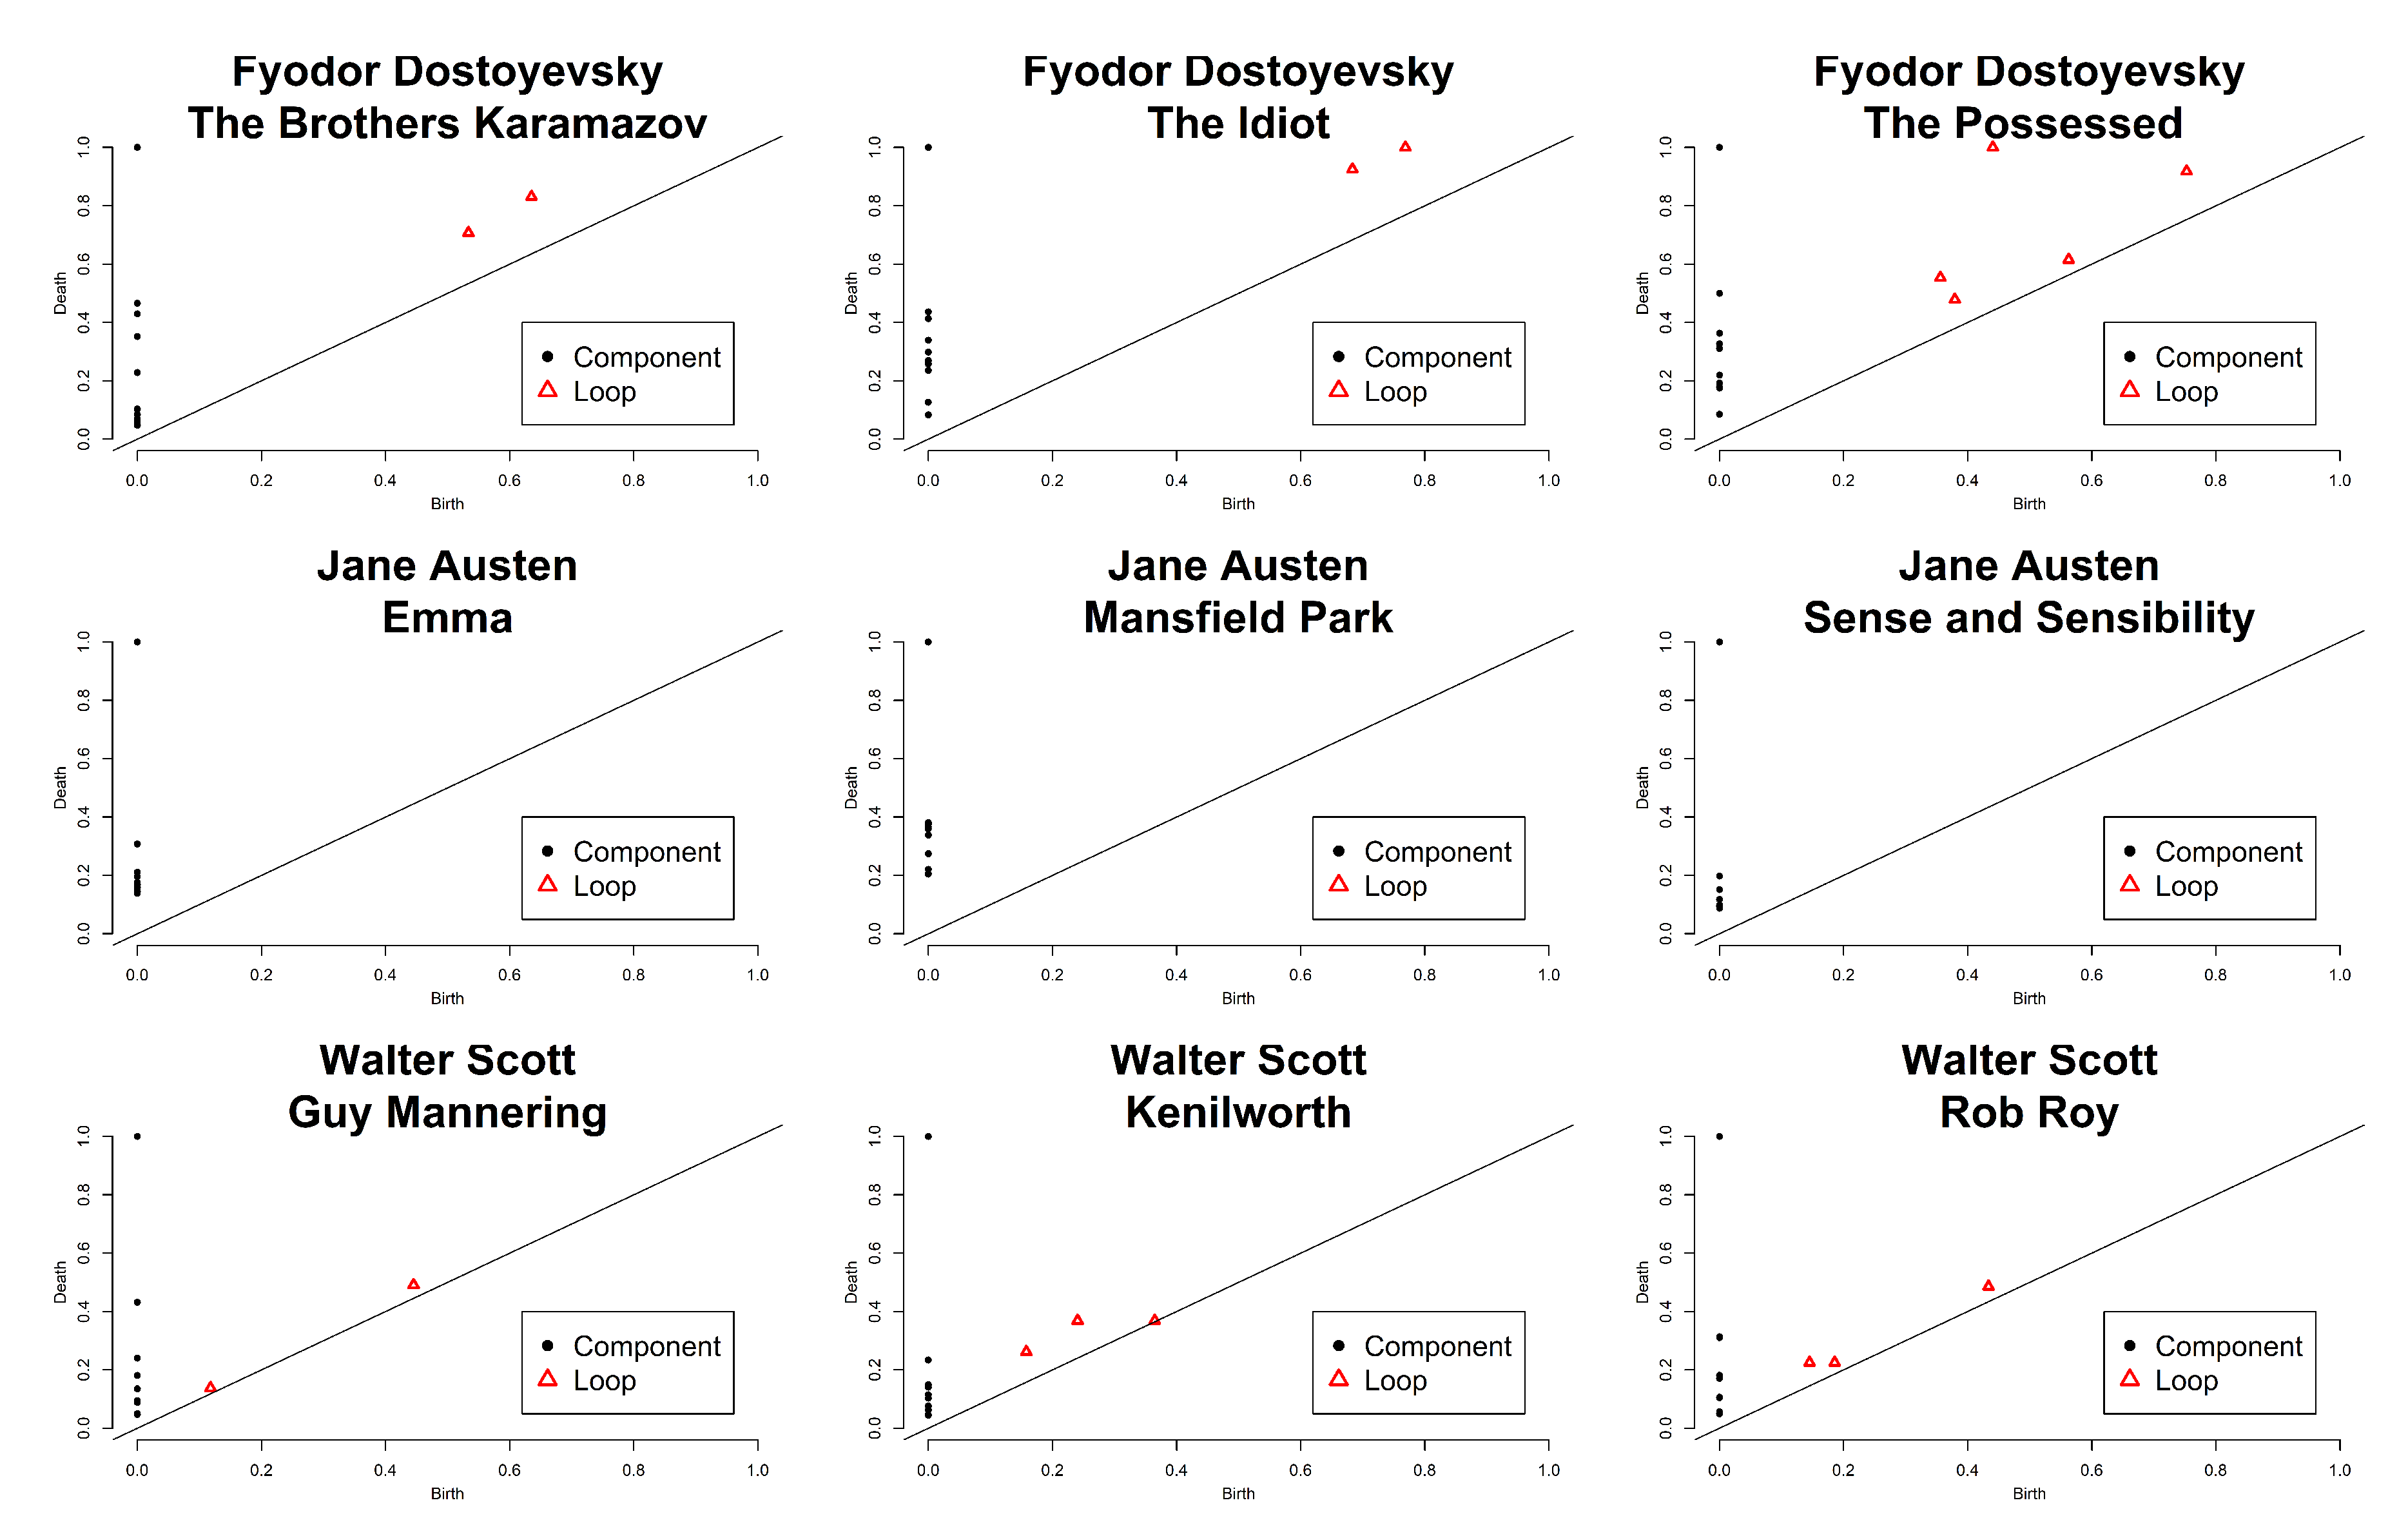
4. Results and Discussion

We used a 5-Nearest Neighbors (5-NN) algorithm in 10-fold cross validation mode to predict the authors of the novels. Note that we used balanced subsets of novels for cross validation. Since we had different number of novels for each novelist, for binary classification of novels by each pair of novelists, we used a relatively large number of iterations ( n = 250 ). In each iteration a sample of novels by the novelist who had more novels was randomly chosen to get a balanced set of novels (where the class ratio is set to one). Then we used the balanced set for the 10-fold cross validation. It means that if the accuracy is significantly higher than 50%, we can conclude that the persistence diagrams are informative and have captured some fingerprints of the novelists. The choice of 5 for nearest neighbors comes from our initial experiments. In our 5-NN algorithm, we set the weight for the vote of each neighbor inversely proportional to the square of its distance. Intuitively, we may be unable to consider a lifelong writing style for a writer. However, it is a safe assumption that novelists usually repeat the style of one particular novel in a few other novels. So, the algorithm is capable of providing valid neighbors. Note that here the style only refers to the relation among novel characters. Table 1 shows the accuracy of each binary classification task in percentages. For the total number of around 69,000 predictions on our small data set of 75 novels, the average accuracy was 77.0 % . As suggested in Table 1 sometime it is easy to distinguish between the topological signatures of writers, e.g., Dostoyevsky vs. Austin. On the other hand, in some cases two different writers may have similar signatures, e.g., Dostoyevsky vs. Scott as it is shown in Figure 4.
We did not use Co-reference Resolution for the entity detection task in our work. We believe that the state of the art in co-reference resolution is not helpful enough to be hired in our algorithm. Note that for a character in a novel, we retrieved only a portion of appearance indices since we lost many of co-references. As a result, in our entity detection for each entity (i.e., character) the precision is substantially higher than the recall. This is exactly why we chose not to use any co-reference resolution algorithm. Our method is extremely more sensitive to the precision than the recall in entity detection phase. Wherever an entity is indirectly implied (e.g., by a pronoun or etc.), there is a high probability that the same entity (character) is directly mentioned a few lines before or even after that. Recall that an advantage of topology is that it is not much sensitive to the choice of metrics. In other word, small changes in the distances only affect geometric properties that are not much useful for our study. Note that for co-reference resolution tools usually precision is higher than recall [30]. Still, a co-reference resolution algorithm even with the accuracy of around 90 % may easily harm our model since for each entity, the precision of entity detection will decrease, the distance functions may experience a huge shift, and eventually the topological signature will be lost.
Here we discuss the existence of topological signature in the text. We chose a metaphoric example to show how these signatures may be extracted from the novels. But, the question is whether we can extend the results to some more applied areas. Even if the answer is yes, still there might be some concern about the computational cost which is beyond the scope of this research. Last but not least, in the terms of accuracy for some applications, these topological features might be substantially weaker than those features that traditional text processing provides. But intuitively, these features may still carry some additive information that is lost in traditional text mining. Thus, one opportunity is to use topological features in addition to the other features. It sounds reasonable at least when the computational cost is not a major matter of concern.

5. Conclusions

As we have shown in our results, a topological signature of writer exists in the writing. For our contribution, we only worked on names (the characters in the novel) and used a context-free graph of the temporal relations between them to capture the topological features of interest. The novel algorithm we used is by definition robust to translation and even to the length of text documents. However, the accuracy is not high enough to use the algorithm directly for a real world application. Yet, the existence of topological signature in the context-free graph is much more important than the accuracy itself in this particular task. Choosing different model parameters or definitions of distance functions may improve the accuracy of this algorithm. But, there are also other dimensions that may improve our algorithm. One may use other features (e.g., topics, concepts, parts of speech, etc.) in addition to the persons to get into a more precise algorithm. The other possibility is to use topological features as the additional variables (in addition to the other features) to run a model.

Author Contributions

conceptualization, S.G. and W.Z.; methodology, S.G. and W.Z.; software, S.G. and A.S.; validation, S.G., A.S. and W.Z.; formal analysis, S.G. and W.Z.; investigation, S.G. and W.Z.; resources, S.G. and W.Z.; data curation, S.G. and A.S.; writing—original draft preparation, S.G. and A.S.; writing—review and editing, S.G. and W.Z.; visualization, S.G.; supervision, W.Z.

Funding

This research received no external funding.

Conflicts of Interest

The authors declare no conflict of interest.

Abbreviations

The following abbreviations are used in this manuscript:
TDATopological Data Analysis
NERNamed Entity Recognizer
SIFTSSimilarity Filtration with Time Skeleton
k-NNk-Nearest Neighbors

References

  1. Zomorodian, A. Computational topology. In Algorithms and Theory of Computation Handbook; Chapman & Hall/CRC: London, UK, 2010; pp. 3.3–3.4. [Google Scholar]
  2. Edelsbrunner, H.; Letscher, D.; Zomorodian, A. Topological persistence and simplification. In Proceedings of the 41st Annual Symposium on Foundations of Computer Science, Redondo Beach, CA, USA, 12–14 November 2000; pp. 454–463. [Google Scholar] [Green Version]
  3. Carlsson, G. Topology and data. Bull. Am. Math. Soc. 2009, 46, 255–308. [Google Scholar] [CrossRef] [Green Version]
  4. Edelsbrunner, H.; Harer, J. Persistent homology-a survey. Contemp. Math. 2008, 453, 257–282. [Google Scholar]
  5. Chen, L.M.; Su, Z.; Jiang, B. Mathematical Problems in Data Science; Springer: Berlin, Germany, 2015. [Google Scholar]
  6. Zomorodian, A.; Carlsson, G. Computing persistent homology. Discret. Comput. Geometry 2005, 33, 249–274. [Google Scholar] [CrossRef]
  7. Collins, A.; Zomorodian, A.; Carlsson, G.; Guibas, L.J. A barcode shape descriptor for curve point cloud data. Comput. Graph. 2004, 28, 881–894. [Google Scholar] [CrossRef] [Green Version]
  8. Carlsson, G.; Zomorodian, A.; Collins, A.; Guibas, L.J. Persistence barcodes for shapes. Int. J. Shape Model. 2005, 11, 149–187. [Google Scholar] [CrossRef]
  9. Ghrist, R. Barcodes: The persistent topology of data. Bull. Am. Math. Soc. 2008, 45, 61–75. [Google Scholar] [CrossRef]
  10. Munch, E. A user’s guide to topological data analysis. J. Learn. Anal. 2017, 4, 47–61. [Google Scholar] [CrossRef]
  11. Wagner, H.; Dłotko, P.; Mrozek, M. Computational topology in text mining. In Computational Topology in Image Context; Springer: Berlin, Germany, 2012; pp. 68–78. [Google Scholar]
  12. Zhu, X. Persistent Homology: An Introduction and a New Text Representation for Natural Language Processing. In Proceedings of the International Joint Conference on Artificial Intelligence (IJCAI), Beijing, China, 3–9 August 2013; pp. 1953–1959. [Google Scholar]
  13. Doshi, P.; Zadrozny, W. Movie Genre Detection Using Topological Data Analysis. In Proceedings of the International Conference on Statistical Language and Speech Processing (SLSP), Mons, Belgium, 15–16 October 2018; pp. 117–128. [Google Scholar]
  14. Guan, H.; Tang, W.; Krim, H.; Keiser, J.; Rindos, A.; Sazdanovic, R. A topological collapse for document summarization. In Proceedings of the 2016 IEEE 17th International Workshop on Signal Processing Advances in Wireless Communications (SPAWC), Edinburgh, UK, 3–6 July 2016; pp. 1–5. [Google Scholar]
  15. Wilkerson, A.C.; Moore, T.J.; Swami, A.; Krim, H. Simplifying the homology of networks via strong collapses. In Proceedings of the 2013 IEEE International Conference on Acoustics, Speech and Signal Processing (ICASSP), Vancouver, BC, Canada, 26–31 May 2013; pp. 5258–5262. [Google Scholar]
  16. Almgren, K.; Kim, M.; Lee, J. Mining Social Media Data Using Topological Data Analysis. In Proceedings of the 2017 IEEE International Conference on Information Reuse and Integration (IRI), San Diego, CA, USA, 4–6 August 2017; pp. 144–153. [Google Scholar]
  17. Singh, G.; Mémoli, F.; Carlsson, G.E. Topological methods for the analysis of high dimensional data sets and 3d object recognition. In Proceedings of the Fourth IEEE/Eurographics Symposium on Point-Based Graphics (SPBG), Prague, Czech Republic, 2–3 September 2007; pp. 91–100. [Google Scholar]
  18. Almgren, K.; Kim, M.; Lee, J. Extracting knowledge from the geometric shape of social network data using topological data analysis. Entropy 2017, 19, 360. [Google Scholar] [CrossRef]
  19. Chiang, I.J. Discover the semantic topology in high-dimensional data. Expert Syst. Appl. 2007, 33, 256–262. [Google Scholar] [CrossRef]
  20. Torres-Tramón, P.; Hromic, H.; Heravi, B.R. Topic Detection in Twitter Using Topology Data Analysis. In Proceedings of the International Conference on Web Engineering, Rotterdam, The Netherlands, 23–26 June 2015; pp. 186–197. [Google Scholar]
  21. Zadrozny, W.; Garbayo, L. A Sheaf Model of Contradictions and Disagreements. Preliminary Report and Discussion. arXiv, 2018; arXiv:1801.09036. [Google Scholar]
  22. Pereira, C.M.; de Mello, R.F. Persistent homology for time series and spatial data clustering. Expert Syst. Appl. 2015, 42, 6026–6038. [Google Scholar] [CrossRef] [Green Version]
  23. Khasawneh, F.A.; Munch, E. Stability determination in turning using persistent homology and time series analysis. In Proceedings of the ASME 2014 International Mechanical Engineering Congress and Exposition, Montreal, QC, Canada, 14–20 November 2014. [Google Scholar]
  24. Perea, J.A.; Harer, J. Sliding windows and persistence: An application of topological methods to signal analysis. Found. Comput. Math. 2015, 15, 799–838. [Google Scholar] [CrossRef]
  25. Maletić, S.; Zhao, Y.; Rajković, M. Persistent topological features of dynamical systems. Chaos Interdiscip. J. Nonlinear Sci. 2016, 26, 053105. [Google Scholar] [CrossRef] [PubMed] [Green Version]
  26. Stolz, B.J.; Harrington, H.A.; Porter, M.A. Persistent homology of time-dependent functional networks constructed from coupled time series. Chaos Interdiscip. J. Nonlinear Sci. 2017, 27, 047410. [Google Scholar] [CrossRef] [PubMed] [Green Version]
  27. Manning, C.D.; Surdeanu, M.; Bauer, J.; Finkel, J.; Bethard, S.J.; McClosky, D. The Stanford CoreNLP Natural Language Processing Toolkit. In Proceedings of the Association for Computational Linguistics (ACL) System Demonstrations, Baltimore, MD, USA, 22–27 June 2014; pp. 55–60. [Google Scholar]
  28. Fasy, B.T.; Kim, J.; Lecci, F.; Maria, C. Introduction to the R package TDA. arXiv, 2014; arXiv:1411.1830. [Google Scholar]
  29. Edelsbrunner, H.; Harer, J. Computational Topology: An Introduction; American Mathematical Society: Providence, RI, USA, 2010. [Google Scholar]
  30. Benatallah, B.; Venugopal, S.; Ryu, S.H.; Motahari-Nezhad, H.R.; Wang, W. A systematic review and comparative analysis of cross-document coreference resolution methods and tools. Computing 2017, 99, 313–349. [Google Scholar]
Sample Availability: All books used in this study were retrieved from project Gutenberg and are in US public domain. All the codes for this study are available through this link: https://github.com/shervin821/Novels_TDA.git.
Figure 1. 0-simplex, 1-simplex, 2-simplex and 3-simplex (left). An example of simplicial complex (right).
Bdcc 02 00033 g001
Figure 2. Betti numbers for a single point, a circle, sphere and a torus. In a k-dimensional space, nth Betti number is always zero for any n k .
Bdcc 02 00033 g002
Figure 3. A simple data cloud (left) with its persistence diagram at dimension one the illustrates the birth and the death of loops (middle) and equivalent representation of barcode (right).
Bdcc 02 00033 g003
Figure 4. Persistence diagrams of the graphs of characters in different novels.
Bdcc 02 00033 g004
Table 1. Average Accuracy of binary classification, having a labeled set of novels by two novelists and using 10-fold cross validation. The numbers in parentheses are the total number of novels for each novelist. The accuracy values are in percentages.
Charles DickensÉmile ZolaFyodor DostoyevskyJane AustenMark TwainWalter Scott
(17)(18)(8)(6)(8)(18)
C. Dickens-87.072.2100.074.673.9
É. Zola87.0-65.064.268.883.3
F. Dostoyevsky72.265.0-90.273.355.8
J. Austen100.064.290.2-82.994.7
M. Twain74.668.873.382.9-68.5
W. Scott73.983.355.894.768.5-
Average81.573.771.386.473.675.2

