Big Data and Business Analytics: Trends, Platforms, Success Factors and Applications


Department of Computer Science, Ebonyi State University, P.M.B 053, Abakaliki 480214, Nigeria
*
Author to whom correspondence should be addressed.
Big Data Cogn. Comput. 2019, 3(2), 32; https://doi.org/10.3390/bdcc3020032
Submission received: 4 April 2019
/
Revised: 31 May 2019
/
Accepted: 5 June 2019
/
Published: 10 June 2019
Abstract
:Big data and business analytics are trends that are positively impacting the business world. Past researches show that data generated in the modern world is huge and growing exponentially. These include structured and unstructured data that flood organizations daily. Unstructured data constitute the majority of the world’s digital data and these include text files, web, and social media posts, emails, images, audio, movies, etc. The unstructured data cannot be managed in the traditional relational database management system (RDBMS). Therefore, data proliferation requires a rethinking of techniques for capturing, storing, and processing the data. This is the role big data has come to play. This paper, therefore, is aimed at increasing the attention of organizations and researchers to various applications and benefits of big data technology. The paper reviews and discusses, the recent trends, opportunities and pitfalls of big data and how it has enabled organizations to create successful business strategies and remain competitive, based on available literature. Furthermore, the review presents the various applications of big data and business analytics, data sources generated in these applications and their key characteristics. Finally, the review not only outlines the challenges for successful implementation of big data projects but also highlights the current open research directions of big data analytics that require further consideration. The reviewed areas of big data suggest that good management and manipulation of the large data sets using the techniques and tools of big data can deliver actionable insights that create business values.
1. Introduction
In the late 1980s, data warehouse technology, which is generally categorized as online analytical processing (OLAP) was introduced by the relational database management system (RDBMS) companies to support the business decision and business intelligence. It was originally designed to archive large amounts of data out of production databases and to keep them lean and mean for good performance. In data warehousing, multiple copies of data are located on multiple database servers referred to as data mart. The data mart can be independent or an enterprise data mart. From there, data is then extracted and loaded into two analytical data marts. Here, the data analysts create their algorithms to run their jobs. One of the data marts links to a statistical analyst and the other to a business user. While data warehouse has not failed in creating business value through detailed reporting based on complex statistical modeling [1,2], it is challenging to continuously move data over the network and takes a long time to yield results [3]. Furthermore, there are limitations in the data volume that can be stored on the system. In addition, current data creation is continuously generated, thereby making it difficult to process big data. Big data has garnered lots of attention recently in government, industries, sciences, engineering, healthcare and medicine, finance and prominently in businesses [4]. Accordingly, data generated in these areas are characterized by high volume, inability to be categorized into the relational database management system and the data are generated, captured and processed rapidly [1]. Therefore, the major challenges facing various organizations, industries, and other business sectors are how to design appropriate techniques to handle and process this large volume of data to ensure effective and efficient decision-making.
Recently, big data and business analytics approaches have been developed and implemented to analyze a large volume of data generated by different business organizations. Consequently, every business needs faster insight into growing volumes of transactional data. Analyzing data in real time helps organizations view the past and foresee the future. This is the beauty of streaming analytics and is endowed by knowing what occurred (descriptive), understanding why it happened (diagnostic), looking ahead to what might take place (predictive) and, ultimately, determining how to influence future occurrences (prescriptive). These four analytics flavors which are explained in Section 3 of this article have huge business benefits but are progressively more difficult to implement and use. The big data opportunity is not only for achieving high efficiency in business operations. There are also important opportunities for economic growth and improving the standard of living to the society. There are various ways in which big data analytics can improve business organizational outputs and industries. These include improved health care delivery, the standard of education, national security, and enable good governance [5,6]. In addition, it has potential to assist policy-makers to gain insight in enabling policies that will grant safe playground for investors, help waste managers find the type of waste that is more generated from a particular locality and provide insight for sharing of waste collection material. Moreover, education monitoring agency can deploy big data and business analytics approaches to evaluate the performance of teachers and improve work attitude. Furthermore, mobile network location data can be used for traffic management to prevent traffic jams in big cities or better plan the public transport system.
The goal of this study is to implement a comprehensive investigation into big data and business analytics methods for improved business decision making, technological approaches, applications, and open research challenges. Furthermore, the study attempts to draw attention to the tremendous benefits big data has brought to companies in developed countries and how these can be replicated by indigenous business organizations. Moreover, the study discusses various challenges facing big data analytics with a focus on data security, management, characteristics, regulation, and compliances.
The phenomenon of big data analytics researches and implementation have been conducted by various researchers and industries for over a decade. This is due to the vital applications of big data in various areas such as the healthcare system, business decision-making, educational development, network optimization, travel estimation, and financial services. Therefore, quite a number of studies and reviews have been published in big data analytics, implementations and related technologies in recent time. Sing et al. [7] reviewed hardware and software parameters for effective big data analytics developments. Additionally, Hashem et al. [4] presented taxonomy and intersection of cloud computing and big data analytics. However, these studies focused on big data in cloud computing, software and hardware parameters such as data availability, scalability, and data size for implementation of big data analytics. The studies failed to discuss important big data analytics tools, their strengths, and weaknesses. Recently, reviews on big data analytics, open sources tools for big data implementation and iterative clustering algorithms for big data analysis were presented by [8,9,10]. Tsai et al. [8] outlined big data analytics approaches in terms of data mining and knowledge discovery. The authors primarily discussed data mining algorithm that can be extended for big data analytics. Nonetheless, challenges, applications, current tools and data sources for big data analytics were not comprehensively discussed. Lanset et al. [9] presented open sources tools for big data analytics, their advantages and drawbacks.
However, the review is narrowed only to tools while other criteria for effective big data implementation were not sufficiently covered. A closely related survey was presented recently by Mohammedi et al. [11] and discussed big data technologies, applications and opens source tools for big data analytics. Conversely, our study differs with their review in many ways. First, the present review provides a broader view by focusing on the recent trends in big data and business analytics development. Second, we discussed platforms, opens source tools, their strengths and weaknesses. Third, this study presents big data success factors for analytic teams, their major functions, and challenges for the implementation of analytics in organizations. Fourth, the current study presents recent data sources and applications for big data and business analytics. Finally, the current review outlines and discusses open research directions in big data and analytics. The review is a timely exploration of big data and business analytics. The major differences between recent reviews and the current study are presented in Table 1 below:
The remainder of this paper is organized as follows: Section 2 discusses the recent developments in big data technologies. Section 3 presents big data analytics platforms while Section 4 explores the success factors and challenges of big data implementation. Section 5 outlines the main applications and data sources for big data and business analytics. Section 6 summarizes the study and explores open research directions. Figure 1 outlines the structure of the paper.
2. Recent Developments in Big Data Technology
Big data emerged for business with the development of social media and weblogs. This has placed basic analytics and business intelligence (BI) activity on new data sources and offers deep, real-time analytics and business intelligence with operational integration. The volume of data generated in the digital world grows exponentially and has become difficult to manage using data warehouse technology. The massive amount of raw data generated using various data sources that require big data technology for analysis have been reported by a number of studies recently [12,13]. For instance, Wal-Mart processes more than a million customer transactions hourly and stores 2.5 petabytes of customer data [14,15]. Similarly, the Library of Congress collects 235 terabytes of new data per year and stores 60 petabytes of data. Over 5.5 billion mobile phones were used in 2014; each phone creates one terabyte of call record data yearly. In the mid-2000s, International Data Corporation (IDC), a premier global market intelligent film report reveals that digital universe which was 4.4 ZB in 2003, will grow to 44 ZB by 2020 [16]. In addition, a recent study by McKinsey reveals that the pieces of content uploaded to Facebook are in the 30 billion while the value of big data for the healthcare industry is about 300 billion [12]. These growths are necessitated by technological changes, and both internal and external activities in electronic commerce (e-commerce), business operations, manufacturing, and healthcare systems. Moreover, recent development in in-memory databases has provided an increase in database performance and makes data collection through the Internet of things (IoT) and cloud computing facilities that provide persistent large-scale data storage and transformation achievable. The surge in data volume is driven by a number of technologies, which include:
- Distributed computing: Big data in large-scale distributed computing systems, which is based on open-source technology, are providing direct access and long-term storage for petabytes of data while powering extreme performance.
- Flash memory in solid-state drives allows computers to become universal. It delivers random-access speeds of less than 0.1 milliseconds unlike disk access of 3 to 12 milliseconds. There is a high possibility that future big data solutions will use a lot of flash memory to improve access time to data [17].
- Mobile devices: Which represent computers everywhere, create much of the big data, and equally receives outputs from big data solutions.
- Cloud computing: This created an entirely new economy of computing by moving storage, databases, services, into the cloud and offers great access for rapidly deploying big data solutions.
- Data analytics: This is a multistage approach that includes data collection, preparation, and processing, analyzing and visualizing large scale data to produce actionable insight for business intelligence.
A huge percentage of these data for big data analytics is unstructured data derived from various data sources and applications such as text files, weblogs, and social media posts, emails, photo images, audio, and movie. Big data are meant to handle and manage unstructured data using key-value pairs. The concept of big data is defined by Will Dailey and Gartner [17,18]. Dailey [17] defined big data as, “a supercomputing environment engineered to parallel process compute jobs across massive amounts of distributed data for the purpose of analysis.” He viewed big data as Global Data Fabric in action and the Centerpiece for the entire biosphere of modern computing. The Global Data Fabric idea shows how big data creates strong connections among institutions and enables them to work as a team. On the other hand, Gartner [18] defined big data as data with high-volume, velocity and variety information assets that demand cost-effective, innovative forms of information processing for enhanced insight and decision-making. There are various areas that big data analytics have been actively implemented for developing effective business decision making.
For example, a solution can be developed to tie customer/merchants bank verification number (BVN) and subscriber identification module (SIM) registration details to a unique digital identity. The solution will utilize the unique digital identification number (id) and stream mobile payment transaction data through a mobile device into a big data repository. The collected data are continuously monitored and standard machine learning techniques can be applied to discover if there is an occurrence of fraudulent or false payment alert from a customer to a merchant. Such happening would trigger a warning alert that could be shared with their mobile operators, and the merchant’s bank, possibly even before the merchant releases his product. At the mobile operator end, the Sim registration record and Global Positioning System (GPS) technology can be used to create the customer’s crime chart and alert the police for the offender’s arrest. At the back end, the intelligent agent model running in the bank application would trigger a warning alert to the merchant to ignore such a transaction request.
While at the big data repository, all of this data can then be mapped to other data, such as network failure log, failed payment transaction, technology awareness data and wrong debit record. These can undergo further analysis to understand users experience and ascertain the root cause of low acceptance of mobile money by merchant across the country. The information could then be used to develop an intelligent business model and enable policy that will build merchants and customers trust for mobile money payment. This, in general, will rapidly help actualize the government initiative of a cashless society [18].
Big data are characterized by various vectors as outlined by Gartner and shown in Figure 2 below.
These vectors include volume, variety, velocity, veracity, and value. The big data volume focuses on the size of data set generated through various applications and sources and are growing at the rate of megabytes to petabytes. Variety aims at the heterogeneous nature of data that constitute big data. These include textual data, social media data, traffic information, health-related data, and other multimodal data. Velocity refers to the speed and dynamic nature of the data collection process and how to generate these data in real-time. Furthermore, veracity depicts the reliability of data sources and if the sources of data generation can be trusted. Finally, the value of big data shows the insight and hidden values that can be discovered from a large amount of dataset [4].
These vectors made it challenging for traditional data warehouse technology to handle huge data volumes of hundreds of terabytes [5,13]. Furthermore, big data is not quantifiable, not the same for all companies, and does not depict better data. There is no quantifiable amount of data that determines whether your data met some artificial thresholds. The size of big data varies from organization to organization. Bigger data is not necessarily better data, but data usually is always better than no data [19,20,21]. Accordingly, big data analytics provide hosts of great new tools including business analytics for visualizing and manipulating data insights. This makes it easy to visualize data into charts, graphs, models, and 3D. Therefore, big data analytics is a collection of tools and techniques aimed at handling a large volume of unstructured data that is beyond the capability of the traditional database system. Big data analytics solutions help the organization see changes in their business and innovate in real time [22]. Different companies have different use cases and obviously different data. A solution that works for one company may be ineffective or completely wrong for another. While it is valuable to benchmark others, it is necessary to understand the motivations that drive their technology choices and the analytics they use to capture the true sensitivity of their businesses. Replication of solution is, therefore, necessary where it makes sense, but most importantly understands your business drivers for the application of big data.
Recent analyses show that big data giants like Google, Facebook and Twitter have used big data analytics effectively. Google indexes the entire internet for rapid Google searches and was said to process 24 petabytes of data per day in 2009. It offers cloud storage (Google Drive) and big data solution with Google Big Query. Moreover, Google performs machine learning and analytics on massive data sets (think reverse image search and voice recognition). With their rapid growth, they continue to be the world’s leading search engine. On the other hand, Facebook and Twitter each store information on over a billion users. There are hundreds of millions of shares, likes, tweets, image posts, etc., a day that must be tracked. They use machine learning tools and algorithms to recommend friends and display trending topics. Their estimated revenue for 2014 was $12.5 billion, for Facebook and Twitter made $1.4 billion respectively.
Other businesses that have successfully implemented a big data analytics framework are Wal-Mart and American Express. Wal-Mart uses big data and machine learning to improve product searches and recommendations. The adoption saw its purchase completion rate increased by 10-15 percent. American Express analyzes its big data to predict customer churn and identify 24% of Australian accounts that will close within four months. Macy’s adjusts product pricing in real time for millions of items [23,24]. BancaCarige implemented IBM® DB2® Analytics Accelerator on a new IBM Enterprise® EC12 that enabled rapid query response times. This helps over 1000 business users to get fast access to vital insights. The positive results derived from big data analytics by various business organizations have seen the development of various tools to aid organizational big data analysis. In this paper, these tools are discussed in Section 4, with their strengths and weaknesses outlined to aid organizations’ choice of tools for their data analysis.
Analytics involves the use of statistical techniques (measures of central tendency, graphs, and so on), information system software (data mining, sorting routines), and operations research methodologies (linear programming) to explore, visualize, discover and communicate patterns or trends in data [25]. For example, weather measurements collected from metrological agencies can be analyzed and use to predict weather pattern. Furthermore, analysis of business data held the key to the development of successful new products. Analytics process in a big data world reveals how to tap into the powerful tool of data analytics to create a strategic advantage and identify new business opportunities. It has wide applications which include credit risk assessment, marketing, and fraud detection. There are many types of analytics approaches, and these can be categorized as:
- Descriptive analytics: This is a simple statistical technique (graph) that describes what is contained in a data set or database. Descriptive statistics, including measures of central tendency (mean, median, mode), measures of dispersion (standard deviation), charts, graphs, sorting methods, frequency distributions, probability distributions, and sampling methods. The result of this process can be used to find possible business-related opportunities. For example, the smartphone ownership bar chart can be deployed to show the number of users that own smartphones for an IT firm that wants to determine the market for their mobile payment app based on phone ownership level.
- Predictive analytics is an application of advanced statistical, information software, or operations research methods to identify predictive variables and build predictive models into a descriptive analysis. The results here predict opportunities in which the firm can take advantage to improve their products and services. For instance, multiple regression can be used to show the relationship (or lack of relationship) between ease of use, cost, and security on merchants’ acceptance of mobile money payment. Knowing that relationships exist helps explain why one set of independent variables influences dependent variables such as business performance.
- Diagnostic analytics uses the analysis of past data to ascertain the cause of certain events. Therefore, diagnostic analytics augments descriptive analytics by asking why certain events occurred using the patterns in the collected data. The diagnostic analytics process is effectively utilized in machine health monitoring and prognosis, fault detection and maintenance.
- Prescriptive analytics deploys the power of decision science, management science, and operations research methodologies (applied mathematical techniques) to make the best use of allocated resources. Resources are allocated to take advantage of the predicted opportunities. For example, a department store that has a limited advertising budget to target customers can use linear programming models and decision theory to optimally allocate the budget to various advertising media. Linear programming (a constrained optimization methodology) has been used to maximize the profit in the design of supply chains [26].
These analytic approaches can be used independently or in combination by an organization to provide information for decision making. For instance, Marist school based in the USA implemented an open source analytics platform from Pentaho to identify students who may be at risk of dropping a class and intervene in time to help them complete the course successfully. The process works by aggregating basic student data, such as GPAs, SAT scores, student’s addresses, and other demographic data, and then combine this information with course-specific data, such as how often students submit assignments and engage with instructors through online forums. The information is analyzed through predictive modeling and data mining, and the outcome presented an accurate picture of who is likely to drop a particular class. In order to assist the students at risk, prescriptive modeling is applied to give insight on how the instructors may prevent the foreseen occurrences and use an approach that will engage the class as a whole [27].
Analytics, business analytics (BA), and business intelligence (BI) are often used interchangeably in business literature and they convert data into useful information. However, they differ in purpose and methodologies used for each of the descriptive, predictive, diagnostic and prescriptive analytics. Analytics can involve any one of the four types of analytics processes. For clarity, definitions of these terms are presented below:
- Business analytics (BA): According to a recent paper [28], business analytics is beyond plain analytics. It sequentially applies a combination of descriptive (what is happening), predictive (why something is happening, what new trends may exist, what will happen next), diagnostic (why did it happen) and prescriptive analytics (what is the best course for the future) to generate new, unique and valuable information that create an improvement in measurable business performance as shown in Figure 3. Analyzed data can be sourced from business reports, database, and business data stored in the cloud. Business analytics processes include reporting results about business intelligence and in addition seeks to explain why the results occur based on the analysis.
- Business intelligence (BI): This focuses on querying and reporting and can include reported information from a business analytics (BA) approach. Moreover, business intelligence seeks to answer questions such as what is happening now and where, and also what business actions are needed based on prior experience.
In the past, business analytics and business intelligence were used for structured DBMS-based content to report and understand what happened in the past [28]. With the growth of big data, they can be used alongside big data analytics techniques to provide opportunities for extracting actionable insight from data by using analytical processes and tools. Their implementation is seen in structured data analytics, text analytics, web analytics, network analytics, and mobile analytics [29,30]. Moreover, the volume and velocity of big data present an opportunity to use big data and analytical tools to predict the future and make new discoveries [31].
Business demand for business analytics and business intelligence has been demonstrated by a number of studies as shown in recent studies [32,33]. Moreover, successful business intelligence and analytics applications have also been reported in a broad range of industries, from health care and airlines to major IT and telecommunication firms [34].
Most successes recorded by organizations that deploy big data analytics are largely noticed in developed countries. This is perhaps why huge successes have not been seen for businesses in a developing country. International Data Corporation (IDC) in 2011 showed that business analytics was second Information Technology (IT) priorities for large enterprises that year [35]. An online survey conducted by [29] asserted that among 930 businesses across the globe in various industries, provides insight into the current state of business analytics in today’s organization. The research findings highlighted the fact that most organizations still rely on traditional technology and depend on spreadsheets for business analytics. There is moderate growth in the use of business analytics within companies. Nonetheless, it is narrowly used within departments or business units, and not integrated across the organization. For some organizations, analytics are used as part of the decision process at varying levels. In addition, organizations are in search of analytics that will primarily help in reducing costs, improving the bottom line, and managing risks. Meanwhile, fear of data accuracy, consistency, and even access is a challenge in the adoption or use of business analytics. Many organizations lack skills to implement analytics and some businesses that attempted it lack the knowledge to apply the results. Companies that have built an “analytics culture” are reaping the benefits of their analytics investments. Therefore, bridging the knowledge gap for the organization to apply big data and business analytics in their organization is vital for effective decision making and business success. To provide this knowledge gap, this paper also discusses the various teams for big data analytics framework in Section 5. These teams include business expert, big data analyst, big data architecture and Hadoop operators and engineers.
3. Big data Analytics Platforms
Big data technology consists of a large number of open source software components, majorly Apache project [36], available for use in constructing a big data platform. This software is designed to work in a distributed and cloud computing environment. However, common problems faced by computer scientists in designing efficient and effective big data computing platforms include, how to move large volumes of transactional data across the back pane; how to move large volumes of static data across the network; how to process large volumes of data very fast; how to ensure even job scheduling and fair usage of resources; how to handle errors interrupting other jobs; and how to coordinate and optimize resources. Consequently, earlier solutions were done at the hardware level, which significantly increased the cost. Recently, Hadoop was designed as an open source framework to handle big data analytics through the batch processing approach. It was designed on the principles which include less dependency on expensive high-end hardware platforms and infrastructure, parallel processing to reduce computing time, not moving the data from disk to the central application to be processed, embrace failure, build applications with less dependent on infrastructures and utilization of flexibility of Hadoop. These design principles helped in cost reduction, platform optimization, fast processing and achieving efficiency [17]. In this section of the paper, the Hadoop ecosystem that enables implementation of big data and business analytics is explained. We outlined the structure, components, and tools that provide effective and efficient processing of big data.
3.1. The Hadoop Ecosystem
Hadoop is an open source project lead by Apache. It was originally designed to handle massive amounts of data, rapidly, efficiently and inexpensively. It handles both structured and unstructured data. Moreover, Hadoop stores bits and bytes of data on commodity hardware. In addition, Hadoop is user-friendly and scales massively. There can be up to 10, 20, 30, 40, or more racks filled with data nodes for a single supercomputing platform. It has the intelligence to run the distributed file system and the parallel processing work. Hadoop consists of three parts, Hadoop distributed file system, (HDFS), yet another resource negotiator (YARN) and common [17] as shown in Figure 4 below.
Hadoop Distributed File System (HDFS) is the storage layer that is responsible for creating a distributed repository. While Yet Another Resource Negotiator (YARN) is the data refinery layer and is a processing level for scheduling parallel compute jobs. This structure abstracts away the complexities of distributed computing.
YARN provides resource management and job scheduling in the Hadoop distributed processing platform. Moreover, Hadoop YARN extends the capability of Hadoop to support varieties of applications thereby reducing the limitation of Hadoop to only run MapReduce applications. Consequently, YARN enables Apache Hadoop to provide services such as interactive querying, data streaming, and real-time analytics applications [4].
With Hadoop, writing a MapReduce job by the programmer is easy as they do not have to determine data location or size and a number of parallels compute jobs. The primary components for the Hadoop cluster include the master server, the switches, the racks, and the data servers as shown in Figure 5. These are commonly called data workers, data nodes, or just nodes. The master server has responsibilities for managing and coordinating the entire Hadoop cluster (data nodes). Furthermore, it performs health checks and takes corrective action when required, mapping the location of all the data and directing all data movement, scheduling and rescheduling all compute jobs, and error handling (including loss of a data node and rescheduling of failed compute jobs). The data server is responsible for data storage and processing, and further, provides resources such as CPU and memory. In addition, data server reports health checks status and on-going job progress during data processing.
Another important component of the Hadoop ecosystem is Common. Common is made up of utilities and tools to perform various operations such as codec compression, error detection, input/output utilities and authorization of proxy users. Furthermore, common is responsible for data and user authentication, services level authorization and configuration of rack awareness [9].
Generally, Hadoop is configured on rack-based servers. On top of each rack, the network switch is configured for intra-rack communication. Furthermore, another network switch is configured for handling communication between rack switches and the client that runs the Hadoop client-related software. Hadoop uses HDFS for holding files. It is responsible for breaking large files into smaller chunks (128 MB - configurable), placing them in different slave nodes and replicating them for providing high availability.
3.2. Common Big Data Analytics Tools
Traditionally, data and business analytics are performed using an integrated suite of machine learning and data mining algorithms [4]. These tools provide mechanisms to analyze small to large scale data for business decision-making process. The machine learning algorithms and tools for data analytics can be broadly categorized into:
- Clustering and segmentation: Divides a large collection of entities into smaller groups that shows some similarities. An example is analyzing a collection of customers to differentiate smaller segments for targeted marketing.
- Classification is a process of organizing data into predefined classes based on attributes that are either pre-selected by an analyst or identified as a result of a clustering model. An example is using the segmentation model to determine which segment a new customer would be categorized.
- Regression is used to discover relationships among a dependent variable and one or more independent variables and helps determine how the dependent variable’s values change in relation to the independent variable values. An example is using mobile money subscription data, usage level, transaction type, transaction amount and geographic location to predict the future penetration of mobile money payment.
- Association and itemset mining looks for statistically relevant relationships among variables in a large data set. For example, this could help direct digital banking representatives to offer specific incentives to mobile money app users based on the usage level, transaction amount and transaction volume.
- Similarity and correlation, which is used to inform undirected clustering algorithms. Similarity-scoring algorithms can be used to determine the similarity of entities placed in a candidate cluster.
However, the huge volume of big data has rendered the traditional data analysis approach ineffective for processing huge amounts of generated data in the current cyber-physical and mobile connected world. Therefore, various big data tools have been proposed and implemented recently for efficient data generation, transmission, processing, storage and analysis of big data [10]. Big data analytics tools and approaches are shown in Figure 6.
These tools are continuously updated and many new tools are being introduced on a regular basis. There is always some meaning attached to the names given to the software projects, but there are no criteria defined for the namespace. Therefore, there is no connection between their names. For example, flume is named after the water race used in some sawmills to bring logs to the mill and pig was named on the fact that pigs eat anything. A few of the most common tools used in a Hadoop cluster are depicted in Figure 7. Other popular tools, can be found from distro companies such as Cloudera, Hortonworks, IBM, or MapR.
- MapReduce [36]: This is a Hadoop distributed programming framework for batch processing compute jobs designed to use key-value pairs. It is responsible for resource scheduling and job management. Moreover, MapReduce consists of two primary parts: The mapper, and the reducer. The mapper filters and transforms data. The data blocks of a large HDFS file is fed into the MapReduce. Each mapper will read its assigned data blocks and then process the data blocks by cleaning out dirty data and/or duplicates. It then produces an intermediate output file which is then shuffled across the network to the reducer for the reduce phase. The reducer sorts each file by key and aggregates them into a larger file. Another sort will occur on the keys to creating the final output file.
- Hive [37]: A SQL-like interface for Hadoop originated at Facebook. Hive is a SQL-like interface to Hadoop. It allows SQL users to use common SQL commands and common relational table structures to create MapReduce jobs without having to know MapReduce. Hive treats all the data like it belongs in tables and allows us to create table definitions over the top of the data files. In addition, it converts inputs into MapReduce jobs and organizes unstructured data metadata into tables.
- Pig [38]: A scripting language for data flow and was originally created at Yahoo. Moreover, pig converts the scripts into MapReduce jobs. Pig scripts have common storage called the piggy bank. The pig schema is optional at runtime.
- Flume [39]: The tool uses an agent for extracting large amounts of data into and out of Hadoop. Flume is well suited for gathering weblogs from multiple sources by the use of agents. Each agent is freestanding and is easily connected to each other. Flume comes with many connectors, making it fast and easy to build reliable and robust agents. Furthermore, the flume is highly scalable across many machines.
- Sqoop [40]: A tool for moving data into and from RDBMS. The name Sqoop is a combination of SQL with the word Hadoop. It is a great tool for exporting and importing data between any RDBMS and Hadoop Distributed File System. Sqoop uses both a JDBC and a command line interface. It supports parallelization across the cluster and has the ability to be deployed as a MapReduce job to manage the export or import of data.
- Apache Spark [41]: Spark is an open source computing framework that can run data on a disk and in- memory. Spark is built to run onto HDFS and is able to use YARN. It is designed to combine SQL, streaming, and complex analytics. It has high-level libraries that enable programmers to rapidly write jobs for streaming, machine learning, graph processing, and the R statistical programming language. The fast processing power of the Apache Spark makes it gain popularity over other existing solutions like Apache Mahout and MapReduce. In machine learning, Spark runs compute job ten times faster than Apache Mahout. On a large-scale statistical analysis, it is benchmarked to run a hundred times faster in memory than the same job running in MapReduce. Spark is robust and versatile. It has successfully combined a number of different functions into a single software solution. Spark applications can be written in Java, Scala, and Python and this makes it easy for programmers to write in their native language. It can read any existing Hadoop data file. It also reads from HBase, Cassandra, and many other data sources. Spark is scalable to 2000 nodes and it will continue to expand its ability to scale compute jobs.
- Oozie [42]: Oozie is a workflow and coordination tool used in a Hadoop cluster. It runs across a supercomputing platform. It allows jobs to run in parallel while waiting for input from other jobs. One of the interesting advantages to Oozie is that it comes with a very complex scheduling tool. This allows for coordination of jobs waiting for other dependencies within the supercomputing platform.
- HBase [43]: This is a popular NoSQL columnar database deployed on top of Hadoop. HBase is an Apache project based on Google’s Big Table model of data storage. It has no schema and provides a column-oriented view of data.
- Mahout [44]: Mahout is a scalable, simple and extensible machine learning library supported by Java, Scala, and Python for building distributed learning algorithm in Hadoop. The current version of Mahout called Samsara focuses on math environment for the task such as linear algebra, statistical operation and data structure using the R like syntax. Some of the commonly distributed machine-learning algorithm in the Mahout Library is singular value decomposition, principal component analysis, collaborative filtering, clustering, and classification. Mahout-Samara allows the user to build a distributed machine learning algorithm instead of depending on the pre-made algorithms. Mahout has provided comprehensive algorithm suits for MapReduce and Apache Spark.
- MLib [45]: MLlib is an open source machine learning library native to Apache Spark. It has a Spark API that allows the user to develop distributed machine learning algorithms in Java, Scala, Python, and R. The main features of MLlib include easy deployment capabilities, and runs faster than Mahout that use the MapReduce framework due to high in-memory computation and Spark Resilient distributed dataset. Moreover, MLlib contains a number of machine algorithms for large scale learning. These include classification, clustering, topic modeling, model evaluation, distributed linear algebra, and feature transformation.
- Apache Tez [46]: Apache Tez is an open source platform built on top of YARN for the analysis of directed Acyclic-graph (DAG) task. It provides a simplified API in Java and python for iterative shell task. Moreover, the Apache Tez platform has higher performance than MapReduce and allows Hive and Pig to run complex DAG task.
- Flink [47]: Another distributed platform for stream and batch processing and providing machine learning, Table and Dataset API for creating an application in Java and Scala. It combines the flexibility, scalability, fast and reliability of Distribute MapReduce to efficiently analyze big data which can be implemented in a single node cluster or in the cloud enterprise system.
- Storm [48]: Storm provides a platform for stream and real-time processing. The basic components of the storm are the Spout, a Twitter streaming API and Bolt for computational logic and data processing. It provides online machine learning, real-time data analytics and is deployed by many organizations such as Twitter, Yahoo, and Spotify Japan Yelp for processing of a large amount of real-time data within seconds. Storm runs heterogeneous topologies for different tasks and can be integrated with HBase, HDFS Kafta for large-scale data processing and storage. Storm being an open source Apache project provide distributed real-time computation system using programming APIs such as Java and Scala. In addition, the platform is built on top of Hadoop for data integration, end to end authentication and data transfer between Hadoop and relational database.
Apart from the above-listed tools, other tools for big data storage, processing, and management include Apache Casandra [49], NoSQL, and Zookeeper [50], Avro [51], Chukwa [52], Python [53], R [54] and Scala [55] programming languages. These tools key functions, features, strengths and weakness are summarized in Table 2 below.
3.3. Functional Layers of Big Data Architecture
Open source strategy creates a large number of computing software projects that provide users with various choice options for the big data analytics process. Often users are faced with the challenge of choice, and the wrong choice of any software solution may lead to business failure. Big data solution selection should be driven by use case, product reputation, team expertise, and knowledge of the current happening. Selection of any solution requires knowledge of functional areas (Big data stack) of the big data solution and maps the selected software into the correct functional layer [1]. A Hadoop cluster is constructed by combining any number of these software tools described in Section 4.2.
Big data stack or architecture can be viewed as a layered model that consists of a number of different functional areas for big data analytics. They include infrastructure, data repository, data refinery, data factory, data fusion, and business value. Each functional area has tools that allow the organization to leverage Hadoop’s power of combining multiple data sources to gain new knowledge. These five layers are explained below.
- Infrastructure layer. This is the first layer and includes all the hardware, network, and software used to support and to operate a Hadoop cluster. Software ranges from operating system versions to all the commonly used tools for monitoring and reporting on the Hadoop cluster.
- Data Repository layer. The second layer that deals with the movement of data within a distributed computing environment. The primary repository here is the Hadoop distributed file system. Data transport tools such as Sqoop and Flume are also included. All the NoSQL databases, such as Accumulo and HBase is a form of data repository.
- The Data Refinery layer. This is the third layer and provides a platform for manipulation and processing of data using the parallel processing framework. The primary technology in the data refinery layer includes Yarn and MapReduce.
- The Data Factory layer. Software under this class is called data workers. They are designed to interface into Hadoop and enables easier access to the full power of Hadoop. Many of them actually allow the users to create compute jobs in an easily understood language, such as SQL, and then they translate these inputs into MapReduce jobs. The tools here include Hive, Pig, Spark, and Oozie.
- The Data Fusion. This layer is the application layer and the true business end of the big data solution. Data analytics and data visualization tools fall under this layer and are used to create applications, implement algorithms, and visualize data. The tools include machine learning technology, such as Mahout, or Data Visualization tools, such as Datameter or Pentahoe and Tableau.
- The Business Value Layer. This is the final layer which utilizes a wide range of tools to express the requirements, the service levels, and the request for changes, the cost and the expenditures for the business.
4. Success Factors and Challenges
This section discusses different factors that are vital for achieving success in big data and business analytics implementation. These factors include having an expert business team, analytics teams, Hadoop operators, etc. Furthermore, the section outlines various challenging hampering big data analytics implementation by business organizations.
4.1. Success Factors
Good implementation of big data solution to provide data analysis for marketing and business processes requires the following design considerations [23]:
- Recognizing elements of Gartner’s vector model by identifying the characteristics of big data.
- Consider solutions from a number of major vendors like Cloudera, Hortonworks, IBM, and MapR and choose the solution that will support the environment to meet business objectives. The culture of big data giants like Amazon, Google, and Facebook should be considered as well.
- Identifying the risks of open source software. Evaluate competing solutions based on any or all of the criterion for their development, deployment and response times. Therefore, knowing which NoSQL database works best with which data type is essential.
- Recognizing Hadoop cluster elements and their functions.
- Create a secure analytics platform to deliver data-driven insights to business users across the group.
- Develop a set of core requirements for its analytics platform. For example, the core requirements could focus on function, cost and time.
- Proof of concept is needed to reduce risk in the implementation process. This exercise confirms how the performance and scalability of the solution chosen will assure meeting the targets set at the beginning of the big data project. This exercise is done jointly by the solutions’ expert with the organization IT team.
Moreover, big data and business analytics teams play a vital role in the success of a big data analytics project. The size and complexity of big data technology require highly motivated team members, who are smart and determined. In addition, a successful implementation of the big data solution requires a good team member with the right mission statement. As a result of the complexity of the supercomputing platform, all levels of the team must have an in-depth mastery of the big data ecosystem [57]. Organizations must invest the time and money in developing their own expertise in the big data analytics team and computing infrastructure. The big data time members and their roles are briefly described below and include:
(a) The business team: It comprises of
- Executives/Stakeholders: Executives are leaders in their business and industry, they generate business strategy and goals, find opportunity in crises, and lead through incidents. They also have the flexibility to pilot and have a strong overview of the big data ecosystem.
- Product Managers/Data Stewards: They provide leadership to achieve business goals and understand data, its value and limitations. Furthermore, they identify and define risk, are open to new opportunities, and maintain a working knowledge of the big data ecosystem.
(b) The analytics team
- Data Scientist: The data scientist should be an academic scientist, a subject-matter expert in their area of business, and possess advanced skills in mathematics and statistical modeling. Moreover, a data scientist should be focused on research, analytic approaches and should be skilled in statistical programming languages.
- Business Analysts/Data Analysts: They should be aligned with business goals and directions. They produce a detailed analysis for business, report on data quality, and are skilled in a wide range of data modeling and data analytics tools. They have a working knowledge of the big data ecosystem.
(c) The Big Data architects team
- Global architect/platform engineers: They are subject matter experts in supercomputing platforms and are skilled in data architecting. They are specialists in applicable use cases, outstanding in root cause analysis and are exceptional in performance tuning. A global architect has a broader knowledge of the big data ecosystem, while a platform engineer has a deeper understanding of the software running the supercomputing platform. Both need a good understanding of the data being ingested and digested by the distributed computing environment.
- Data architect/data wranglers: They possess industry knowledge, strong skills in mathematics and statistics, and are specialists in applicable use cases. They are also subject matter experts in data analytics, data visualization, NoSQL, and ETL.
(d) The Big Data Hadoop operators team
The real frontline troops in managing and operating a Hadoop cluster are;
- Hadoop engineers: They are subject-matter experts in supercomputing platforms and experts in Java and Python. They can write and deploy Hadoop jobs, knowledgeable in the Hadoop cluster performance and implementation, and proficient in debugging and troubleshooting.
- Hadoop operators: They are subject-matter experts in the Hadoop cluster, Linux systems, and networking. They are also skilled in Kerberos, experts in troubleshooting, proficient in performance tuning, and knowledgeable in DC hardware.
In addition, the big data Hadoop operator team must have in-depth knowledge and experience working with the supercomputing platform.
In addition, the aforementioned considerations, the organization should also consider switching to global architecture where a supercomputing platform is best operated as a single entity and components are tightly coupled together rather than the usual enterprise architecture where each layer of the stack of component and clearly defines boundaries. Furthermore, the single team should have the responsibility for both the development and the operation of the supercomputing. The management, the platform engineers, the software developers, and the operators should work in a single team, frequently in a single location. The proximity of the team helps the team build working knowledge. This working attitude is the secret of the big data giants such as Yahoo, Google, and Facebook. Moreover, mastering the big data ecosystem by the team is another key criterion. Big data is built on the principles of supercomputing. The complexity of this platform mandates sophisticated knowledge of the big data ecosystem at all levels of the team. The operators, the engineers, the architects, and the business managers must be well versed in the big data ecosystem. Everyone involved in the project must be a generalist with a solid understanding of how a supercomputing platform works, and this includes the stakeholders and executive management. Organizations must invest the time and money in developing their own expertise in their supercomputing platform [1,12].
4.2. Challenges of Big data and Business Analytics
Though big data can be useful, like any resource, it has potential implementation challenges if it is not properly handled. It is needful to understand that big data does not equal good data. It may have come with some element of imperfection due to the consequence of an imperfect world. The impression of garbage in, garbage out with respect to data visualization, data analytics, still holds. It is needful to comprehend the level of imperfection in the collected data in order to calibrate and understand the meaning of the outputs with respect to the cleanliness or quality of the data. Some of these challenges are outlined below:
(1) A false sense of security
Big data gives a false sense of security. This is because having a huge amount of data does not necessarily mean the result must be true. Big data may not capture the true information you need to solve a particular question on the business problem. Sometimes small data can be ok or even better. There are occasions you may not have the data to support your questions, which is going to spur on either data collection efforts or data acquisition efforts to answer your questions. However, collected data should not be used out of the sample to answer the wrong business problems [58].
(2) May waste resources
Unnecessary use of big data ties up computer resources and so money and time should not be committed to big data if it is not needed. Big data should be deployed only when it is necessary, to avoid waste of computer resources. It is wasteful for an organization to spend time computing big data when small data can actually answer her questions. This is a case in the Google flu trend BD (engineering). In this project, Google attempted to predict flu outbreaks by measuring millions of Google search terms related to the flu – flu shots, flu symptoms, etc. However, the proposed big data analytics approach for flu prediction failed due to overestimation of results. The failure was due to the wrong choice of measurement as people who search for flu may not actually have the flu. Such error could be avoided when the source of your data, the degree of cleanliness or quality of your data, are understood from a modeling or analytics perspective. Understand the assumptions in your models and verify your data to identify/eliminate bad data, outliers, etc. If you have a big data system already in place, do not be afraid to capture more data that you think may be irrelevant and verify model results overtimes.
(3) Physical challenges to Big Data
Big data poses challenges beyond volumes, velocity, and variety. It equally questions the fundamental beliefs about the relationship between data and knowledge. Big data is challenging to current IT architecture, networks, servers, and software. Considering various reports and Cisco estimates by 2014, on the exponential growth of business data, the yearly doubling of Internet traffic will leave experts with the significant challenge of how these data will be collected and analyzed; will every collected data be analyzed and stored? How do we determine what should be stored and for what duration? Will there be enough physical space for storage? The volume of data on internal networks will hugely exceed most networks capacity for data transmission. The conversion of the moving data to higher bandwidth networks becomes a requirement. Infrastructure for datacenters that support big data and data storage challenges for online and archival data are all problems to deal with. Even if the cost of hardware and software are made affordable, the people and time to enable these changes while keeping the current enterprise fully operational is another challenging factor.
(4) Management challenges.
On management challenges, the issues on security, privacy and civil liberties, regulatory challenges, and compliance come into play. The path between the good and the bad in every technology is determined by the people and how they use it. Just as there are many amazing benefits of big data, so are many possible bad and criminal uses for it. Big data can be very destructive in the wrong hands. The original architecture of big data was not built with enough emphasis on security. Some users take advantage of design oversight and introduce management related challenges. These include security, privacy and civil liberties, regulatory challenges, and compliance.
- Security and privacy: The digital world has experienced threat from criminal attacks. The fact that big data encourages the collection and analysis of everything, people privacy and civil liberties are at high risk. Big data technology is being used by organized crime to now run a cyber-scam. The criminals use the platform to identify victims, normally elderly, and their relationship to new relatives who are traveling to foreign countries. They then make a call and impersonate foreign officials – asking for immediate payment to post bail, or to pay for urgent medical care. The collection of big data gives them enough data to make the scam work and intrude upon one’s privacy. The collection of vast amounts of data can be used to attack the economy, infrastructure, and personnel of the opposition. Today, there are real threats of using cyber blackmail to bend an enemy to your will. For example, in Nigeria, political parties use this platform to attack one another and win members to their group. In worst cases, world leaders have been insulted via this means. This seems to create a society void of respect and dignity. Privacy and civil liberty issues around big data are extremely controversial on whether big data is the end of privacy. There is no doubt that in today’s’ world, people leave an ever-increasing detailed and complete digital footprint, there is a number of companies that make revenue by tracking every click, and every second you spend on the Internet. The number of companies, government agencies, and research organizations that track and use the telephony data from mobile phones is growing rapidly. They track every movement of a switched on a mobile phone, and store all this collection into a big data solution. Perhaps, creating a new version of the community through broad public education and discussion to determine the right standards, policies, regulations, and laws might resolve the perception of big data as an end to privacy.
- Regulatory and compliance: Deeper knowledge of big data technology has led to an increase in regulatory requirements. Europe is taking lead in setting rules around the capture and use of various sources of data such as e-mails, instant messages, web forms, mobile records, and mobile data. The tools and the practices for ensuring compliance with these new regulations are immature, or they do not exist. It will require continuous attention to detail and to new tool offerings, to ensure we can manage compliance. This concern calls for enhancements in the Hadoop cluster. Hadoop has the problem of encrypting data. Currently, Kerberos is one of the most common security technologies deployed with a Hadoop cluster to ensure security. Kerberos is an open source project that originated at MIT. It is fundamentally a network protocol, designed as a client-server model and uses the highest available cryptography to ensure mutual authentication for both the user and the server.
5. Applications of Big Data and Business Analytics
There are various areas of business and industries that have benefited from big data analytics technologies. These areas generate a huge amount of data that require big data analytics process for effective and efficient decision making. These application areas include healthcare, telecommunication, network optimization, travel estimation, retails, financial industries, energy consumption [4,56] to mention but a few. The application areas are explained below while Table 3 outlines the key data sources in these areas and features.
- Healthcare: Improved health is important for economic growth, good physical and mental health. Healthcare industry generates a huge amount of data that can be used to enhance decision making by both doctors and other health practitioners. In addition, the use of big data in healthcare can help to develop a real-time analysis of disease thereby improving the quality of life to the public. There are lots of research in this regards and range from fault tolerance system to support data generation, integration and analysis to continuous monitoring for early detection of an environmental condition that may trigger asthma attack [59,60]. Moreover, public health care data require big data analytics techniques due to their large scale to track, monitor, store and analyze individual moving objects with their level of exposure to harmful environmental factors in order to ascertain the relationship between the data and environmental risk. Furthermore, big data analytics have played a vital role in predicting the outbreak of diseases such as Ebola virus using call detail records and sensor data to provide feedback mechanism in order to improve quality of healthcare delivery system [61].
- Network Optimization: Big data and business analytics approach can be used to design a mobile network to provide efficient services. The area of interest is in content-centric analysis, traffic analysis, network signaling to ensure effective service delivery and quality of service delivery. Network operators can incorporate framework to collect, store and analyze user or core network data for efficient signaling, predict traffic variation, network overload, intelligent network optimization, automatic self-configuration of the network and intelligent transportation development [62,63].
- Travel Estimation: High volume of data generated by mobile users during calls often referred to as call data records (CDRs) has enabled researchers to aggregate, store, process and analyze travel estimation particularly in route recommendation, location tracking, trip generation, commuter origin and destination information and transportation management planning in the developing economy [64,65,66]. Mobile big data can also aid route recommendation in a complex environment by deploying smart multimodal platform that utilizes personal information and global constraint. The algorithms monitor the state of the cities in real time and identify the congested route in order to make alternative recommendations. This mechanism is not new as it has seen its applications in drone routing, infectious disease, and hotspot identification and in an emergency situation [64]. To ensure security, the datasets are usually anonymized using computer generated unique identifiers to replace the phone numbers of subscribers. Researches in mobile big data for travel estimate have proven to be important to improve transportation planning.
- User behavior modeling: User behavior modeling helps to understand navigation patterns in order to develop user-centric applications. These applications are important in anomalies, fraud and spam detection in social media and enable social behavior changes for target marketing [67].
- Human mobility modeling: Human beings maintain a regular pattern over a period of time. Consequently, repeating such pattern enables efficient prediction of a global movement and this can be applied in disease containment, transportation planning, emergency situation and prevent the outbreak of diseases by leveraging the social network platform, GPS data, call data record and geo-tagged data through big data analytics methods [68,69,70].
- Service recommendation: Big data and business analytics approaches have played a vital role in services recommendation, target advertisement using user location information, product review, time and product buying behavior. For instance, a recent study by Salehan and Kim [70] deployed Hadoop and MapReduce to analyze customer review to understand the strengths and weaknesses of the product. This approach helps to determine the predictors of review readership and how to improve sales.
- Energy consumption analysis: Identification of the amount of energy in the household is a sure way to promote green energy efficiency and conservation. The analysis using big data techniques provides the usage patterns to promote green energy by fitting the electricity supplies with sensors, communication network and analytics engine to digitalize, store and analyze the consumption rate [4]. Moreover, this will help to improve energy sales and return on investment for energy companies.
- Crowdsourcing and Sensing: Crowdsourcing implemented through opportunistic sensing is an essential source of data for data-driven decision making in a business environment. Many companies employ these techniques to enlist people to perform a specific task for solving complex problems by leveraging smartphone with embedded sensors. Smartphones can be used to source a huge amount of opinion data from the public and then analyze decision-making in an urban emergency, location-based search and similarity services using mobile phone data [71].
- Educational development: Educational sector provides rich sources of data for big data analytics processes. These data help to predict learner performances and achievement. Moreover, big data analytics in education play an important role in course content management, personalized recommendation module, development of smart education by leveraging areas such as natural language processing and text summarization. In addition, data generated through massive online courses (MOOCs) helps to identify difficult areas of the subjects and provides support to students in order to enhance teaching and learning [72,73,74].
- Financial Industries: The adoption of social media and internet-based approaches to financial industries have resulted in the generation of the high volume of data. Therefore, to analyze these data for effective decision-making requires big data techniques. Moreover, analysis of financial statement and data would result in the detection and management of anti-money laundry, financial statement fraud, financial spamming, impersonation, identity theft, and other financial fraud related incidences [57].
These applications alongside key data sources and features and summarized in Table 3 below.
6. Summary and Open Research Directions
Benefits of big data are potentially tremendous. To a business class, technology is merely a means of keeping the company close to its customers. Enterprises that embarked on a big data project have experienced massive growth in business as revealed in this work. It has successfully helped the organization to achieve cost reductions, faster and better decisions, and even provide new offerings for the customer as discussed in this paper. Hadoop and cloud-based analytics used in big data have contributed immensely to a substantial reduction in the cost of the technology when compared to the traditional architectures (data warehouses and marts in particular). However, big data is not a replacement for data warehouses but it augments it. Rather than processing and storing vast quantities of new data in a data warehouse, for example, companies are using Hadoop clusters for that purpose and moving data to enterprise warehouses as needed for production analytical applications. Analytics has always helped to improve decision making. But big data has leveraged the speed of Hadoop and in-memory analytics, to generate faster and better decisions. For example, health insurance giant United Healthcare is using “natural language processing” tools from SAS to better understand customer satisfaction and when to intervene to improve it. The most interesting use of big data analytics is to create new products and services for customers as seen in the case of BancaCarige and other organizations mentioned in the work. Big data is characterized by volume, variety, and velocity. Understanding customers’ demand requires an excellent grasp and analysis of business data. This is the key to the development of successful new products and services.
Big data has some limitations. It is however not equal to a good result. Big data encourages collection and analysis of everything. There is some level of imperfection in the collected data which when not properly cleaned could yield a bad result that will lead to wrong business decisions. Data generated via big data is sometimes used by the wrong hands to perpetrate crime. Unnecessary use of technology can also waste computer resources. Therefore, the organization should be familiar with various analytics offerings by distro companies, to clearly understand their business requirements and apply a matching solution that will fit their business environment in order to avoid waste of resources. In addition, big data solution should be used when is needful. The technology is complex and runs on a supercomputing platform. This has resulted in new roles for supercomputing experts. Organizations should bear in mind that it takes time to build complex, sophisticated, and intense technology skills. They should, therefore, invest in their team to achieve a good result.
Big data has a wide range of applications namely business, government, health, education, finance, and so on. Finally, every organization should stick to her memory that determining relevant data is key to delivering value from massive amounts of data.
Even though various big data and business analytics approaches that can be deployed for enhanced business acceleration and development have been discussed in this paper. There are open research directions that have constantly appeared in literature recently. These open research directions cut across an analysis of heterogeneous data, data privacy, and security, providing a unified framework for data cleaning and deep learning techniques for big data processing.
- Data privacy and security: One of the major challenges in developing effective big data and business analytics in our opinion is how to develop a security mechanism that ensures user security. With such an approach, business owners will be confident in sharing their user data to develop the next generation of big data analytics protocol that takes into cognizance the security challenges. This may involve providing a dynamic security mechanism that takes care of the changing nature of big data especially mobile big data or big data algorithms for data privacy during data extraction, filtering techniques that reduce scarce bandwidth consumption in the mobile network through computational offloading. In addition, areas such as ways to generate the right metadata to be analyzed using scalable data mining [75] also require further research.
- Effective techniques for heterogeneous data analysis: Developing techniques and framework for the analysis of heterogeneous big data for various economic enhancement and applications such as disease control, transportation network scheduling and modeling of dynamic distribution of population for human mobility are highly required. Moreover, other techniques in big data are data cleaning and aggregation for the recent explosion of mobile big data and how these data can be analyzed for target advertising, behavioral analysis, detection of hotspot crime zone and disaster management [76,77].
- Deep learning Methods for big data and business analytics: Deep learning techniques are automatic feature representation approaches for big data analysis and have been widely applied in image classification, medical diagnosis, natural language processing, and human activity identification using smartphones and other cyber-physical system data [74,77]. Various deep-learning approaches have been proposed for the analysis of a variety of data models. These include convolutional neural network, deep autoencoder, restricted Boltzmann machine, and recurrent neural networks. However, there are still areas that are scarcely explored in deep learning for big data analytics. These include evaluation of deep learning methods on a variety of datasets and hyperparameter tuning for improved results, solving class imbalanced issues, efficient and real-time analysis of big data using deep learning approaches [77].
- Data Fusion for big data and business analytics: Another big data area that has received less attention and requires further research is in the area of data fusion for effective data analysis. Data fusion methods are the integration of heterogeneous or homogenous data in order to increase reliability, robustness, and generalizability of big data analytics algorithms. In addition, big data fusion approaches are necessary to reduce uncertainty and the impact of indirect capture that are common during big data generations [78]. Areas that require further research include cyber-physical implementation for the internet of things applications, improved decision fusion for enhanced generalization and diversity, obtaining reliable approaches to combine heterogeneous data and identifying the importance of individual data modality for big data and business analytics before fusion is performed.
Author Contributions
I.A.A. and H.F.N. conducted the research, drafted and proof-read the article. All authors were involved in the review of the manuscript.
Funding
The authors received no external funding for this research.
Acknowledgment
We are grateful to the anonymous reviewers for their insightful comments and suggestions.
Conflicts of Interest
The authors declare no conflict of interest.
Abbreviations
| Abbreviations | Full meaning |
| API | Application Programming Interface |
| BA | Business Analytics |
| BI | Business Intelligence |
| BVN | Bank verification Numbers |
| CDR | Call data record |
| DAG | Direct Acyclic Graph |
| DBMS | Database management system |
| ECG | Electrocardiography |
| EMG | Electromyography |
| GPA | Grade point average |
| GPS | Global positioning system |
| HDFS | Hadoop distributed file systems |
| IDC | International data corporation |
| MLlib | Machine learning library |
| MOOCs | Massive Online Courses |
| OLAP | Online analytics processing |
| RDMBS | Relational database management systems |
| SIM | Subscriber identification module |
| SQL | Structured query language |
| YARN | Yet another resource negotiator |
References
- Davenport, T.H. Big Data at Work: Dispelling the Myths, Uncovering the Opportunities; Harvard Business School Publishing: Boston, MA, USA, 2014. [Google Scholar]
- Davenport, T.H.; Harris, J.G. Competing on Analytics: The New Science of Winning; Harvard Business School Publishing: Boston, MA, USA, 2014. [Google Scholar]
- Davenport, T.H.; Barth, P.; Bean, R. How Big Data is Different. MIT Sloan Manag. Rev. 2012, 54, 21–24. [Google Scholar]
- Hashem, I.A.T.; Yaqoob, I.; Anuar, N.B.; Mokhtar, S.; Gani, A.; Khan, S.U. The rise of “big data” on cloud computing: Review and open research issues. Inf. Syst. 2015, 47, 98–115. [Google Scholar] [CrossRef]
- Grover, V.; Chiang, R.H.L.; Liang, T.; Zhang, D. Creating Strategic Business Value from Big Analytics: A Research Framework. J. Manag. Inf. Syst. 2018, 35, 388–423. [Google Scholar] [CrossRef]
- Chahal, H.; Jyoti, J.; Wirtz, J. Business Analytics: Concepts and Applications. In Understanding the Role of Business Analytics; Springer: London, UK, 2019; pp. 1–8. [Google Scholar]
- Singh, D.; Reddy, C.K. A survey of Platforms for Big Data Analytics. J. Big Data 2015, 2, 8. [Google Scholar] [CrossRef]
- Tsai, C.-W.; Lai, C.-F.; Chao, H.-C.; Vasilakos, A.V. Big Data Analytics: A survey. J. Big Data 2015, 2, 21. [Google Scholar] [CrossRef]
- Landset, S.; Khoshgoftaar, T.M.; Richter, A.N.; Hasanin, T. A survey of Open Source tools for machine learning with big data in the Hadoop ecosystem. J. Big Data 2015, 2, 24. [Google Scholar] [CrossRef]
- Mohebi, A.; Aghabozorgi, S.; Wah, T.Y.; Herawan, T.; Yayapour, R. Iterative big data clustering algorithms: A review. Softw. Pract. Exp. 2016, 46, 107–129. [Google Scholar] [CrossRef]
- Mohamed, A.; Nahafabadi, M.K.; Wah, Y.B.; Zaman, E.A.K.; Maskat, R. The state of the art and taxonomy of big data analytics: View from the new big data framework. Artif. Intell. Rev. 2019, 1–49. [Google Scholar] [CrossRef]
- Brynjolfsson, E.; Hitt, L.M.; Kim, H.H. Strength in Numbers: How Does Data-Driven Decision Making Affect Firm Performance? 2011. Available online: http://ssrn.com/abstract=1819486 (accessed on 2 January 2019).
- Manyika, J.; Chui, M.; Brown, B.; Bughin, J.; Dobbs, R.; Roxburgh, C.; Byers, A.H. Big Data: The Next Frontier for Innovation, Competition, and Productivity. 2011. Available online: http://www.mckinsey.com/insights/mgi/research/technology_and_innovationbig_data_th_next_frontier_for_ innovation (accessed on 6 October 2018).
- SAS, Big data meets Big Data Analytics. Available online: www.sas.com/content/dam/SAS/en.../big-data-meets-big-data-analytics-105777.pdf (accessed on 10 February 2019).
- McAfee, A.; Brynjolfsson, E. Big data: The management revolution. Harv. Bus. Rev. 2012, 90, 60–69. [Google Scholar] [PubMed]
- International Data Corporation (IDC). The Digital Universe of Opportunities: Rich Data and the Increasing Value of the Internet of Things, 2014. Available online: http://www.emc.com/leadership/digital-universe/2014iview/executive -summary.htm (accessed on 4 May 2018).
- Dailey, W. The Big Data Technology Wave. Available online: https://www.skillsoft.com/courses/5372828-the-big-data-technology-wave/ (accessed on 18 March 2019).
- Sicular, S. Gartner’s Big Data Definition Consists of Three Parts, Not to Be Confused with Three “V”s. Available online: http://www.forbes.com/sites/gartnergroup/2013/03/27/gartners-big-data-definition-consists-of-three-parts-not-to-be-confused-with-three-vs/#95a45853bf622013 (accessed on 4 May 2018).
- Davenport, T.H.; Dyché, J. Big Data in Big Companies. Available online: https://www.sas.com/resources/asset/Big-Data-in-Big-Companies.pdf (accessed on 10 October 2018).
- Jones, M.; Silberzahn, P. Three Reasons Why Big Data Doesn’t Make You Smarter—Lessons from the World of Intelligence. Available online: http://www.forbes.com/sites/silberzahnjones/2013/07/02/three-reasons-why-big-data-doesnt-make-you-smarter-lessons-from-the-world-of-intelligence/#2cbc03266562 (accessed on 22 May 2018).
- Noyes, K. Why Big Data Isn’t Always the Answer. Available online: http://www.computerworld.com/article/2973436/big-data/why-big-data-isn’t-always-the-answer.html 2015-08 (accessed on 22 May 2018).
- Davenport, T. Three Big Benefits of Big Data Analytics. Available online: https://www.sas.com/en_ ca/news/sascom/2014q3/Big-data-davenport.html (accessed on 25 June 2018).
- Frizzo-Barker, J.; Chow-White, P.A.; Mozafari, M.; Ha, D. An empirical study of the rise of big data in business scholarship. Int. J. Inf. Manag. 2016, 36, 403–413. [Google Scholar] [CrossRef]
- Marr, B. Big Data Facts: How Many Companies Are Really Making Money from Their Data? 2016. Available online: http://www.forbes.com/sites/bernardmarr/2016/01/13/big-data-60-of-companies-are-making-money-from-it-are-ou/#3bbdb7143877 (accessed on 25 May 2018).
- Schniederjans, M.J.; Schniederjans, D.G.; Starkey, C.M. Business Analytics Principles, Concepts, and Applications; Pearson Education, Inc.: London, UK, 2014. [Google Scholar]
- Paksoy, T.; Ozxeylan, E.; Weber, G.W. Profit-Oriented Supply Chain Network Optimization. Central Eur. J. Oper. Res. 2012, 21, 455–478. [Google Scholar] [CrossRef]
- Burns, E. Education Analytics Project Helps Marist, Students Make the Grade. Available online: http://searchbusinessanalyticss.techtarget.com/feature/Education-analyticss-project-helps-Marist-students-make-the-gradeon (accessed on 3 July 2018).
- Stubbs, E. The Value of Business Analytics; John Wiley & Sons: Hoboken, NJ, USA, 2011. [Google Scholar]
- Bloomberg Businessweek Research Services, The Current State of Business Analyticss: Where Do We Go from Here? Available online: https://www.sas.com sources/asset/busanalyticssstudy_wp_08232011.pdf (accessed on 19 February 2019).
- Lim, E.P.; Chen, H.; Chen, G. Business intelligence and analytics: Research directions. ACM Trans. Manag. Inf. Syst. 2013, 3, 17.1–17.10. [Google Scholar] [CrossRef]
- Provost, F.; Fawcett, T. Data Science for Business; O’Reilly Media: Sebastopol, CA, USA, 2013. [Google Scholar]
- Lavalle, S.; Lesser, E.; Shockley, R.; Hopkins, M.S.; Kruschwitz, N. Analytics: The new path to value: How the smartest organizations are embedding analytics to transform insights into action. MIT Sloan Manag. Rev. 2010, 12, 1–28. [Google Scholar]
- Lavalle, S.; Lesser, E.; Shockley, R.; Hopkins, M.S.; Kruschwitz, N. Big data, analytics and the path from insights to value. MIT Sloan Manage. Rev. 2011, 52, 1–31. [Google Scholar]
- Watson, H.J. Tutorial: Business intelligence—Past, present, and future. Commun. Assoc. Inf. Syst. 2009, 25, 487–510. [Google Scholar] [CrossRef]
- IDC. Big Data Big Opportunities. Available online: http://www.emc.com/microsites/cio/articles/big-data-big-opportunities/LCIA-Big Data Opportunities -Value.pdf (accessed on 25 July 2018).
- White, T. Hadoop: The Definitive Guide, 3rd ed.; O’Reilly Media, Inc.: Sebastopol, CA, USA, 2012. [Google Scholar]
- Apache Hive. Available online: http://hive.apache.org/ (accessed on 10 January 2019).
- Apache Pig. Available online: http://pig.apache.org/ (accessed on 10 January 2019).
- Apache Flume. Available online: https://flume.apache.org/ (accessed on 10 January 2019).
- Apache Sqoop. Available online: http://sqoop.apache.org/ (accessed on 10 January 2019).
- Spark. Available online: https://spark.apache.org/ (accessed on 10 January 2019).
- Apache Oozie Workflow Scheduler for Hadoop. Available online: http://oozie.apache.org/ (accessed on 5 February 2019).
- Apache HBase. Available online: http://hbase.apache.org/ (accessed on 5 February 2019).
- Mahout. Available online: http://mahout.apache.org/ (accessed on 5 February 2019).
- MLLib. Available online: https://spark.apache.org/mllib/ (accessed on 5 February 2019).
- Apache Tez. Available online: http://tez.apache.org/ (accessed on 5 February 2019).
- Apache Flink. Available online: https://flink.apache.org/ (accessed on 5 February 2019).
- Apache Storm. Available online: https://storm.apache.org/ (accessed on 5 February 2019).
- Apache Cassandra. Available online: http://cassandra.apache.org/ (accessed on 12 December 2019).
- Apache Zookeeper. Available online: https://zookeeper.apache.org/ (accessed on 7 November 2019).
- Apache Avro. Available online: https://avro.apache.org/ (accessed on 19 February 2019).
- Apache Chukwa. Available online: https://chukwa.apache.org/ (accessed on 19 February 2019).
- Python Programming. Available online: https://www.python.org/ (accessed on 8 March 2019).
- The R Project for Statistical Computing. Available online: http://www.r-project.org/ (accessed on 19 February 2019).
- Scala programming. Available online: https://scala-lang.org/ (accessed on 6 March 2019).
- Wang, K.; Shao, Y.; Shu, L.; Zhu, C.S.; Zhang, Y. Mobile Bid Data Fault-Tolerant Processing for eHealth Networks. IEEE Netw. 2016, 30, 36–42. [Google Scholar] [CrossRef]
- Bhadani, A.; Jothimani, D. Big data: Challenges, Opportunities, and Realities. In Effective Big Data Management and Opportunities for Implementation; Singh, K.M., Kumar, D.G., Eds.; Information Science Reference: Hershey, PA, USA, 2016. [Google Scholar]
- He, Y.; Yu, F.R.; Zhao, N.; Yin, H.; Yao, H.; Qiu, R.C. Big data analytics in mobile cellular networks. IEEE Access 2016, 4, 1985–1996. [Google Scholar] [CrossRef]
- Zhang, G.L.; Sun, J.; Chitkushev, L.; Brusic, V. Big Data Analytics in Immunology: A Knowledge-Based Approach. Biomed. Res. Int. 2014, 2014, 437987. [Google Scholar] [CrossRef]
- Wyber, R.; Vaillancourt, S.; Perry, W.; Mannava, P.; Folaranmi, T.; Celli, L.A. Big data in global health: Improving health in low and middle-income countries. Bull. World Health Organ. 2015, 93, 2013–2018. [Google Scholar] [CrossRef]
- Khatib, E.J.; Barco, R.; Muñoz, P.; De La Bandera, I.; Serrano, I. Self-Healing in Mobile Networks with Big Data. IEEE Commun. Mag. 2016, 54, 114–120. [Google Scholar] [CrossRef]
- Dobre, C.; Xhafa, F. Intelligent service for Big Data Science. Futur. Gener. Comput. Syst. 2014, 37, 267–281. [Google Scholar] [CrossRef]
- De Domenico, M.; Lima, A.; Gonzalez, M.C.; Arenas, A. Personalized routing for multitudes in smart cities. EPJ Data Sci. 2015, 4, 1–11. [Google Scholar] [CrossRef]
- Dong, H.H.; Wu, M.C.; Ding, X.Q.; Chu, L.Y.; Jia, L.M.; Qin, Y.; Zhou, X.S. Traffic Zone division based on big data from mobile phone-based stations. Transp. Res. Part C Emerg. Technol. 2015, 58, 278–291. [Google Scholar] [CrossRef]
- Lokanathan, S.; Kreindler, G.E.; De Silva, N.N.; Miyauchi, Y.; Dhananjaya, D.; Samarajiva, R. The potential of Mobile Network Big Data as a Tools in Colombo’s Transportation and Urban Planning. Inf. Technol. Int. Dev. 2016, 12, 63–73. [Google Scholar]
- Douglas, R.W.; Meyer, D.A.; Ram, M.; Rideout, D.; Song, D.J. High-resolution population estimation from telecommunication data. EPJ Data Sci. 2015, 4, 1–13. [Google Scholar] [CrossRef]
- Lima, A. Digital Traces of Human Mobility and Interaction: Models and Applications. Ph.D. Thesis, University of Birmingham, Birmingham, UK, 2016. [Google Scholar]
- Finger, F.; Genolet, T.; Mari, L.; De Magny, G.C.; Manga, N.M.; Rinaldo, A.; Bertuzzo, E. Mobile phone data highlights the role of mass gatherings in the spread of cholera outbreaks. Proc. Natl. Acad. Sci. USA 2016, 113, 6421–6426. [Google Scholar] [CrossRef] [PubMed]
- Zhan, X.; Ukkusuri, S.V.; Zhu, F. Inferring Urban Land Use Using Large-Scale Social Media Check-in Data. Netw. Spat. Econ. 2014, 14, 647–667. [Google Scholar] [CrossRef]
- Salehan, M.; Kim, D.J. Predicting the performance of online consumer reviews: A sentiment mining approach to big data analytics. Decis. Support Syst. 2016, 81, 30–40. [Google Scholar] [CrossRef]
- Chatzimilioudis, G.; Kanstantinidis, A.; Laoudias, C.; Zeinalipour-Yazti, D. Crowdsourcing with smartphones. IEEE Internet Comput. 2012, 16, 36–44. [Google Scholar] [CrossRef]
- Yang, Y.Y.; Brinton, C.G.; Joe-wong, C.; Chiang, M. Behavior-based grade prediction for MOOCs via time series Neural Networks. IEEE J. Sel. Top. Sign. Process. 2017, 11, 716–728. [Google Scholar] [CrossRef]
- Mohammadi, M.; Alfuqaha, A.; Sorour, S.; Guizani, M. Deep Learning for IoT big data and Streaming Analytics: A Survey. IEEE Commun. Sur. Tutor. 2018, 20, 2923–2960. [Google Scholar] [CrossRef]
- Ochoa, S.F.; Fortino, G.; Di Fatta, G. Cyber-Physical systems, Internet of things and big data. Futur. Gener. Comput. Syst. 2017, 75, 82–84. [Google Scholar] [CrossRef]
- Xu, F.; Li, Y.; Chen, M.; Chen, S. Mobile cellular big data: Linking cyberspace and the physical world with social ecology. IEEE Netw. 2016, 30, 6–12. [Google Scholar] [CrossRef]
- Xu, Z.; Liu, Y.; Yen, N.; Mei, L.; Lou, X.; Wei, X.; Hu, C. Crowdsourcing-based description of the urban emergency event using social media big data. IEEE Trans. Cloud Comput. 2016, 99, 1–11. [Google Scholar] [CrossRef]
- Nweke, H.F.; Wah, T.Y.; Al-garadi, M.A.; Alo, U.R. Deep Learning Algorithms for human activity recognition using mobile and wearable sensor networks: State of the art and research challenges. Expert Syst. Appl. 2018, 105, 233–261. [Google Scholar] [CrossRef]
- Nweke, H.F.; Wah, T.Y.; Mujtaba, G.; Al-garadi, M.A. Data fusion and multiple classifier systems for human activity detection and monitoring: Review and Open Research Directions. Inf. Fus. 2019, 46, 147–170. [Google Scholar] [CrossRef]
Figure 1.
Structure of the review paper.

Figure 2.
The Gartner’s Vector model.

Figure 3.
Business analytics process.

Figure 4.
Functional view of Hadoop.

Figure 5.
The primary component of Hadoop cluster.

Figure 6.
Overview of big data and business analytics in Hadoop.

Figure 7.
Common tools used in a Hadoop cluster.


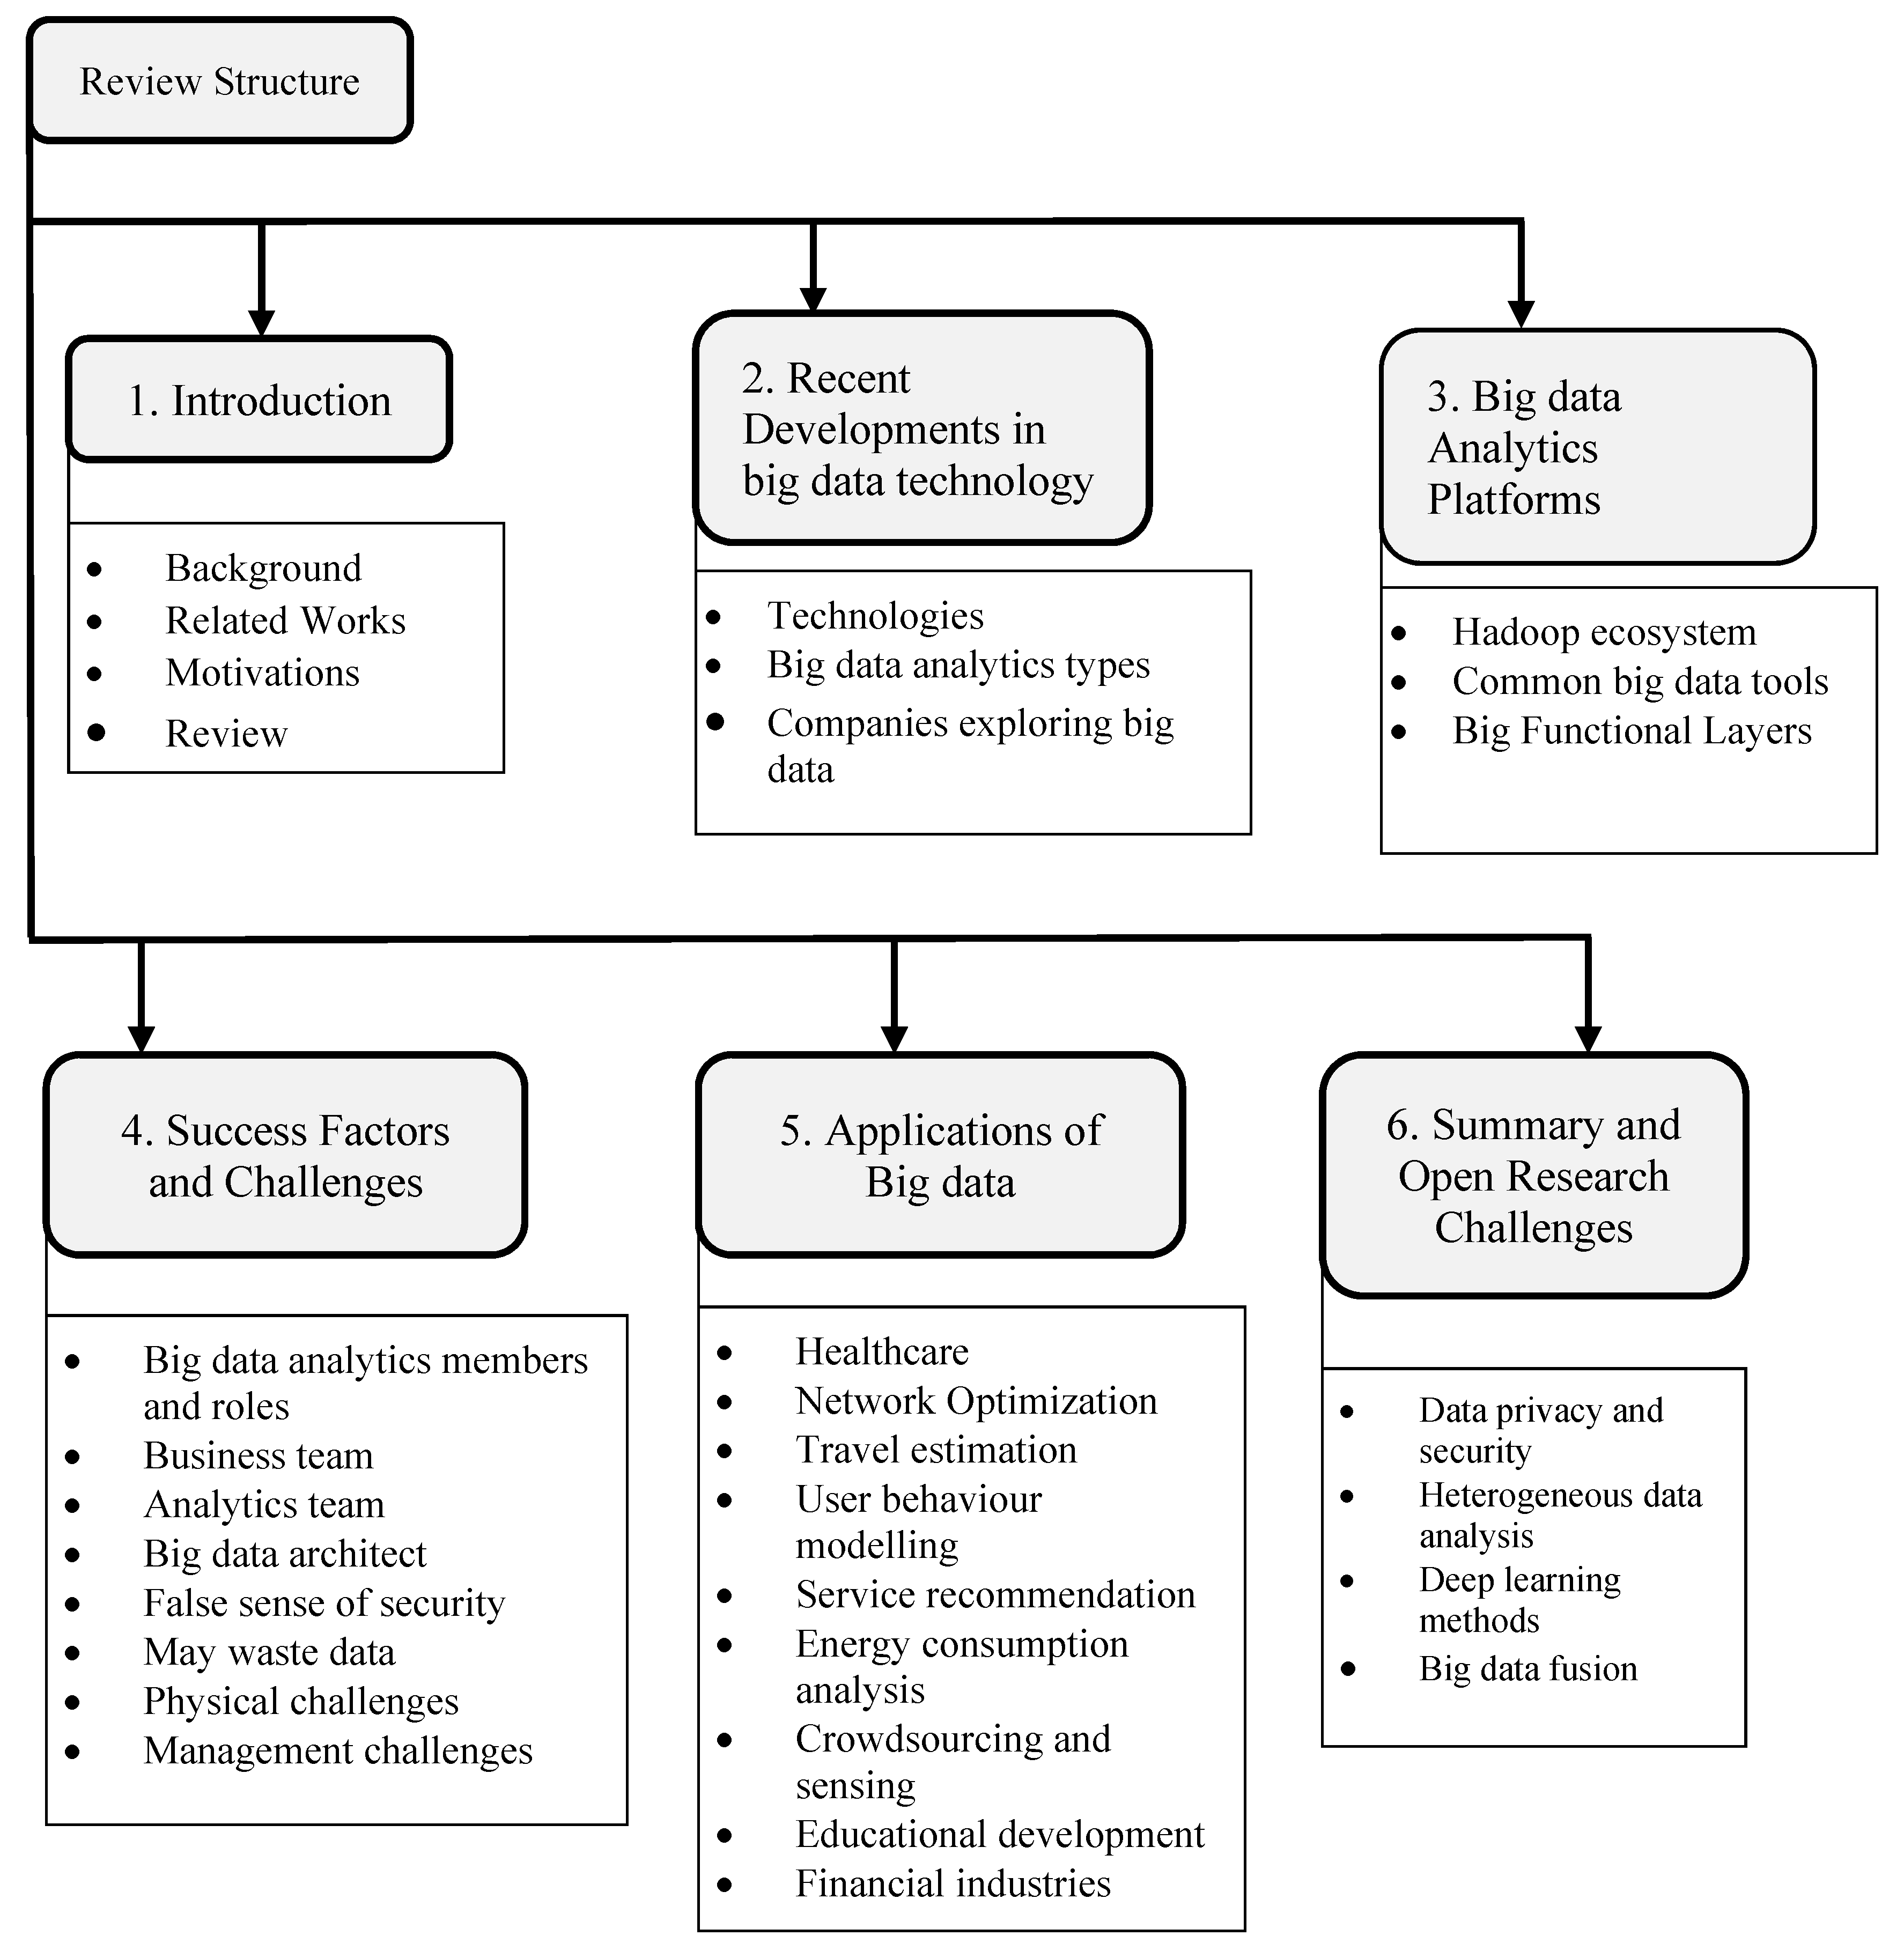
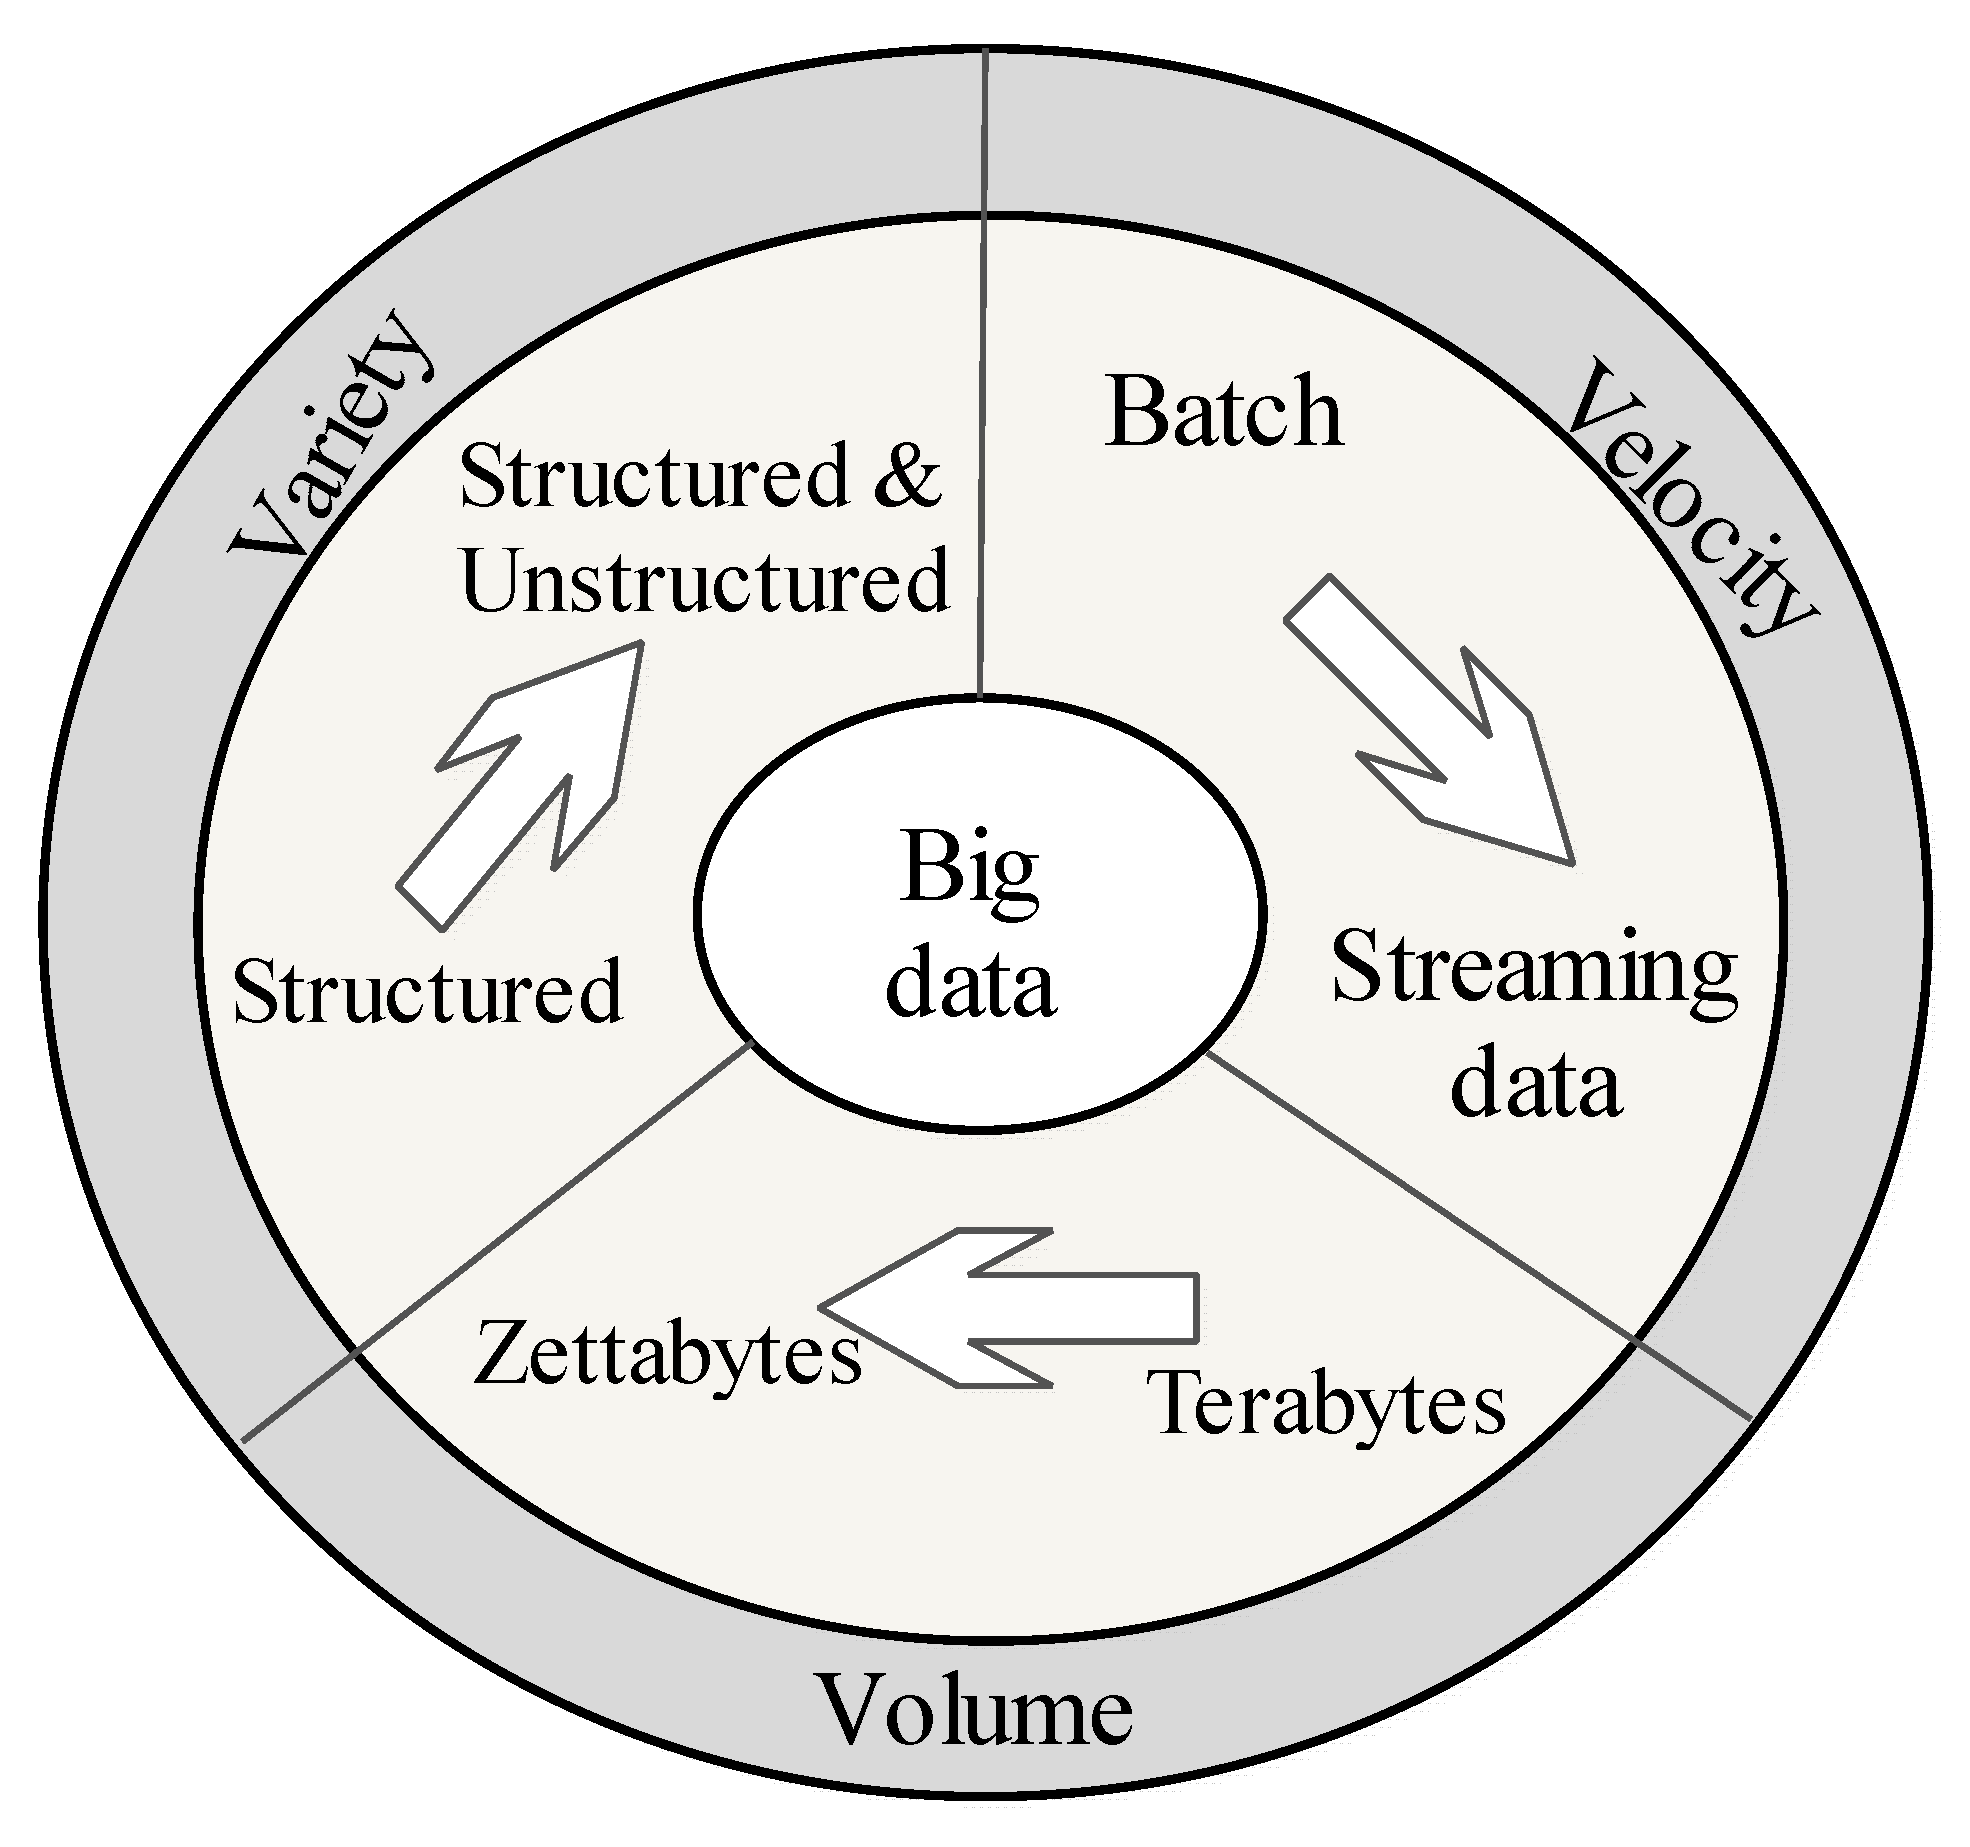
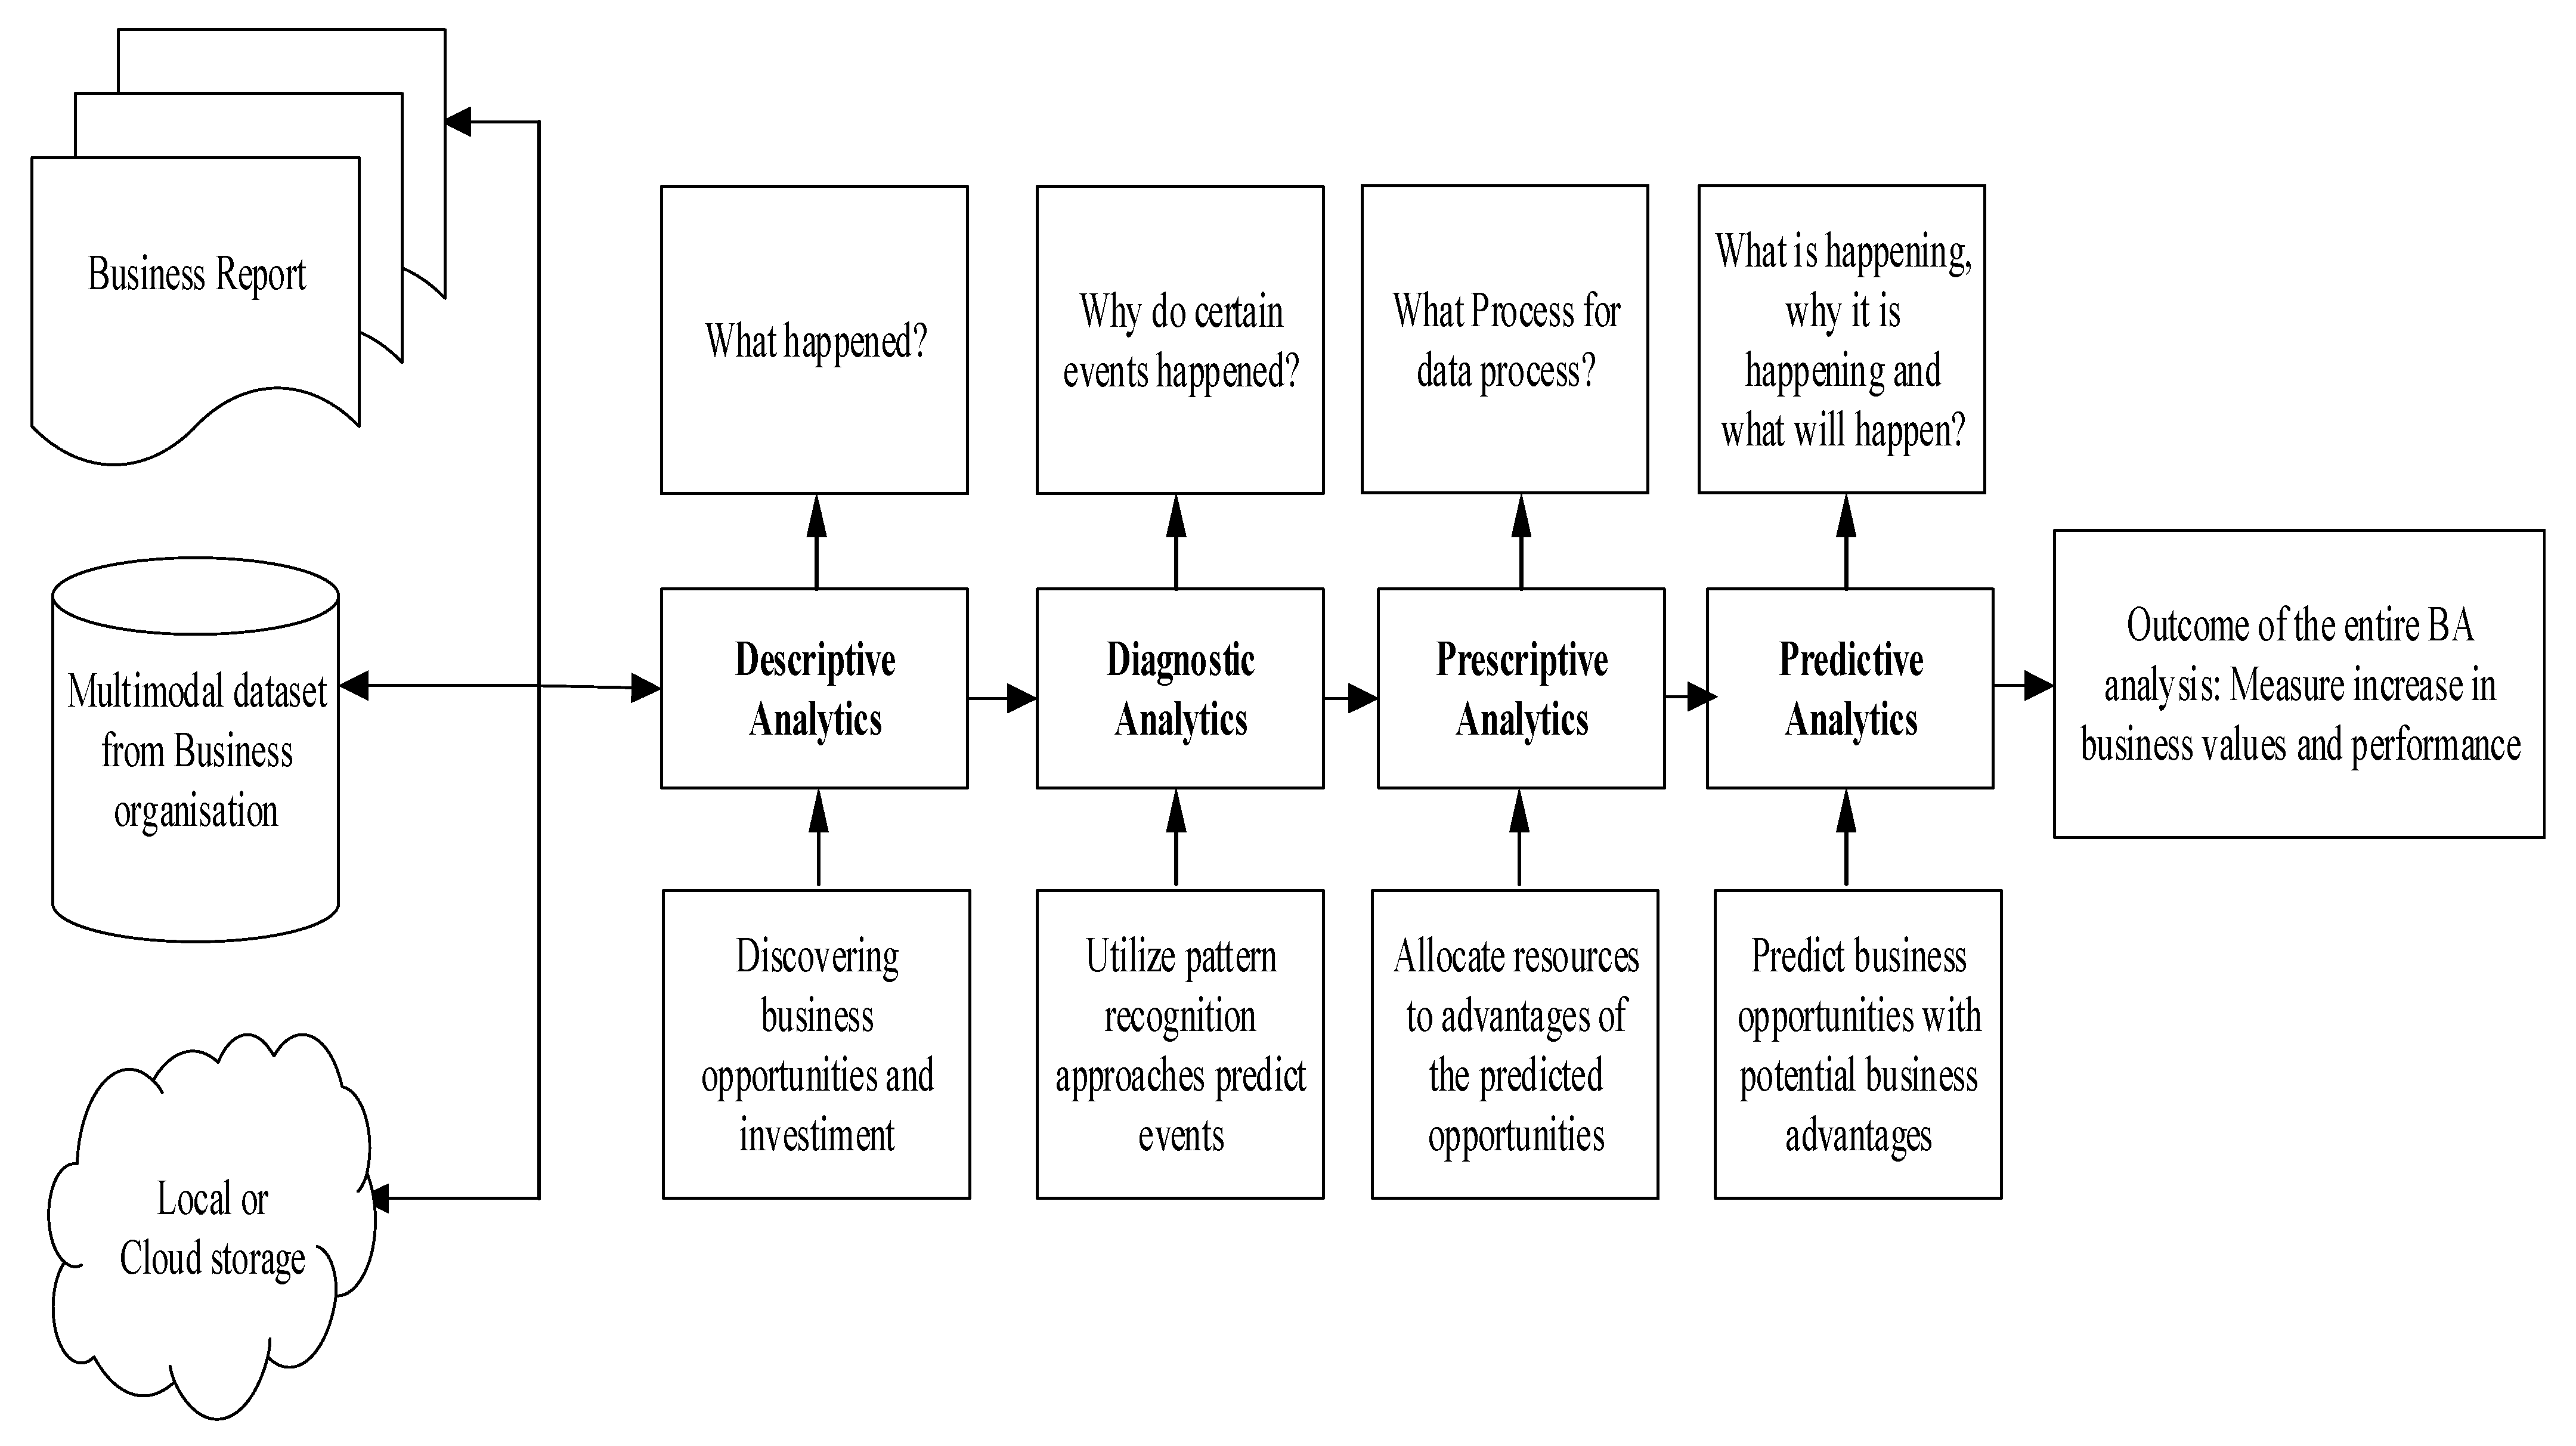
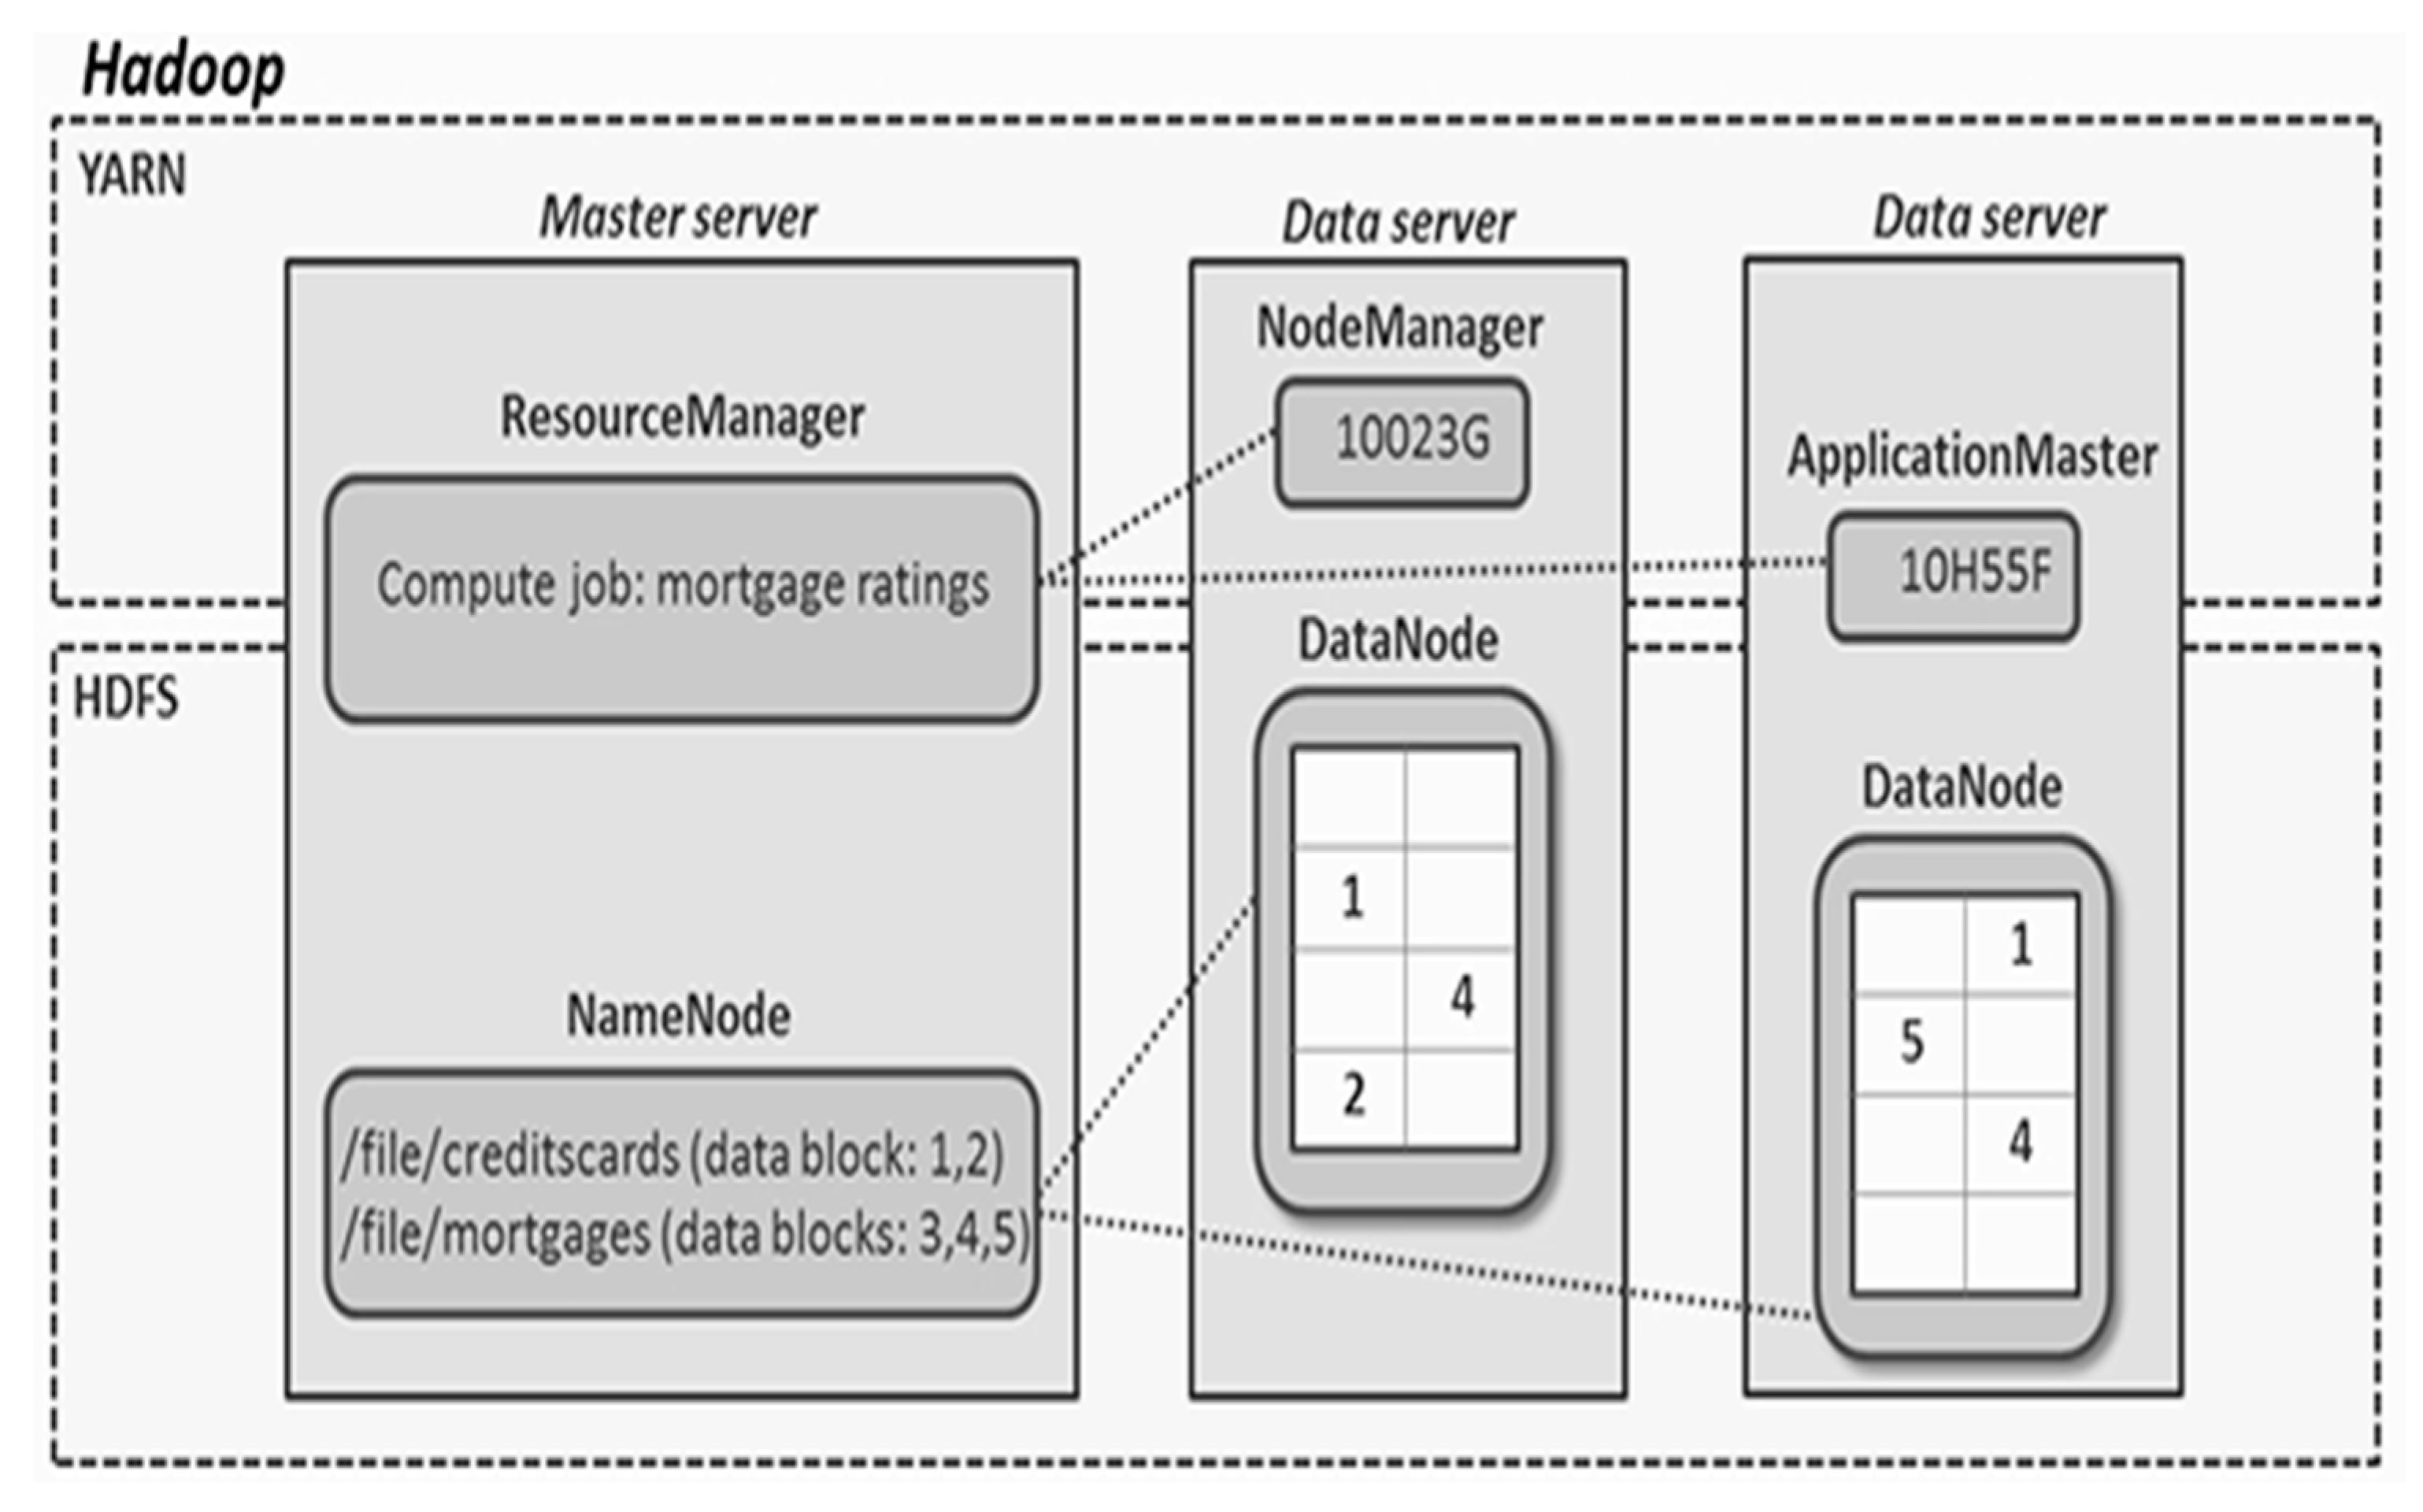
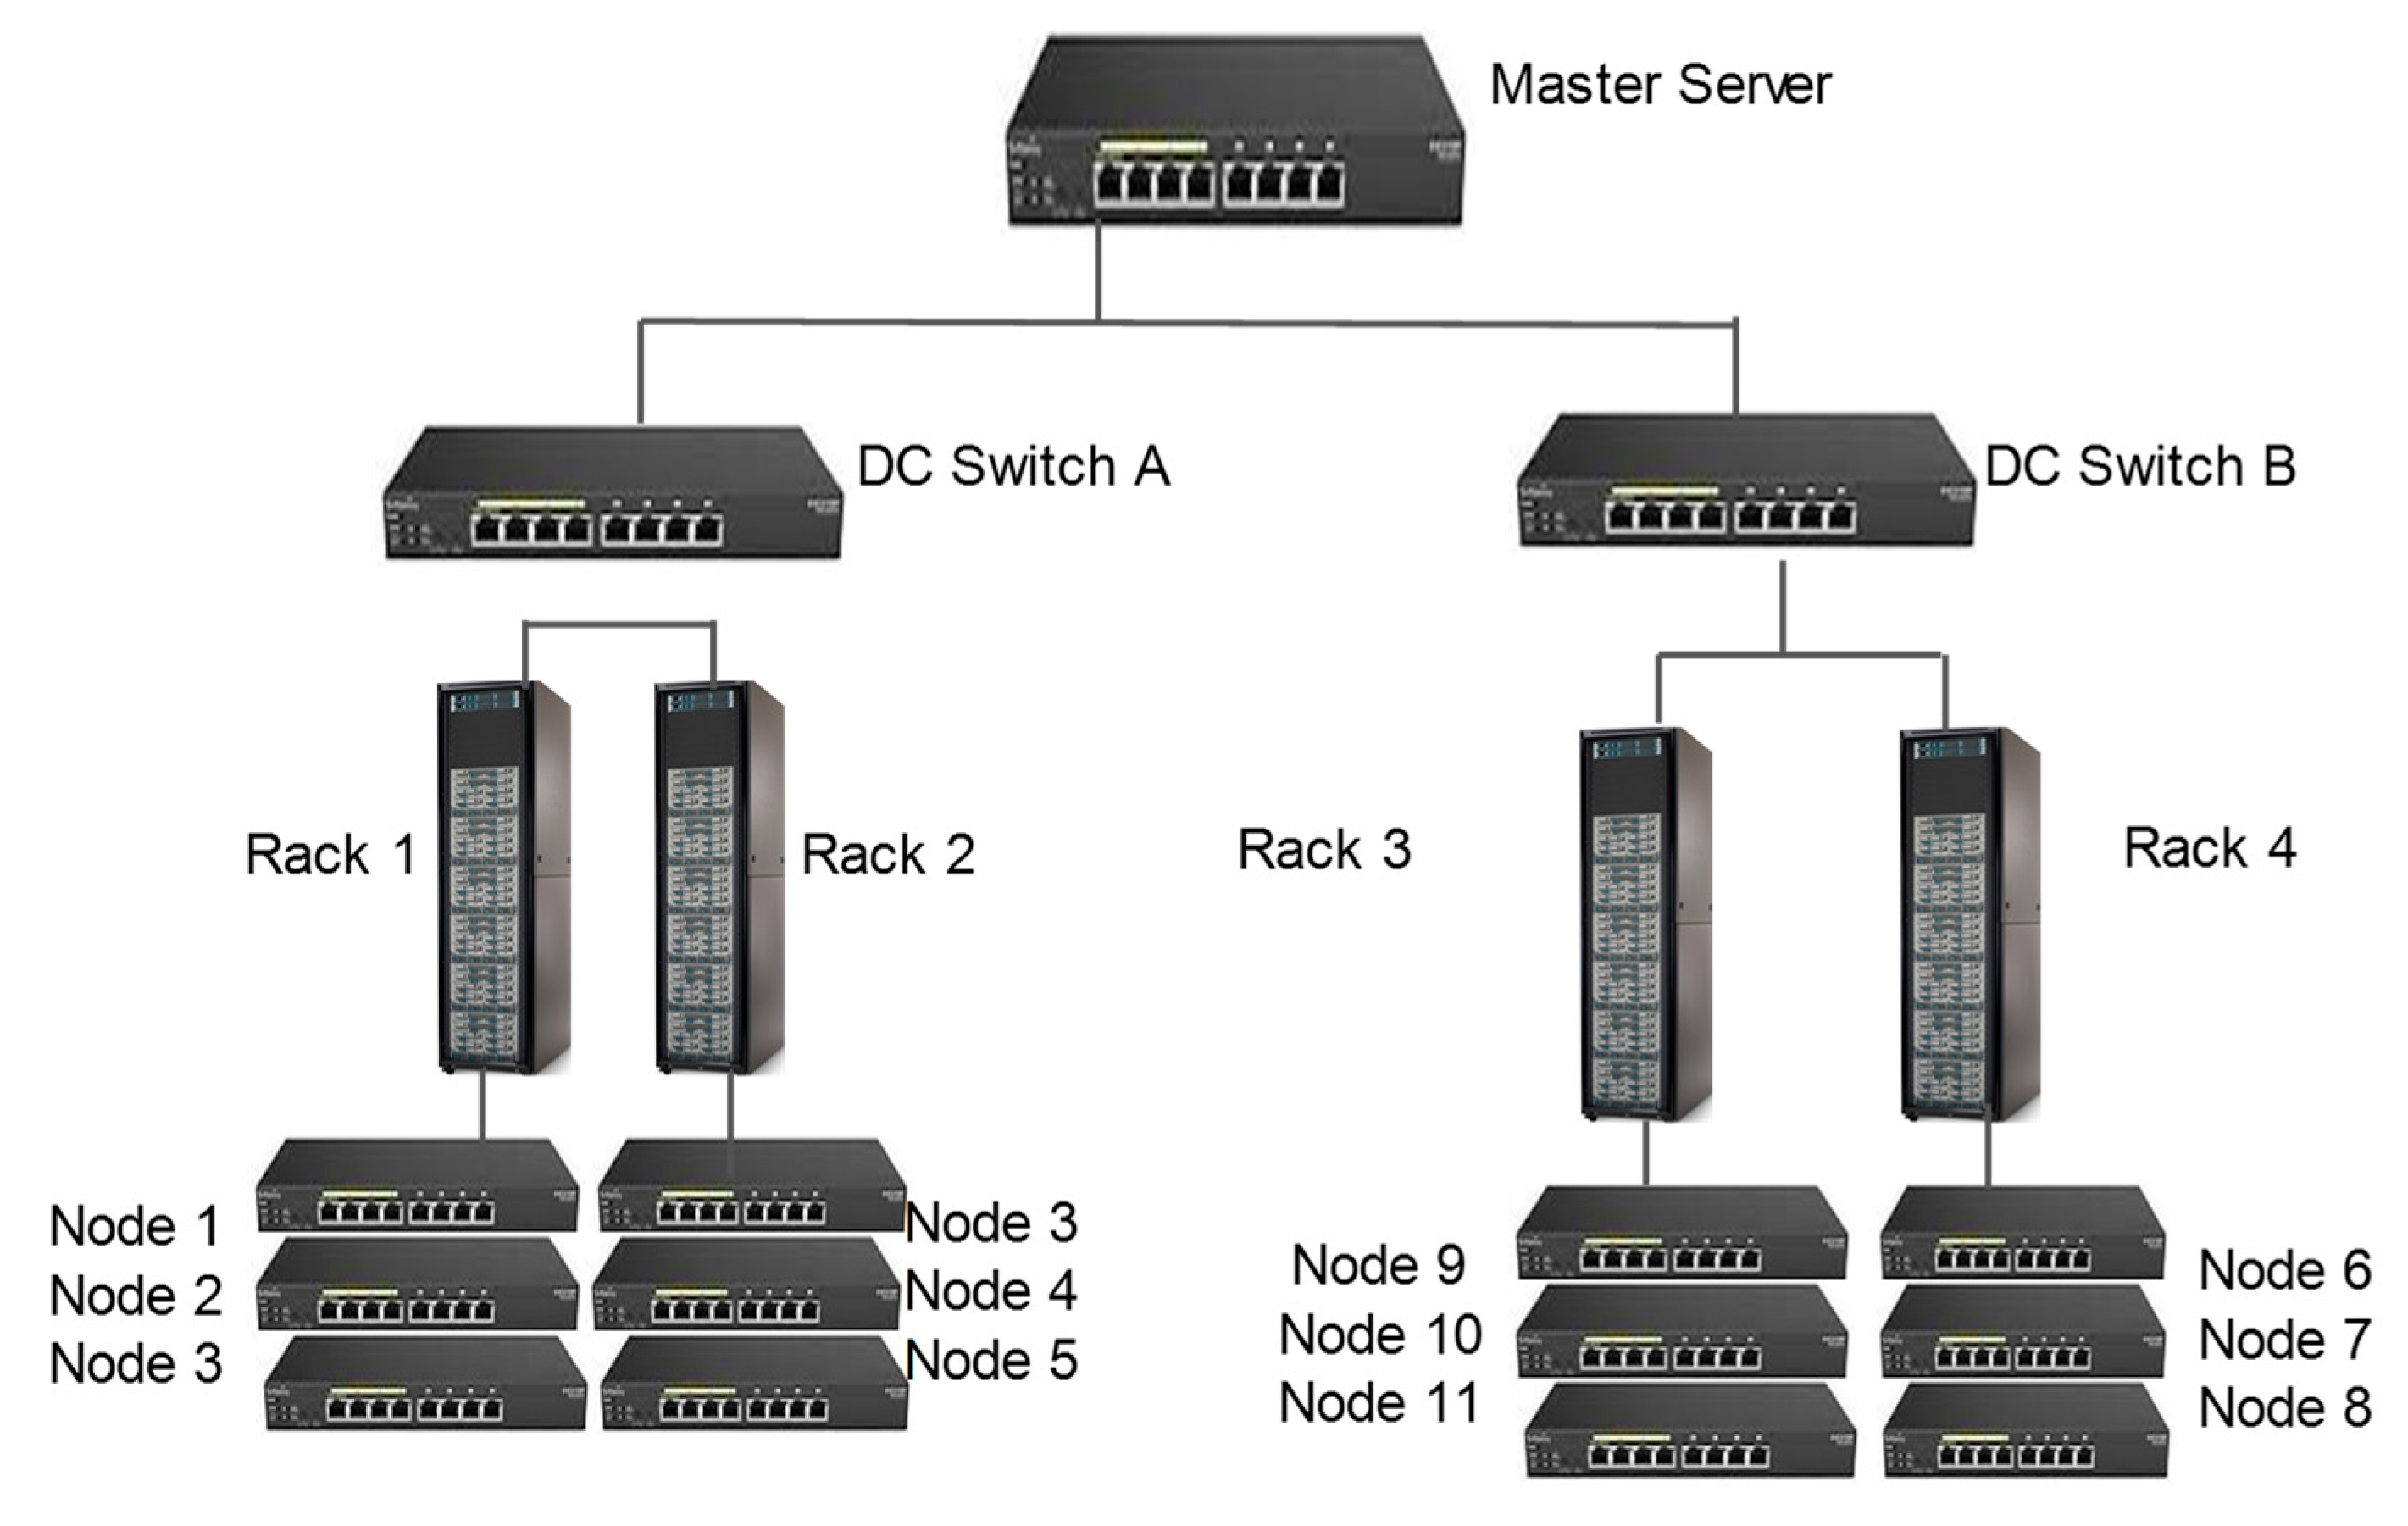
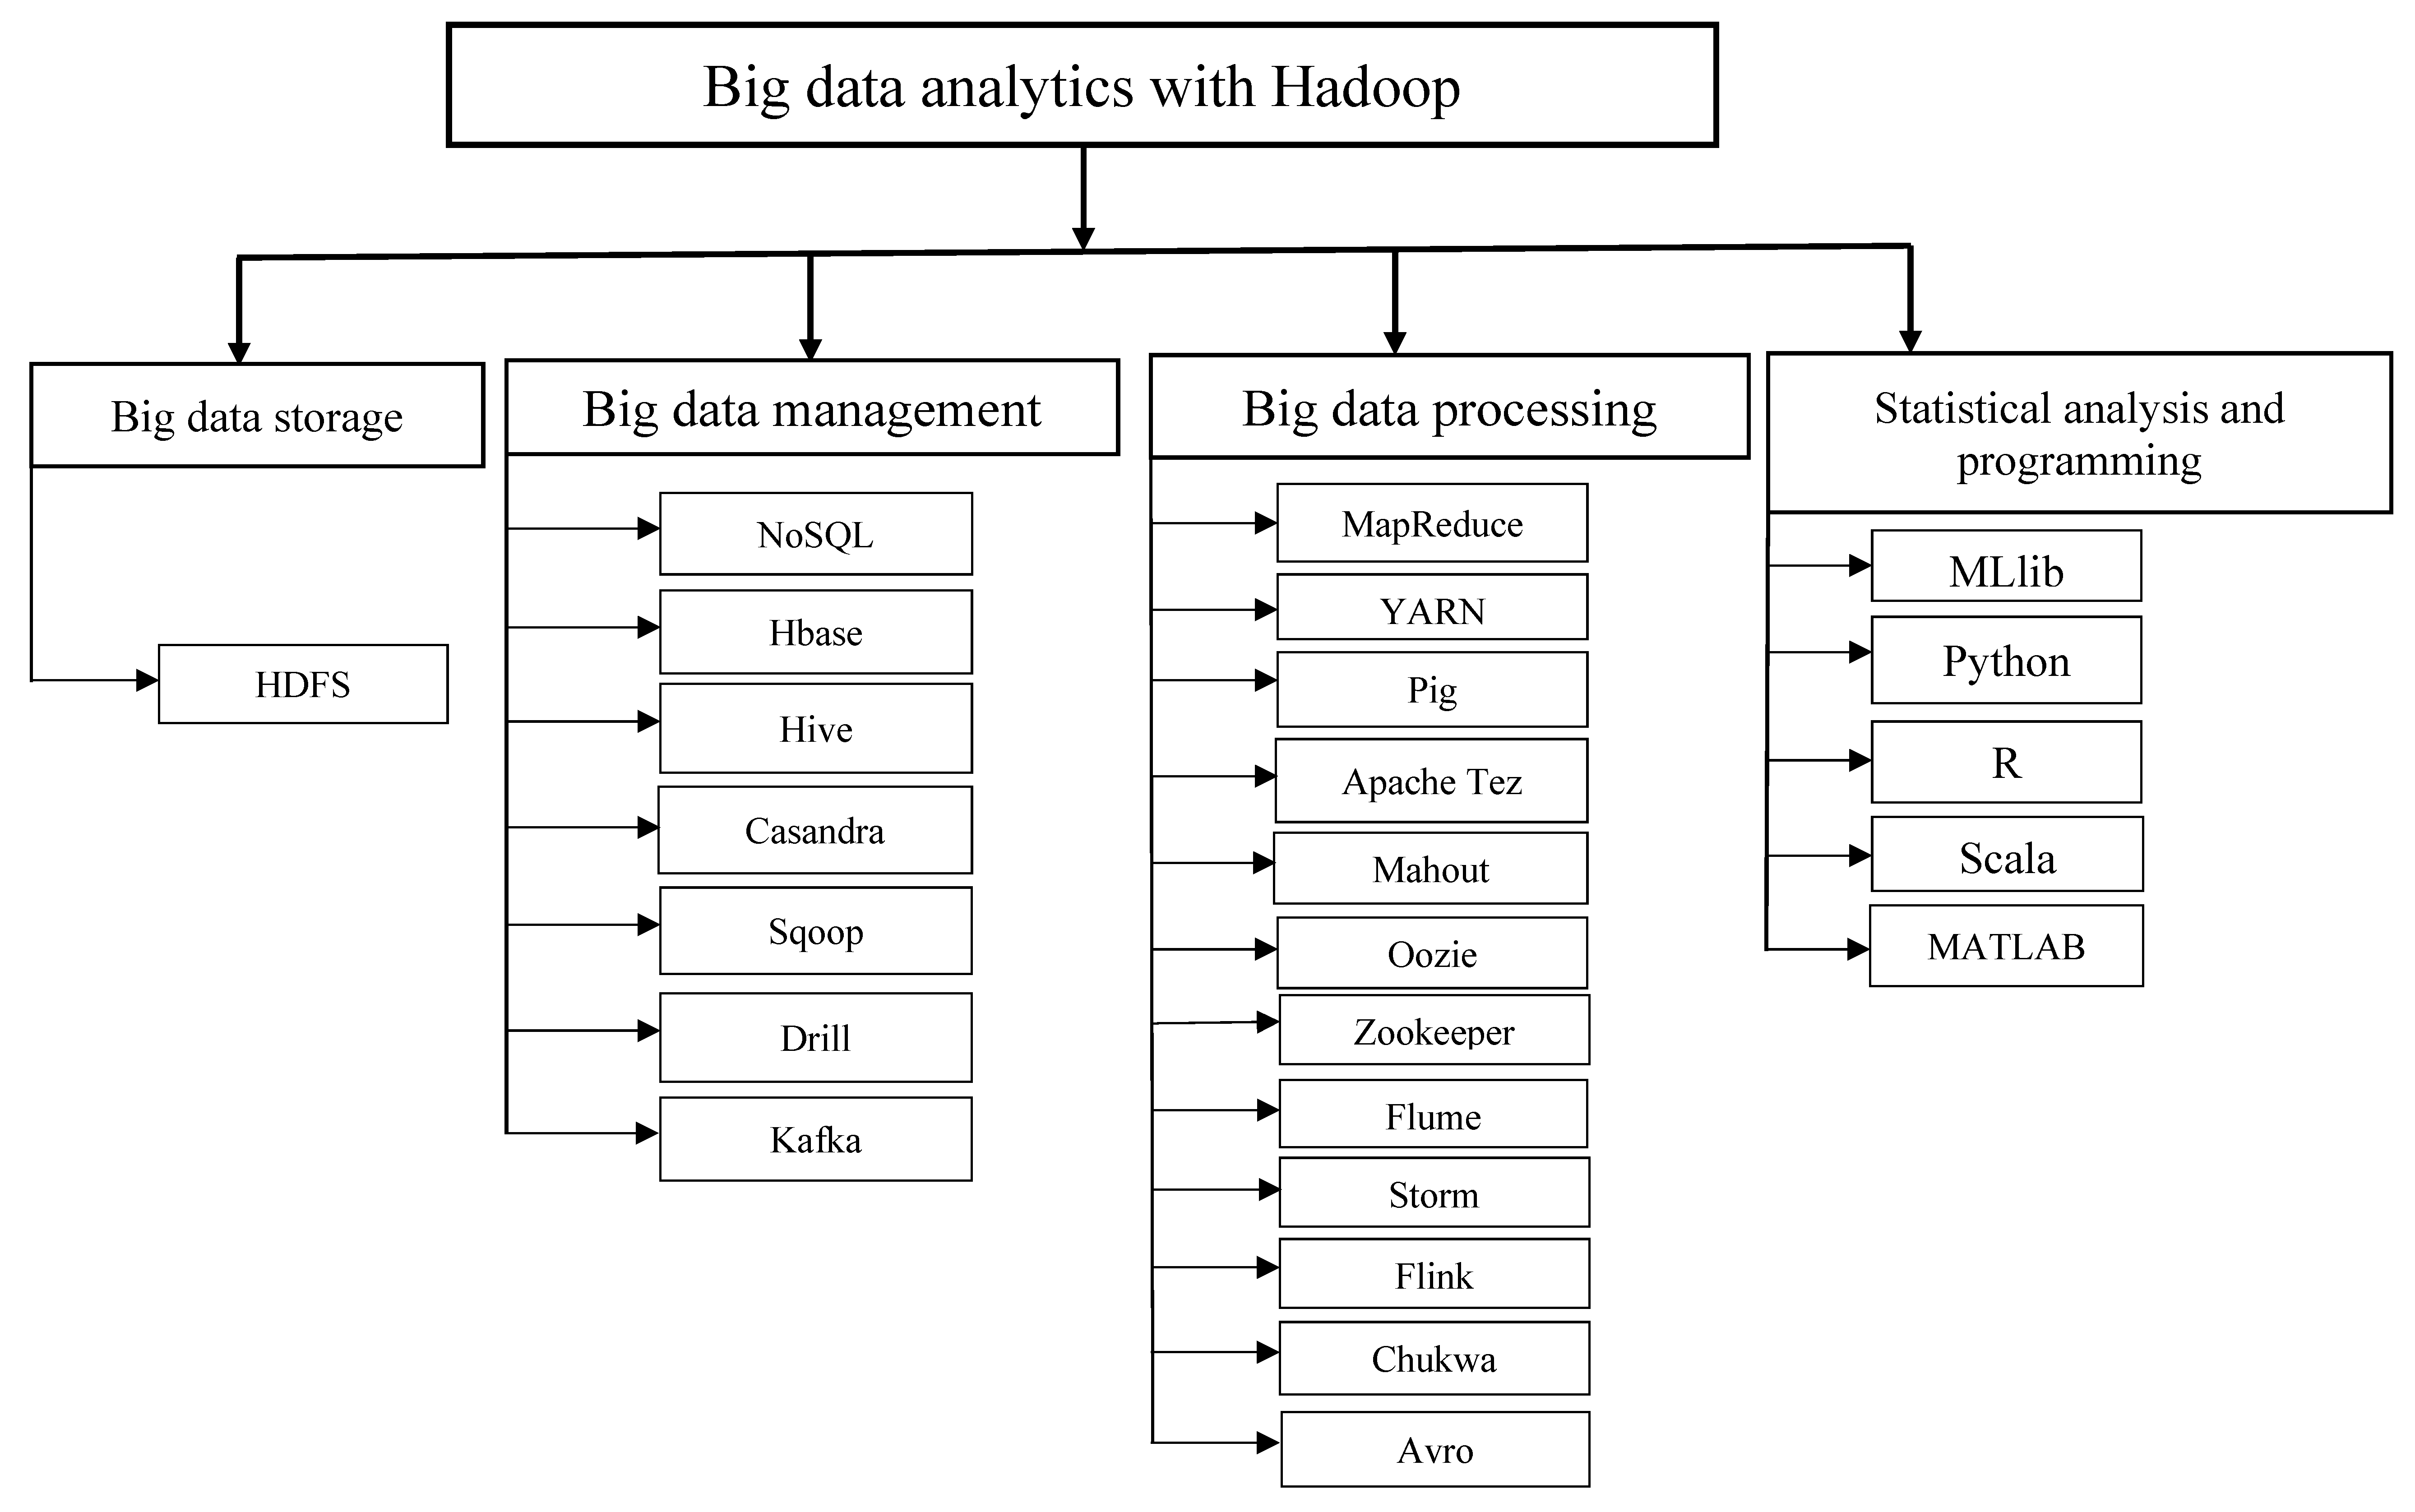
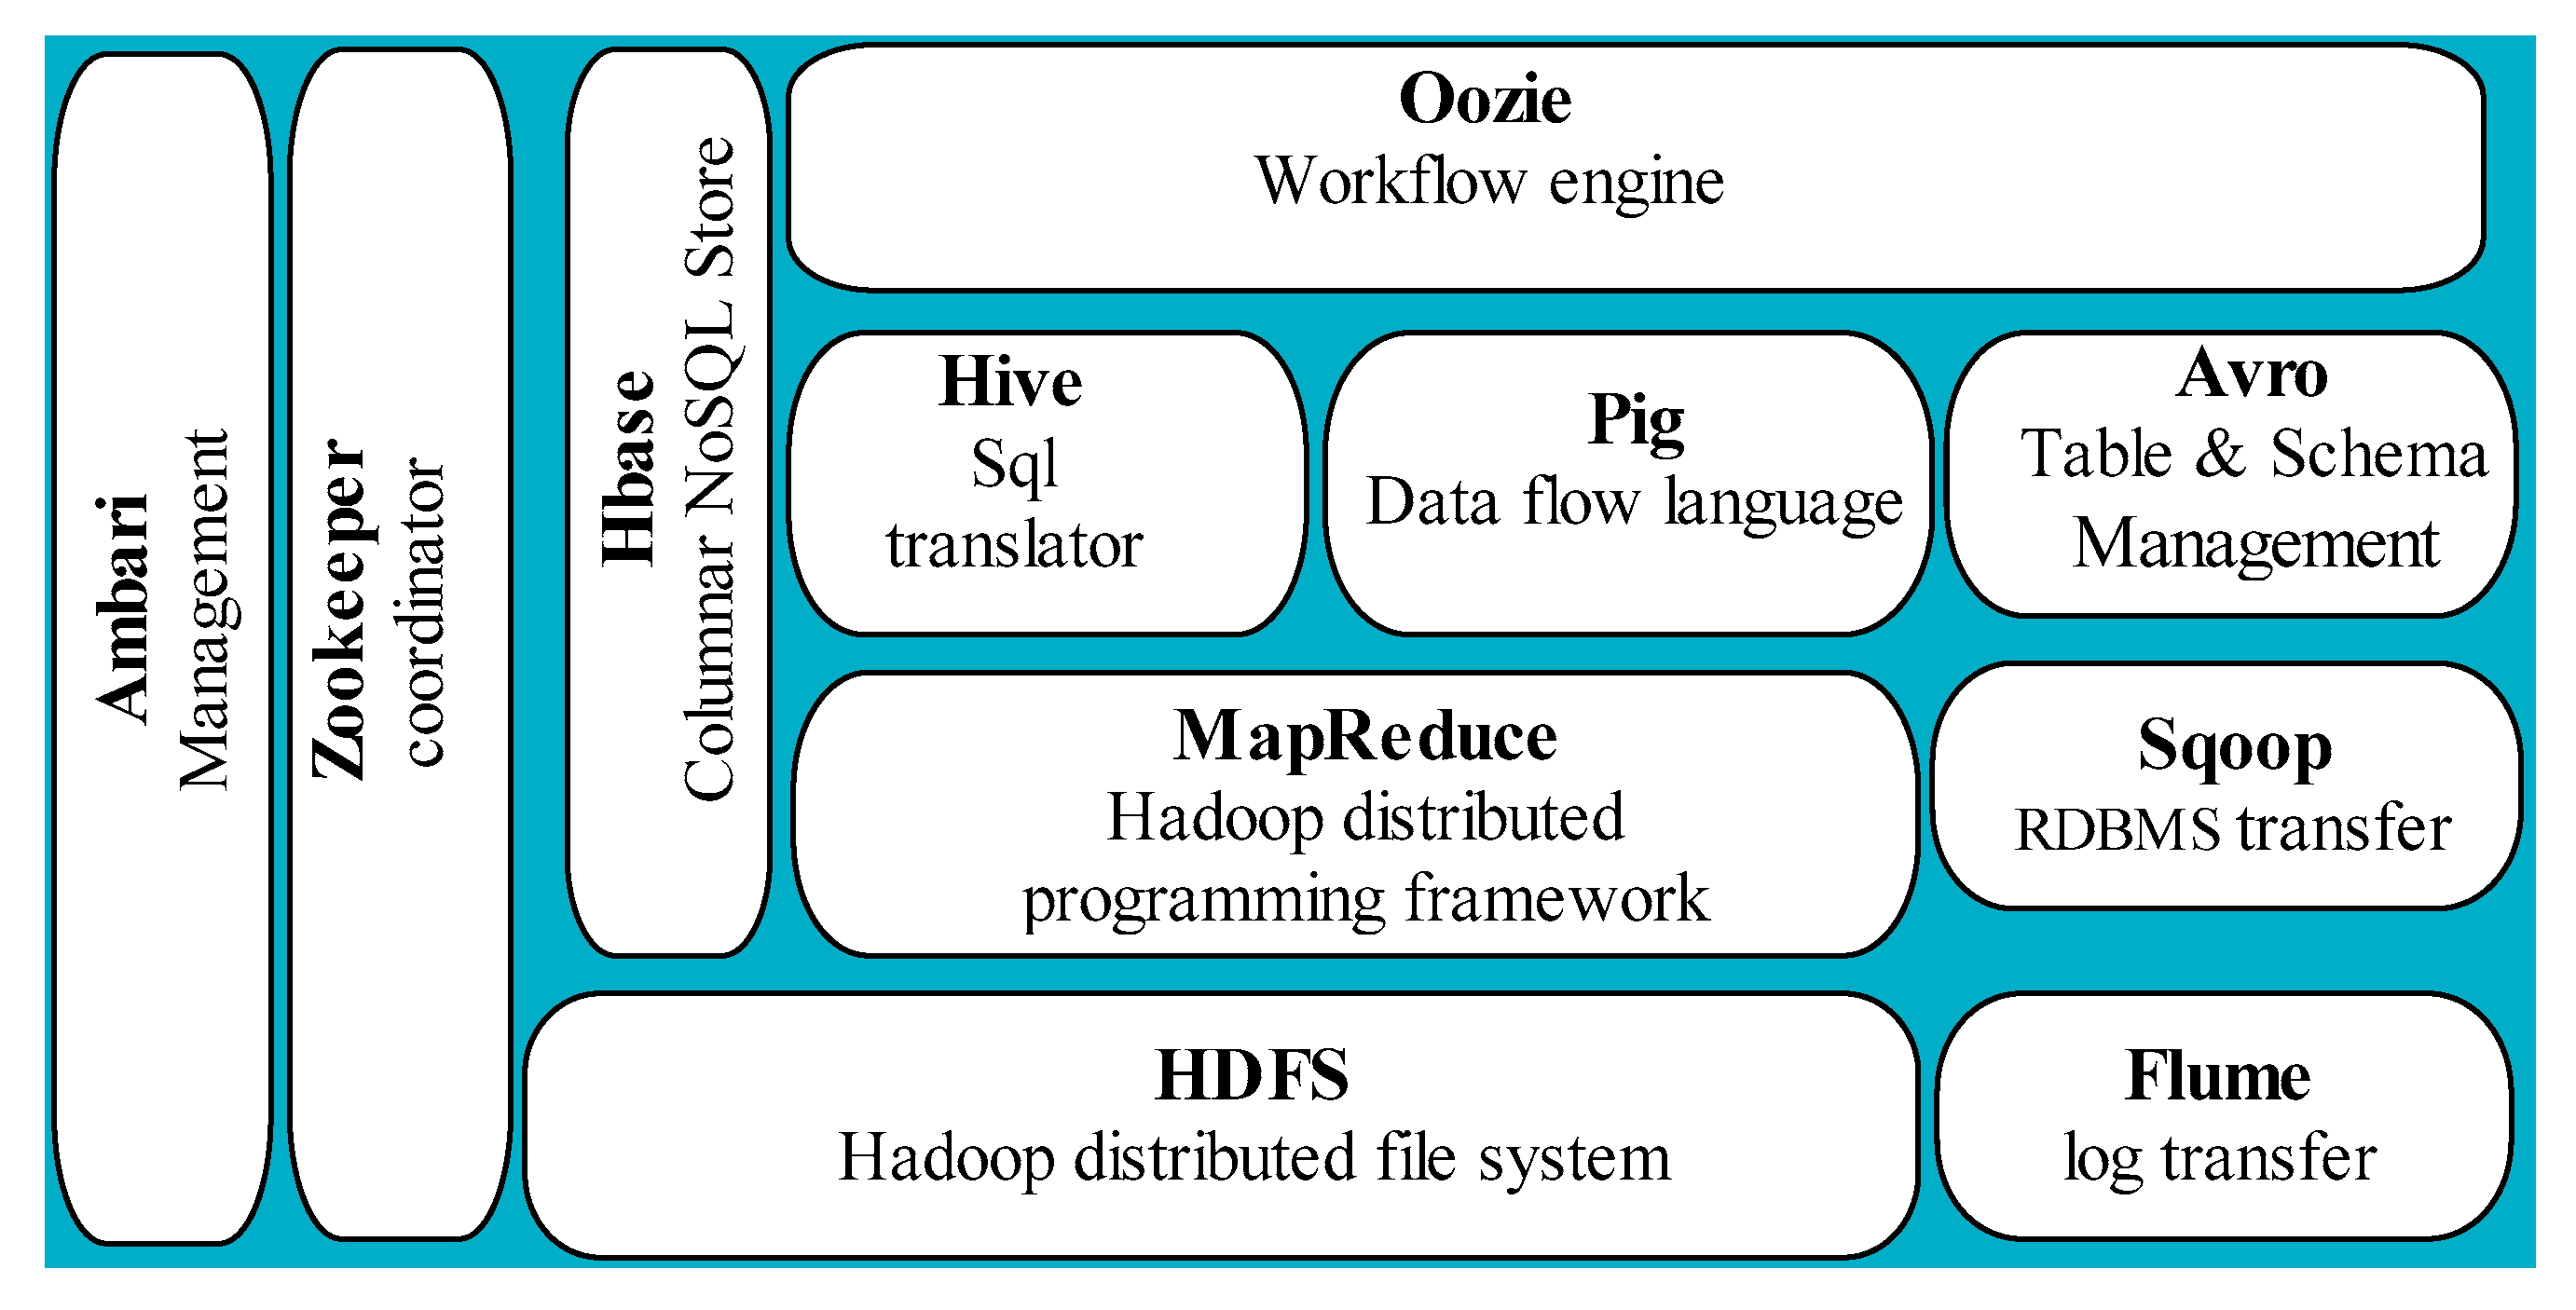
Table 1.
Recent review of big data analytics.
| References | Paper Title | Objectives | Comments |
|---|---|---|---|
| [7] | “Survey on platforms for big data analytics” | To discuss the in-depth analysis of hardware and software platforms for big data analytics | The study only focused on the hardware and software platform for big data analytics. The review is centered on the impact of parameters such as scalability, data sizes, resources availability on big data analytics. However, the review failed to discuss the recent applications and tools for big data analytics for effective business decision making |
| [4] | “The “rise of big data” in cloud computing: review and open research issues” | To review the intersection of big data and cloud computing | Discuss overview cloud computing and big data technology. In addition, the paper present basic definitions, characteristics, and challenges for the implementation of big data analytics in the cloud computing environment |
| [8] | “Big data analytics: A survey” | To provide a brief overview of big data analytics in terms of data mining and knowledge discovery approaches | Present traditional data mining, knowledge discovery and distributed computing approach for big data analytics. Nonetheless, challenges, applications, current tools and data sources for big data analytics were not discussed. |
| [9] | “A survey of open source tools for machine learning with big data in the Hadoop ecosystem” | Reviews and evaluates the criteria for choosing tools for big data analytics. | The review only focused on evaluating big data tools in terms of drawbacks and strengths. However, the review is narrowed to only tools while other criteria for effective big data implementation were not sufficiently covered. |
| [10] | Iterative big data clustering algorithms: a review | To review iterative clustering approaches for big data processing using MapReduce framework | The review is limited to the iterative clustering approach for big data processing. |
| [11] | “The state of the art and taxonomy of big data analytics: view from new big data framework” | To present a review of literature that analyzes various tools and techniques, applications and trend in big data research. | This study is closely related to our review as it present tools, trend and applications of big data analytics. Nevertheless, the study fails to present various analytics types that form the building block of big data analytics. In addition, the study failed to elaborately discuss the required metrics for achieving success in big data and business analytics. Moreover, challenges and future research direction for big data analytics were not sufficiently presented. |
| This paper | “Big Data and Business Analytics: State of The Art, Research Challenges and Future Directions” | To review big analytics methods and how big data analytics can lead to business success. | The study presents a comprehensive review of tools, application, data sources and challenges for big data and business analytics. Also, the study presents the strengths and weaknesses of various big data tools and open research directions that require further considerations. |
Table 2.
Key features of big data analytics tools, strengths, and weaknesses.
| Key Functions | Tools | Features | Strengths | Weaknesses | References |
|---|---|---|---|---|---|
| Data storage management | Hadoop distributed file system (HDFS) | Used for storage for high volumes of data. It is reliable and faults tolerant | Enable data to be read once and written many times with less expensive data storage. | Lack of the ability to efficiently support random read of a small amount of data. In addition, it difficult to manage Hadoop clusters. | [36] |
| Big database management | NoSQL | Non-relational database for storage, querying, and management of structured and unstructured data. | Require no normalization, union or join porting application. Moreover, provide elastic scaling by distributing the data across multiple hosts to reduce computation overload | Has a large amount of complexity, overlap and constant changes, and therefore require high expertise to implement | [36] |
| Hbase | NoSQL column database for data storage and column oriented data view. | Provide a mechanism for the storage of large dataset on top of the Hadoop distributed file system. Moreover, helps to aggregate and analyze billions of rows of the dataset in less time | Cross data operation and joins are difficult to implement. Also, HBase has a single point of failure and challenging to perform data migration from RDBMS external sources. | [43] | |
| Casandra | Apache Casandra was first developed at Facebook for analysis of the large volume of data. | Used by a large number of companies to handle a large volume of generated datasets. Moreover, Casandra is a column-oriented database with high throughput and quick response time. | It does not support database operation such as a subquery, join and data aggregation. Also, it provides limited storage space with single column values | [49] | |
| Apache Hive | Apache hive is used for big data operations such as summarization, query and data analysis using SQL like interface | Facilitate and maintain writing and managing of the large dataset using indexing approach. | Apache Hive is not suitable for online transaction processing. Also, it does not support database operations such as a subquery, update, and deletes. | [37] | |
| Sqoop | Tools for importing and exporting large dataset into and from RDBMS | Provide a computational off-loading mechanism to reducing data processing time | Complicated to provide change operation and require special handling to implement incremental data import | [40] | |
| Apache Spark | Hadoop tools for real-time processing and machine learning | Efficient for a reading/write operation, batch processing, join streams and ability to handle failures of any worker nodes. Furthermore, Spark support implementation using multiple and commonly used programming languages with built-in App. | Challenging to provide real-time processing. Also, have a problem processing small dataset and require manual optimization for a specific dataset. | [41] | |
| Big data processing | MapReduce | Hadoop distributed programming framework for batch processing, resources scheduling and compute job management. | Highly scalable due to the ability to store a large volume of distributed data and also cost-effective | Inability to handle interactive, in-memory and graph processing. In addition, map reduce are not configured for small dataset. | [36] |
| YARN | Responsible for resource allocation and job scheduling in Hadoop. It is the operating systems of Hadoop 2.0 that manage resources across multiple clusters, maintain meta-data of information and keep track of user information. | Addition of YARN in Hadoop help to ensure efficient utilization of resources and high availability of data. | Challenging to set up accurate parameter configuration and require extensive knowledge of each parameter | [56] | |
| Mahout | Tools for large arrays of data processing scheme such as clustering, classification, regression, collaborative filtering, statistical modeling, and segmentation. | Used for complementary and distributed mining of large volume of data | Lack of support for popular big data development languages such as Scala. Furthermore, Mahout has little documentation to support effective learning | [44] | |
| Oozie | Workflow and coordination tool for parallelization of jobs in Hadoop cluster. | Allow workflow of execution of multiple jobs with fault tolerance. Moreover, it provides web service API for seamless control of scheduled jobs. | Oozie is not suitable for off-grid scheduling. | [42] | |
| Apache Tez | Data processing framework to define workflow and steps of execution using a directed acyclic graph. | Flexible with a simplified interface for speedy data processing. Moreover, it is easy to switch over from MapReduce platform | It utilizes MapReduce strict map, shuffle and reduce approach and very challenging to process data that didn’t fit into such pattern. | [46] | |
| Flink | Big data processing tools for handling batch and streaming operation. It is efficient for real-time analysis and distributed stream processing in Hadoop. | Provide high-performance data operation with efficient fault tolerance mechanism based on a distributed snapshot. In addition, Apache Flink provides a single run-time environment for both data streaming and batch processing. | Flink is not widely used for big data processing and lacks a high number of community contributions. | [47] | |
| Flume | Apache flume is used for extracting data in and out Hadoop. | Provide simple and flexible architecture for efficiently aggregating and moving large streaming data into HDFS | Low scalability and the high point of failure. | [39] | |
| Pig | Is responsible for data flow representation, cleaning, and analysis of large dataset using Hadoop ecosystems | Apache Pig is easy to learn and analyze big data without writing complicated MapReduce program. | Lack of appropriate documentation and support when encountered errors during operation. | [38] | |
| Storm | Tools for online machine learning, real-time data analytics for analyzing a large amount of real-time data, streaming and real-time processing | Efficient for non-complicated streaming operation, low latency, and high throughput streaming operation | Lack of advanced features for event time processing, data aggregation and implicit support for state management. | [48] | |
| Zookeeper | Zookeeper ensure robust synchronization, configuration management and name identification with Hadoop cluster | Provide high data availability, serialization, reliability and minimize data inconsistencies with clusters. | Require high maintenance of large arrays of the stack within the clusters | [50] | |
| Chukwa | Open source tool built on top of HDFS and MapReduce framework for monitoring of large distributed systems | Provide features such as scalability, flexibility and robust tools for data monitoring, visualization and analyzing results. | Apache Chukwa is highly dependent on the Hadoop cluster and MySQL with a lack of technical support for users. | [52] | |
| Avro | Provide a platform for big data query processing and data reduction to minimize computation time. | Fast and smaller in size which helps to improve query processing. | Provide slower serialization of data. | [51] | |
| Statistical analysis, programming and machine learning | MLlib | Open source machine learning in Apache spark for big data processing, classification, and clustering. In addition, it is highly interoperable with python libraries such as Numpy, Scipy and R languages | MLib is very fast, dynamic in nature, reusable features and fault tolerance | High latency, memory usage, require manual optimization and lack of efficient file management system | [45] |
| R programming | Open source programming language for data visualization and analysis, complex data handling, efficient data storage, and vector operation | Has strong support for common data operations such as data cleaning, reading and writing into memory, storage, data mining, machine learning, and data visualization. Furthermore, it is appropriate for handling big data processing and analysis | Issues bothering on efficient memory management, and slow. In addition, it has a steep learning curve and maybe challenging to master by a non-programmer | [54] | |
| Python programming | General purpose programming language and deploy large open source packages for computing and data modeling, preprocessing, data mining, machine learning, natural language processing, and network graph analysis | User-friendly, object-oriented, flexible and support multiple platforms for integration with other big data processing system such as Apache Spark | Slow and not efficient for memory intensive operation | [53] | |
| Scala Programming | Object and functional programming language for complex application development which requires a Java virtual machine environment for data processing. Scala support big data processing and management through Apache Spark | Fast, simple and inherently immutable that minimize much-threaded safety in similar languages | Challenging to learn, lack of easy implementation and limited backward compatibility | [55] |
Table 3.
Applications and key data sources for big data and business analytics.
| Application | Key Data Sources | Features |
|---|---|---|
| Healthcare | Electronic health record, patients’ information, images, health history data. | Support improved health monitoring, study patients’ immune systems, activity recommendation for elderly physical health |
| Financial Industries | Financial reports, stock news, blog post, social media, and annual general meeting information | Provide a mechanism for fraud detection, mitigate against money laundry and decision making |
| Network Optimization | Network signal information, information between network users, weblog, geo-location data, sensor data, video camera, and network log | Efficient network signaling, prediction of network variation, network management and to generate cell deployment information |
| Travel estimation | GPS data, location data, satellite imagery, personal information, call data record(CDR) | Provide information for complex route recommendation, location tracking, drone routing for a military operation, emergency situation and infectious disease identification |
| User Behavior Modeling | Log data, social media data, blog post, tweets, and product review | Effective and efficient individual service recommendation. |
| User mobility modeling | Location data, GPS | Maintain global movement pattern to enable disease containment and transportation planning |
| Service Recommendation | Customer product review, product selection, location data, buying behavior data. | Enhanced product buying using customer product review and ascertain weaknesses and strength of products |
| Energy Consumption Analysis | Gas status, consumption pattern data, location data, smart meter reading data, and usage history. | Promote green energy, conservation, and efficiency through energy consumption prediction. |
| Crowdsourcing and sensing | Sensing data such as accelerometer, gyroscopes, magnetometer, electrocardiograph (ECG), pulse rate, electromyography (EMG), online questionnaire and survey. | Approach for large scale data collection project using a smartphone and online platforms. |
| Educational development | Student information, examination information, student enrollment, course allocation, course contents, | Predict student enrollment ratio and dropout rate after particular course or session |
© 2019 by the authors. Licensee MDPI, Basel, Switzerland. This article is an open access article distributed under the terms and conditions of the Creative Commons Attribution (CC BY) license (http://creativecommons.org/licenses/by/4.0/).
Share and Cite
MDPI and ACS Style
Ajah, I.A.; Nweke, H.F. Big Data and Business Analytics: Trends, Platforms, Success Factors and Applications. Big Data Cogn. Comput. 2019, 3, 32. https://doi.org/10.3390/bdcc3020032
AMA Style
Ajah IA, Nweke HF. Big Data and Business Analytics: Trends, Platforms, Success Factors and Applications. Big Data and Cognitive Computing. 2019; 3(2):32. https://doi.org/10.3390/bdcc3020032
Chicago/Turabian StyleAjah, Ifeyinwa Angela, and Henry Friday Nweke. 2019. "Big Data and Business Analytics: Trends, Platforms, Success Factors and Applications" Big Data and Cognitive Computing 3, no. 2: 32. https://doi.org/10.3390/bdcc3020032