
Fuzzy Neural Network Expert System with an Improved Gini Index Random Forest-Based Feature Importance Measure Algorithm for Early Diagnosis of Breast Cancer in Saudi Arabia

 ,
,  ,
,
Abstract
:1. Introduction
- How to develop an expert system that would address the uncertainty often associated with diagnosis of breast cancer?
- How to address the heavier burden on the overlay of the network nodes of fuzzy neural network system with feature selection technique?
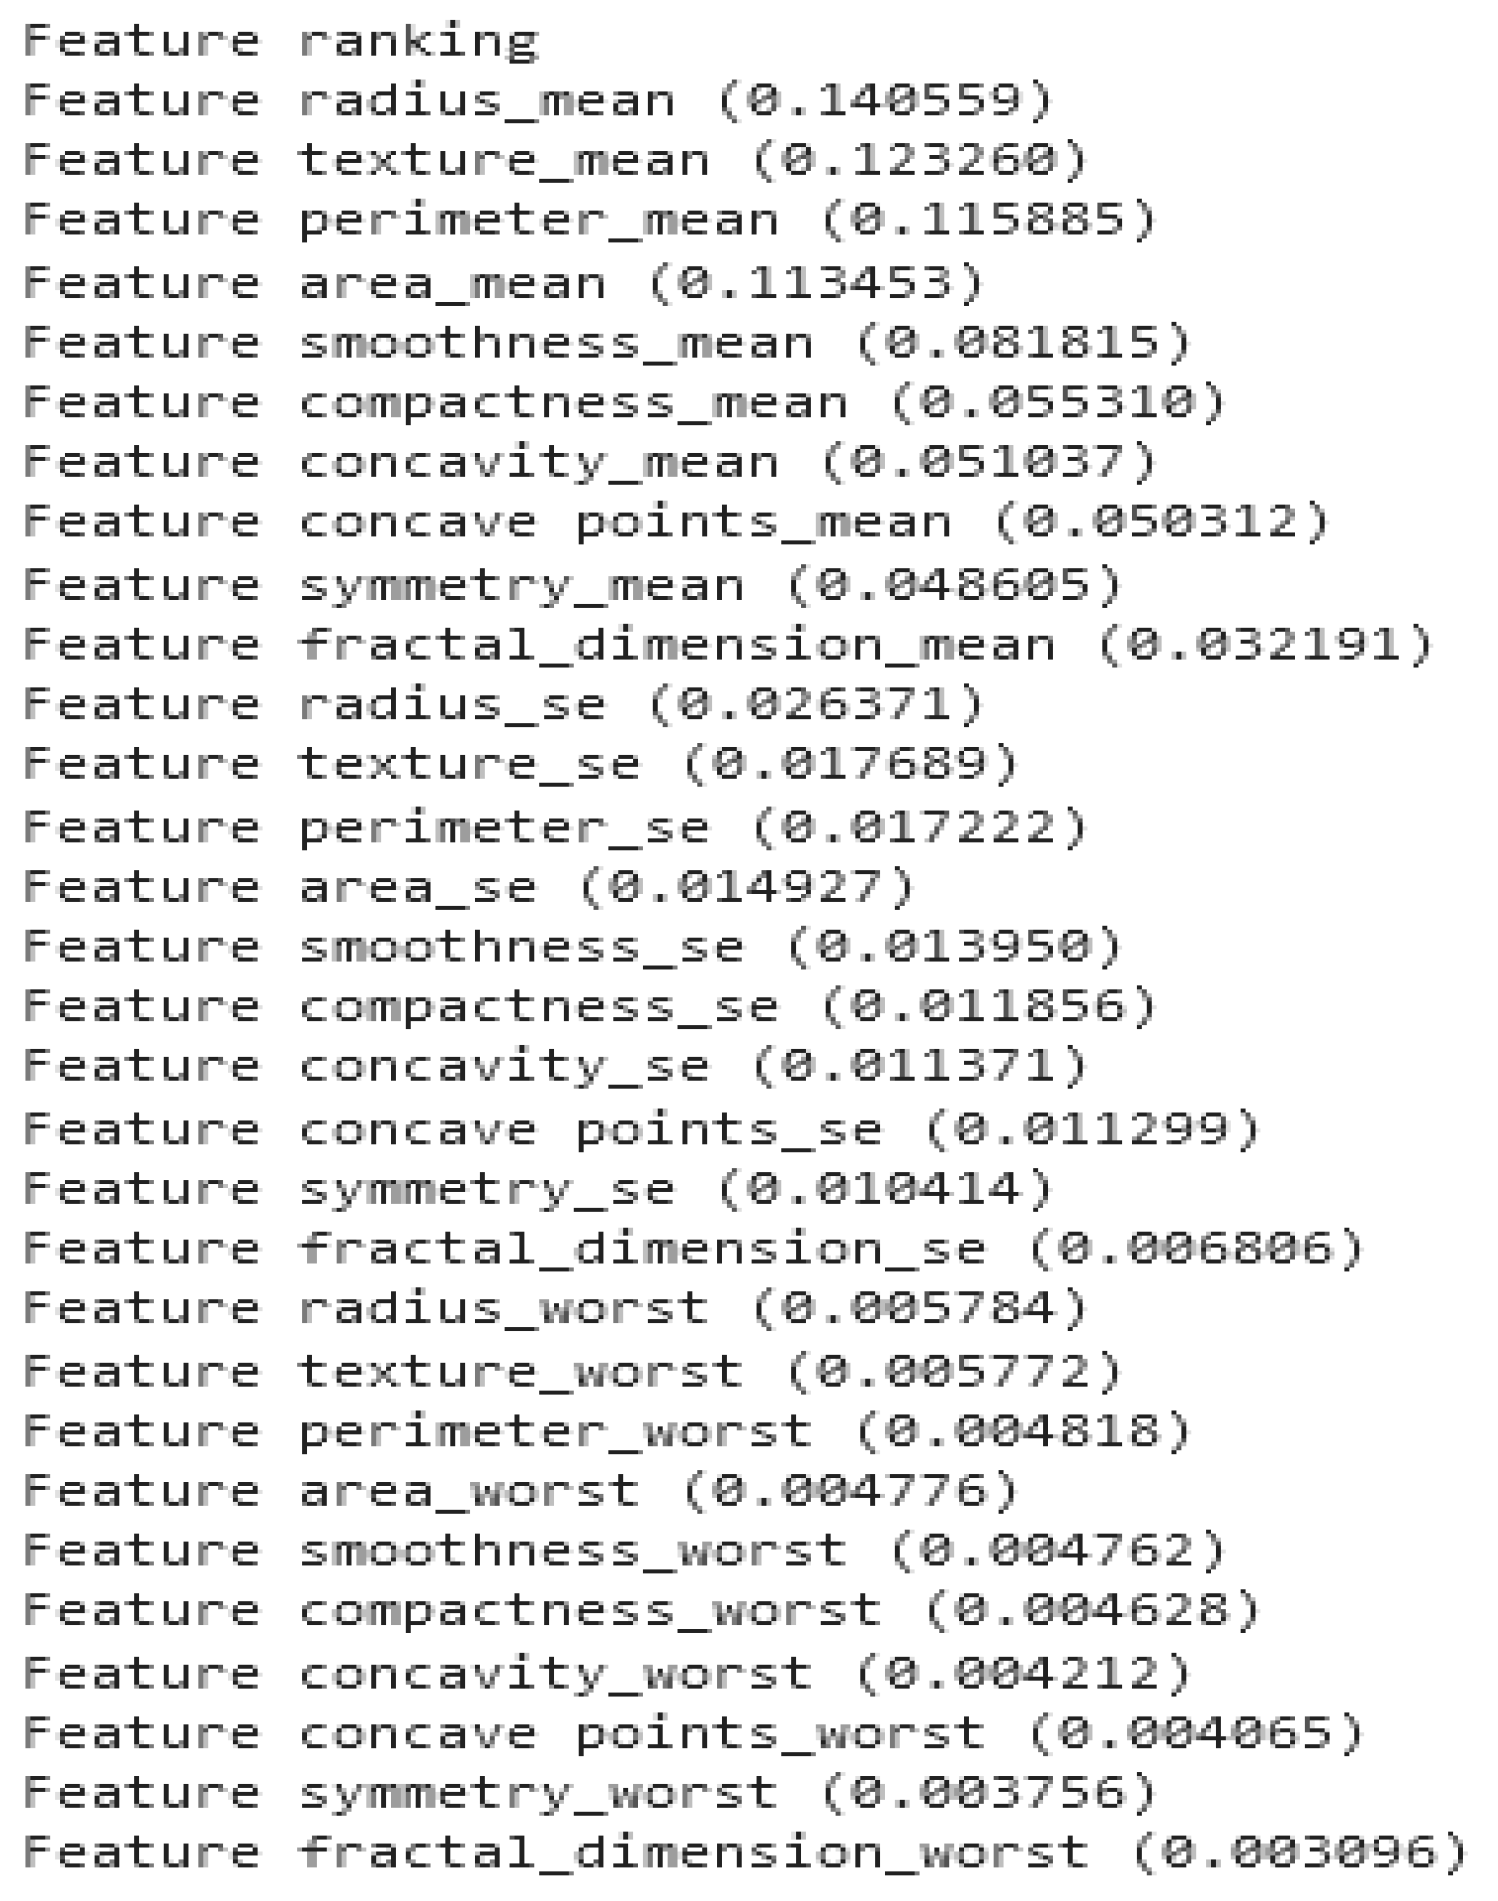
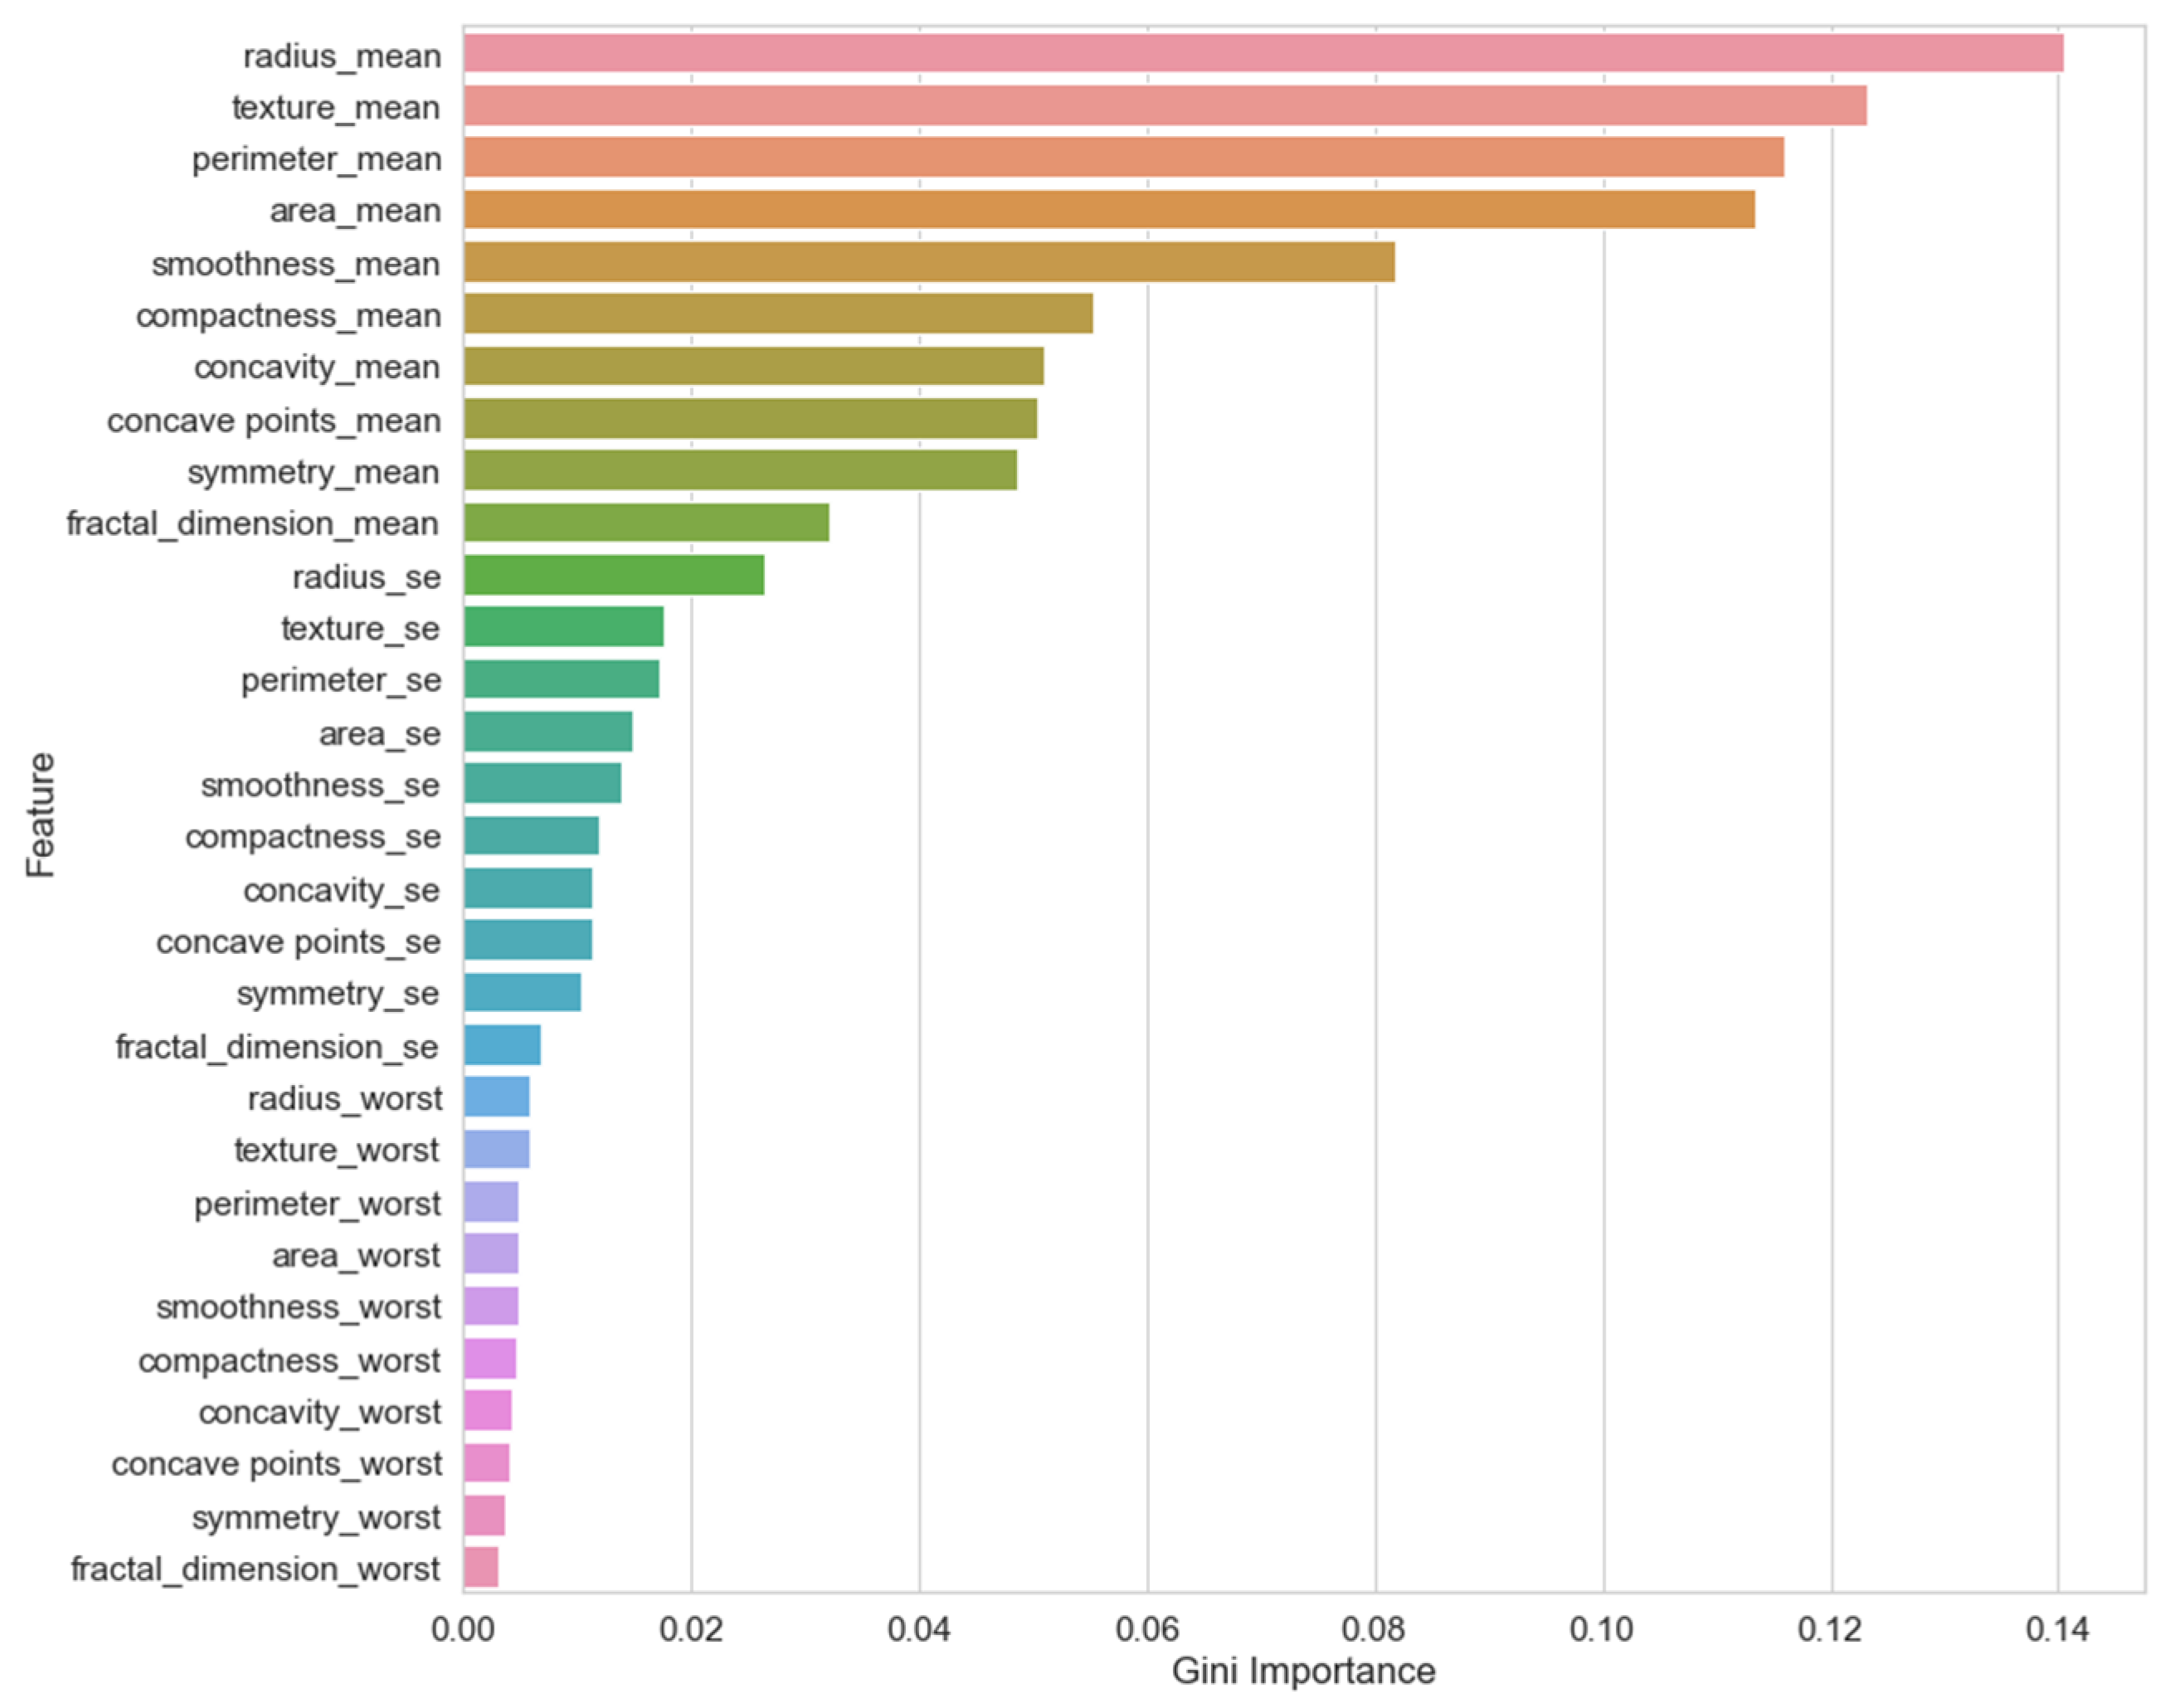
- How to find out the five fittest features of the diagnostic wisconsin breast cancer database among 32 features of the dataset?
- How to justify why the five fittest features of the diagnostic wisconsin breast cancer database are more important than using all of the feature dataset with the help of machine learning algorithms?
2. Related Work
- The heavier burden on the overlay of the network nodes of fuzzy neural network-based expert system is due to many insignificant features that are used to predict or diagnose the disease
- The uncertainty and ambiguity are often associated with diagnostic decision making of breast cancer.
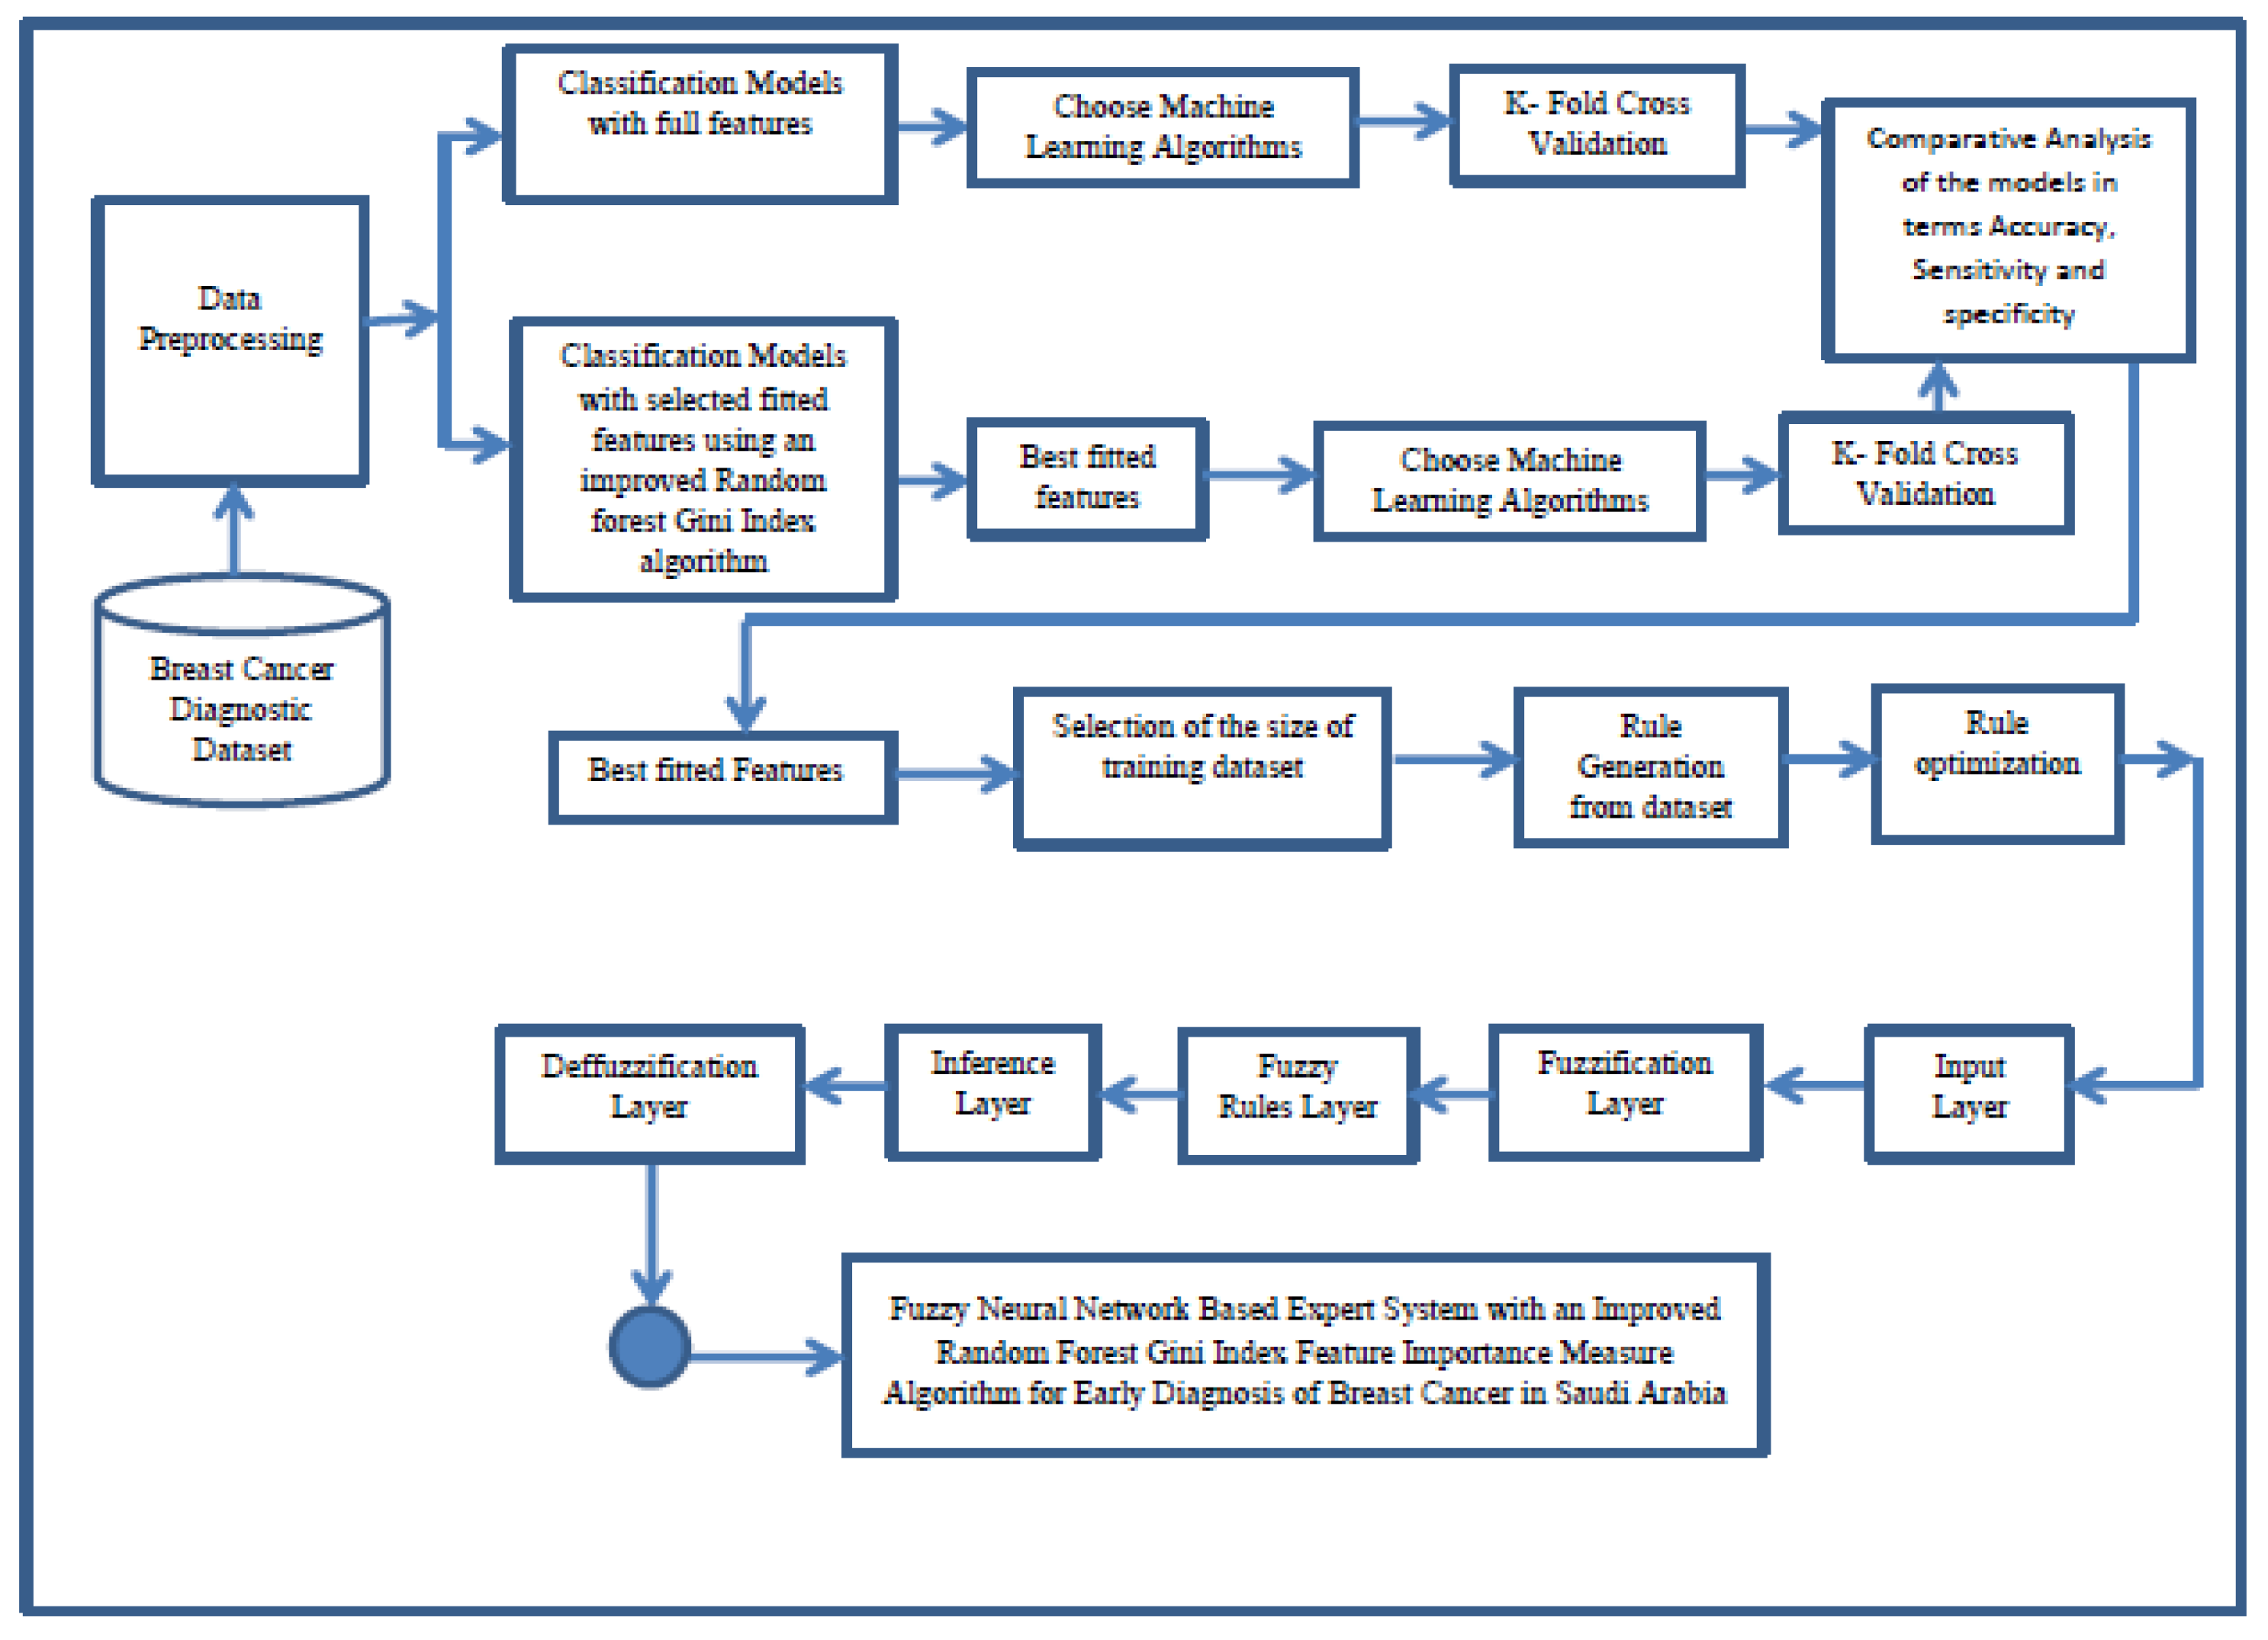
3. Methods and Materials
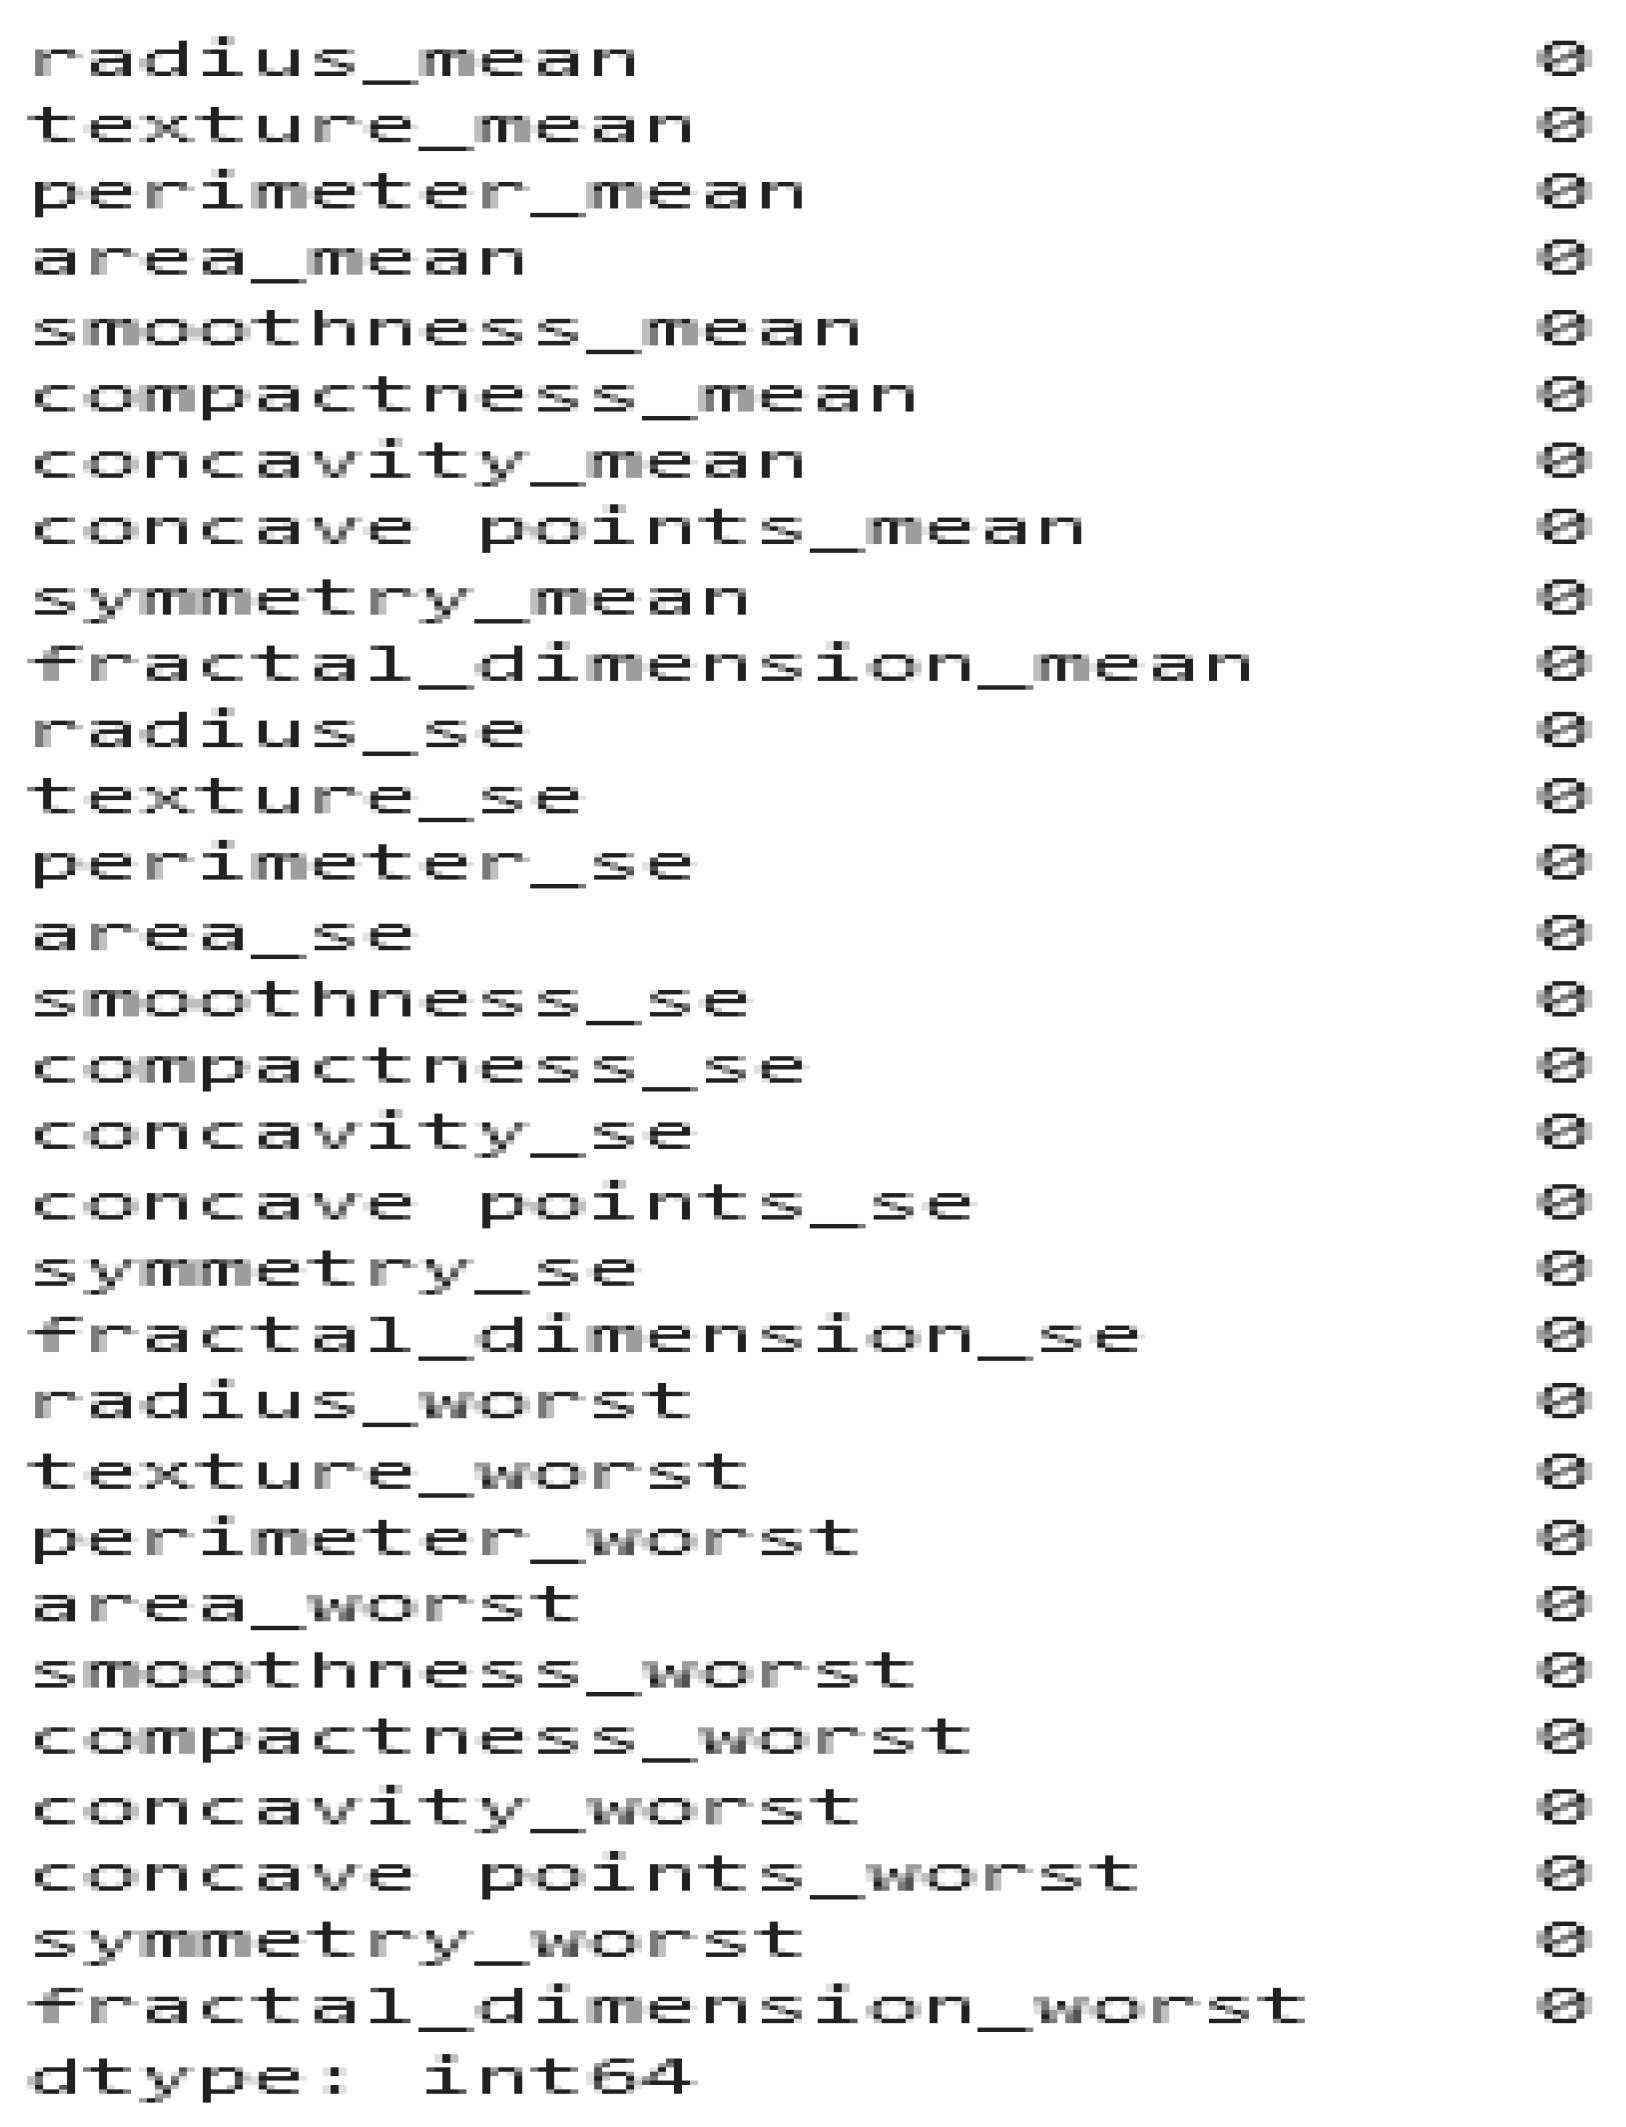
3.1. Dataset Collection, Preprocessing, and Feature Selection
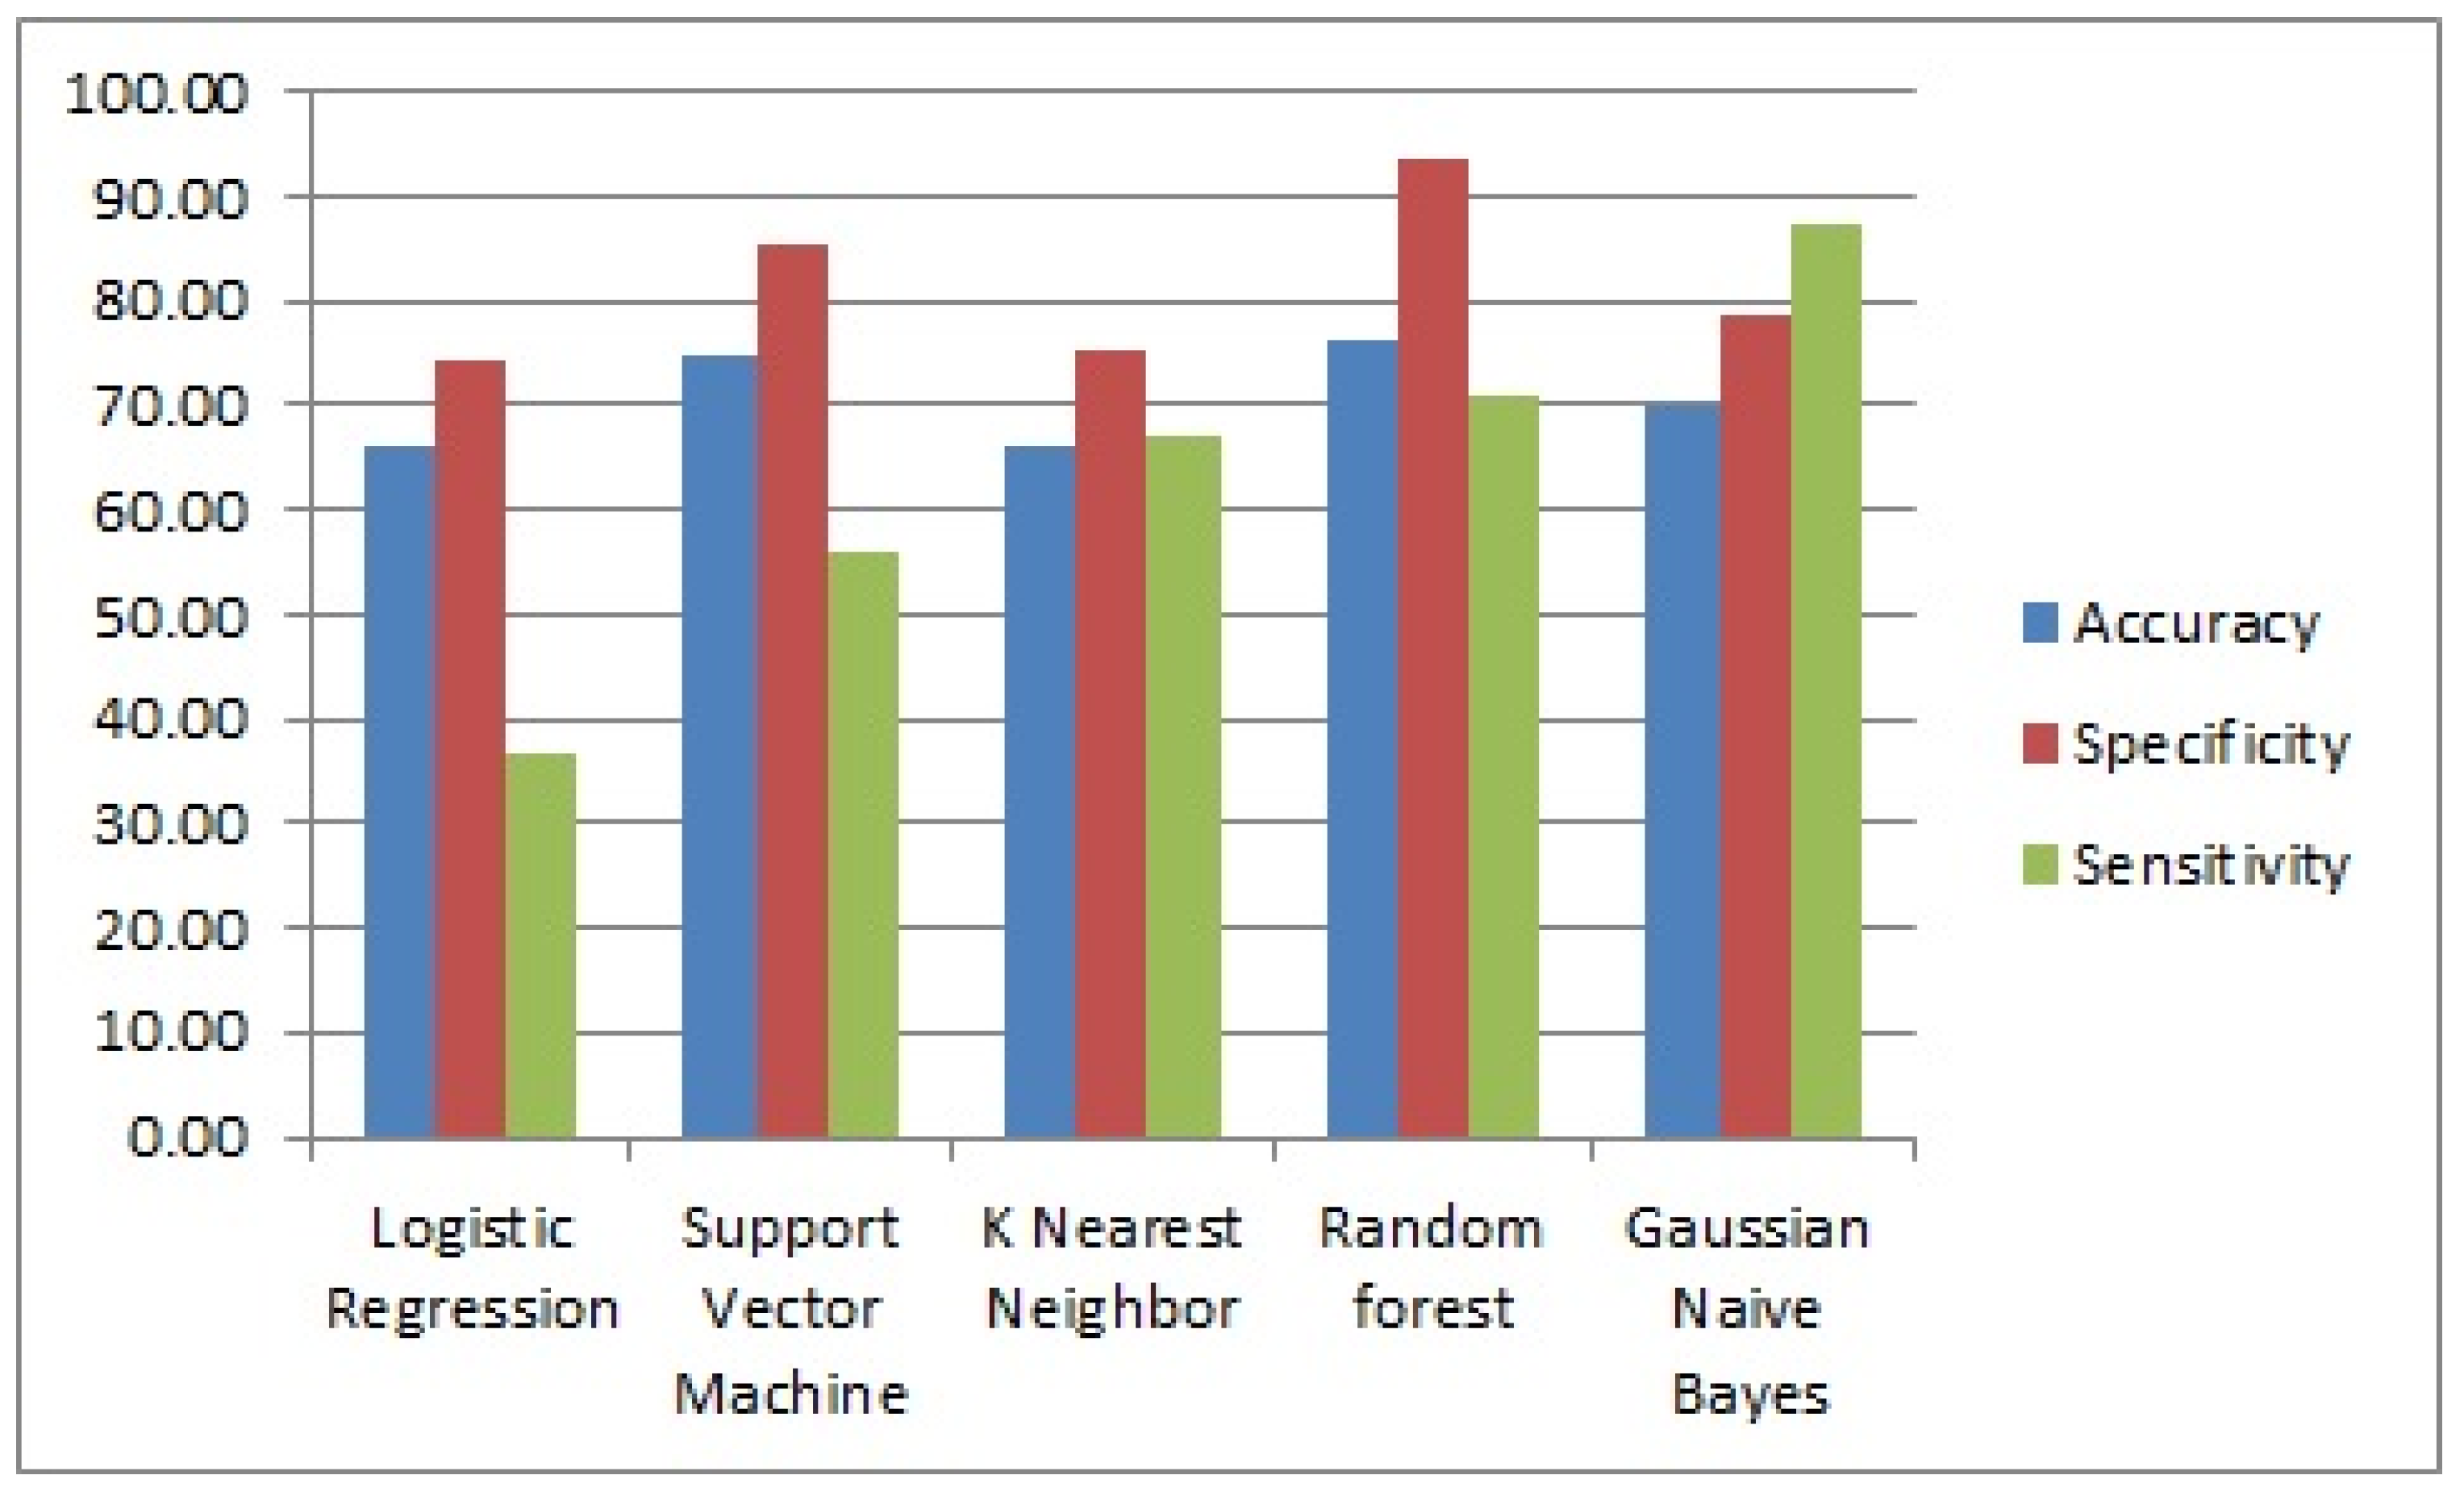
3.1.1. Classification Models with Full Features
- Logistic regression algorithm is used to model the probability of an event or certain classes and it uses logistic function to model binary dependent features or variables against the independent one [34]. Logistic regression does not really have any critical hyper parameters to tune. Sometimes, you can see useful differences in performance or convergence with different solvers [64].
- Support vector machine (SVM) is being used to model data for classification and regression analysis, respectively [34]. SVM builds a set of hyper plane in infinite dimensional space which might be used for regression or classification or even other tasks such as the detection of outliers. SVM provides a large number of hyper parameters to tune. Perhaps the first important parameter is the choice of kernel that will control the manner in which the input variables will be projected [65].
- K-nearest neighbor is also a learning algorithm that stores all the existing cases and classifies new cases based on the measure of similarity and it classifies a case by a vote of the majority of its neighbors with the case that is being given the most common category among its closest neighbors, measured by a distance function. If K = 1, then that case is assigned to its nearest neighbor [16,66]. The most important hyper parameter for k-nearest neighbor is the number of neighbors [65].
- Random forest is a learning algorithm for regression and classification by building a multitude of decision trees at training time and producing the class that is the mode of the classes of the individual decision trees [61]. The algorithm consists of a number of individual decision trees that work as an ensemble where each decision tree in the random forest gives out a class of prediction and the class with majority votes becomes the predictive model. [66]. The most important parameter is the number of random features to sample at each split point of the maximum of features [64,67].
- Gaussian naïve bayes is a learning algorithm for probabilistic classification by applying bayes theorem with strong independence assumption between dataset features [35]. The learning algorithm is highly scalable, which requires a number of parameters linear in the number of features in the learning problem [34]. Moreover, naïve Bayes has almost no hyper parameters to tune, so it usually generalizes well. One thing to note is that, due to the feature independence assumption, the class probabilities output by naïve bayes can be pretty inaccurate [65].
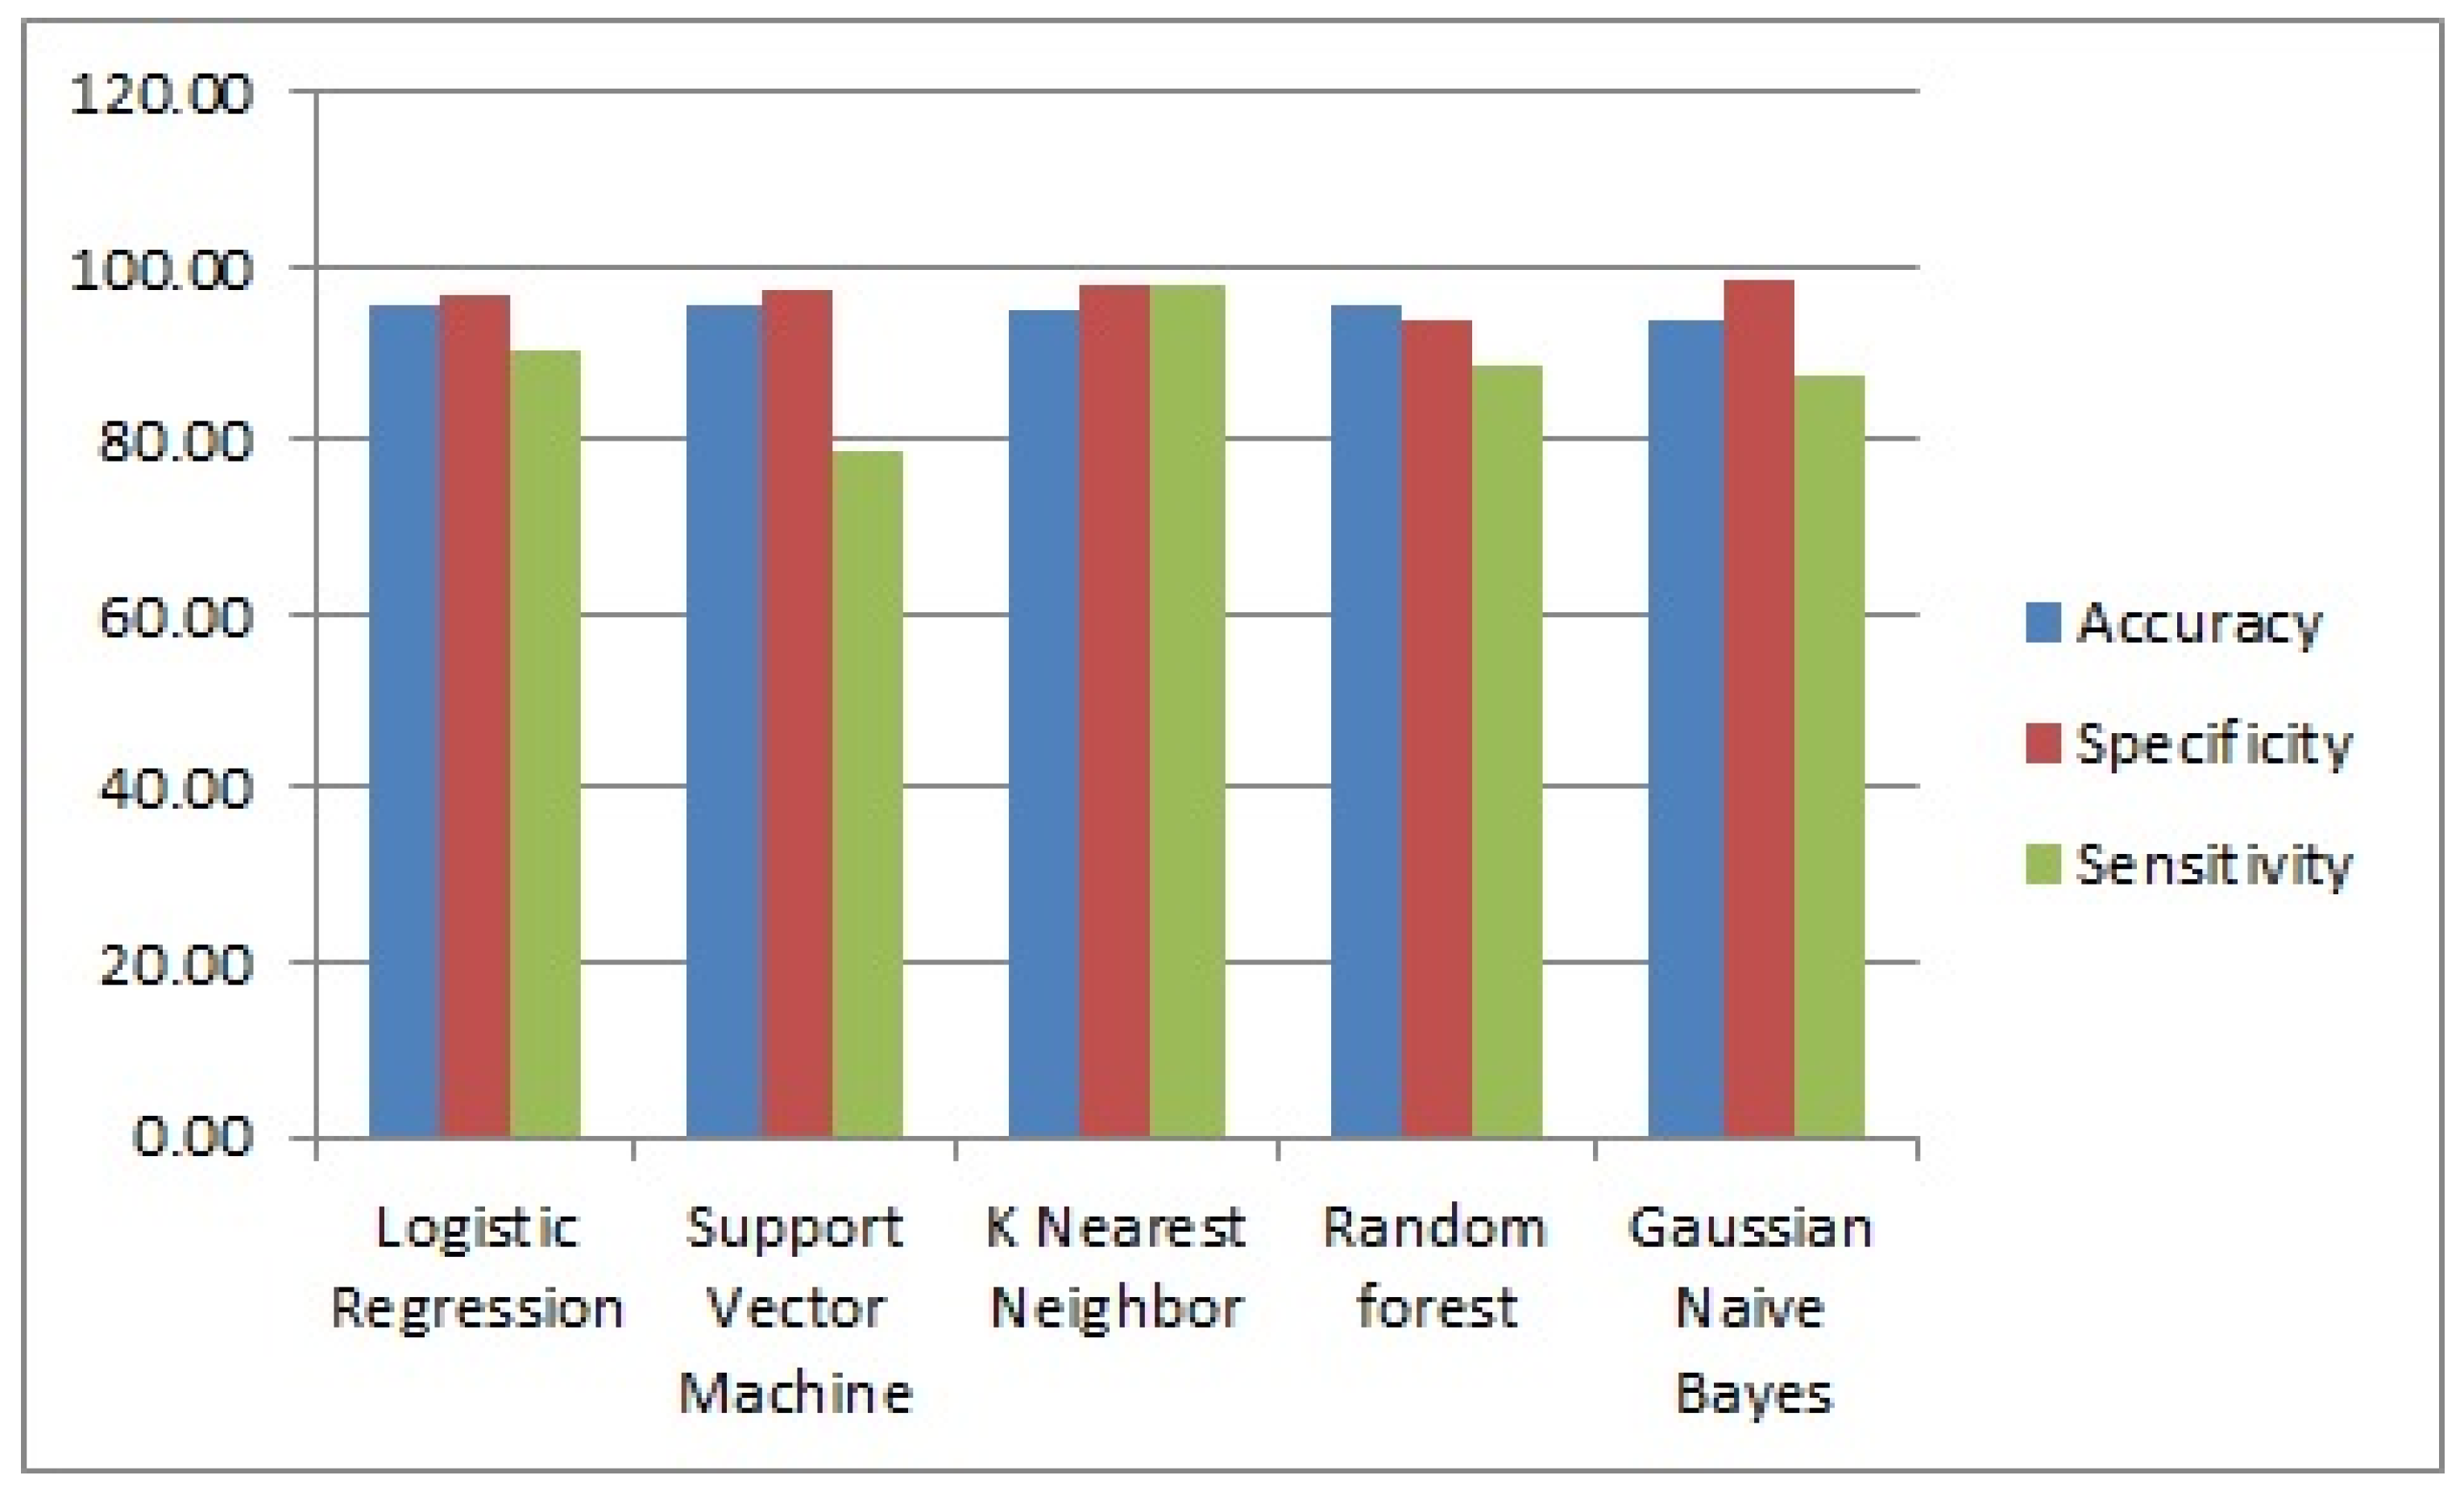
3.1.2. Classification Models with Selected Fittest Features
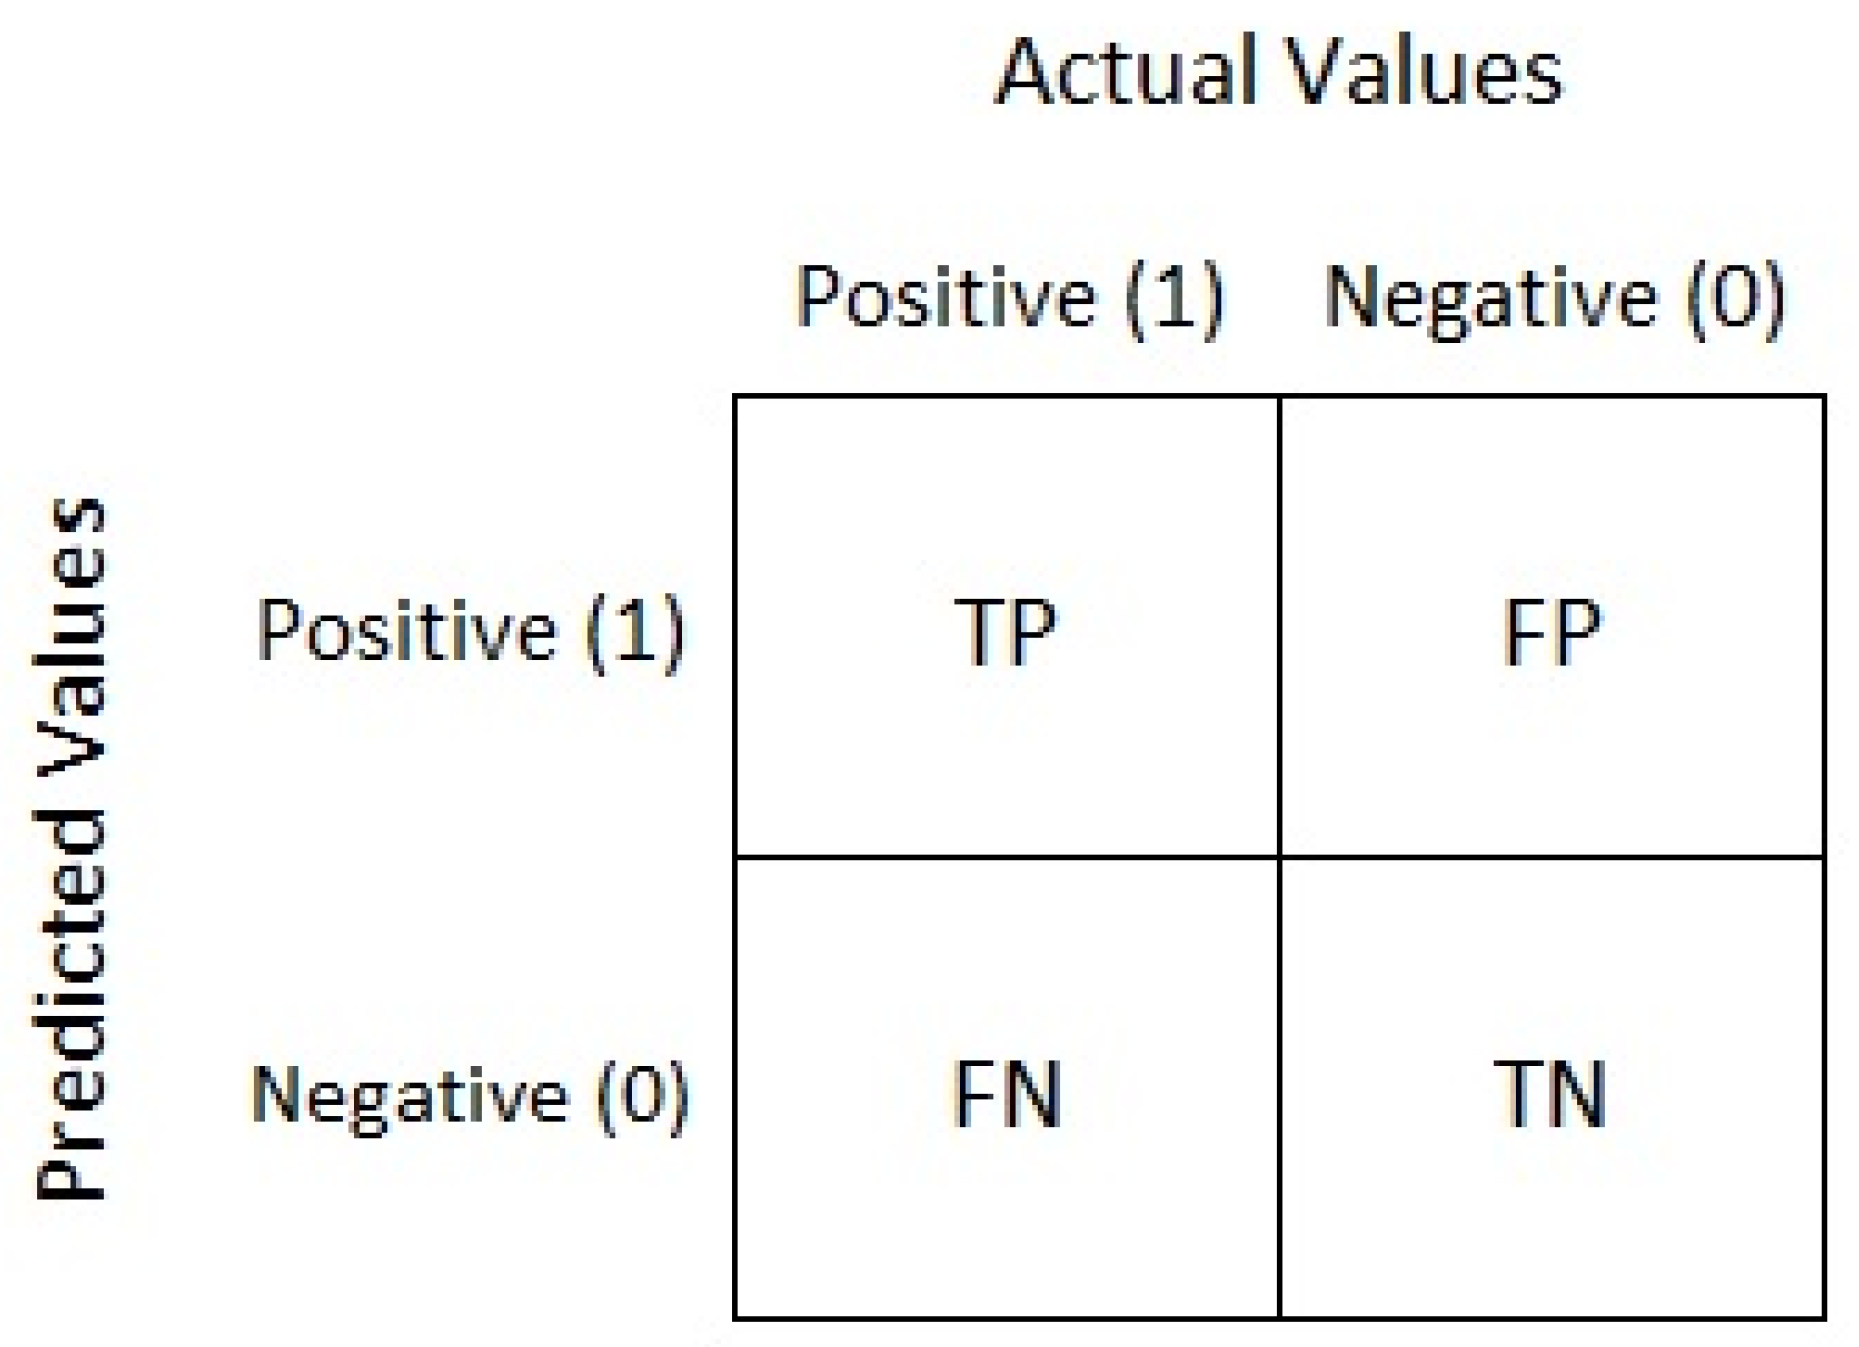
3.1.3. Comparative Analysis of the Performance Evaluation of Classification Models
- i.
- Accuracy: It is used to determine the efficiency of the models in terms of the number of the corrected predicted breast cancer cases against the total number of available instances of the dataset as defined by the formula:
- ii.
- Sensitivity: It is used to determine the efficiency of the models in terms of the number of predicted positive cases of the breast cancer against the total number of actual positive instances of the dataset as defined by the formula:
- iii.
- Specificity: It is used to determine the efficiency of the system in terms of using the predicted negative cases of the breast cancer against the total number of actual negative instances of the dataset as defined by the formula:
3.2. Selection of the Size of Training Dataset
3.3. Rule Generation from Dataset
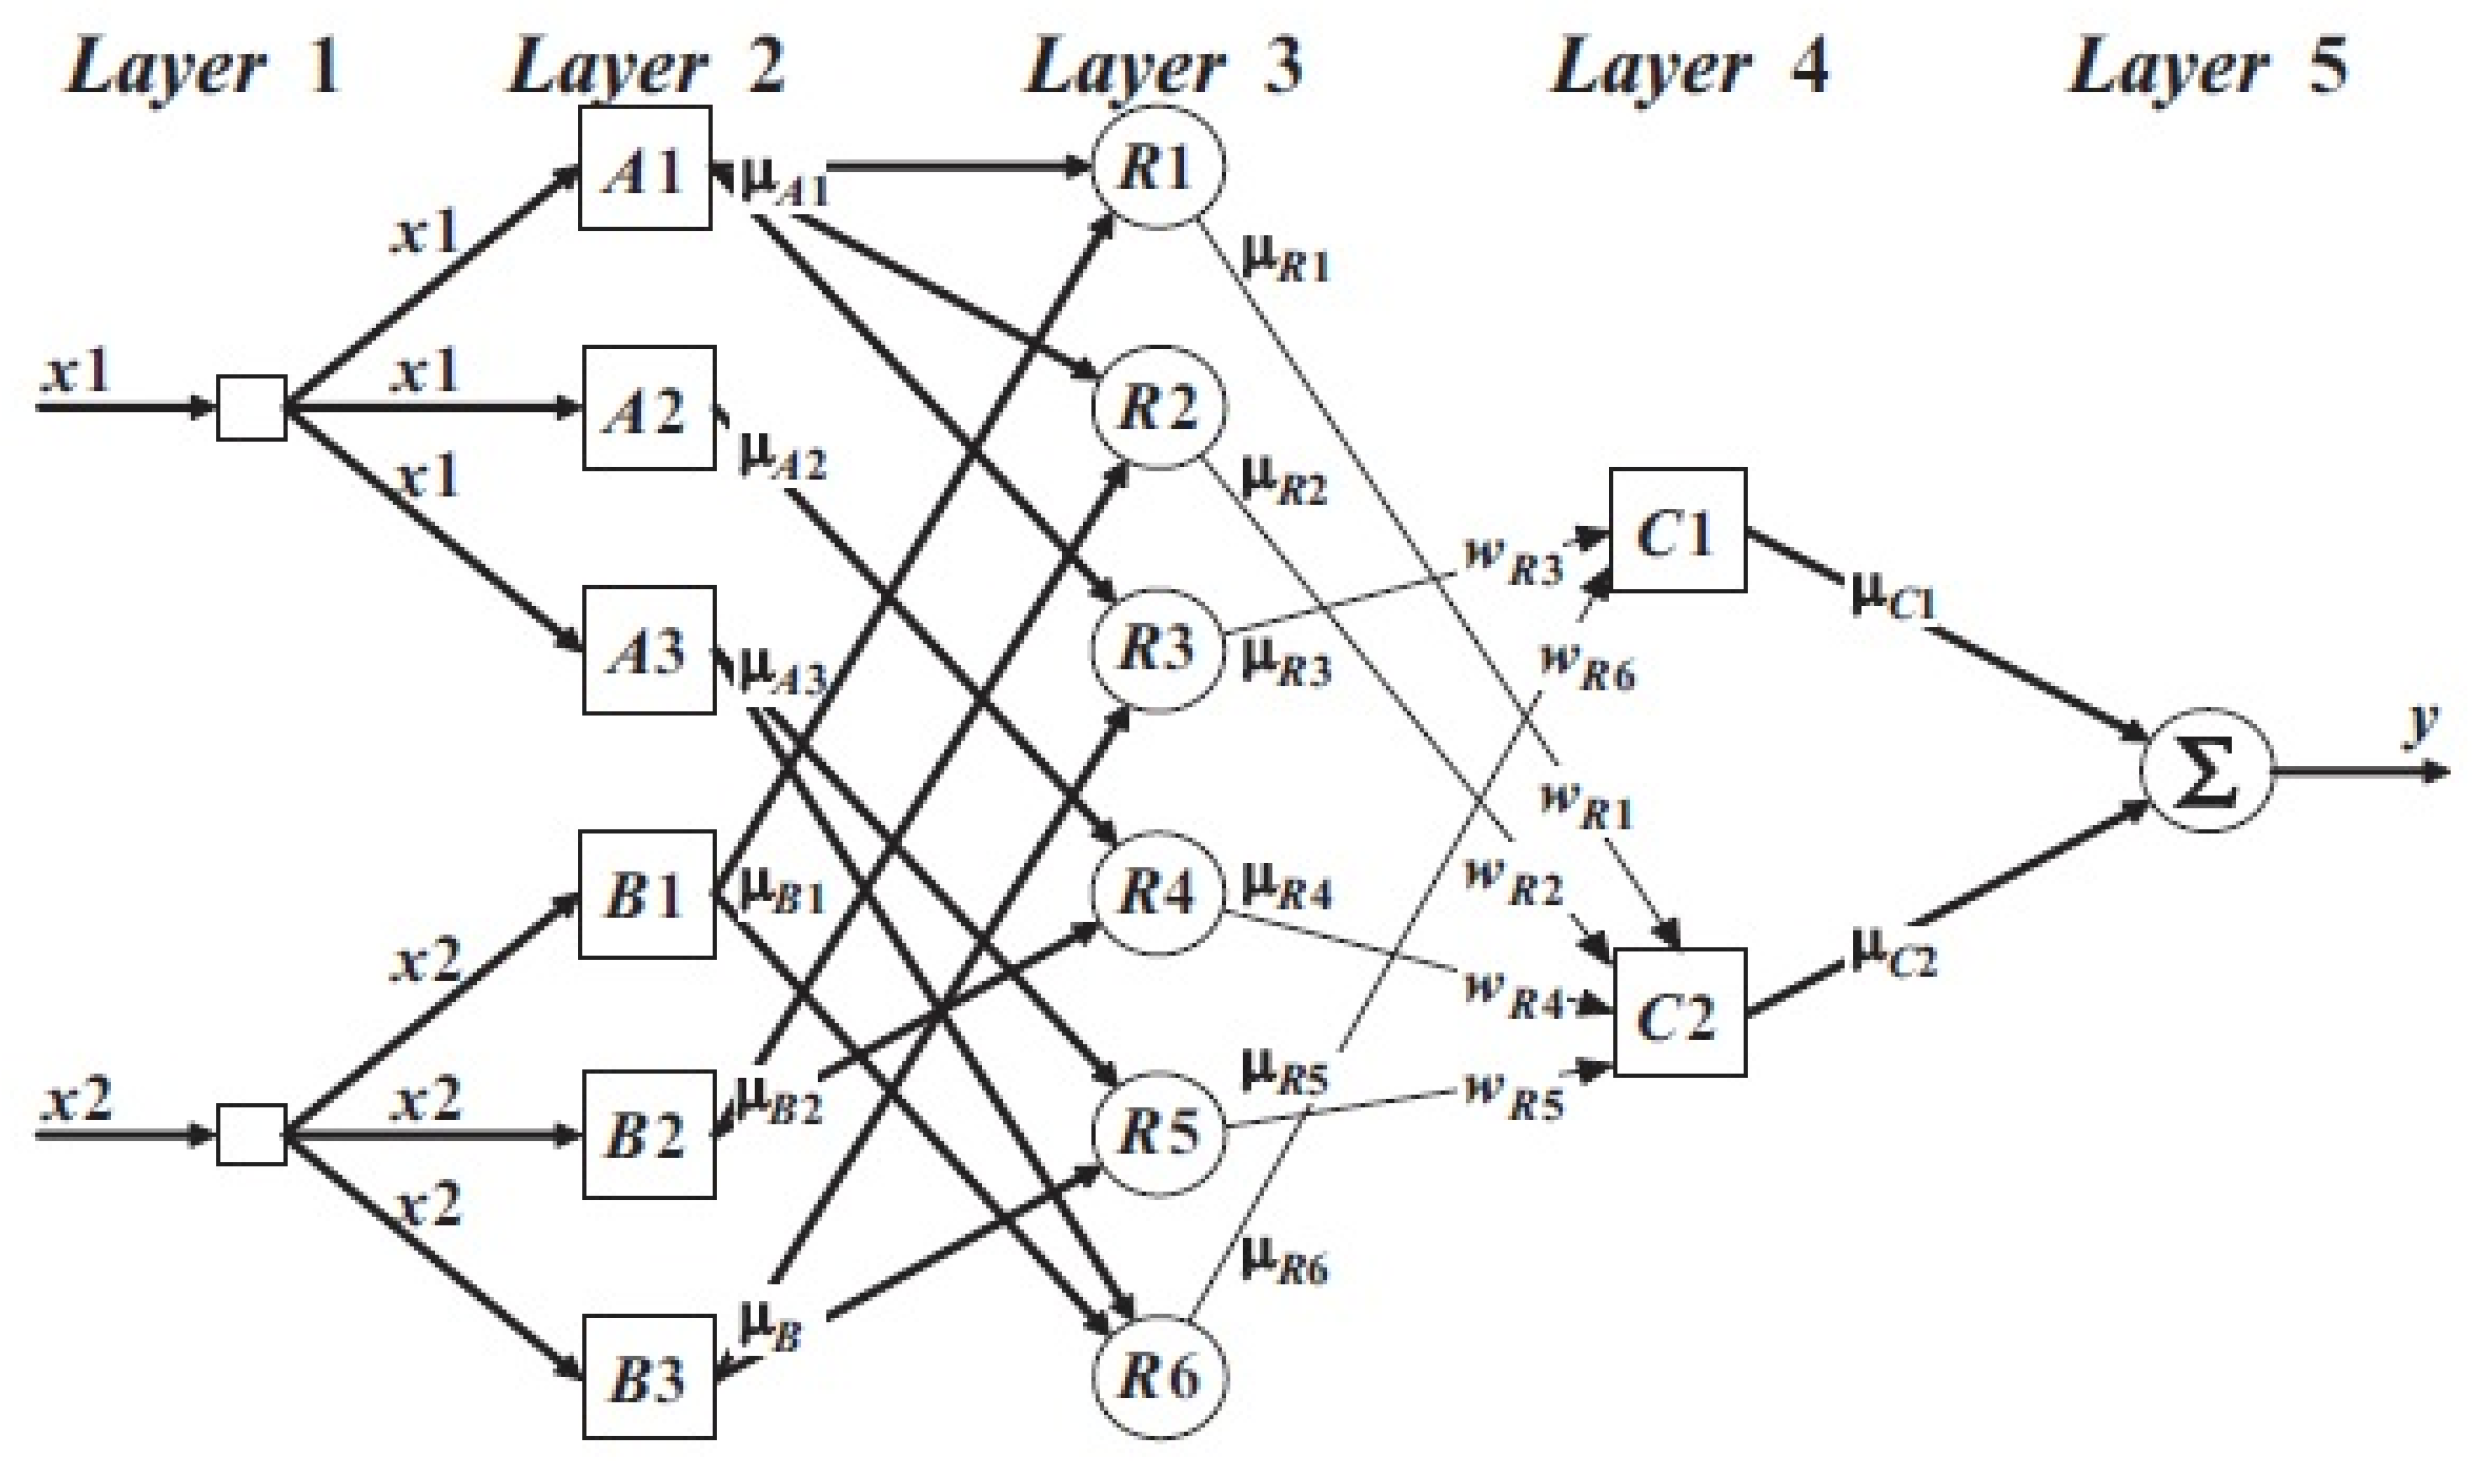
3.4. Rule Optimization
3.4.1. Input Layer
3.4.2. Fuzzification Layer
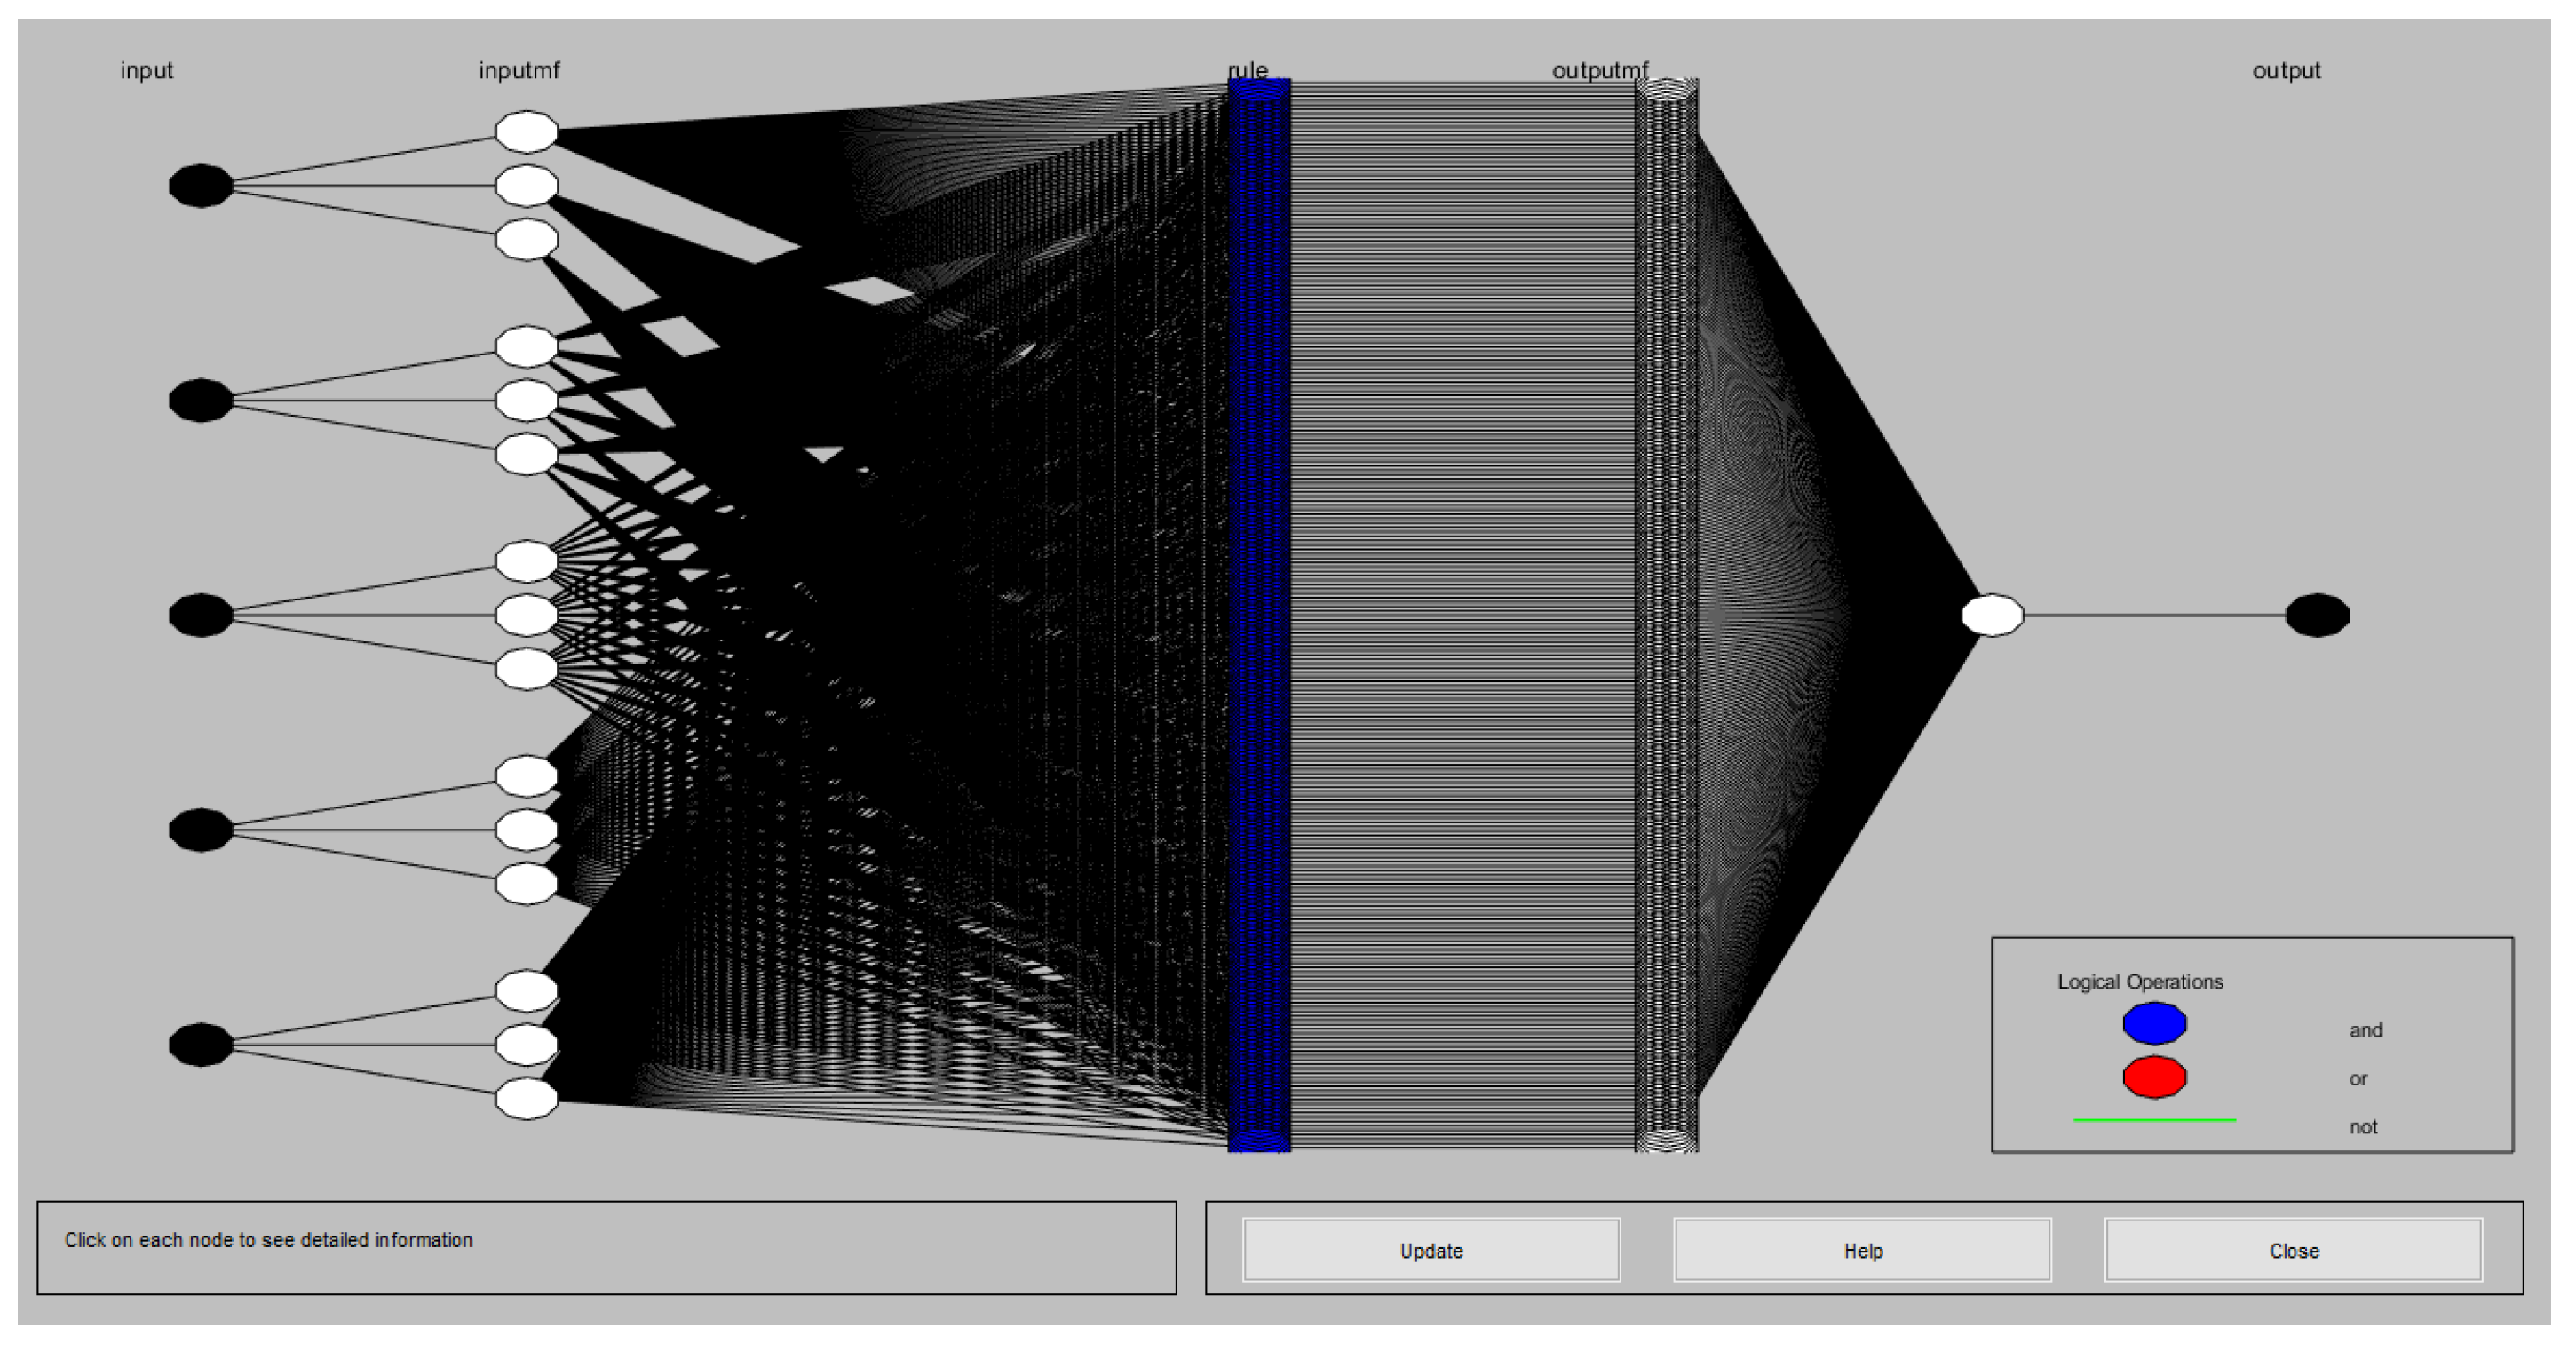
3.4.3. Fuzzy Rules Layers
3.4.4. Inference Layer
3.4.5. Defuzzification Layer
4. Fuzzy Neural Network Expert System with an Improved Gini Index Random Forest-Based Feature Importance Measure Algorithm
4.1. Dataset Collection, Preprocessing, and Feature Selection
4.1.1. Classification Models with full features
4.1.2. Classification Models with Selected Fittest Features
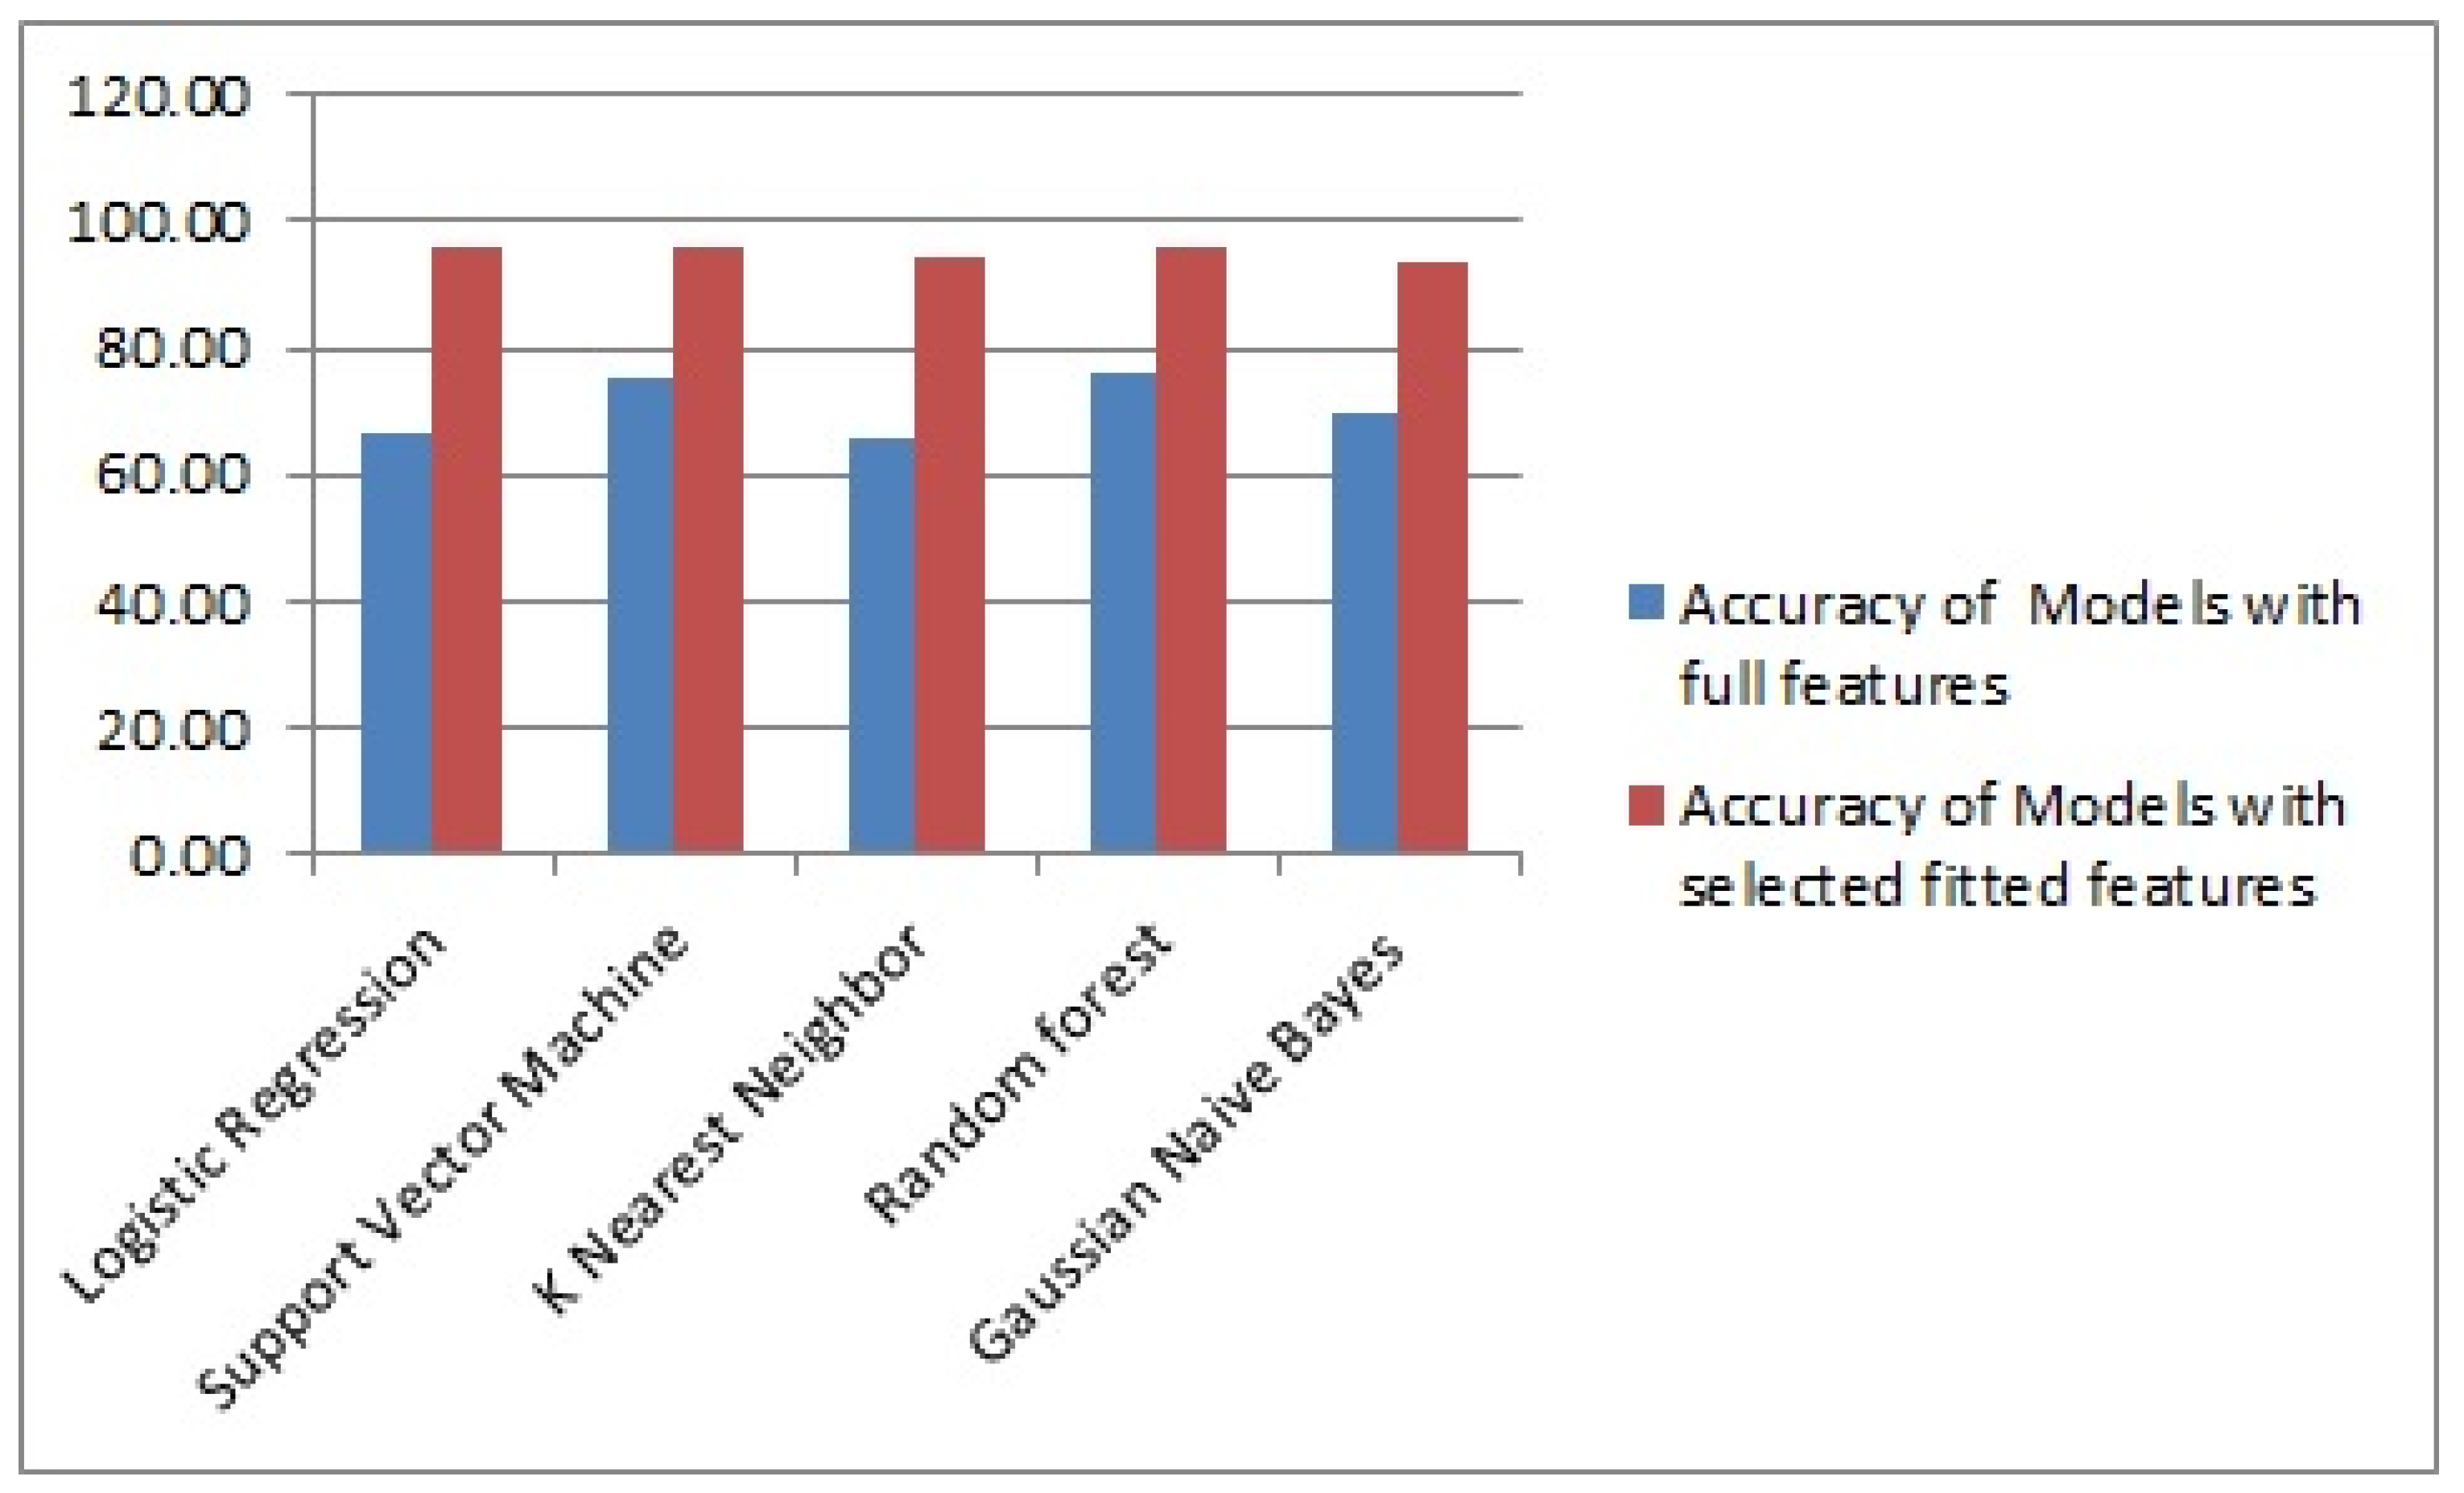
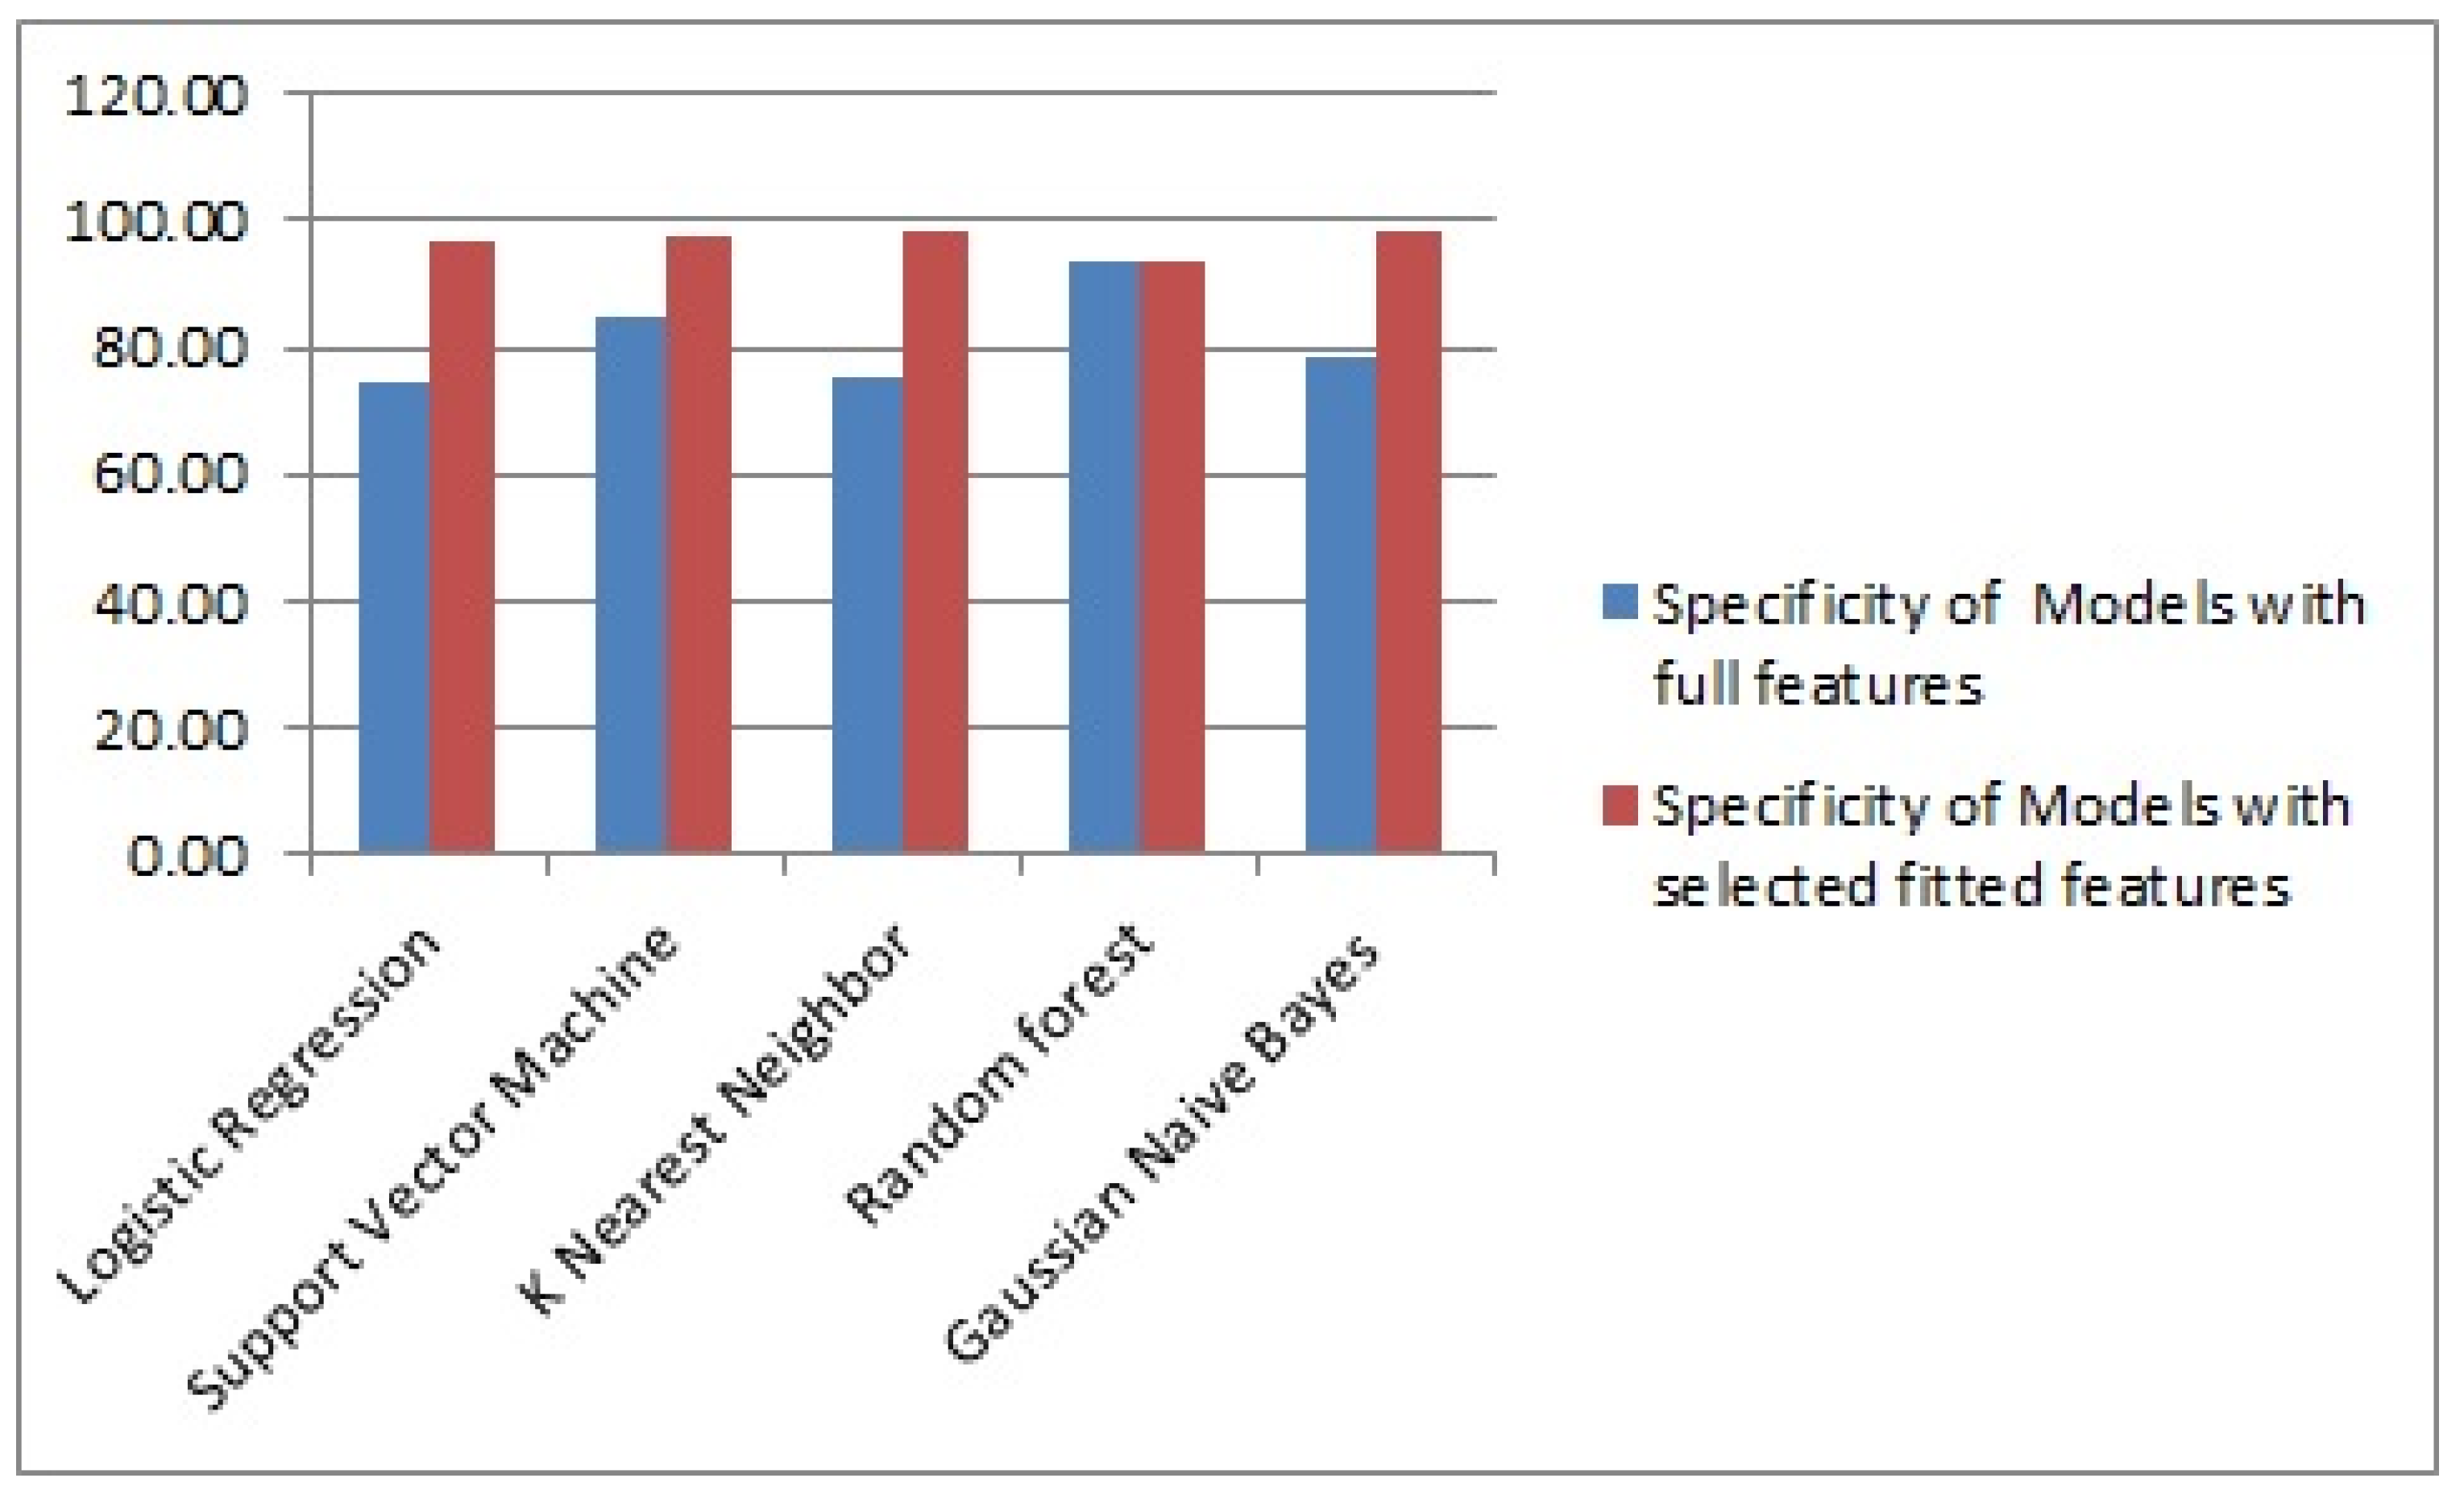
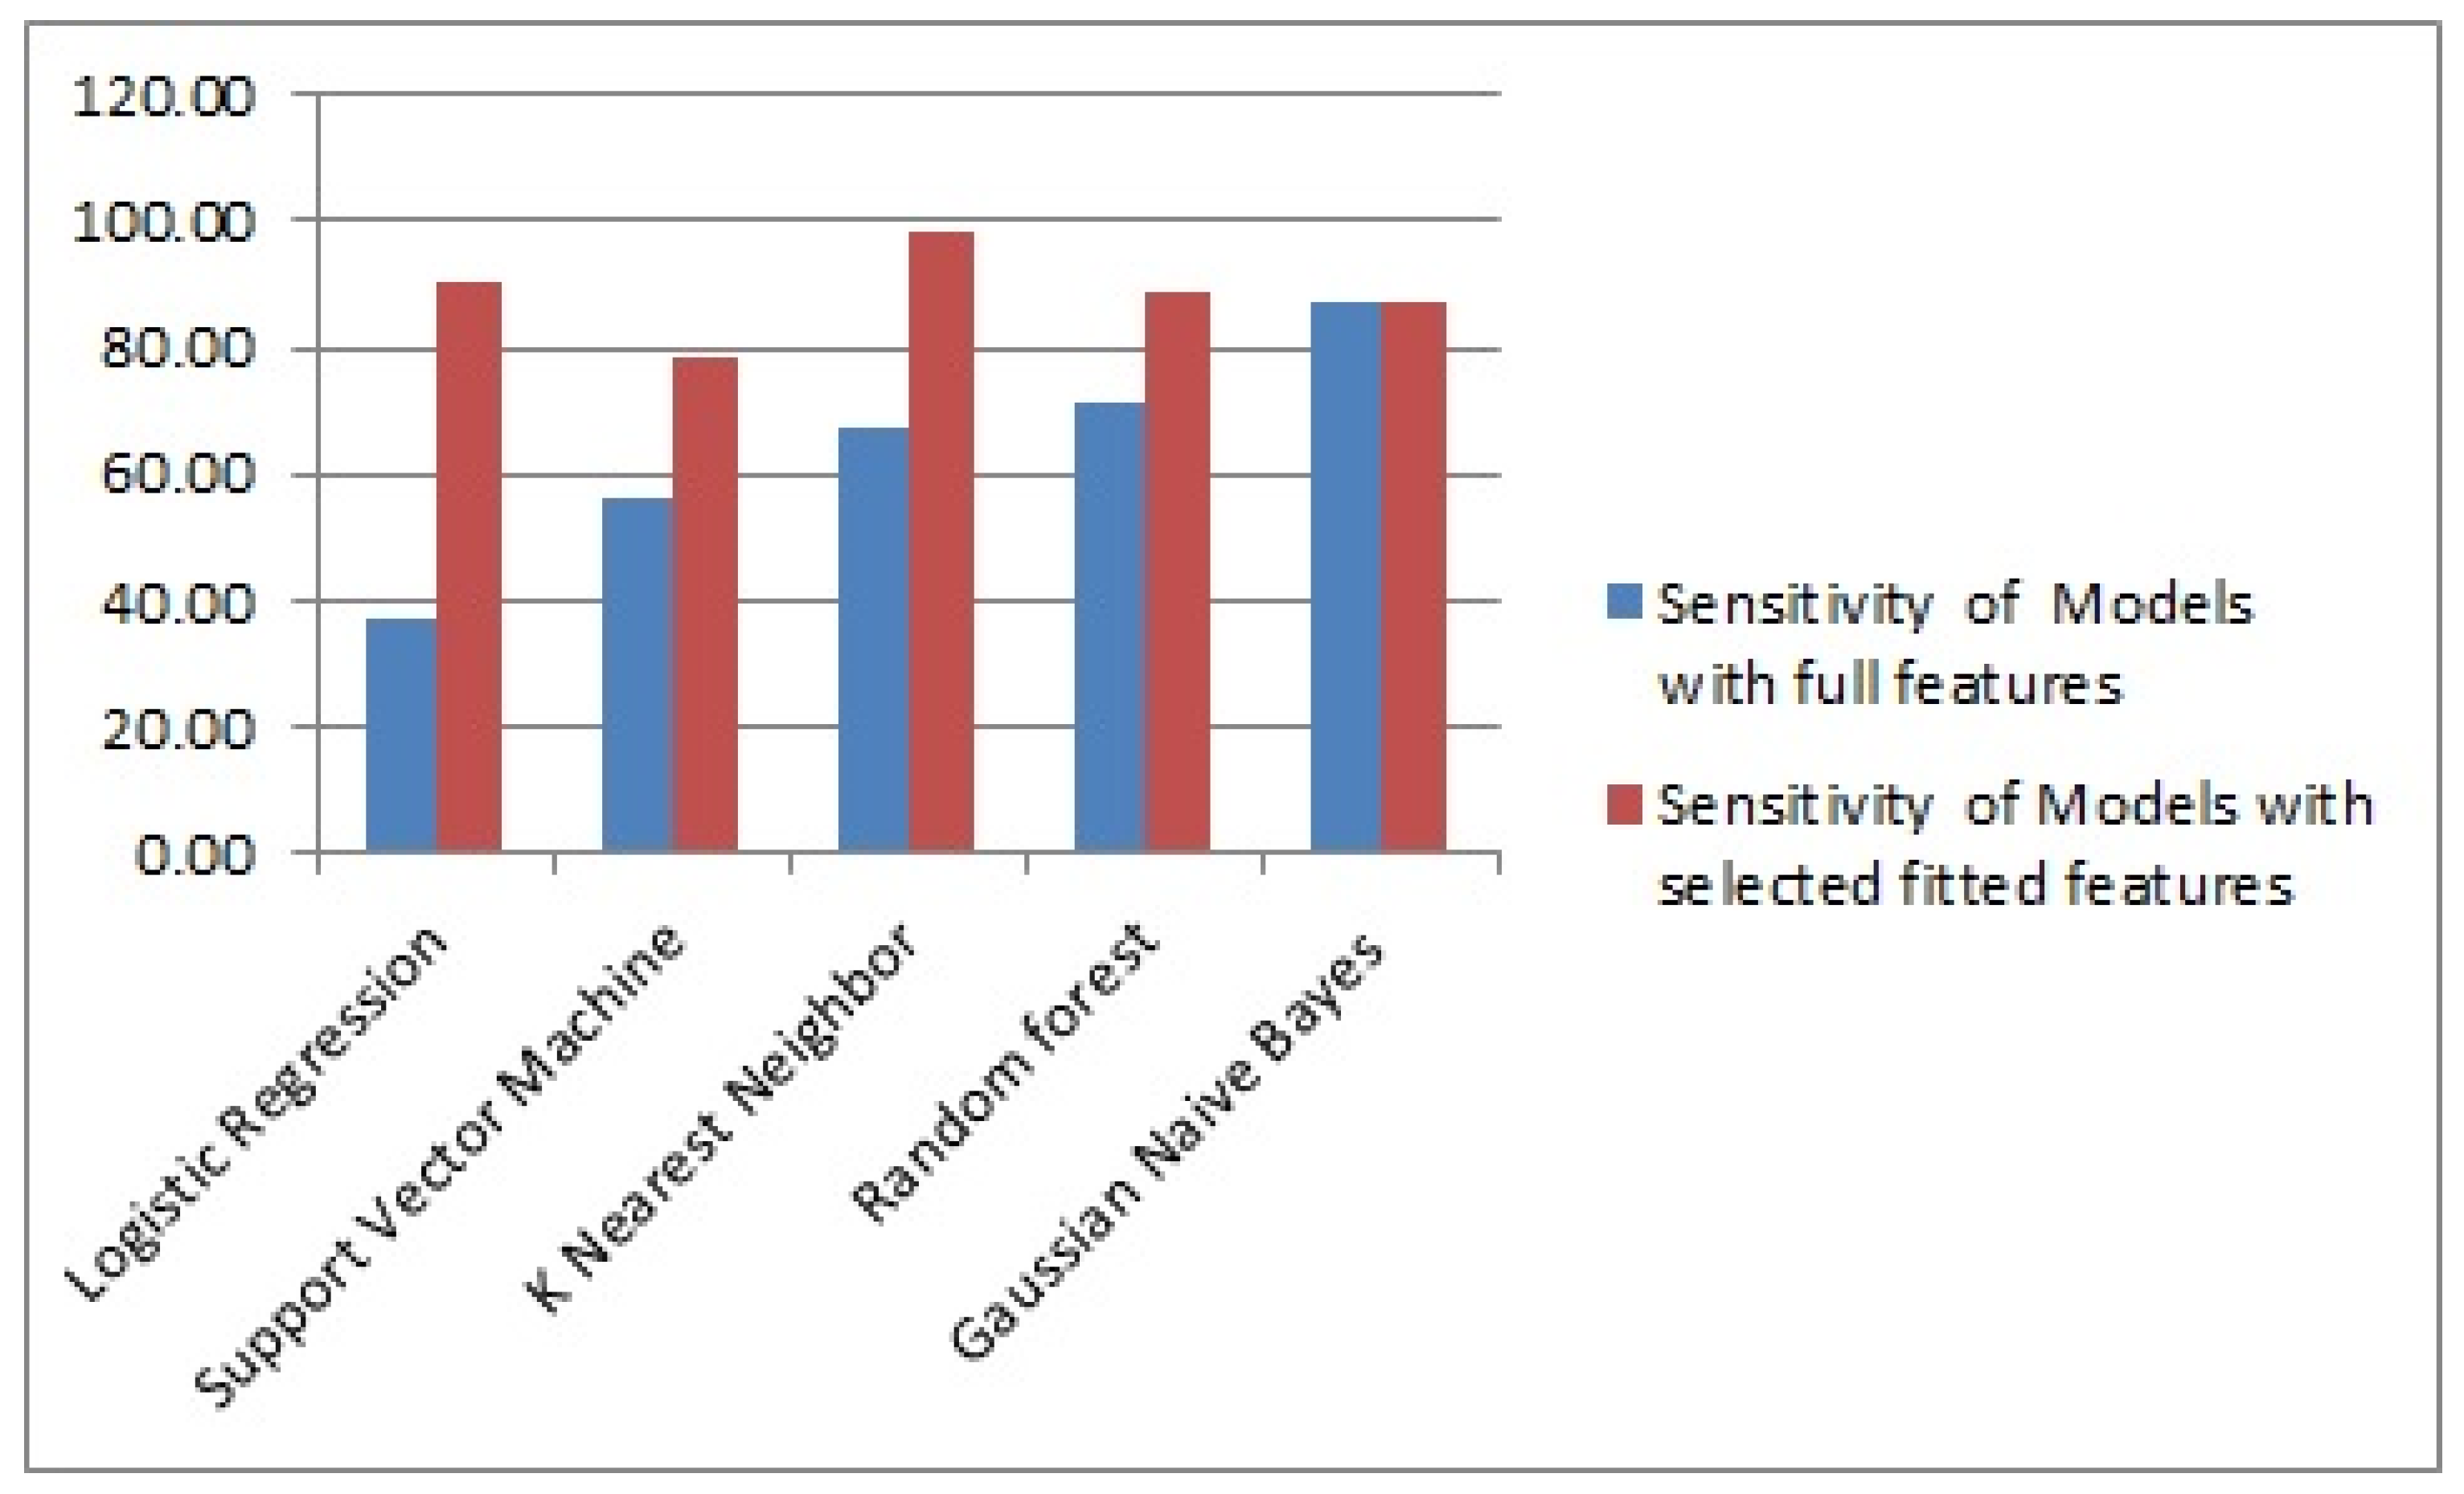
4.1.3. Comparative Analysis of Performance Evaluation of the Classification Models
4.2. Selection of the Size of Training Dataset
4.3. Rule Generation from Dataset
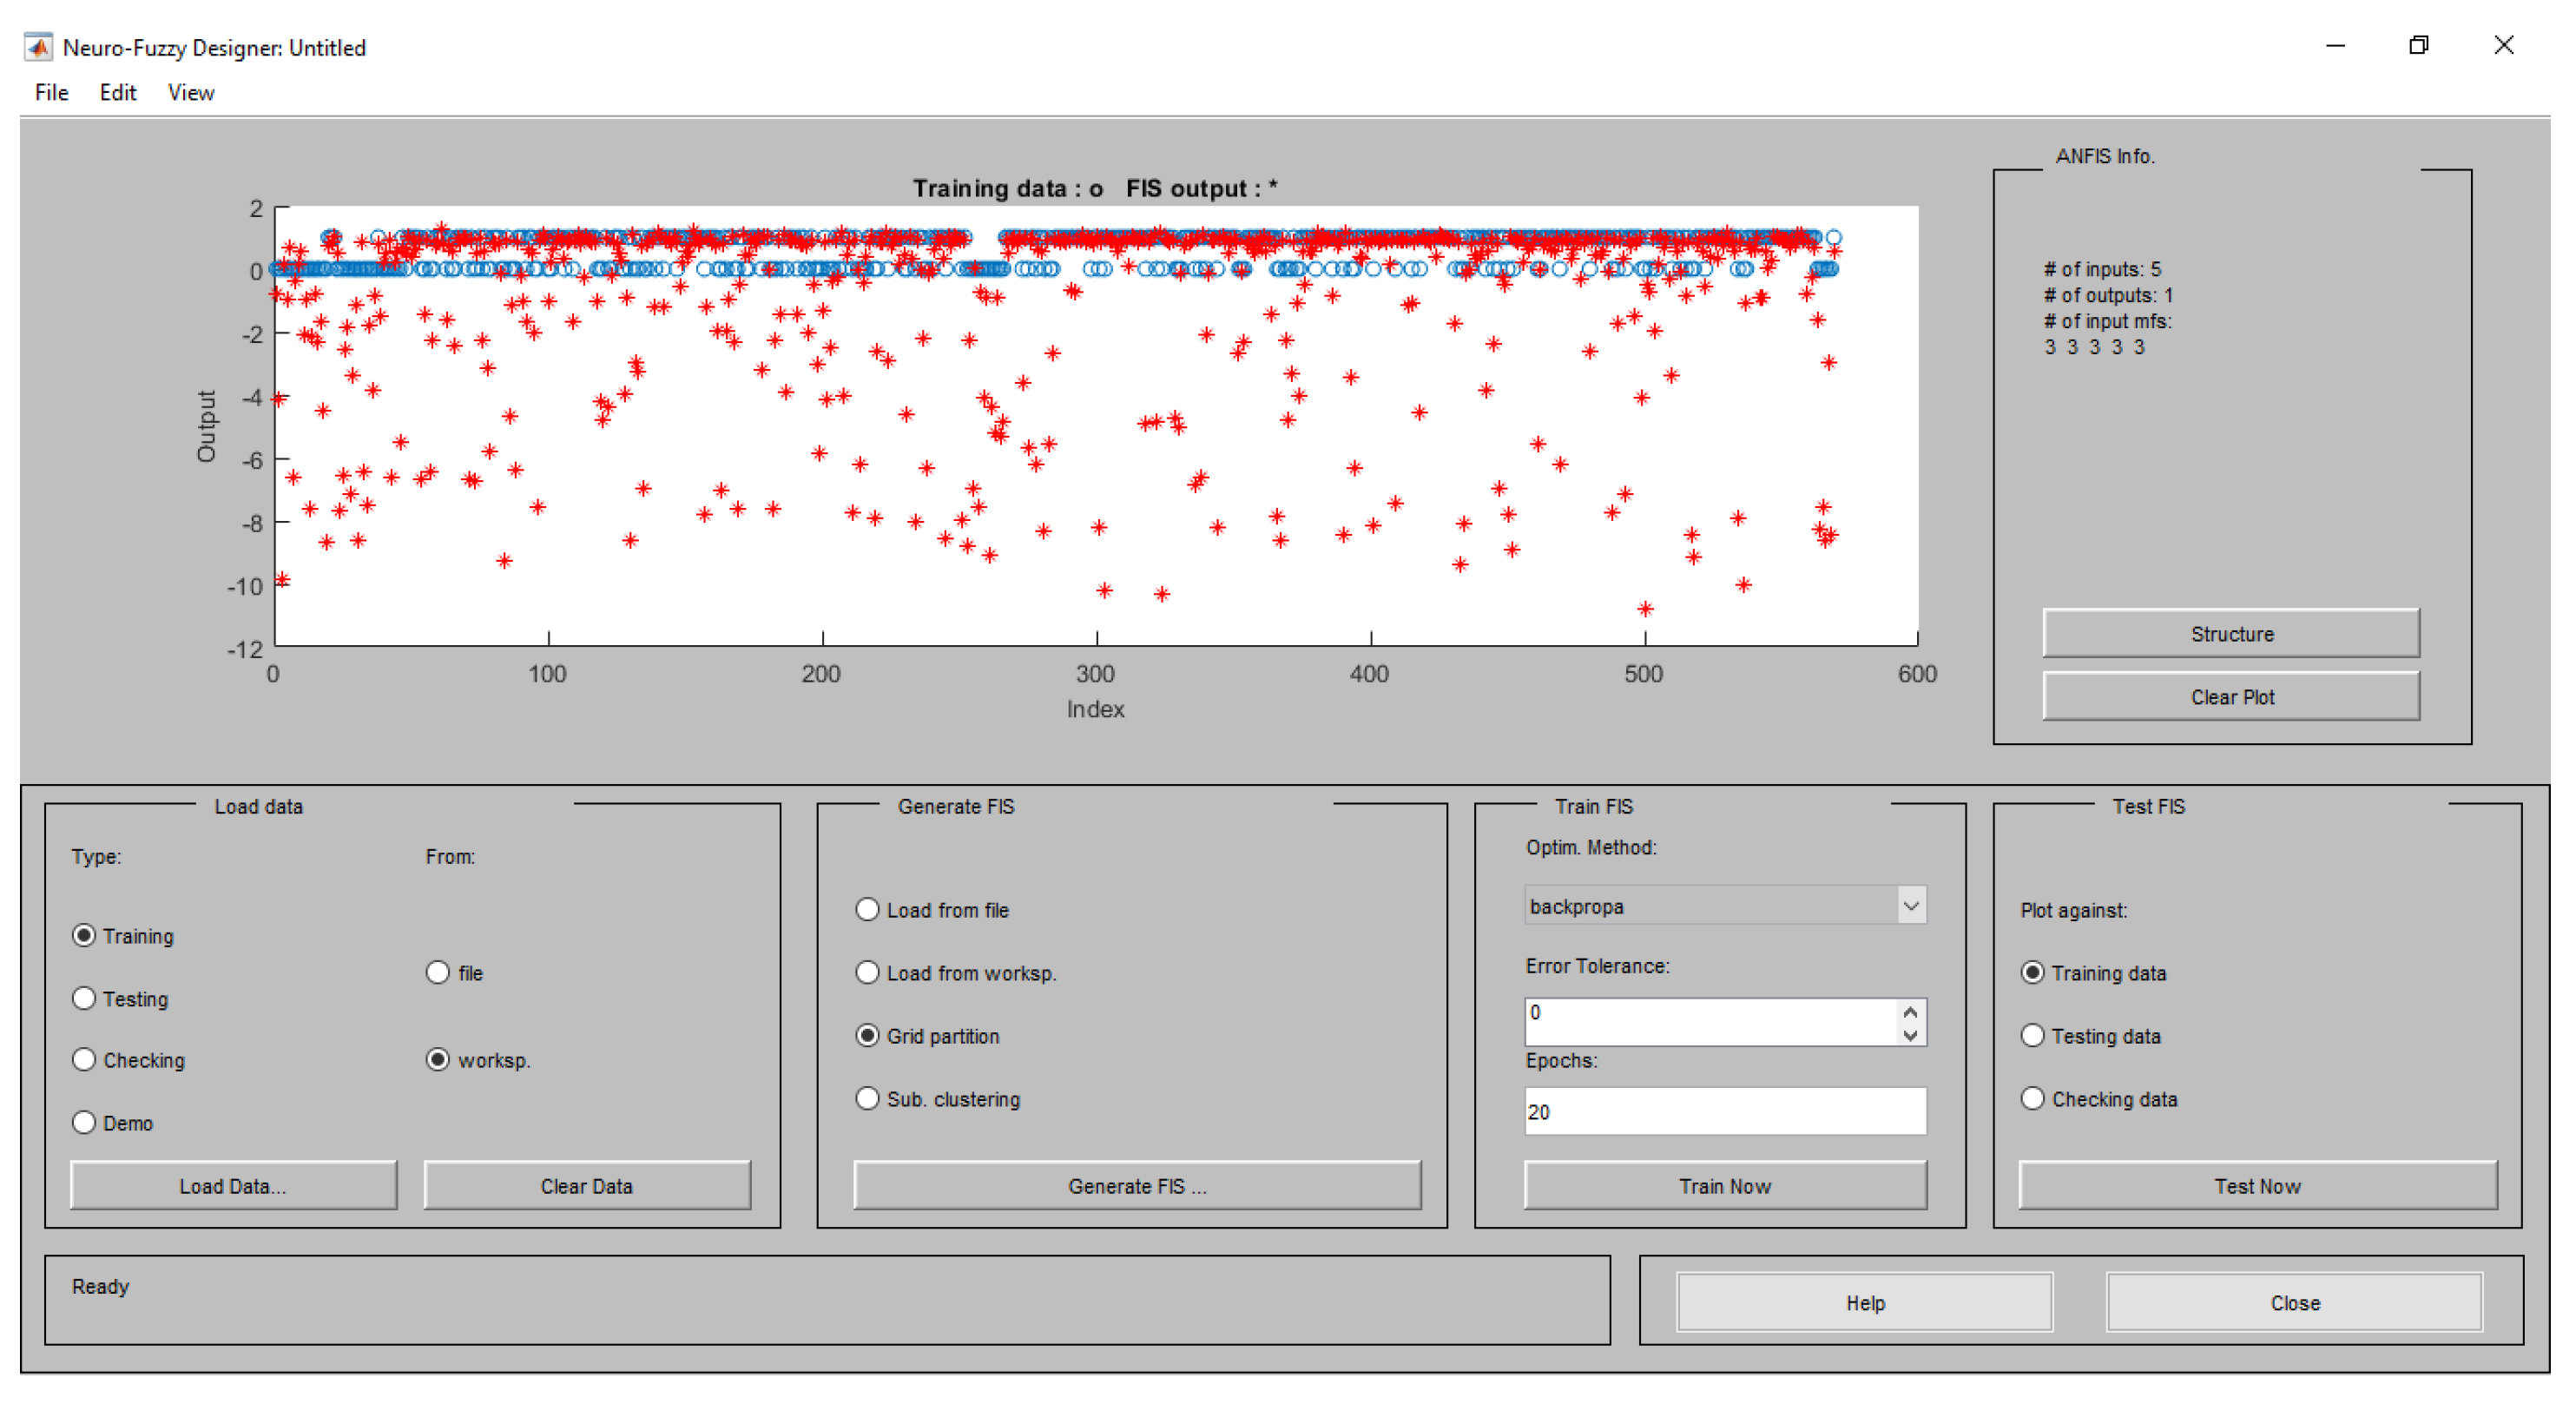
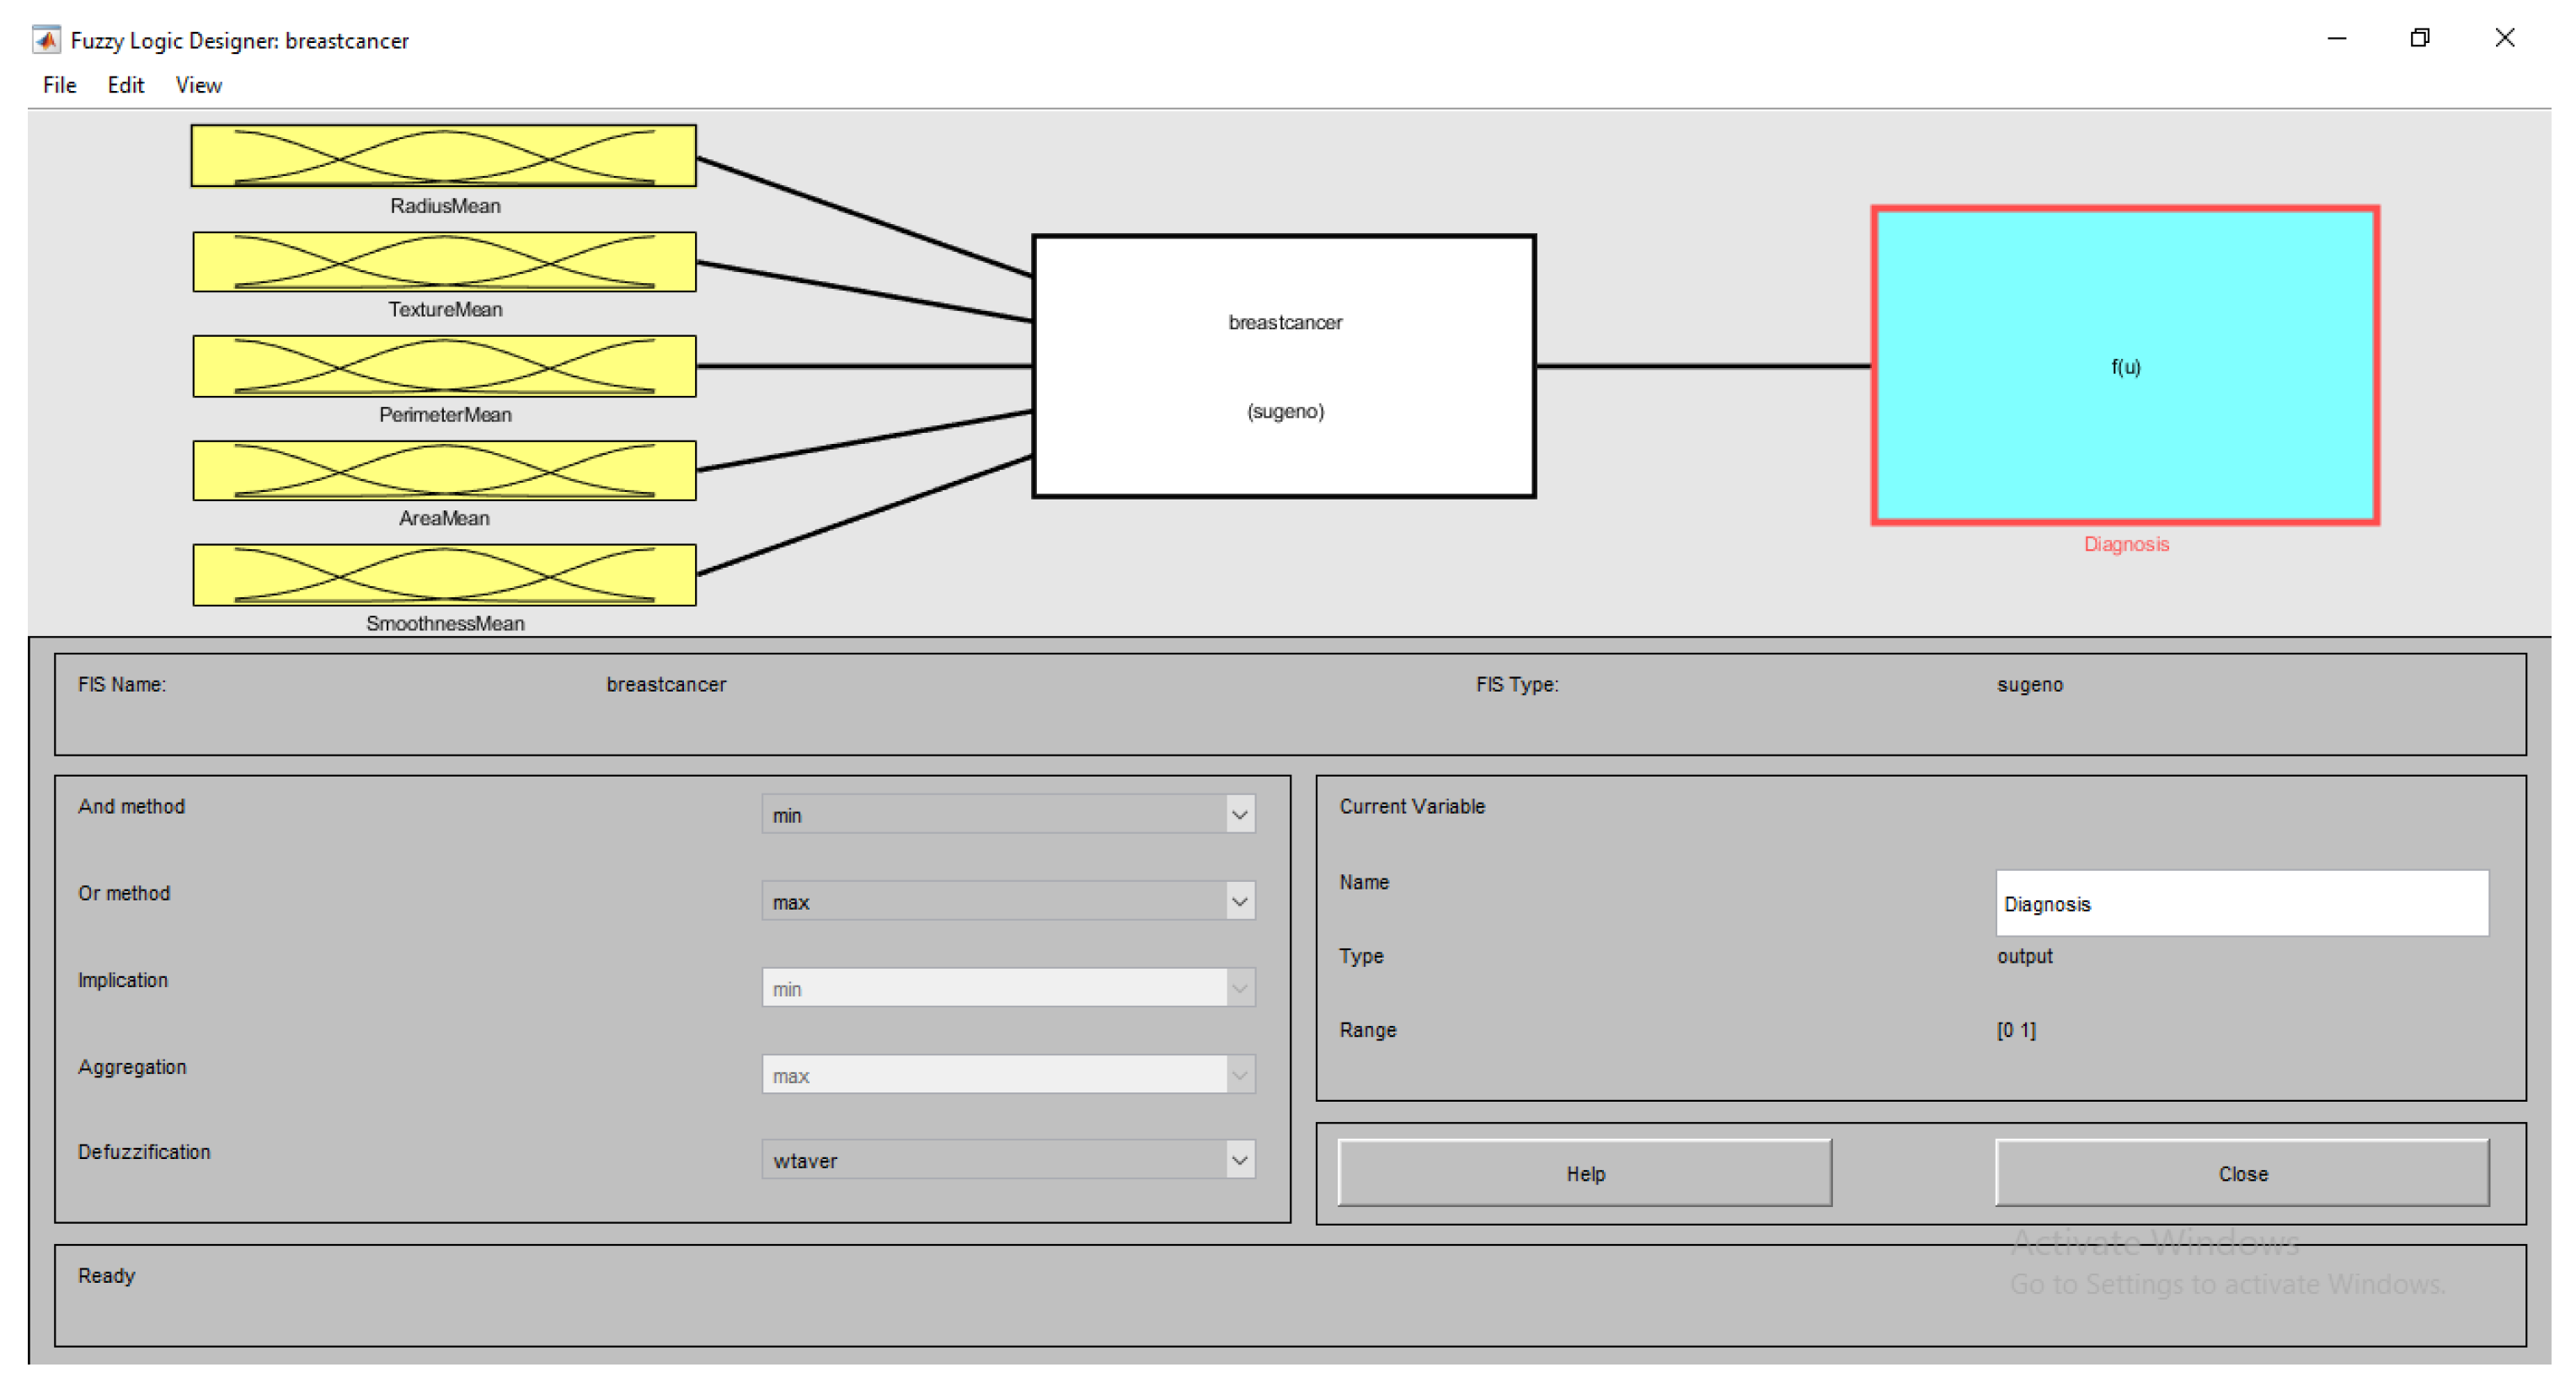
4.4. Rule Optimization
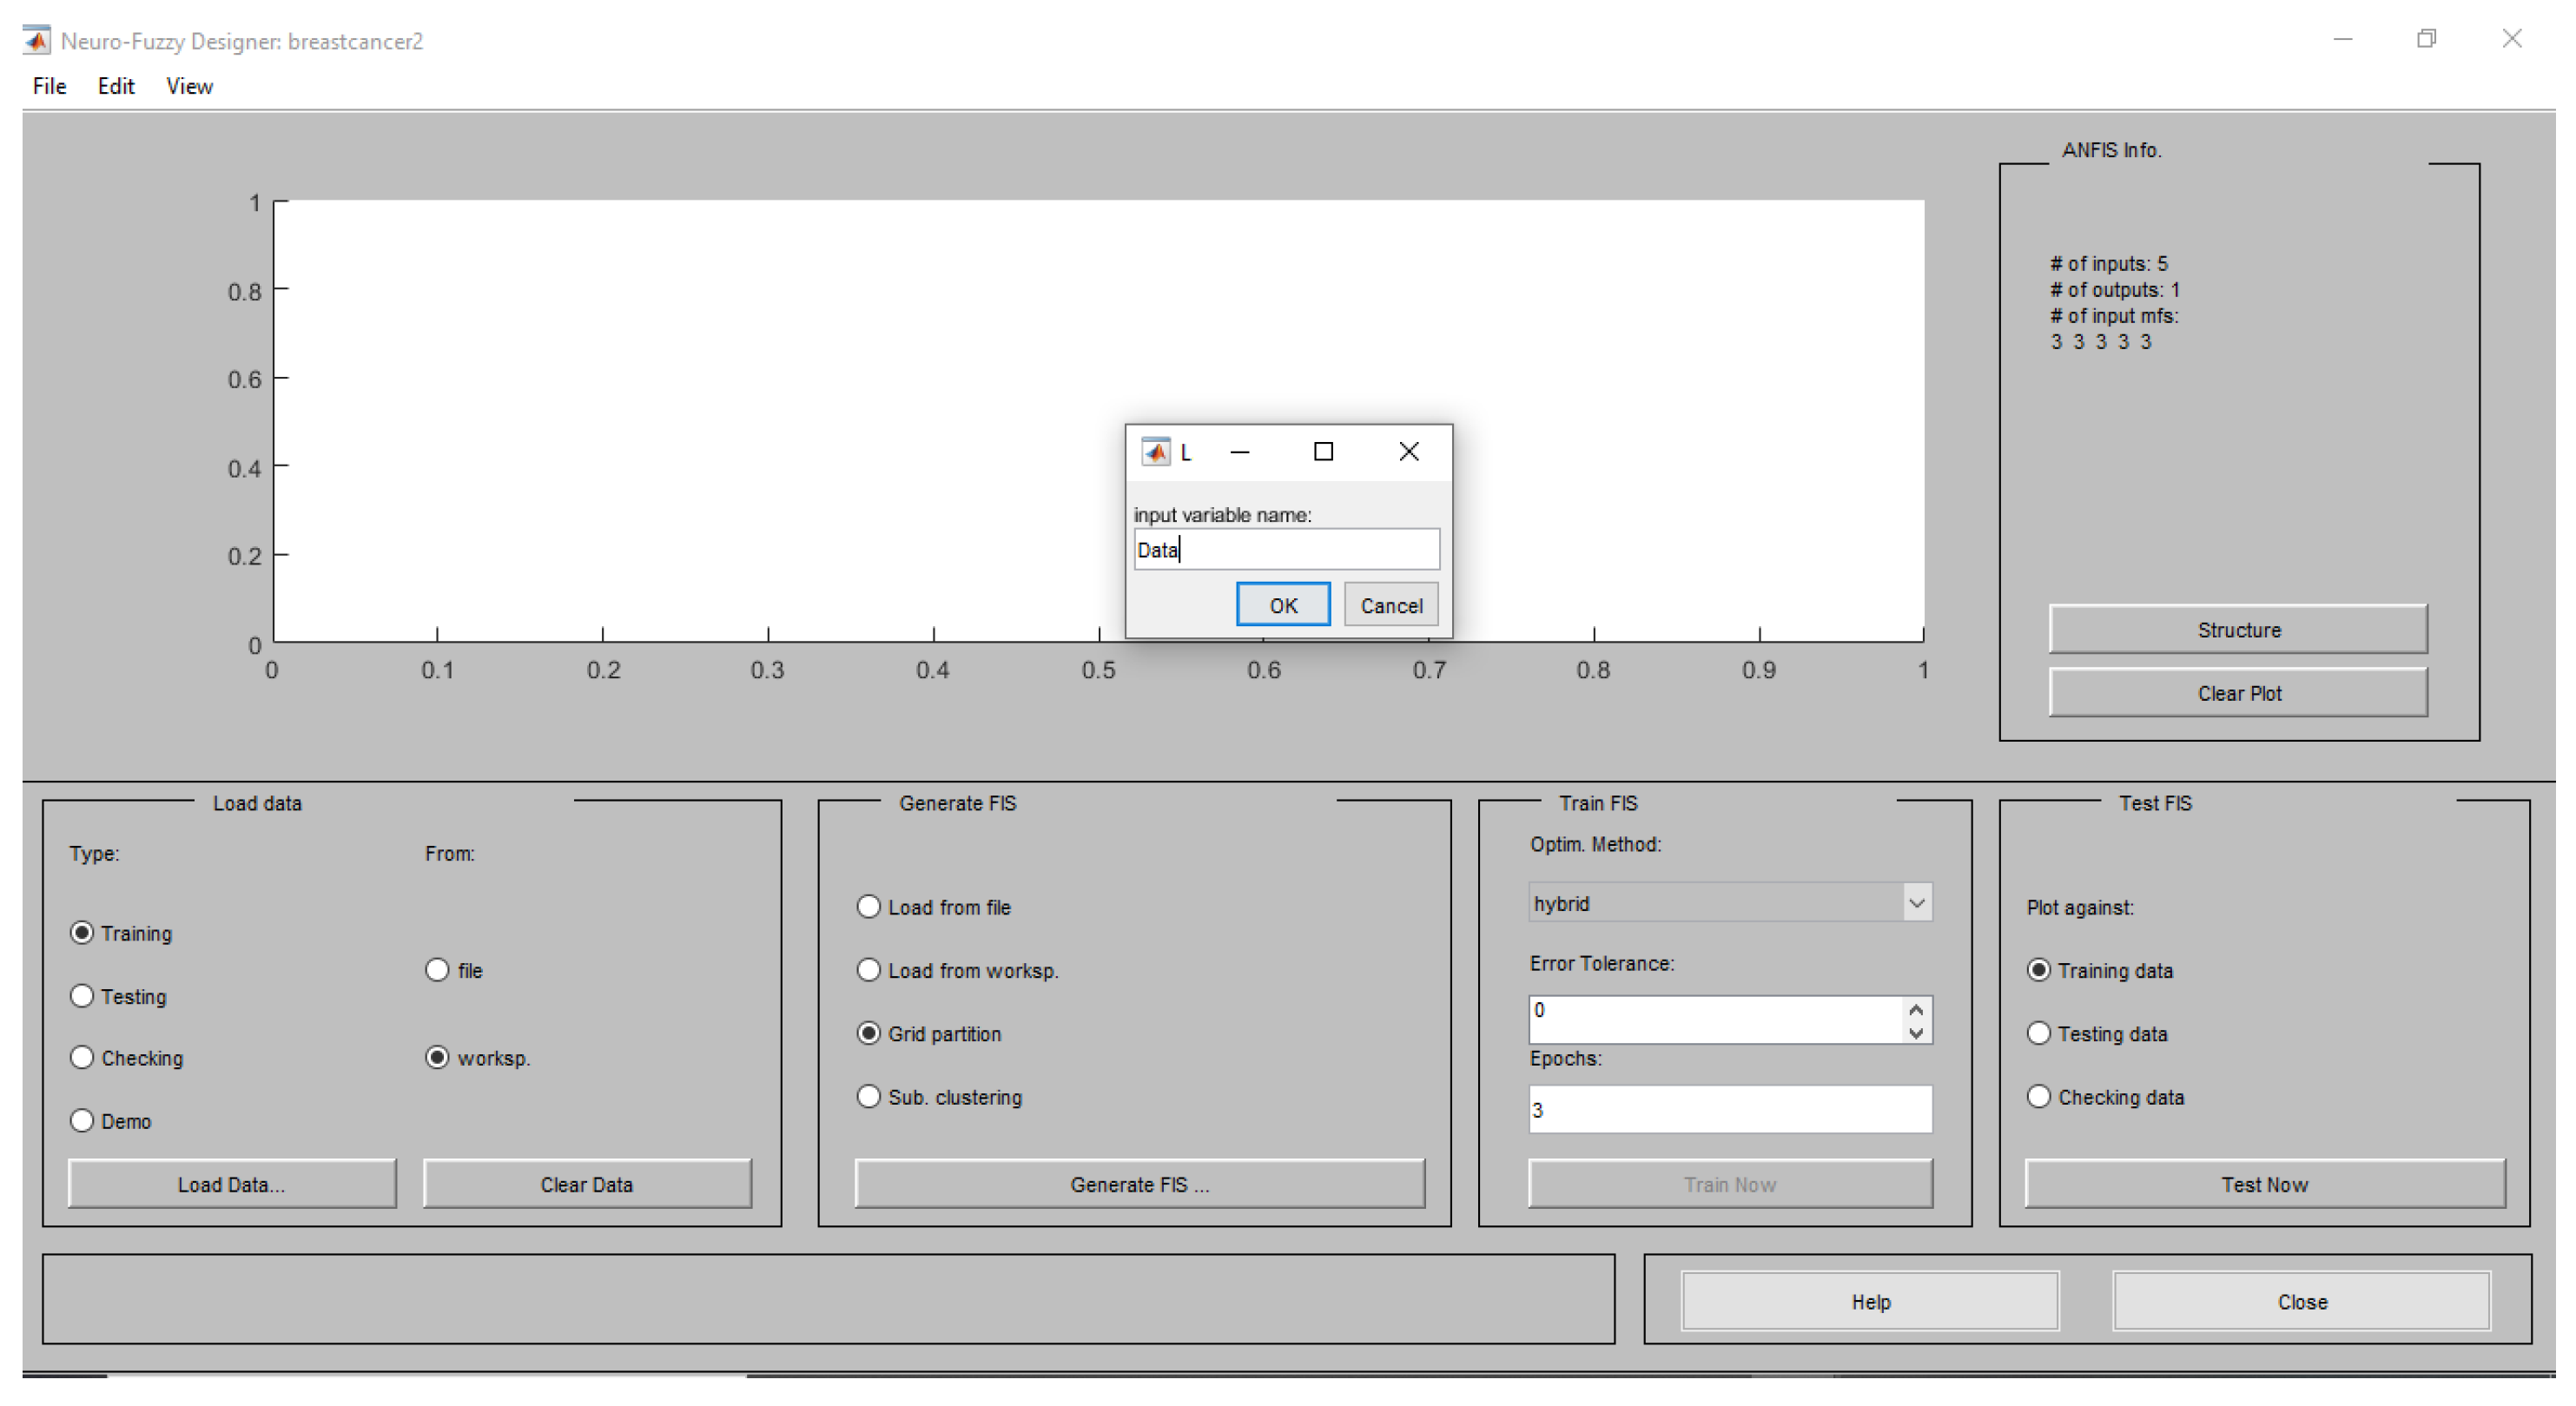
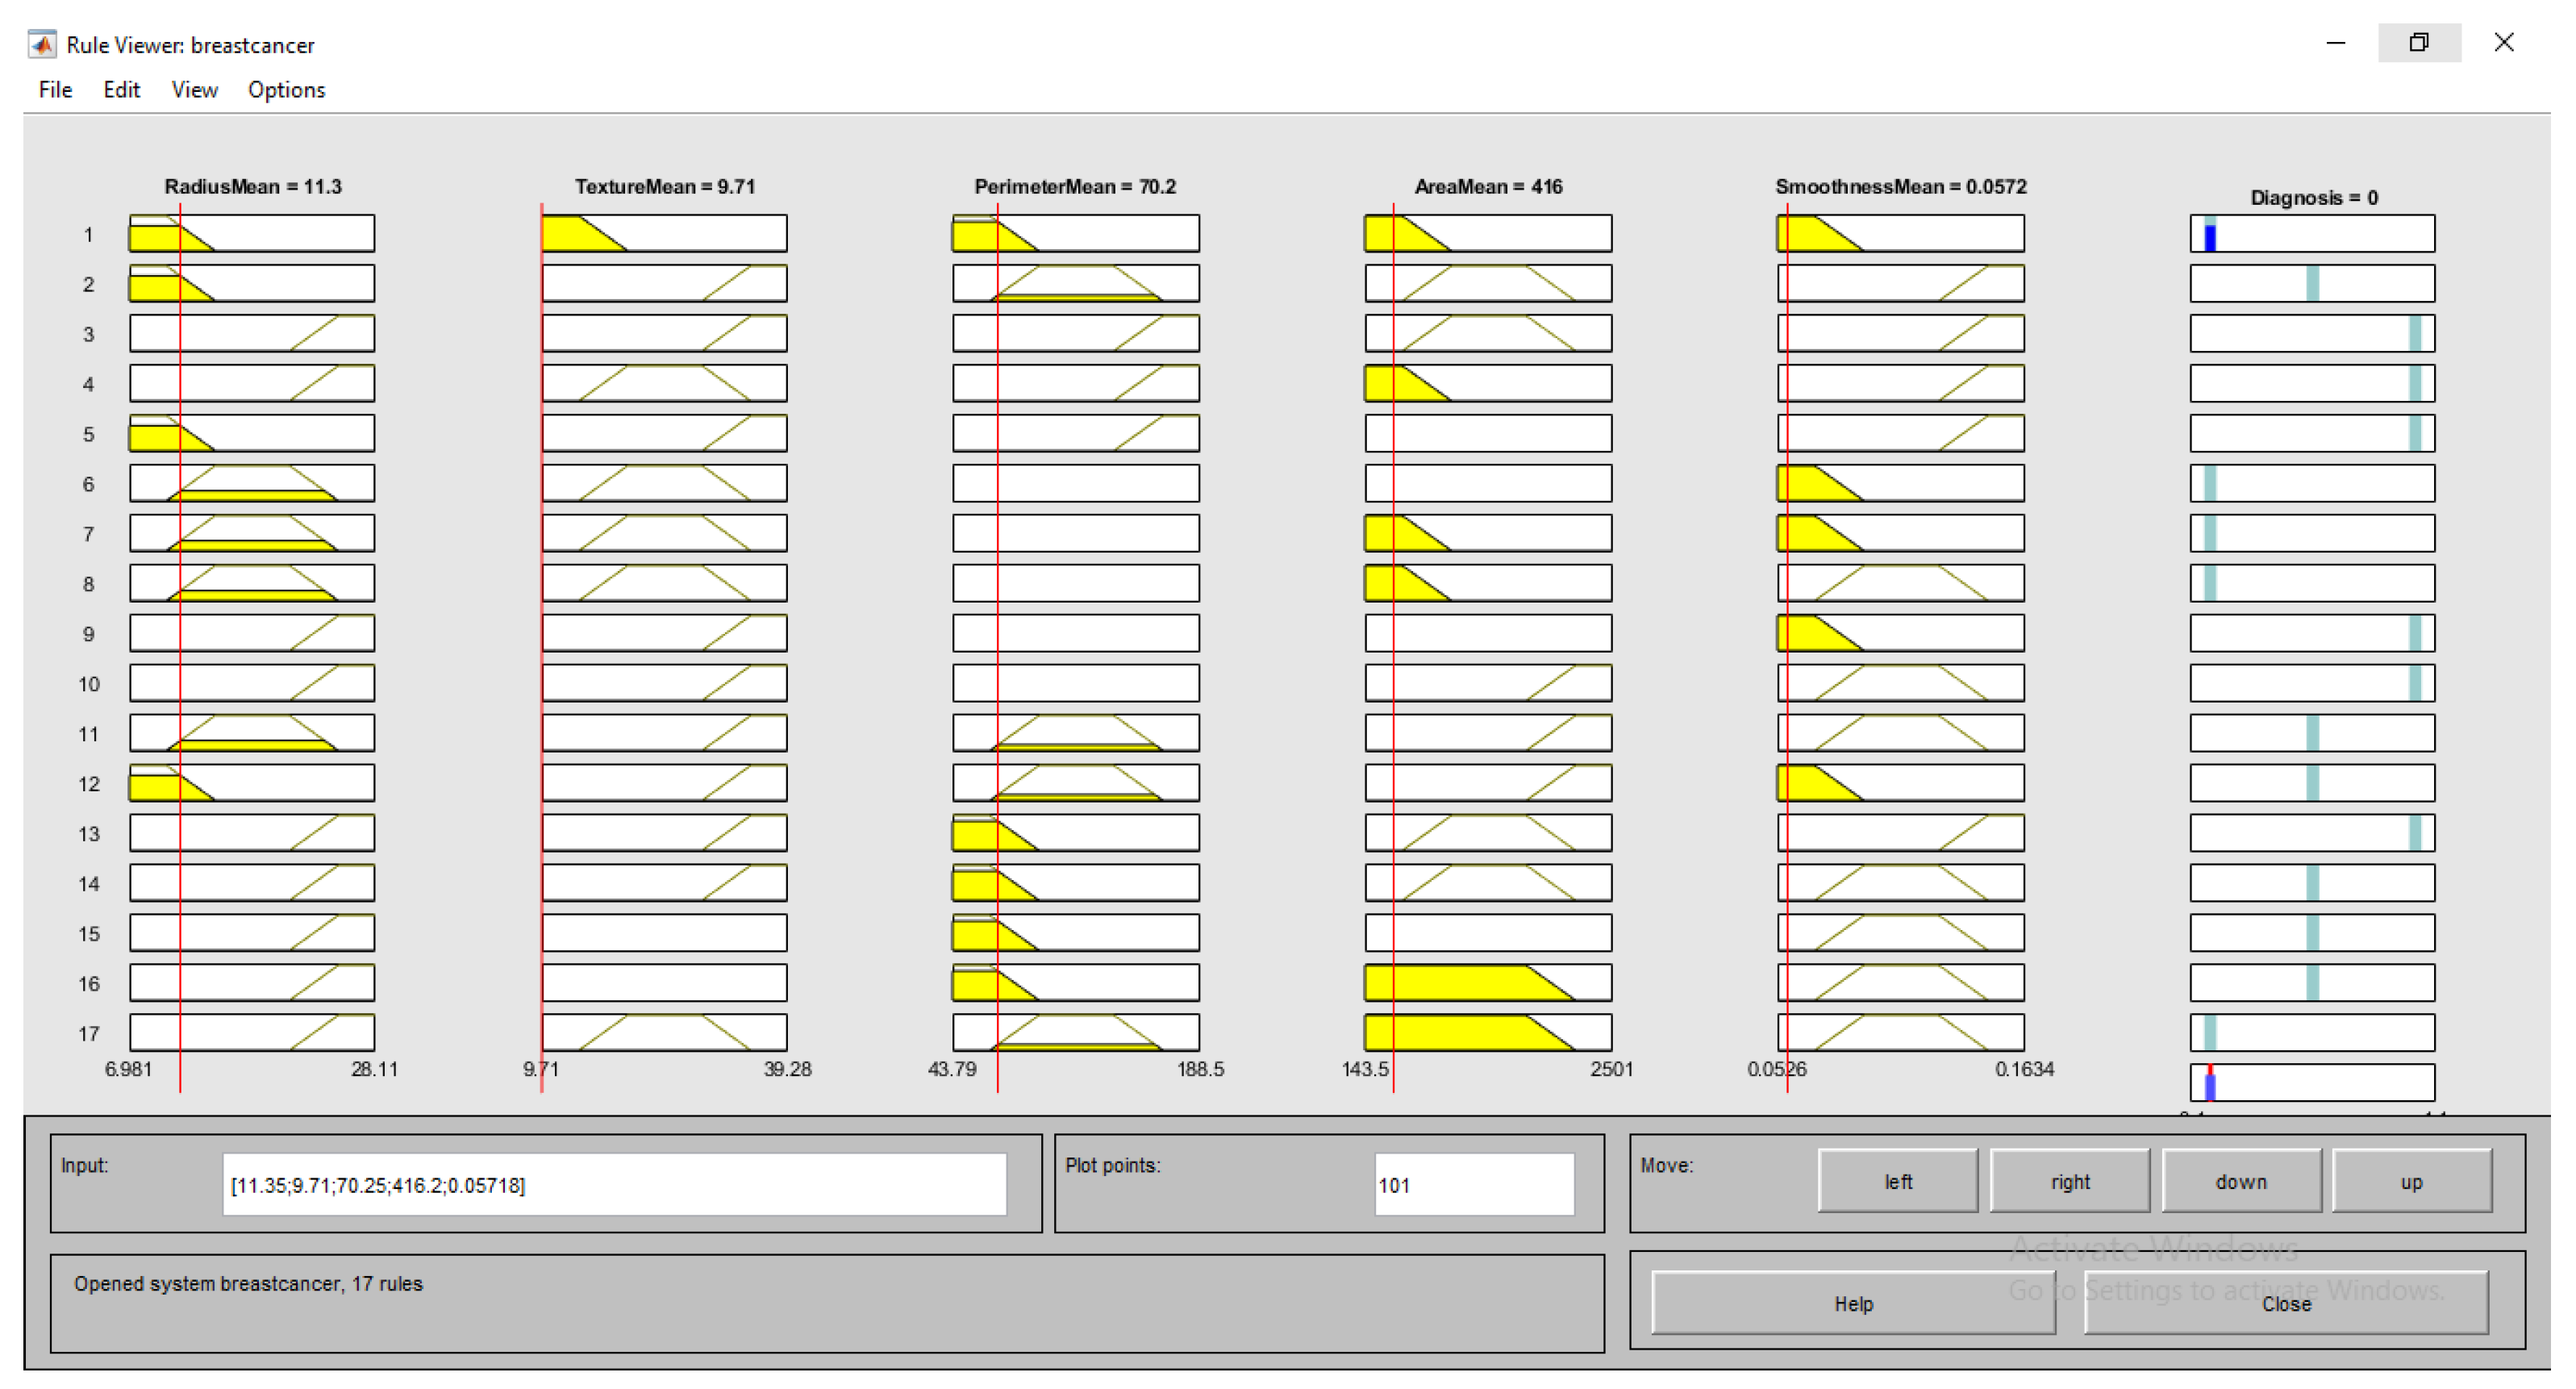
4.4.1. Input Layer
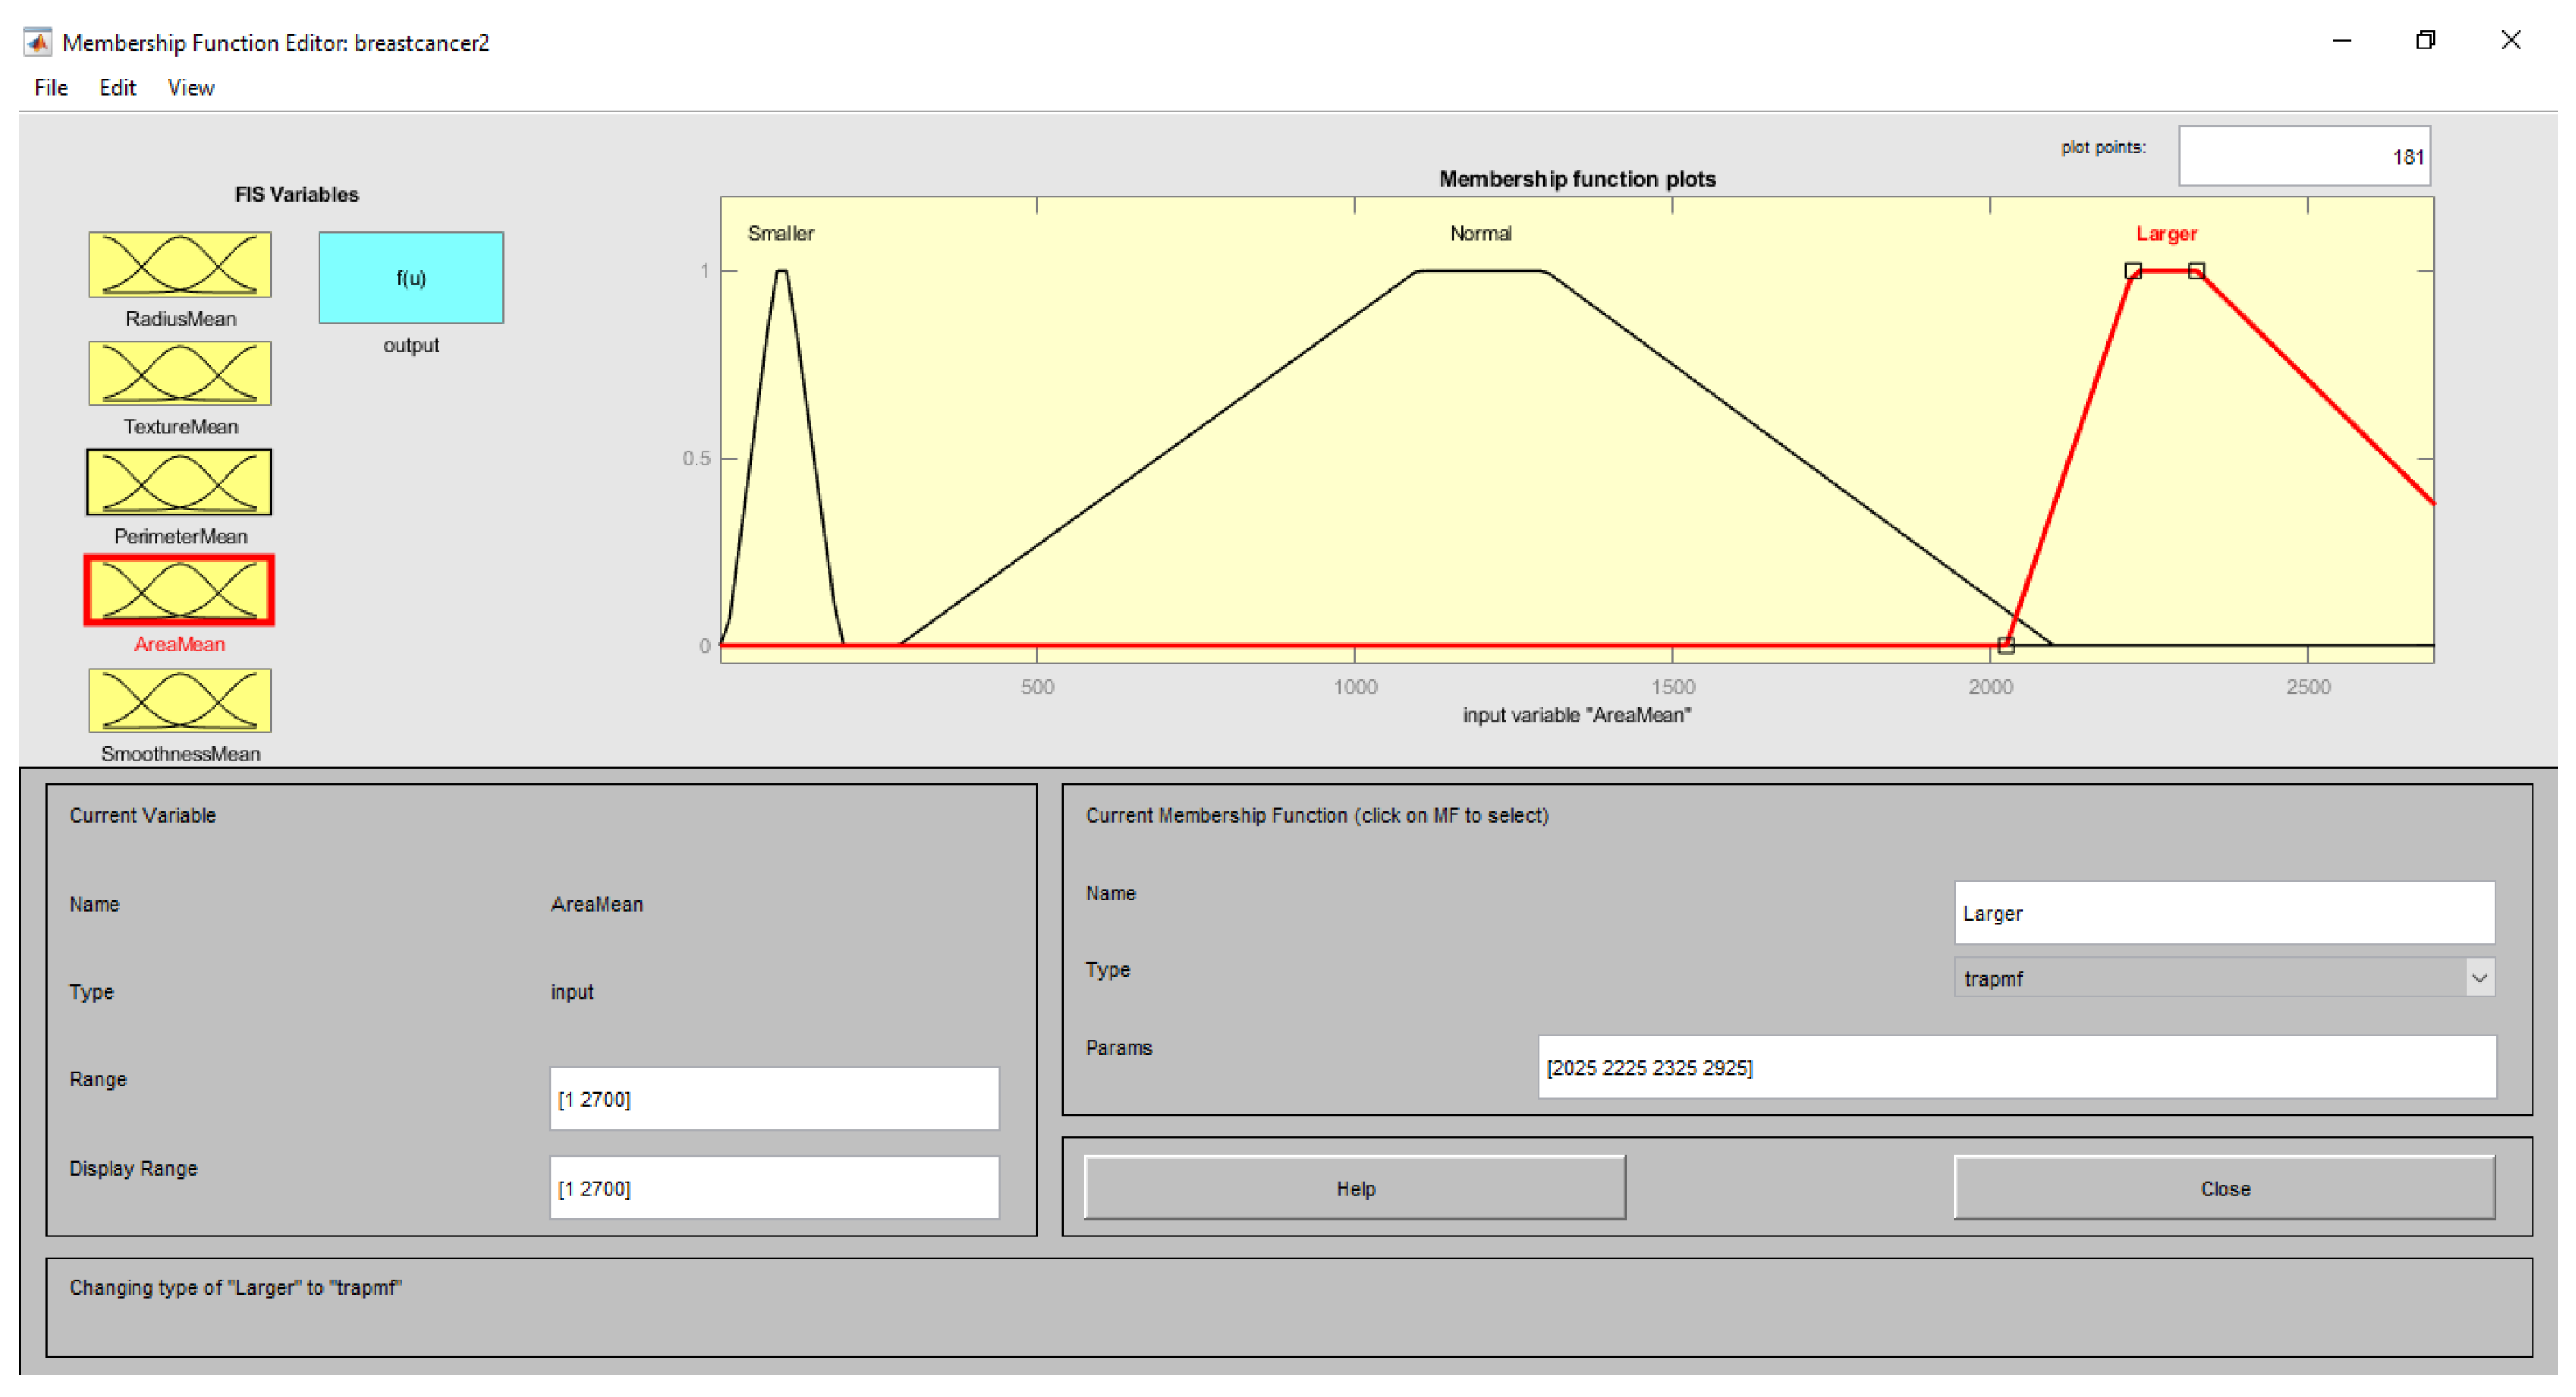
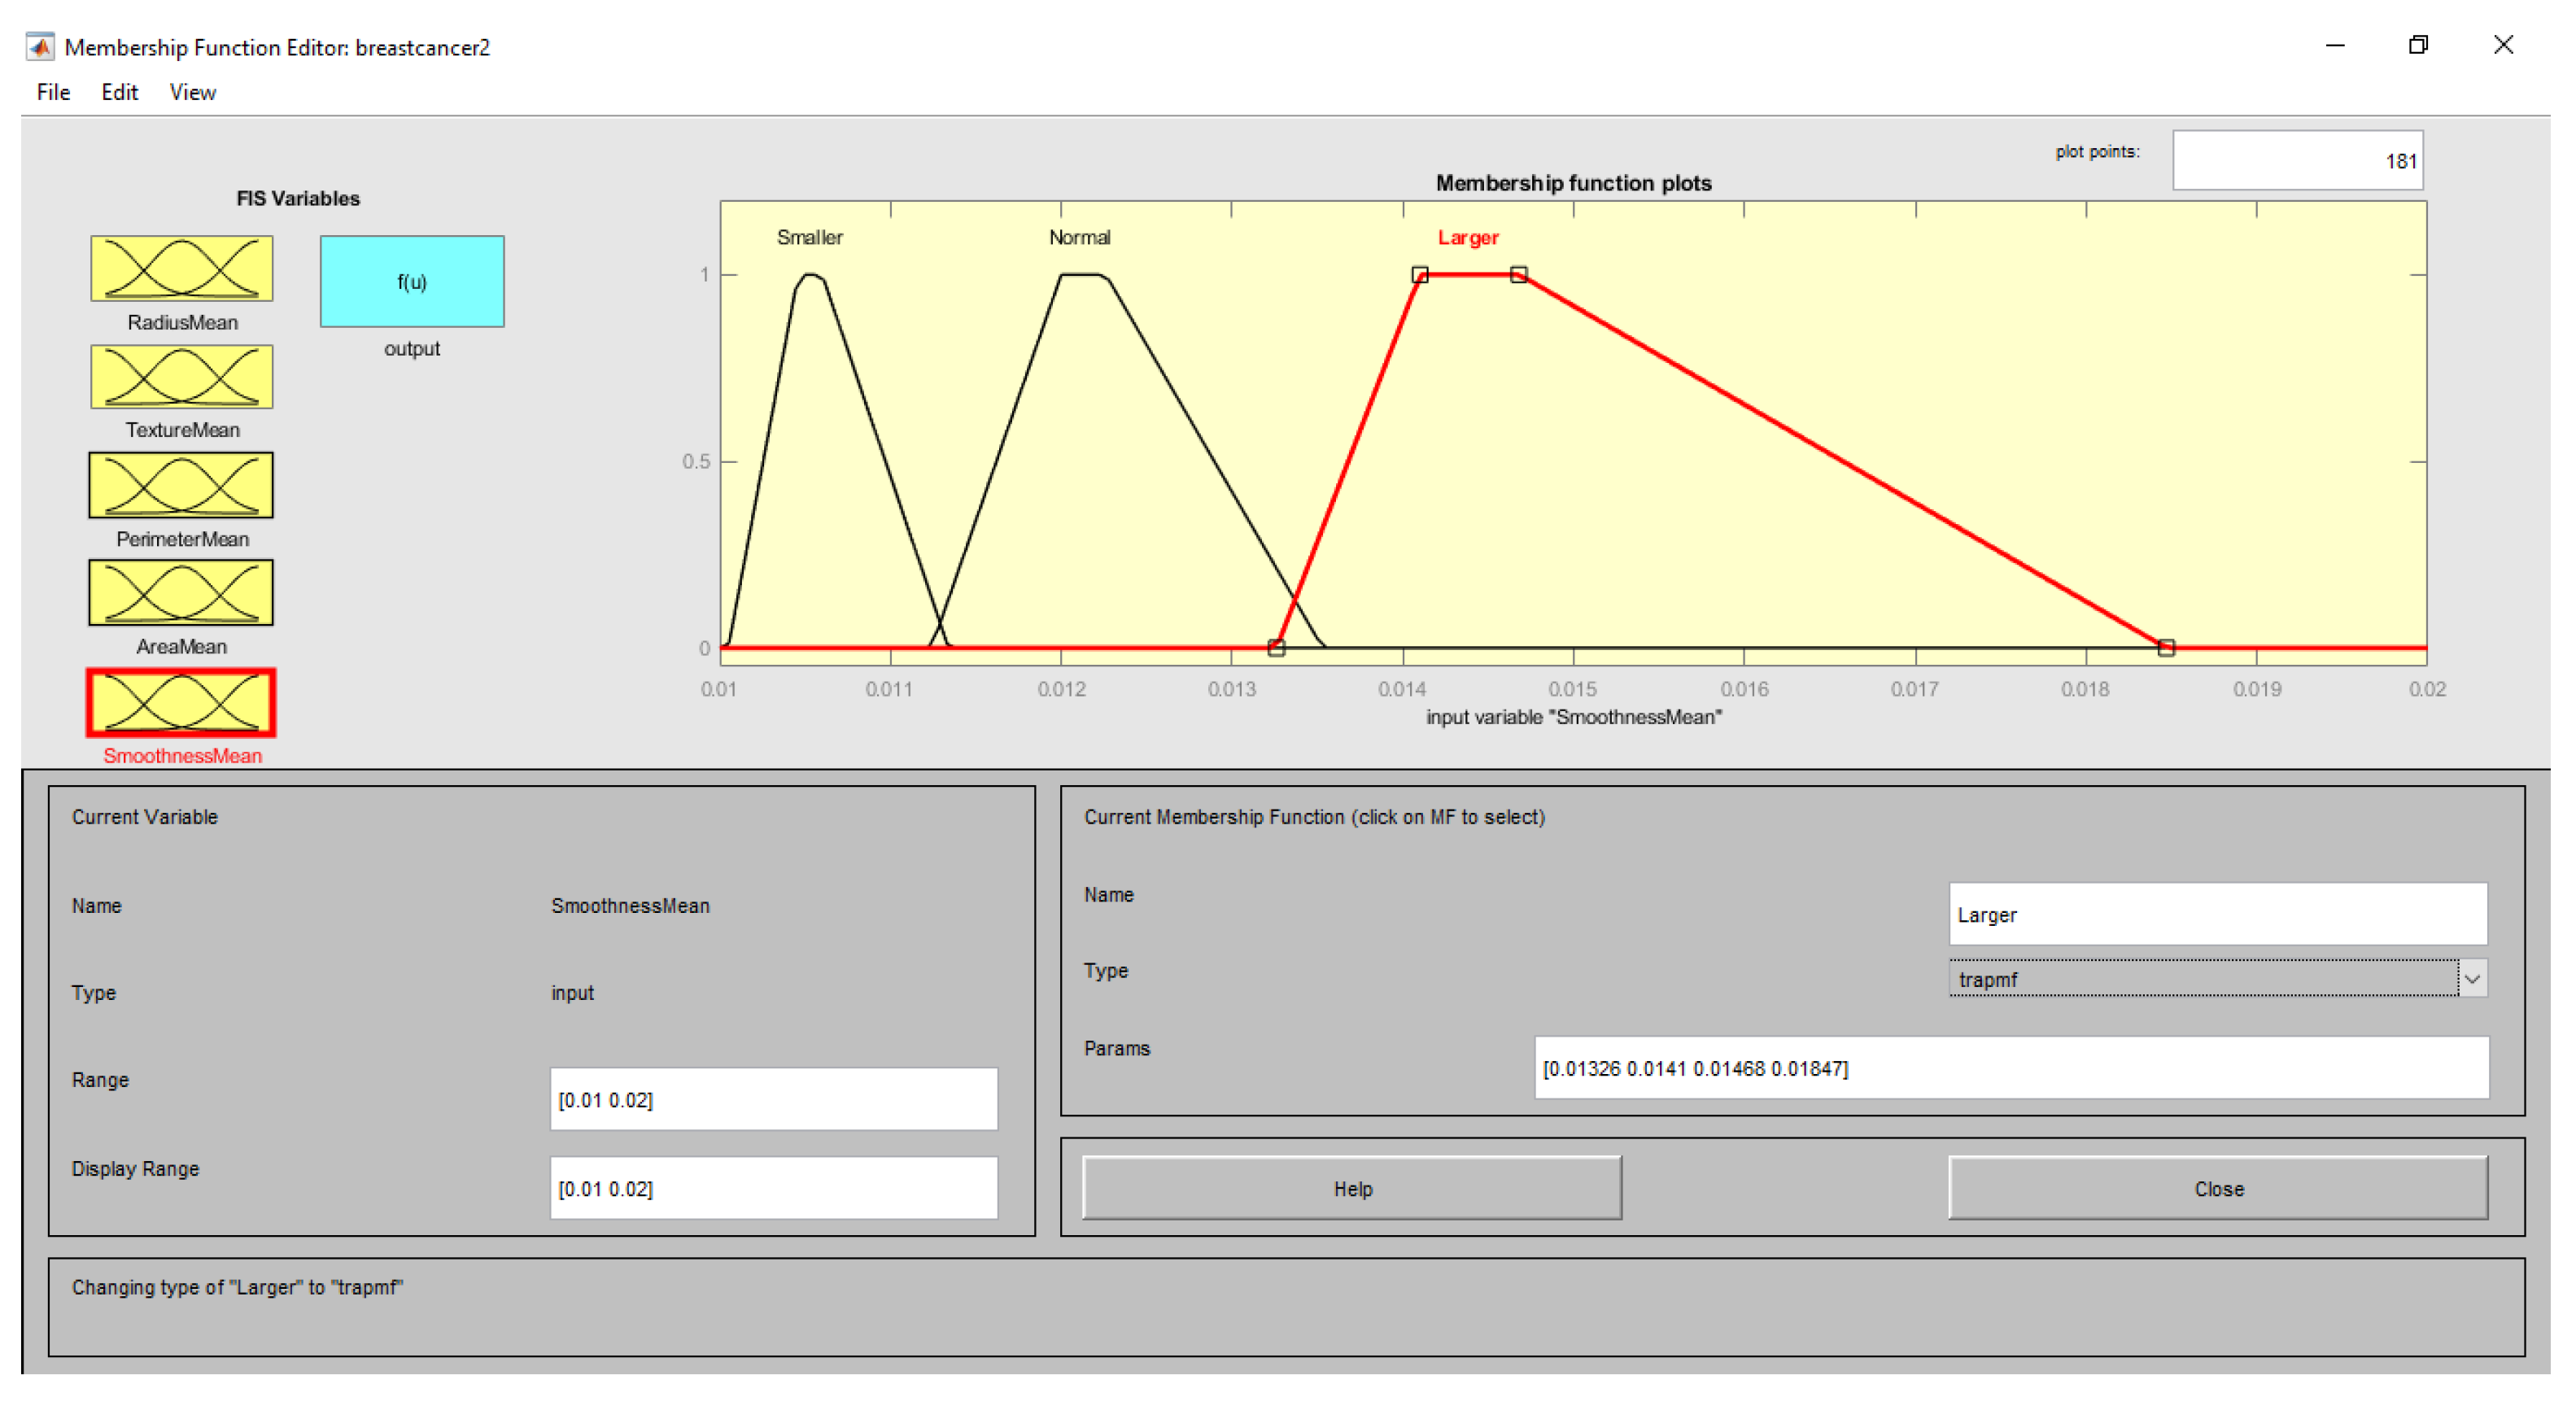
4.4.2. Fuzzification Layer
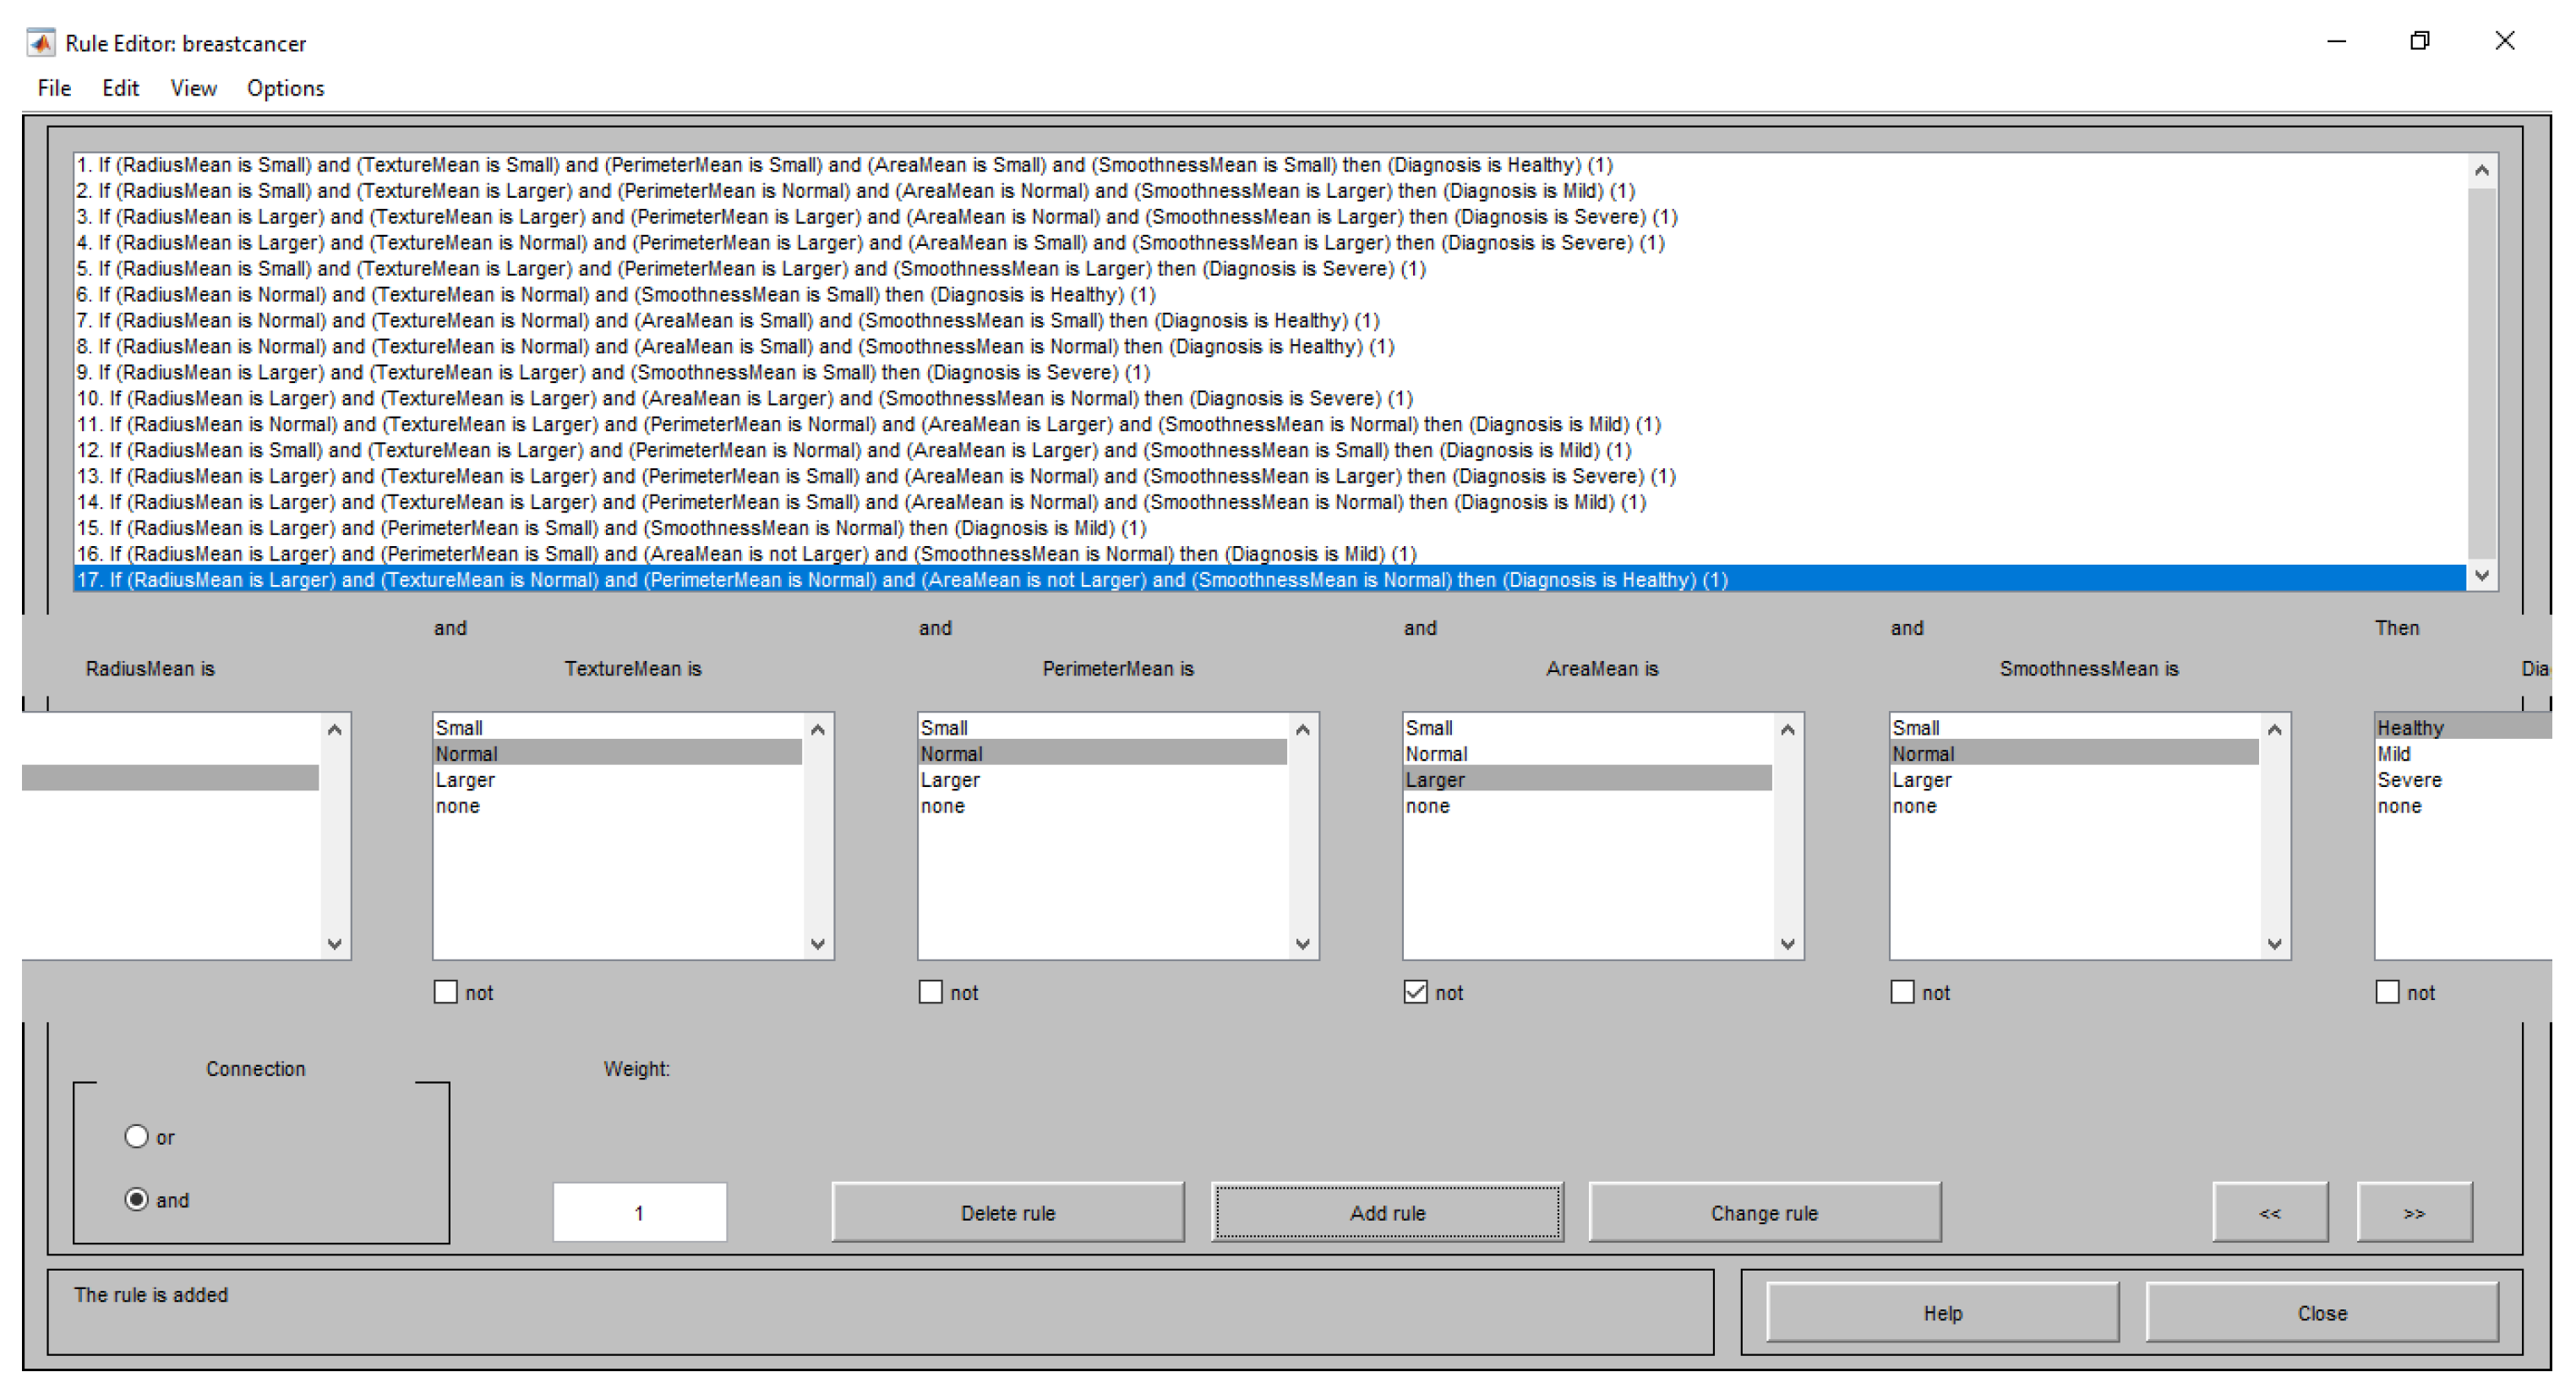
4.4.3. Fuzzy Rules Layers
- (RadiusMean == Larger) & (TextureMean == Normal) ) & (PerimeterMean == Normal) ) & (AreaMean == Normal ) & (SmoothnessMean == Small) => (Diagnosis == Mild)
- (RadiusMean == Normal) & (TextureMean == Normal) ) & (PerimeterMean == Normal) ) & (AreaMean == Normal) ) & (SmoothnessMean == Normal) => (Diagnosis == Healthy)
- (RadiusMean == Larger) & (TextureMean == Larger) ) & (PerimeterMean == Larger) ) & (AreaMean == Larger) ) & (SmoothnessMean == Larger) = > (Diagnosis == Severe)
- (RadiusMean ==Small) & (TextureMean == Normal) ) & (PerimeterMean == Normal) ) & (AreaMean == Normal ) & (SmoothnessMean == Normal) => (Diagnosis == Healthy)
- (RadiusMean == Lager) & (TextureMean == Small) ) & (PerimeterMean == Normal) ) & (AreaMean == Small) ) & (SmoothnessMean == Larger) => (Diagnosis == MIld)
- (RadiusMean == Normal) & (TextureMean == Small) ) & (PerimeterMean == Normal) ) & (AreaMean == Small ) & (SmoothnessMean == Normal) => (Diagnosis == Healthy)
- (RadiusMean == Small) & (TextureMean == Larger) ) & (PerimeterMean == Normal) ) & (AreaMean == Small) ) & (SmoothnessMean == Larger) => (Diagnosis == Mild)
- (RadiusMean == Normal) & (TextureMean == Small) ) & (PerimeterMean == Normal) ) & (AreaMean == Normal ) & (SmoothnessMean == Normal) => (Diagnosis == Healthy)
- (RadiusMean == Larger) & (TextureMean == Larger) ) & (PerimeterMean == Larger) ) & (AreaMean == Larger) ) & (SmoothnessMean == Larger) => (Diagnosis == Severe)
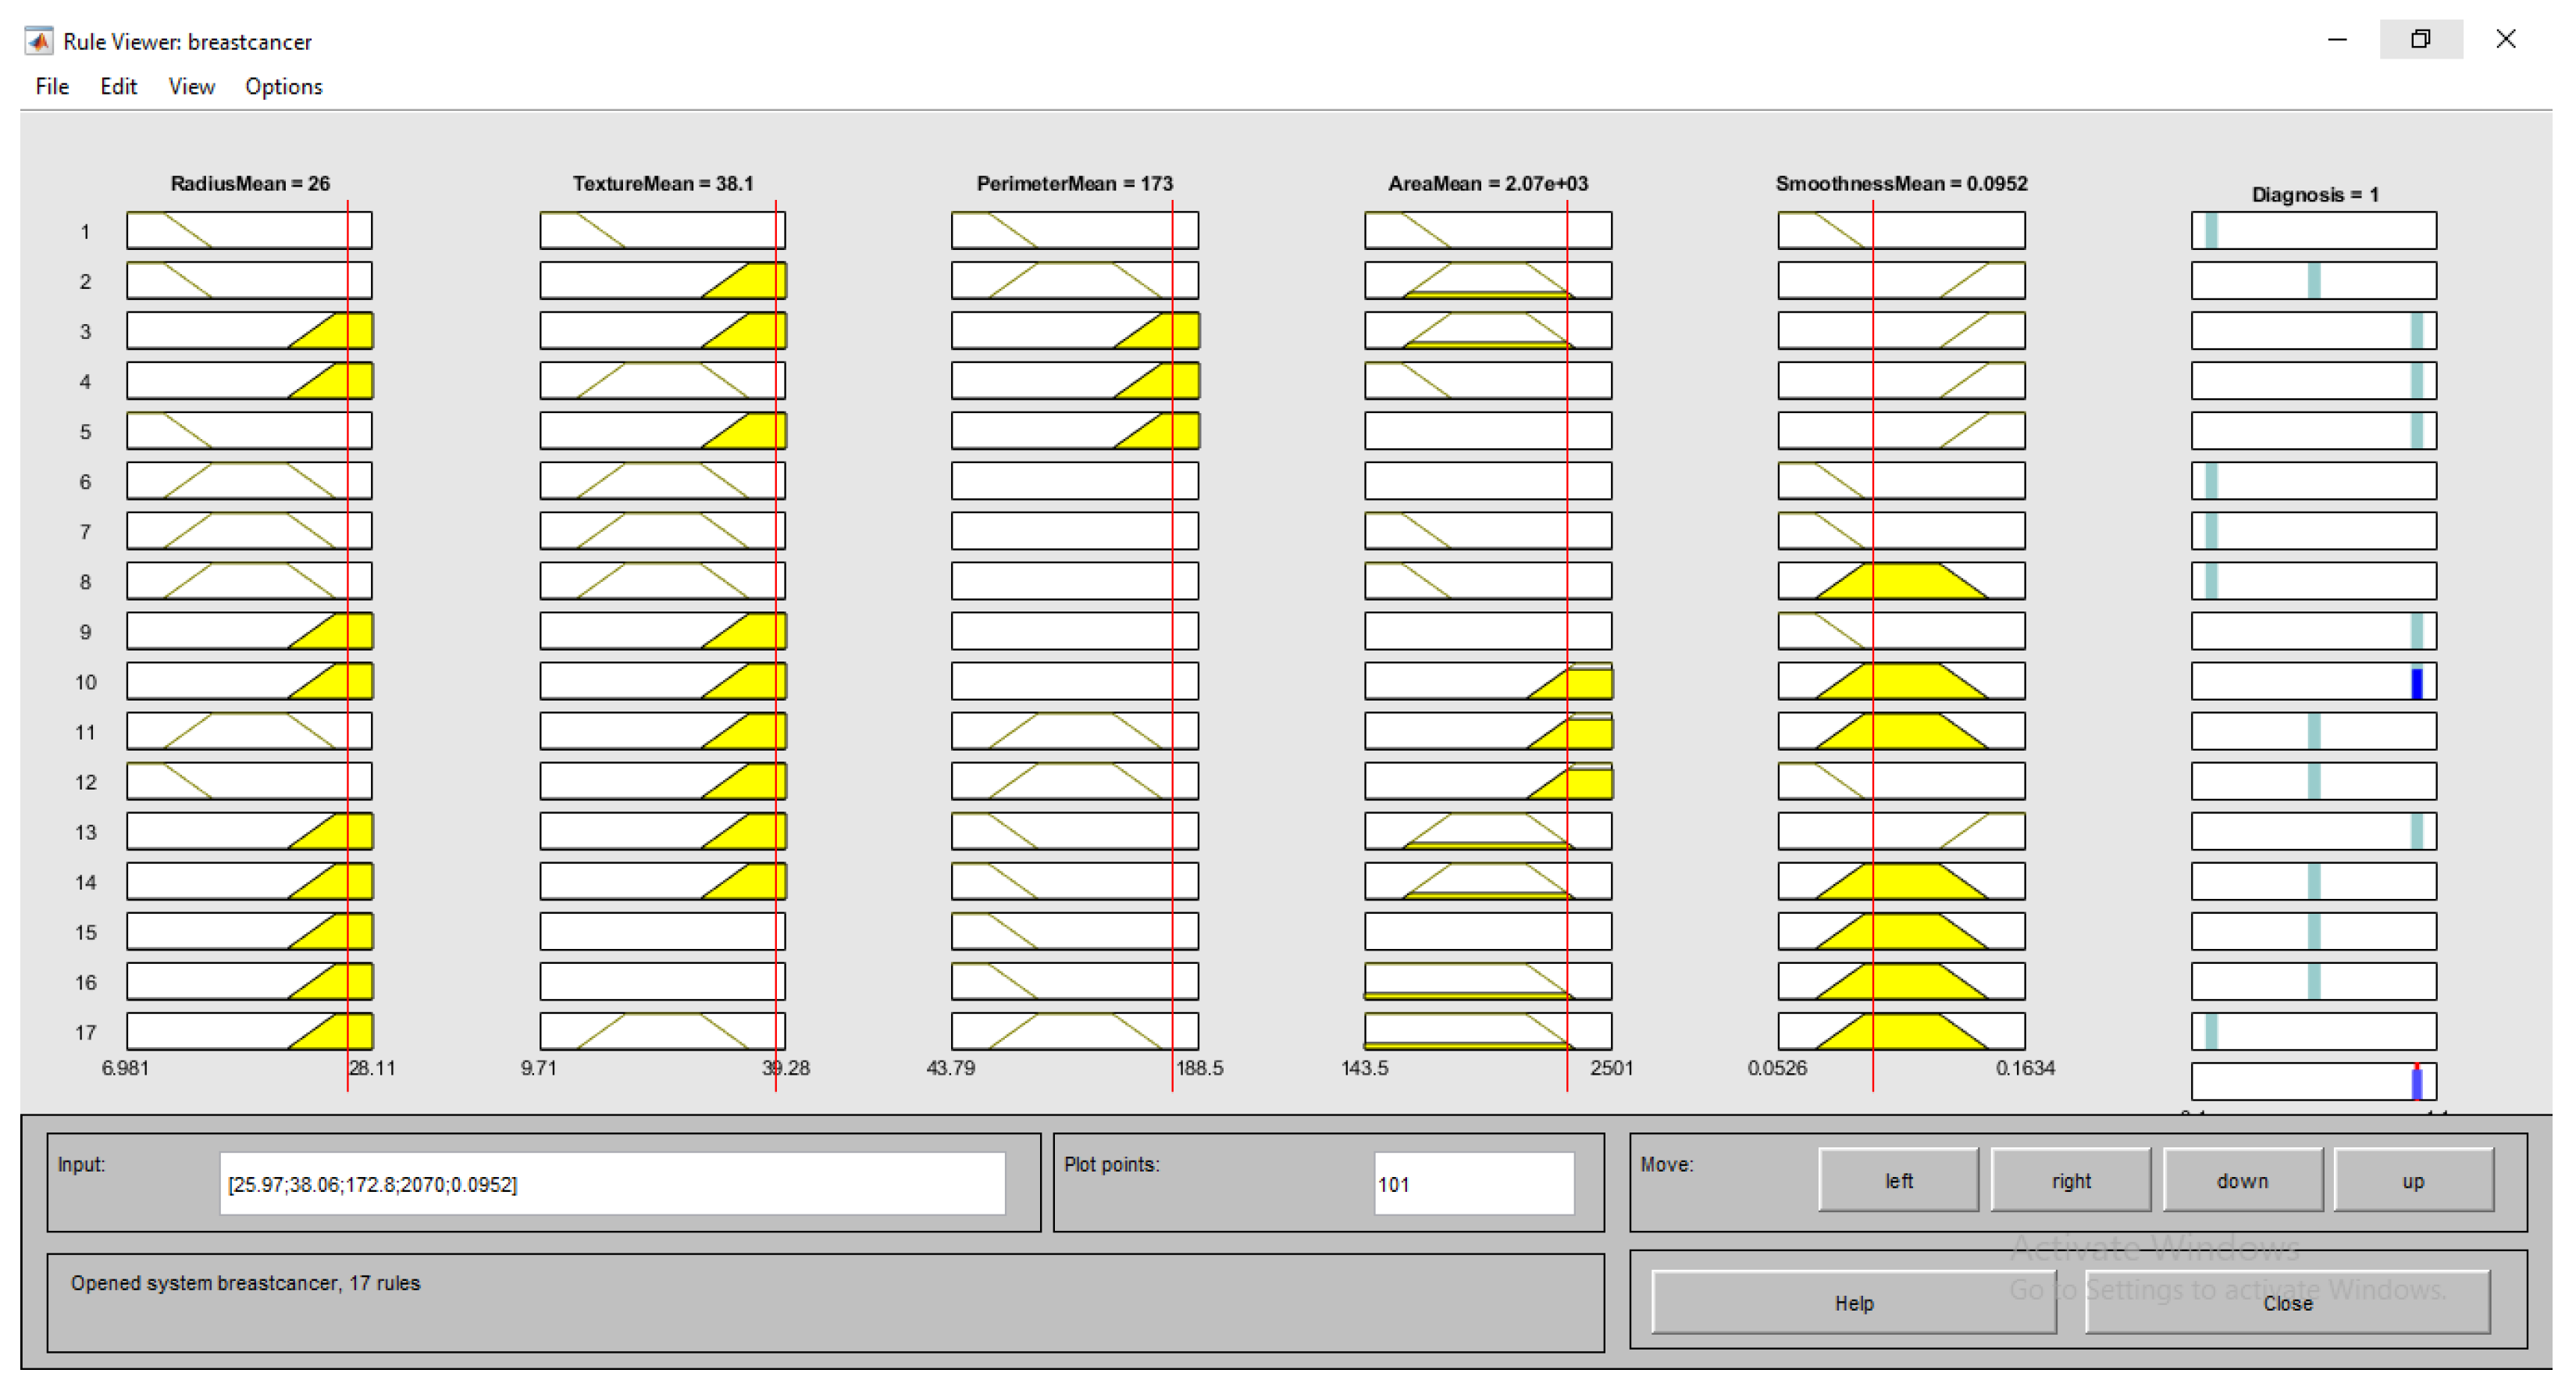
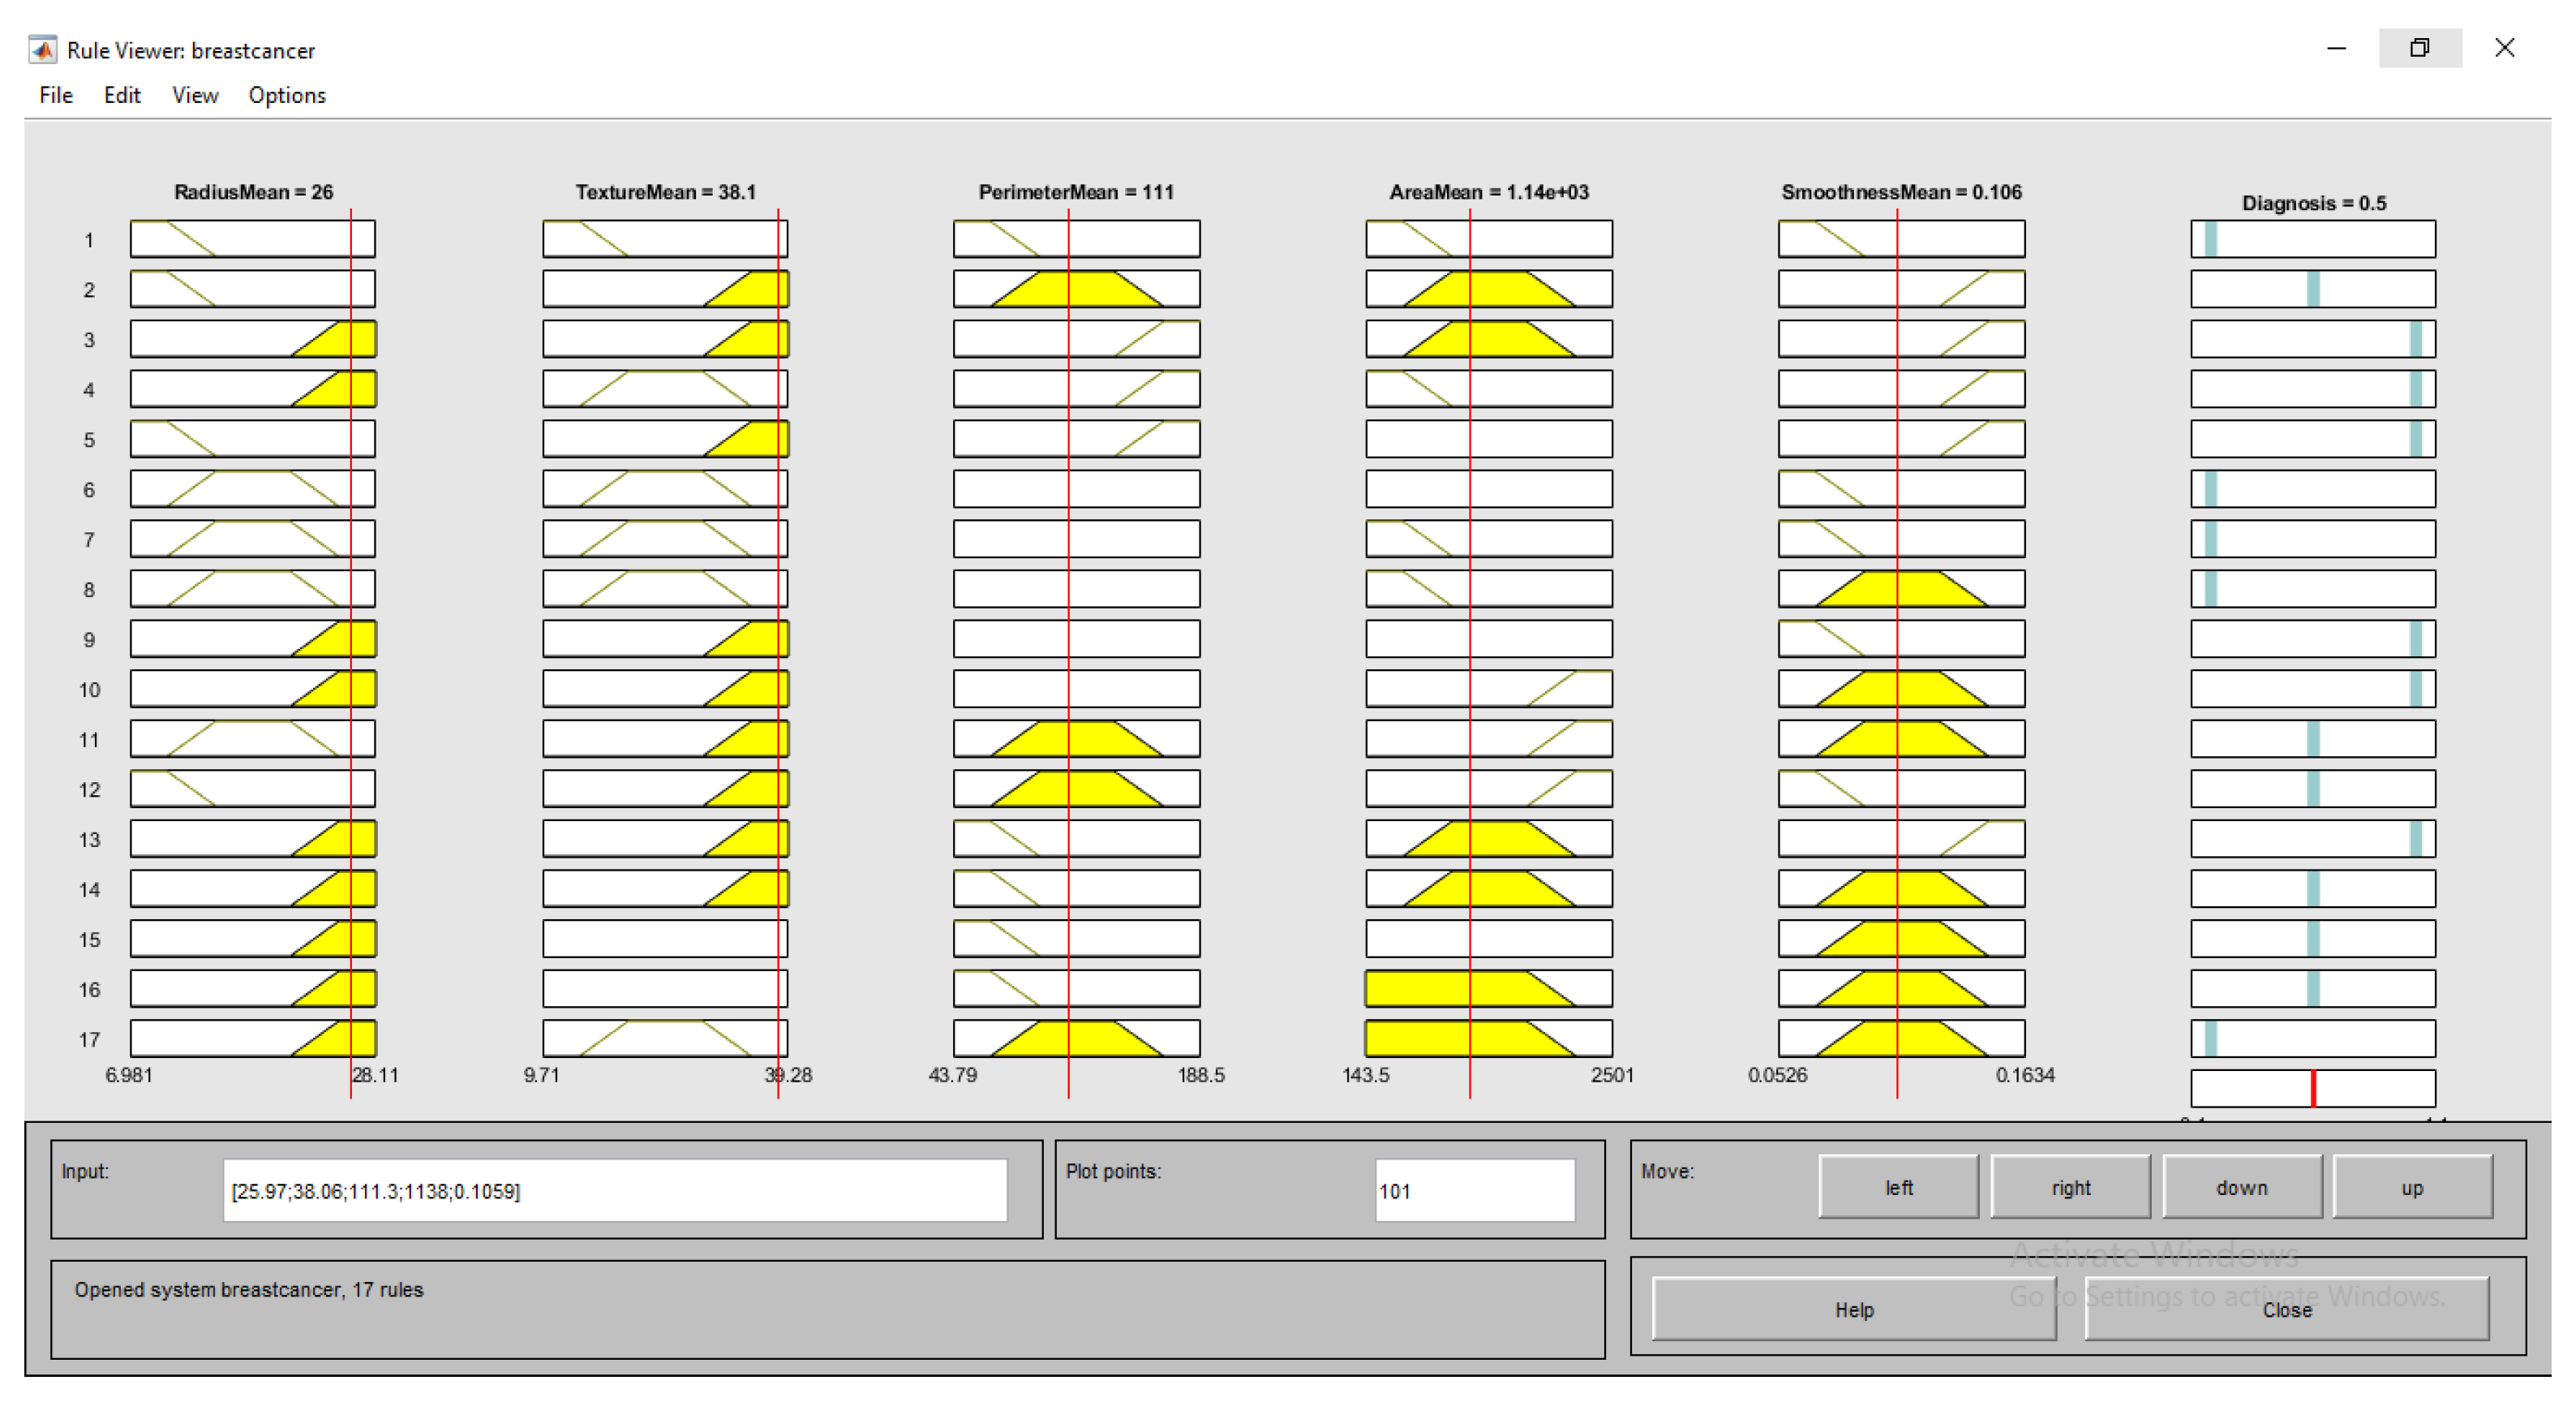
4.4.4. Inference Layer
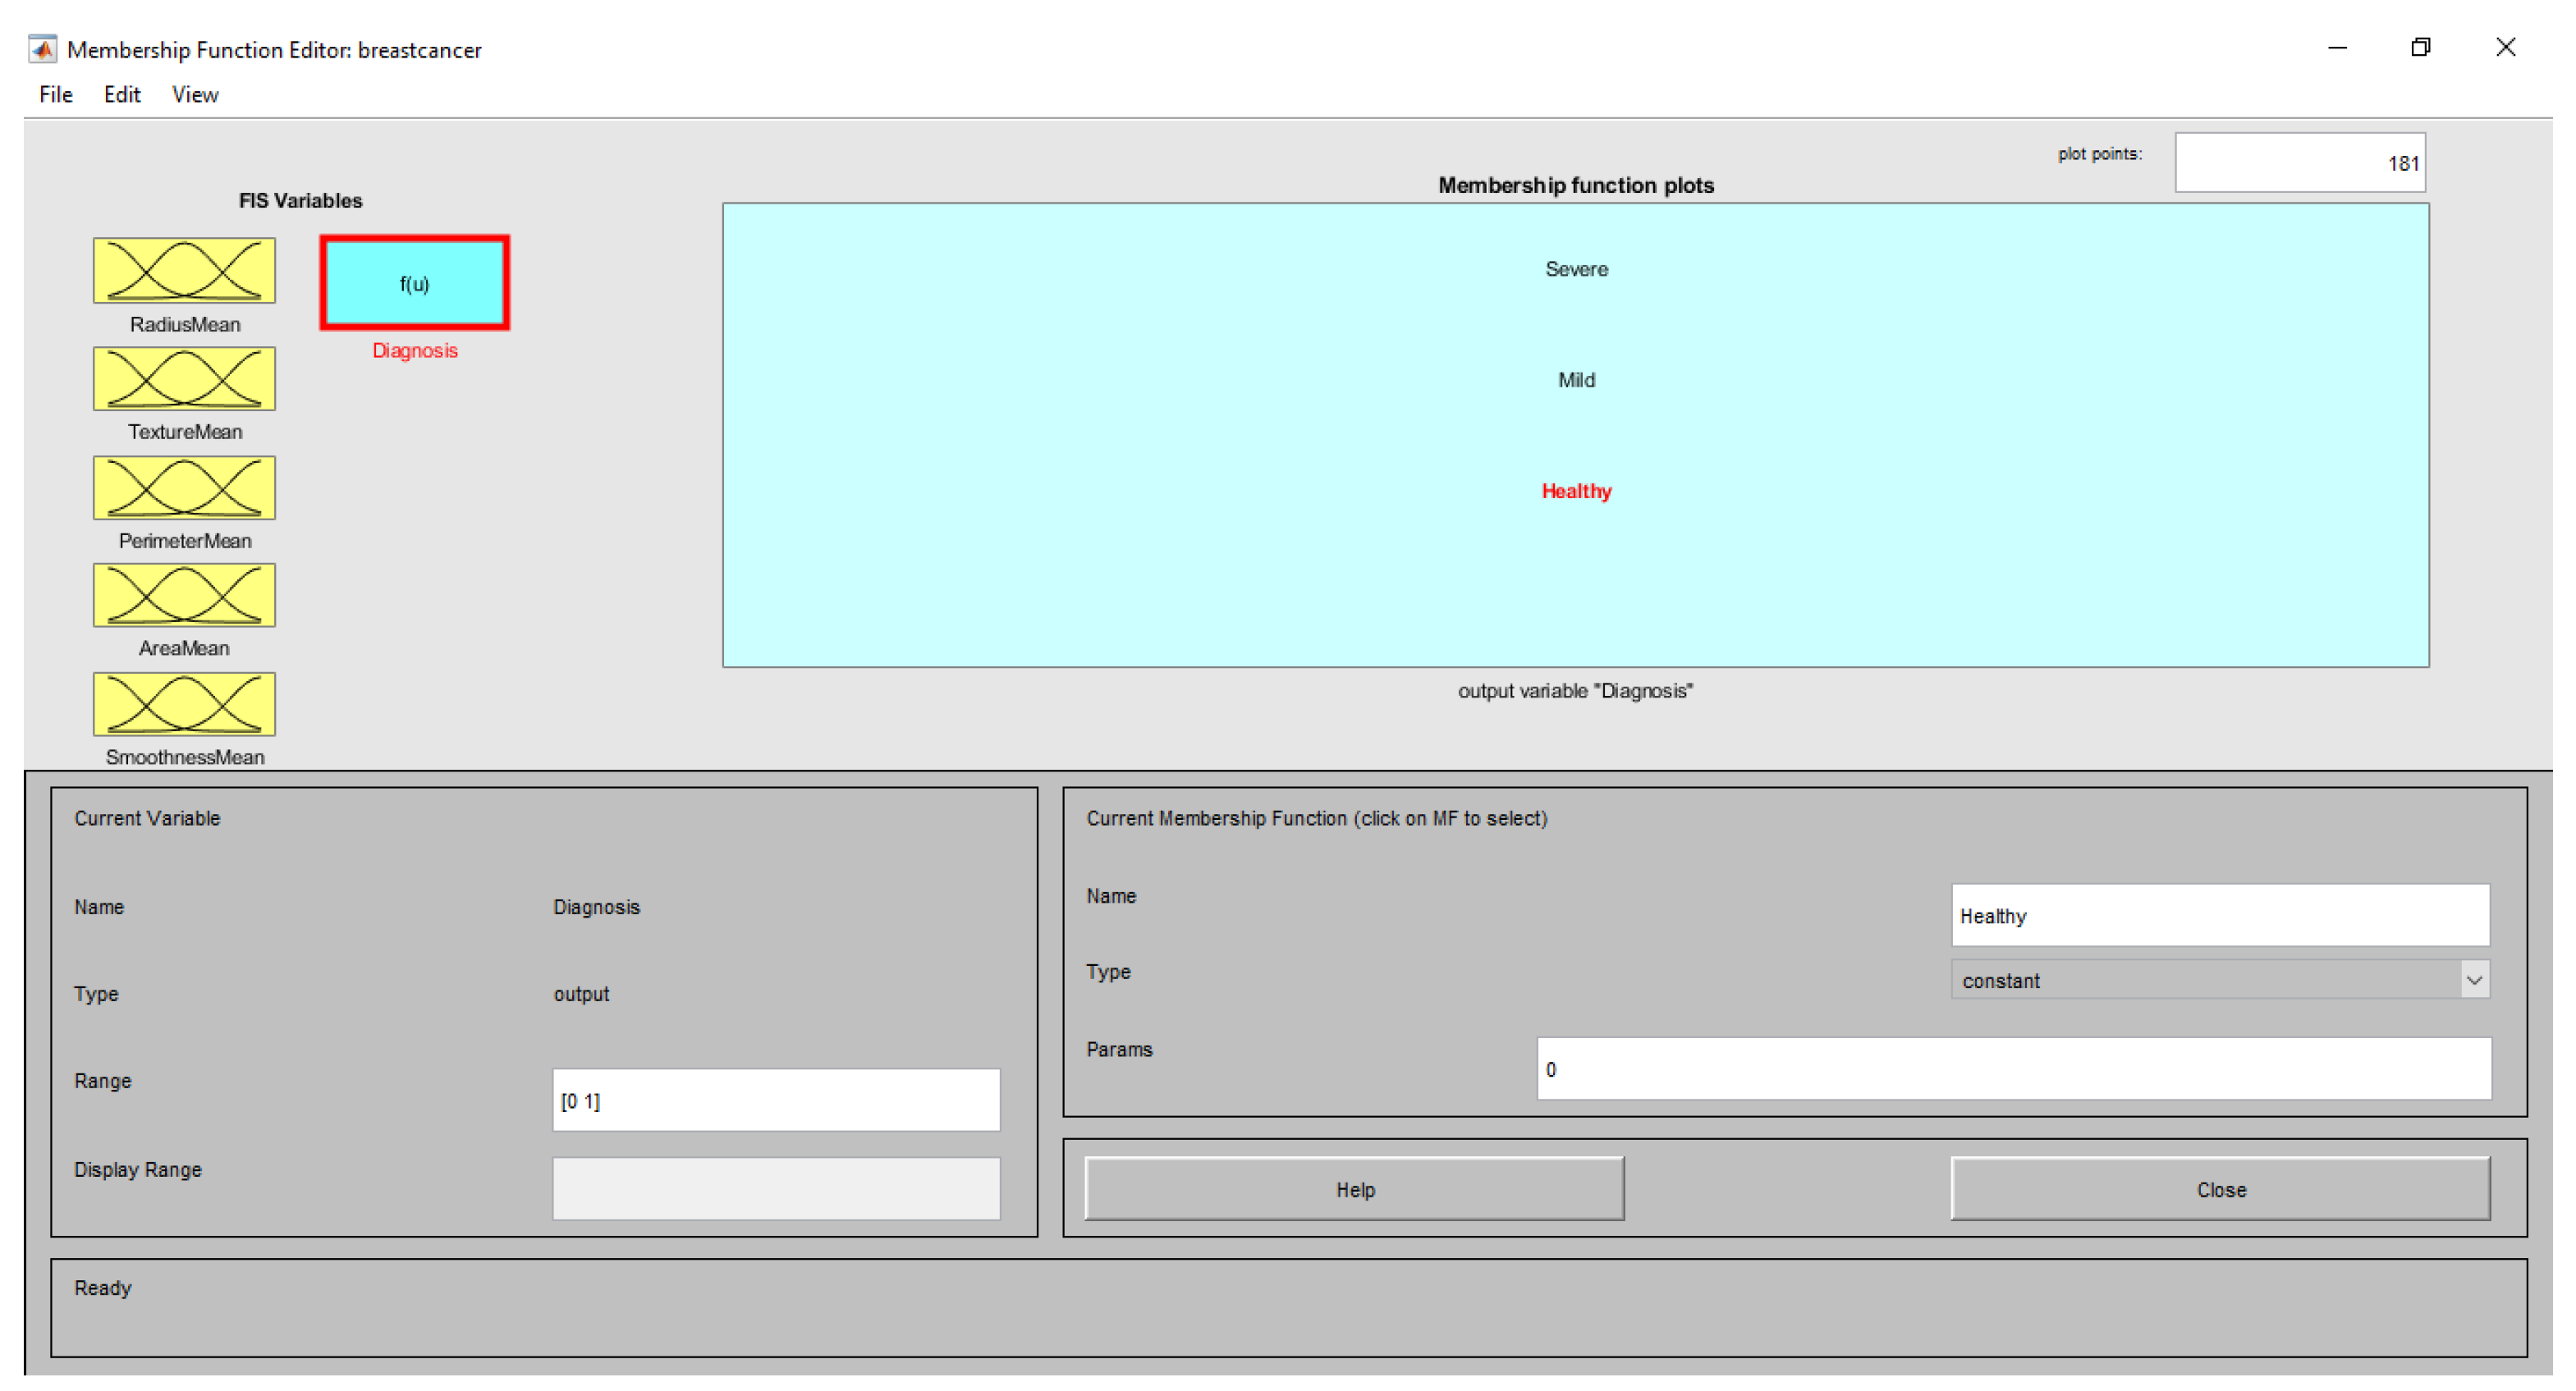
4.4.5. Defuzzification Layer
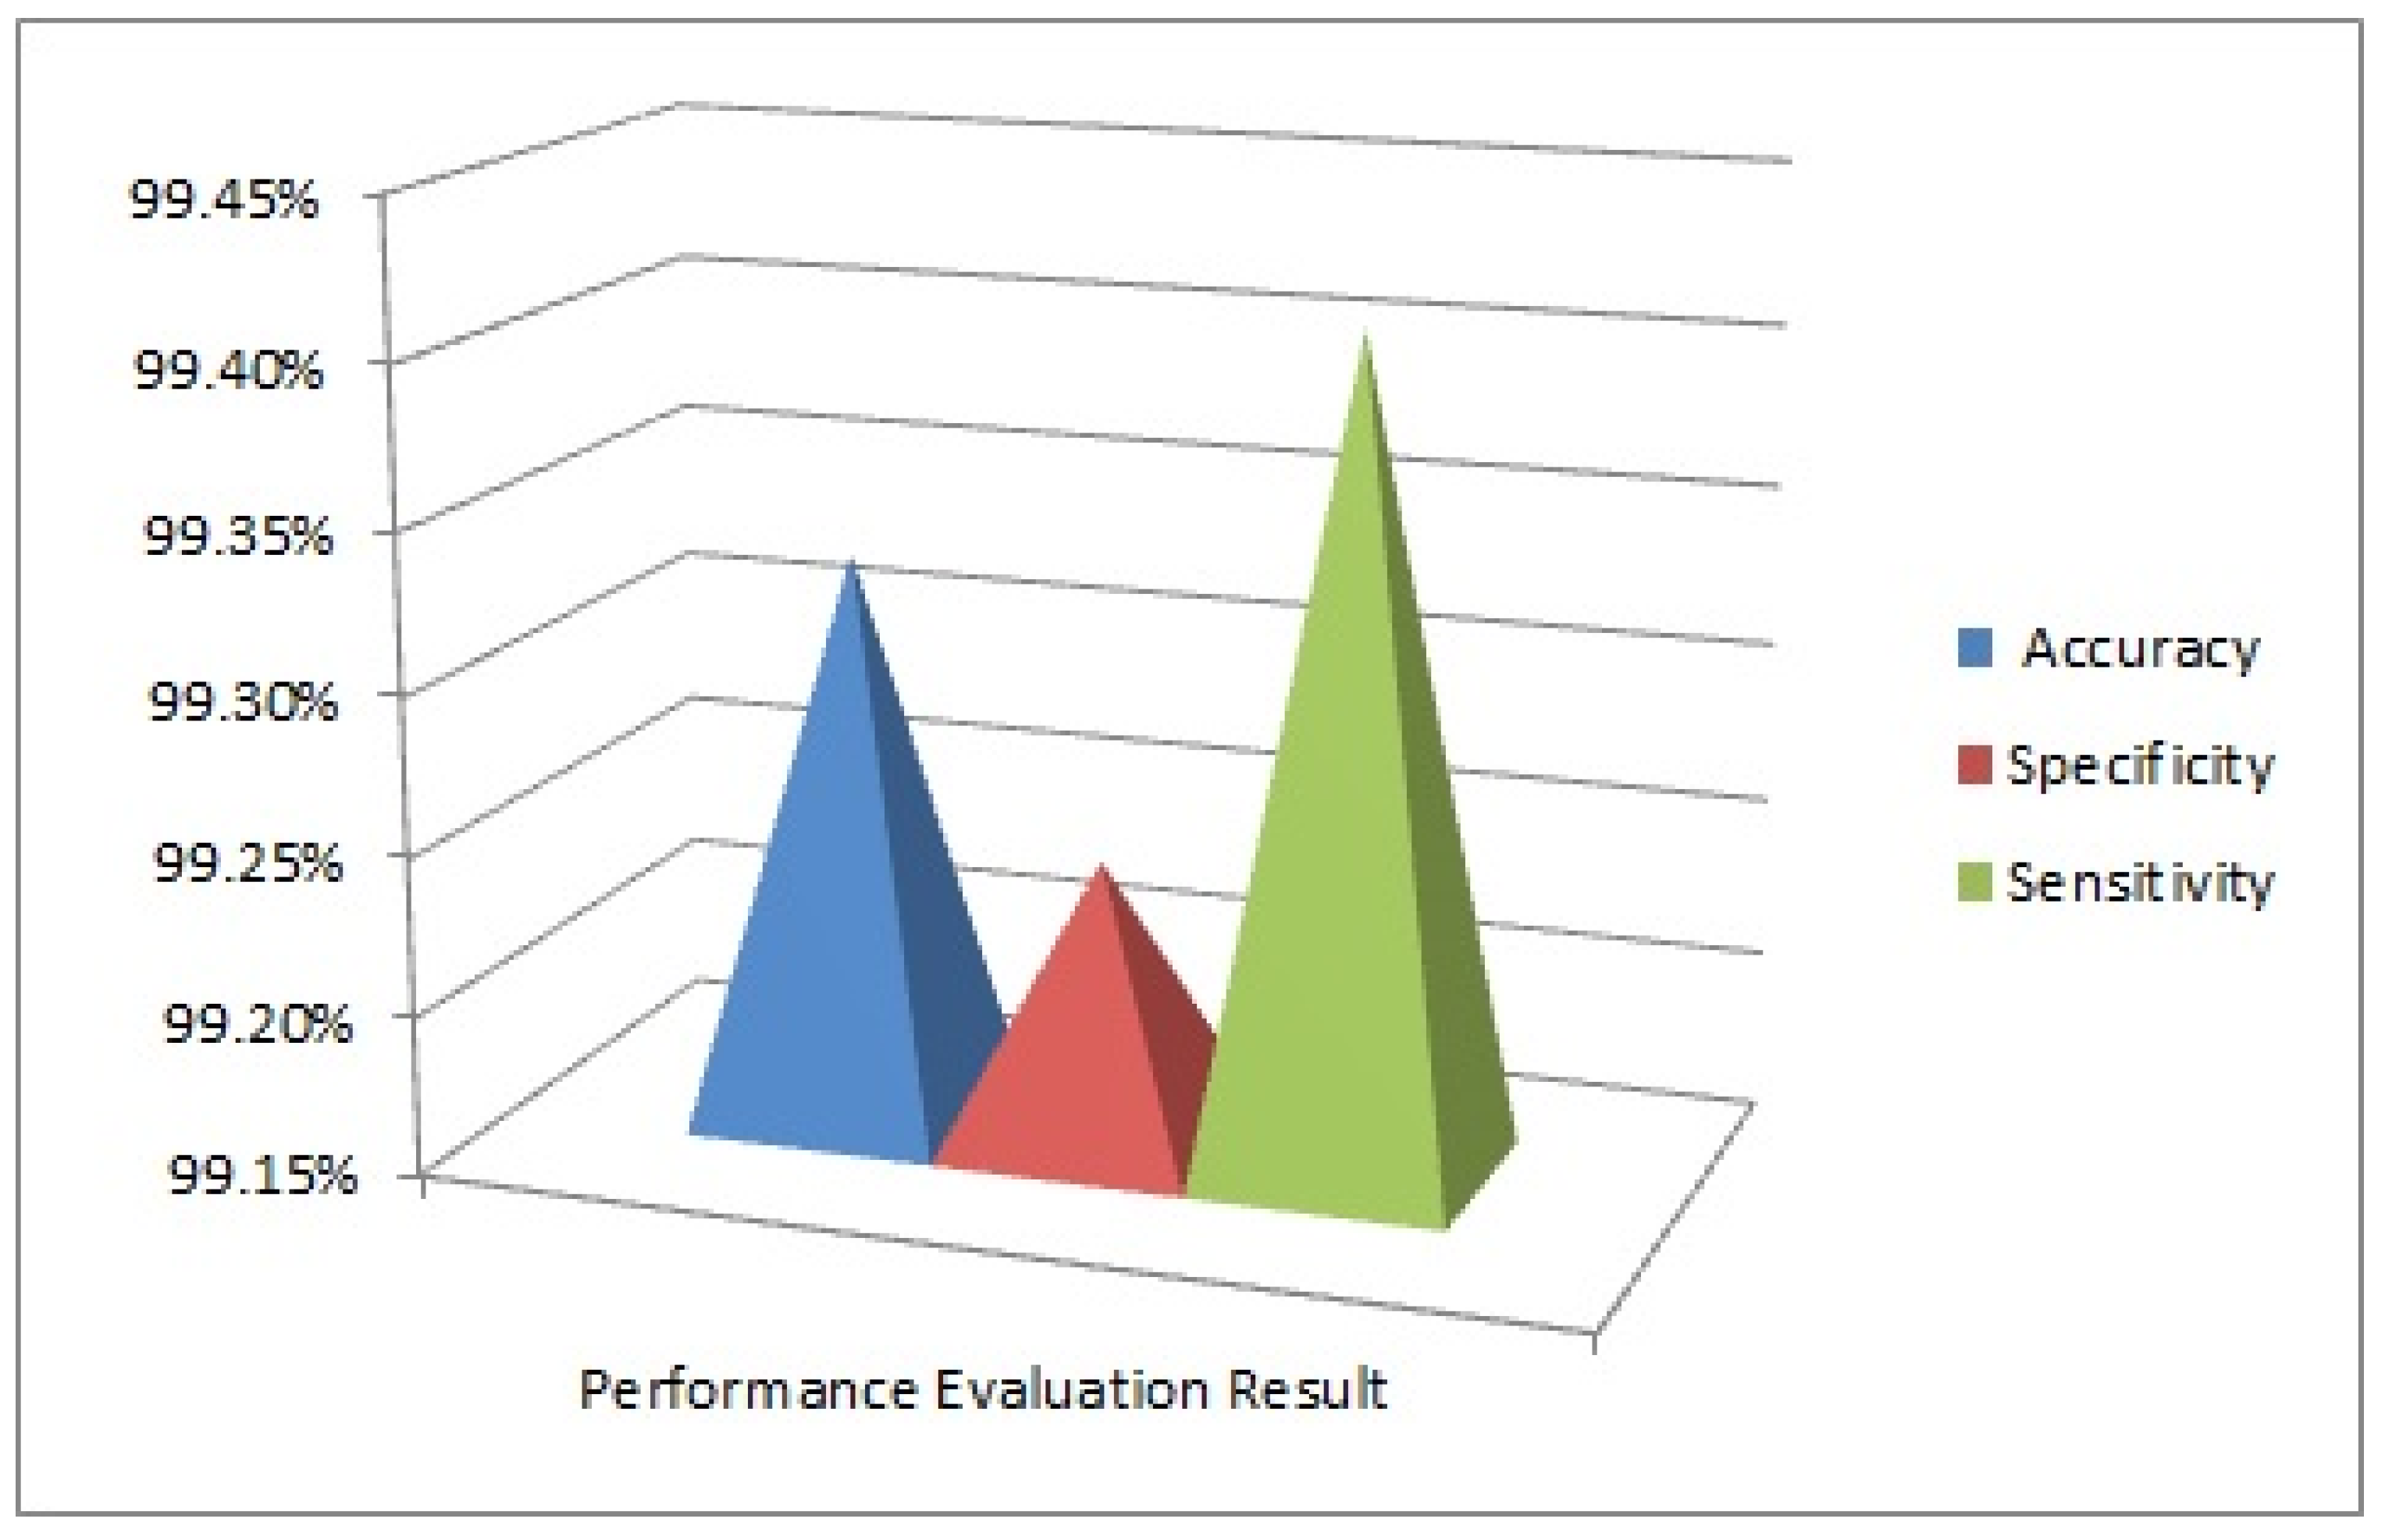
5. Performance Evaluation of Fuzzy Neural Network Expert System with an Improved Gini Index Random Forest-Based Feature Importance Measure Algorithm
- iv.
- Accuracy: It is used to determine the efficiency of the system in terms of the percentage of suspected breast cancer patients that were able to predict correctly against the total number of available instances and it is defined using the formula:
- v.
- Sensitivity: It is used to determine the efficiency of the system in terms of the percentage of mild and severe cases of breast cancer patients that is able to predict correctly against the total number of positive cases of the instances and it is defined using the formula:
- vi.
- Specificity: It is used to determine the efficiency of the system in terms of the percentage of healthy cases of breast cancer patients that is able to predict correctly against the total number of negative cases of the instances and it is defined using the formula:
6. Statistical Testing
7. Conclusions
Limitation and Future Direction
Author Contributions
Funding
Institutional Review Board Statement
Informed Consent Statement
Data Availability Statement
Acknowledgments
Conflicts of Interest
References
- Song, H. Detectability of Breast Tumors in Excised Breast Tissues of Total Mastectomy by IR-UWB-Radar-Based Breast Cancer Detector. IEEE Trans. Biomed. Eng. 2019, 66, 2296–2305. [Google Scholar] [CrossRef] [PubMed]
- Alharthi, H. Healthcare predictive analytics: An overview with a focus on Saudi Arabia. J. Infect. Public Health 2018, 11, 749–756. [Google Scholar] [CrossRef] [PubMed]
- Oyelade, O.N.; Obiniyi, A.A.; Junaidu, S.B.; Adewuyi, S.A. ST-ONCODIAG: A semantic rule-base approach to diagnosing breast cancer base on Wisconsin datasets. Inform. Med. Unlocked 2018, 10, 117–125. [Google Scholar] [CrossRef]
- Reis, S. Automated Classification of Breast Cancer Stroma Maturity From Histological Images. IEEE Trans. Biomed. Eng. 2017, 64, 2344–2352. [Google Scholar] [CrossRef] [PubMed]
- Idris, N.F.; Ismail, M.A. Breast cancer disease classification using fuzzy-ID3 algorithm with FUZZYDBD method: Automatic fuzzy database definition. PeerJ Comput. Sci. 2021, 7, e427. [Google Scholar] [CrossRef] [PubMed]
- Aibe, N. Results of a nationwide survey on Japanese clinical practice in breast-conserving radiotherapy for breast cancer. J. Radiat. Res. 2019, 60, 142–149. [Google Scholar] [CrossRef]
- Sitaula, C.; Aryal, S. Fusion of whole and part features for the classification of histopathological image of breast tissue. Health Inf. Sci. Syst. 2020, 8, 38. [Google Scholar] [CrossRef]
- Alanazi, M.; Parine, N.R.; Shaik, J.P.; al Naeem, A.; Aldhaian, S. Targeted sequencing of crucial cancer causing genes of breast cancer in Saudi patients. Saudi J. Biol. Sci. 2020, 27, 2651–2659. [Google Scholar] [CrossRef]
- Assiri, A.S.; Nazir, S.; Velastin, S.A. Breast Tumor Classification Using an Ensemble Machine Learning Method. J. Imaging 2020, 6, 39. [Google Scholar] [CrossRef]
- L-Abad, A.M.A. A Semantic Social Network Service for Educating Saudi Breast Cancer Patients. In Proceedings of the 2009 Ninth IEEE International Conference on Advanced Learning Technologies, Riga, Latvia, 15–17 July 2009; pp. 81–82. [Google Scholar] [CrossRef]
- Fu, B.; Liu, P.; Lin, J.; Deng, L.; Hu, K.; Zheng, H. Predicting Invasive Disease-Free Survival for Early Stage Breast Cancer Patients Using Follow-Up Clinical Data. IEEE Trans. Biomed. Eng. 2019, 66, 2053–2064. [Google Scholar] [CrossRef]
- Alickovic, E.; Subasi, A. Normalized Neural Networks for Breast Cancer Classification. In CMBEBIH 2019; Badnjevic, A., Škrbić, R., Gurbeta, P.L., Eds.; IFMBE Proceedings Springer: Cham, Switzerland, 2020. [Google Scholar] [CrossRef]
- Rawan, S.; Manal, A. Real time data analysis and visualization for the breast cancer disease. Period. Eng. Nat. Sci. 2019, 7, 395–407. [Google Scholar]
- Feng, X. Accurate Prediction of Neoadjuvant Chemotherapy Pathological Complete Remission (pCR) for the Four Sub-Types of Breast Cancer. IEEE Access 2019, 7, 134697–134706. [Google Scholar] [CrossRef]
- Alshammari, F.D. Breast cancer genetic susceptibility: With focus in Saudi Arabia. J. Oncol. Sci. 2019, 5, 6–12. [Google Scholar] [CrossRef]
- Almutlaq, B.; Almuazzi, R.F.; Almuhayfir, A.A. Breast cancer in Saudi Arabia and its possible risk factors. J. Cancer Policy 2017, 12, 83–89. [Google Scholar] [CrossRef]
- Alsharif, F.H.; Mazanec, S.R. The use of complementary and alternative medicine among women with breast cancer in Saudi Arabia. Appl. Nurs. Res. 2019, 48, 75–80. [Google Scholar] [CrossRef]
- Al-Gaithy, Z.K.; Yaghmoor, B.E.; Koumu, M.I. Trends of mastectomy and breast-conserving surgery and related factors in female breast cancer patients treated at King Abdulaziz University Hospital, Jeddah, Saudi Arabia, 2009–2017: A retrospective cohort study. Ann. Med. 2019, 41, 47–52. [Google Scholar] [CrossRef]
- Muhammad, L.J.; Garba, E.J.; Oye, N.D.; Wajiga, G.M.; Garko, A.B. Fuzzy rule-driven data mining framework for knowledge acquisition for expert system. In Translational Bioinformatics in Healthcare and Medicine; Elsevier: Amsterdam, The Netherlands; Academic Press: New Delhi, India, 2021; pp. 201–214. [Google Scholar]
- Muhammad, L.J.; Jibrin, M.B.; Yahaya, B.Z.; Jibrin, I.A.M.B.; Ahmad, A.; Amshi, J.M. An Improved C4.5 Algorithm using Principle of Equivalent of Infinitesimal and Arithmetic Mean Best Selection Attribute for Large Dataset. In Proceedings of the 2020 10th International Conference on Computer and Knowledge Engineering (ICCKE), Mashhad, Iran, 29–30 October 2020; pp. 006–010. [Google Scholar]
- Pertiwi, D.A.; Daniawan, B.; Gunawan, Y. Analysis And Design of Decision Support System in Major Assignment at Buddhi High School Using AHP and SAW Methods. Tech-E 2019, 3, 13–21. [Google Scholar] [CrossRef]
- Muhammad, L.J.; Ahmad, A.H.; Ibrahim, A.M.; Mansir, A.; Bature, B.; Jamila, M.A. Performance Evaluation of Classification Data Mining Algorithms On Coronary Artery Disease Dataset. In Proceedings of the IEEE 9th International Conference on Computer and Knowledge Engineering (ICCKE 2019), Ferdowsi University of, Mashhad, Mashhad, Iraq, 24–25 October 2019. [Google Scholar]
- Muhammad, L.J.; Garba, A.; Abba, G. Security Challenges for Building Knowledge Based Economy in Nigeria. Int. J. Secur. Its Appl. 2015, 9, 13–21. [Google Scholar] [CrossRef]
- Tchiera, F.; Alharbia, A. Fuzzy Relational Model and Genetic Algorithms for Early Detection and Diagnosis of Breast Cancer in Saudi Arabia. Filomat 2016, 30, 547–556. [Google Scholar] [CrossRef]
- Ishaq, F.S.; Muhammad, L.J.; Yahaya, Y.Z. Fuzzy-Based Expert System for Diagnosis of Diabetes Mellitus. Int. J. Adv. Sci. Technol. 2020, 136, 39–50. [Google Scholar] [CrossRef]
- Huang, G.B.; Zhu, Q.Y.; Siew, C.K. Extreme learning machine: Theory and applications. Neurocomputing 2006, 70, 489–501. [Google Scholar] [CrossRef]
- Han, H.; Guo, X.; Yu, H. Variable selection using Mean Decrease Accuracy and Mean Decrease Gini based on Random Forest. In Proceedings of the 2016 7th IEEE International Conference on Software Engineering and Service Science (ICSESS), Beijing, China, 26–28 August 2016; pp. 219–224. [Google Scholar] [CrossRef]
- Haruna, A.A.; Jung, L.T.; Arputharaj, V.; Muhammad, L.J. Incentive-Scheduling Algorithms to Provide Green Computational Data Center. SN Comput. Sci. 2021, 2, 252. [Google Scholar] [CrossRef]
- Muhammad, L.J.; Algehyne, E.A. Fuzzy based expert system for diagnosis of coronary artery disease in Nigeria. Health Technol. 2021, 11, 319–329. [Google Scholar] [CrossRef]
- Das, S.; Ghosh, P.K.; Kar, S. Hypertension diagnosis: A comparative study using fuzzy expert system and neuro fuzzy system. In Proceedings of the IEEE International Conference on Fuzzy Systems (FUZZ-IEEE), Hyderabad, India, 7–10 July 2013. [Google Scholar] [CrossRef]
- Kour, H.; Manhas, R.; Sharma, V. Usage and implementation of neuro-fuzzy systems for classification and prediction in the diagnosis of different types of medical disorders: A decade review. Artif. Intell. Rev. 2020, 53, 4651–4706. [Google Scholar] [CrossRef]
- González-Pérez, B.; Núñez, C.; Sánchez, J.L.; Valverde, G.; Velasco, J.M. Expert System to Model and Forecast Time Series of Epidemiological Counts with Applications to COVID-19. Mathematics 2021, 9, 1485. [Google Scholar] [CrossRef]
- Park, K.; Chen, W.; Chekmareva, M.A.; Foran, D.J.; Desai, J.P. Electromechanical Coupling Factor of Breast Tissue as a Biomarker for Breast Cancer. IEEE Trans. Biomed. Eng. 2018, 65, 96–103. [Google Scholar] [CrossRef] [PubMed]
- Hussain, S.; Muhammad, L.J.; Ishaq, F.S.; Yakubu, A.; Mohammed, I.A. Performance Evaluation of Various Data Mining Algorithms on Road Traffic Accident Dataset. In Information and Communication Technology for Intelligent Systems. Smart Innovation, Systems and Technologies; Satapathy, S., Joshi, A., Eds.; Springer Nature: Singapore, 2019. [Google Scholar]
- Ubeyli, E.D. Adaptive neuro-fuzzy inference systems for automatic detection of breast cancer. J. Med. Syst. 2009, 33, 353–358. [Google Scholar] [CrossRef]
- Sakri, S.B.; Rashid, N.B.A.; Zain, Z.M. Particle Swarm Optimization Feature Selection for Breast Cancer Recurrence Prediction. IEEE Access 2018, 6, 29637–29647. [Google Scholar] [CrossRef]
- Ahmad, A. Evaluation of Modified Categorical Data Fuzzy Clustering Algorithm on the Wisconsin Breast Cancer Dataset. Scientifica 2016, 2016, 4273813. [Google Scholar] [CrossRef] [Green Version]
- Marcano-Cedeño, A.; Marin-de-la-Barcena, A.; Jimenez-Trillo, J.; Piñuela, J.A.; Andina, D. Artificial metaplasticity neural network applied to credit scoring. Int. J. Neural. Syst. 2011, 21, 311–317. [Google Scholar] [CrossRef] [PubMed]
- Aličković, E.; Subasi, A. Breast cancer diagnosis using GA feature selection and Rotation Forest. Neural Comput. Appl. 2017, 28, 753–763. [Google Scholar] [CrossRef]
- Nembrini, S.; König, I.R.; Wright, M.N. The revival of the Gini importance? Bioinformatics 2018, 34, 3711–3718. [Google Scholar] [CrossRef] [PubMed] [Green Version]
- Haruna, A.A.; Muhammad, L.J.; Yahaya, B.Z. An Improved C4.5 Data Mining Driven Algorithm for the Diagnosis of Coronary Artery Disease. In Proceedings of the International Conference on Digitization (ICD), Sharjah, United Arab Emirates, 18–19 November 2019; pp. 48–52. [Google Scholar]
- Menze, B.H.; Kelm, B.M.; Masuch, R. A comparison of random forest and its Gini importance with standard chemometric methods for the feature selection and classification of spectral data. BMC Bioinform. 2009, 10, 213. [Google Scholar] [CrossRef] [PubMed] [Green Version]
- Muhammad, L.J. Deep Learning Models for Predicting COVID-19 Using Chest X-Ray Images. In Trends and Advancements of Image Processing and Its Applications; Johri, P., Diván, M.J., Khanam, R., Marciszack, M., Will, A., Eds.; EAI/Springer Innovations in Communication and Computing; Springer: Cham, Switzerland, 2022. [Google Scholar] [CrossRef]
- Muhammad, L.J.; Algehyne, E.A.; Usman, S.S. Predictive Supervised Machine Learning Models for Diabetes Mellitus. SN Comput. Sci. 2020, 1, 240. [Google Scholar] [CrossRef] [PubMed]
- Kaur, G.; Kaushik, A.; Sharma, S. Cooking Is Creating Emotion: A Study on Hinglish Sentiments of Youtube Cookery Channels Using Semi-Supervised Approach. Big Data Cogn. Comput. 2019, 3, 37. [Google Scholar] [CrossRef] [Green Version]
- Shah, S.R.; Kaushik, A.; Sharma, S.; Shah, J. Opinion-Mining on Marglish and Devanagari Comments of YouTube Cookery Channels Using Parametric and Non-Parametric Learning Models. Big Data Cogn. Comput. 2020, 4, 3. [Google Scholar] [CrossRef] [Green Version]
- Sarumi, O.A.; Aouedi, O. Potential of Deep Learning Algorithms in Mitigating the Spread of COVID-19. In Understanding COVID-19: The Role of Computational Intelligence; Nayak, J., Naik, B., Abraham, A., Eds.; Springer: Manhattan, NY, USA, 2021. [Google Scholar]
- Govinda, K.; Singla, K.; Jain, K. Fuzzy based uncertainty modeling of Cancer Diagnosis System. In Proceedings of the 2017 International Conference on Intelligent Sustainable Systems (ICISS), Palladam, Palladam, India, 7–8 December 2017; pp. 740–743. [Google Scholar] [CrossRef]
- Meesad, P.; Yes, G.G. A hybrid intelligent system for medical diagnosis. In Proceedings of the International Joint Conference on Neural Networks, Proceedings (Cat. No.01CH37222), Washington, DC, USA, 15–19 July 2001; pp. 2558–2563. [Google Scholar] [CrossRef]
- Salah, B.; Alshraideh, M.; Beidas, R.; Hayajneh, F. Skin cancer recognition by using a neuro-fuzzy system. Cancer Inform. 2011, 10, CIN-S5950. [Google Scholar] [CrossRef] [Green Version]
- Sizilio, G.R.; Leite, C.R.; Guerreiro, A.M. Fuzzy method for prediagnosis of breast cancer from the Fine Needle Aspirate analysis. BioMed. Eng. OnLine 2012, 11, 83. [Google Scholar] [CrossRef] [Green Version]
- Nadia, G.; Bilal, R.; Ebrahem, A.A. The dynamics of fractional order Hepatitis B virus model with asymptomatic carriers. Alex. Eng. J. 2021, 60, 3945–3955. [Google Scholar]
- Aldrich, C. Process Variable Importance Analysis by Use of Random Forests in a Shapley Regression Framework. Minerals 2020, 10, 420. [Google Scholar] [CrossRef]
- Ebrahem, A.A.; Din, R. On global dynamics of COVID-19 by using SQIR type model under non-linear saturated incidence rate. Alex. Eng. J. 2021, 60, 393–399. [Google Scholar]
- Kanagarathinam, K.; Algehyne, E.A.; Sekar, K. Analysis of ‘earlyR’epidemic model and time series model for prediction of COVID-19 registered cases. Mater. Today Proc. 2020, 10, 2214–7853. [Google Scholar]
- Park, H.; Kwon, H. Improved Gini-Index Algorithm to Correct Feature-Selection Bias in Text Classification. IEICE Trans. Inf. Syst. 2011, 94, 855–865. [Google Scholar] [CrossRef] [Green Version]
- Strobl, C.; Boulesteix, A.L.; Zeileis, A. Bias in random forest variable importance measures: Illustrations, sources and a solution. BMC Bioinform. 2007, 8, 25. [Google Scholar] [CrossRef] [PubMed] [Green Version]
- Rani, L.N.; Defit, S. Determination of Student Subjects in Higher Education Using Hybrid Data Mining Method with the K-Means Algorithm and FP Growth. Int. J. Artif. Intell. Res. 2021, 5, 91–101. [Google Scholar] [CrossRef]
- Shang, W.; Dong, H.; Zhuo, H. A Novel Feature selection algorithm for text categorization. Expert Syst. Appl. 2007, 33, 1–5. [Google Scholar] [CrossRef]
- Ebrahem, A.A.; Ibrahim, M. Fractal-Fractional Order Mathematical Vaccine Model of COVID-19 under non-singular kernel. Chaos Solitons Fractals 2021, 148, 111–150. [Google Scholar]
- Cassidy, A.P.; Deviney, F.A. Calculating feature importance in data streams with concept drift using Online Random Forest. In Proceedings of the 2014 IEEE International Conference on Big Data (Big Data), Washington, DC, USA, 27–30 October 2014; pp. 23–28. [Google Scholar] [CrossRef]
- Uddin, M.T.; Uddiny, M.A. A guided random forest based feature selection approach for activity recognition. In Proceedings of the 2015 International Conference on Electrical Engineering and Information Communication Technology (ICEEICT), Dhaka, Bangladesh, 21–23 May 2015; pp. 1–6. [Google Scholar] [CrossRef]
- Chen, R.A.; Dewi, C.; Huang, S.W. Selecting critical features for data classification based on machine learning methods. J. Big Data 2020, 7, 52. [Google Scholar] [CrossRef]
- Sethi, K.; Jaiswal, V.; Ansari, M.D. Machine Learning Based Support System for Students to Select Stream (Subject). Recent Adv. Comput. Sci. Commun. 2020, 13, 336–344. [Google Scholar] [CrossRef]
- Bhargava, N.; Sharma, G.; Bhargava, R.; Mathuria, M. Decision tree analysis on J48 algorithm for data mining. Int. J. Adv. Res. Comput. Sci. Softw. Eng. 2013, 3, 1114–1119. [Google Scholar]
- Alsayed, O.; Rahim, M.S.M.; Bidewi, I.A. Selection of the Right Undergraduate Major by Students Using Supervised Learning Techniques. Appl. Sci. 2021, 11, 10639. [Google Scholar] [CrossRef]
- Hjerpe, A. Computing Random Forests Variable Importance Measures (VIM) on Mixed Continuous and Categorical Data; KTH Royal Institute of Technology School of Computer Science and Communication: Stockholm, Sweden, 2016. [Google Scholar]
- Keles, A.; Yavuz, A.U. Expert system based on neuro-fuzzy rules for diagnosis breast cancer. Expert Syst. Appl. 2011, 38, 5719–5726. [Google Scholar] [CrossRef]
- University of California Irvine Machine Learning Repository. Available online: https://archive.ics.uci.edu/ml/datasets/Breast+Cancer+Wisconsin+(Diagnostic) (accessed on 10 March 2021).
- Dilip, K. Soft Computing: Fundamentals and Applications; NAROSA: New Delhi, India, 2013; pp. 103–121. [Google Scholar]
- Nilashi, M.; Ibrahim, O.; Ahmadi, H.; Shahmoradi, L. A Knowledge-Based System for Breast Cancer Classification Using Fuzzy Logic Method. Telemat. Inform. 2017, 34, 133–144. [Google Scholar] [CrossRef]
- Karabatak, M.M.; Ince, M.C. An expert system for detection of breast cancer based on association rules and neural network. Expert Syst. Appl. 2009, 36, 3465–3469. [Google Scholar] [CrossRef]


| SN | Features | Units | Range |
|---|---|---|---|
| 1 | RadiusMean | mm | 6.981–28.11 |
| 2 | TextureMean | dimensionless | 9.71–39.28 |
| 3 | PerimeterMean | mm | 43.79–188.5 |
| 4 | AreaMean | μm2 | 143.5–2501 |
| 5 | SmoothnessMean | mm | 0.05263–0.1634 |
| 6 | The Diagnosis of Breast Tissues | malignant (0), benign (1) | 0,1 |
| Model | Accuracy (%) | Specificity (%) | Sensitivity (%) |
|---|---|---|---|
| Logistic regression | 66.30 | 74.24 | 36.80 |
| Support vector machine | 75.00 | 85.20 | 56.00 |
| K-nearest neighbor | 66.10 | 75.40 | 67.19 |
| Random forest | 76.20 | 93.40 | 71.16 |
| Gaussian naïve bayes | 70.00 | 78.70 | 87.12 |
| Model | Accuracy (%) | Specificity (%) | Sensitivity (%) |
|---|---|---|---|
| Logistic Regression | 95.60 | 96.90 | 90.11 |
| Support vector machine | 95.60 | 97.45 | 78.51 |
| K-nearest neighbor | 94.74 | 98.00 | 98.11 |
| Random forest | 95.61 | 93.56 | 88.45 |
| Gaussian naïve bayes | 93.86 | 98.34 | 87.18 |
| Model. | Accuracy of Models with Full Features (%) | Accuracy of Models with Selected Fittest Features (%) | Specificity of Models with Full Features (%) | Specificity of Models with Selected Fittest Features (%) | Sensitivity of Models with Full Features (%) | Sensitivity of Models with Selected Fittest Features (%) |
|---|---|---|---|---|---|---|
| Logistic regression | 66.30 | 95.61 | 74.24 | 96.90 | 36.80 | 90.11 |
| Support vector machine | 75.00 | 95.60 | 85.20 | 97.45 | 56.00 | 78.51 |
| K-nearest neighbor | 66.10 | 94.74 | 75.40 | 98.00 | 67.19 | 98.11 |
| Random forest | 76.20 | 95.61 | 93.40 | 93.56 | 71.16 | 88.45 |
| Gaussian naïve bayes | 70.00 | 93.86 | 78.70 | 98.34 | 87.12 | 87.18 |
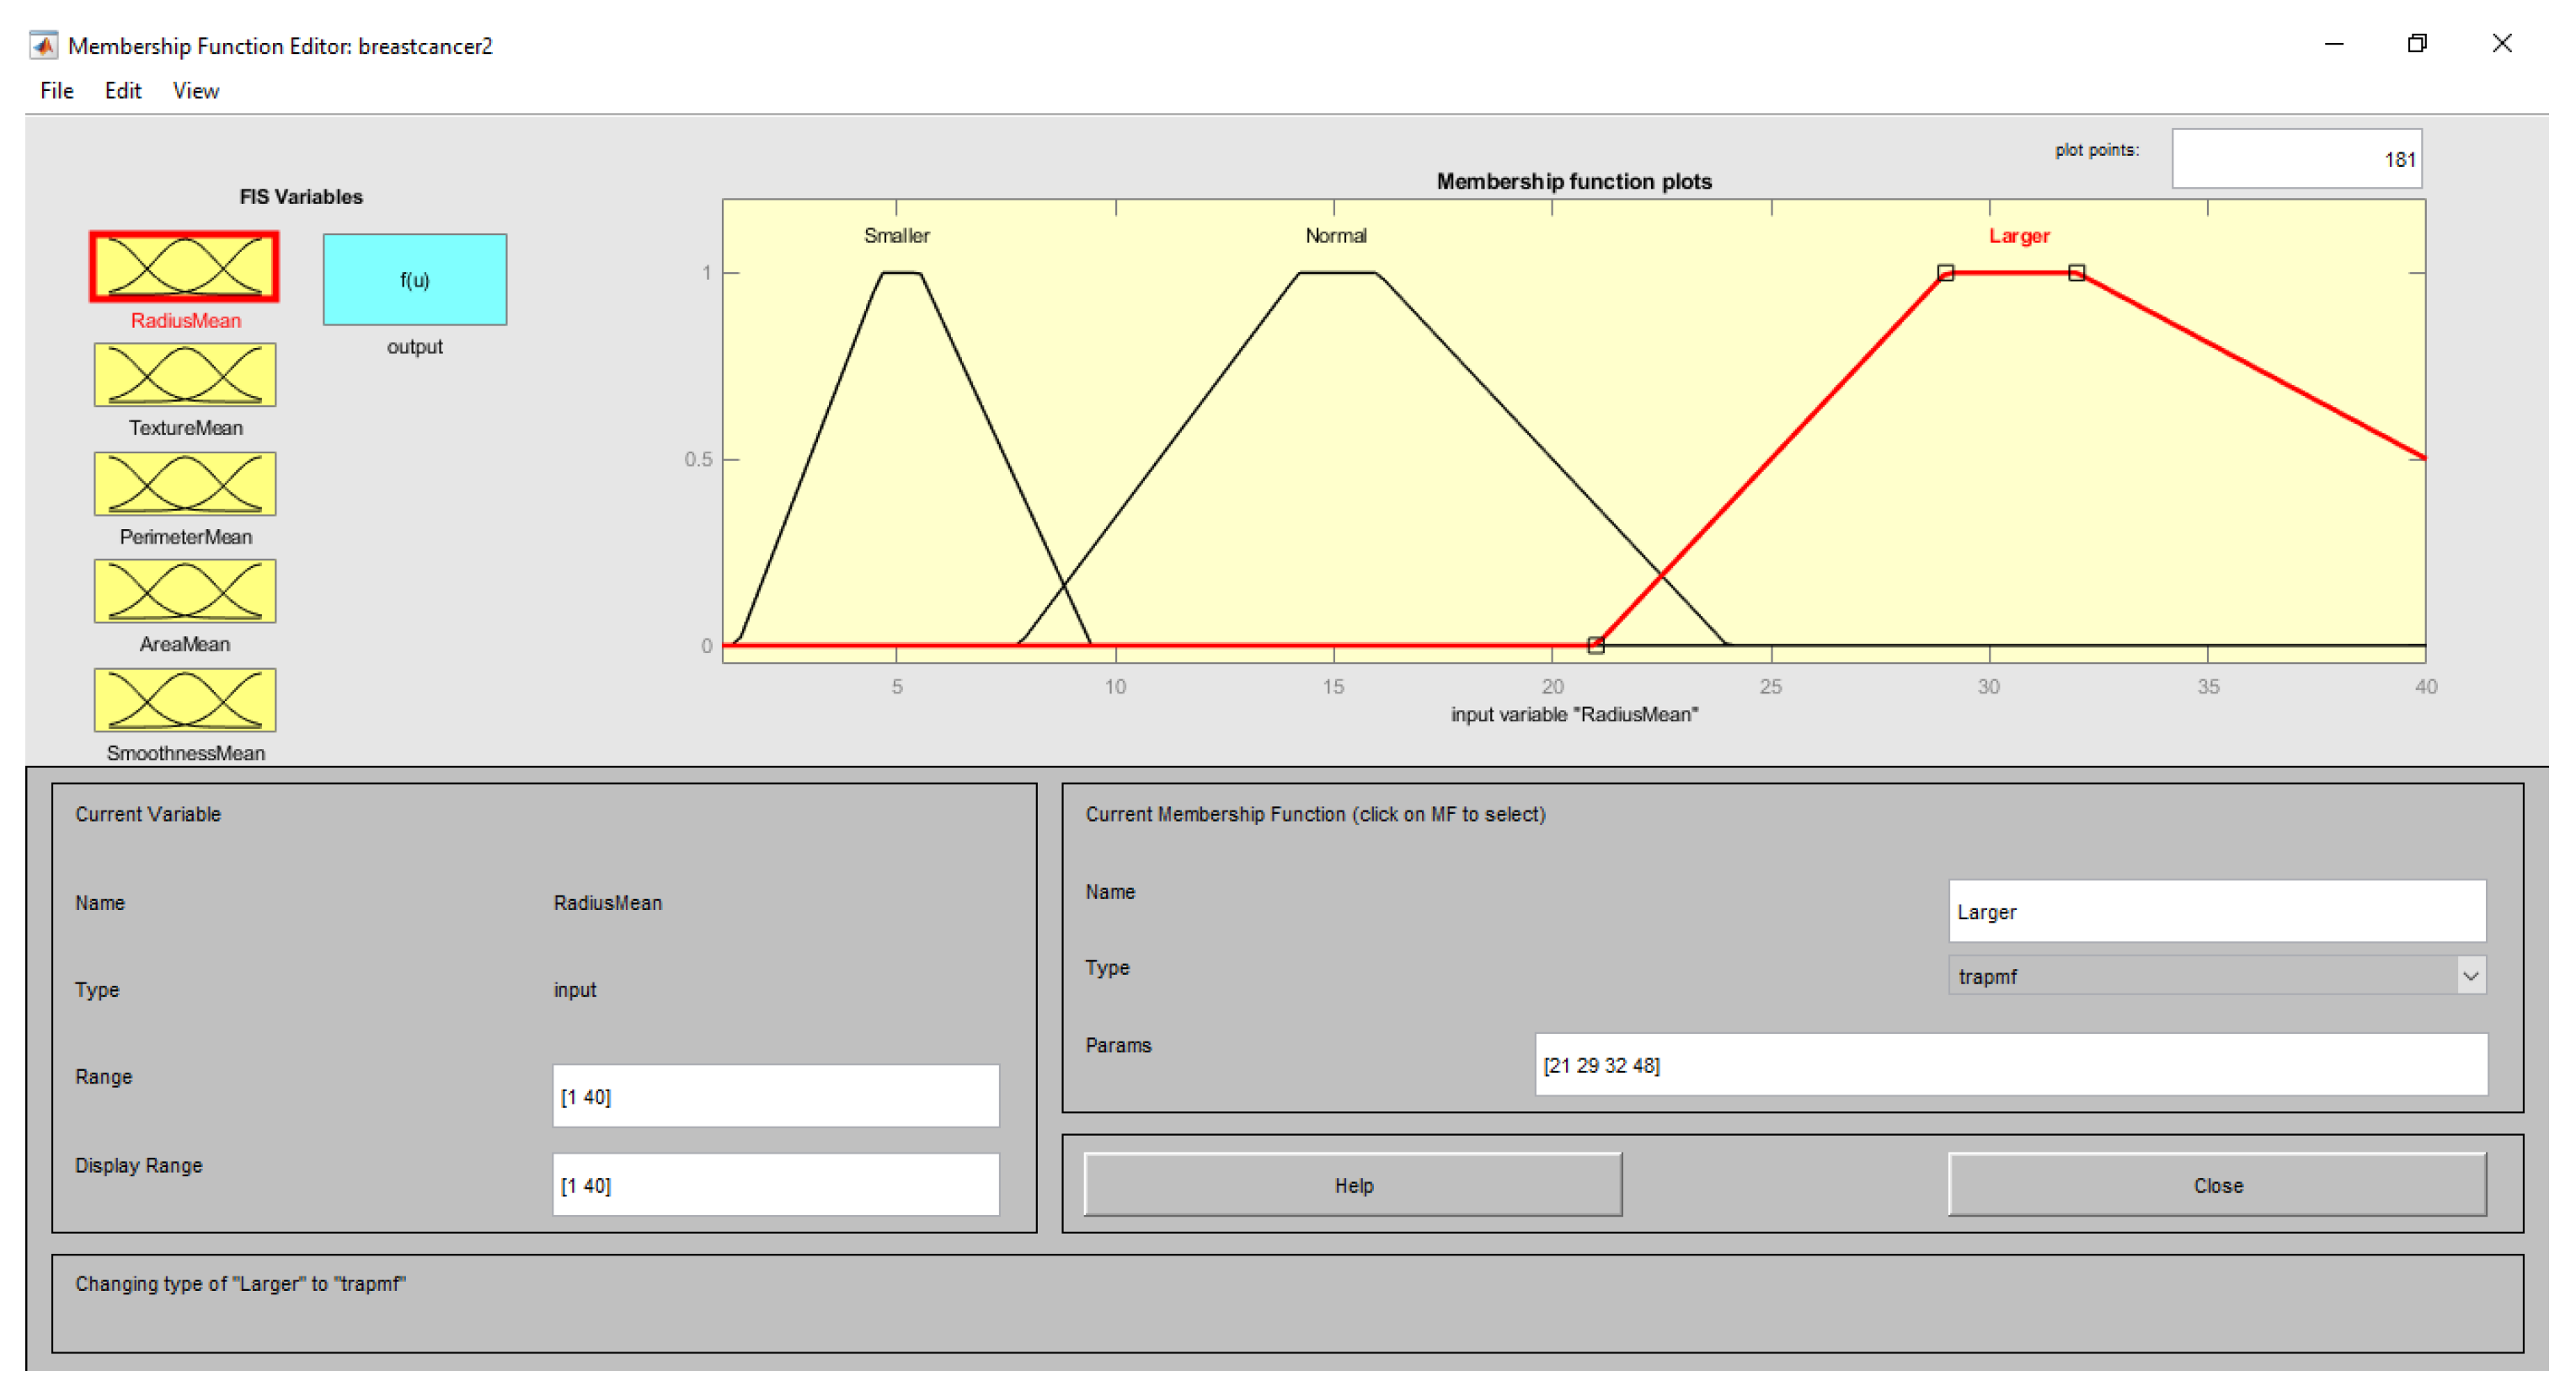
| Input (Features) | Range | Linguistic Term | Membership Function |
|---|---|---|---|
| RadiusMean | <10 | Smaller | Trapezoid |
| 7–28 | Normal | ||
| >21 | Larger | ||
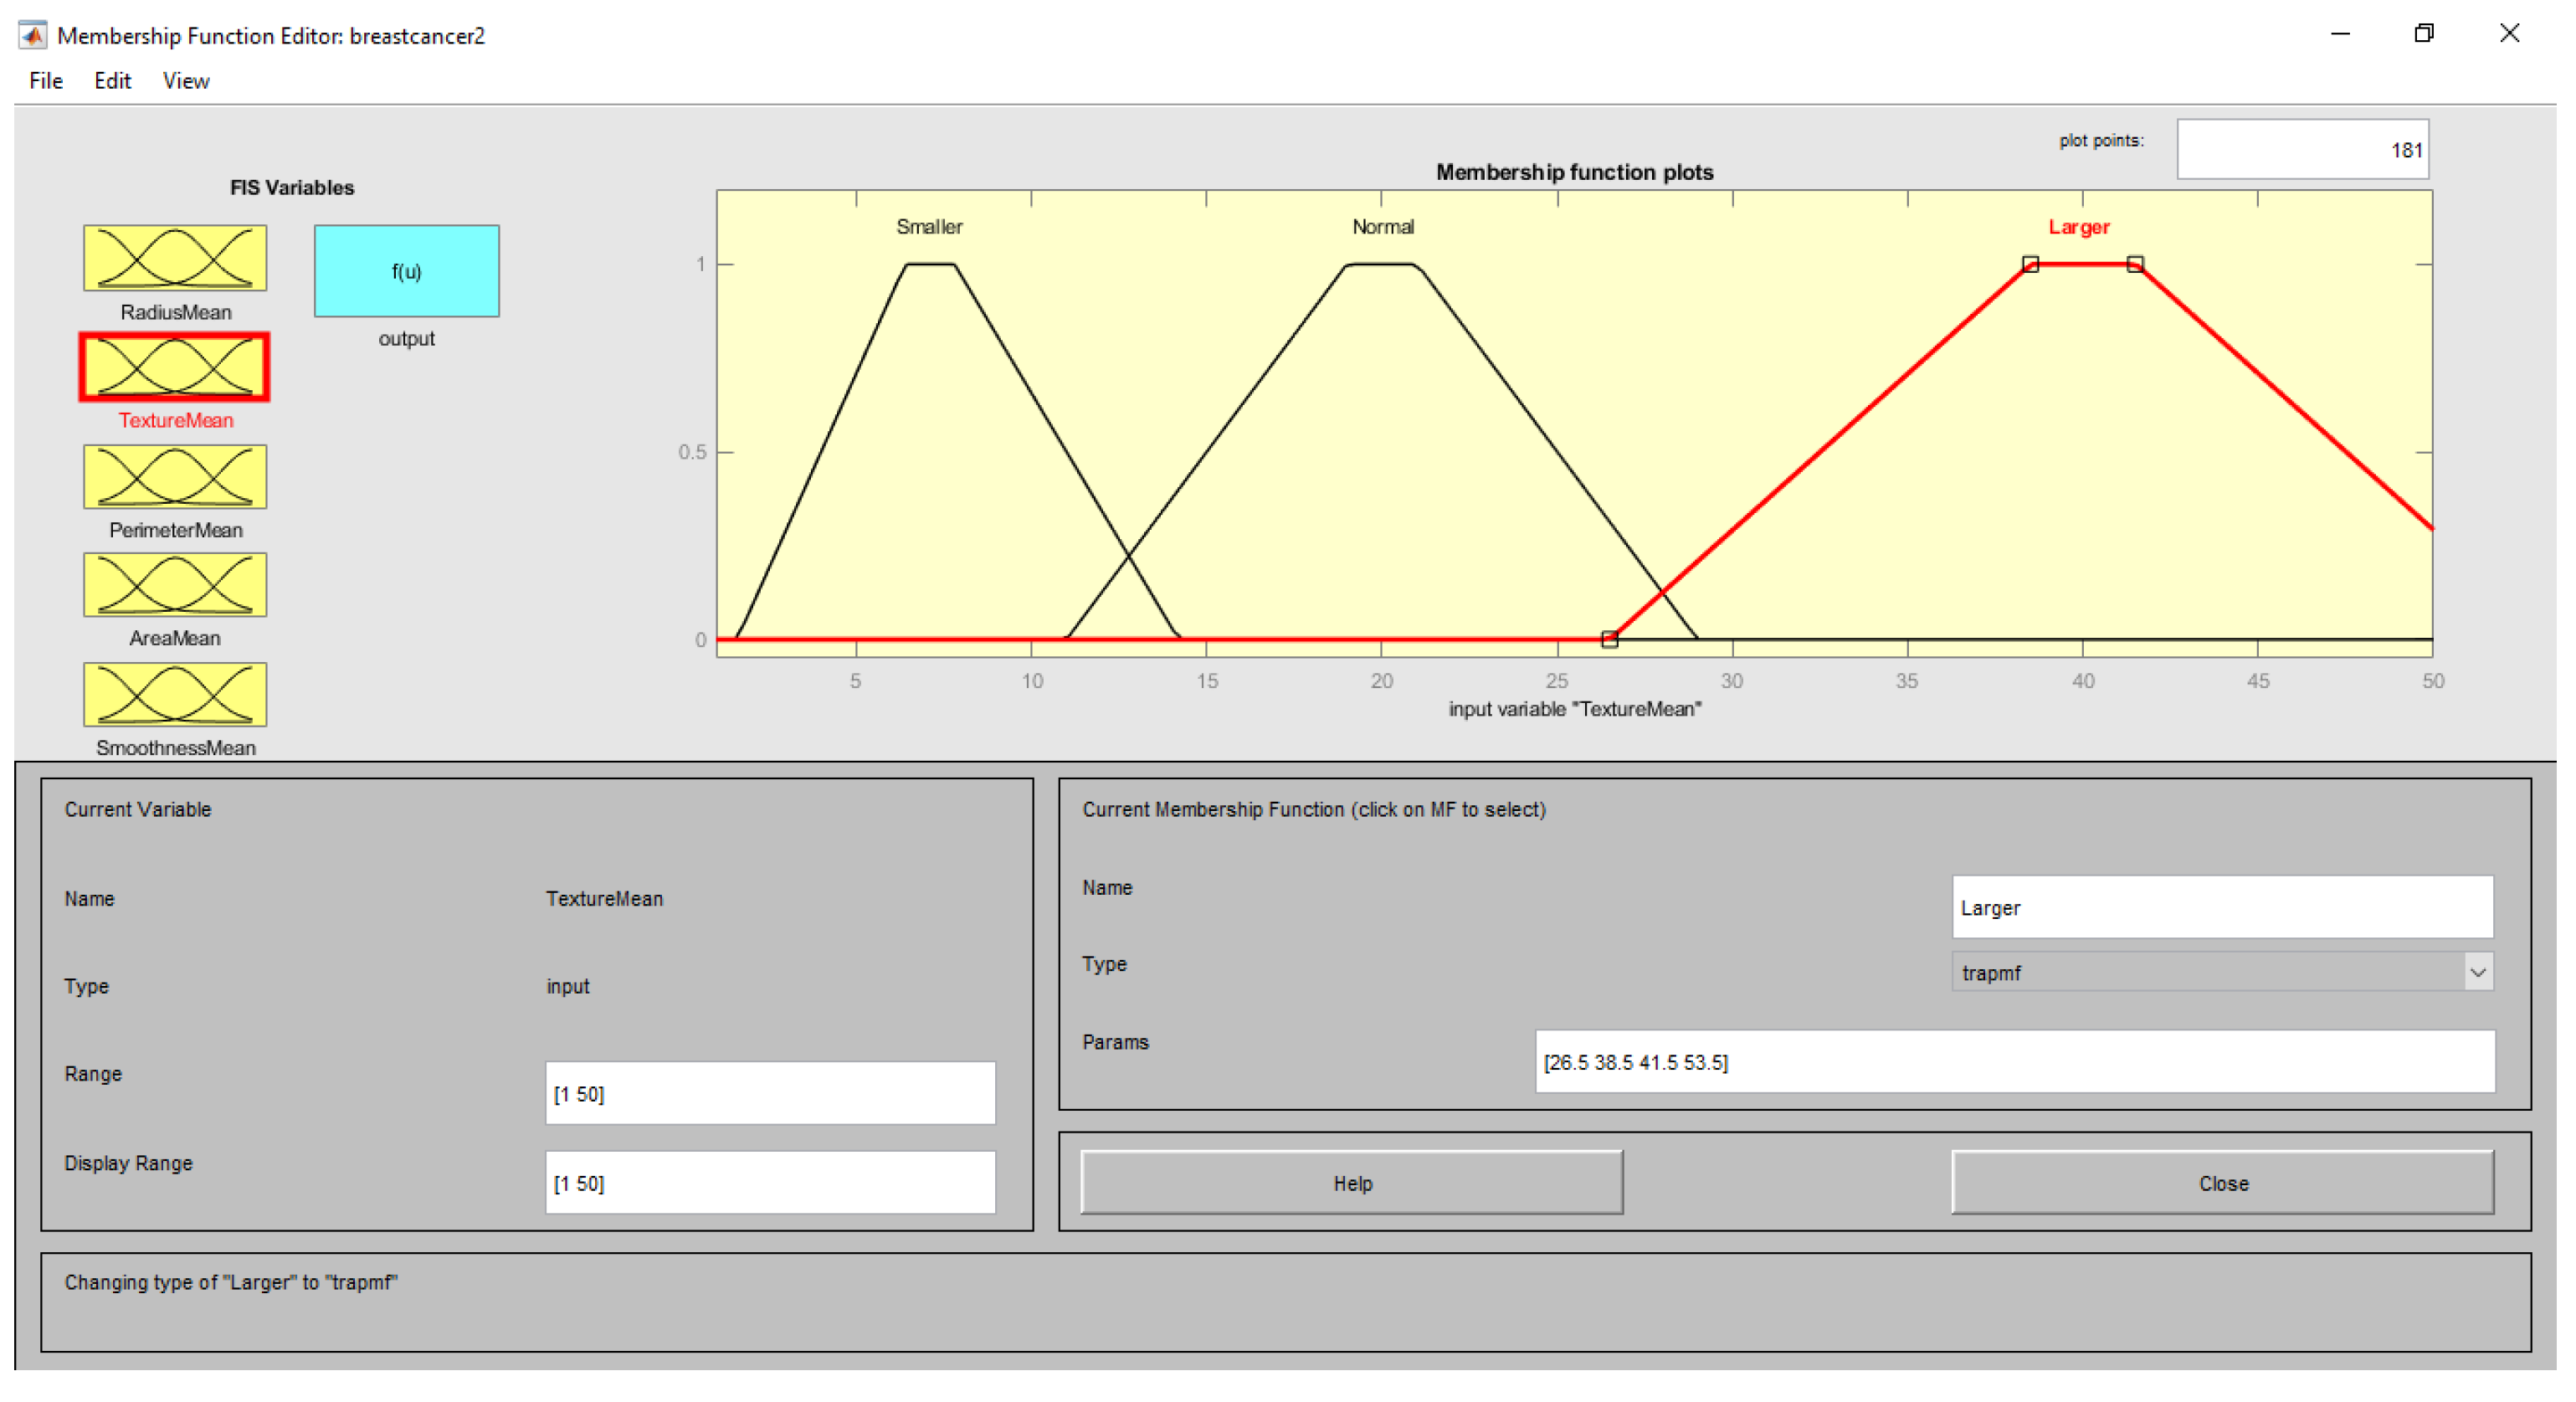
| TextureMean | <15 | Smaller | Trapezoid |
| 10–30 | Normal | ||
| >25 | Larger | ||
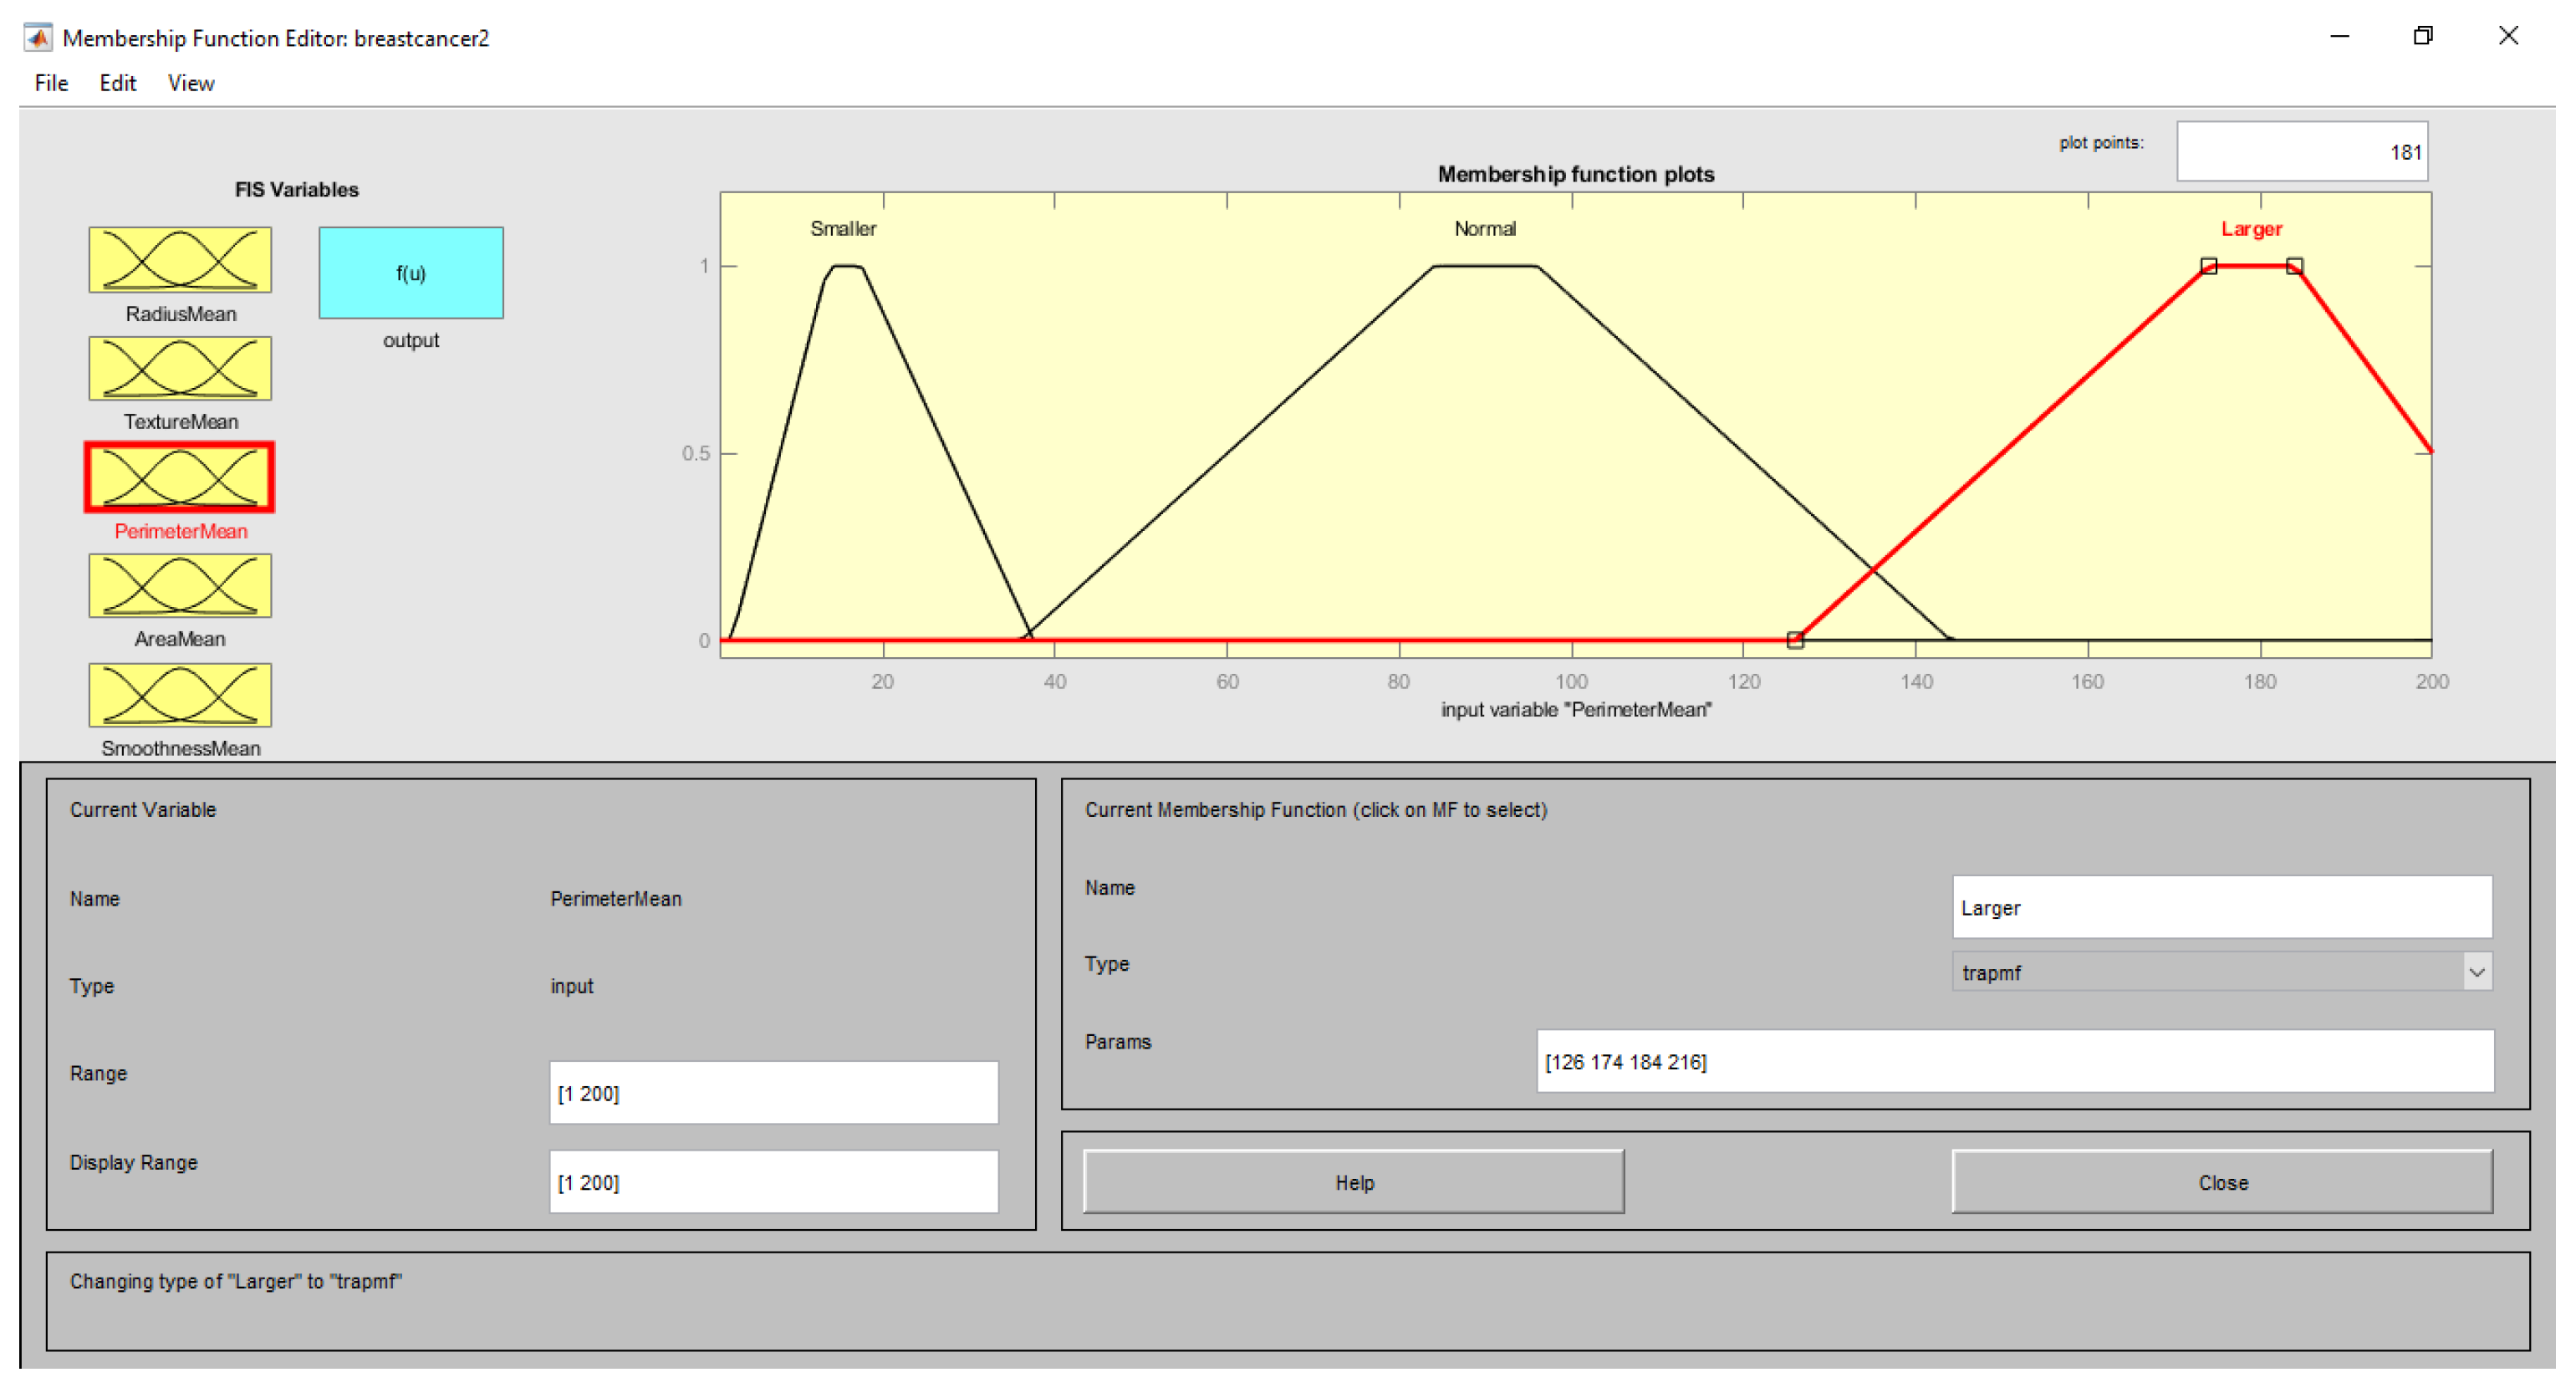
| PerimeterMean | <40 | Smaller | Trapezoid |
| 30–180 | Normal | ||
| >160 | Larger | ||
| AreaMean | <150 | Smaller | Trapezoid |
| 130–2200 | Normal | ||
| >2300 | Larger | ||
| SmoothnessMean | <0.04 | Smaller | Trapezoid |
| 0.06–0.14 | Normal | ||
| >0.12 | Larger | ||
| Diagnosis | <1 | Mild | Triangle |
| 1–2 | Healthy | ||
| >2 | Severe |
| Class | No. of Instances | No. of Corrected Diagnosis | No. of Wrong Diagnosis |
|---|---|---|---|
| Healthy | 131 | 130 | 1 |
| Mild | 80 | 80 | 0 |
| Severe | 89 | 88 | 1 |
| Grand Total | 300 | 298 | 2 |
| Accuracy (%) | Specificity (%) | Sensitivity (%) |
|---|---|---|
| 99.33 | 99.24 | 99.41 |
| Reference | Technique | Accuracy (%) | Sensitivity (%) | Specificity (%) |
|---|---|---|---|---|
| Proposed Method | Fuzzy neural network expert system with an improved gini index random forest-based feature importance measure algorithm | 99.33 | 99.41 | 99.24 |
| Ref. [36] | Automatic fuzzy database definition | 94.53% | NA | NA |
| Ref. [3] | A semantic rule-based approach | NA | 89.00 | 81.00 |
| Ref. [51] | fuzzy method for pre-diagnosis of breast cancer from the fine needle aspirate analysis | NA | 85.43 | 98.59 |
| Ref. [39] | Breast cancer diagnosis using GA feature selection and Rotation Forest | 96.00 | 94.67 | 97.69 |
| Ref. [12] | Normalized neural networks for breast cancer classification | 99.27 | NA | NA |
| Ref. [38] | artificial metaplasticity neural network | 99.26 | NA | NA |
| Ref. [72] | An expert system for detection of breast cancer based on association rules and neural network (for four inputs) | 95.60 | NA | NA |
| Ref. [72] | An expert system for detection of breast cancer based on association rules and neural network (for eight inputs) | 97.40 | NA | NA |
| Ref. [36] | Particle swarm optimization feature selection for breast cancer recurrence prediction (naïve bayes) | 81.30 | 63.20 | 86.90 |
| Ref. [36] | Particle swarm optimization feature selection for breast cancer recurrence prediction (Reftree) | 80.00 | 36.80 | 93.89 |
| Ref. [36] | particle swarm optimization feature selection for breast cancer recurrence prediction (K-nearest neighbors (IBK)) | 75.00 | 42.10 | 85.29 |
Publisher’s Note: MDPI stays neutral with regard to jurisdictional claims in published maps and institutional affiliations. |
© 2022 by the authors. Licensee MDPI, Basel, Switzerland. This article is an open access article distributed under the terms and conditions of the Creative Commons Attribution (CC BY) license (https://creativecommons.org/licenses/by/4.0/).
Share and Cite
Algehyne, E.A.; Jibril, M.L.; Algehainy, N.A.; Alamri, O.A.; Alzahrani, A.K. Fuzzy Neural Network Expert System with an Improved Gini Index Random Forest-Based Feature Importance Measure Algorithm for Early Diagnosis of Breast Cancer in Saudi Arabia. Big Data Cogn. Comput. 2022, 6, 13. https://doi.org/10.3390/bdcc6010013
Algehyne EA, Jibril ML, Algehainy NA, Alamri OA, Alzahrani AK. Fuzzy Neural Network Expert System with an Improved Gini Index Random Forest-Based Feature Importance Measure Algorithm for Early Diagnosis of Breast Cancer in Saudi Arabia. Big Data and Cognitive Computing. 2022; 6(1):13. https://doi.org/10.3390/bdcc6010013
Chicago/Turabian StyleAlgehyne, Ebrahem A., Muhammad Lawan Jibril, Naseh A. Algehainy, Osama Abdulaziz Alamri, and Abdullah K. Alzahrani. 2022. "Fuzzy Neural Network Expert System with an Improved Gini Index Random Forest-Based Feature Importance Measure Algorithm for Early Diagnosis of Breast Cancer in Saudi Arabia" Big Data and Cognitive Computing 6, no. 1: 13. https://doi.org/10.3390/bdcc6010013