
The Next-Generation NIDS Platform: Cloud-Based Snort NIDS Using Containers and Big Data
by
 , ,
, ,
Ferry Astika Saputra
1 ,
,
Muhammad Salman
1, 
Jauari Akhmad Nur Hasim
2,
Isbat Uzzin Nadhori
2 and
Kalamullah Ramli
1,*
1
Department of Electrical Engineering, Faculty of Engineering, Kampus UI Depok, Universitas Indonesia, Depok 16424, Indonesia
2
Department of Informatics and Computer Engineering, Kampus Sukolilo, Politeknik Elektronika Negeri Surabaya, Surabaya 60111, Indonesia
*
Author to whom correspondence should be addressed.
Big Data Cogn. Comput. 2022, 6(1), 19; https://doi.org/10.3390/bdcc6010019
Submission received: 28 December 2021
/
Revised: 27 January 2022
/
Accepted: 29 January 2022
/
Published: 7 February 2022
(This article belongs to the Special Issue Cyber Security in Big Data Era)
Abstract
:Snort is a well-known, signature-based network intrusion detection system (NIDS). The Snort sensor must be placed within the same physical network, and the defense centers in the typical NIDS architecture offer limited network coverage, especially for remote networks with a restricted bandwidth and network policy. Additionally, the growing number of sensor instances, followed by a quick increase in log data volume, has caused the present system to face big data challenges. This research paper proposes a novel design for a cloud-based Snort NIDS using containers and implementing big data in the defense center to overcome these problems. Our design consists of Docker as the sensor’s platform, Apache Kafka, as the distributed messaging system, and big data technology orchestrated on lambda architecture. We conducted experiments to measure sensor deployment, optimum message delivery from the sensors to the defense center, aggregation speed, and efficiency in the data-processing performance of the defense center. We successfully developed a cloud-based Snort NIDS and found the optimum method for message-delivery from the sensor to the defense center. We also succeeded in developing the dashboard and attack maps to display the attack statistics and visualize the attacks. Our first design is reported to implement the big data architecture, namely, lambda architecture, as the defense center and utilize rapid deployment of Snort NIDS using Docker technology as the network security monitoring platform.

1. Background
Snort is a commonly used, signature-based network intrusion detection system (NIDS) [1]. It is implemented in many network security systems. Typically, users install Snort sensors to detect intrusions in their networks. The sensors send the log data to a dedicated defense center for processing and aggregation. In the typical Snort architecture, the sensors and the defense center must be physically placed in the same local network.
One of the best examples of Snort’s implementation is in the Mata Garuda Project of the Indonesia Security Incident Response Team in the Internet Infrastructure coordination center (ID-SIRTII/CC) [2,3]. We implemented the system on 12 ISP routers that handled the highest volumes of Indonesian Internet traffic in 2014. The intrusion detection, data aggregation sensors, and defense center were in the same networks. Each of the sensors had two interfaces: one for sniffing the packet and the other for sending the intrusion logs to the defense center each minute through a secure file transfer protocol (FTP). At the defense center, the data were aggregated based on various time units and enriched with IP geolocation to build attack maps and other security-related tools for analyses. Figure 1 shows the topology of Mata Garuda implemented at the ID-SIRTII/CC.
In early 2015, when we were implementing our system in a real gigabit network, we found that the system could only efficiently handle 4–5 million pieces of data per query. As the number of data grew exponentially, the data table also grew in size. Join queries in several large tables caused Mata Garuda to run slowly. Another problem was that the topology still only utilizes one Online Transaction Processing (OLTP) database server. The database server’s load was high, and one OLTP database could not handle the join queries, especially when generating reports. Then, we proposed a distributed database design [2]. Each sensor has a database of attack logs and aggregates the data every minute. The defense center triggers the sensor to send their aggregated data and extract the information of alerts and source IP of attackers. Figure 2 shows the overall system that significantly increased the computation time when generating monthly and annual reports (see Table 1).
In early 2019, the rapid change in Internet technology in Indonesia, with cloud computing and big data technology, challenged us to develop a new version of Mata Garuda. The improved version of Mata Garuda had to be compatible with cloud technology and also had to be able to handle big data, which posed a challenge to the existing system due to the increasing number of sensor instances, followed by a rapid increase in the log data volume. Based on our works in [3,4], we successfully processed the Extract Transform Load (ETL) and data enrichment of Snort log files using big data and data mining in the Mata Garuda application. We carried out the data-mining method on geolocation data to determine the attack’s location in our proposed distributed system. We used the SQL-User Defined Table Generating Function (UDTF) feature in Hadoop to perform “join queries” between the source IP address and Geo2IP location table. The algorithm that we applied in the mining process was k-means clustering, which allowed us to cluster GeoIP attacks. The UDTF reduced join table operation computation time from 3561 s to 0.08 s using join queries. Figure 3 shows the architecture of the improved version of Mata Garuda, based on big data technology.
2. Related Works
Recently, however, cloud technology has become more prevalent. In this technology, the servers and networks monitored by the administrator can be anywhere. Thus, the NIDS architecture configured by Mata Garuda cannot be used. The dynamic change in the cloud-based architecture requires ubiquitous sensor placement, lightweight sensor deployment, and the most reliable means of data transport to the defense center. Moreover, cloud technology significantly increases the volume, velocity, and variety of the data that must be processed at the defense center. This means that the defense center needs a big data platform.
The implementation of ubiquitous sensor placement and lightweight sensor deployment was first introduced by [5]. The researchers implemented docker technology to auto-scald Snort IDS sensors placed on Software Defined Network (SDN). The systems consist of 3 components: (1) the Snort IDS sensor runs inside the docker container. It detects and drops abnormal traffic; (2) the application determines the number of agents to be deployed based on the type of abnormal traffic; (3) the container daemon controls the operation of the docker deployment based on the instruction from the application. Therefore, the Docker containers can be automatically scaled out or scaled down on demand. The researchers reported that their design could handle DDoS attacks with 2000 packets/s with only 50% CPU usage. The Docker container’s lightweight characteristics allow for the rapid application of Snort IDS and are also easy to manage.
The proof of concept of implementing big data tools to analyze the network security data was introduced by [6]. The researchers used Apache Spark, a big-data processing tool, and its machine library, namely, MLlib, to analyze extensive network traffic. DARPA KDD’99 was used, a dataset containing approximately 4 GB of network traffic data in the form of tcpdump. This dataset was processed and stored using approximately 5 million network connections at DARPA. Each network connection record had 41 features, and was labeled as either regular traffic or malicious traffic. There were 22 types of attack mentioned, and these attacks were categorized into four groups such as Denial of Service (DoS), Port Scanning attack (Probe), unauthorized access to a remote machine (R2L), and unauthorized access to root superuser privileges (U2R attack). They also analyzed the NSL-KDD dataset. This was a reduced version of the KDD’99 dataset all of the duplicate instances were removed from the KDD’99 dataset.
Other research related to Big Data implementation combined with ML in the NIDS system was reported [7]. They developed a system called BigFlow. It has five main parts: the monitored agents, the messaging middleware, the stream-processing parts, the stream-learning parts, and the analytics. The agent sends the network event to the messaging middleware, which acts as a broker of events. Then, the event is streamed to the stream-processing line to extract 158 features from its bidirectional network flow. The stream-learning module processes the features from the captured flow in a 15 s time window to create an initial classification model. The stream learning module provides reliable classifications as it has a Verification module. At the same time, it provides updated machine learning models. According to the authors, BigFlow can maintain a high accuracy over a network traffic dataset spanning an entire year.
Conceptually similar work has been proposed [8,9,10,11,12,13]. The researchers extensively investigated the implementation of big data technology to improve NIDS performance, and they used well-known IDS datasets offline to conduct experiments. The dataset was divided into training and testing datasets. The training dataset was used to process various machine-learning algorithms implemented in the big-data environment to create a model that served as the rule of the detection engine for detecting intrusions. Then, the testing data were streamed to the detection engine and measured the performance of intrusion classification based on its accuracy, precision, and various other machine learning evaluation metrics.
In [14], the researchers reported that the correlation of security events, the collection of data from diverse sources, and big data technologies were recommended when building an efficient intrusion detection system. The researchers reviewed 74 papers related to Big Data Cyber Security Analytics (BDCA) and identified 17 architectural tactics for BDCA based on the qualitative goals, i.e., performance, accuracy, scalability, reliability, security, and usability of BDCA systems. One example of the codified architectural tactics was data ingestion monitoring tactics. In some situations, the security event data could be generated and collected at speed beyond the DC’s capacity, which led the defense center to crash. Therefore, the DC must have a data ingestion monitor to control the distributed data collector agents.
The pioneering studies showed that the NIDS must support multiagents, data ingestion, and big data environments. These requirements increase the complexity of the entire NIDS platform. Our research focuses on addressing this complexity in the NIDS and its defense center in four ways:
- We describe the architecture and components of our proposed design in detail;
- We propose a novel Snort-based NIDS design for the cloud, which makes it scalable and easy to configure against intrusion in the cloud;
- We implement messaging middleware framework to support data ingestion monitoring;
- We propose a new design for the defense center to handle massive data using the advantages of big data technologies.
The following parts of this paper are organized as follows: Section 2 contains the main idea of our proposed design. Section 3 shows the detailed architecture and components of the proposed system. We experiment with the sensor deployment strategy, selecting the messaging protocol between sensors and the DC, and the building blocks of big data components. We conclude the work in Section 4.
3. Methods
3.1. Defining Big Data for IDS
Suthaharan [15] proposed a system for defining big data for IDSs based on 3 new parameters: (1) cardinality, (2) continuity, and (3) complexity. The system demands an efficient distributed file system to process data capture, data storage, and data analysis. Thus, the network topology must be appropriately designed to address big data challenges in NIDS. The solution is to build the network topology on NIDS using a distributed system and a public cloud based on current data-processing needs.
Suthaharan also proposed a big data network model that addresses the implementation of big data technology in NIDS (see Figure 4). The model is composed of two systems. The User Interaction and Learning System allows its users to interact with the system and control its settings. The Network Traffic Sniffing System (sensor) captures network traffic and stores it either on the Hadoop Distributed File System (HDFS) or the Cloud Computing Storage System (CCS). Data are stored on HDFS for urgent purposes, and data are stored on the CCS for future processing. The number of sensors grows according to the number of networks that need to be monitored. Consequently, the sizes of the CCS and HDFS also increase as the volume of the data increases. The architecture may face 2 challenges:
- Minimizing bandwidth and latency between the client and the server. Deciding on an efficient data flow design can address this challenge;
- The security of this architecture. Security challenges arise because the security mechanisms in cloud technology are relatively low. Damage to data in the public cloud is unavoidable and becomes a complicated problem. Finding suitable security mechanisms on cloud-based systems is a formidable challenge.
3.2. The Lambda Architecture
The difficulties in developing a big data system include arbitrary computing functions on distributed datasets in real-time and combining batch and real-time processing capabilities to maintain data latency throughput and minimize the faults. However, there is no optimal design that can accomplish these tasks.
The Lambda architecture [16], as shown in Figure 5, addresses the problem of arbitrary computing functions parallel to distributed data in real-time, and it consists of three layers:
- Batch Layer
This layer stores the continually growing and immutable master data in a distributed file system, HDFS. It also precomputes batch views of distributed data using the MapReduce feature of this layer. Batch views are commonly used to reply to incoming queries with a low read latency.
- Speed Layer
This layer computes views of recently incoming data from various data sources and may enrich the master data by combining them with related data from other sources in real-time.
- Serving Layer
This layer combines the results of the batch layer and the speed layer. Its main results are aggregated data, merged data, and consolidated data. These types of data help generate reports, facilitate data analysis by querying across data patterns, and preserve the visualization dashboard.
4. Result and Discussion
This research paper proposes a novel design for a cloud-based Snort NIDS using containers, the messaging middleware between sensors and the DC, and big data architecture implemented at the DC. Moreover, to the best of our knowledge, our proposed design is the first reported design, which implements a big data architecture, namely, Lambda architecture, in the defense center as part of a network security monitoring platform.
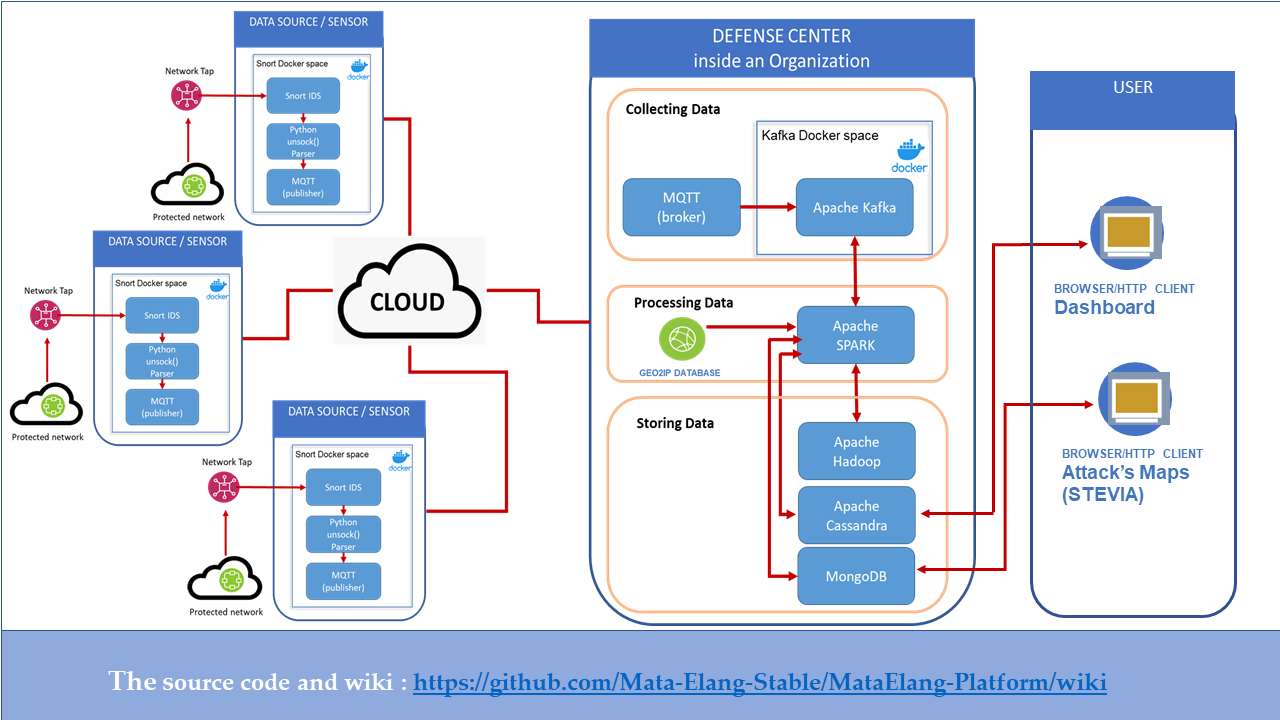
Our proposed design is composed of three main blocks: the Data Source or sensor, the DC, and the Dashboard and Visualization Service. The functional block diagram of our proposed design is shown in Figure 6.
4.1. Data Source/Sensor
4.1.1. Building the Snort Using Docker Technology
Docker is an open-source platform used by development teams to effectively build, run, and distribute applications [17]. Docker technology has two elements. The first element is the docker engine. This is a portable software packaging tool with a lightweight system that is run by a particular library, namely, libcontainer(). Using this library, Docker can manipulate namespaces, control groups, SELinux policies, network interfaces, and firewall rules. This feature allows independent containers to run within a single instance to avoid the overhead of starting virtual machines. The second element is the docker hub. This is a docker data-sharing application on a cloud service, automating the workflow. It makes the creation of new containers easy, enabling it to iterate applications and provide transparency in application updates.
Moreover, Docker can shorten application development, testing, and production times. These advantages led us to base our Snort-based IDS sensor on docker technology [18]. We saw that we could build the Snort-based NIDS and its dependencies into one docker image. Users can download this pre-configured sensor application without any further configuration; this can be as simple as issuing the Command-Line Interface (CLI) “docker run” (see Figure 7). The sequence of installing and configuring the Snort sensor container is as follows:
- Through CLI, execute the “docker run” command for the image sensor with web rules;
- Obtain the image sensor with web rules from the docker registry;
- Put the image on a file;
- Create a new Snort Sensor container;
- Create a new read and write file system for the newly created container;
- Create a new network interface that will connect the container to the network;
- Start the Snort Sensor container.
We tried four Linux distributions as the operating system of the Snort docker containers, i.e., Debian, Ubuntu Server, Alpine, and Mint. We experimented on each Linux distribution three times. We experimented with CPU Intel i5 as the host and 4 GB RAM and 500 GB HDD. As shown in Table 2, our experiments indicated that the docker container with Alpine as its base image has a shorter build time and smaller sizes than the other Linux distributions, which may cause Alpine Linux [19] to have a smaller memory usage footprint designed for containers.
4.1.2. The Data Flow from the Snort to the MQTT (Publisher)
As we previously explained, we used the Docker containers to make the sensor installation easier. We assigned a device ID to each sensor as its identifier. The data stream starts from the alert file generated by the Snort. Then, the Python’s library, called unsock() parses every line of the alert. The parser builds a data structure for messages. The MQTT (Publisher) sends messages to the MQTT (Broker). Box 1 shows an example of a Snort alert sent by the MQTT (Publisher).
Box 1. Example of the Snort alert sent through the MQTT.
{
“src_mac”: “08:00:27:5b:df:e1”,
“dest_ip”: “173.194.70.94”,
“src_ip”: “10.0.2.16”,
“packet_info”: {
“len”: 40,
“ttl”: 128,
“offset”: 0,
“DF”: true,
“MF”: false
},
“protocol”: 6,
“classification”: 131072,
“dst_port”: 80,
“alert_msg”: “(http_inspect) INVALID CONTENT-LENGTH OR CHUNK SIZE”,
“priority”: 196608,
“timestamp”: “1523556223.279105”,
“sig_id”: 524288,
“src_port”: 49165,
“sig_gen”: 7864320,
“ip_type”: “IPv4”,
“sig_rev”: 131072,
“device_id”: “sensor-1”,
“dest_mac”: “52:54:00:12:35:02”
}
4.2. The Messaging Middleware Using MQTT
The messaging middleware has a hub and spoke architecture that makes it the central point of communication between all applications. It controls the transport method, the rule, and the data reformatting to ensure that the data will arrive at the receiving application precisely. For example, data sent by one application (Publisher) can be stored in a queue and then forwarded to the receiving application (Subscriber) when it becomes available for processing. The messaging middleware system is commonly implemented in an Internet of Things (IoT) architecture. Most IoT projects combine MQTT and Kafka for good performance and scalability. The high-level IoT architecture is shown in Figure 8.
MQTT Broker receives data from sensors (as Publisher) using MQTT protocols. Then, it sends the data to Apache Kafka Broker through the MQTT connector. Kafka Producer is an application that publishes data to a Kafka cluster made up of Kafka Brokers. Kafka Broker will be responsible for receiving and storing the data that a producer from MQTT Broker recently published. Then, Kafka Consumer consumes the data from Kafka Broker at specified offsets, timestamps, and positions. Each consumer can perform a specific task: write the messages to a Hadoop and stream the Spark engine’s data. A basic unit of data in Kafka is called a “message”. This contains the data and their metadata and the timestamps. These messages are organized into logical groupings called “topics,” on which Producers publish data. Typically, messages in a topic are distributed across different partitions in different Kafka Brokers. An Apache Kafka Broker can manage many partitions.
We experimented with comparing the performance of Apache Kafka with that of MQTT. In the experiment, the size of each piece of event data or message was 924 bytes. We increased the message rates from 1 to 1000 messages/s. Then, we found the best message rates according to their latency. The results, presented in Table 3, show that MQTT has a higher message rate and lower latency than Apache Kafka. We used the MQTT for the IoT messaging protocol designed by researchers according to [13,14], a lightweight Publish/Subscribe protocol for connecting remote devices with minimal memory and bandwidth requirements. In MQTT, messages are stored until a receiving application connects and receives a queue message. The MQTT client can acknowledge the message when it receives it or when the client has completely processed the message. Once the message is acknowledged, the system removes it from the queue. The difference between Apache Kafka and MQTT is that Apache Kafka is not only designed as a broker. It is also a streaming platform that stores, reads, and analyzes streaming data. Consequently, the messages are still stored in the queue, even those sent to the target. In our experiment, we deleted all of the messages after the retention period.
4.3. The Defense Center
The Defense Center has three blocks: collecting and streaming, processing, and storing.
4.3.1. Collecting and Streaming Data
In the first stage of collecting data, the Kafka Broker does not directly receive the MQTT package when the package arrives at the machine that collects data blocks. We used Confluent’s Kafka-connect feature in the MQTT server and created a bridge class connector to bridge the MQTT server to the Kafka Broker. We chose the Confluent platform because of the simplicity with which it performs transformation tasks such as encoding, encrypting, and transforming data before the data go to any Kafka Broker partitions. We transformed the data into the Avro format (an encoded binary format) because Avro-format data have a higher level of security than JSON or ordinary text files. We had to define the Avro schema to read and parse the data at the receiver.
The MQTT (Broker) does not actively publish topics to other destination data but only serves destinations that subscribe to specific topics with the Broker. In our system development, only one topic was published/subscribed.
We chose Apache Spark to process data in the data-processing blocks because of its proven ability to effectively handle IDS data [20]. However, to be more convincing during the selection of Apache Kafka for data ingestion, we experimented with the following specifications. We looked at 3 scenarios: sending 50 million, 100 million, and 150 million data sent simultaneously to a single Kafka Broker. Then, we analyzed the average message rates and the throughput. As seen in Table 4, there was a significant decrease in the throughput rate when the messages reached 150 million. This result indicates that a single broker can process about 100 million messages, with a maximum message rate of 650,000 messages/s, and the maximum throughput was 172 MBps. If the number of messages that need to be processed is more than 150 million, we must scale up the Broker by adding more Apache Kafka Brokers.
The order of the tasks in this structured streaming process is as follows. First, Spark will stream the topic defined when the job is executed on the Apache Kafka Broker. Then, the schema retrieved via the Confluent schema registry API deserializes Avro messages. The streaming process includes the following steps:
- Deserialization of the Avro data with a pre-existing registry schema;
- Conversion of the data into a data frame using the map function;
- Execution of the aggregation process from the existing data frame using the Reduce function;
- Storage of the data in Apache Hadoop.
4.3.2. Processing Data
In the data-preprocessing phase, the previously collected data are sorted and aggregated for further processing. The data stored in Apache Hadoop are retrieved and processed in Apache Spark using batch processing. The log-data-processing performed in Apache Spark consists of a timestamp and time-zone adjustments for sensors that use Unix Epoch as the format of the timestamp data sent by the sensor. The aggregation is performed in the following time units: second, minute, hour, day, month, and year. Additionally, we enriched the aggregation data with the Geo2IP database through Apache Spark. The aggregated data are shown in Table 5.
4.4. Dashboard and Visualization Services
We build a service, namely, Kaspa Service, with web technology, using Python Flask to display the statistics in graphs and charts. KaspaService consists of two primary services: a backend and a frontend. It allows users to monitor and control the activity of the sensors they have installed.
Users can access all of the information sent by the sensors that the defense center has processed through a web browser using their previously set username and password. The information available on the dashboard page includes the sensor statistics; the daily, weekly, and monthly attack data; and a page for sensor management. We used [21,22] to design our dashboards, and Figure 9 shows examples of our dashboards. We provided two main menus on the left side: (1) Monitoring & Statistics and (2) Report & Summary. The IDS metrics that we used are as follows:
- Top 20 Alarming Signatures (ordering, highest count);
- Top 20 Alerts by Date Metric (ordering, highest count);
- Alerts by Source IP (aggregation, grouping);
- Alerts by Date;
- Alerts by Destination IP (aggregation, grouping);
- Alerts Categorized by Severity (aggregation, grouping);
- Number of Alerts by Signature (aggregation, grouping);
- Alerts by Source Port (aggregation, grouping);
- Alerts by Destination Port (aggregation, grouping); and
- Source IP by Country (aggregation, count, sort).
We used the D3-geo module of D3.js as a web application (STEVIA) to visualize the attack maps on the user’s dashboard. As explained previously, MongoDB receives data from Apache Spark through the change stream feature then notifies the web application to generate the maps. Figure 10 shows the attack maps on the user’s browser.
5. Conclusions
The rapid change in Internet technology with cloud computing and big data technology challenged us to develop a new platform for a network intrusion detection system (NIDS). The cloud-based NIDS platform requires sensors that act as multi-agents, messaging middleware, and big data environments.
The change in the installation method and configuration of the Snort sensor enables it to act as an agent that is distributed over the cloud using Docker technology. The use of Docker can significantly reduce the sensor development and configuration time on the user side. We created our Docker image based on Alpine Linux distributions for the minimum image file size and build time.
Our experiment shows that the MQTT protocol has lightweight and latency qualities for communication between the sensors and the defense center. We used the following big data technologies inside the defense center: Apache Kafka, Hadoop, Spark, Mongo DB, Cassandra DB, and Rest API. Data ingestion by Apache Kafka was observed in our experiment. The experiments showed that Apache Kafka has a maximum message rate of 650,000 messages/sec and a maximum throughput of 172 MBps for streaming data into Spark and Hadoop.
In summary, based on our novel design, we successfully developed a cloud-based Snort NIDS and found the optimum method of message delivery from the sensor to the defense center. We also succeeded in developing the dashboard, and the attack maps to display the attack statistics and visualize the attacks. Our design is the first to implement a big data architecture, namely, the Lambda architecture, at the defense center as part of a network security-monitoring platform. We provide the detailed architecture of our system in Appendix A.
6. Future Work
Nevertheless, our work can be improved and expanded. Some future works are:
- Gather data to calculate the minimum hardware and software requirements of each platform component;
- Change the data source with a packet-flow feature extractor such as CICFlowMeter [23] and analyze it using the big data with MLlib.
Author Contributions
K.R. led the project for the stable version of this system. M.S. administered the project for the stable version of this system and wrote the original draft of this paper. F.A.S. and M.S. initiated the project and developed the main conceptual ideas, proof outline, and committer. The experiments were planned and implemented by I.U.N., J.A.N.H. and F.A.S. F.A.S. developed the NIDS Agent-Based on Snort Sensor software. F.A.S. performed big data integration. J.A.N.H., K.R. supervised F.A.S., J.A.N.H. and I.U.N. in experimentation and numerical calculations. All authors have read and agreed to the published version of the manuscript.
Funding
This publication is supported by Direktorat Riset dan Pengembangan Universitas Indonesia through Hibah Publikasi Terindeks Internasional (PUTI) Q2 Scheme No. NKB-1680/UN2.RST/HKP.05.00/2020.
Institutional Review Board Statement
Not applicable.
Informed Consent Statement
Not applicable.
Data Availability Statement
Not applicable.
Acknowledgments
The authors gratefully acknowledge the financial support from the Direktorat Riset dan Pengembangan Universitas Indonesia. The authors thank all members of the Mata-Elang teams (Dimas, Fadhil, Alfiyan, Ahmada, Ikbar, Andi) from Computer Network Laboratory of Politeknik Elektronika Negeri Surabaya, id.CARE of Universitas Indonesia (Gde, Elvian and Astha), BJIK-BPPT (Taufik, Andi and Cahyo), and JICA-TOKYO (Ide, Takano, Akiyama and Sakurai) for helpful discussion and technical support.
Conflicts of Interest
The authors declare no conflict of interest.
Appendix A
The materials related to this article can be found online at: https://github.com/Mata-Elang-Stable/MataElang-Platform (accessed on 27 January 2022).
References
- Karim, I.; Vien, Q.-T.; Le, T.; Mapp, G. A Comparative Experimental Design and Performance Analysis of Snort-Based Intrusion Detection System in Practical Computer Networks. Computers 2017, 6, 6. [Google Scholar] [CrossRef]
- Irdoni, S.; Saputra, F.A.; Ahsan, A.S. Optimizing the Database of Mata Garuda by Using Partition Table; Politeknik Elektronika Negeri Surabaya: Surabaya, Indonesia, 2017. [Google Scholar]
- Hisyam, M.; Barakbah, A.R.; Syarif, I.; Astika, F. Spatio Temporal with Scalable Automatic Bisecting-Kmeans for Network Security Analysis in Matagaruda Project. Emit. Int. J. Eng. Technol. 2019, 7, 83–104. [Google Scholar] [CrossRef]
- Hisyam, M.; Saputra, F.A.; Akhmad, J. A Study of Implementing Data Mining Using Hadoop and Mahout for Mata Garuda Log Analysis; Politeknik Elektronika Negeri Surabaya: Surabaya, Indonesia, 2015. [Google Scholar]
- Xing, J.; Zhou, H.; Shen, J.; Zhu, K.; Wang, Y.; Wu, C.; Ruan, W. AsIDPS: Auto-Scaling Intrusion Detection and Prevention System for Cloud. In Proceedings of the 2018 25th International Conference on Telecommunications, ICT 2018, Saint-Malo, France, 26–28 June 2018; pp. 207–212. [Google Scholar]
- Gupta, G.P.; Kulariya, M. A Framework for Fast and Efficient Cyber Security Network Intrusion Detection Using Apache Spark. Procedia Comput. Sci. 2016, 93, 824–831. [Google Scholar] [CrossRef] [Green Version]
- Viegas, E.; Santin, A.; Bessani, A.; Neves, N. BigFlow: Real-time and reliable anomaly-based intrusion detection for high-speed networks. Future Gener. Comput. Syst. 2019, 93, 473–485. [Google Scholar] [CrossRef]
- Liu, H.; Lang, B. Machine learning and deep learning methods for intrusion detection systems: A survey. Appl. Sci. 2019, 9, 4396. [Google Scholar] [CrossRef] [Green Version]
- Carta, S.; Podda, A.S.; Recupero, D.R.; Saia, R. A local feature engineering strategy to improve network anomaly detection. Future Internet 2020, 12, 177. [Google Scholar] [CrossRef]
- Othman, S.M.; Ba-Alwi, F.M.; Alsohybe, N.T.; Al-Hashida, A.Y. Intrusion detection model using machine learning algorithm on Big Data environment. J. Big Data 2018, 5, 34. [Google Scholar] [CrossRef]
- Van Dongen, G.; Van Den Poel, D. Evaluation of Stream Processing Frameworks. IEEE Trans. Parallel Distrib. Syst. 2020, 31, 1845–1858. [Google Scholar] [CrossRef]
- Peng, K.; Leung, V.C.M.; Huang, Q. Clustering Approach Based on Mini Batch Kmeans for Intrusion Detection System over Big Data. IEEE Access 2018, 6, 11897–11906. [Google Scholar] [CrossRef]
- Hafsa, M.; Jemili, F. Comparative Study between Big Data Analysis Techniques in Intrusion Detection. Big Data Cogn. Comput. 2018, 3, 1. [Google Scholar] [CrossRef] [Green Version]
- Ullah, F.; Ali Babar, M. The Journal of Systems and Software Architectural Tactics for Big Data Cybersecurity Analytics Systems: A Review. J. Syst. Softw. 2019, 151, 81–118. [Google Scholar] [CrossRef]
- Suthaharan, S. Big data classification. ACM SIGMETRICS Perform. Eval. Rev. 2014, 41, 70–73. [Google Scholar] [CrossRef]
- Marz, N.; Warren, J. Big Data: Principles and Best Practices of Scalable Realtime Data Systems, 1st ed.; Renae Gregoire, J.S., Ed.; Manning: Shelter Island, NY, USA, 2015; ISBN 9781617290343. [Google Scholar]
- Docker. Get Started with Docker. Available online: https://www.docker.com/get-started (accessed on 12 January 2021).
- Kim, A.; Park, M.; Lee, D.H. AI-IDS: Application of Deep Learning to Real-Time Web Intrusion Detection. IEEE Access 2020, 8, 70245–70261. [Google Scholar] [CrossRef]
- Alpine Linux. Available online: https://www.alpinelinux.org/ (accessed on 27 December 2021).
- Dahiya, P.; Srivastava, D.K. Network Intrusion Detection in Big Dataset Using Spark. Procedia Comput. Sci. 2018, 132, 253–262. [Google Scholar] [CrossRef]
- Proffitt, T. How Can You Build and Leverage SNORT IDS Metrics to Reduce Risk. Available online: https://www.sans.org/white-papers/34350/ (accessed on 22 January 2021).
- Raftopoulos, E.; Dimitropoulos, X. A quality metric for IDS signatures: In the wild the size matters. Eurasip J. Inf. Secur. 2013, 2013, 7. [Google Scholar] [CrossRef] [Green Version]
- Masoudi-Sobhanzadeh, Y.; Motieghader, H.; Masoudi-Nejad, A. FeatureSelect: A software for feature selection based on machine learning approaches. BMC Bioinform. 2019, 20, 170. [Google Scholar] [CrossRef] [PubMed]
- Suricata. Available online: https://suricata.io/ (accessed on 18 January 2022).
- The Zeek Network Security Monitor. Available online: https://zeek.org/ (accessed on 18 January 2022).
- The ELK Stack: From the Creators of Elasticsearch. Available online: https://www.elastic.co/what-is/elk-stack (accessed on 22 January 2022).
- Grafana: The Open Observability Platform. Available online: https://grafana.com/ (accessed on 22 January 2022).
Figure 1.
The topology of Mata Garuda, the Indonesia intrusion detection system based on Snort NIDS at the ID-SIRTII/CC (2014–2015).
Figure 1.
The topology of Mata Garuda, the Indonesia intrusion detection system based on Snort NIDS at the ID-SIRTII/CC (2014–2015).

Figure 2.
Mata Garuda with distributed database (2015).

Figure 3.
The improved version of Mata Garuda was based on big data technology.

Figure 4.
The concept of a big data network model that addresses implementing big data in NIDS.

Figure 5.
The components of the Lambda architecture.

Figure 6.
The functional block diagram of the proposed NIDS and big data architecture for cloud.

Figure 7.
The process for creating a new docker container for the sensor (Snort-based NIDS with pre-configured web rules).
Figure 7.
The process for creating a new docker container for the sensor (Snort-based NIDS with pre-configured web rules).

Figure 8.
The high-level architecture of a typical IoT system that combines MQTT and Apache Kafka, and confluent manages all the elements of MQTT and Apache Kafka.
Figure 8.
The high-level architecture of a typical IoT system that combines MQTT and Apache Kafka, and confluent manages all the elements of MQTT and Apache Kafka.

Figure 9.
The dashboard shows the network security event data. The left menu contains two sub-menus: (1) Monitoring & Statistics and (2) Report & Summary.
Figure 9.
The dashboard shows the network security event data. The left menu contains two sub-menus: (1) Monitoring & Statistics and (2) Report & Summary.

Figure 10.
The client web page shows the attacks maps.


Table 1.
Mata Garuda with distributed database (2015) significantly improves the computation time needed to generate reports compared to the Mata Garuda (2014).
Table 1.
Mata Garuda with distributed database (2015) significantly improves the computation time needed to generate reports compared to the Mata Garuda (2014).
| QUERY | Generating Monthly Reports (In Seconds) | Generating Annual Reports (In Seconds) | ||
|---|---|---|---|---|
| Mata Garuda (2014) | Mata Garuda with Distributed Database (2015) | Mata Garuda (2014) | Mata Garuda with Distributed DATABASE (2015) | |
| Top 10 by Signature | 0.22 | 0.08 | 1.90 | 0.50 |
| Top 10 by Signature Class | 0.20 | 0.08 | 1.80 | 0.50 |
| Event by Severity | 0.20 | 0.09 | 1.60 | 0.40 |
| Top 10 by ip_source | 2.90 | 0.08 | 8.70 | 0.30 |
| Timeline Top 10 ip_src | 192.00 | 0.50 | 700.00 | 4.50 |
| Top 10 by ip_destination | 3.00 | 0.08 | 8.50 | 0.30 |
| Timeline Top 10 ip_dst | 120.00 | 0.40 | 700.00 | 1.00 |
| Average Time | 45.50 | 0.19 | 203.21 | 1.07 |
Table 2.
The NIDS agent’s average build time and image size, based on the Snort sensor, are based on its base image.
Table 2.
The NIDS agent’s average build time and image size, based on the Snort sensor, are based on its base image.
| Parameters | Debian | Ubuntu Server | Alpine | Mint |
|---|---|---|---|---|
| Average Build Time (In Minutes) | 30 | 43 | 15 | 25 |
| Image Size (MB) | 623 | 702 | 562 | 620 |
Table 3.
Performance comparison of the Apache Kafka Pub protocol and the MQTT protocol.
| n-th Experiment | Apache Kafka Publisher | MQTT | ||
|---|---|---|---|---|
| Best Message Rates (Messages/s) | Latency (ms) | Best Message Rates (Messages/s) | Latency (ms) | |
| 1 | 210 | 340 | 19 | 31,980 |
| 2 | 220 | 400 | 17 | 31,819 |
| 3 | 200 | 410 | 20 | 32,250 |
Table 4.
The average throughput of Apache Kafka for different numbers of messages sent by the sensor.
Table 4.
The average throughput of Apache Kafka for different numbers of messages sent by the sensor.
| Number of Messages (1 msg = 924 Bytes) | Message/s | Mbytes/s |
|---|---|---|
| 50,000,000 | 420,000 | 110 |
| 100,000,000 | 650,000 | 172 |
| 150,000,000 | 530,000 | 132 |
Table 5.
The aggregated data after the processing of the data block.
| Variable | Type |
|---|---|
| ts | String |
| company | String |
| device_id | Integer |
| year | Integer |
| month | Integer |
| day | Integer |
| hour | Integer |
| minute | Integer |
| second | Integer |
| protocol | String |
| ip_type | String |
| src_mac | String |
| dest_mac | String |
| src_ip | String |
| dest_ip | String |
| src_port | Integer |
| dest_port | Integer |
| alert_msg | String |
| classification | Integer |
| priority | Integer |
| sig_id | Integer |
| sig_gen | Integer |
| sig_rev | Integer |
| src_country | String |
| src_region | String |
| dest_country | String |
| dest_region | String |
Publisher’s Note: MDPI stays neutral with regard to jurisdictional claims in published maps and institutional affiliations. |
© 2022 by the authors. Licensee MDPI, Basel, Switzerland. This article is an open access article distributed under the terms and conditions of the Creative Commons Attribution (CC BY) license (https://creativecommons.org/licenses/by/4.0/).
Share and Cite
MDPI and ACS Style
Saputra, F.A.; Salman, M.; Hasim, J.A.N.; Nadhori, I.U.; Ramli, K. The Next-Generation NIDS Platform: Cloud-Based Snort NIDS Using Containers and Big Data. Big Data Cogn. Comput. 2022, 6, 19. https://doi.org/10.3390/bdcc6010019
AMA Style
Saputra FA, Salman M, Hasim JAN, Nadhori IU, Ramli K. The Next-Generation NIDS Platform: Cloud-Based Snort NIDS Using Containers and Big Data. Big Data and Cognitive Computing. 2022; 6(1):19. https://doi.org/10.3390/bdcc6010019
Chicago/Turabian StyleSaputra, Ferry Astika, Muhammad Salman, Jauari Akhmad Nur Hasim, Isbat Uzzin Nadhori, and Kalamullah Ramli. 2022. "The Next-Generation NIDS Platform: Cloud-Based Snort NIDS Using Containers and Big Data" Big Data and Cognitive Computing 6, no. 1: 19. https://doi.org/10.3390/bdcc6010019