
An Empirical Study on Core Data Asset Identification in Data Governance
by
Yunpeng Chen
1,
Ying Zhao
1,
Wenxuan Xie
1,
Yanbo Zhai
1,
Xin Zhao
1,
Jiang Zhang
2,
Jiang Long
2 and
Fangfang Zhou
1,* 1
School of Computer Science and Engineering, Central South University, Changsha 410073, China
2
Data Intelligence Innovation Lab, Huawei Cloud Computing Technologies Co., Ltd., Hangzhou 310020, China
*
Author to whom correspondence should be addressed.
Big Data Cogn. Comput. 2023, 7(4), 161; https://doi.org/10.3390/bdcc7040161
Submission received: 8 August 2023
/
Revised: 27 September 2023
/
Accepted: 29 September 2023
/
Published: 7 October 2023
Abstract
:Data governance aims to optimize the value derived from data assets and effectively mitigate data-related risks. The rapid growth of data assets increases the risk of data breaches. One key solution to reduce this risk is to classify data assets according to their business value and criticality to the enterprises, allocating limited resources to protect core data assets. The existing methods rely on the experience of professionals and cannot identify core data assets across business scenarios. This work conducts an empirical study to address this issue. First, we utilized data lineage graphs with expert-labeled core data assets to investigate the experience of data users on core data asset identification from a scenario perspective. Then, we explored the structural features of core data assets on data lineage graphs from an abstraction perspective. Finally, one expert seminar was conducted to derive a set of universal indicators to identify core data assets by synthesizing the results from the two perspectives. User and field studies were conducted to demonstrate the effectiveness of the indicators.
1. Introduction
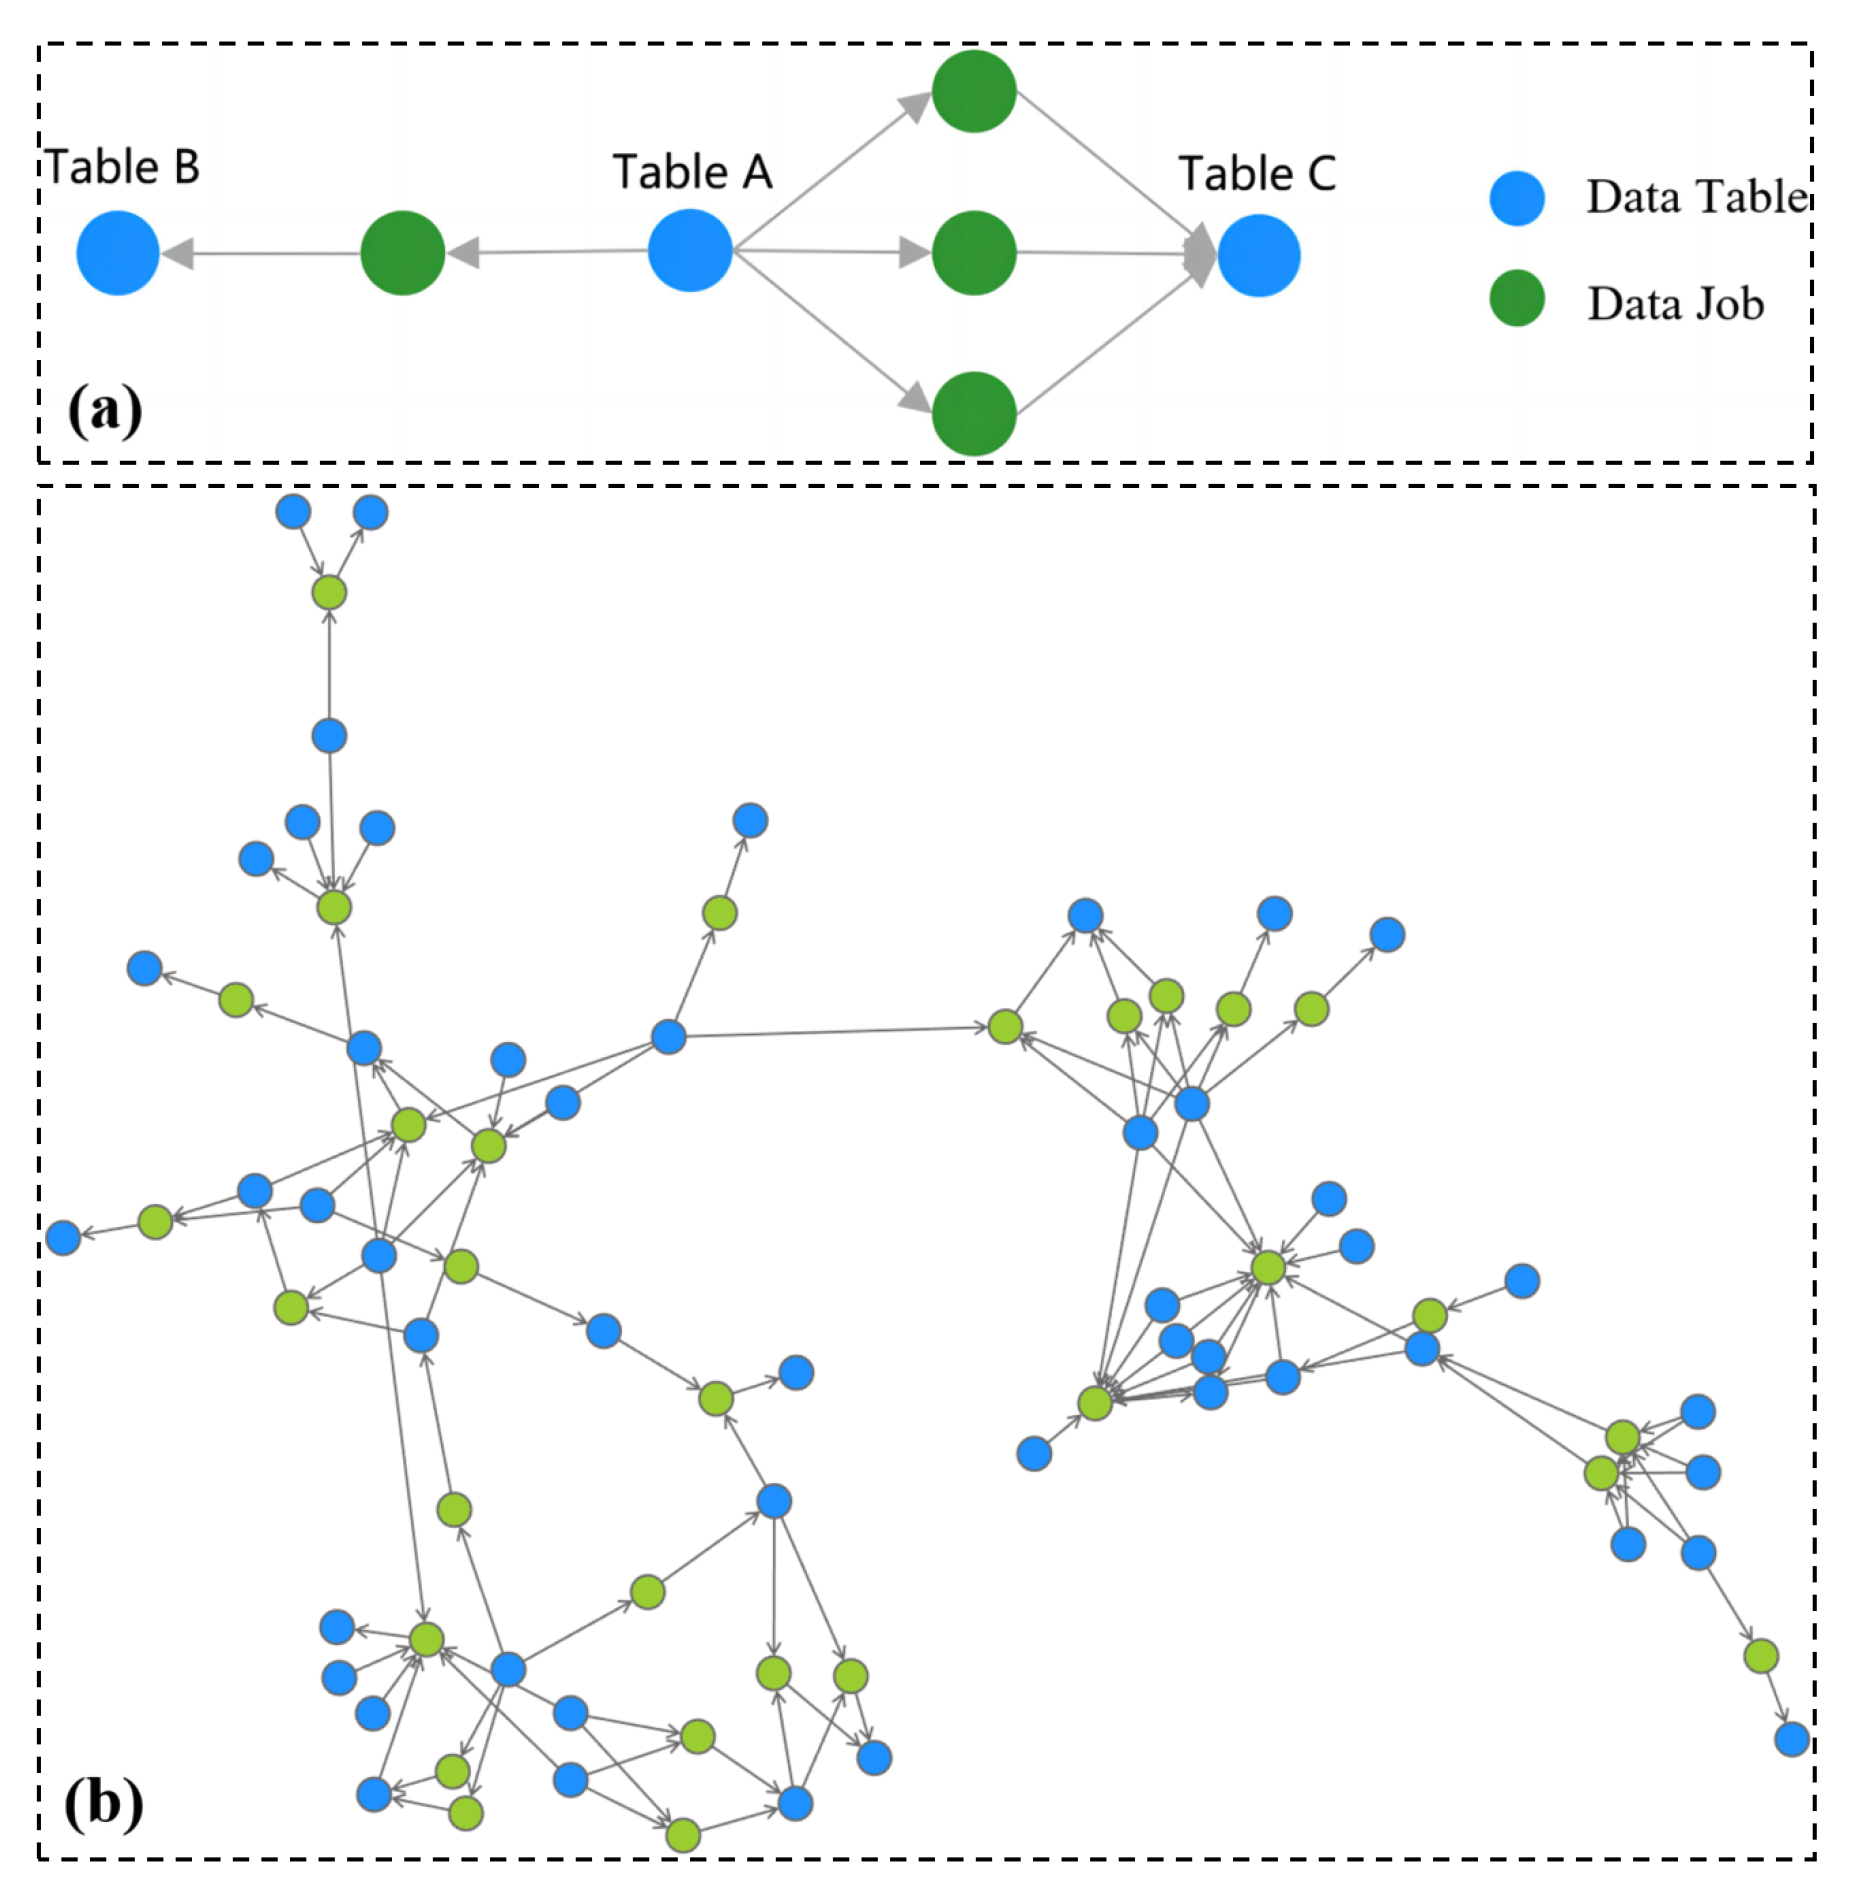
Data are newly emerging assets for enterprises. Data governance aims to maintain high-quality data that are secure and easily accessible for deeper business insights, therefore enhancing management efficiency and empowering product innovations [1,2]. Currently, most data assets exist in the form of relational data tables. In data governance, data tables are frequently transformed into another through data jobs to meet data application requirements. A data job typically consists of SQL statements that extract and manipulate data in data tables, establishing internal data transformation relationships between data tables, known as data lineage [3]. It describes the origins of a piece of data assets and the related data transformation process. As shown in Figure 1a, Table A contains sales data for a particular enterprise’s products. To enhance product sales, consumer information (e.g., age, gender, and occupation) is extracted from Table A and then saved into a new Table B. Moreover, statistical information, including each user’s purchase, retention, and churn rates, is obtained from Table A through three data jobs and transformed into a new Table C. Two data lineages exist among the three tables: one between Tables A and B, and another between Tables A and C. Similarly, a large number of data tables and data jobs can generate complex data lineages, which can be described using a data lineage graph, as illustrated in Figure 1b.
Data classification is one of the activities in data governance, aiming to ensure those data receive an appropriate level of protection based on their importance to the organization [4]. The rapid growth in the number of data assets within enterprises has led to a situation where enterprises cannot comprehensively protect all of their data assets, resulting in a risk of data breaches [5]. When a large enterprise manages millions of data assets, some of these assets will inevitably hold greater value than others. As safeguarding data comes at a cost, it becomes imperative for the enterprise to assess the relative worth of its diverse data assets. Therefore, one key solution to reduce this risk is to allocate limited resources to protect core data assets in enterprises (i.e., lifeblood or crown jewels). Core data assets are high-value assets that may be critical in enterprise management or product innovation. As shown in Figure 1a, Table A is a core data asset because it serves as a base table for generating new tables. Tables B and C in Figure 1b are potential core data assets if they are used in subsequent product sale optimizations.
To realize this goal, all data assets must be assigned a value that properly considers their business value and criticality to the enterprises. However, the primary limitation is that current data classification methods are executed manually based on their understanding of business scenarios, resulting in time-consuming and non-reusable processes. Few standardized or universal approaches have been proposed for identifying core data assets across different enterprise business scenarios.
This work explores a set of relatively universal indicators from scenario and abstraction perspectives, supporting efficient and cross-scenario core data asset identification. Two research questions were proposed: (RQ1) What universal indicators influence data users on the core data asset identification in different business scenarios; and (RQ2) can data users accurately identify core data assets through proposed universal indicators? Through multiple on-site investigations and literature research, an empirical study was designed and conducted to explore the universal indicators for core data asset identification across business scenarios.
The empirical study consists of three steps: (1) The first experiment examined data experts’ experiences in core data asset identification from the scenario perspective. This work was collaborated with Huawei Cloud Computing Technologies Co., Ltd. (referred to as “Company H”), and multiple sets of data assets from different business scenarios were selected as data sets. Four data users, namely one data asset manager and three data experts in Company H responsible for these scenarios, were then invited to identify core data assets manually, providing data sets and labeling core data assets for subsequent experiments; (2) the second experiment aimed to explore the structural features of core data assets on node–link graphs from an abstraction perspective. Thirty-one node centrality metrics are used to summarize the structural features of expert-labeled core data assets; (3) a node–link graph is a common graph visualization that can help humans visually identify important nodes in visual space [6]. Previous graph perception studies revealed that visually prominent nodes, such as high-incident and bridge nodes, are generally perceived as important nodes in a node–link graph [7,8]. These studies largely concentrated on visual space but rarely considered the affections of the user experience. This work conducted one expert seminar to integrate the user experience of data experts and structural features of data assets, deriving five universal indicators for core data asset identification.
Through detailed discussions, data users reached a consensus on five universal indicators: the number of data transformations on a data asset (UI1), the influence on the data transformation process after deleting a data asset (UI2), the number of data sources that directly transmit data to a data asset (UI3), the value of data tables that directly transmit data to a data asset (UI4), and the data capacity to a data asset (UI5). Each indicator captured common meanings in various scenarios and was easily understood by data users. Each indicator is also quantifiable using certain node centrality metrics based on data lineage graphs.
A user study and a field study were conducted with 30 recruited participants and 4 data users from Company H to validate the effectiveness of these universal indicators. The results showed that these universal indicators significantly improved the efficiency of core data asset identification and helped data users identify core data assets that were easily overlooked using traditional methods. Moreover, these universal indicators enabled data users to achieve cross-scenario core data asset identification.
This work presents a preliminary attempt to establish universal indicators for core asset discovery. This work contributes two main findings: (1) it presents a preliminary attempt to establish universal core asset identification indicators in data governance. It offers new insights into data classification and introduces new considerations for issues related to data breaches; (2) the empirical study may inspire investigations into the transformation between subjective perceptions in the human mind and objective descriptions based on abstract graphs in other areas, such as social networks, biological networks, or GeoNetworks.
2. Related Works
2.1. Related Literature on Data Governance
Data governance refers to the exercise of authority and control over data management [9]. Its objective is to establish an organization-wide data management plan, optimizing the value derived from data assets and effectively mitigating data-related risks. The increasing amount of data from various sources gives rise to data inconsistencies that require detection and resolution before making decisions based on inaccurate data. Moreover, the ongoing influence of regulatory mandates, such as the General Data Protection Regulation (GDPR), intensifies the demand for companies to have a robust understanding of data storage locations, data usage practices, and data security. In data governance, numerous problems must be improved significantly, such as datafication and privacy, data breaches, and data classification.
As data governance is a broad area, this work places a special focus on data breaches in data governance. The number of large-scale and high-profile data breaches, such as WikiLeaks and Sony Hack, is rapidly growing [10]. Since data breaches can lead to public relations disasters, their prevention and detection have become top priorities for enterprise managers [11]. The current data breach studies mainly focus on three areas [12]. Some researchers proposed that several factors unintentionally contribute to data breaches, such as human factors [13,14,15], management factors [16,17,18], and technological factors [19,20,21]. However, these studies have not considered the scale of data as a contributing factor to data breaches. This work proposes that the vast scale of data assets leads to decreased data protection in enterprises, making data breaches more likely to occur. Some scholars have researched preventive measures for data breaches, such as managerial factors [22,23], technological measures [24,25,26], and information disclosure [27,28,29]. These studies primarily focus on security policies and security technologies without considering the importance of data classification. Some studies concentrate on the consequences caused by data breaches. It is beyond the scope of this work to go into detail on this research area, so this work does not elaborate further on them.
2.2. Related Literature on Data Classification
The frequency of large-scale identity thefts and data breaches has increased, primarily attributed to insufficient perimeter protection measures. Implementing data classification can serve as an effective means to mitigate this issue. Some studies have been proposed to identify valuable assets in organizations automatically. Beaver et al. [30] and Park et al. [31] have utilized text processing and classification to assess the information value stored on hosts. Beaudoin and Eng [32] introduced a method based on network topology and interdependencies among network assets to calculate the value of network assets. This work is somewhat similar to it. However, this work aims to establish relatively universal indicators to identify core data assets in different business scenarios. Sawilla and Ou [33] proposed a general version of the PageRank algorithm, which estimates the importance of assets to attackers. However, their method calculates the relative importance of attacker assets rather than the importance of the assets themselves. This work focuses on evaluating data asset value and identifying core data assets.
2.3. Related Literature on Graph Perception
Graph perception investigates visual cognition principles when humans extract quantitative or qualitative information visually encoded in a node–link diagram [34,35]. Most graph perception studies concentrate on recognizing structure-oriented information [36]. For example, high-degree nodes are appealing small structures, and clusters are attractive large structures when humans observe a node–link diagram without having particular cognitive tasks [37,38,39]. In-depth investigations on cognition principles of high-degree nodes have a high priority, which supports our work [40]. Several psychological studies have illuminated the profound impact of knowledge and experience on the perception of visual stimuli, including images and artwork. For instance, Rahman et al. [41] revealed that knowledge can mold perception by influencing early visual processing. Lupyan’s research [42] provided evidence that personal knowledge can enhance the richness of visual perception when encountering paintings or images. However, a few studies discuss the transformation between subjective perceptions in the human mind and objective descriptions based on abstract graphs. This work seeks to address this gap.
3. Experimental Design
3.1. Experiment on Scenario Perspective
- (1)
- Experimental Objective
This experiment aims to obtain the objective experiences of data users in Company H regarding core data asset identification from a scenario perspective and provide graph data sets with labeled core data assets.
- (2)
- Experimental Method
Company H specializes in the public cloud domain, storing numerous data assets from various business scenarios on its cloud servers. Data users, including data asset managers and data experts in Company H, are responsible for managing and utilizing data assets for data governance. Data asset managers focus on enhancing data sharing across different business scenarios, whereas data experts manage data assets in specific business scenarios.
Through six months of on-site learning and practice, we have gained domain knowledge of core data asset identification and familiarity with the daily work pipeline of data users in Company H. In this pipeline, data users search for data assets using keywords and validate them based on business descriptions. They then evaluate the value of the data in tables using their business knowledge. Moreover, they examine the data transformation process of tables and determine their importance in the business chain. Lastly, they review other data tables in the data transformation process, repeat the first two steps, and continue until most core data assets are identified.
- (3)
- Experimental Result
Three main business scenarios, namely Cloud Infrastructure, Customer Service, and Operation Analysis, were selected as data sources for the experimental data. The primary reason is that Company H focuses on the public cloud domain, with Cloud Infrastructure as the fundamental scenario, Customer Service as the key scenario for maintaining customer loyalty, and Operation Analysis as the central scenario for driving product innovation. Two criteria were considered in data selection from data sources. (1) The complexity level of data lineages among data tables should vary, reflecting the complexity of data transformation processes in business scenarios. (2) Data lineage graphs should be small-sized to minimize the effect of node overlapping and edge crossing on visual perception.
Ten data lineage graphs with labeled core data assets were extracted from the three business scenarios. Table 1 presents the basic information of the 10 data lineage graphs.
3.2. Experiment on Abstraction Perspective
- (1)
- Experimental Objective
This experiment aims to find the structural features of core data assets on data lineage graphs from an abstraction perspective. It facilitates the creation of universal indicators that can be used to identify core data assets across different scenarios.
- (2)
- Experimental Method
Core data assets play crucial roles in the data transformation process and are represented as important nodes in the corresponding data lineage graph. Node centrality [43] is a metric that measures a node’s importance based on its structural position in a graph. Hence, we can utilize the node centrality metric to analyze the structural features of core data assets in data lineage graphs. Thirty-one node centrality metrics were applied to identify core data assets in the 10 data lineage graphs (DLG1-10). Two evaluation metrics, namely Recall and Precision, were used to verify the performance of node centrality metrics. Recall is the proportion of true positives among all positive samples, whereas Precision is the proportion of true positives among all predicted positive samples. Table 2 presents the identification results of all node centrality metrics.
- (3)
- Experimental Result
Seven node centrality metrics marked with an asterisk (*) significantly outperform the others, which are used to summarize four structural features of core data assets.
(SF1) Table 2 shows that the Degree Centrality metric and the LocalRank Centrality metric outperform other metrics, which means they identify more labeled core data assets. Therefore, this work analyzed these two metrics and found they consider nodes with more links important, deriving the structural feature SF1, i.e., some core data assets appear as high-degree data table nodes in the data lineage graph.
(SF2) The Flow Betweenness Centrality metric and the Information Centrality metric have similar performance in two evaluation metrics. Therefore, this work analyzed these two metrics and found that a graph node is important if it connects different regions, deriving the structural feature SF2, i.e., some core data assets serve as a bridge between different regions in the data lineage graph.
(SF3) The Eigenvector Centrality metric identify nodes as important when they have fewer links but a greater number of 2-hop neighbors. Therefore, this work analyzed this metric and derived the structural feature SF3, i.e., Some core data assets in the data lineage graph have numerous 2-hop neighbors that are non-core data assets.
(SF4) The LeaderRank metric is an improvement of the PageRank metric, which has similar performance in two evaluation metrics. Therefore, this work analyzed these two metrics and found they evaluate the importance of a node in the graph according to the number and value of nodes pointing to it. The structural feature SF4 was derived based on these two metrics, i.e., some core data assets in the data lineage graph have fewer 2-hop neighbors, but some of them are core data assets.
3.3. Expert Seminar
One expert seminar was conducted with data users from the first experiment to explore the business meanings behind the presence of the four structural features (SF1–SF4) of core data assets in various business scenarios, deriving a set of universal indicators for identifying core data assets.
The expert seminar involved three data experts and one data asset manager responsible for managing data assets in specific business scenarios (i.e., Cloud Infrastructure, Customer Service, and Operation Analysis). The goal was to establish a connection between the business meanings of core data assets and their structural features, leading to a set of user-friendly indicators for identifying core data assets across business scenarios. As a result, five universal indicators for identifying core data assets are derived as follows.
UI1. The number of data transformations on a data asset.
This universal indicator refers to the number of data transformations performed on a data table. It is derived by combining the structural feature SF1 and the data users’ understanding of the business scenario from the initial experiment. Data users mentioned that a data table holds greater business value if it performs many data transformation operations, demonstrating its fundamental role in providing data.
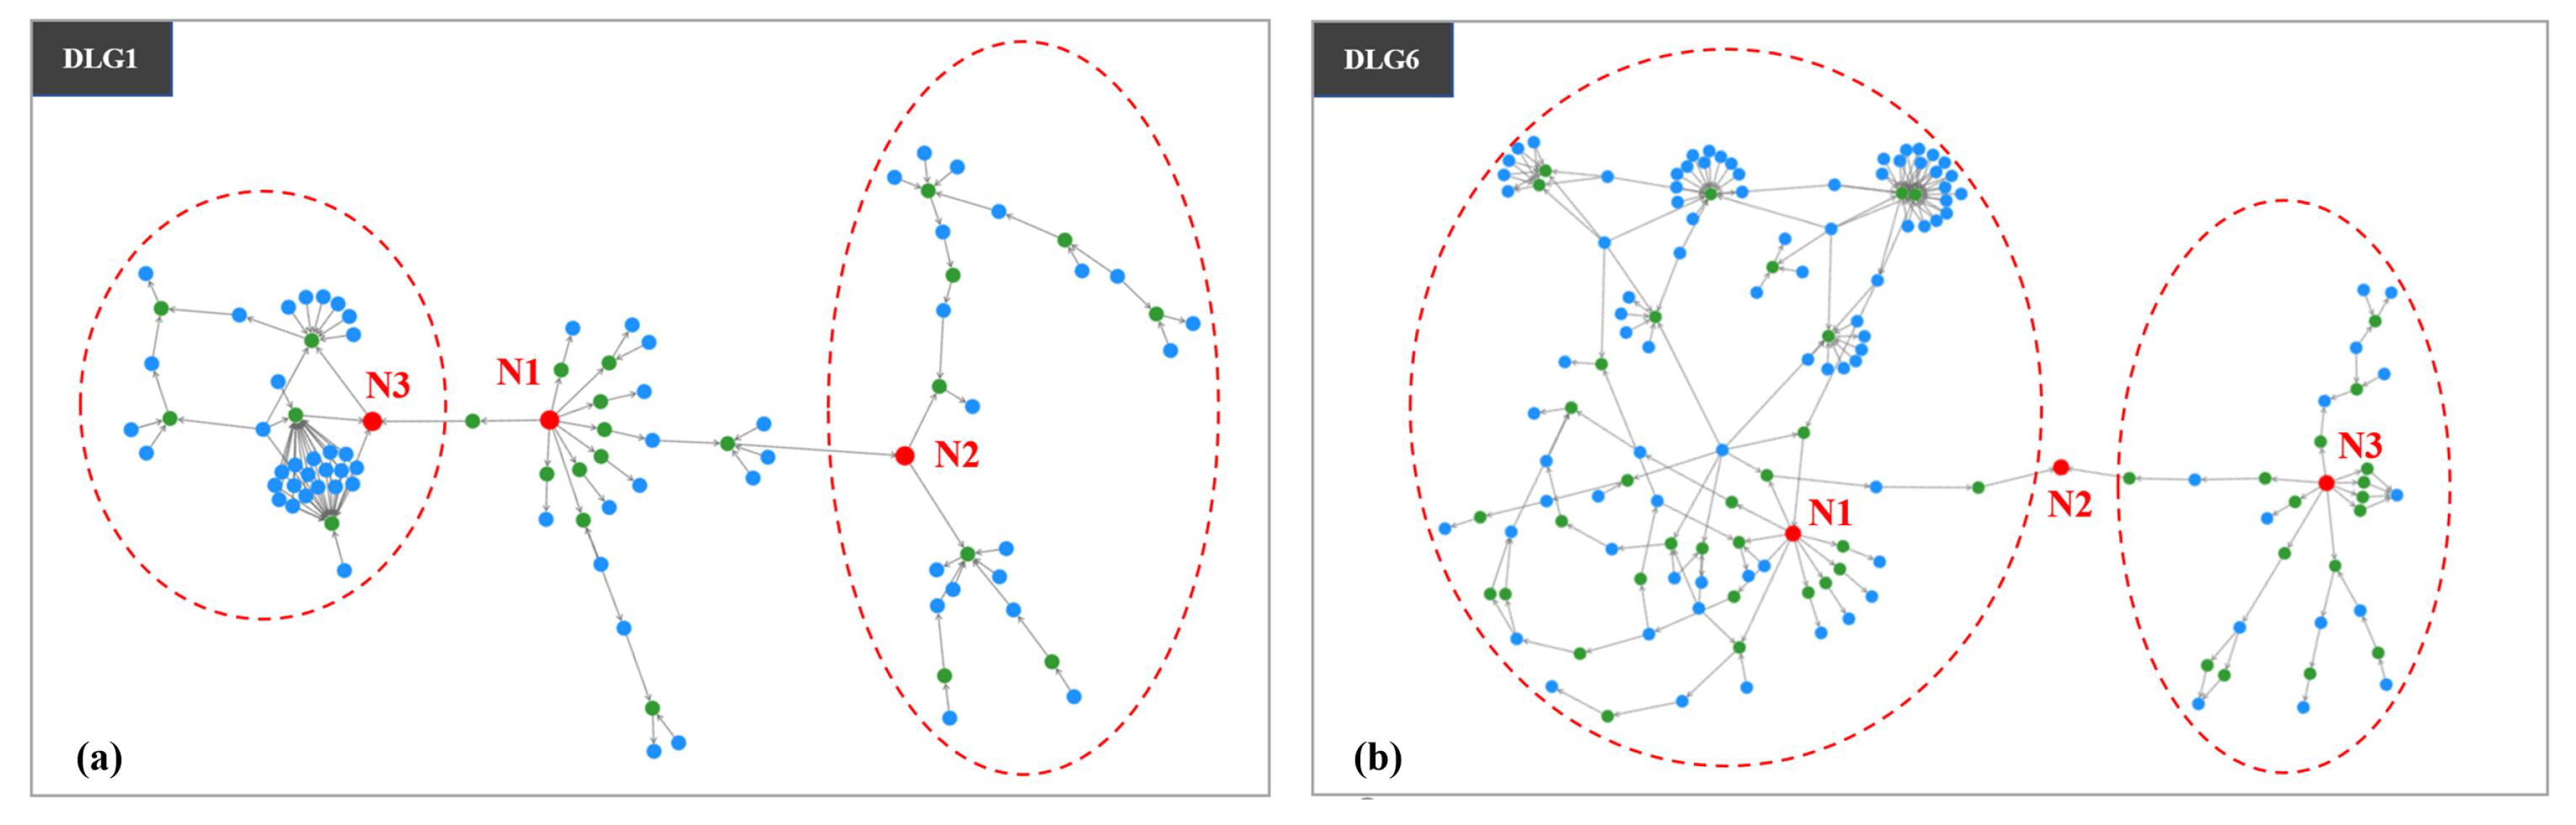
This universal indicator is the most important one among all the universal indicators. We illustrated UI1 using N1 in DLG1 and N1 and N3 in DLG6. Figure 2a shows that N1 is a data table in DLG1 containing information about Company H’s cloud servers, such as server names, locations, buyer details, and service levels, acting as a data source for the entire data transformation process in DLG1. For DLG6 (Figure 2b), N1 and N3 are two data tables that store customer complaint information for a specific product, including complaint time, complaint details, and handling personnel, which is used to provide data support for analyzing customer complaints. These data tables are considered core data assets because they undergo data transformations more frequently than others, playing a fundamental role in the data transformation process. Some business experts remarked, “When identifying core data assets, I immediately pay attention to the number of data transformations of the data assets”. The data asset manager added, “Generally, it is likely a core data asset if it executes data transformations frequently”.
UI2. The influence on the data transformation process after deleting a data asset.
This universal indicator refers to the extent of disruption to the data transformation process when a data asset is removed. It combines the structural feature SF2 and the results of business analysis. Data users stated that multiple data lineages exist within a data lineage graph, which is interconnected through certain data tables. Disrupting these tables can cause the entire data transformation process to break down.
We illustrated UI2 by taking N2 and N3 in DLG1 and N2 in DLG6 as examples. N2 and N3 in DLG1 are crucial turning points in the data transformation process. As shown in the two regions of Figure 2a, disrupting the two data tables will cause several complex data lineages to disconnect from the entire data transformation process. Business experts verified that these tables contain crucial information about cloud servers, supplying data to various data jobs in subsequent transformations to produce other data tables. Similarly, N2 in DLG6 serves a critical bridging role, connecting two complex data lineages (Figure 2b). A business expert stated, “These tables that play a crucial role in different data transformation processes are the ones we need to focus on”. The data asset manager commented, “Although it can be challenging to identify such data tables, their business value is undoubtedly high”.
UI3. The number of data sources that directly transmit data to a data asset.
This universal indicator refers to the number of data tables directly transmitting data to a specific data table. It is derived by combining the structural feature SF3 and the results of business analysis. Data users mentioned that a data table is considered valuable in the data transformation process if it receives data directly from many data tables.
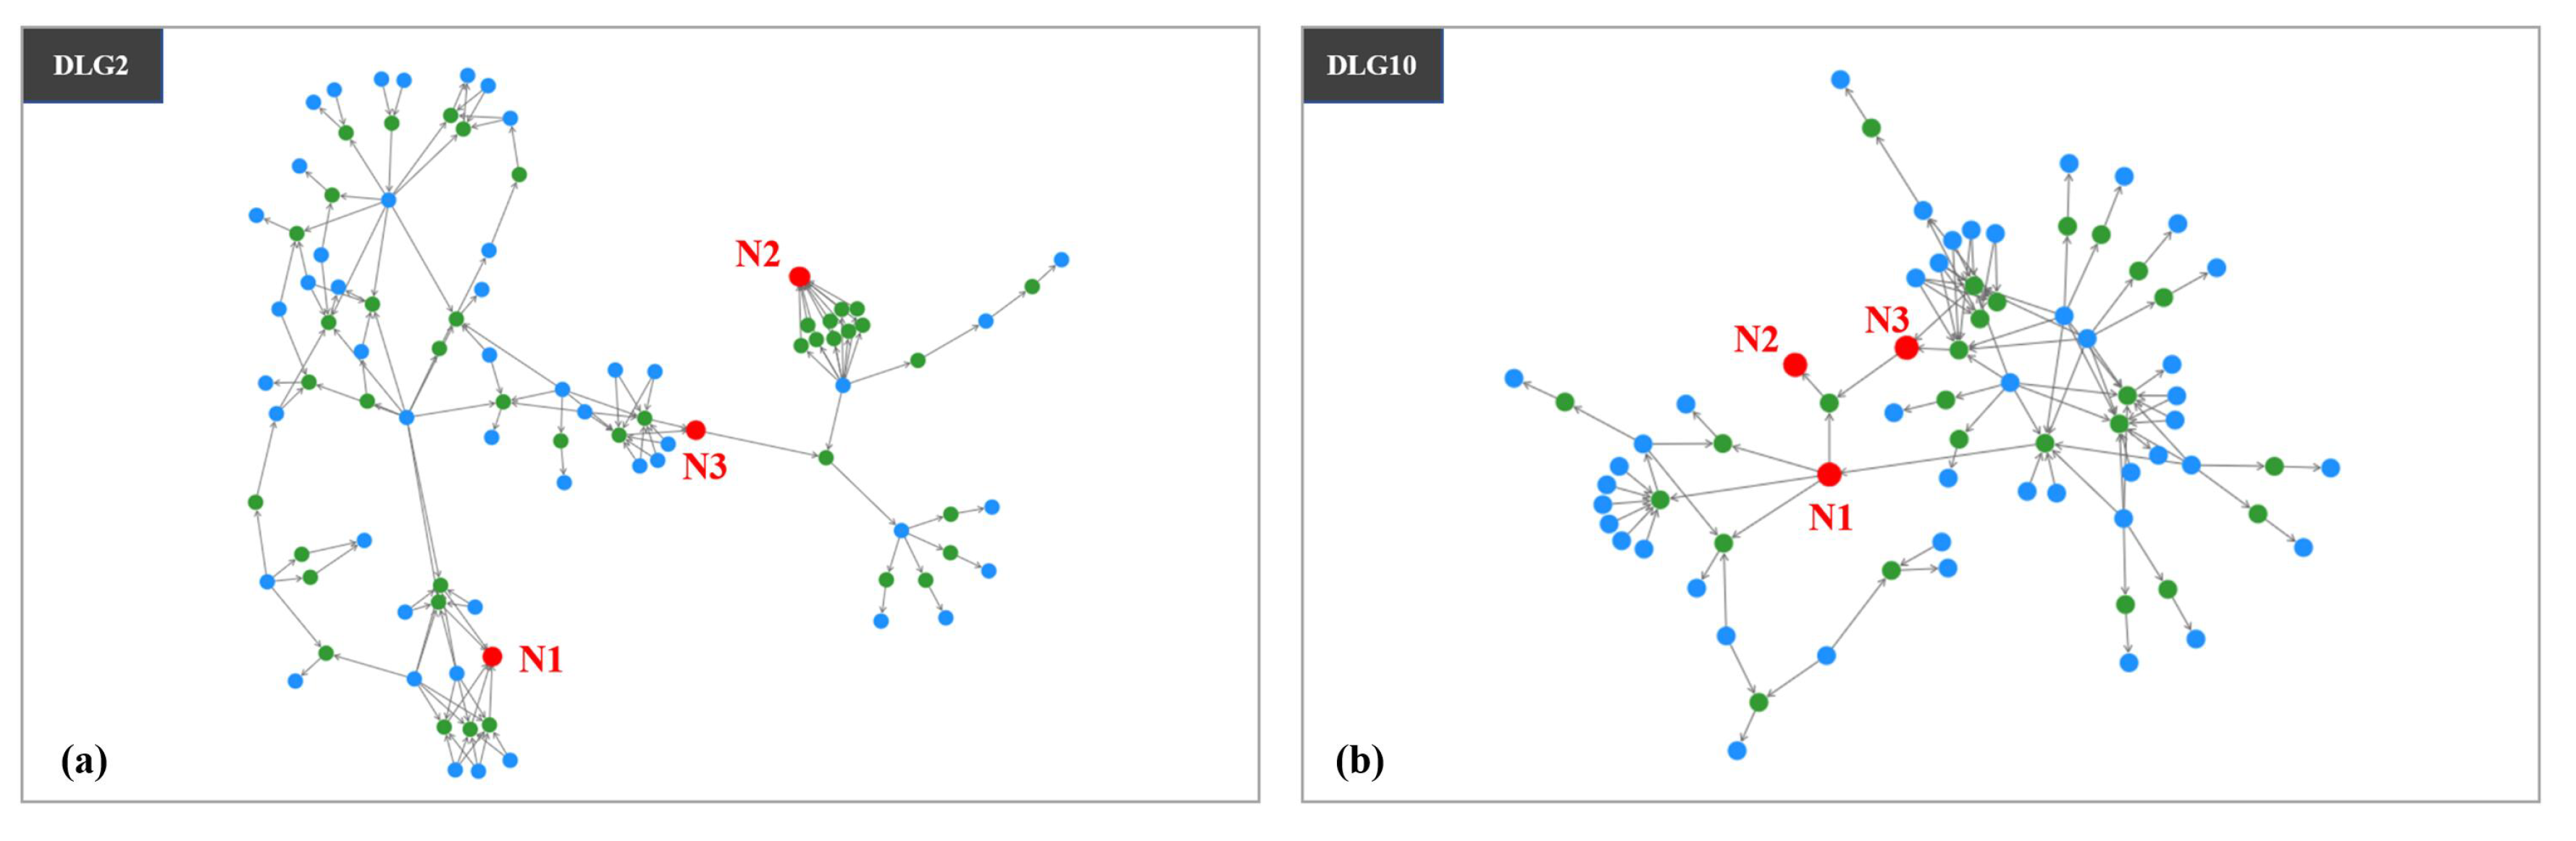
UI3 is demonstrated by examining N1 and N3 in DLG2 and DLG10. N1 (Figure 3a) obtains data from eight data tables through four data jobs. Although the eight tables are considered non-core data assets, N1 has significant application value and is classified as a core data asset. Similarly, N3 in DLG2 is also a core data asset. As shown in Figure 3b, N1 and N3 each receive data from seven data tables that are non-core data assets, which perform data transformations through one or two data jobs. Business experts confirmed that these two tables are generated based on specific business requirements and are thus considered core data assets. The data asset manager mentioned, “The tables serve a specific purpose and require data retrieval from multiple sources typically are considered to be core data assets”. However, a business expert argued, “Sometimes, a significant number of tables are accessed to verify the data processing mechanisms of certain data jobs”.
UI4. The value of data tables that directly transmit data to a data asset.
This universal indicator refers to the business value of data tables that directly transmit data to a specific data table. It is derived by combining the structural feature SF4 and the results of business analysis. Data users mentioned that a data table is considered valuable in the data transformation process if it receives data directly from a few high-value data tables.
UI4 is exemplified by examining N2 in DLG2 and DLG10. N2 in DLG2 (Figure 3a) was generated using data from one table through nine data jobs, where this table is a core data asset containing information about cloud servers. Data users claimed that N2 is a relatively scarce and unique core data asset, typically acquired through complex data processing based on specific business requirements. N2 in DLG10 (Figure 3b) has two data sources (N1 and N3) that are both core data assets, and is therefore considered a core data asset. The data asset manager stated, “These special core data assets with unique application value attract more of my attention”. A business expert stated, “If multiple core data assets are found to participate in the same data lineage, the resulting data asset is likely considered a core data asset”.
UI5. The data capacity to a data asset.
A data user commented, “I have noticed that some data tables meet these four universal indicators, but they are not core data assets.” Through a detailed discussion with data users, we found that the data assets have relatively limited data.
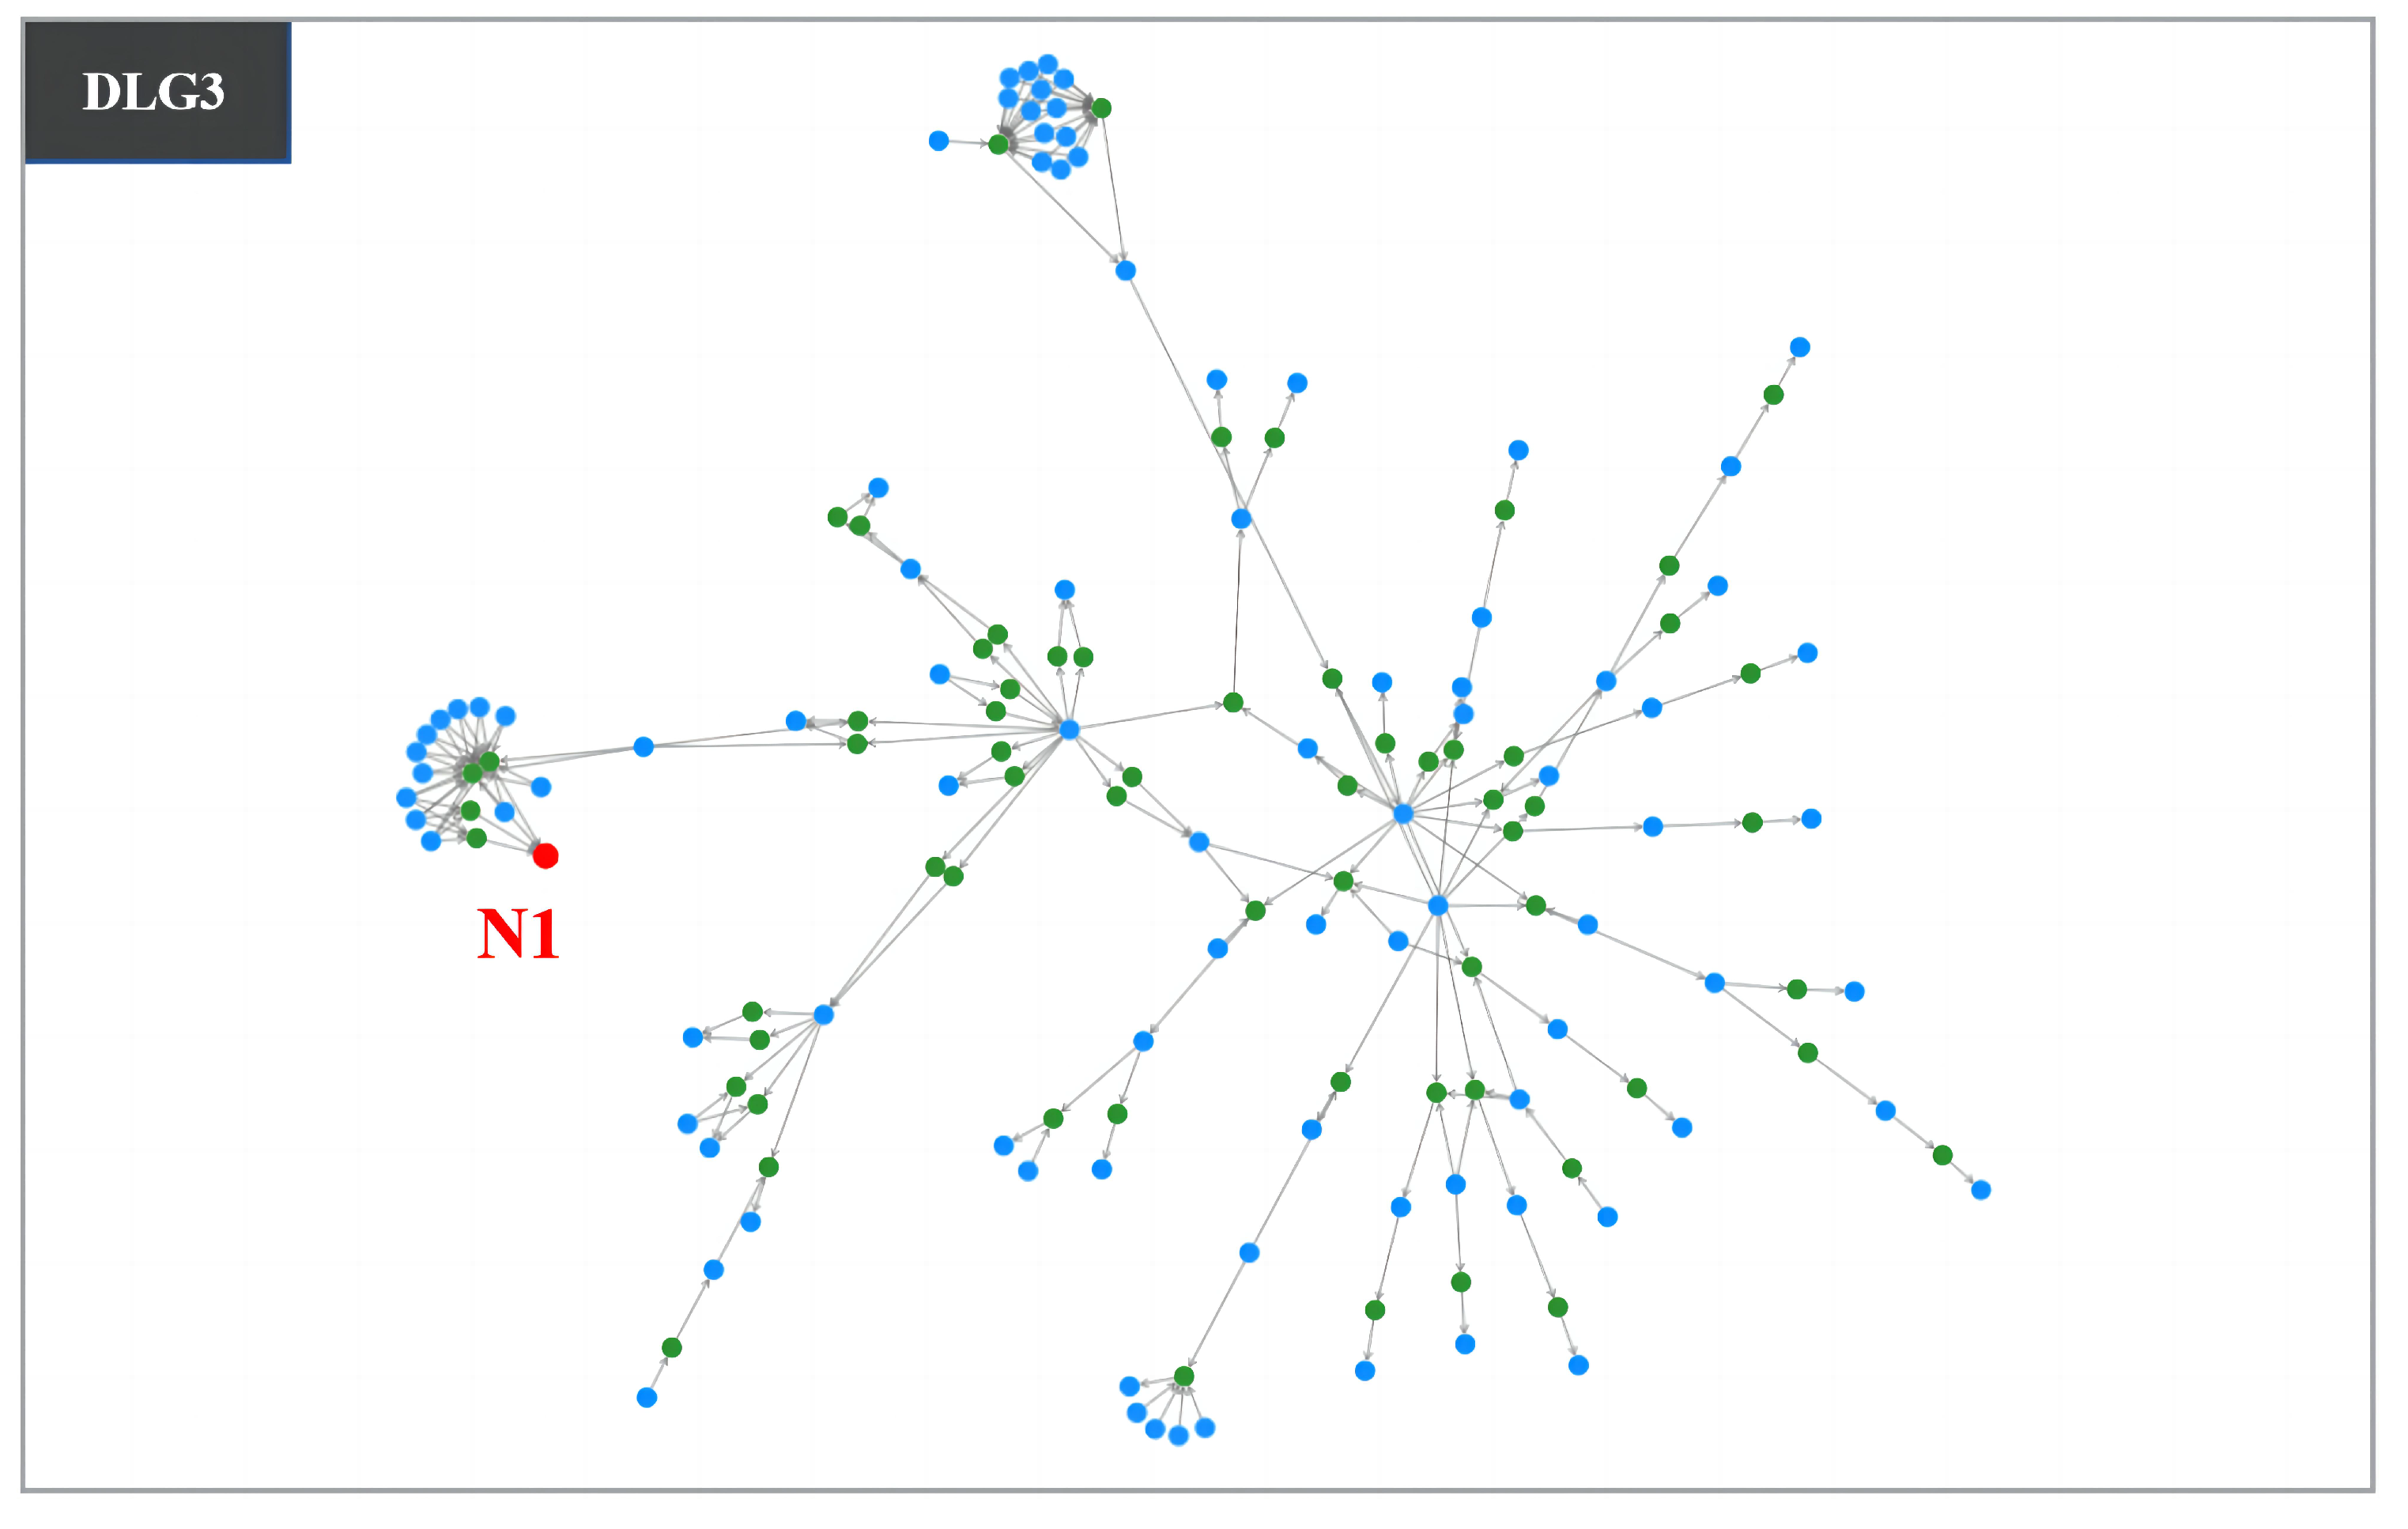
Therefore, UI5 is formulated based on this finding, representing the volume of data stored in a data table. Data users noted that the amount of data directly influences the business value of a data table. If the volume is extremely small, then playing a significant role in the data transformation process becomes difficult for a data table. UI5 is illustrated using N1 in DLG3. N1 (Figure 4) is not a core data asset, even though it has 13 data tables as direct data sources due to its minimal data volume. Business experts generated it to validate data processing mechanisms in certain data jobs. A business expert commented, “It is difficult for a data table with a small amount of data to take on significant responsibilities in the data transformation process”. The data asset manager added, “I have observed that core data assets consistently have a large amount of data”.
4. Evaluation
4.1. User Study
In this section, we enlisted 30 participants who lacked prior experience in data governance for our experiments, comprising an equal gender split of 15 males and 15 females. Their ages ranged from 20 to 31 years. All participants were either undergraduate or graduate students. Among them, 18 had a background in computer science, while the remaining 12 came from non-computer science disciplines. To ensure diversity, we randomly assigned participants into three groups: Groups A, B, and C. Each group included six individuals with a computer science background and four from non-computer science backgrounds.
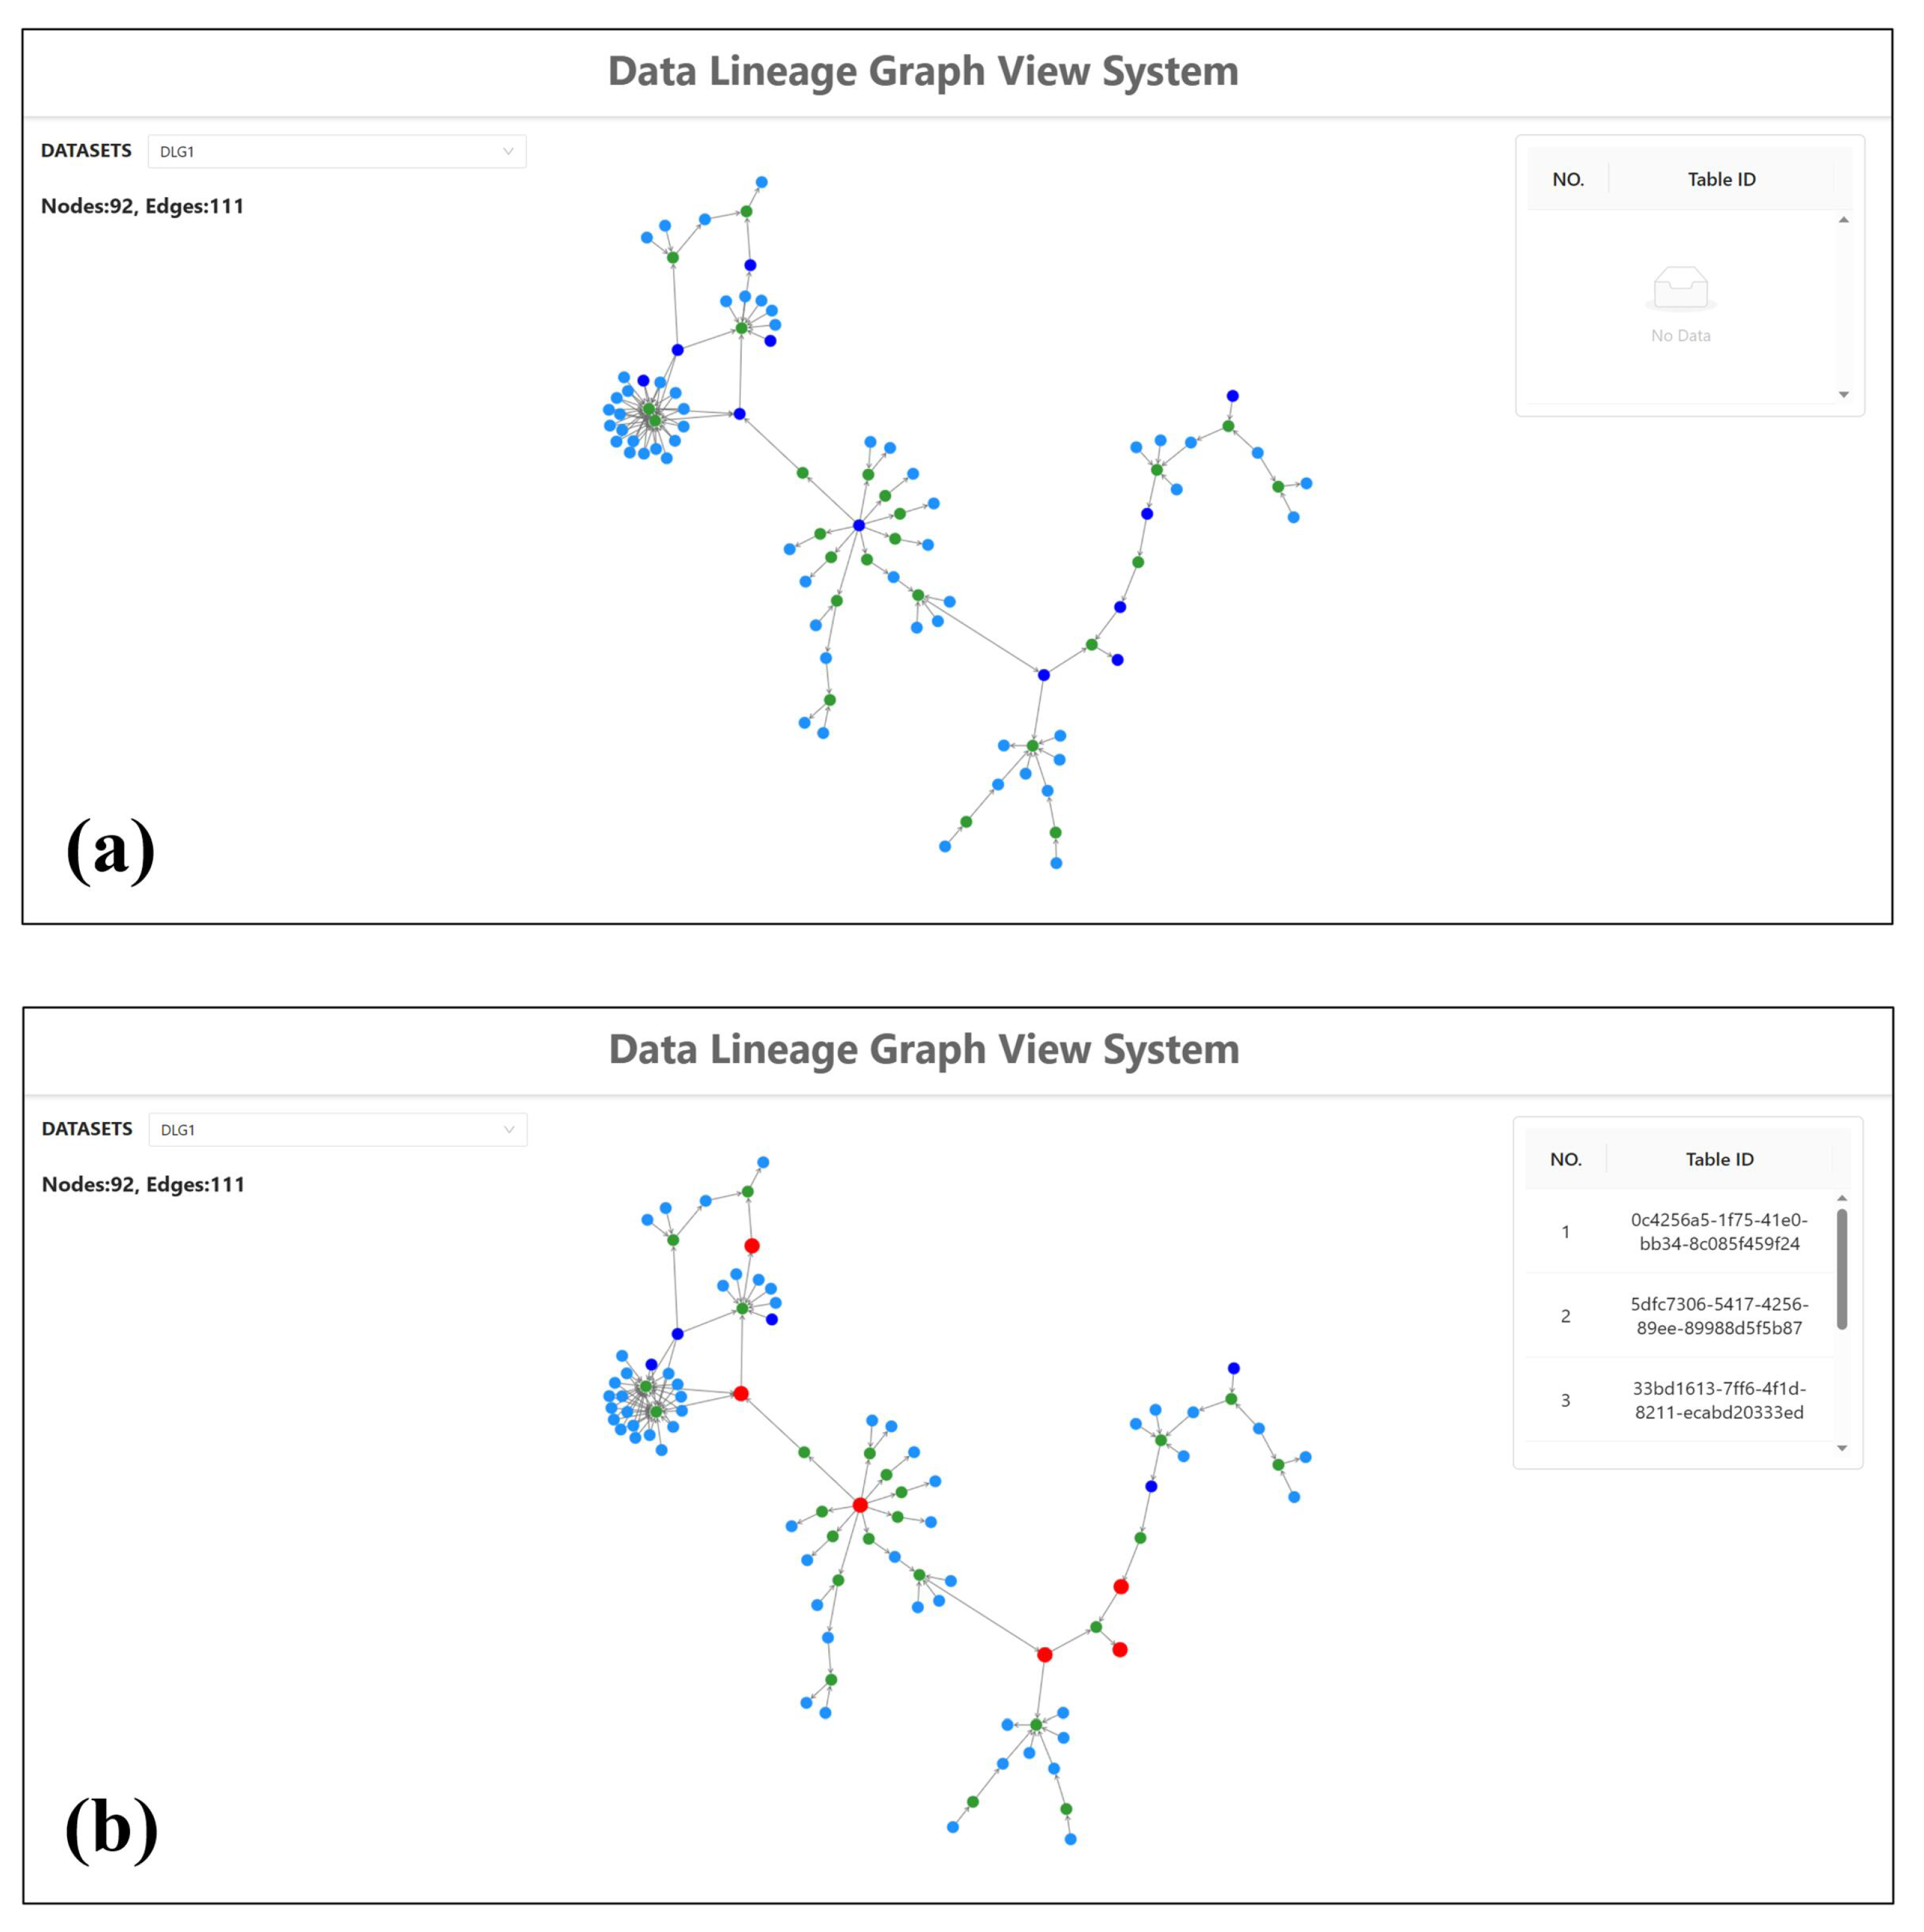
As shown in Figure 5, a user interface called “DLG View System” was provided for support. Regarding data confidentiality, we are unaware of the data volume in data assets. We manually set a high data volume for expert-labeled core data assets, represented by nodes with a dark blue color. We also randomly set a high data volume for some tables to ensure experimental effectiveness.
The instructors provided an overview of the study’s objectives, tasks, and procedures for all experiments. The participants in Group A needed to identify the core data assets following the method used by data users in Company H. The participants in Group B needed to use DLG View to observe the data lineage graph in the form of the node–link diagram for identifying core data assets. The participants in Group C used the DLG View System and the proposed indicators to identify core data assets.
Two analysis metrics were designed, namely Average Precision and Average Recall, to evaluate the user study results. Average Precision calculates the proportion of correctly identified core assets to the total number of selected assets by the participants, whereas Average Recall calculates the proportion of correctly identified core assets to the total number of core assets. As a result, the Average Recall and Average Precision of Group A (15%, 10%) were slightly lower than those of Group B (18%, 15%), and both were significantly lower than Group C (70%, 60%). The two main reasons are as follows.
(1) The participants were unfamiliar with business scenarios. The method used by data users in Company H provided sufficient scenario information but was not helpful for the participants in Group A. Instead, the data lineage graph provided by DLG View displayed nodes with clear structural features, such as high-degree nodes and bridge nodes, guiding the participants in Group B in selecting these data assets. A participant in Group A expressed, “I am unable to understand business information at all, mostly relying on intuition for identification”. Someone from Group B stated, “The nodes with special structural features in the data lineage graph caught my attention, and I instinctively believed that these nodes are important”.
(2) Accurately identifying core data assets by only observing the data lineage graph is insufficient because of the limited understanding of the structural features of core data assets. The participants in Group C could identify core data assets using the proposed indicators without scenario knowledge. A participant in Group C said, “I only need to follow the indicators to identify core data assets”.
Overall, these findings indicate that the proposed indicators can help users without specific scenario knowledge quickly learn how to identify core data assets in unfamiliar business scenarios.
4.2. Field Study
The field study extended over the course of a month. The data users in the first experiment (i.e., one data asset manager and three business experts) were encouraged to use our method (DLG View System and the proposed indicators) in their daily work. The method commonly used in Company H was considered the reference method. Data users were interviewed to assess usability, effectiveness, and user satisfaction. They were requested to rate each question using a five-point Likert scale, with options ranging from 5 (strongly agree) to 1 (strongly disagree). Table 3 shows the rating results.
In summary, the proposed method consistently achieved a higher average score (3.81) compared to the reference method (3.19) across all questions. This indicates that the proposed method outperformed the reference method during the field study. Subsequently, we will delve into our analysis of the rating results, considering aspects related to usability, effectiveness, and user satisfaction.
In terms of usability (Questions 1–3), the proposed method obtained an average rating (4.42) slightly higher than that of the traditional method (2.58). Generally, two data users confirmed that the proposed method is reasonable and easy to use. A business expert commented, “It typically requires extensive training when mastering reference methods to identify core data assets, especially for beginners”. The data asset manager claimed, “I can quickly grasp these indicators without the need to learn different business scenarios specifically”.
In terms of effectiveness (Questions 4–6), the proposed method obtained a higher average rating (4.17) than that of the traditional method (2.58). All data users stated that the proposed method can assist them in quickly locating potential core data assets and improving identification efficiency. Moreover, the proposed method helps identify core data assets across business scenarios. A business expert stated, “The proposed method can quickly help me to filter out potential core data assets, saving a significant amount of time”. The data asset manager commented, “I sometimes encounter challenges of false positives and false negatives when filtering core assets in unfamiliar scenarios. The proposed indicators can greatly enhance the accuracy of my identification”. He added, “In unfamiliar business scenarios, I used to depend on frequent communication with business experts to identify core assets. With the help of the proposed method, I can quickly identify potential core data assets”.
In terms of user satisfaction (Questions 7–9), the proposed method obtained a slightly higher average rating (3.42) than that of the traditional method (3.17). All data users are not entirely satisfied with either of the two methods. A business expert stated, “The proposed method is user-friendly and easy to understand but lacks detailed business information to be supported. Once the core data assets are identified by the proposed method, I would appreciate reviewing their detailed information for additional confirmation”. The data asset manager suggested, “I believe it would be better if combining two methods”.
5. Discussion
In this section, we present a discussion regarding the primary objective of this work. In particular, we present a brief overview of its main strengths, limitations, and practical applications.
The main strengths of this work are the following: (1) this work presents a preliminary attempt to establish universal core asset identification indicators in data governance. It offers new insights into data classification and introduces new considerations for issues related to data breaches; (2) this work may inspire investigations into the transformation between subjective perceptions in the human mind and objective descriptions based on abstract graphs in other areas, such as social networks, biological networks, or GeoNetworks.
This work also has some limitations. First, the experimental data in this paper were derived from three business scenarios of Company H. We expect to utilize more relevant datasets from different business scenarios to validate the generality of the proposed indicators further [44,45]. Second, the complexity of data lineages or large scales may lead to node overlaps and edge crossings in the data lineage graph, affecting users’ visual perception. Graph simplification and sampling techniques [46,47] can help improve the visual effects of graphs. Moreover, the evaluation metrics used in the user study focus only on accuracy and recall. We plan to enrich the evaluation metrics, including time, effects of indicators, and user preferences. Finally, the number of participants and the age range in the user study and the field study need further diversification to validate the generalizability of the indicators. Future research will address this issue, as it is beyond the scope of this paper.
This work’s first possible practical application involves supporting data classification and reducing data breaches in organizations. Organizations cannot ensure that all data assets are under their security protection. When data assets are not properly classified, it can lead to employees accessing information they should not have access to. The second application enhances data users’ efficiency in managing data assets and reduces the time and effort required for training new employees. The universal indicators can assist data users in narrowing down their filtering scope, therefore improving the efficiency of identifying core data assets. For inexperienced new employees, these indicators can help them quickly acquire the ability to recognize core data assets.
6. Conclusions
This work proposed a preliminary attempt to establish universal core asset identification indicators for data governance. First, this work collaborated with Huawei Cloud Computing Technologies Co., Ltd., and multiple sets of data assets from different business scenarios were selected as data sets. Then, data experts in Company H responsible for these scenarios were invited to identify core data assets manually, providing data sets and labeled core data assets for subsequent experiments. Afterward, this work uses data lineage graphs as an intermediary to connect various scenarios and universal indicators. Thirty-one node centrality metrics are used to summarize the structural features of expert-labeled core data assets. Finally, this work integrated the user experience of data experts and structural features of data assets, deriving five universal indicators for core data asset identification.
The main novelties of this work are the following: (1) it presents a preliminary attempt to establish universal core asset identification indicators in data governance. It offers new insights into data classification and introduces new considerations for issues related to data breaches; (2) the empirical study may inspire investigations into the transformation between subjective perceptions in the human mind and objective descriptions based on abstract graphs in other areas, such as social networks, biological networks, or GeoNetworks.
The main results and findings obtained by applying the universal indicators to the user study and the field study can be summarized as follows: (1) For participants who are not familiar with business scenarios and data users from Company H, the method proposed in this work outperforms the traditional core asset identification method used by Company H. (2) Participants and data users using the method proposed in this work can identify the majority of core data assets across business scenarios. However, Company H’s traditional core asset identification method falls short of achieving this. (3) The proposed method helps data users identify core data assets that were easily overlooked using traditional methods.
The ideas proposed in this work have several possible future developments. First, we plan to enrich the indicators further and determine the priority of these features. We also intend to design and implement a more comprehensive data lineage visualization interface, supporting the daily work of data users. Furthermore, we aim to develop an algorithm [48] that synthesizes these indicators to automatically identify core data assets on data lineage graphs, therefore improving the efficiency of data users in identifying core data assets.
Author Contributions
Investigation and Writing-Original Draft Preparation, Y.C.; Writing, Reviewing and Editing, Y.Z. (Ying Zhao); Scrub Data and Maintain Research Data, W.X., Y.Z. (Yanbo Zhai) and X.Z.; Resources-Provision of Study Data, J.Z. and J.L.; Conceptualization and Supervision, F.Z. All authors have read and agreed to the published version of the manuscript.
Funding
The research is supported in part by the National Natural Science Foundation of China (No.62272480 and 62072470) and the Natural Science Foundation of Hunan Province (2021JJ30881).
Institutional Review Board Statement
Ethical review and approval were waived for this study due to REASON: The manuscript contains data derived from interviews and experiments involving human participants, focusing solely on business-related simple question-and-answer interactions. It does not involve any personal identity information or sensitive issues. As the manuscript did not involve sensitive or ethically complex matters, it was determined that ethics approval was not required for this manuscript.
Informed Consent Statement
Informed consent was obtained from all subjects involved in the study.
Data Availability Statement
The data used in this paper is unavailable due to privacy or ethical restrictions.
Conflicts of Interest
All authors disclosed no relevant relationship.
References
- Hannila, H.; Silvola, R.; Harkonen, J.; Haapasalo, H. Data-driven Begins with DATA; Potential of Data Assets. J. Comput. Inf. Syst. 2022, 62, 29–38. [Google Scholar] [CrossRef]
- Janssen, M.; Brous, P.; Estevez, E.; Barbosa, L.S.; Janowski, T. Data Governance: Organizing Data for Trustworthy Artificial Intelligence. Gov. Inf. Q. 2020, 37, 101493. [Google Scholar] [CrossRef]
- Abraham, R.; Schneider, J.; Brocke, J.V. Data Governance: A Conceptual Framework, Structured Review, and Research Agenda. Int. J. Inf. Manag. 2019, 49, 424–438. [Google Scholar]
- Bergström, E.; Karlsson, F.; Åhlfeldt, R. Developing an Information Classification Method. Inf. Comput. Secur. 2021, 29, 209–239. [Google Scholar] [CrossRef]
- Park, Y.; Teiken, W.; Rao, J.R.; Chari, S.N. Data Classification and Sensitivity Estimation for Critical Asset Discovery. IBM J. Res. Dev. 2016, 60, 2:1–2:12. [Google Scholar] [CrossRef]
- Gibson, H.; Faith, J.; Vickers, P. A Survey of Two-dimensional Graph Layout Techniques for Information Visualisation. Inf. Vis. 2013, 12, 324–357. [Google Scholar] [CrossRef]
- Li, J.; Liu, Y.; Wang, C. Evaluation of Graph Layout Methods Based on Visual Perception. In Proceedings of the 10th Indian Conference on Computer Vision, Graphics, and Image Processing, New York, NY, USA, 18–22 December 2016; pp. 1–7. [Google Scholar]
- Wu, Y.; Cao, N.; Archambault, D. Evaluation of Graph Sampling: A Visualization Perspective. IEEE Trans. Vis. Comput. Graph. 2017, 23, 401–410. [Google Scholar] [CrossRef]
- Ladley, J. Data Governance: How to Design, Deploy, and Sustain an Effective Data Governance Program; Elsevier Science: Amsterdam, The Netherlands, 2019; pp. 16–18. [Google Scholar]
- Veroniki, S.K.; Christos, I.; Richard, O.; Christos, G.; Demosthenes, S. Insider Threats in Corporate Environments: A Case Study for Data Leakage Prevention. In Proceedings of the Fifth Balkan Conference in Informatics, Novi Sad, Serbia, 16 September 2012; pp. 271–274. [Google Scholar]
- Schlackl, F.; Link, N.; Hoehle, H. Antecedents and Consequences of Data Breaches: A Systematic Review. Inf. Manag. 2021, 59, 103638. [Google Scholar]
- Dhillon, G.; Smith, K.; Dissanayaka, I. Information Systems Security Research Agenda: Exploring the Gap Between Research and Practice. J. Strateg. Inf. Syst. 2021, 30, 101693. [Google Scholar] [CrossRef]
- Liginlal, D.; Sim, I.; Khansa, L. How significant is human error as a cause of privacy breaches? An empirical study and a framework for error management. Comput. Secur. 2009, 28, 215–228. [Google Scholar] [CrossRef]
- Kamoun, F.; Nicho, M. Human and Organizational Factors of Healthcare Data Breaches: The Swiss Cheese Model of Data Breach Causation and Prevention. Int. J. Healthc. Inf. Syst. Inform. 2014, 9, 42–60. [Google Scholar] [CrossRef]
- Ayyagari, R. An Exploratory Analysis of Data Breaches from 2005–2011: Trends and Insights. J. Inf. Priv. Secur. 2012, 8, 33–56. [Google Scholar] [CrossRef]
- Liu, C.; Huang, P.; Lucas, H. Centralized IT Decision Making and Cybersecurity Breaches: Evidence from U.S. Higher Education Institutions. J. Manag. Inf. Syst. 2020, 37, 758–787. [Google Scholar] [CrossRef]
- Higgs, J.L.; Pinsker, R.E.; Smith, T.J.; Young, G.R. The Relationship between Board-Level Technology Committees and Reported Security Breaches. J. Manag. Inf. Syst. 2016, 30, 79–98. [Google Scholar] [CrossRef]
- Sung, W.; Kang, S. An Empirical Study on the Effect of Information Security Activities: Focusing on Technology, Institution, and Awareness. In Proceedings of the 18th Annual International Conference on Digital Government Research, New York, NY, USA, 7 June 2017; pp. 84–93. [Google Scholar]
- Kim, S.H.; Kwon, J. How Do EHRs and a Meaningful Use Initiative Affect Breaches of Patient Information? Inf. Syst. Res. 2019, 30, 1107–1452. [Google Scholar] [CrossRef]
- Kwon, J.; Im, G. Data Breaches in Multihospital Systems: Antecedents and Mitigation Mechanisms. In Proceedings of the 40th International Conference on Information Systems, New Delhi, India, 13 December 2020; pp. 84–93. [Google Scholar]
- McLeod, A.; Dolezel, D. Cyber-analytics: Modeling Factors Associated with Healthcare Data Breaches. Decis. Support Syst. 2018, 3, 57–68. [Google Scholar] [CrossRef]
- Ransbotham, S.; Mitra, S. Choice and Chance: A Conceptual Model of Paths to Information Security Compromise. Inf. Syst. Res. 2009, 20, 1–157. [Google Scholar] [CrossRef]
- Kweon, E.; Lee, H.; Chai, S.; Yoo, K. The Utility of Information Security Training and Education on Cybersecurity Incidents: An Empirical Evidence. Inf. Syst. Front. 2021, 2, 361–373. [Google Scholar] [CrossRef]
- Cavusoglu, H.; Mishra, B.; Raghunathan, S. The Value of Intrusion Detection Systems in Information Technology Security Architecture. Inf. Syst. Res. 2005, 16, 28–46. [Google Scholar] [CrossRef]
- Kwon, J.; Johnson, M.E. Health-Care Security Strategies for Data Protection and Regulatory Compliance. J. Manag. Inf. Syst. 2013, 30, 41–66. [Google Scholar] [CrossRef]
- Miller, A.R.; Tucker, C.E. Encryption and The Loss of Patient Data. J. Policy Anal. Manag. 2011, 30, 534–556. [Google Scholar] [CrossRef] [PubMed]
- Mitra, S.; Ransbotham, S. Information Disclosure and the Diffusion of Information Security Attacks. Inf. Syst. Res. 2005, 16, 473–636. [Google Scholar] [CrossRef]
- Hausken, K. Information Sharing Among Firms and Cyber Attacks. J. Account. Public Policy 2005, 26, 639–688. [Google Scholar] [CrossRef]
- Gao, X.; Zhong, W.; Shue, M. Security Investment and Information Sharing under an Alternative Security Breach Probability Function. Inf. Syst. Front. 2015, 17, 423–438. [Google Scholar] [CrossRef]
- Beaver, J.M.; Patton, R.M.; Potok, T.E. An Approach to the Automated Determination of Host Information Value. In Proceedings of the 23th IEEE Symposium on Computational Intelligence in Cyber Security, Paris, France, 11 April 2011; pp. 92–99. [Google Scholar]
- Youngja, P.; Stephen, G.; Wilfried, T.; Suresh, C. System for Automatic Estimation of Data Sensitivity with Applications to Access Control and Other Applications. In Proceedings of the 16th ACM Symposium on Access Control Models and Technologies, Innsbruck, Austria, 15 June 2011; pp. 145–146. [Google Scholar]
- Beaudoin, L.; Eng, P. Asset Valuation Technique for Network Management and Security. In Proceedings of the 6th IEEE International Conference on Data Mining-Workshops, Innsbruck, Austria, 18 December 2006; pp. 718–721. [Google Scholar]
- Sawilla, R.E.; Ou, X. Identifying Critical Attack Assets in Dependency Attack Graphs. In Proceedings of the 13th European Symposium on Research in Computer Security, Málaga, Spain, 6 October 2008; pp. 18–34. [Google Scholar]
- Huang, W.; Eades, P.; Hong, S.-H.; Been-Lirn Duh, H. Effects of Curves on Graph Perception. In Proceedings of the 2016 IEEE Pacific Visualization Symposium, Taipei, Taiwan, 5 May 2016; pp. 199–203. [Google Scholar]
- Marriott, K.; Purchase, H.; Wybrow, M.; Goncu, C. Memorability of Visual Features in Network Diagrams. IEEE Trans. Vis. Comput. Graph. 2012, 18, 2477–2485. [Google Scholar] [CrossRef]
- McGrath, C.; Blythe, J.; Krackhardt, D. The Effect of Spatial Arrangement on Judgments and Errors in Interpreting Graphs. Soc. Netw. 1997, 19, 223–242. [Google Scholar] [CrossRef]
- Chen, M.; Ouyang, J.; Jian, A.; Liu, J.; Li, P.; Hao, Y.; Gong, Y.; Hu, J.; Zhou, J.; Wang, R.; et al. Imperceptible, Designable, and Scalable Braided Electronic Cord. Nat. Commun. 2022, 13, 7097. [Google Scholar] [CrossRef]
- Kypridemou, E.; Zito, M.; Bertamini, M. The Effect of Graph Layout on the Perception of Graph Properties. In Proceedings of the 22th Eurographics Conference on Visualization, Norrköping, Sweden, 25 May 2020; pp. 15–20. [Google Scholar]
- Hao, Y.; Hu, L.; Chen, M. Joint Sensing Adaptation and Model Placement in 6G Fabric Computing. IEEE J. Sel. Areas Commun. 2023, 41, 2013–2024. [Google Scholar] [CrossRef]
- Ham, F.V.; Rogowitz, B. Perceptual Organization in User-generated Graph Layouts. IEEE Trans. Vis. Comput. Graph. 2008, 14, 1333–1339. [Google Scholar]
- Rahman, R.A.; Sommer, W. Seeing What We Know and Understand: How Knowledge Shapes Perception. Psychon. Bull. Rev. 2008, 15, 1055–1063. [Google Scholar] [CrossRef]
- Lupyan, G. Objective Effects of Knowledge on Visual Perception. J. Exp. Psychol. Hum. Percept. Perform. 2017, 43, 794–806. [Google Scholar] [CrossRef] [PubMed]
- Saxena, A.; Iyengar, S. Centrality Measures in Complex Networks: A Survey. arXiv 2020. [Google Scholar] [CrossRef]
- Zhao, Y.; Yang, K.; Chen, S.; Zhang, Z.; Huang, X.; Li, Q.; Ma, Q.; Luan, X.; Fan, X. A Benchmark for Visual Analysis of Insider Threat Detection. Sci. China Inf. Sci. 2022, 65, 199102. [Google Scholar] [CrossRef]
- Zhao, Y.; Zhao, X.; Chen, S.; Zhang, Z.; Huang, X. An Indoor Crowd Movement Trajectory Benchmark Dataset. IEEE Trans. Reliab. 2021, 70, 1368–1380. [Google Scholar] [CrossRef]
- Zhao, Y.; Shi, J.; Liu, J.; Zhao, J.; Zhou, F.; Zhang, W.; Chen, W. Evaluating Effects of Background Stories on Graph Perception. IEEE Trans. Vis. Comput. Graph. 2022, 28, 4839–4854. [Google Scholar] [CrossRef] [PubMed]
- Burch, M.; Brinke, K.B.t.; Castella, A.; Peters, G.K.S.; Shteriyanov, V.; Vlasvinkel, R. Dynamic Graph Exploration By Interactively Linked Node-Link Diagrams and Matrix Visualizations. Vis. Comput. Ind. Biomed. Art 2021, 4, 23. [Google Scholar] [CrossRef]
- Cauteruccio, F.; Terracina, G. Extended High-Utility Pattern Mining: An Answer Set Programming-Based Framework and Applications. Theory Pract. Log. Program. 2023, 1, 1–31. [Google Scholar] [CrossRef]
Figure 1.
Illustration of data lineage graphs in which data tables are represented as blue nodes, data jobs as green nodes, and data lineage relationships between them are depicted as gray arrows with the direction indicating the data transformation direction. (a) Toy case of data lineages and (b) a real-world data lineage graph containing 49 data tables, 30 data jobs, and 109 data transformation relationships.

Figure 2.
Illustrations of UI1 and UI2 using DLG1 and DLG6. The dashed circles indicate various regions of graphs. (a) DLG1 is a data lineage graph that consists of 92 data assets and their 111 corresponding data transformation relationships in the Cloud Infrastructure scenario. (b) DLG6 is a data lineage graph that consists of 144 data assets and their 187 corresponding data transformation relationships in the Customer Service scenario.

Figure 3.
Illustrations of UI3 and UI4 using DLG2 and DLG10. (a) DLG2 is a data lineage graph that consists of 94 data assets and their 141 corresponding data transformation relationships in the Cloud Infrastructure scenario. (b) DLG10 is a data lineage graph that consists of 74 data assets and their 99 corresponding data transformation relationships in the Operation Analysis scenario.

Figure 4.
Illustrations of UI5 using DLG3. DLG3 is a data lineage graph comprising 157 data assets and their 211 corresponding data transformation relationships.
Figure 4.
Illustrations of UI5 using DLG3. DLG3 is a data lineage graph comprising 157 data assets and their 211 corresponding data transformation relationships.

Figure 5.
Interface used in the user study. (a) The interface provided for the participants to complete tasks; (b) the interface in which a participant had completed the tasks in DLG1. The nodes highlighted in red are the nodes that the participants had selected.
Figure 5.
Interface used in the user study. (a) The interface provided for the participants to complete tasks; (b) the interface in which a participant had completed the tasks in DLG1. The nodes highlighted in red are the nodes that the participants had selected.


Table 1.
Basic information of the 10 data lineage graphs.
| Scenario | ID | Nodes | Edges | Core Data Asset |
|---|---|---|---|---|
| Cloud Infrastructure | DLG1 | 92 | 111 | 6 |
| DLG2 | 94 | 141 | 6 | |
| DLG3 | 157 | 211 | 8 | |
| DLG4 | 305 | 526 | 19 | |
| Customer Service | DLG5 | 100 | 149 | 7 |
| DLG6 | 144 | 185 | 10 | |
| DLG7 | 380 | 572 | 24 | |
| DLG8 | 90 | 122 | 6 | |
| Operation Analysis | DLG9 | 91 | 185 | 7 |
| DLG10 | 74 | 99 | 6 |
Table 2.
Identification results of 31 node centrality metrics.
| Node Centrality Metric | Precision | Recall |
|---|---|---|
| * Degree Centrality | 41% | 40% |
| Semi-Local Centrality | 26% | 25% |
| * LocalRank Centrality | 41% | 40% |
| ClusterRank Centrality | 19% | 18% |
| K-shell Decomposition Centrality | 26% | 24% |
| Closeness Centrality | 26% | 25% |
| Eccentricity | 18% | 17% |
| * Flow Betweenness Centrality | 45% | 44% |
| Shortest Path Betweenness Centrality | 28% | 27% |
| Random Walk Betweenness Centrality | 30% | 29% |
| * Information Centrality | 43% | 42% |
| Katz Centrality | 13% | 12% |
| Routing Betweenness Centrality | 14% | 13% |
| Communicability Centrality | 15% | 14% |
| Harmonic Centrality | 20% | 19% |
| Local Research Centrality | 20% | 19% |
| Subgraph Centrality | 16% | 14% |
| Traffic Load Centrality | 14% | 13% |
| Percolation Centrality | 23% | 22% |
| Shortest Path of Node Deletion | 22% | 22% |
| Spanning Tree of Node Deletion | 20% | 19% |
| Node Contraction | 26% | 25% |
| Residual Closeness Centrality | 0% | 0% |
| * PageRank | 28% | 27% |
| * Eigenvector Centrality | 40% | 39% |
| H-index | 18% | 17% |
| HITs | 14% | 13% |
| Automatic Resource Compilation | 23% | 22% |
| Cumulative Nomination | 25% | 24% |
| * LeaderRank | 28% | 27% |
| SALSA | 12% | 11% |
Table 3.
Questions of the subjective questionnaire used in the field study and rating results by data users.
Table 3.
Questions of the subjective questionnaire used in the field study and rating results by data users.
| Questions | Rating Results | ||||||||
|---|---|---|---|---|---|---|---|---|---|
| Reference Method | Our Method | ||||||||
| Manager | Expert A | Expert B | Expert C | Manager | Expert A | Expert B | Expert C | ||
| Usability | 1. Can you quickly learn the method? | 2 | 2 | 3 | 2 | 4 | 4 | 4 | 5 |
| 2. Can you master the method without specific knowledge? | 2 | 2 | 2 | 2 | 5 | 5 | 5 | 5 | |
| 3. Do you think the method is easy to use? | 4 | 3 | 3 | 4 | 4 | 4 | 4 | 4 | |
| Effectiveness | 4. Can you use the method to identify enough core data assets? | 3 | 3 | 3 | 3 | 4 | 4 | 4 | 4 |
| 5. Can you use the method to quickly identify core data assets? | 2 | 3 | 3 | 3 | 5 | 4 | 4 | 4 | |
| 6. Can you identify core assets in various scenarios? | 1 | 3 | 2 | 2 | 4 | 4 | 4 | 5 | |
| Satisfaction | 7. How satisfied are you with this method overall? | 3 | 3 | 3 | 4 | 3 | 4 | 3 | 3 |
| 8. Does this method support your daily work? | 3 | 3 | 3 | 3 | 3 | 3 | 3 | 3 | |
| 9. Are you satisfied with the way the data are presented? | 3 | 3 | 4 | 4 | 4 | 4 | 4 | 4 | |
Disclaimer/Publisher’s Note: The statements, opinions and data contained in all publications are solely those of the individual author(s) and contributor(s) and not of MDPI and/or the editor(s). MDPI and/or the editor(s) disclaim responsibility for any injury to people or property resulting from any ideas, methods, instructions or products referred to in the content. |
© 2023 by the authors. Licensee MDPI, Basel, Switzerland. This article is an open access article distributed under the terms and conditions of the Creative Commons Attribution (CC BY) license (https://creativecommons.org/licenses/by/4.0/).
Share and Cite
MDPI and ACS Style
Chen, Y.; Zhao, Y.; Xie, W.; Zhai, Y.; Zhao, X.; Zhang, J.; Long, J.; Zhou, F. An Empirical Study on Core Data Asset Identification in Data Governance. Big Data Cogn. Comput. 2023, 7, 161. https://doi.org/10.3390/bdcc7040161
AMA Style
Chen Y, Zhao Y, Xie W, Zhai Y, Zhao X, Zhang J, Long J, Zhou F. An Empirical Study on Core Data Asset Identification in Data Governance. Big Data and Cognitive Computing. 2023; 7(4):161. https://doi.org/10.3390/bdcc7040161
Chicago/Turabian StyleChen, Yunpeng, Ying Zhao, Wenxuan Xie, Yanbo Zhai, Xin Zhao, Jiang Zhang, Jiang Long, and Fangfang Zhou. 2023. "An Empirical Study on Core Data Asset Identification in Data Governance" Big Data and Cognitive Computing 7, no. 4: 161. https://doi.org/10.3390/bdcc7040161