
Distributed Bayesian Inference for Large-Scale IoT Systems
by
 , , , , and
Eleni Vlachou
1,
Aristeidis Karras
1,* ,
,
Christos Karras
1,* ,
,
Leonidas Theodorakopoulos
2,
Constantinos Halkiopoulos
2 and
and
Spyros Sioutas
1 1
Computer Engineering and Informatics Department, University of Patras, 26504 Patras, Greece
2
Department of Management Science and Technology, University of Patras, 26334 Patras, Greece
*
Authors to whom correspondence should be addressed.
Big Data Cogn. Comput. 2024, 8(1), 1; https://doi.org/10.3390/bdcc8010001
Submission received: 4 November 2023
/
Revised: 12 December 2023
/
Accepted: 15 December 2023
/
Published: 19 December 2023
Abstract
:In this work, we present a Distributed Bayesian Inference Classifier for Large-Scale Systems, where we assess its performance and scalability on distributed environments such as PySpark. The presented classifier consistently showcases efficient inference time, irrespective of the variations in the size of the test set, implying a robust ability to handle escalating data sizes without a proportional increase in computational demands. Notably, throughout the experiments, there is an observed increase in memory usage with growing test set sizes, this increment is sublinear, demonstrating the proficiency of the classifier in memory resource management. This behavior is consistent with the typical tendencies of PySpark tasks, which witness increasing memory consumption due to data partitioning and various data operations as datasets expand. CPU resource utilization, which is another crucial factor, also remains stable, emphasizing the capability of the classifier to manage larger computational workloads without significant resource strain. From a classification perspective, the Bayesian Logistic Regression Spark Classifier consistently achieves reliable performance metrics, with a particular focus on high specificity, indicating its aptness for applications where pinpointing true negatives is crucial. In summary, based on all experiments conducted under various data sizes, our classifier emerges as a top contender for scalability-driven applications in IoT systems, highlighting its dependable performance, adept resource management, and consistent prediction accuracy.
1. Introduction
The emergence of the Internet of Things (IoT) has marked the beginning of a significant era where the digital and physical worlds merge, leading to an extraordinary increase in both the amount and speed of data produced by interconnected devices. The Internet of Things (IoT) has emerged as a transformative force in contemporary society, substantially impacting various facets of daily life. This technology extends its influence across numerous sectors, significantly enhancing healthcare delivery, streamlining transportation systems, and facilitating the evolution of smarter urban environments. Nevertheless, the IoT ecosystem’s rapid expansion is accompanied by a significant increase in data generation, known as Big Data. This expansion presents a complex challenge, necessitating advanced, scalable, and efficient data processing techniques.
Current traditional methodologies often struggle to manage the enormity and real-time processing demands of data originating from IoT sources. This shortfall can lead to less effective decision-making processes and undermine the overall performance of IoT systems. The consequences of such inefficiencies in data management within IoT applications are extensive. They not only impede progress in critical infrastructure sectors but also constrain the broader scope of innovation, thus obstructing the full realization and benefits that IoT technology promises to deliver. Given the complex nature of large-scale data analysis in IoT systems, distributed Bayesian inference arises as a practical and efficient solution in this domain. Bayesian methods, which are influential in deriving informed conclusions and predictions from complex datasets, are widely recognized for their probabilistic underpinnings. An examination of these methodologies within a distributed computation framework tailored for the massive data systems of the Internet of Things is essential to this field of study.
The distributed implementation of Bayesian inference simplifies immense datasets into more manageable elements through the use of a systematic approach. The methodology functions within a decentralized framework, enabling the analysis of these segments simultaneously. The workflow commences with the dataset being segmented, subsequently undergoing parallel analysis on each segment. To achieve this goal, numerous algorithms have been developed, such as variational Bayesian (VB) and Markov chain Monte Carlo (MCMC) methods, which are specifically designed for distributed applications. These techniques, along with neural networks, Gaussian mixture models (GMMs), and generalized linear models (GLMs), have been applied to a wide variety of modelling scenarios. On the basis of theoretical and empirical research, the effectiveness of distributed Bayesian inference algorithms may be comparable to that of conventional, centralized methodologies. As supported by the results of several research studies in the respective domain [1,2,3,4], the algorithms under consideration demonstrate remarkable effectiveness in terms of both computational speed and statistical accuracy. These methodologies illustrate the efficacy of modern computational techniques in handling substantial amounts of data, producing accurate results that are computationally viable.
This study introduces a Distributed Bayesian Inference Classifier that has been methodically designed to address the unique difficulties associated with Internet of Things (IoT) systems operating on a large scale. The principal inquiries that direct our research are as follows: (a) To optimize the management of the substantial volumes of data produced by Internet of Things (IoT) devices, (b) what is the most efficient approach to disseminating Bayesian inference across extensive computational networks? (c) What are the performance metrics of the resultant distributed classifier, encompassing resource utilization efficiency, scalability, and accuracy?
To investigate these inquiries, we conduct an exhaustive empirical investigation in addition to a comprehensive theoretical analysis to evaluate the performance of our Distributed Bayesian Inference Classifier. The scalability of the system is assessed using datasets that span significant time intervals and faithfully depict the dynamic and heterogeneous nature of IoT data. Our evaluation primarily centers around several critical performance indicators (EPIs). These encompass classification accuracy, memory consumption, inference time, and CPU utilization. These metrics provide insight into the classifier’s capacity to process substantial quantities of data seamlessly. Recognizing the critical role that specificity plays in IoT applications, we place considerable emphasis on it as a fundamental element of our analysis. It is of utmost importance to precisely identify true negatives, as classification errors, specifically false positives, can yield substantial consequences in practical Internet of Things situations and implementations.
Our primary objective in this study was to make a substantial contribution to the expanding domains of Big Data and the Internet of Things (IoT). Our objective is to improve the capabilities of IoT systems by creating a scalable and efficient solution for data management and analysis. The result will enable these systems to achieve higher levels of intelligence and self-sufficiency. Moreover, our approach not only presents new opportunities for future research into enhancing the management of data in the Internet of Things but also has impacts across a broader range of academic areas. The proposed advancements in distributed inference systems could have significant implications for various critical domains such as machine learning, distributed computation, and data analytics. This highlights the wide-ranging potential influence that our research may have.
The organization of our paper is methodical, allowing for a coherent exposition of our findings. Following this introduction, Section 2 reviews relevant literature on Bayesian inference within distributed frameworks and the Big Data challenges typical to IoT systems. Section 3 outlines the foundational concepts of the Distributed Bayesian Inference Classifier, detailing its computational framework and the Bayesian principles it is based on. Section 4 describes the experimental setup, specifying the datasets used and the metrics established for performance evaluation. Section 5 offers a detailed analysis of the results, emphasizing the classifier’s capability to efficiently manage large datasets. Finally, Section 6 concludes the paper, summarising our research findings and suggesting directions for future exploration in this area.
2. Background and Related Work
Distributed Bayesian inference is becoming increasingly well-known within the domain of the Internet of Things (IoT), mainly because of its wide-ranging applications in object classification, target monitoring, and medical diagnosis, among others. Since the majority of IoT systems are distributed and operate with constrained resources, critical information is likely to be stored on a limited number of nodes at any given time. Therefore, for effective inference, the notion of Information-Driven Distributed Sensing (IDDS) assumes paramount importance, as it directs the allocation of resources toward the detection and transmission of valuable data [5].
There exists a multitude of studies dedicated to distributed Bayesian inference in IoT ecosystems [5]. An example of such research is the development of a centralized (C-IDDS) and distributed (D-IDDS) algorithm that utilizes exponential family distributions to facilitate efficient Bayesian inference. Both are online algorithms, characterized by their adaptability to stochastic system conditions without foreknowledge. The researchers demonstrated, through a detailed theoretical evaluation, that these proposed algorithms deliver an asymptotically optimal system-wide utility. This theoretical proposition was further substantiated by real-world testing on an established testbed.
Another study delves into the opportunities and challenges associated with approximate Bayesian deep learning for smart IoT frameworks [6]. The authors propose potential solutions to mitigate model storage requirements and enhance computational scalability, such as model pruning and distillation methods. Additionally, the study underscored the significance of Bayesian inference as a theoretical base for developing uncertainty-aware, robust deep learning-centric intelligent IoT systems.
A different study presents a pragmatic approach that identifies removable connections in ResNet without considerably affecting the model’s efficacy, facilitating distribution in scenarios with resource constraints. This outcome forms the basis for formulating a multi-objective optimization problem focused on latency minimization and accuracy maximization considering the available resources [7]. The experimental results indicate that an adaptable ResNet architecture can diminish shared data, energy consumption, and latency during distribution while preserving high accuracy.
Lastly, a research paper proposes ApDeepSense, an efficient and effective method for deep learning uncertainty estimation suitable for resource-limited IoT devices [8]. ApDeepSense estimates output uncertainty by utilizing an implicit Bayesian approximation that correlates neural networks with deep Gaussian processes. It was shown that the implementation of an innovative layer-wise approximation approach, as opposed to traditional sampling-based methods that require significant computational resources for uncertainty estimation, can significantly decrease the execution time and energy usage associated with uncertainty estimation.
The utilisation of distributed Bayesian inference is crucial for enabling intelligent inference in Internet of Things (IoT) systems. In a variety of scholarly articles, algorithms and methodologies to enhance the scalability and effectiveness of Bayesian inference in IoT systems have been proposed. These encompass methodologies such as approximate Bayesian deep learning, adaptive ResNet architecture, and deep learning uncertainty estimation [9].
The field of the Internet of Things (IoT) has experienced a notable transition in recent times towards the implementation of distributed Bayesian inference to improve the scalability of systems, as evidenced by numerous research initiatives. Ullah et al. emphasize the notion of context-aware Bayesian inference in an innovative manner. By integrating multi-sensor data, the aforementioned approach generates a reliable and precise inference model, thereby streamlining the integration of vast quantities of data from various origins [10]. Meanwhile, the work in [11] presents a novel methodology for implementing decentralized data flows in the Internet of Things (IoT) systems through the utilization of DX-MAN semantics. Through the reduction of intricate data transmission control among numerous coordinating entities, this approach substantially enhances the overall efficiency of the system.
In order to address the complexities associated with distributed co-simulation in cloud environments particularly for IoT systems, [12], employs domain-specific languages and CoHLA. This methodology enhances the management of vast amounts of IoT data and streamlines cloud-based simulations through adherence to HLA and FMI standards [12]. Quasi-Deterministic Transmission Policy (QDTP) is suggested by [13] as a potential resolution to the Massive Access Problem (MAP) associated with the Internet of Things. By utilizing QDTP, a methodology based on diffusion analysis, the likelihood of missing crucial data deadlines is effectively diminished, thereby enhancing the dependability and efficacy of Internet of Things systems. Based on the results of previous research, Internet of Things systems may be made much more functional and scalable by using strategic techniques, such as distributed Bayesian inference.
A detailed analysis of the difficulties of applying distributed Bayesian inference to large-scale Internet of Things systems as in [14] reveals several important variables. The study highlights that the variety of IoT data sources is a key obstacle. A suggested analytical framework with two tiers is designed to handle data obtained from the Internet of Things, considering the challenges discussed in [15]. This strategy effectively reduces the existing uncertainty by incorporating detailed events into Bayesian networks. In another interesting work related to the security in distributed Internet of Things (IoT) systems, the authors provide a novel perspective on this domain and countermeasures as they developed and introduced a set of methodologies to guarantee secure distributed inference [16]. Ultimately, ref. [17] presents an alternative method that employs a trust model grounded on Bayesian decision theory.
2.1. Bayesian Inference in Wireless Sensor Networks
Bayesian inference-based wireless sensor networks (WSNs) help people make decisions faster and get around problems. Studies show that WSN is used to find outliers, find and fix faults, find the cause of a problem, and figure out how much trust to put in something. A study in [18] shows that Bayesian reasoning could improve the performance of wireless sensor networks by finding and solving problems. When sensor readings are checked and fixed, WSN data are more accurate and reliable. Using the Bayesian method, new sensor data can be used to test theories and figure out how unclear something is. This makes sure that mistakes are found and fixed correctly, which protects network data.
In another study [19], it was discovered that Bayesian reasoning is needed to find outliers in Wireless Sensor Networks (WSNs). Bayesian inference networks find parts of sensor data that depend on each other in certain situations. Bayesian networks that show how sensor measures are connected make it possible for technology to find data points that do not fit with expected trends. Bayesian inference uses statistical reasoning and the network of sensor characteristics that are linked to figure out how likely it is that an observation is not normal. This system needs to work well to find problems that could be caused by monitors that are not working correctly or strange conditions in the surroundings. Also, ref. [20] discovered that Bayesian reasoning is very important for making network nodes believe each other in Wireless Sensor Networks (WSN). Bayesian fusion lets us figure out how reliable a network node is by combining different trust factors. The program analyses and includes trust data, including uncertainty from various trust characteristics. Sensor data, previous knowledge, and statistical models are used in Bayesian inference to synthesize information. This association helps provide accurate evaluations.
The results of our investigation strongly demonstrate the feasibility of using Bayesian inference in large-scale Internet of Things infrastructures. An effective method to improve the efficiency of implementing the Bayesian inference process is by using PySpark, a Python package particularly built for distributed computing. PySpark can handle large amounts of data produced by IoT-connected devices. Moreover, in addition to the aforementioned capabilities, it facilitates system optimization, anomaly detection, real-time decision-making, and defect tolerance. Through the utilization of PySpark’s scalable and distributed architecture, it becomes viable to perform Bayesian inference on computing clusters, concurrently analyze data produced by the Internet of Things (IoT), and effectively manage the substantial resources necessary for the deployment of large-scale IoT systems.
2.2. Apache Hadoop
The groundbreaking contributions of Doug Cutting and Mike Cafarella were primarily responsible for the establishment of Apache Hadoop in 2006, which constituted a significant milestone in the field of data processing. The principal deliverable of the group was the conception and execution of the groundbreaking distributed file system Hadoop Distributed File System (HDFS). Hard Disc Foundation Stream (HDFS) was intentionally engineered to operate as a centralized repository, overseeing the management of every worker node—including the input data, intermediate outputs, and final outputs of the MapReduce framework. Hadoop gained the ability to process and distribute data in real-time as a result of the expansion of its functionalities made possible by the implementation of this novel data storage methodology. Furthermore, the inventive architecture of HDFS streamlines the initiation phase of MapReduce processes by facilitating the prompt retrieval of vital data by worker nodes. The proposed architectural decision significantly enhances the system’s performance and scalability, as well as the data management efficiency within the Hadoop ecosystem.
Significant enhancements to the administration of malfunctioning nodes were implemented as an additional noteworthy consequence of the HDFS architectural framework. The system is additionally fitted to facilitate prompt data recovery and task redistribution to other operational personnel in the case of a node failure. In addition to its high efficiency, the HDFS infrastructure facilitates the smooth incorporation or removal of worker nodes while MapReduce tasks are being executed. As Apache Hadoop’s evolution unfolded, its capabilities were further enhanced, incorporating support for Apache Spark’s distributed software. Once again, the HDFS was leveraged as a unified memory space for handling input, output, and intermediary data (Apache Hadoop). Such unwavering commitment to continual innovation and enhancement fortifies Apache Hadoop’s position as a leading entity in the realm of big data management and processing.
2.3. Spark
Apache Spark is a distinguished distributed data processing framework, developed under the Apache umbrella. Initiated in 2009 by Matei Zaharia and his team, it formally became a part of the Apache Software Foundation in 2013.
Spark was conceptualized to overcome some of the challenges posed by the MapReduce model, an earlier computational model in distributed data processing. One of the main challenges faced by MapReduce was its reliance on disc storage for the storage of intermediate data on worker nodes. This dependence led to considerable latency, especially in situations involving real-time data streams. This latency was caused by the employee’s reliance on routine data transfers between their main memory and disc. Furthermore, the MapReduce design introduced execution delays for reduced functions, which hindered the framework’s capacity to attain optimal parallelism for specific tasks. Spark integrates robust distributed datasets (RDDs), which are data structures that have been carefully engineered to optimize worker nodes’ utilization of random-access memory (RAM). RDDs are fundamental constituents of the architecture of Spark. A multitude of significant advantages are offered by RDDs due to their memory-centric design. The advantages encompass accelerated processing, heightened parallelism, and the capacity to manage and transmit real-time data, in addition to the capability to process large data sets. By expediting the processing of immense quantities of data, the implementation of this novel approach to optimizing data structure design increases the efficacy of data processing endeavors. RDDs play a vital role in mitigating the intricacies linked to big data processing by effectively overseeing both batch and real-time data processing. This underscores their importance within the Spark ecosystem.
Although Spark and MapReduce are both capable of functioning on the Hadoop Distributed File System (HDFS), their respective environments are solely examined in the context of this study. This focus, however, suggests potential avenues for future explorations in integrating both architectures to optimize large-scale data management.
3. Methodology
3.1. Objectives and Contributions
The primary aim of our study is to thoroughly assess the scalability of the EVCA Classifier [21], an innovative MCMC classifier that combines Bayesian machine learning and Apache Spark for distributed data analysis. Here, we focus on evaluating its ability to maintain high accuracy and efficiency while accommodating various test set sizes, showcasing its adaptability and robustness in practical applications. By analyzing diverse test set volumes, we aim to prove EVCA’s suitability for handling large, complex datasets, along with the dynamic nature of distributed IoT data.
This experiment directly addresses our concern about the effective distribution of Bayesian inference across computational networks to process the immense data influx arising from IoT devices. Our research sheds light on the potential of this classifier in the domains of big data management and environmental data analysis, with broader implications not only in academic fields like statistics, mathematics, and physics but also in real-world scenarios where the need for correct True Negative prediction is extremely important.
3.2. Tools and Technologies Used
For the processing of the data used, the implementation of the classification models used, along with their evaluation we have utilized a variety of Python and Apache Spark libraries:
- Pyspark:
- Spark’s Python API that simplifies distributed data analysis and Machine Learning tasks.
- Spark SQL: A programming interface for structured and semi-structured data management with SQL-like syntax. In our research, it has been used for data preprocessing and manipulation.
- Spark MLlib: Library for development of scalable machine learning models. Here we have utilized its built-in Logistic Regression algorithms, along with its predefined classification metrics.
Here we set the master URL to run the Spark application in local mode, utilizing all available cores on the machine for parallel processing. The memory allocation for the driver program and executors are both set to 5 gigabytes. Lastly, we determine the number of cores assigned to each executor, allocating 6 cores for our application. These configuration settings ensure efficient execution and utilization of computational resources. - nupmy:
- Provides the necessary tools and functionalities to efficiently implement the numerical computations involved in Bayesian Logistic Regression, such as array operations.
- pymc3:
- High-level intuitive interface for probabilistic programming in Python [22].
- pandas:
- High-performance data manipulation and analysis tool for structured data. Here it is used to handle the data and allow for use with other libraries for scientific computing and machine learning.
- matplotlib:
- Used to visualise data.
- scikit-learn:
- Used to obtain classification metrics when working with pandas data frame and predictions with numpy.
- psutil:
- Used to retrieve system information, such as CPU and Memory Usage.
- time:
- Used to compute Inference time for each test set and Classification method.
3.3. Study Limitations
The limitations of our current study are primarily rooted in the compatibility challenges between PyMC and PySpark. Our research heavily relies on MCMC sampling, a fundamental Bayesian Inference tool, to make accurate predictions and classifications. The integration of these components into PySpark presented inherent obstacles. As a result, we had to think of an alternative approach, wherein we defined, trained, and generated the MCMC sample trace using a combination of pandas data frames, numpy, and PyMC. This trace was then stored and loaded into the PySpark environment, where it was utilized to make predictions. While this workaround allowed us to conduct our study effectively, it underscores a significant limitation in the current state of distributed machine learning technology and Apache Spark for Bayesian machine learning using MCMC sampling techniques.
3.4. Data Collection and Cleaning
This analysis utilizes a dataset that spans from January 2001 to April 2018, encompassing hourly air pollutant concentration data for Spain’s capital, Madrid. The data are publicly accessible through Madrid’s Open Data website and Kaggle [23,24]. Analyzing this dataset holds significant practical and environmental relevance, as Madrid is among the European cities with the poorest air quality and a notably high mortality rate associated with nitrogen dioxide and carbon monoxide [25]. This underscores the imperative need to enhance air quality, beginning with a comprehensive understanding through data analysis.
The dataset is structured into separate CSV files, each dedicated to a specific year, and it contains information about various air pollutants. These pollutants consist of Sulfur Dioxide—SO, Carbon Monoxide—CO, Nitrogen Dioxide—NO, Particles smaller than 2.5 m—PM, Particles smaller than 10 m—PM, O (ozone), Toluene—TOL, Benzene—BEN, Ethylbenzene—EBE, Total Hydrocarbons—TCH, and Non-methane hydrocarbons or volatile organic compounds—NMHC. These data points originate from 18 measurement stations located across Madrid, with each station’s readings forming columns within the respective files. The aforementioned contaminants are measured using a variety of techniques, including fluorescence, infrared spectroscopy, chemiluminescence, and microbalances, which frequently employ sensors and other Internet of Things methodologies [26].
These pollutants play a critical role in the computation of the Air Quality Index (AQI) for a specific hour, which is a vital tool for evaluating the health consequences of air pollution. Numerous factors, including pollution sources and vehicular traffic, are susceptible to the sensitivity of this index, which is derived from air quality sensor data. The European Environment Agency classifies air quality into six discrete grade levels. The aforementioned levels span a spectrum from “excellent” to extremely poor”, as illustrated in Table 1. These levels are determined by analyzing the concentrations of particulate matter (PM), sulphur dioxide (SO), nitrogen dioxide (NO2), and PM2.5. Through the utilization of this categorization framework, individuals are empowered to augment their understanding of air quality and render informed judgments that protect the welfare of the general public. One can obtain a precise depiction of the health hazards linked to the air quality in a specific area by ascertaining the air quality classification through the utilization of the highest recorded value of the pollutants in question. This information must be utilized to inform efforts to mitigate the negative health effects associated with air pollution; thus, strict adherence to European standards for the index cannot be overstated.
We implemented the PySpark.sql and PySpark.mllib modules of the PySpark framework to facilitate the data compilation process. Absent values were managed with extreme care to detail during the preparatory phase by employing time-based interpolation as a technique. Despite the atypical sampling intervals employed, this approach was indispensable in maintaining the dataset’s integrity and accuracy. To achieve a comprehensive understanding and analysis of the evolution of air quality trends during a specified time period, it was essential that the data’s inherent temporal patterns be preserved.
An additional column, designated AQI_Index, was affixed to each document to classify them in accordance with the Air Quality Index (AQI) associated with the most severe level of five different pollutants. An additional column denoted as AQI_GenPop_Index, was incorporated to symbolize binary AQI values that indicate the suitability of the air quality for the general population. We addressed outliers within pollutant columns using the interquartile range (IQR) technique, considering the data’s skewed nature. Conclusively, we employed z-score normalization on the pollutant columns to standardize their measurements, ensuring a mean of 0 and a standard deviation of 1. Subsequently, we performed sampling to create datasets equivalent to 1 year, 3 years, 6 years, 9 years, 12 years, and 15 years from the preprocessed data. The one-year sample was designated as the training set, while the remaining six subsets were employed for testing (as shown in Table 2, Table 3 and Table 4).
3.5. Experiment
The EVCA Classifier implements Bayesian Logistic Regression with MCMC sampling to classify AQI safety categories into “safe” or “hazardous” and the Apache Spark environment is then used to scale up the analysis for larger datasets. Unlike traditional logistic regression, which relies on a fixed set of parameters and assumes complete and accurate data, this classifier uses a probabilistic approach to combine prior beliefs with observed data to produce a posterior distribution of parameters. This allows for more robust and flexible modeling, reduced overfitting, and improved prediction accuracy. It also estimates uncertainty, present in real-world data, which is important in high-consequence decision-making.
In [21], the model is trained using a small data frame from 2017 and then tested on data from all eighteen years. Then, the same test and train sets are used to perform Frequentist Logistic regression in Spark. The results show that the frequentist and Bayesian logistic regression models have similar metrics for the specific data; however, the Bayesian model performs better in terms of the recall/specificity metric. It predicts fewer false negatives and positives, making it more effective at identifying true negative values, thus ensuring that the AQI is not misclassified as safe. This suggests that Bayesian machine learning can be a useful tool for environmental data analysis, particularly in high-consequence decision-making scenarios where uncertainty needs to be taken into account.
To assess EVCA’s scalability, we train the model using the data of the one-year subset and perform MCMC sampling to obtain a trace which is then used to make predictions using Pyspark, similarly as in [21]. Here, the classifier’s performance is tested across different time intervals, specifically 3, 6, 9, 12, 15, and 18 years. The classifier is assessed for a decision threshold set at 0.505, which is noted to be an ideal threshold as shown in [21].
For each of the test subsets, the experiment records a set of classification metrics, including accuracy and recall/specificity(as the cost of false negatives is very high in this case). This will help us determine the classification efficacy of our model, regardless of the volume of data handled. Our experimental approach is also designed to comprehensively evaluate the classifier’s performance across the different-sized subsets, considering inference time, memory usage, and CPU utilization. These metrics are directly aligned with our objectives, as they enable a thorough assessment of the EVCA classifier’s capability to distribute Bayesian Inference across extensive computational networks for large-scale IoT data processing. The experiment is repeated for two comparison scenarios:
- a
- The Bayesian classifier’s performance is assessed in two different environments: one using Pyspark and another using the Numpy and Pandas libraries, likely to compare the performance of different implementations.
- b
- Bayesian vs. Frequentist Logistic Regression Classifier using Pyspark: comparison of the performance of the Bayesian logistic regression classifier with the frequentist logistic regression classifier, both implemented using Pyspark.
4. Results and Analysis
Scalability analysis is fundamental in machine learning, as it assesses the performance and efficiency of models or algorithms when faced with larger data sizes, increased computational resources, or more complex problems. Given the substantial variations in real-world datasets and the escalating computational demands associated with such highly-detailed problem scenarios, achieving scalability is key, in order to ensure the reliability and efficiency of machine learning systems. In this study, we conducted a comprehensive scalability analysis to assess the ability of our Classifier to handle varying data sizes and computational resources. The analysis primarily examined two critical elements: the ability to scale data and to scale computation.
To assess the robustness of the model, we conducted experiments utilizing unseen data of different sizes to ascertain whether it could effectively manage extensive and heterogeneous testing sets without experiencing a decline in performance. The model’s architecture is founded upon the Markov Chain Monte Carlo (MCMC) Classifier, a technique that guarantees optimal memory and computational resource allocation while managing substantial quantities of data. The performance metrics and outcomes of these assessments are detailed in Table 2.
Moreover, our principal objective was to evaluate the computational scalability of our system. This required an evaluation of the system’s capability to effectively employ augmented computational resources. We implemented PySpark to facilitate the distribution of the computational burden and the efficient execution of parallel computing strategies by classifying newly acquired test data. This methodology was instrumental in maximizing resource utilization, particularly when larger test datasets and computationally demanding assignments were encountered. In Table reftab:bayes-pandas, a comparison between this method and a model evaluated with pandas and numpy is detailed. This comparison highlights the disparities in efficacy and resource consumption between the two methodologies.
4.1. Data Scalability
- Inference Time:
- The evaluation of the scalability of our classifier commences with a comprehensive analysis of the Inference Time across a multitude of test sets. It is noteworthy to mention that the prediction times exhibit consistency, notwithstanding fluctuations in the test sets’ dimensions or composition. The aforementioned consistency underscores the effectiveness of the classifier in handling a wide range of data scenarios. The duration values for the 12-year and 9-year test sets are 60.44 ms and 81.02 ms, respectively. The consistent and efficient performance of the classifier is underscored by the negligible fluctuation in execution time, which is independent of the test set’s magnitude. When assessing scalability, the classifier’s capacity to sustain comparatively consistent prediction durations is an essential criterion. This finding suggests that the classifier exhibits satisfactory performance when evaluated on more extensive datasets, without experiencing a significant duration increase in execution.
- Memory Usage:
- As shown by the data in Table 2, memory consumption rises in direct proportion to the size of the test set. This finding is in line with anticipated outcomes, considering that more memory is needed to store and process larger datasets. However, it is crucial to acknowledge that the growth in memory usage does not exhibit a direct proportionality to the test set’s size. To provide an example, the increase in memory usage from 645 MB to 860.2 MB is significantly less noticeable than the corresponding increase of 430.0 MB in the size of the test set. The data quantity exhibits a nonlinear arithmetic relationship with the observed trends in memory utilization. This indicates that the correlation is being affected by factors other than the amount of data. It may be inferred from this that factors like model complexity and execution details could impact memory needs.When working with large amounts of data, using PySpark for machine learning and classification might lead to memory usage issues. Spark is able to do this by dividing the data into smaller, more manageable pieces, which allows for distributed processing over a vast network of computers. The demands on processing and memory storage grow in proportion to the size of the dataset since more segments are formed as the dataset grows in size. Additionally, Spark’s memory usage is affected by the many data operations and transformations it does. It must be recognized that the amount of data written does not always correlate directly with the rise in memory use. This variety sometimes results from the convergence of several factors, including the complexity of the model used and the specific nuances of its implementation.
- CPU Usage:
- Examining the CPU usage across test sets of different sizes is crucial for assessing our classifier’s performance. Our primary finding implies that CPU utilization remains relatively constant across different sizes of test sets. Computing power consumption is reliably efficient, as shown by the CPU utilization percentages ranging from 0.29 to 5.8% in the 15-year and 9-year test sets. No matter how much the test data becomes, our classifier’s CPU use stays the same. This indicates that it efficiently employs the available processing power without experiencing a substantial escalation in resource requirements. Thus, it is well-suited for scalability in computational systems where efficient resource utilization is extremely important.
- Classification Metrics:
- The classification metrics reveal consistent performance across different test set sizes. The accuracy ranges from 0.878833 to 0.8791466, indicating a robust and stable classifier. Also, the specificity across the different test sets remains constant at a nearly perfect value of 0.995. These metrics (accuracy, precision, etc.) demonstrate EVCA’s ability to handle varying data volumes while maintaining reliable and accurate predictions. This highlights the scalability of the classifier, accommodating diverse data sizes while accounting for inherent uncertainties.
Comparison to Classic Logistic Regression in Pyspark
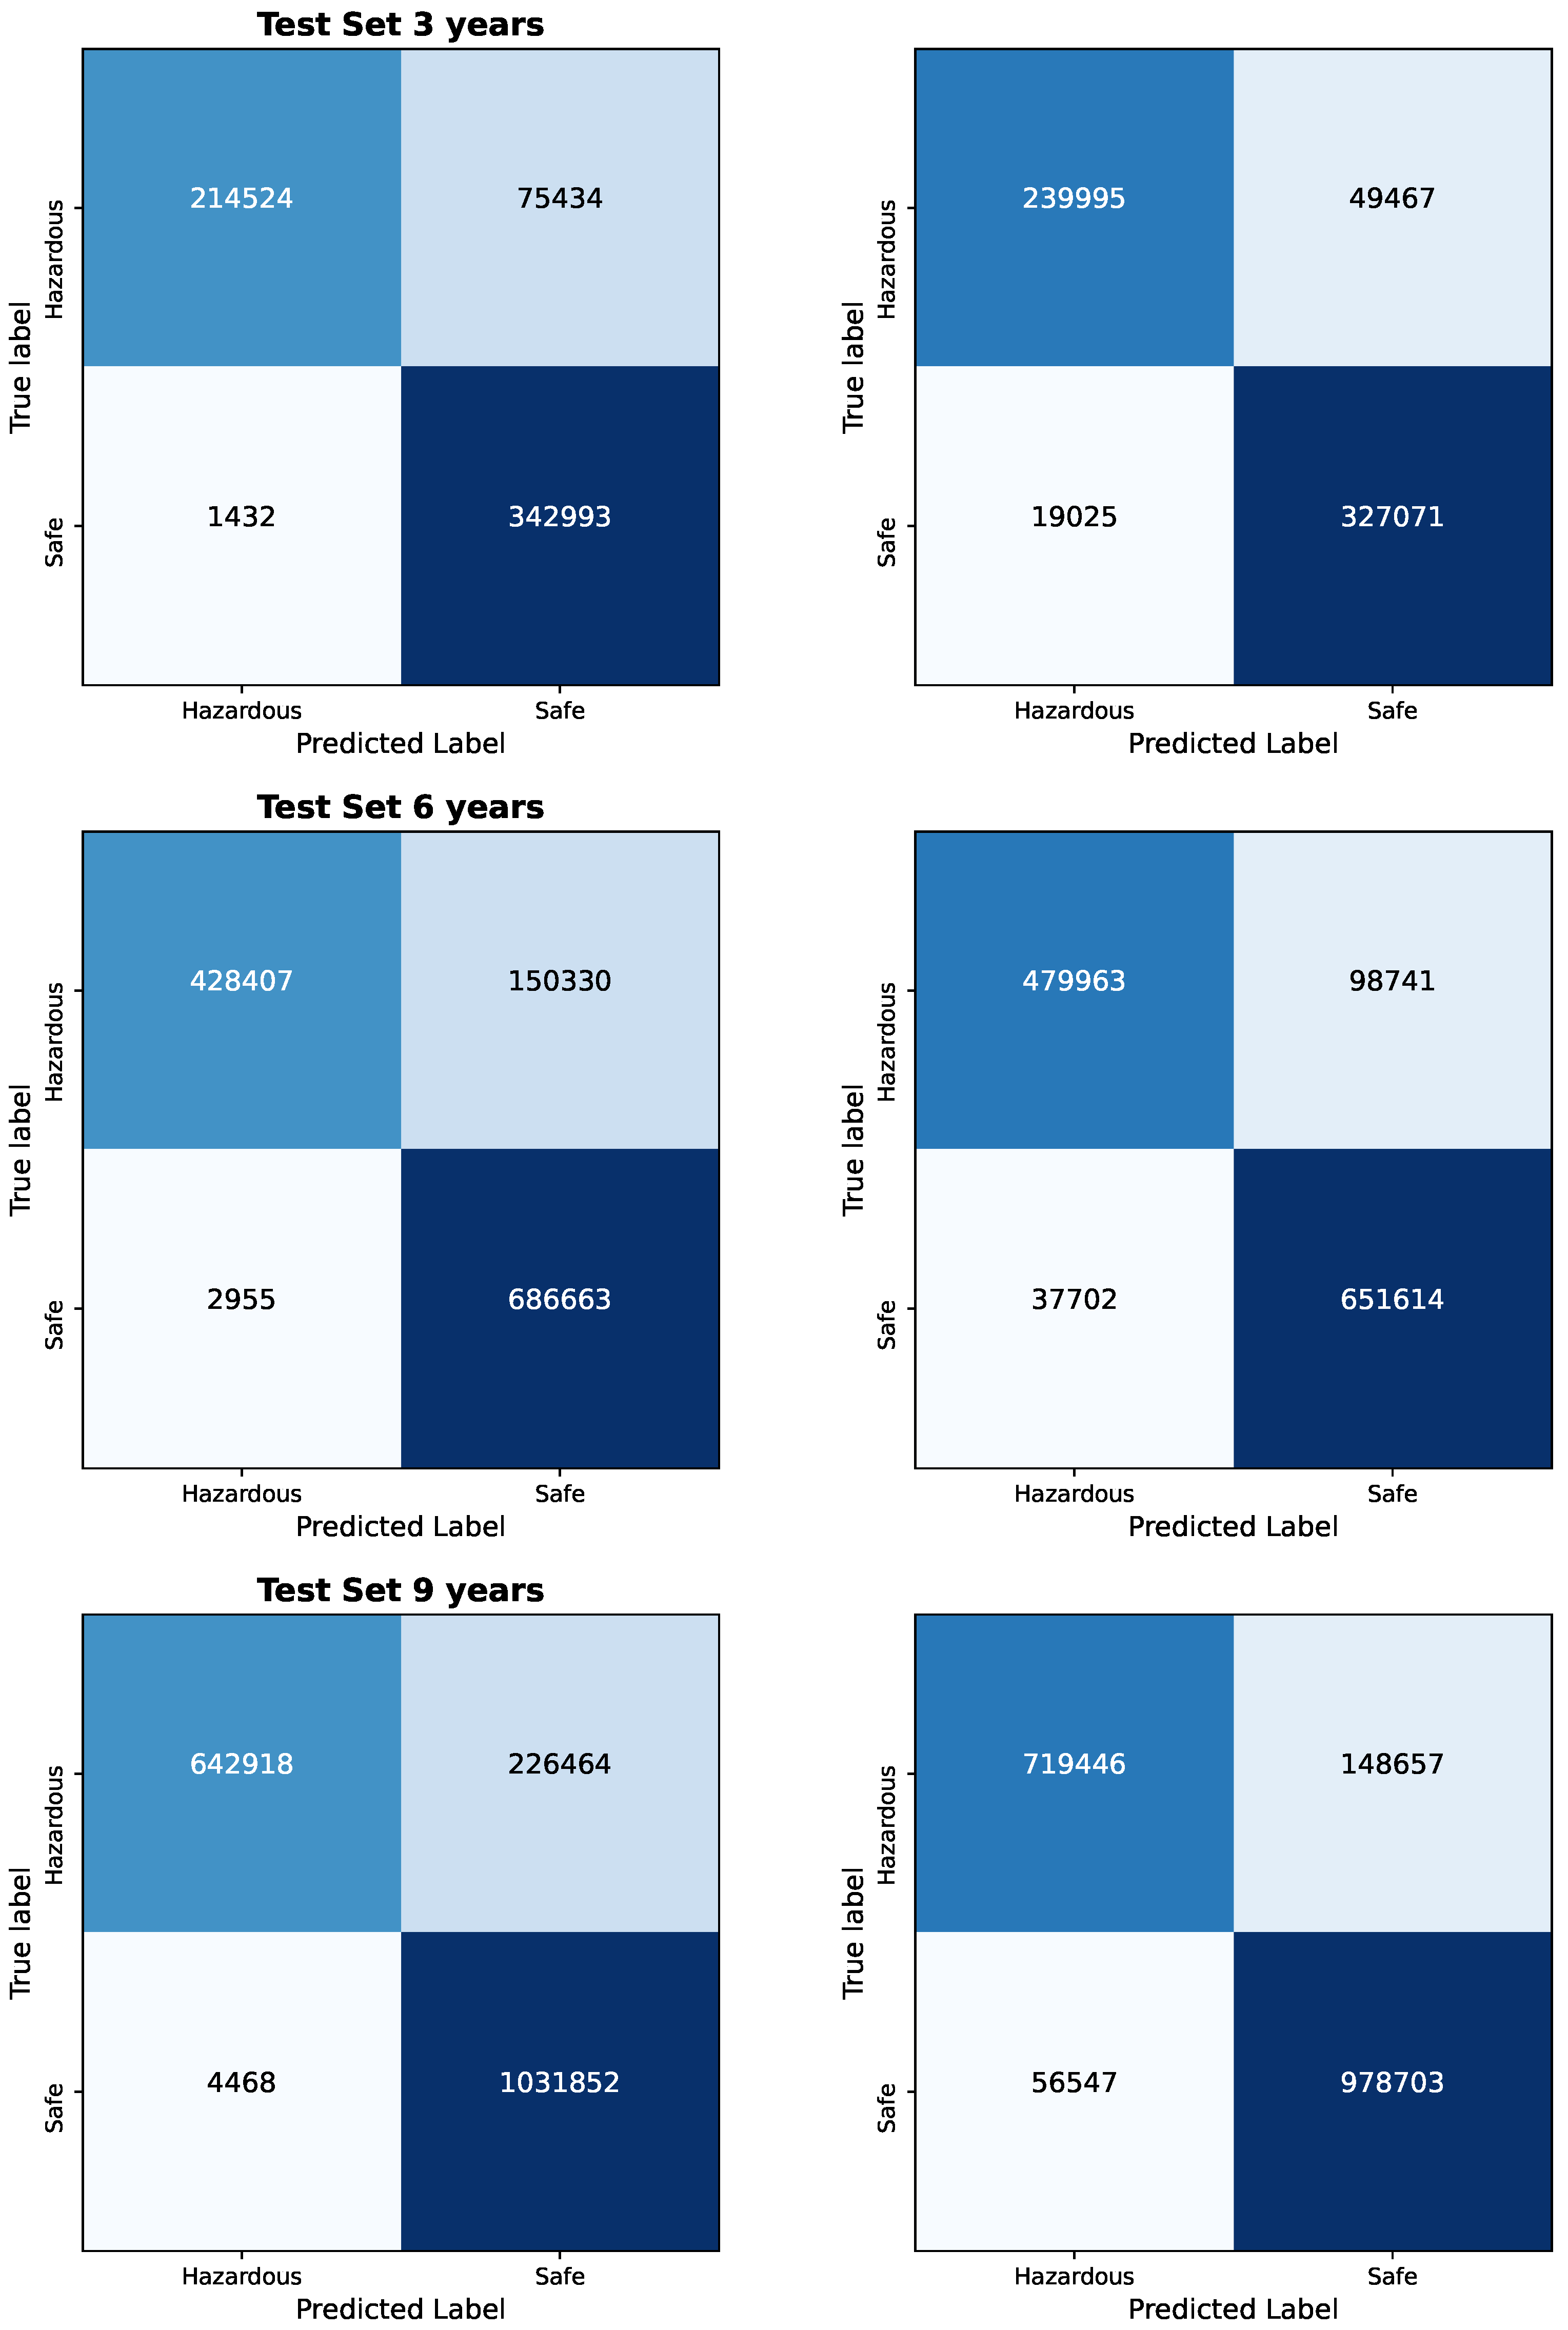
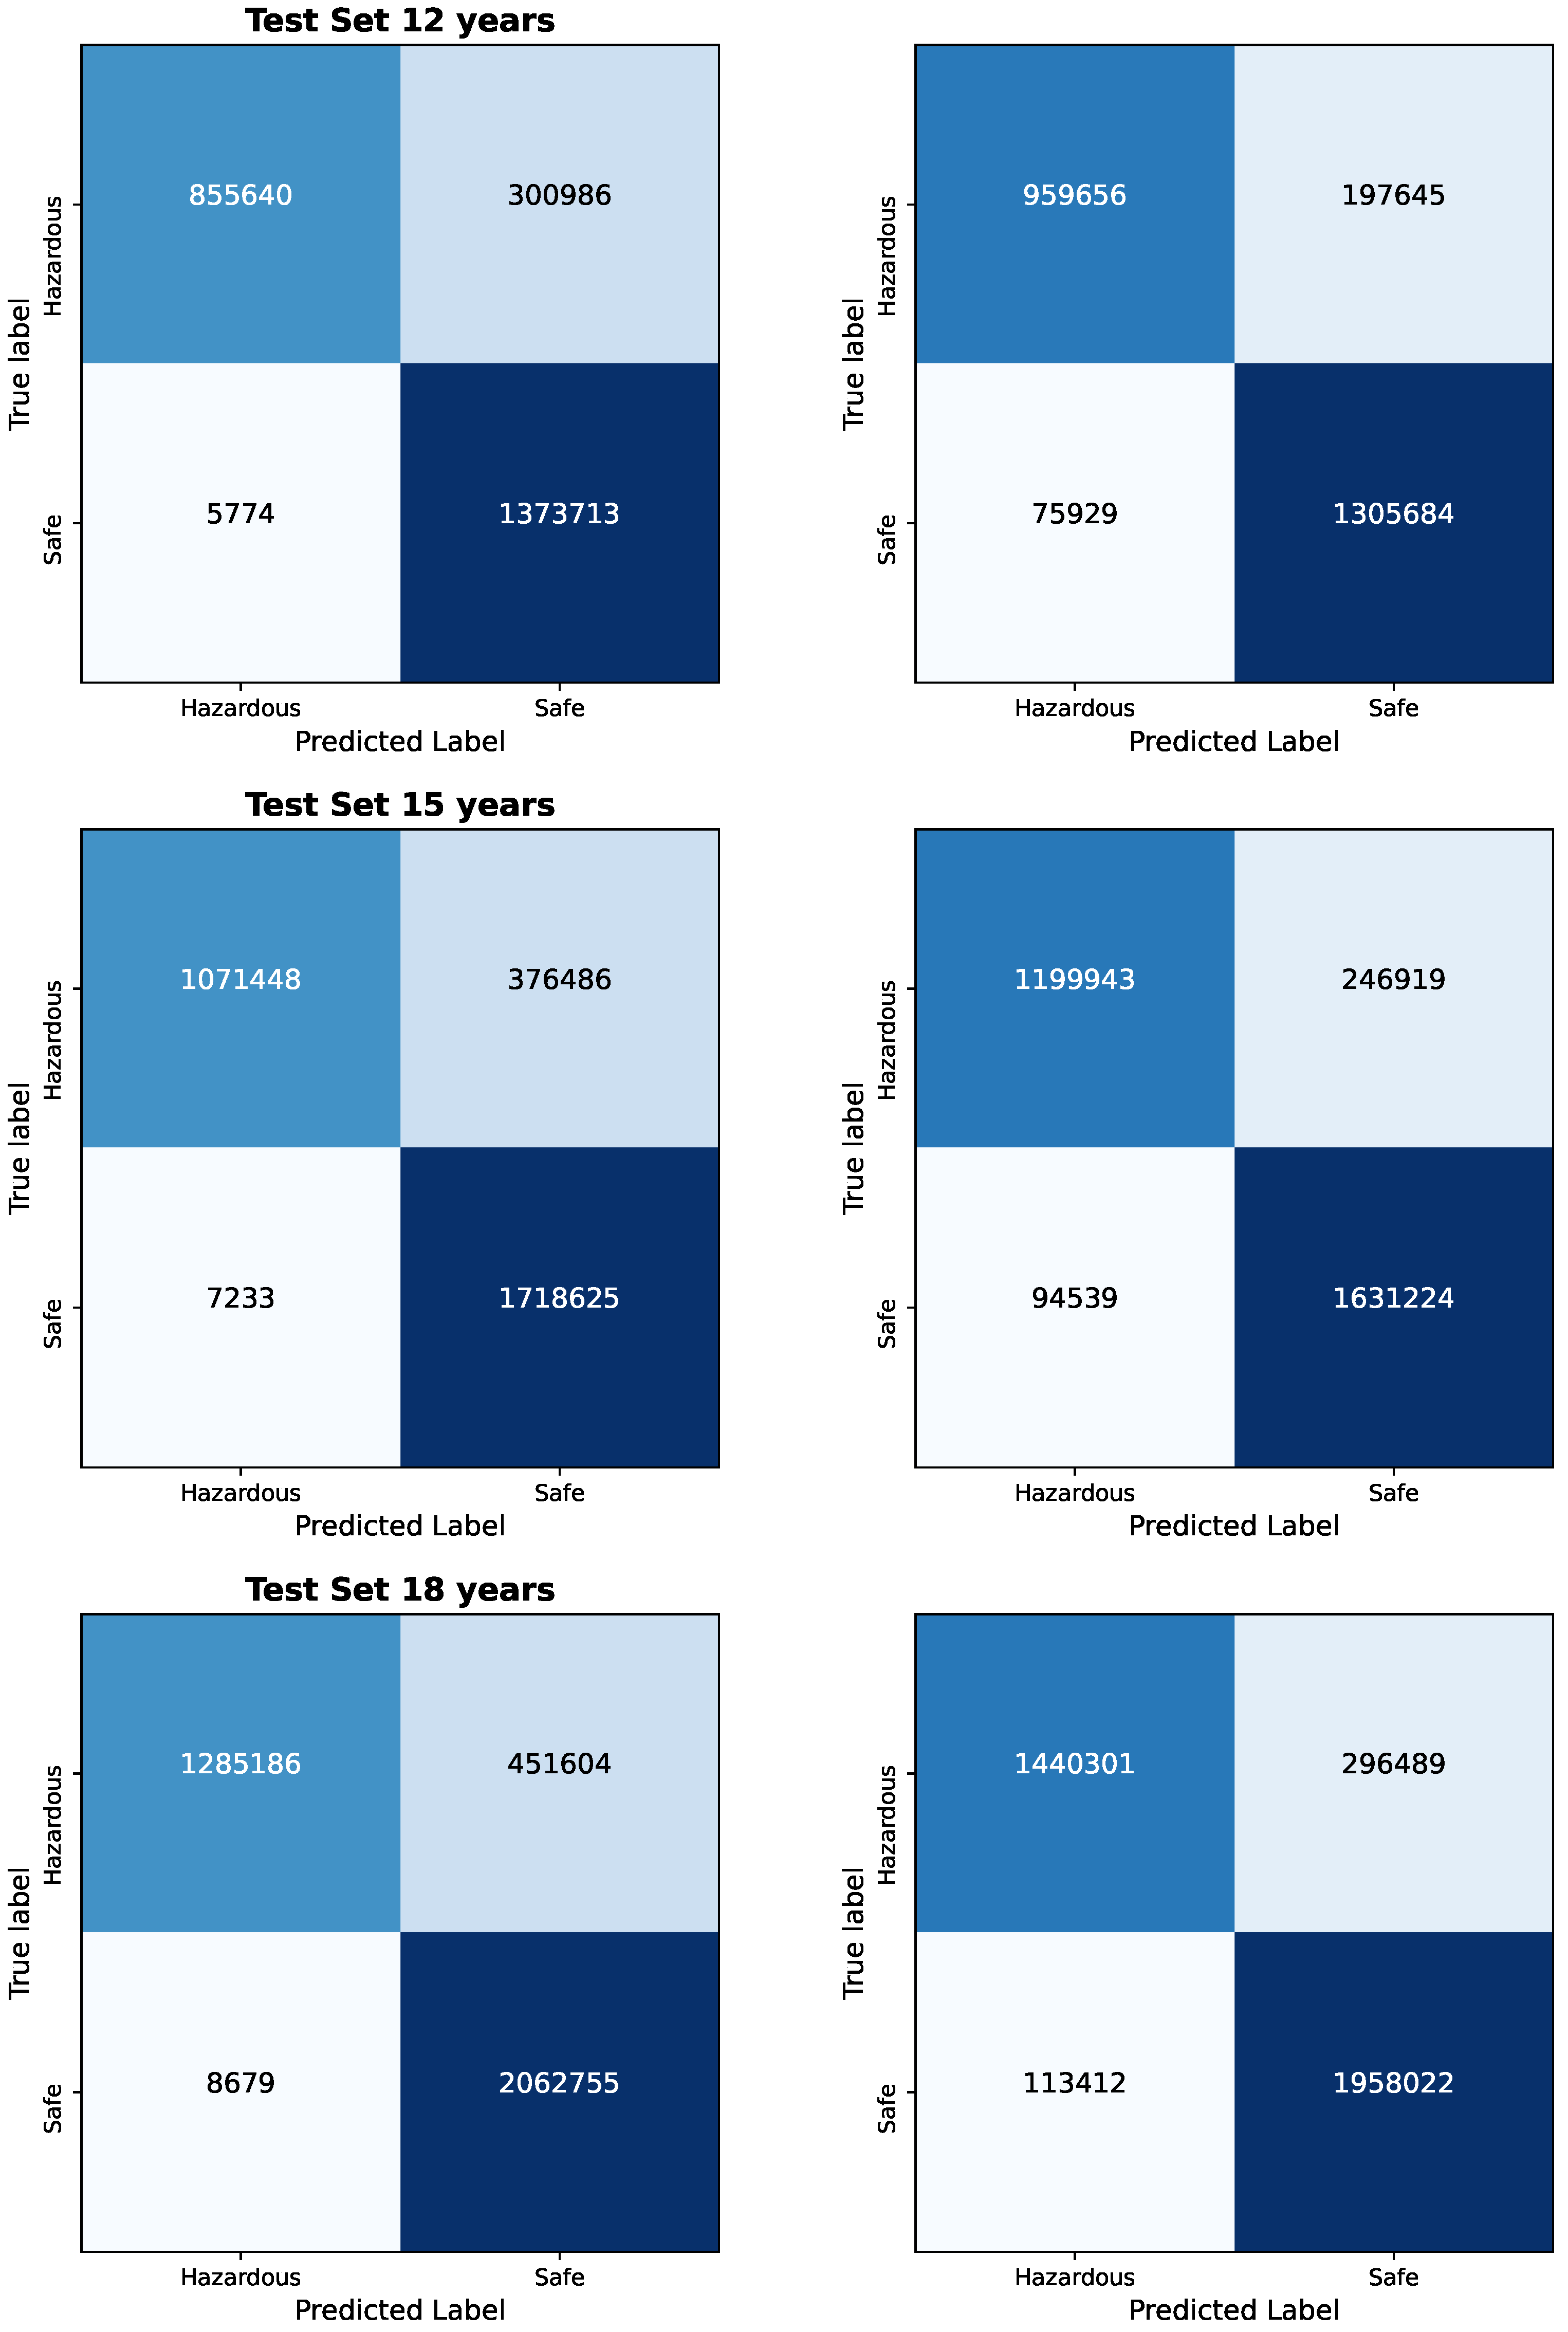
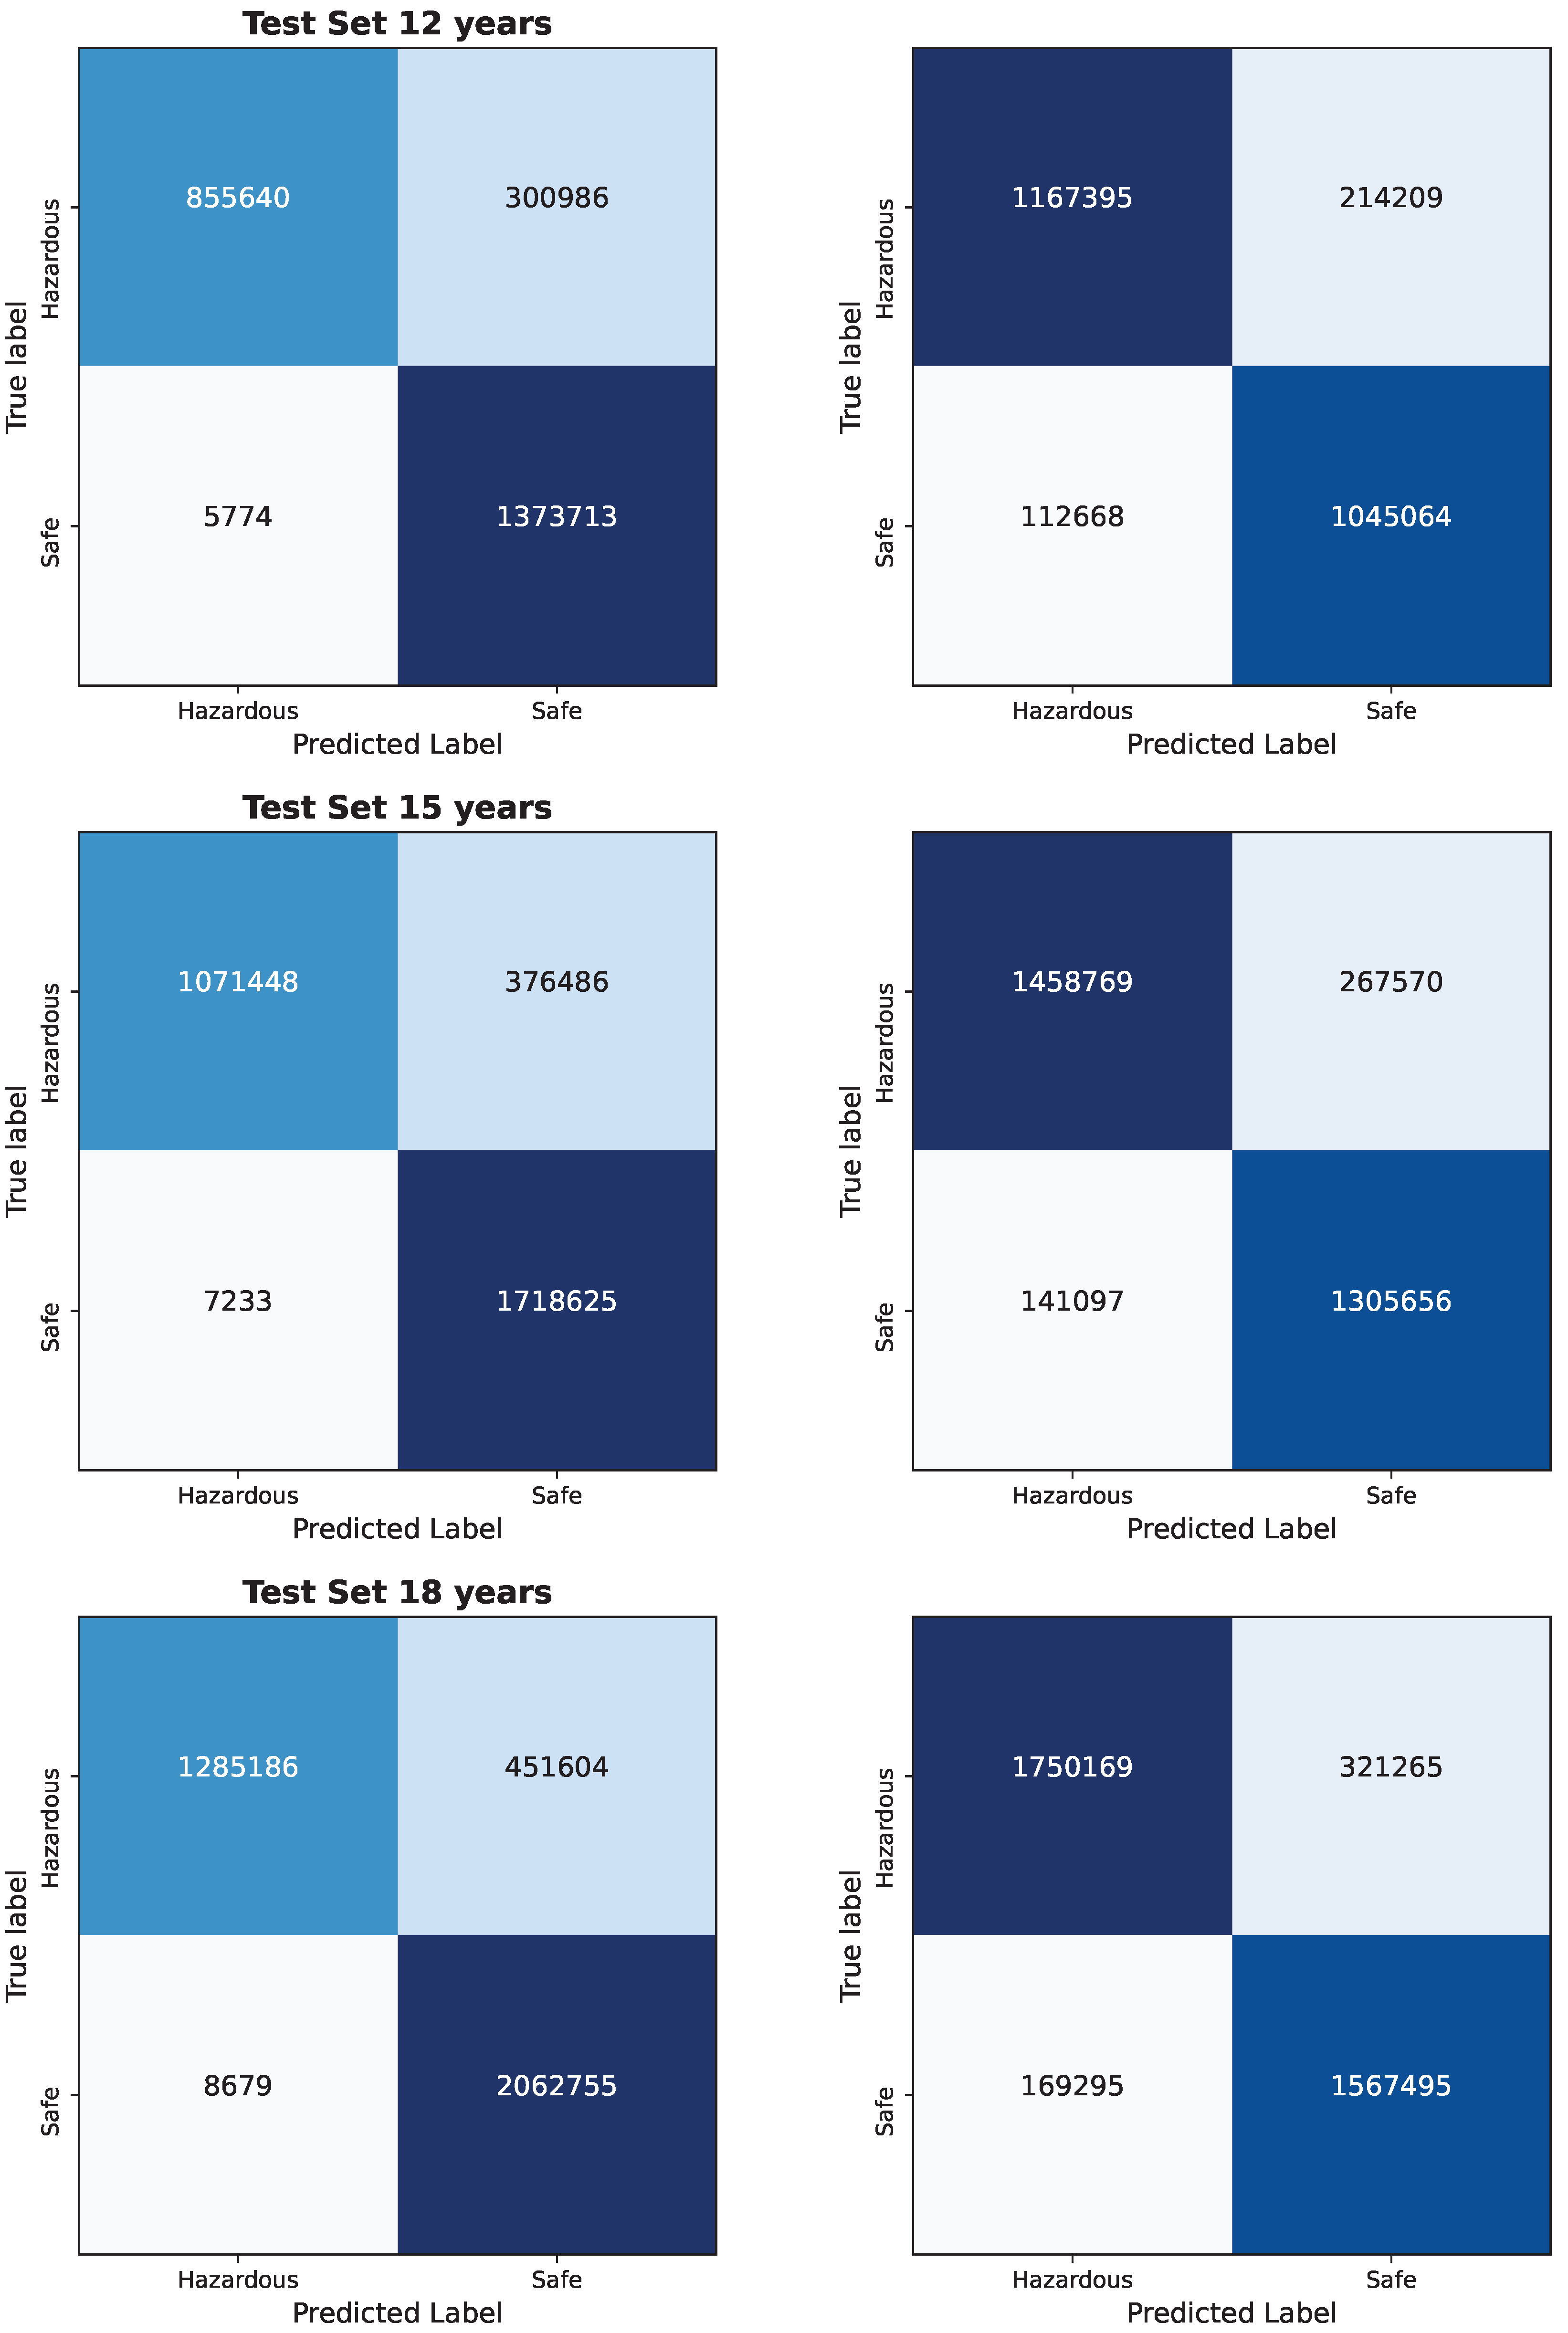
The results of the Bayesian vs. Frequentist Logistic Regression as per the confusion matrices are given in Figure 1 and Figure 2. The visualized data in Figure 3, Figure 4, Figure 5, Figure 6 and Figure 7, along with the numerical data represented Table 2 and Table 3 provide insights into the Bayesian and Frequentist Logistic Regression Models in Pyspark for the same test sets and same decision thresholds. We observe that:
- Inference Time:
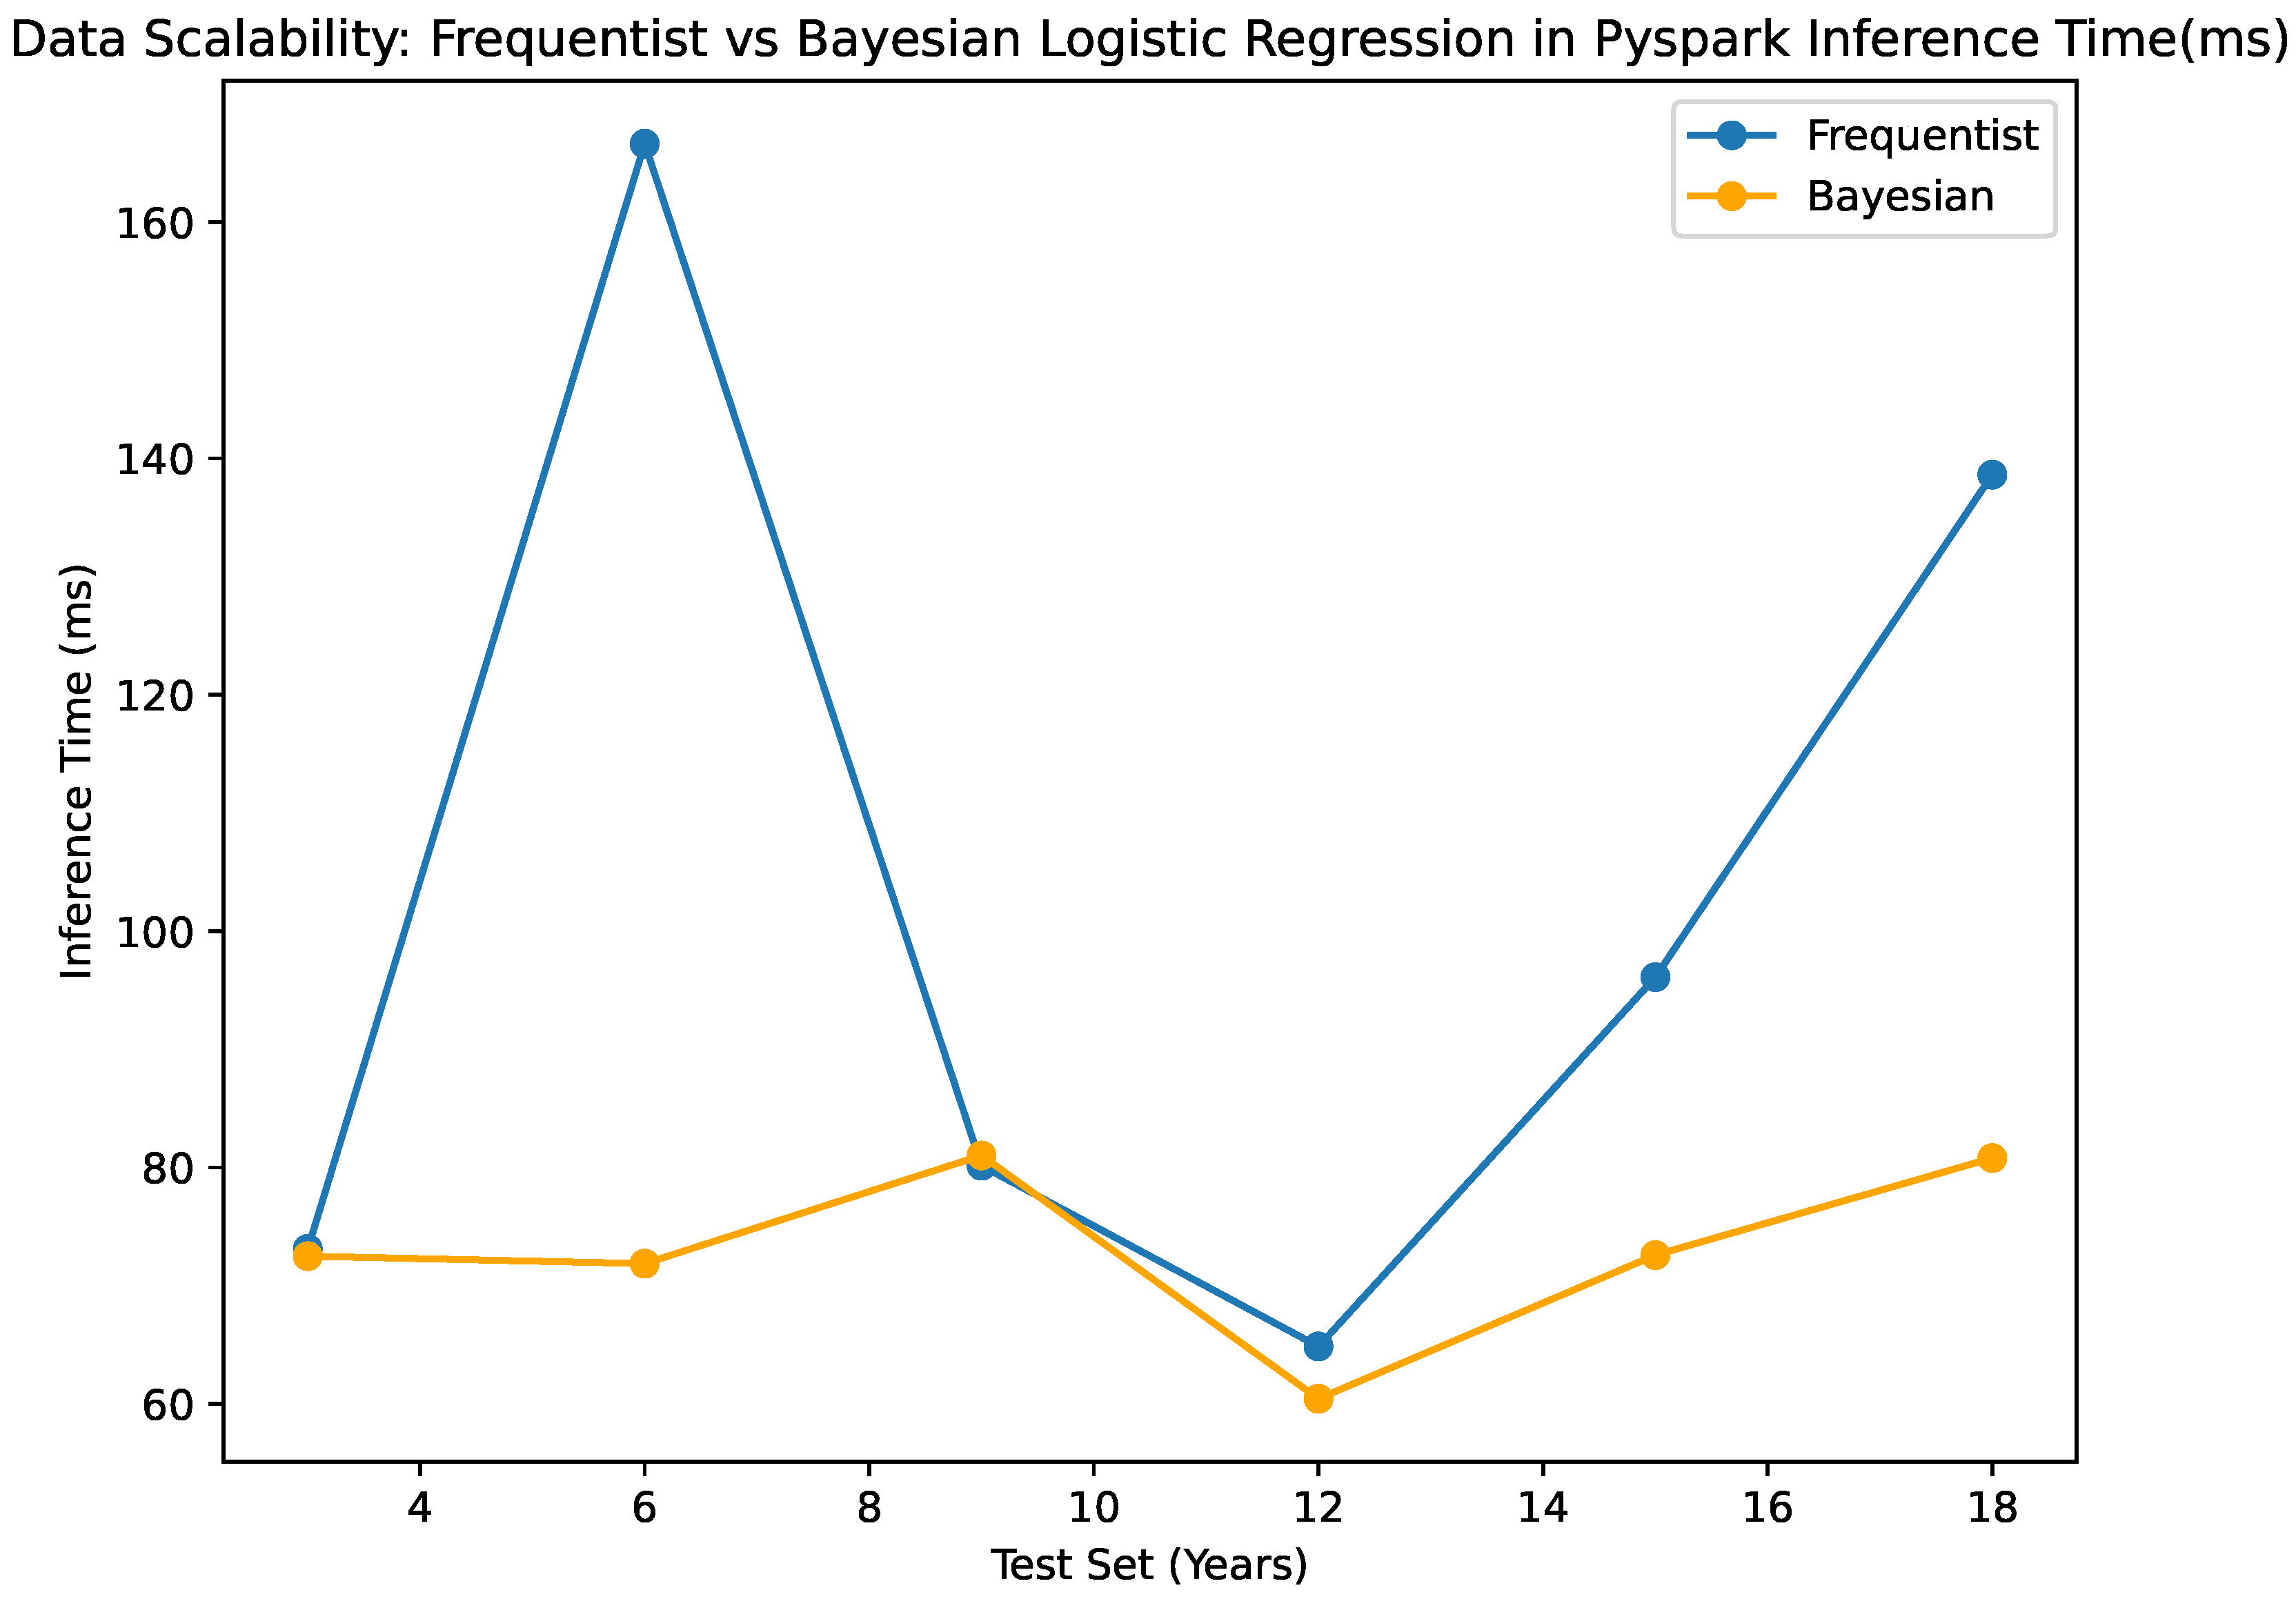
- The Bayesian classifier has inference times ranging from 60.44 ms to 81.02 ms across different test set sizes, demonstrating faster prediction speeds compared to the frequentist classifier, which ranges from 64.86 ms to 166.62 ms. This highlights the computational efficiency of the Bayesian classifier. We also note that the minor differences in inference times further emphasize the Bayesian Model’s consistent and efficient performance.
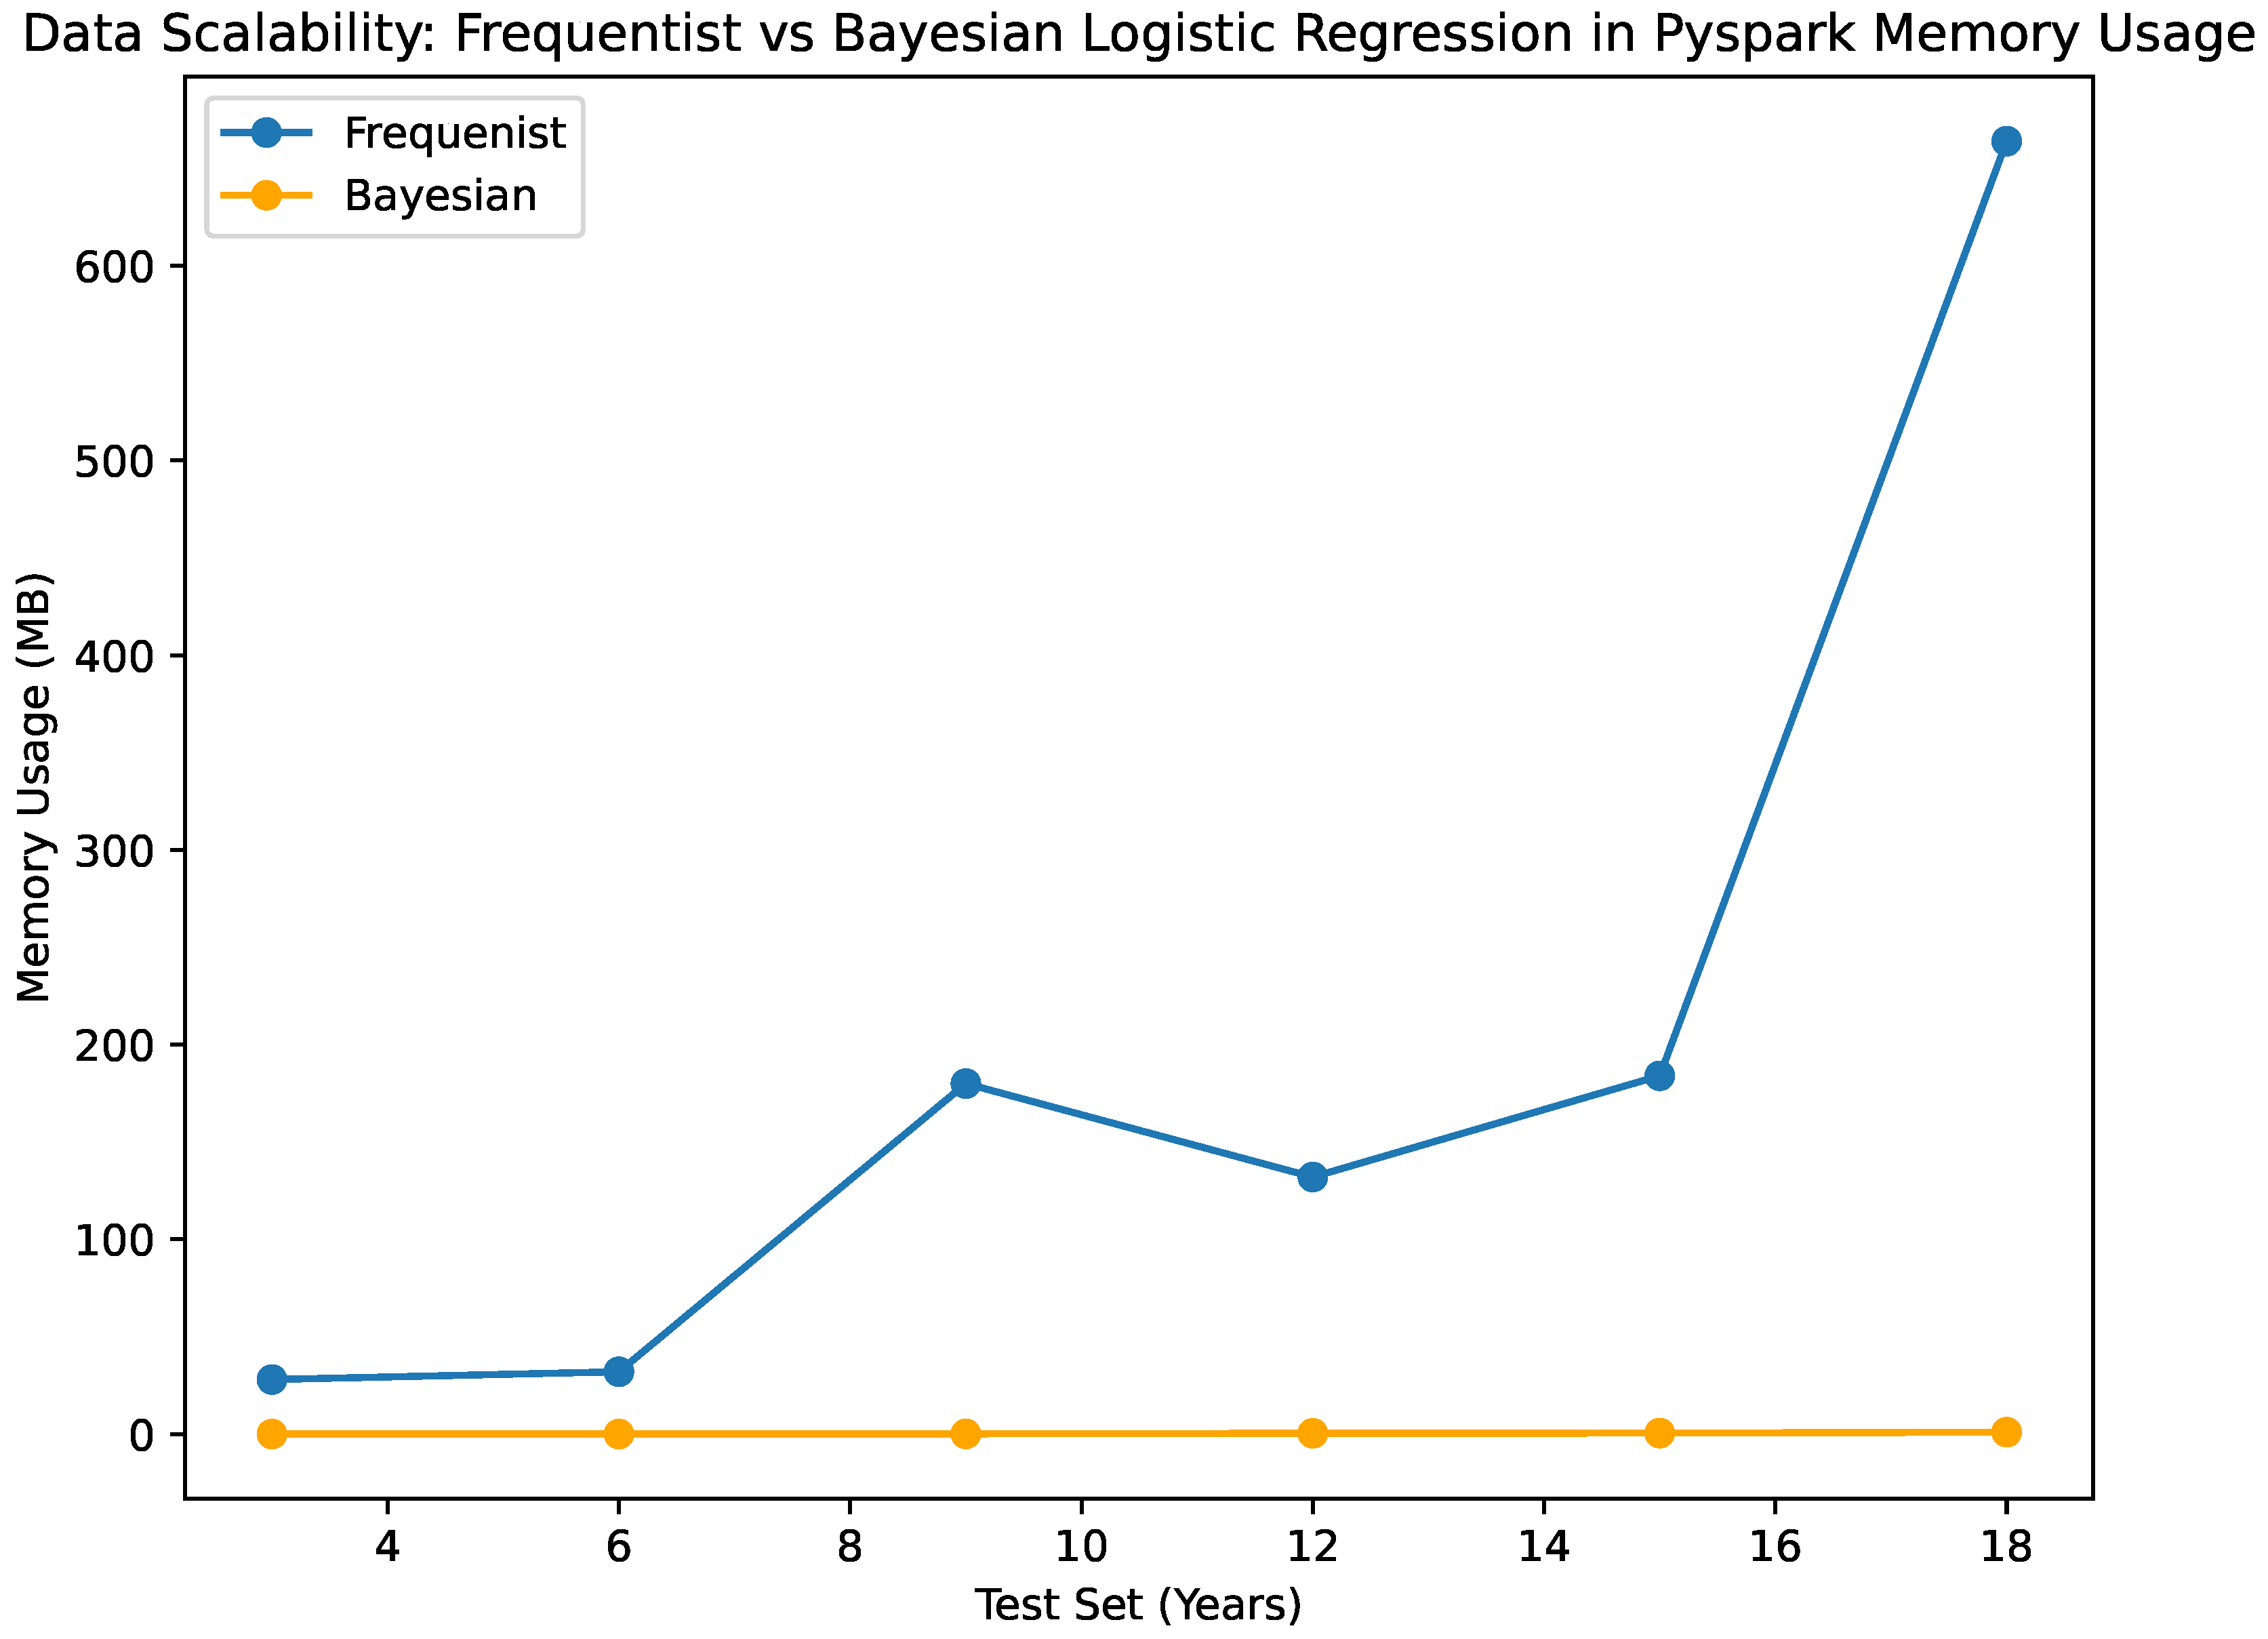
- Memory Usage:
- When examining memory usage, both the Bayesian and frequentist classifiers exhibit similar patterns. The memory usage of the Bayesian classifier increases progressively, although not in a linear manner, as the size of the test sets increases. Likewise, the frequentist classifier shows a similar pattern when it comes to memory use; as the test sets get bigger, there is a departure from a straight-line trend in the growth. These results show that factors besides the amount of test data affect how much memory both algorithms need. Other things that affect memory use are things that you cannot change, like how complicated the model is and how it was implemented.
- CPU Usage:
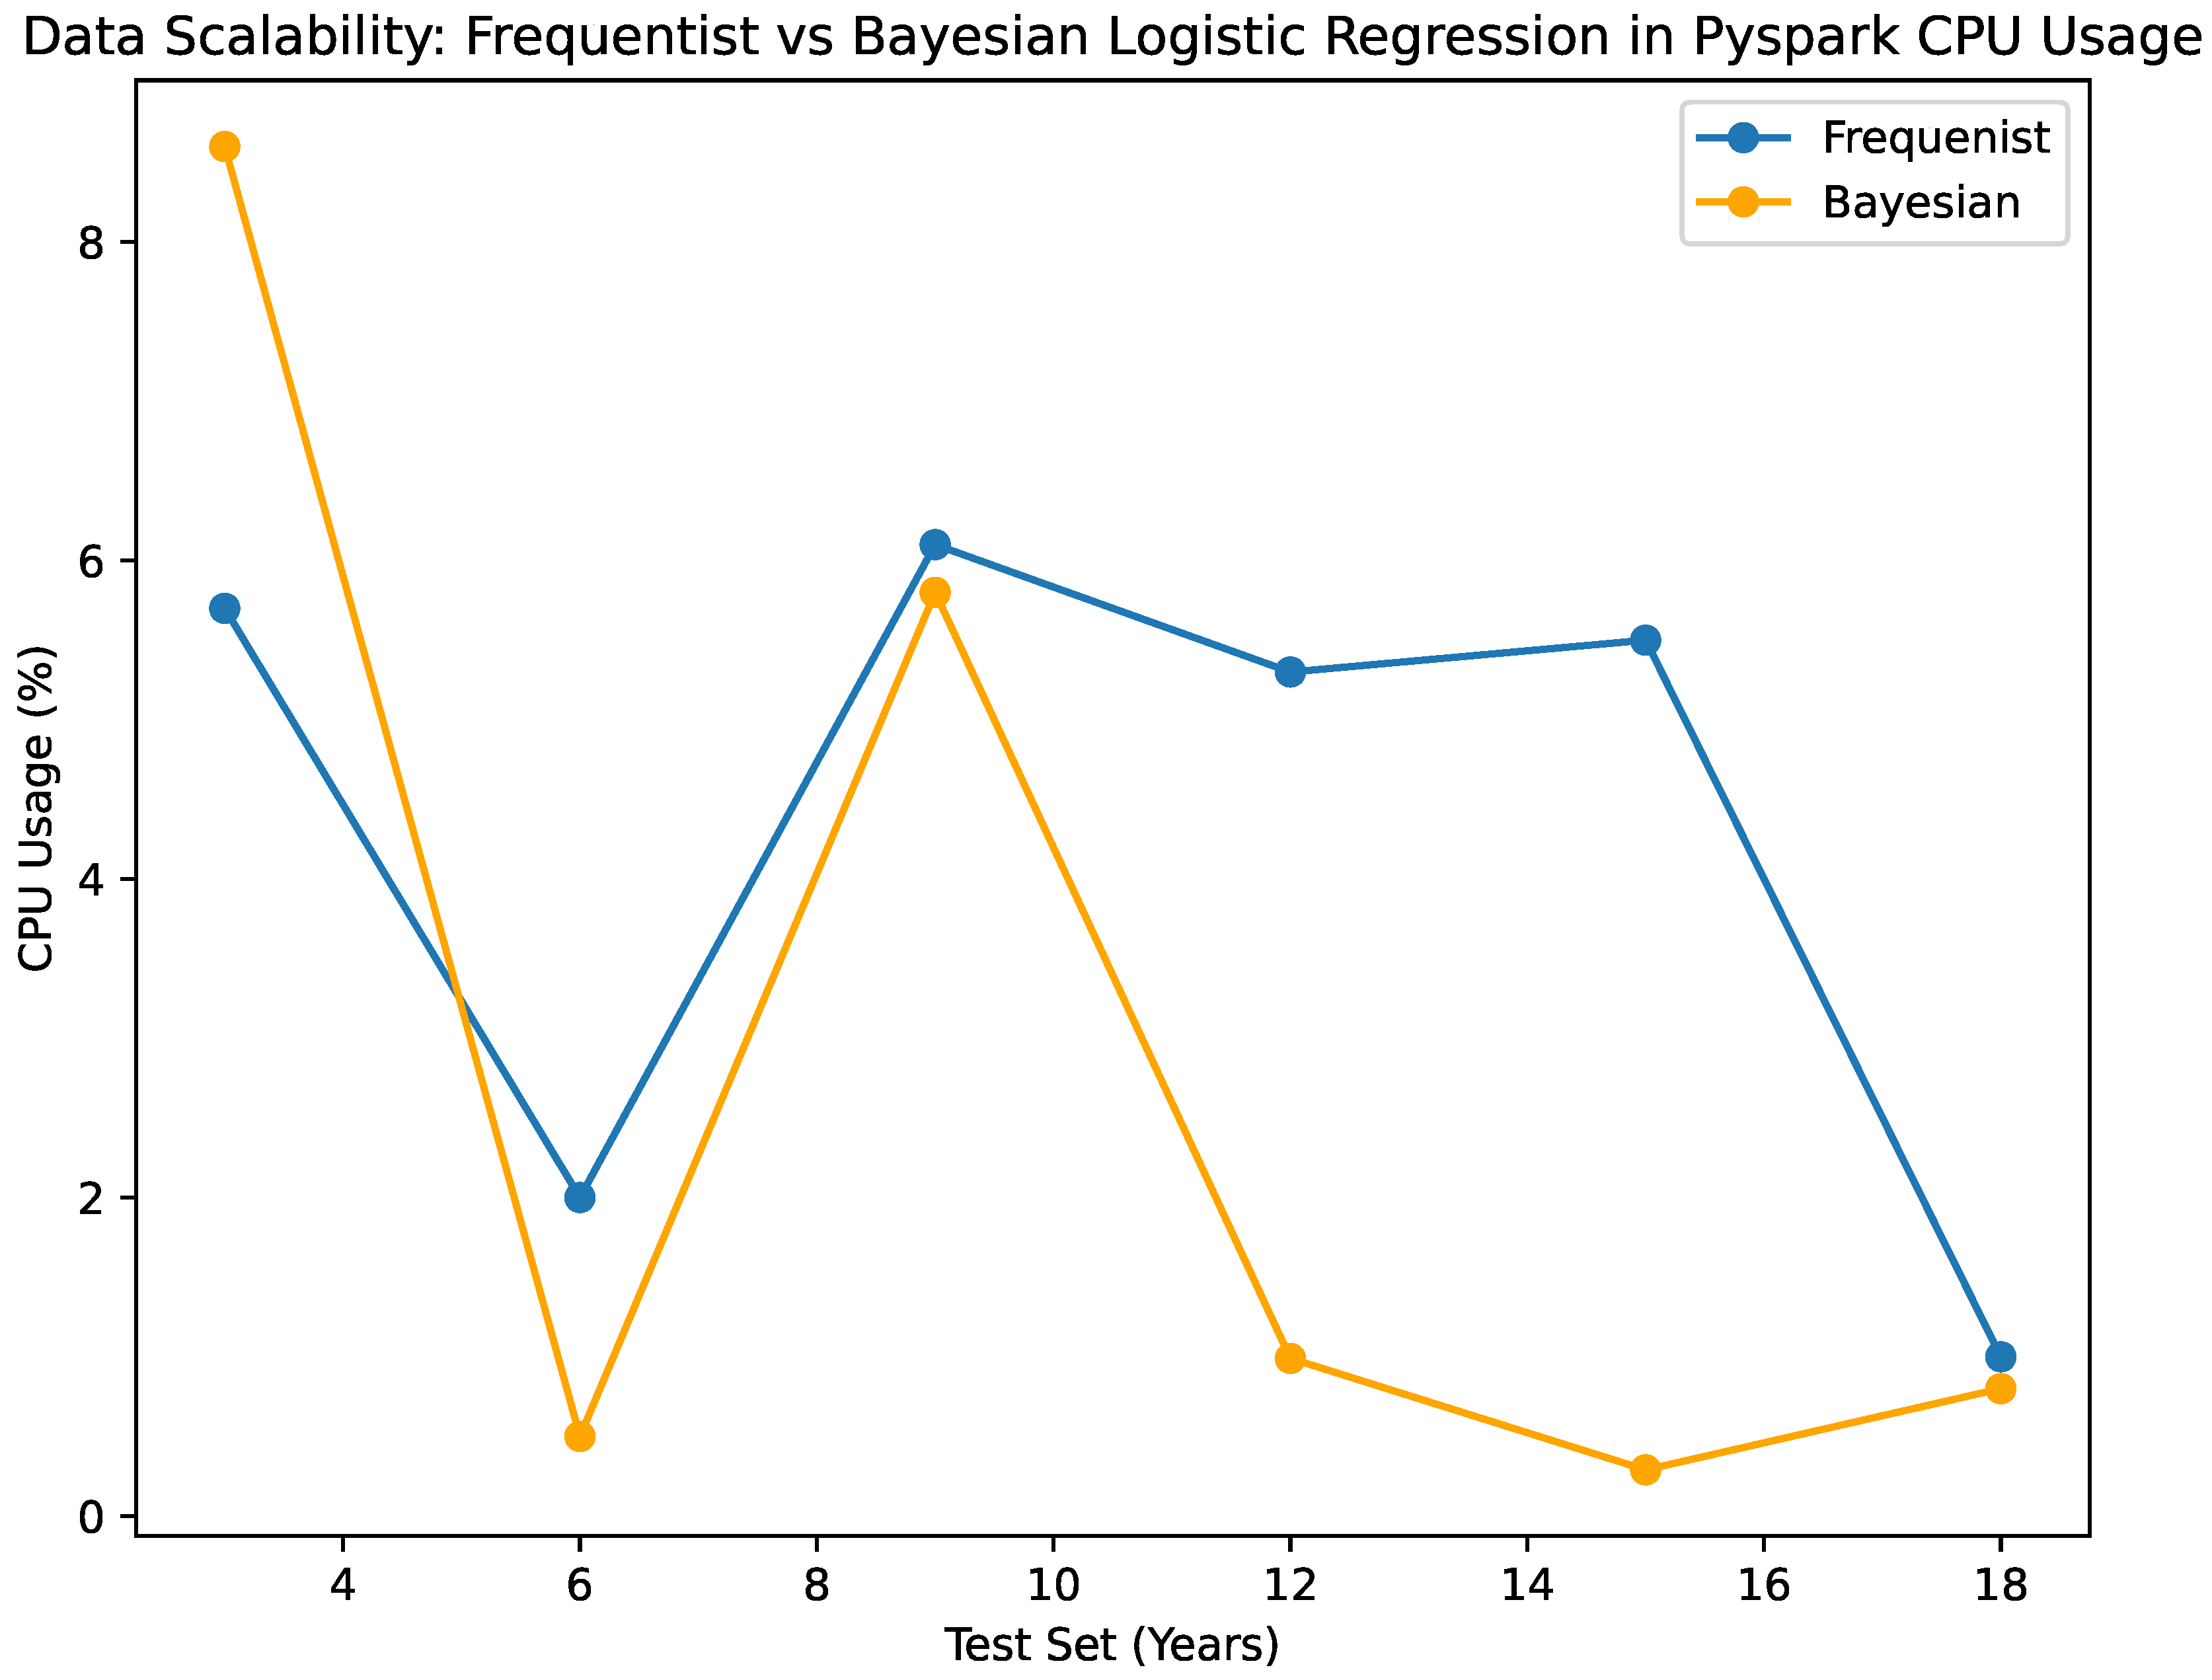
- Both Bayesian and frequentist algorithms make good use of computer resources. It is consistent that the Bayesian predictor uses very little CPU, ranging from 0.29% to 5.88% for different set sizes. In the same way, the frequentist classification always uses between 6.1 and 1 percent of its central processing unit (CPU). Based on the performance that has been seen, it looks like both algorithms make good use of the processing power that is available, keeping the system’s resources from being overloaded. It is important to note that the Bayesian algorithm has a small tendency to use less CPU, which could be good for computer efficiency, especially when working with bigger datasets. The fact that the algorithms use the central processing unit (CPU) smoothly and efficiently suggests that they can work with computer systems that need to be scalable and use resources efficiently.
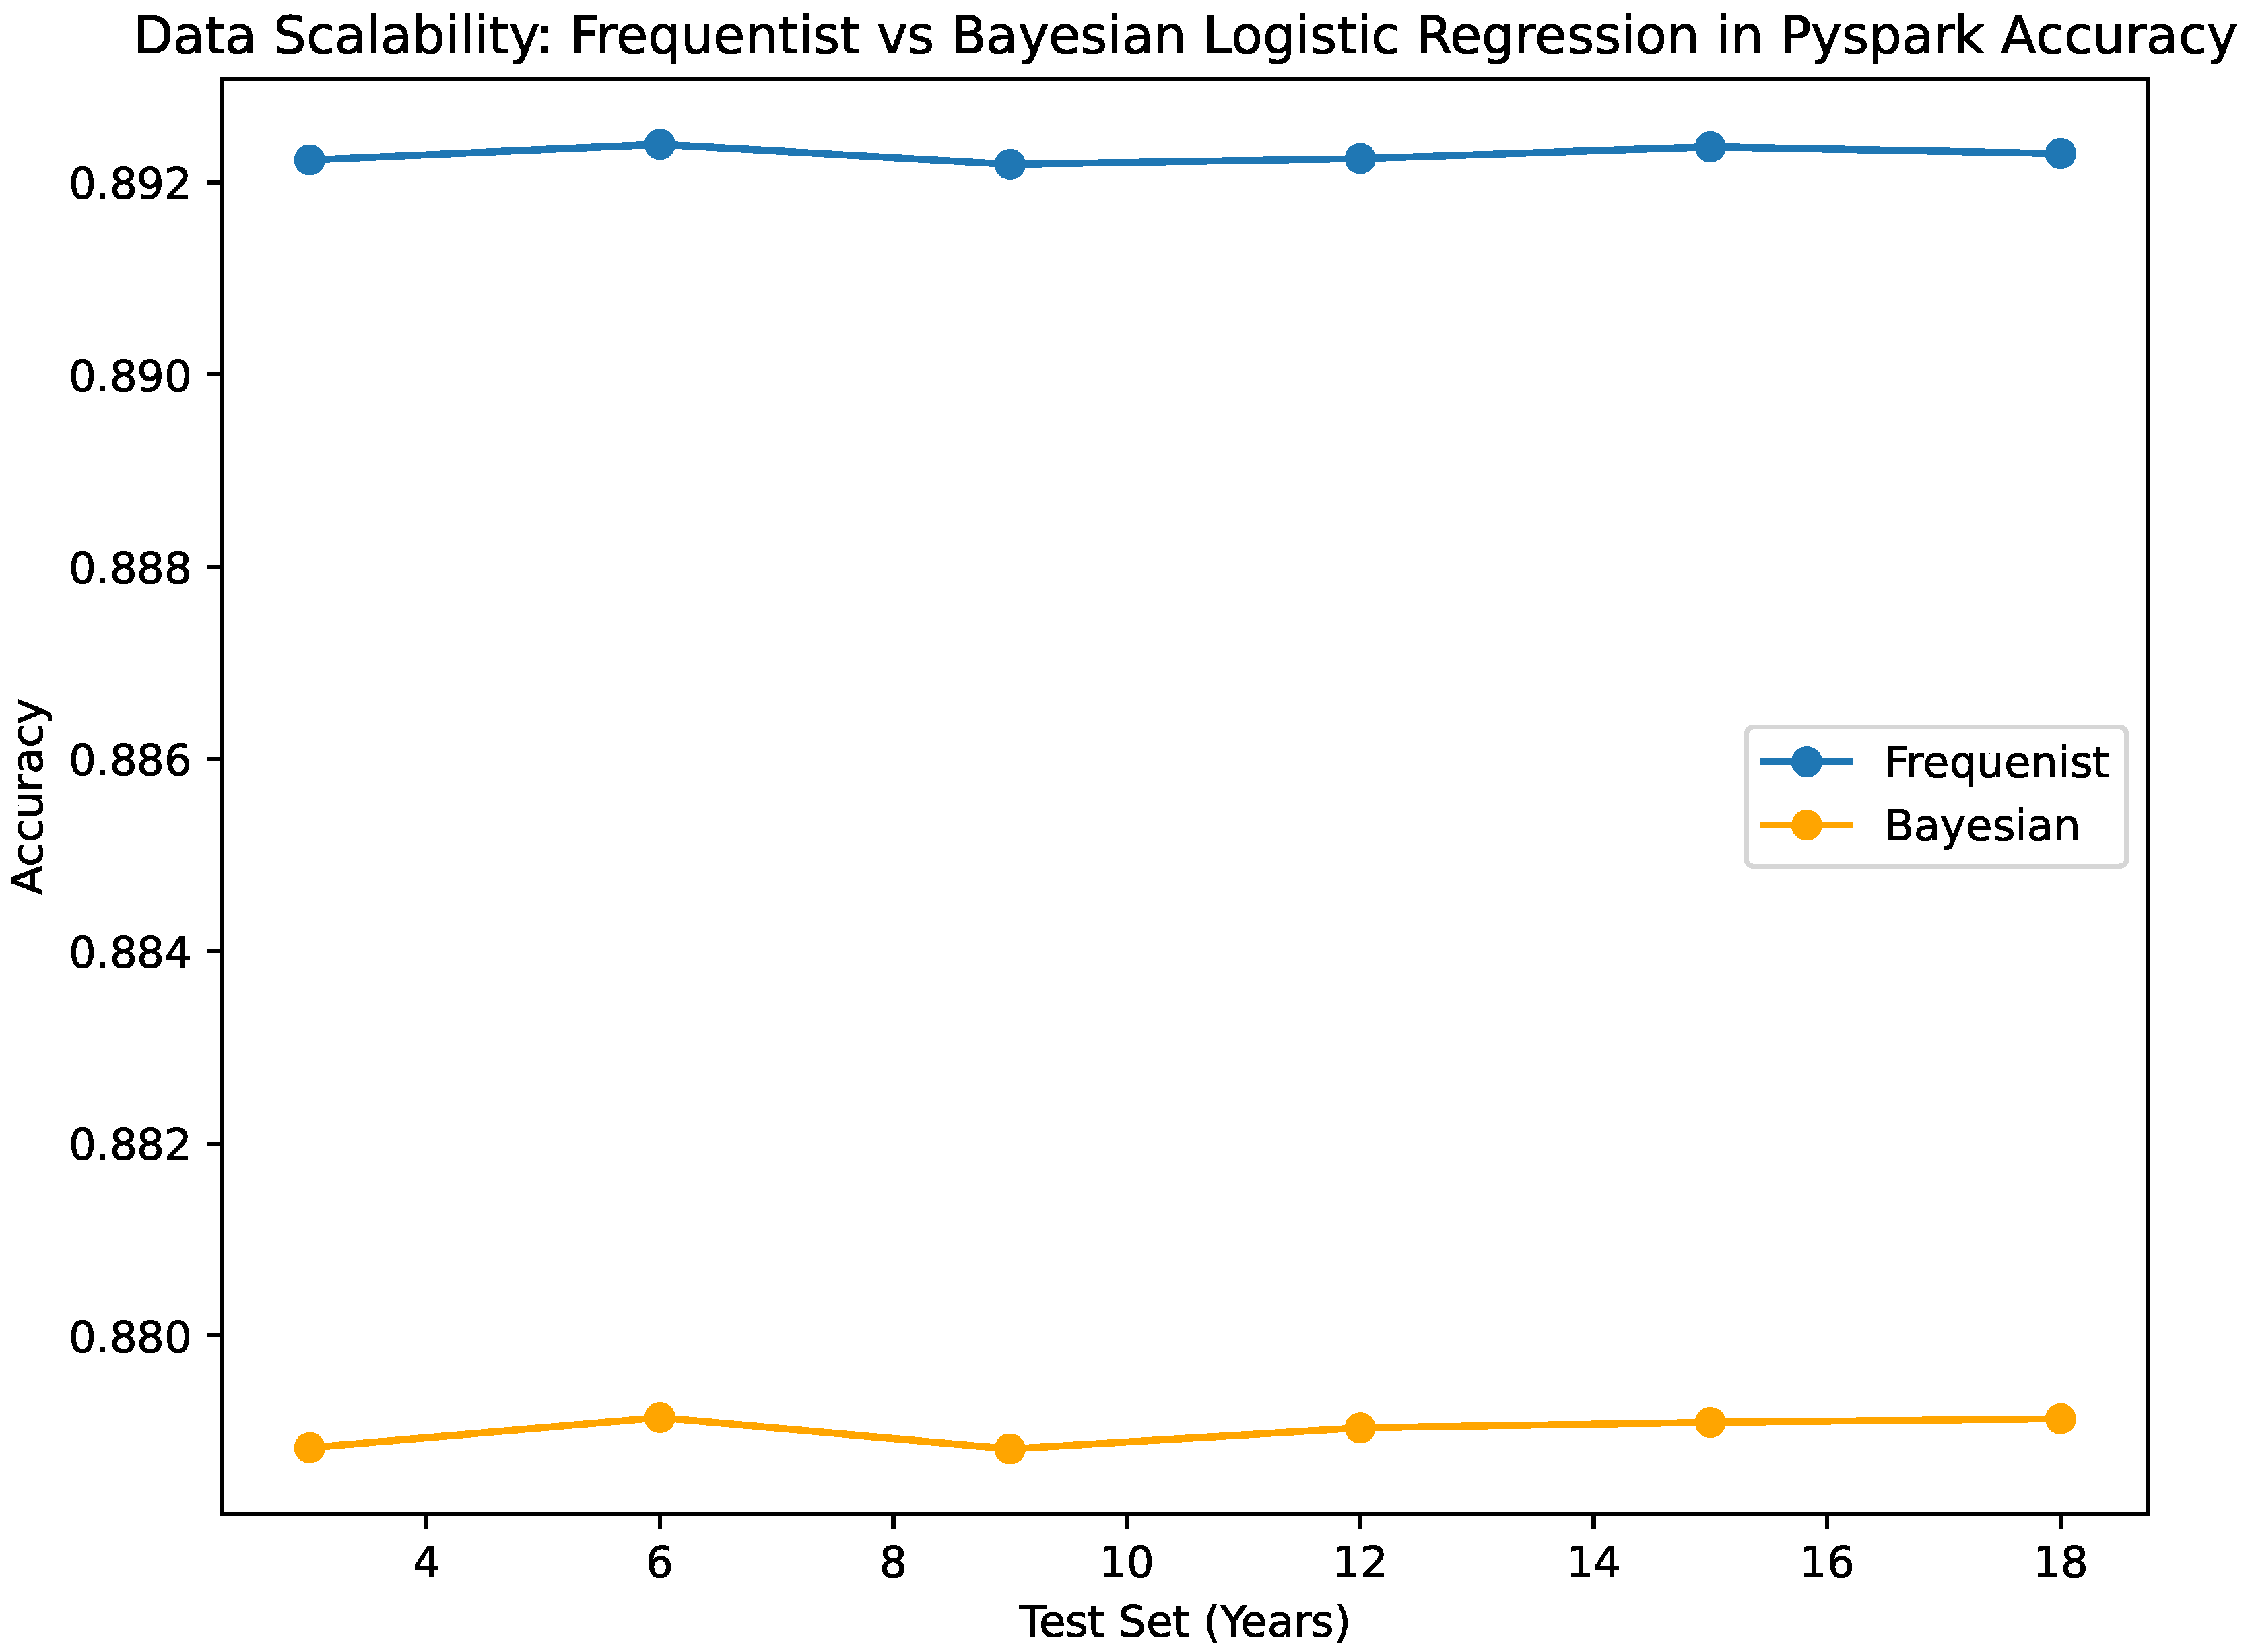
- Classification Metrics:
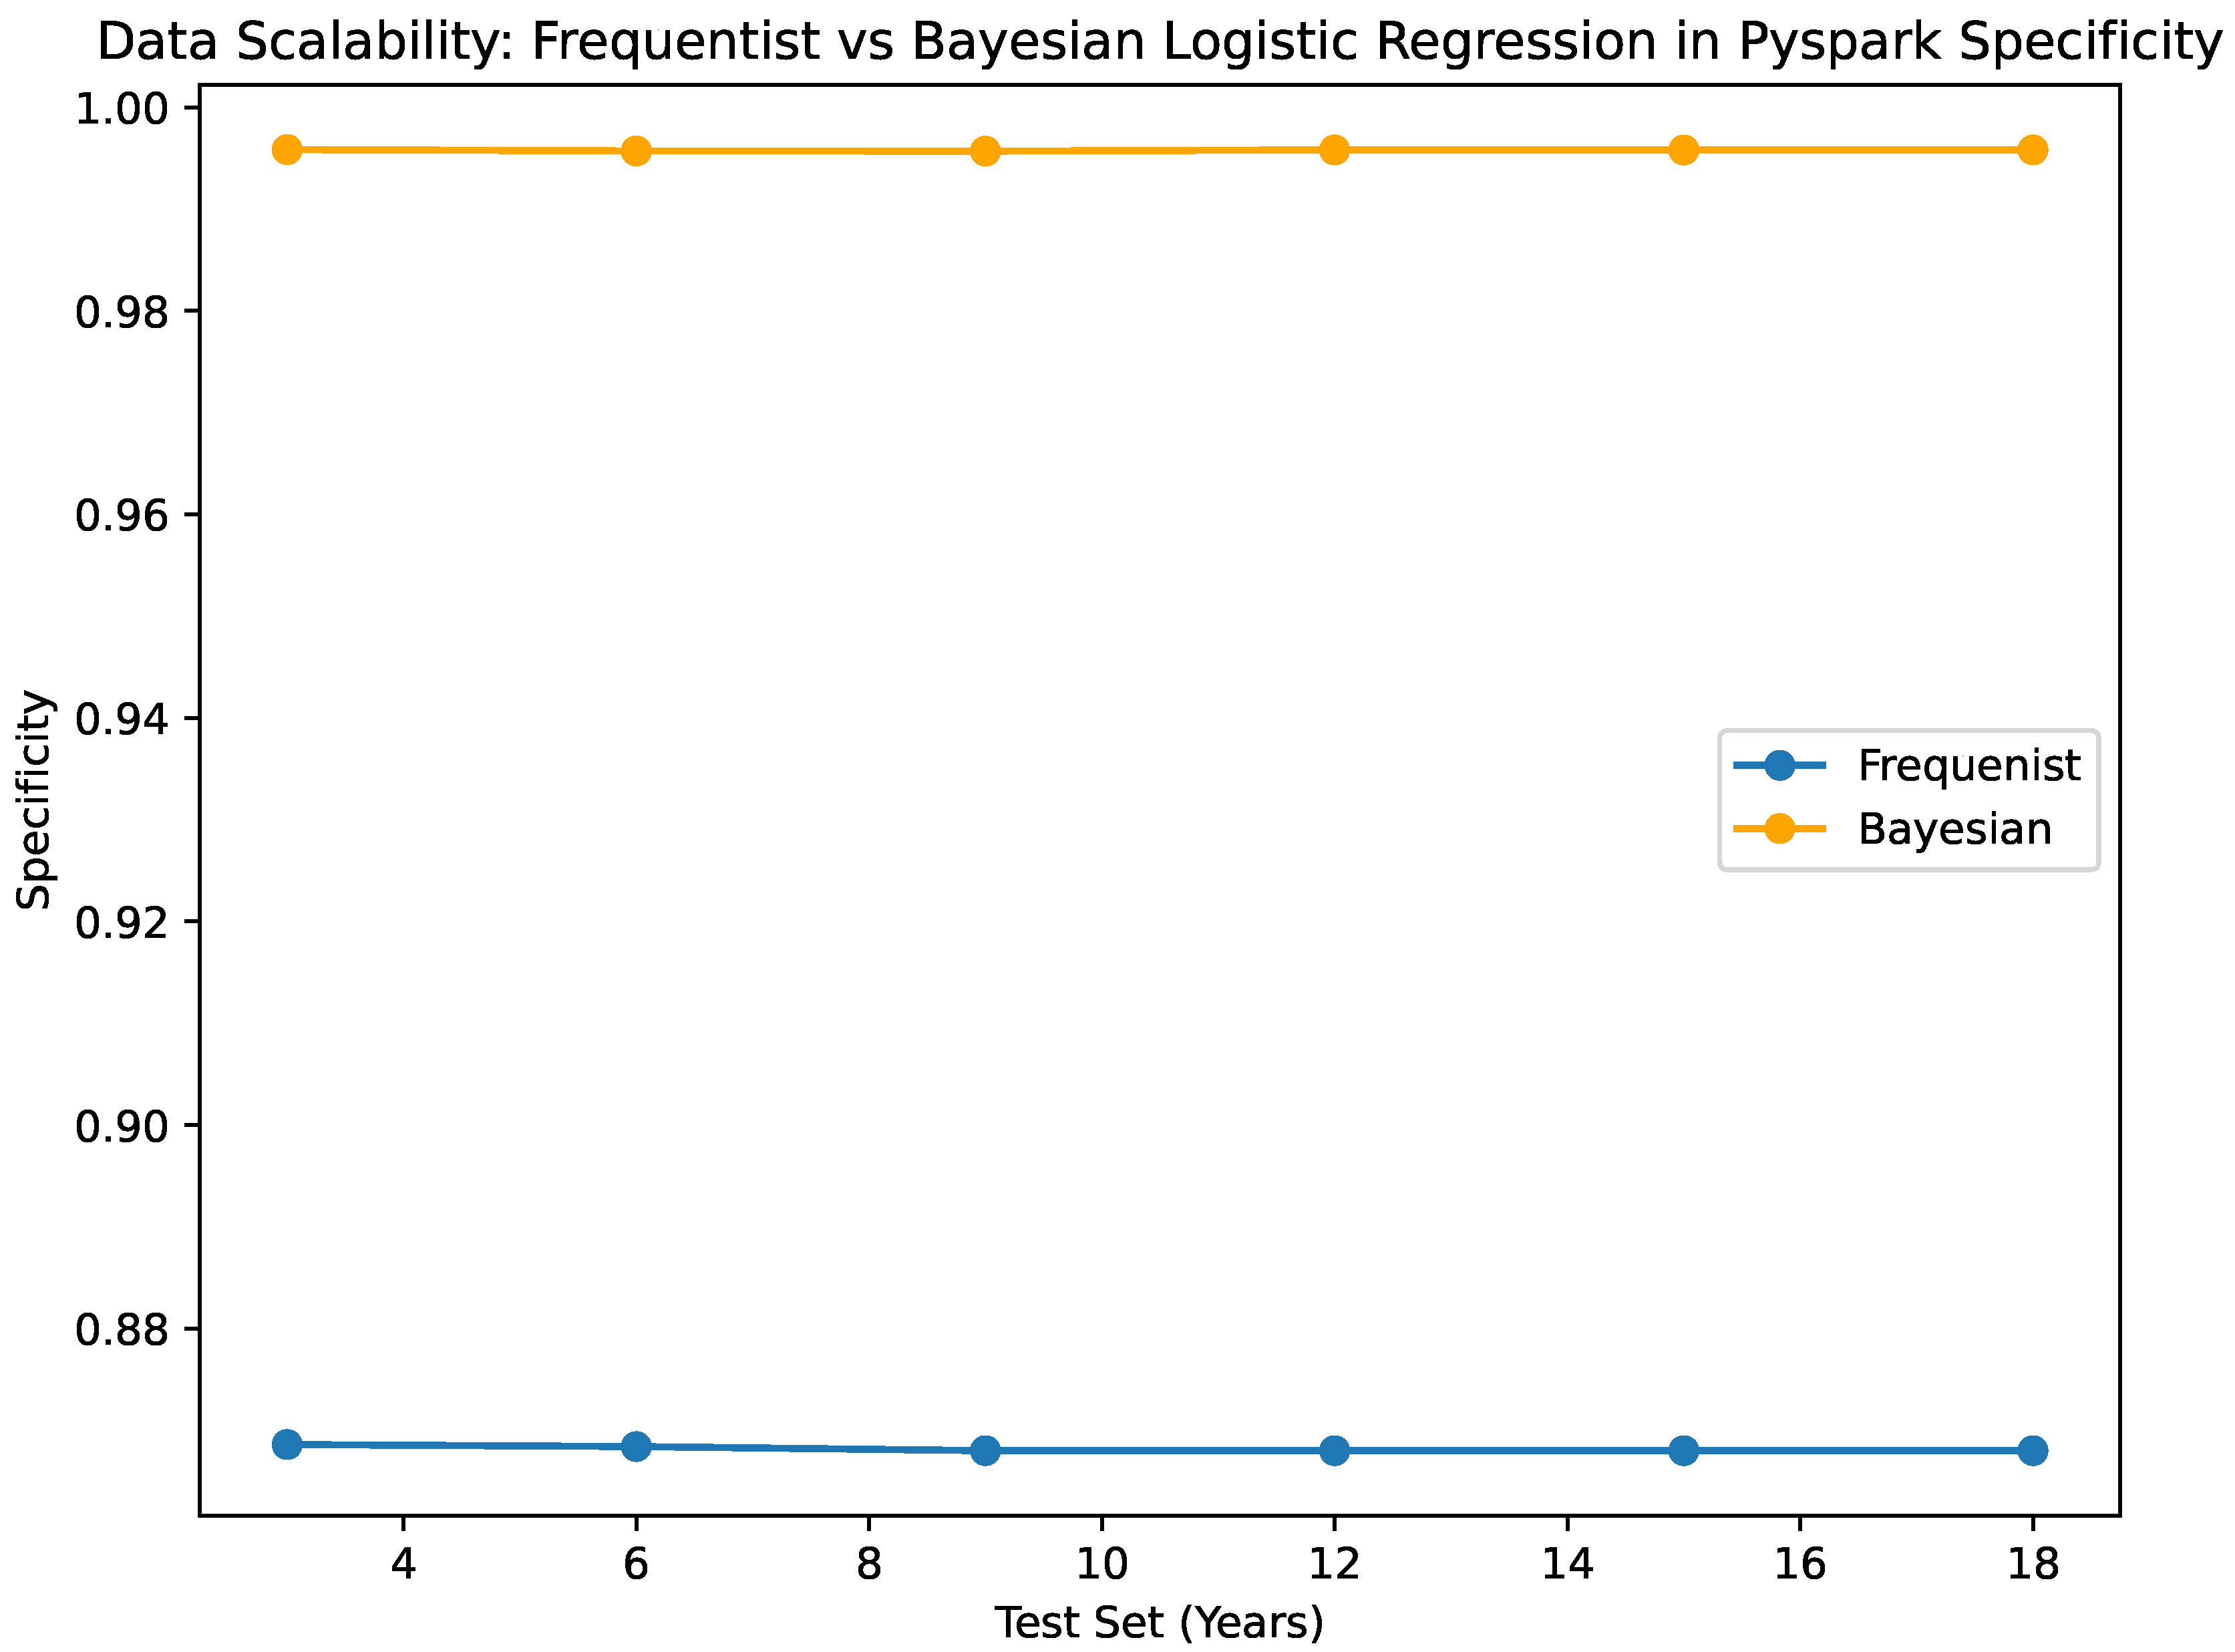
- Both the Bayesian and frequentist models are still very good at making predictions. Multiple test sets of various sizes show that the Bayesian classification is accurate within the range of 0.87882 to 0.8791466. However, the frequentist estimator is more accurate, with a range of accuracy between 0.892238 and 0.892396. A high sensitivity value of 0.995 is always obtained by the Bayesian classifier, no matter how big the test set is. This means the classifier does not make a lot of mistakes and can guess true positives properly. One thing that you should keep in mind is that the frequentist classifier, which looks at all test set sizes, has a pretty high rate of false positives (0.868), as shown by its sensitivity value. In this case, the Bayesian classifier is more specific than the frequentist classifier, which means it can correctly identify true positives. When it is very important to obtain the negative class correctly, the Bayesian classifier works optimally because the method is more specific.
A comparative analysis of the Python implementations of Bayesian and Frequentist Logistic Regression methodologies is illustrated in Figure 3 and Figure 4. The inference time, denoted in milliseconds, is depicted in Figure 3 for each methodology. A reduced inference time suggests that the method is efficient in generating predictions, a crucial aspect especially in data-intensive environments. Figure 5 and Figure 6 present evaluations of Bayesian and Frequentist Logistic Regression techniques in the PySpark framework. Figure 5 showcases the memory consumption in kilobytes (KB) of both methods. Efficient memory utilisation is vital for optimisation, especially in resource-limited settings. Conversely, Figure 6 illustrates the classification accuracy of each approach. Accuracy indicates the model’s effectiveness in making correct predictions.
Overall, when considering all the above evaluation metrics, the Bayesian classifier exhibits competitive performance compared to the frequentist classifier. It demonstrates faster inference times, lower CPU usage, and higher specificity while achieving comparable accuracy levels. This indicates that the Bayesian classifier is not only efficient but also excels in accurately predicting true negatives, making it highly suitable for scenarios where specificity is crucial, such as in our case. Moreover, its scalability stands out as a notable advantage, as it consistently handles larger test set sizes without significant increases in computational time and resources.
4.2. Computational Scalability
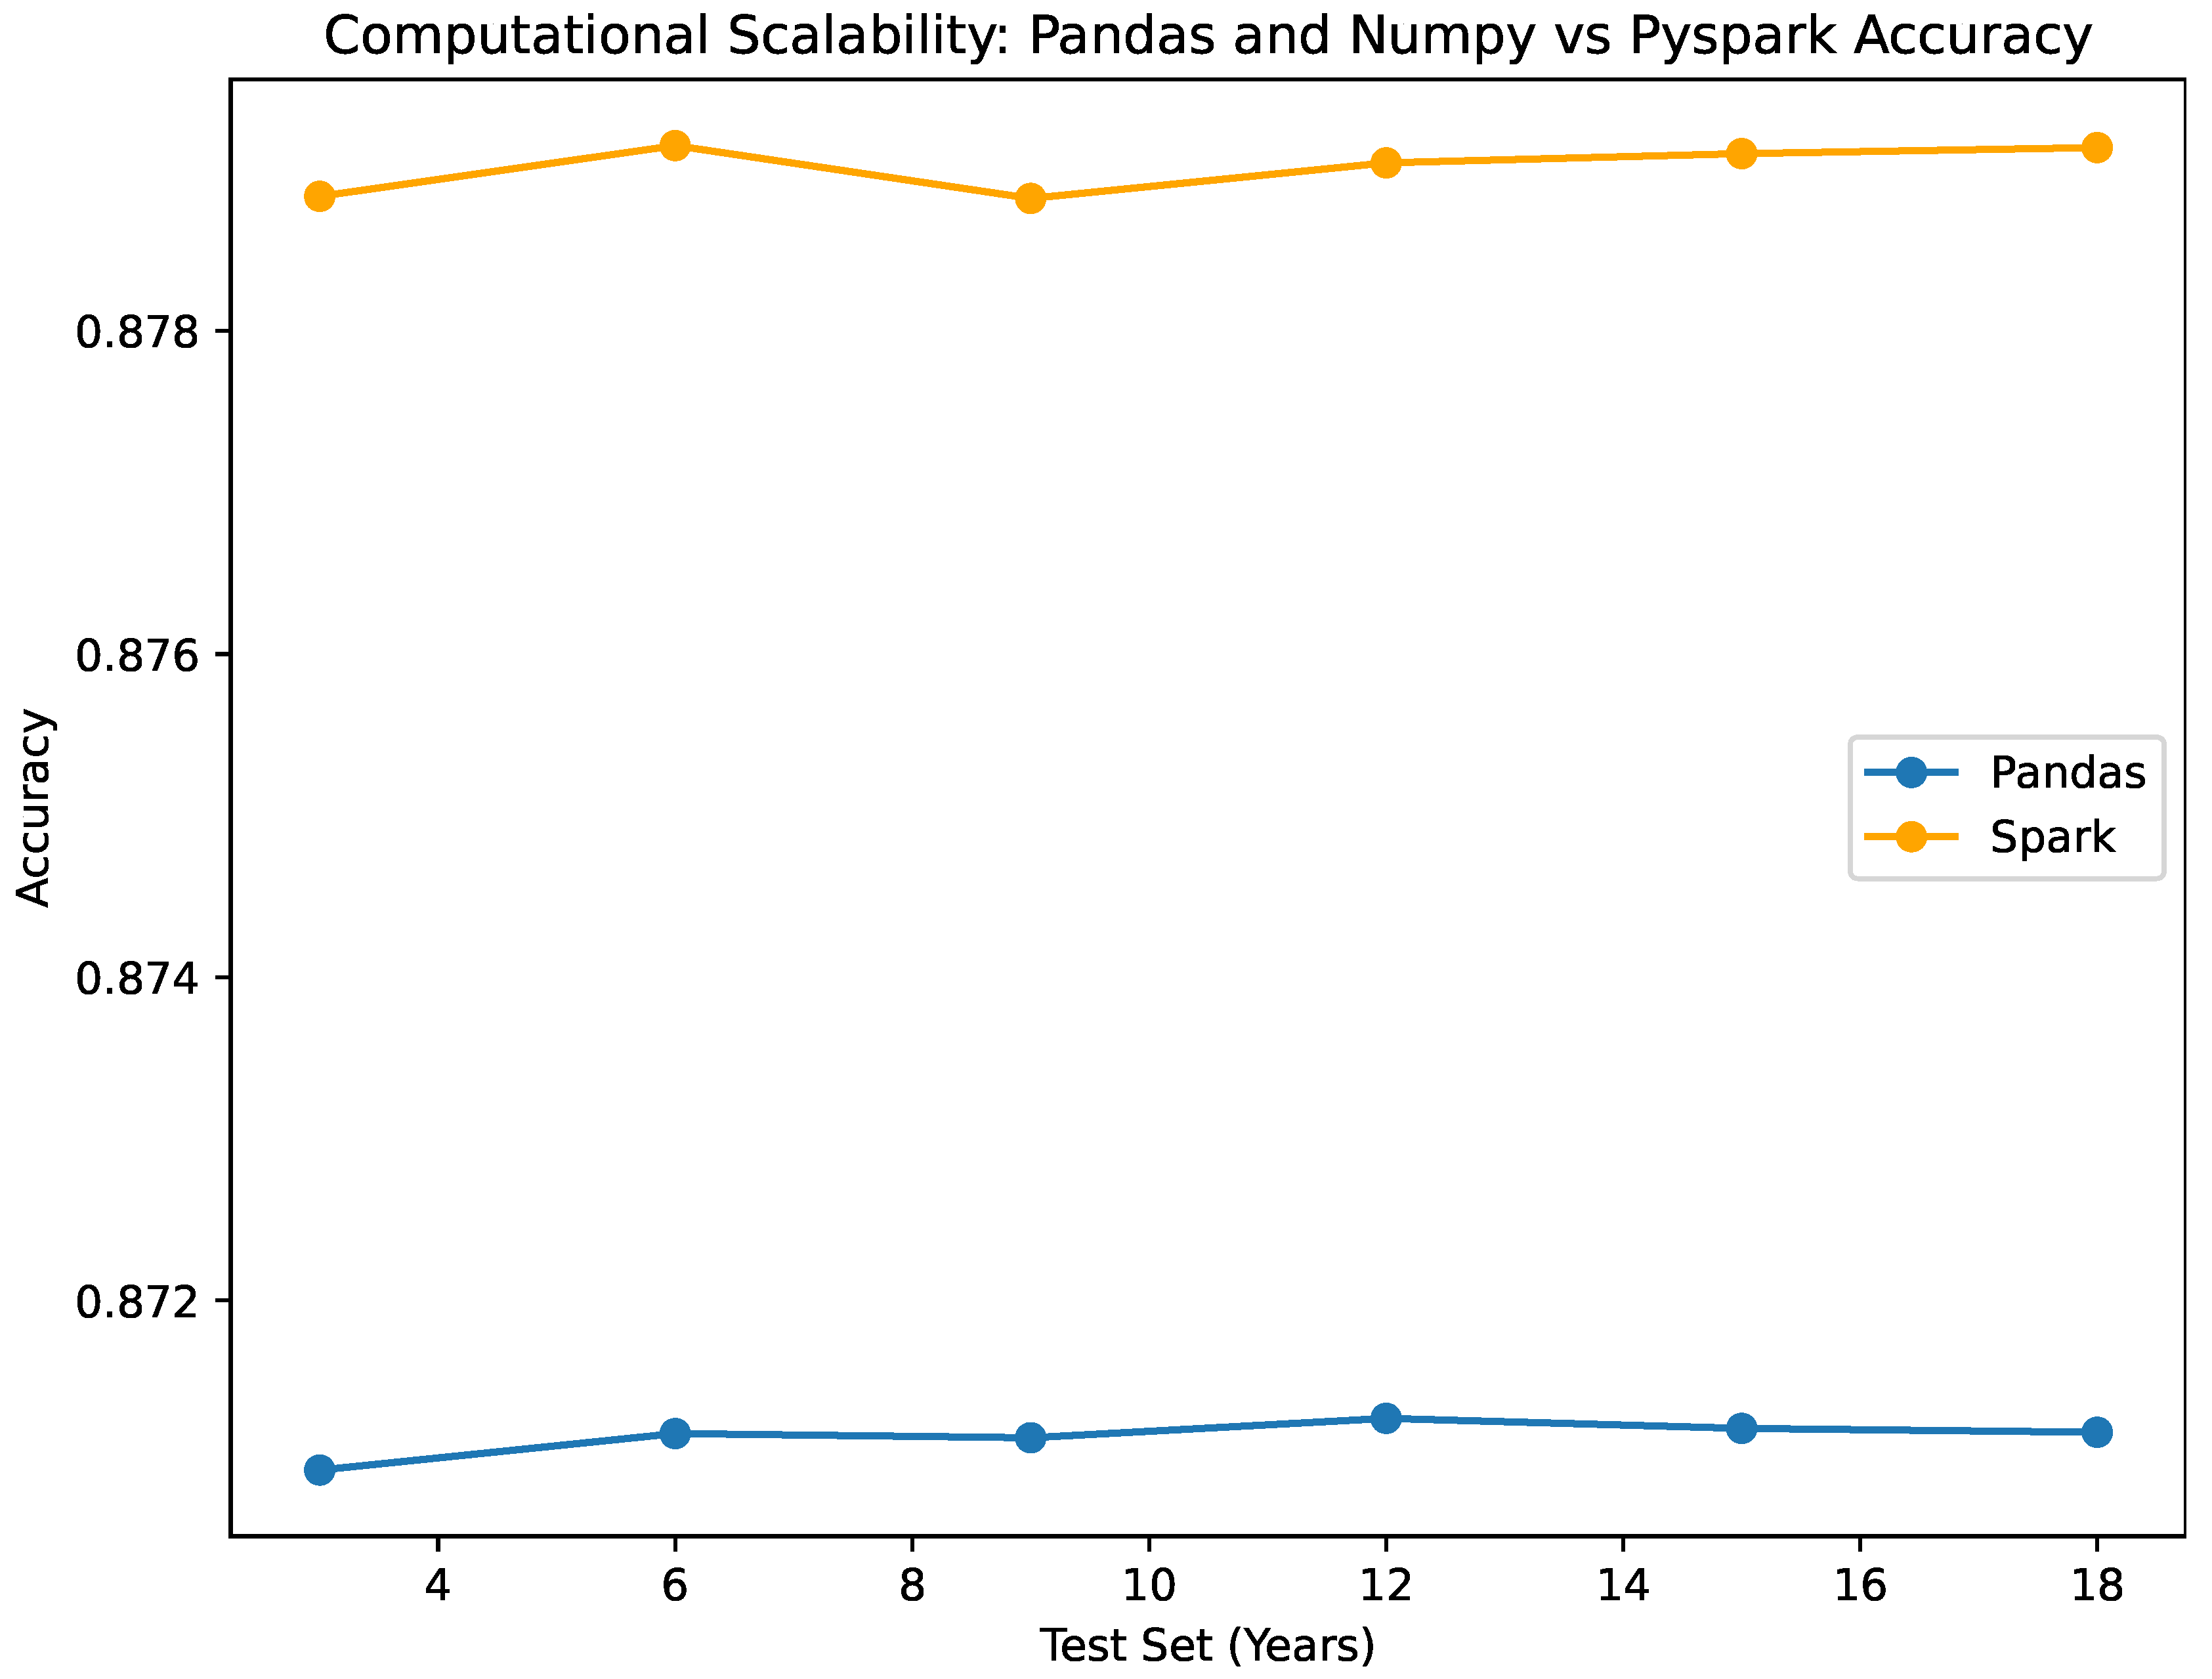
The visualized data in Figure 8, Figure 9, Figure 10, Figure 11 and Figure 12, along with the numerical data represented Table 2 and Table 4 provide insights into the Bayesian Logistic Regression Models using Pyspark vs. using numpy for pandas dataframe analysis on the same test sets and same decision thresholds. We observe that:
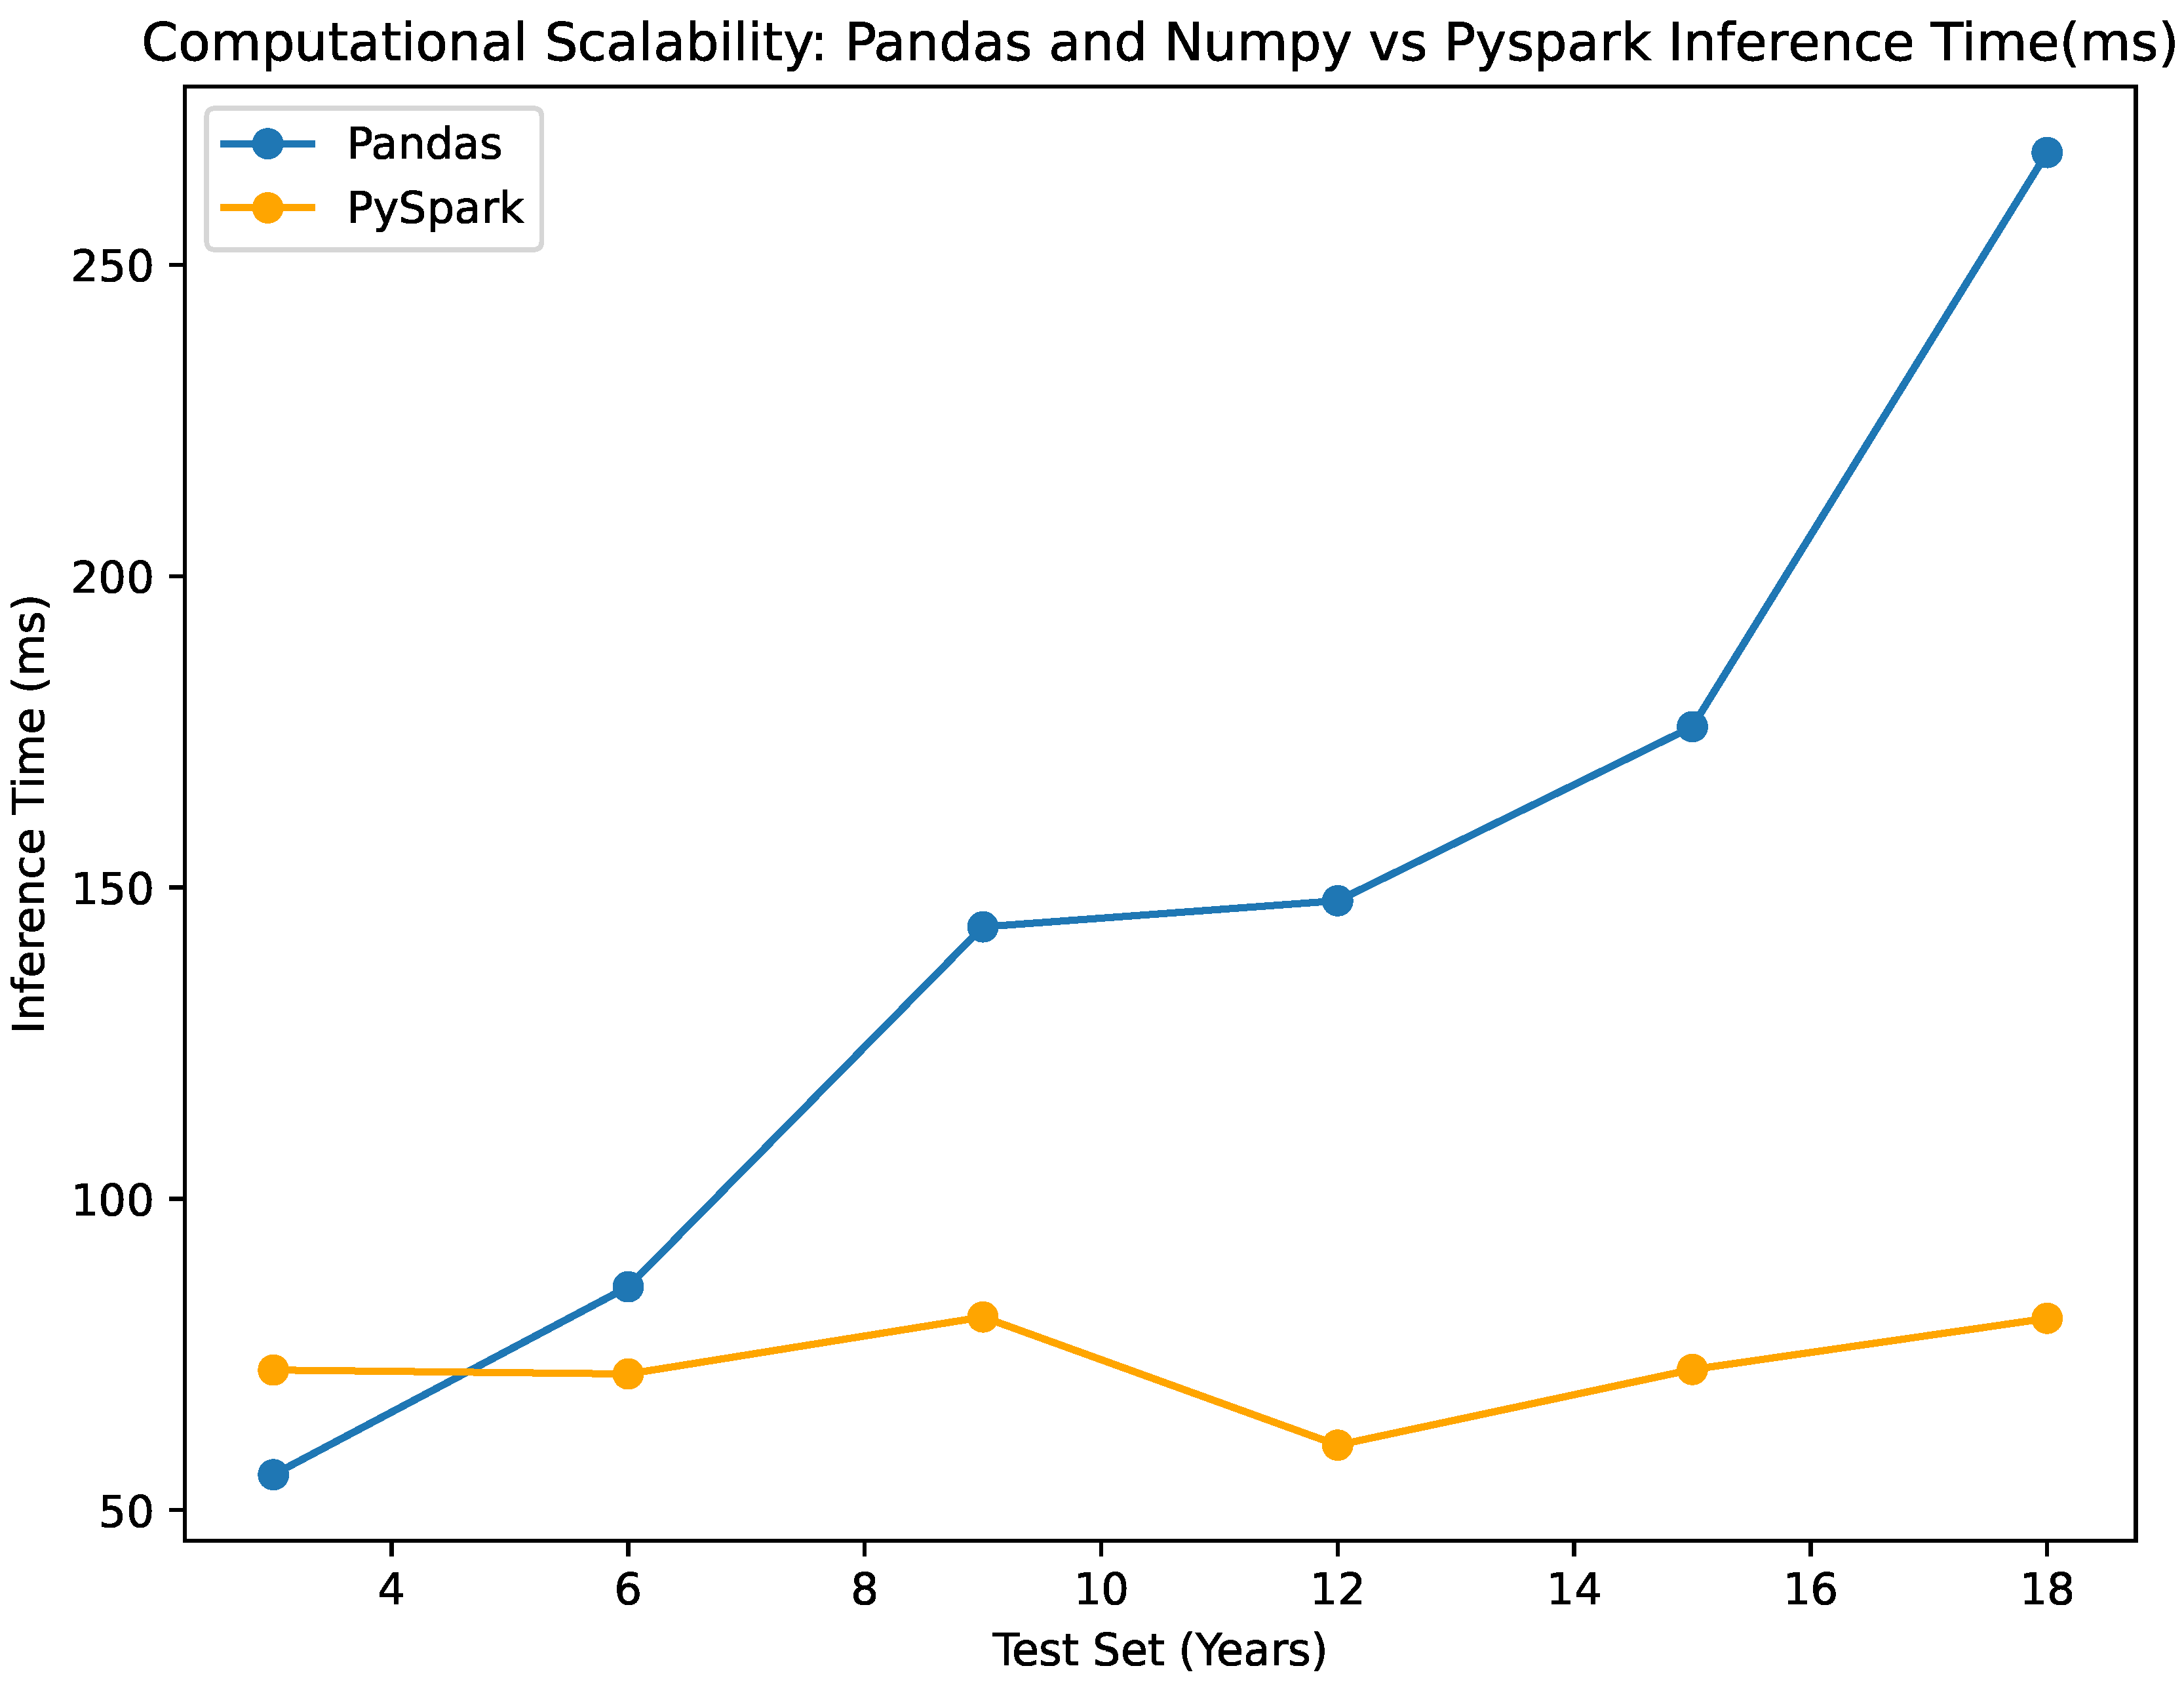
- Inference Time:
- The NumPy and Pandas classifier shows slightly longer inference times compared to the Pyspark classifier for the smaller datasets, while it significantly increases as the data increases. On the other hand, the pyspark classifier maintains an almost stable inference time as the data increases. The inference time for the numpy classifier ranges from 55.694 ms to 268.03 ms, while the Pyspark classifier ranges from 60.44 ms to 81.02 ms, as seen in Table 4. This difference emphasizes the scalability of the Pyspark classifier in terms of prediction time, which is visualized in Figure 12.
- Memory Usage:
- The comparison between the NumPy and Pandas classifier and the PySpark classifier reveals significant differences in memory usage and scalability. The memory consumption of the NumPy and Pandas classifiers varies between 15.3 MB and 89.6 MB, whereas the PySpark classifier consumes between 124 KB and 992 KB, as indicated in Figure 9. The significant disparity in memory consumption underscores the PySpark classifier’s exceptional scalability, given its capacity to process larger test set sizes with minimal memory demands. The system’s memory consumption remains exceptionally modest, irrespective of the escalating dimensions of the test sets. This demonstrates the efficiency with which the PySpark framework manages memory resources and executes distributed processing.
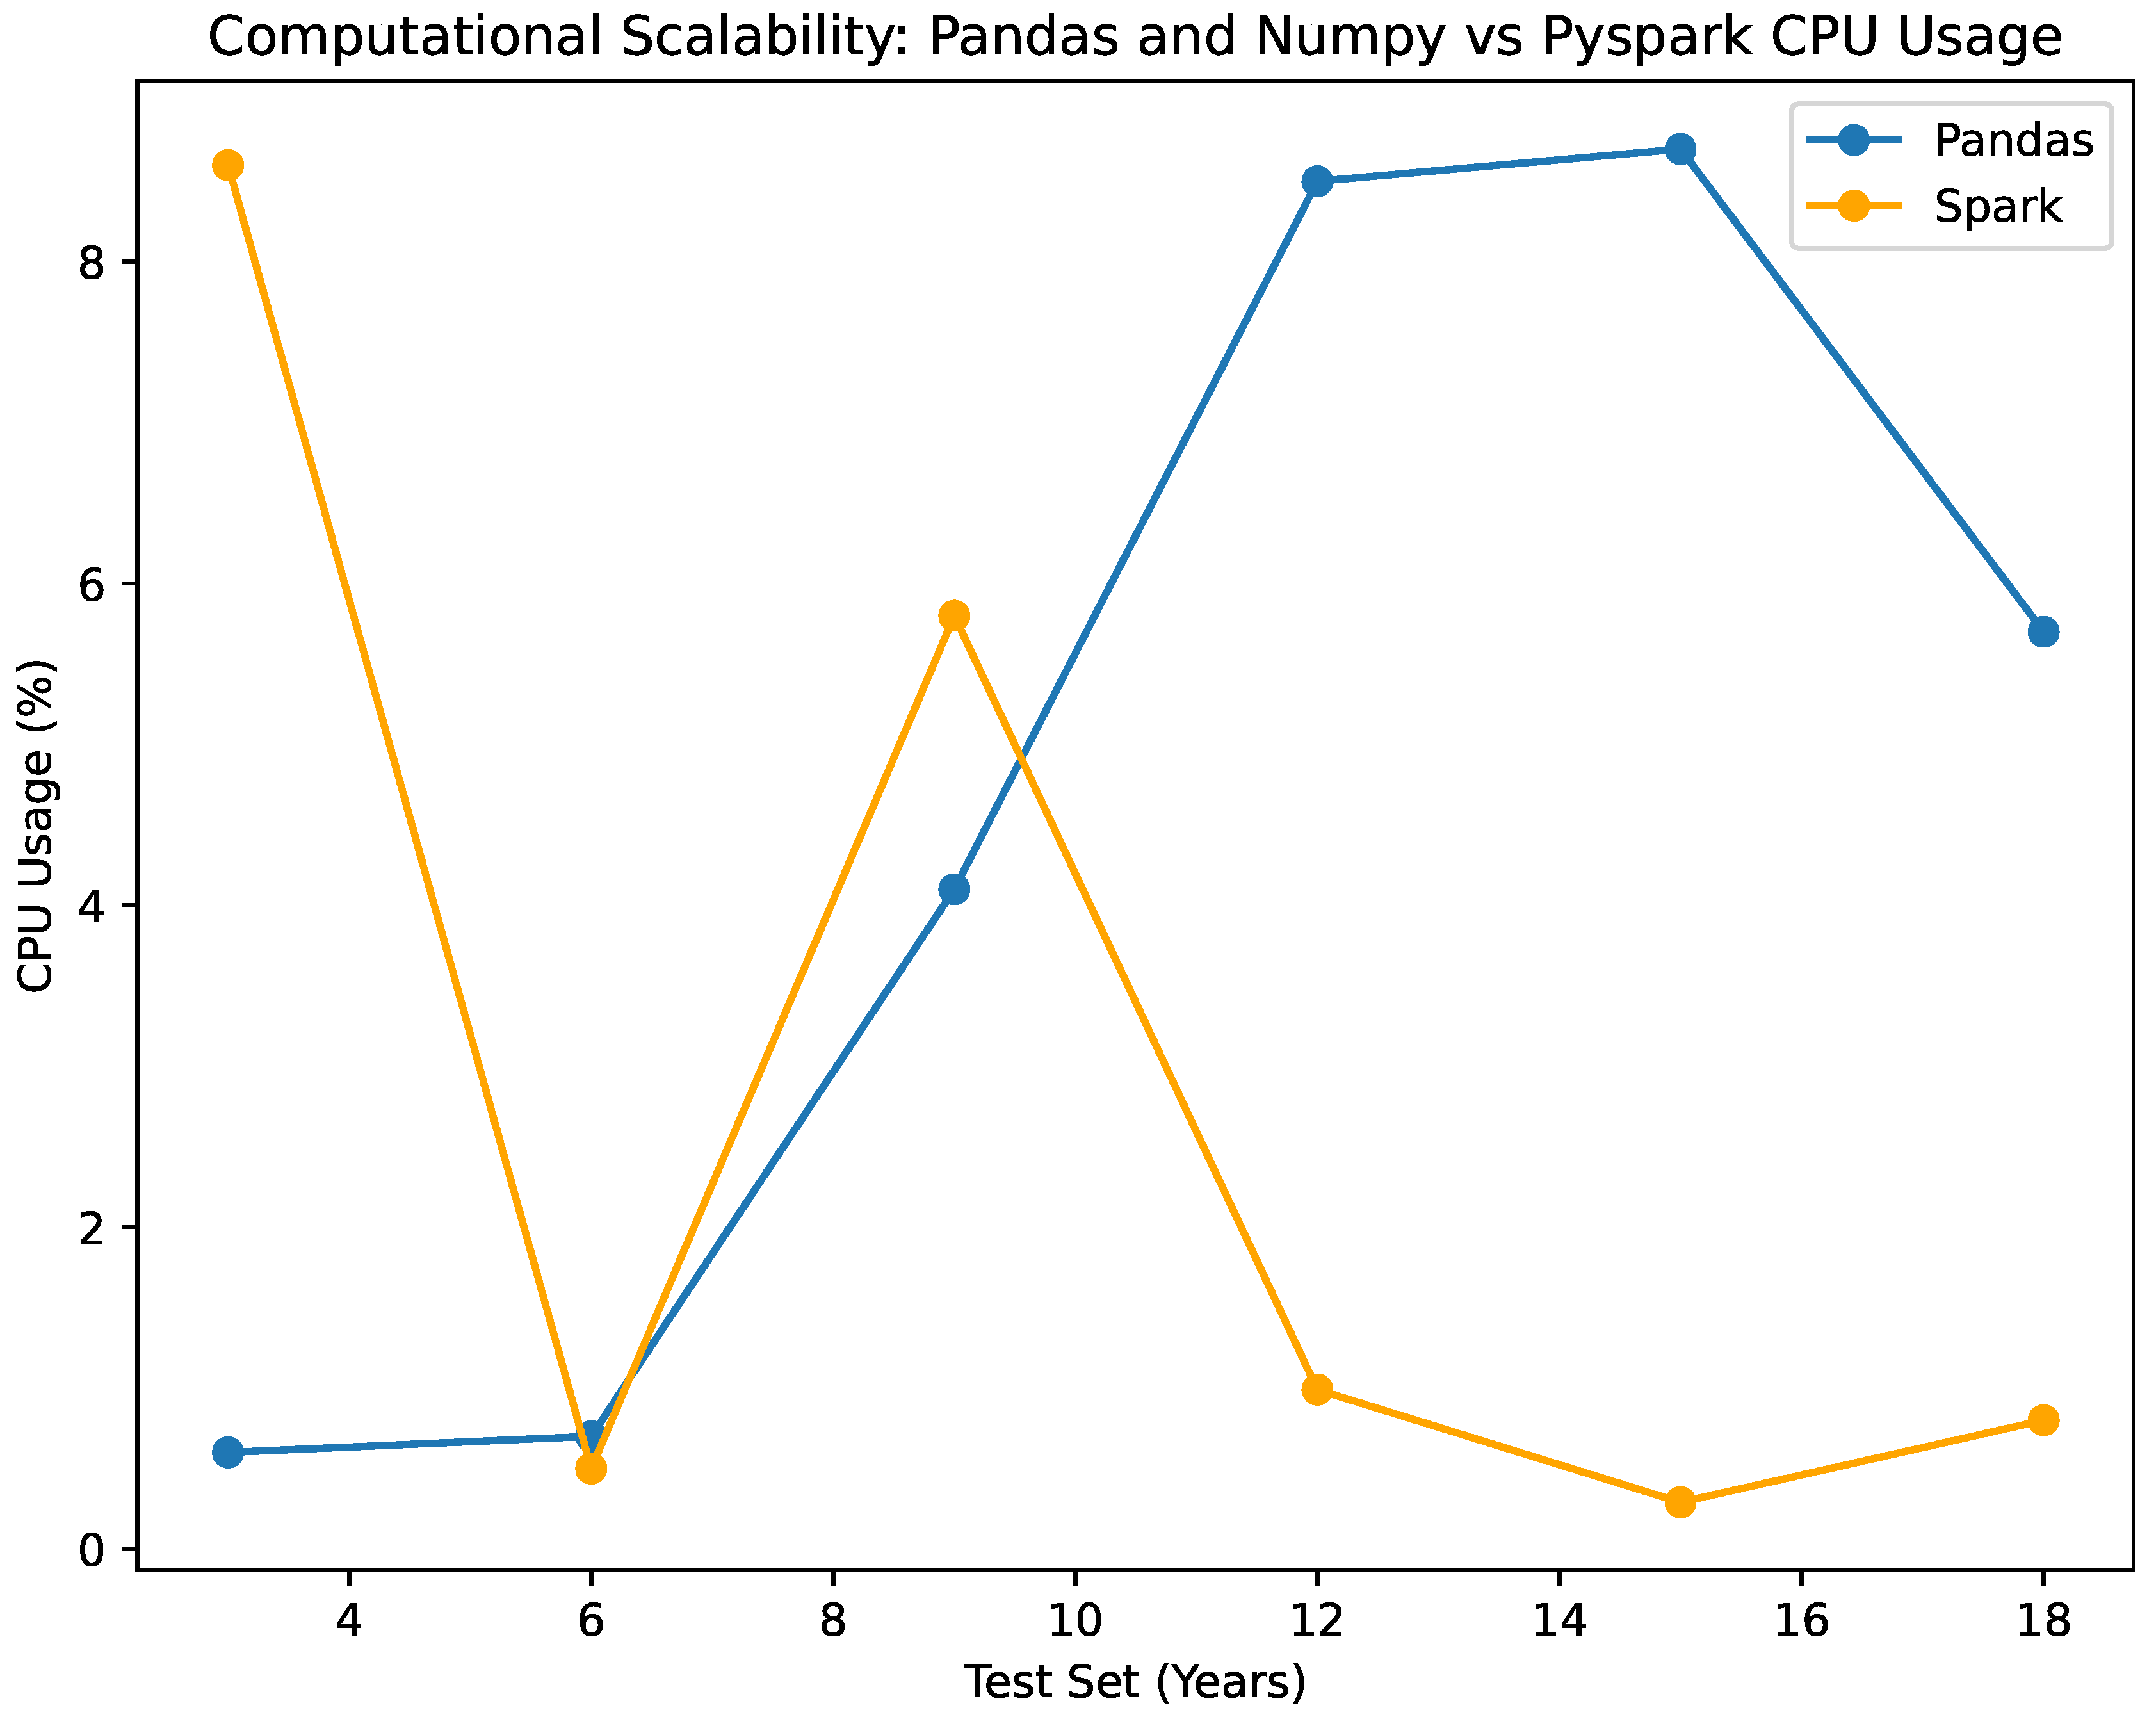
- CPU Usage:
- The CPU utilization of the NumPy-based classifier exhibits negligible fluctuations, ranging only 0.6% to 8.7% across test sets of varying sizes. In the scenario, it has been observed that the Pyspark-based classifier consumes a range of 0.29% to 5.8% of the CPU. Both classifiers exhibit effective utilization of CPU resources; however, it is observed that the NumPy classifier marginally consumes more CPU power as the data size expands. Clearly illustrated in the figure, this once more demonstrates the scalability of the Pyspark classifier by demonstrating its efficacy in utilizing computational resources despite the growth of data as seen in Figure 8.
- Classification Metrics:
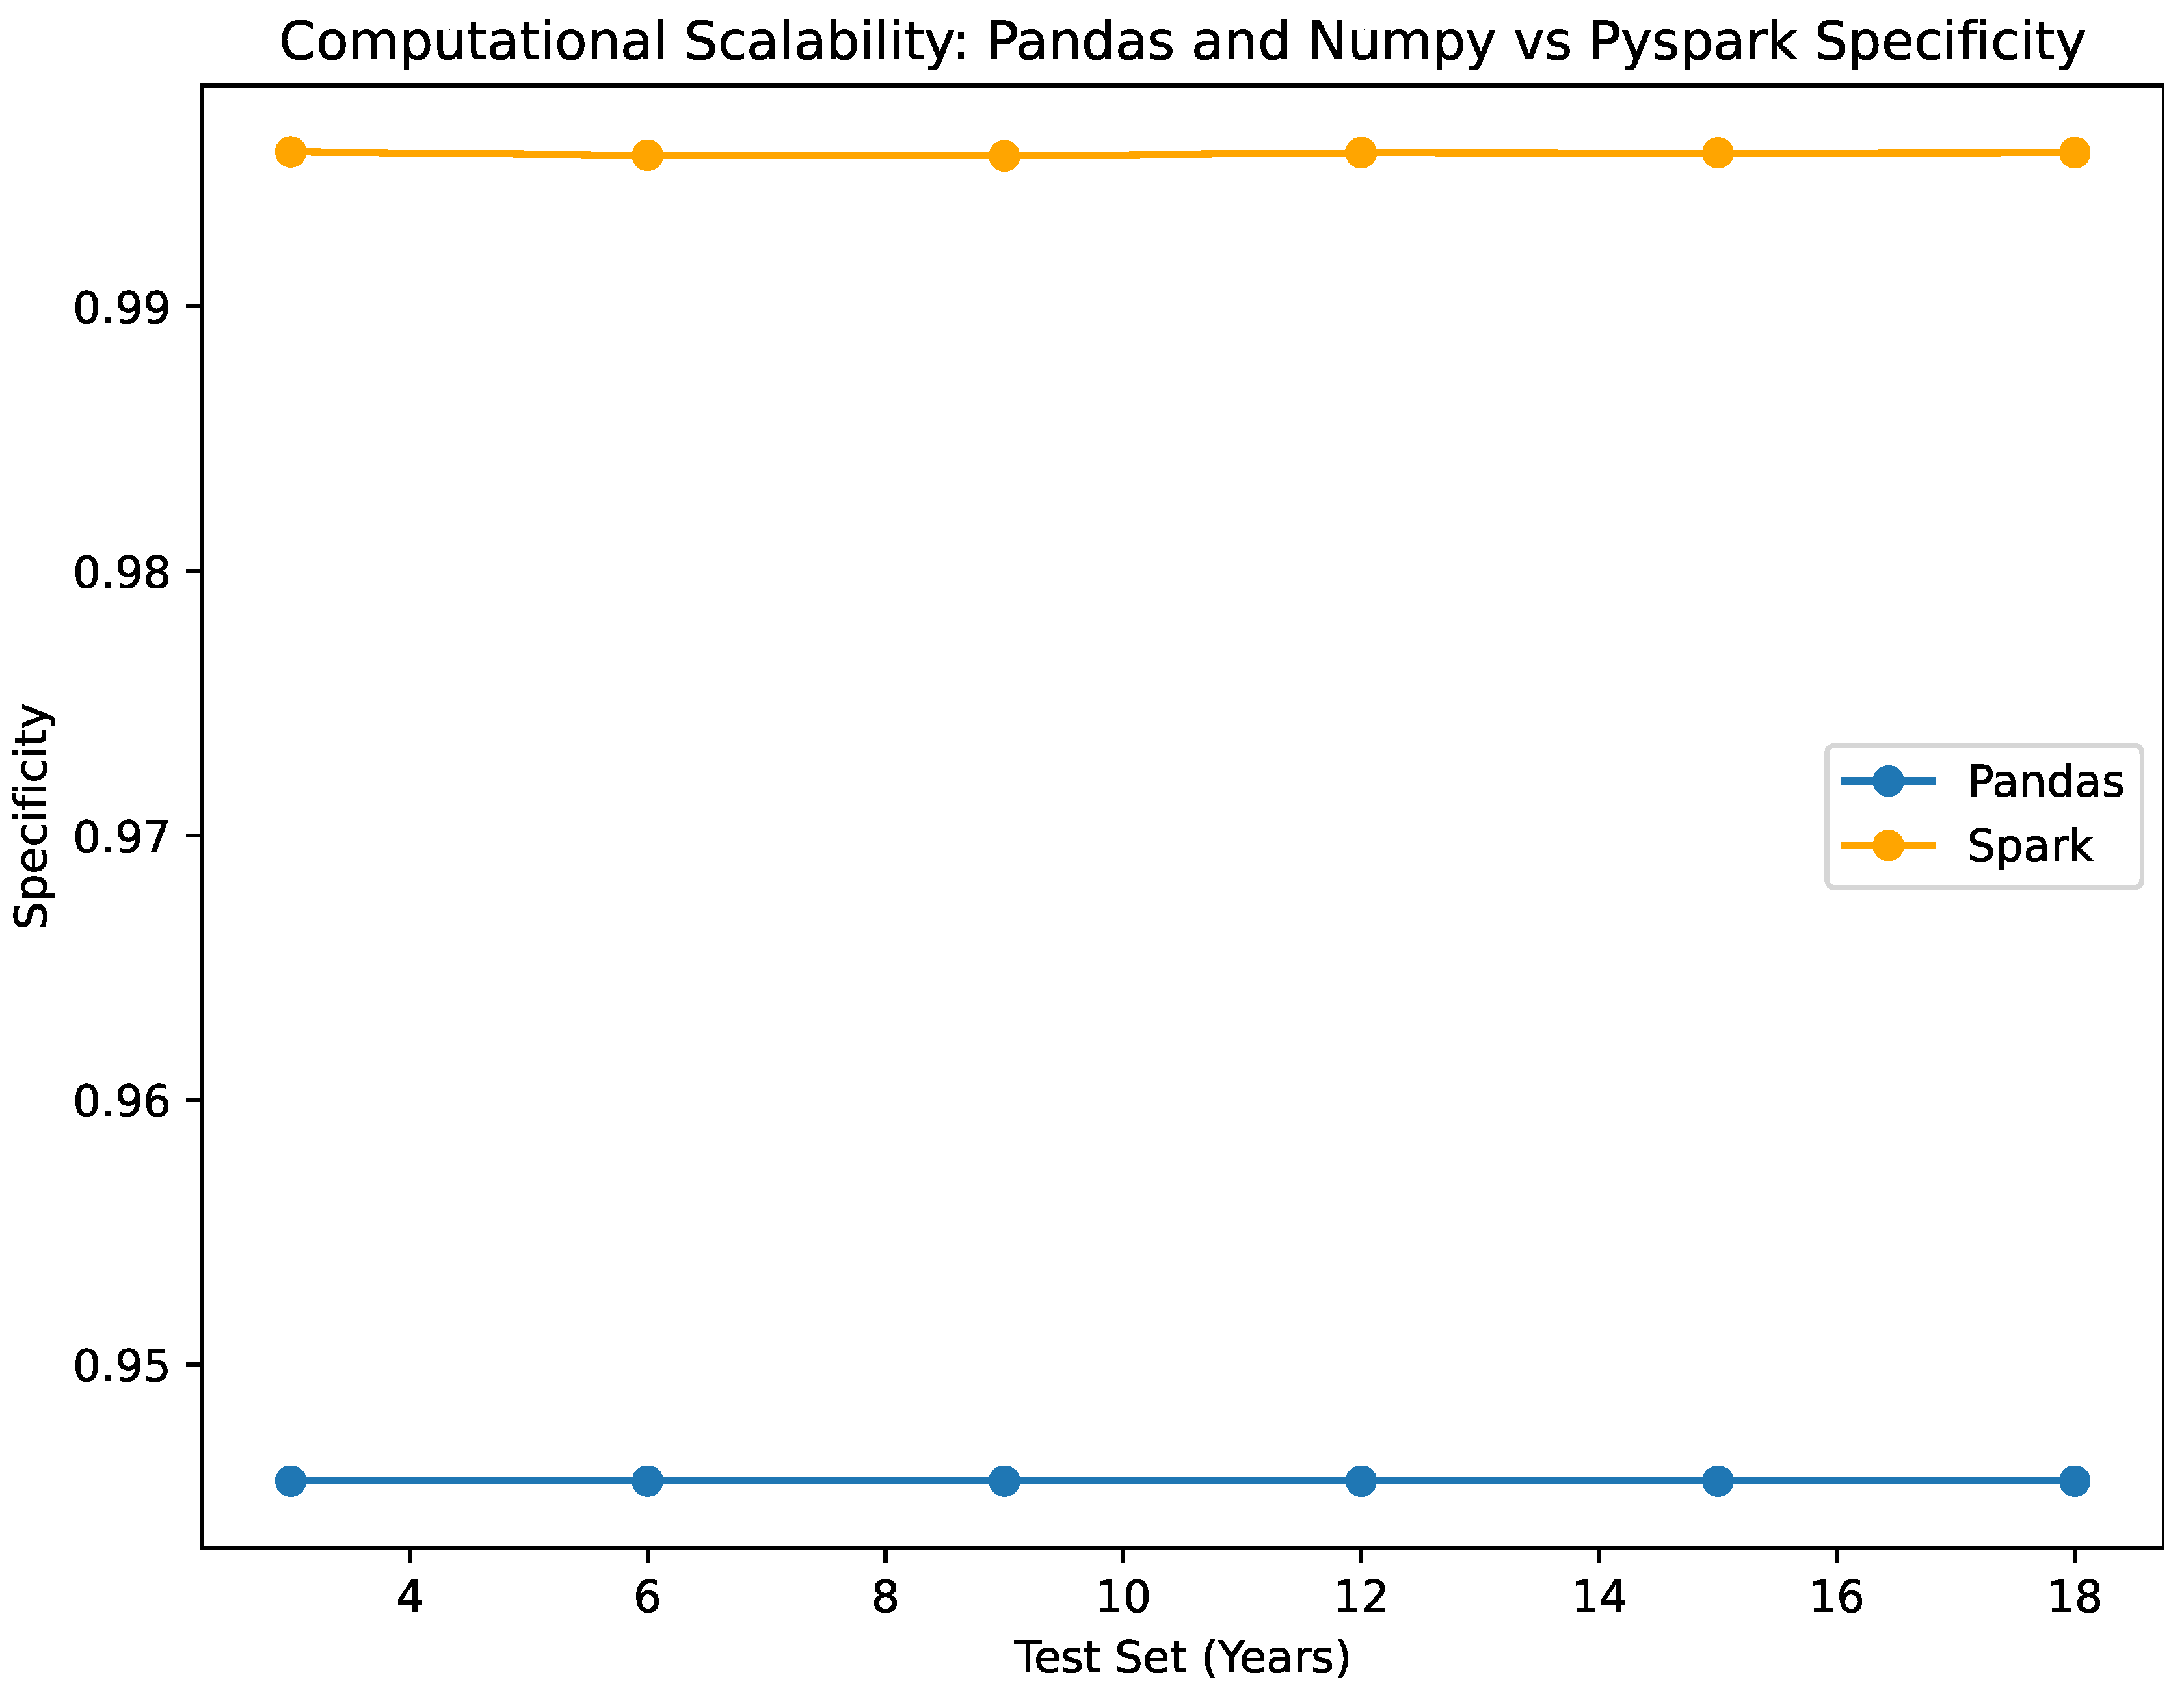
- As per the accuracy, The NumPy and Pandas classifiers exhibit accuracy values spanning from 0.87095 to 0.87127, which are analogous to the accuracy values of 0.87882 to 0.8791466 for the Pyspark classifier. Without regard to the size of the test set, both classifiers exhibit consistent and dependable performance. Specificity: Both classifiers consistently demonstrate a specificity value of 0.945, reflecting their precision in accurately identifying true negative outcomes. This consistent performance across datasets of various sizes emphasizes their effectiveness in correctly detecting negative instances, a critical aspect of our study. These performance metrics are illustrated in Figure 10, Figure 11, Figure 12, Figure 13 and Figure 14.
5. Discussion
The experimental analysis of the EVCA Classifier presented in the previous section, provides us with some significant insights that are discussed here. By seamlessly integrating Bayesian machine learning and distributed data processing, this classifier exhibits considerable promise in the examination of extensive environmental datasets. It is distinguished by the high level of consistency and efficacy it maintains when applied to test sets of different sizes. One notable feature is the classifier’s dependable identification of genuine negative outcomes, which is an essential component in the analysis of environmental data where erroneous conclusions can have severe repercussions. The feature in question is of the utmost importance, given that erroneously classifying hazardous conditions as secure could result in severe consequences in the real world, such as the issuance of air quality advisories.
The scalability analysis of the classifier demonstrates its praiseworthy ability to accommodate growing volumes of data. The aforementioned demonstrates the effective amalgamation of Bayesian MCMC classifiers and Apache Spark, as well as the versatility of the Python ecosystem in facilitating such intricate computational endeavors. An examination of the Bayesian and Frequentist approaches, utilizing the identical logistic regression model in Spark, reveals that the Bayesian classifier exhibits enhanced recall and specificity. This suggests that situations in which accurately identifying true negatives is more critical than accurately identifying true positives are better suited for the Bayesian approach. In terms of computational resources, the increasing demand for memory and inference time in response to larger data volumes highlights the persistent necessity for developments in distributed computing frameworks that can manage large-scale data more efficiently. Notwithstanding these obstacles, the research illustrates that Apache Spark, when appropriately configured, functions as a resilient infrastructure for carrying out complex machine-learning operations, including Bayesian MCMC sampling.
In conclusion, our research underscores the effectiveness of the EVCA Classifier in handling extensive and intricate datasets and establishes a foundation for future investigations concerning the integration of Bayesian techniques with distributed computing. With the continuous progress of technology, there exists a significant potential to enhance these methodologies, thereby potentially surmounting existing constraints and augmenting the effectiveness and practicality of classifiers such as EVCA in the context of big data applications.
6. Conclusions and Future Work
During our investigation, of the Distributed Bayesian Inference Classifier presented in this work, we have identified crucial findings that underscore the resilience and effectiveness of the classifier. One notable characteristic of the classifier is its remarkable feature of effectively managing substantial quantities of data, consistently maintaining its performance. The aforementioned attribute holds significant importance as it illustrates the capacity of the system to efficiently manage expanding datasets, thereby rendering it an invaluable instrument for the ever-increasing and developing expanding IoT domain.
The classifier is successful, especially when it comes to memory use and other relevant parameters. It is expected that memory requirements will be directly proportional to the number of datasets. We must highlight that this rise has clear and unclear bounds. This finding shows that the classifier can handle massive data sets due to its resource efficiency. CPU resource utilization by the predictor must also be assessed. Large data collections can be handled effectively without increased hardware or computing power. One of its many advantages is its ability to interface with current systems without change. Accurate findings also rely on the classifier’s ability to consistently predict values near to reality. Accuracy and uniqueness are vital to Internet of Things (IoT) system studies due to their potential impact. Classifier implementation provides important information including processing speed, accuracy, and memory reuse efficiency. The classifier meets IoT system criteria. However, our research has revealed potential Bayesian inference-distributed machine learning combinations. The findings of this study open up new possibilities for creative collaborations in that field. Addressing these difficulties opens up opportunities for cooperation across disciplines, which might lead to better-distributed machine learning frameworks and more effective Bayesian approaches in distributed settings.
The classifier demonstrates considerable and positive prospective capabilities. Further research could be devoted to the practical implementation of this classifier in Internet of Things (IoT) environments. Such investigations would provide a more comprehensive comprehension of the classifier’s true performance capabilities and constraints. By incorporating adaptive learning functionalities, the classifier acquires the capacity to independently adapt to changing data, thereby establishing an additional trajectory of success. Furthermore, it is crucial to investigate supplementary methodologies that could further diminish memory consumption, such as the integration of advanced data partitioning or compression strategies. Expanding the classifier’s capabilities to handle intricate, unstructured data types has the potential to significantly increase its applicability across a multitude of Internet of Things domains. As of now, this classifier has effectively laid a strong foundation, and further investigation is expected to solidify its position as a standard instrument for handling extensive datasets within the Internet of Things frameworks.
Author Contributions
E.V., A.K., C.K., L.T., C.H. and S.S., conceived of the idea, designed and performed the experiments, analysed the results, drafted the initial manuscript and revised the final manuscript. All authors have read and agreed to the published version of the manuscript.
Funding
This research received no external funding.
Data Availability Statement
The data presented in this study are available on request from the corresponding author.
Conflicts of Interest
The authors declare no conflict of interest.
References
- Guhaniyogi, R.; Li, C.; Savitsky, T.; Srivastava, S. Distributed Bayesian inference in massive spatial data. Stat. Sci. 2023, 38, 262–284. [Google Scholar] [CrossRef]
- Srivastava, S.; Xu, Y. Distributed Bayesian inference in linear mixed-effects models. J. Comput. Graph. Stat. 2021, 30, 594–611. [Google Scholar] [CrossRef]
- Ye, B.; Qin, J.; Fu, W.; Zhu, Y.; Wang, Y.; Kang, Y. Distributed Bayesian inference over sensor networks. IEEE Trans. Cybern. 2021, 53, 1587–1597. [Google Scholar] [CrossRef] [PubMed]
- Yu, Z.; Chen, F.; Liu, J.K. Sampling-Tree Model: Efficient Implementation of Distributed Bayesian Inference in Neural Networks. IEEE Trans. Cogn. Dev. Syst. 2020, 12, 497–510. [Google Scholar] [CrossRef]
- Zhou, C.; Li, Q.; Tham, C.K. Information-Driven Distributed Sensing for Efficient Bayesian Inference in Internet of Things Systems. In Proceedings of the 2018 15th Annual IEEE International Conference on Sensing, Communication, and Networking (SECON), Hong Kong, China, 11–13 June 2018; pp. 1–9. [Google Scholar] [CrossRef]
- Vadera, M.P.; Marlin, B.M. Challenges and Opportunities in Approximate Bayesian Deep Learning for Intelligent IoT Systems. In Proceedings of the 2021 IEEE Third International Conference on Cognitive Machine Intelligence (CogMI), Virtual, 13–15 December 2021; pp. 252–261. [Google Scholar] [CrossRef]
- Khan, F.M.; Baccour, E.; Erbad, A.; Hamdi, M. Adaptive ResNet Architecture for Distributed Inference in Resource-Constrained IoT Systems. In Proceedings of the 2023 International Wireless Communications and Mobile Computing (IWCMC), Dubrovnik, Croatia, 30 May–3 June 2023; pp. 1543–1549. [Google Scholar] [CrossRef]
- Yao, S.; Zhao, Y.; Shao, H.; Zhang, C.; Zhang, A.; Liu, D.; Liu, S.; Su, L.; Abdelzaher, T. ApDeepSense: Deep Learning Uncertainty Estimation without the Pain for IoT Applications. In Proceedings of the 2018 IEEE 38th International Conference on Distributed Computing Systems (ICDCS), Vienna, Austria, 2–6 July 2018; pp. 334–343. [Google Scholar] [CrossRef]
- Baccour, E.; Erbad, A.; Mohamed, A.; Hamdi, M.; Guizani, M. RL-DistPrivacy: Privacy-Aware Distributed Deep Inference for Low Latency IoT Systems. IEEE Trans. Netw. Sci. Eng. 2022, 9, 2066–2083. [Google Scholar] [CrossRef]
- Ullah, I.; Kim, J.B.; Han, Y.H. Compound Context-Aware Bayesian Inference Scheme for Smart IoT Environment. Sensors 2022, 22, 3022. [Google Scholar] [CrossRef] [PubMed]
- Arellanes, D.; Lau, K.K. Decentralized data flows in algebraic service compositions for the scalability of IoT systems. In Proceedings of the 2019 IEEE 5th World Forum on Internet of Things (WF-IoT), Limerick, Ireland, 15–18 April 2019; pp. 668–673. [Google Scholar]
- Nägele, T.; Hooman, J. Scalability analysis of cloud-based distributed simulations of IoT systems using HLA. In Proceedings of the 2018 IEEE 24th International Conference on Parallel and Distributed Systems (ICPADS), Singapore, 11–13 December 2018; pp. 1075–1080. [Google Scholar]
- Gelenbe, E.; Nakıp, M.; Marek, D.; Czachorski, T. Diffusion analysis improves scalability of IoT networks to mitigate the massive access problem. In Proceedings of the 2021 29th International Symposium on Modeling, Analysis, and Simulation of Computer and Telecommunication Systems (MASCOTS), Virtual, 3–5 November 2021; pp. 1–8. [Google Scholar]
- Raut, A.; Kumar, D.; Chaurasiya, V.K.; Kumar, M. Distributed Decision Fusion for Large Scale IoT- Ecosystem. In Proceedings of the 2022 IEEE 15th International Symposium on Embedded Multicore/Many-Core Systems-on-Chip (MCSoC), Penang, Malaysia, 19–22 December 2022; pp. 112–119. [Google Scholar] [CrossRef]
- Akbar, A.; Kousiouris, G.; Pervaiz, H.; Sancho, J.; Ta-Shma, P.; Carrez, F.; Moessner, K. Real-Time Probabilistic Data Fusion for Large-Scale IoT Applications. IEEE Access 2018, 6, 10015–10027. [Google Scholar] [CrossRef]
- Chen, Y.; Kar, S.; Moura, J.M. The Internet of Things: Secure Distributed Inference. IEEE Signal Process. Mag. 2018, 35, 64–75. [Google Scholar] [CrossRef]
- Kurniawan, A.; Kyas, M. A trust model-based Bayesian decision theory in large scale Internet of Things. In Proceedings of the 2015 IEEE Tenth International Conference on Intelligent Sensors, Sensor Networks and Information Processing (ISSNIP), Singapore, 7–9 April 2015; pp. 1–5. [Google Scholar] [CrossRef]
- Krishnamachari, B.; Iyengar, S. Distributed Bayesian algorithms for fault-tolerant event region detection in wireless sensor networks. IEEE Trans. Comput. 2004, 53, 241–250. [Google Scholar] [CrossRef]
- Janakiram, D.; Kumar, A.; Reddy V., A.M. Outlier Detection in Wireless Sensor Networks using Bayesian Belief Networks. In Proceedings of the 2006 1st International Conference on Communication Systems Software & Middleware, New Delhi, India, 8–12 January 2006; pp. 1–6. [Google Scholar] [CrossRef]
- Momani, M.; Challa, S.; Al-Hmouz, R. Bayesian Fusion Algorithm for Inferring Trust in Wireless Sensor Networks. J. Netw. 2010, 5, 815–822. [Google Scholar] [CrossRef]
- Vlachou, E.; Karras, C.; Karras, A.; Tsolis, D.; Sioutas, S. EVCA Classifier: A MCMC-Based Classifier for Analyzing High-Dimensional Big Data. Information 2023, 14, 451. [Google Scholar] [CrossRef]
- Salvatier, J.; Wiecki, T.V.; Fonnesbeck, C. Probabilistic programming in Python using PyMC3. Peerj Comput. Sci. 2016, 2, e55. [Google Scholar] [CrossRef]
- Ayuntamiento de Madrid. Calidad del Aire. Datos Horarios desde 2001; Portal de Datos Abiertos del Ayuntamiento de Madrid: Madrid, Spain, 2018.
- Soluciones, D. Air Quality in Madrid (2001–2018); Kaggle: San Francisco, CA, USA, 2018. [Google Scholar]
- Bañuelos-Gimeno, J.; Sobrino, N.; Arce-Ruiz, R.M. Effects of Mobility Restrictions on Air Pollution in the Madrid Region during the COVID-19 Pandemic and Post-Pandemic Periods. Sustainability 2023, 15, 12702. [Google Scholar] [CrossRef]
- Ayuntamiento de Madrid. Intérprete de Ficheros de Datos Horarios—Diarios y Tiempo Real; Dirección General de Sostenibilidad y Control Ambiental Subdirección General de Sostenibilidad: Madrid, Spain, 2018.
Figure 1.
Bayesian vs. Frequentist Logistic Regression in Pyspark: Confusion Matrices for each test set for 3, 6, and 9 years.
Figure 1.
Bayesian vs. Frequentist Logistic Regression in Pyspark: Confusion Matrices for each test set for 3, 6, and 9 years.

Figure 2.
Bayesian vs. Frequentist Logistic Regression in Pyspark: Confusion Matrices for each test set for 12, 15, and 18 years.
Figure 2.
Bayesian vs. Frequentist Logistic Regression in Pyspark: Confusion Matrices for each test set for 12, 15, and 18 years.

Figure 3.
Bayesian and Frequentist Logistic Regression in Pyspark: Inference time in ms.

Figure 4.
Bayesian and Frequentist Logistic Regression in Pyspark: CPU Usage Percentage(%).

Figure 5.
Bayesian and Frequentist Logistic Regression in Pyspark: Memory Usage in KB.

Figure 6.
Bayesian and Frequentist Logistic Regression in Pyspark: Total Classification accuracy.

Figure 7.
Bayesian and Frequentist Logistic Regression in Pyspark: Classification Specificity.

Figure 8.
Bayesian Logistic Regression using 1. Pyspark 2. numpy and pandas: CPU Usage Percentage (%).
Figure 8.
Bayesian Logistic Regression using 1. Pyspark 2. numpy and pandas: CPU Usage Percentage (%).

Figure 9.
Bayesian Logistic Regression using 1. Pyspark 2. numpy and pandas: Memory Usage in MB.

Figure 10.
Bayesian Logistic Regression using 1. Pyspark 2. numpy and pandas: Total Classification accuracy.
Figure 10.
Bayesian Logistic Regression using 1. Pyspark 2. numpy and pandas: Total Classification accuracy.

Figure 11.
Bayesian Logistic Regression using 1. Pyspark 2. numpy and pandas: Classification Specificity.
Figure 11.
Bayesian Logistic Regression using 1. Pyspark 2. numpy and pandas: Classification Specificity.

Figure 12.
Bayesian Logistic Regression using 1. Pyspark 2. numpy and pandas: Inference Time in ms.

Figure 13.
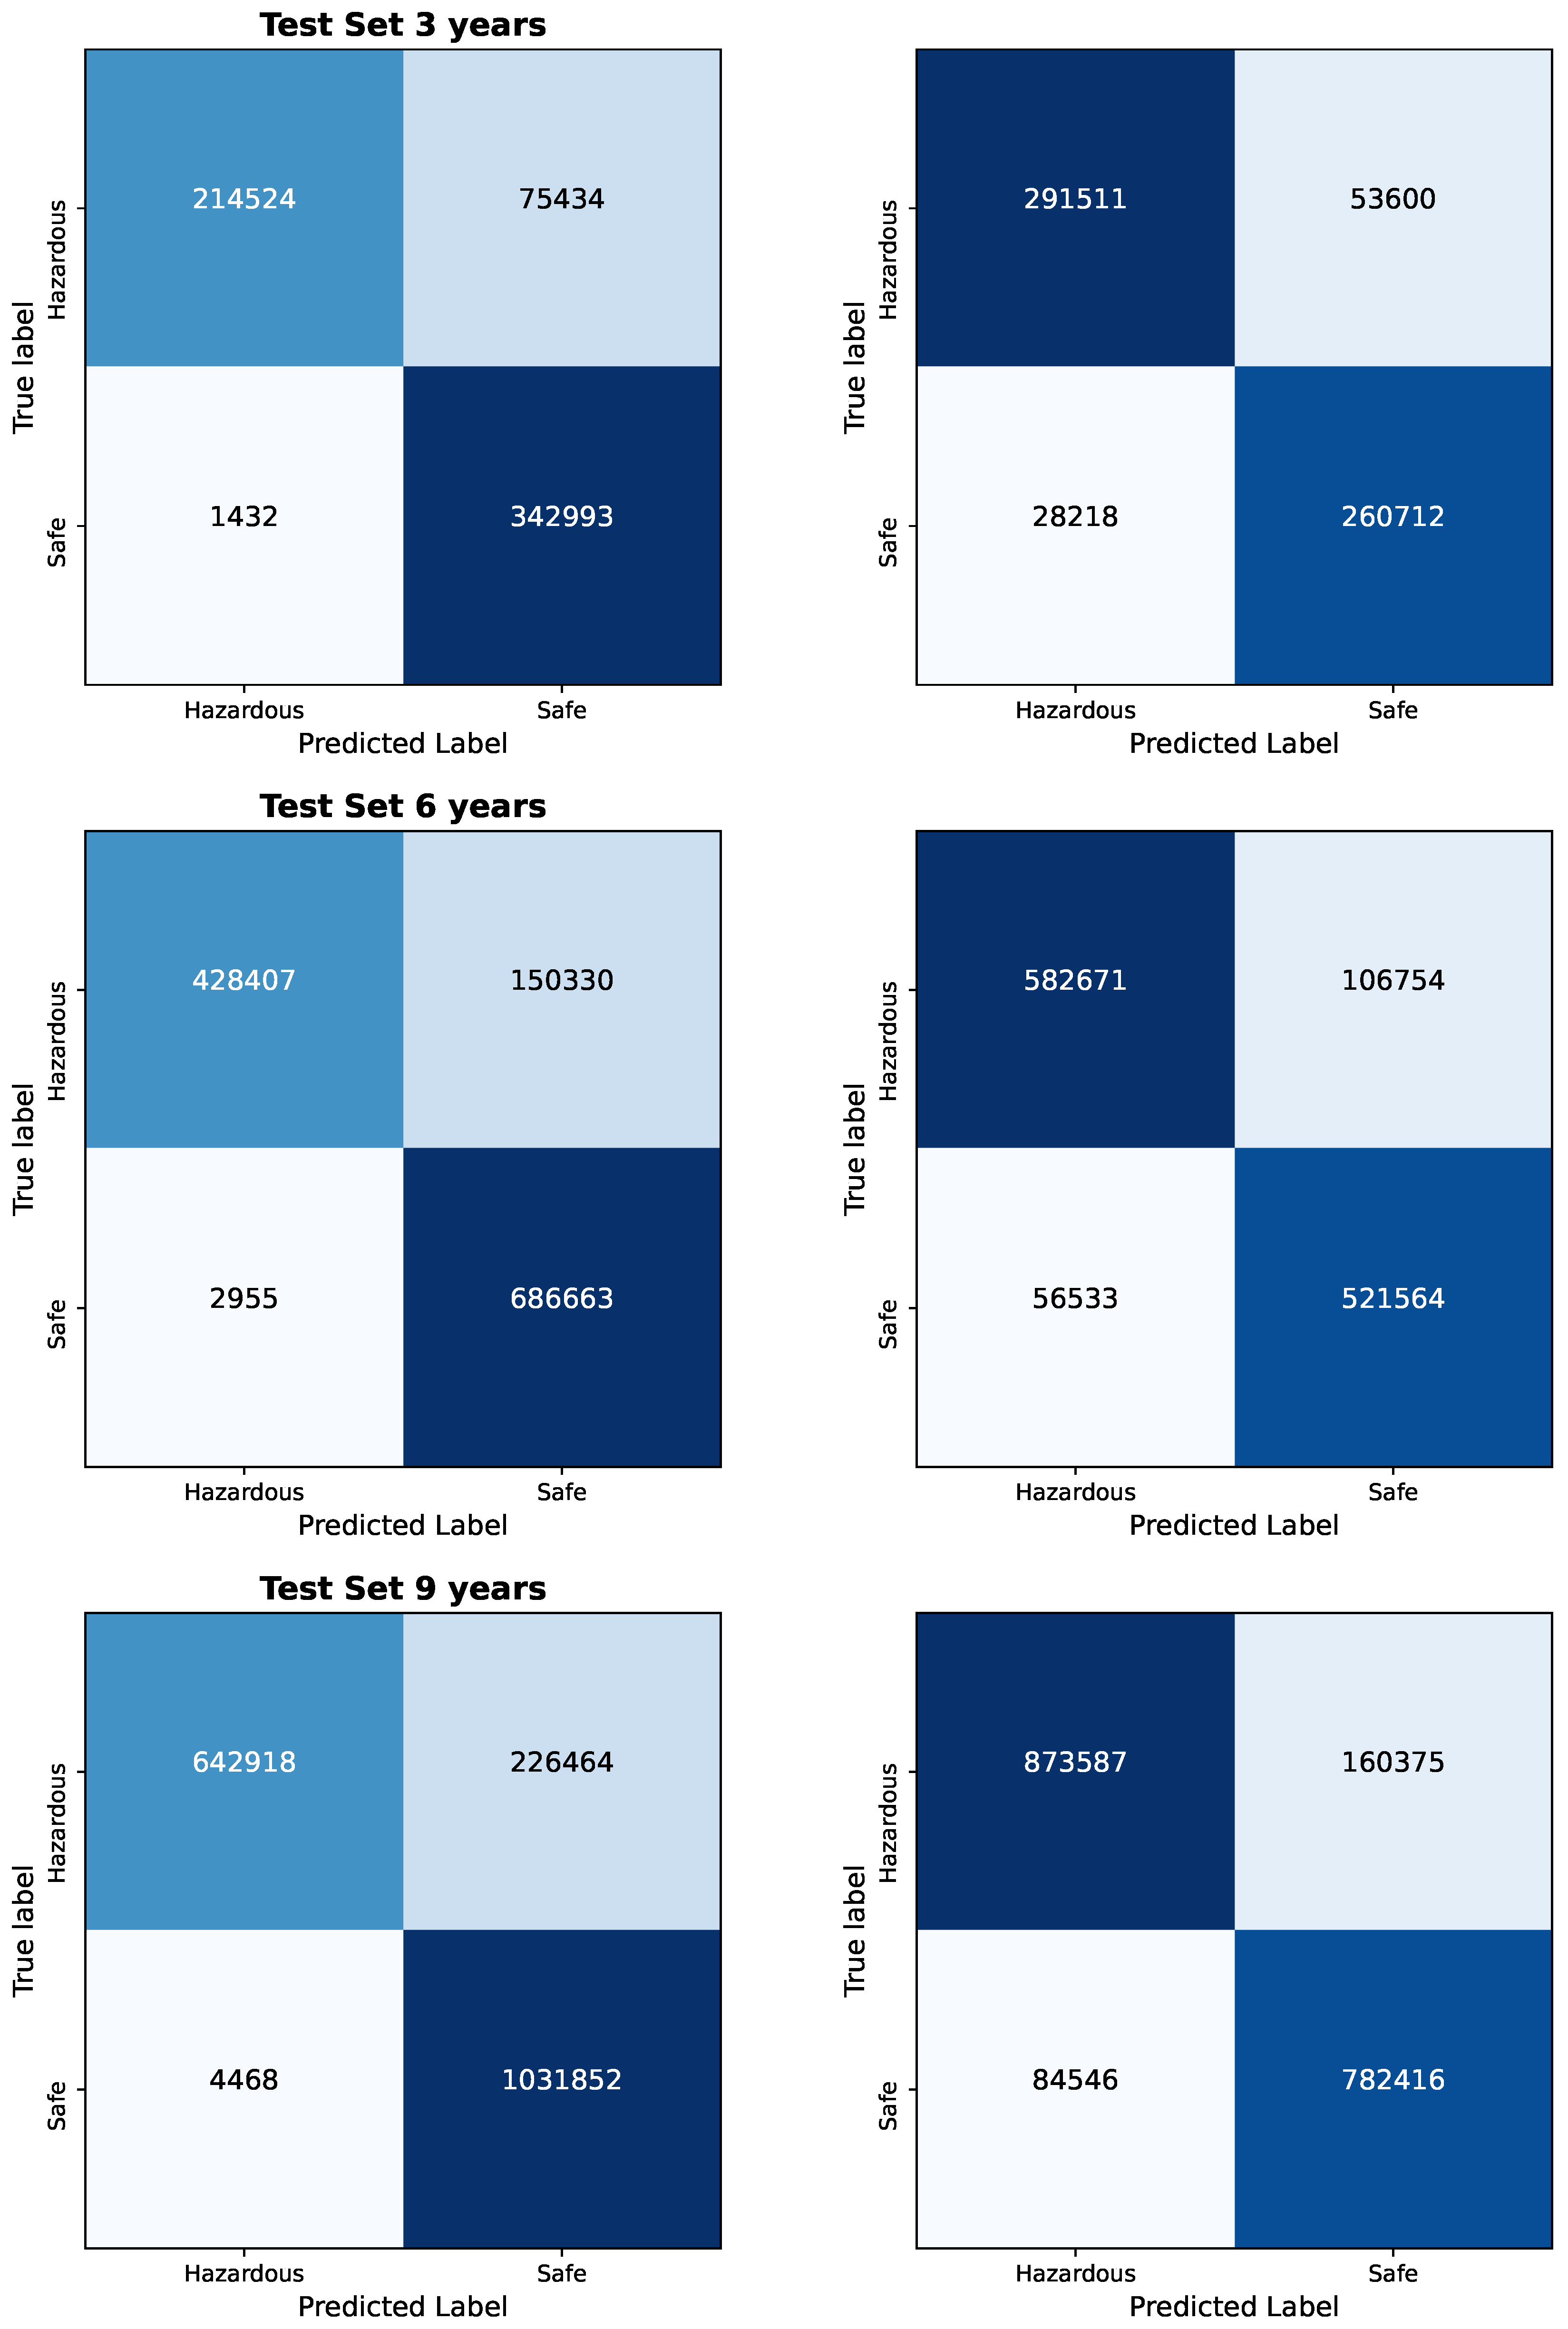
Bayesian Logistic Regression using 1. Pyspark (column 1) 2. numpy and pandas (Column 2): Confusion Matrices for each test set for 3, 6 and 9 years.
Figure 13.
Bayesian Logistic Regression using 1. Pyspark (column 1) 2. numpy and pandas (Column 2): Confusion Matrices for each test set for 3, 6 and 9 years.

Figure 14.
Bayesian Logistic Regression using 1. Pyspark (column 1) 2. numpy and pandas (Column 2): Confusion Matrices for each test set for 12, 15, and 18 years.
Figure 14.
Bayesian Logistic Regression using 1. Pyspark (column 1) 2. numpy and pandas (Column 2): Confusion Matrices for each test set for 12, 15, and 18 years.


Table 1.
AQI Categories and Index Ranges.
| Pollutant | Good | Fair | Moderate | Poor | Very Poor | Extremely Poor |
|---|---|---|---|---|---|---|
| PM | 0–10 | 10–20 | 20–25 | 25–50 | 50–75 | 75–800 |
| PM | 0–20 | 20–40 | 40–50 | 50–100 | 100–150 | 150–1200 |
| NO | 0–40 | 40–90 | 90–120 | 120–230 | 230–340 | 340–1000 |
| O | 0–50 | 50–100 | 100–130 | 130–240 | 240–380 | 380–800 |
| SO | 0–100 | 100–200 | 200–350 | 350–500 | 500–750 | 750–1250 |
Table 2.
Bayesian Logistic Regression Predictions using Pyspark: Classification Metrics, Inference Time, Memory and CPU usage for Testing sets containing data over a period of 3, 6, 9, 12, 15, and 18 years, respectively.
Table 2.
Bayesian Logistic Regression Predictions using Pyspark: Classification Metrics, Inference Time, Memory and CPU usage for Testing sets containing data over a period of 3, 6, 9, 12, 15, and 18 years, respectively.
| Years | Size (MB/GB) | Time (ms) | Mem. (KB/MB) | CPU (%) | Acc. | Spec. | CM TP, FN, FP, TN |
|---|---|---|---|---|---|---|---|
| 3 | 215.0 MB | 72.5 | 4 | 8.6 | 0.878833 | 0.995 | 214524, 75434, 1432, 342993 |
| 6 | 430.0 MB | 71.87 | 16 | 0.5 | 0.8791466 | 0.995 | 428407, 150330, 2955, 686663 |
| 9 | 645 MB | 81.02 | 124 | 5.8 | 0.87882 | 0.995 | 642918, 226464, 4468, 1031852 |
| 12 | 860.2 MB | 60.44 | 400 | 0.99 | 0.87904 | 0.995 | 855640, 300986, 5774, 1373713 |
| 15 | 1.05 GB | 72.59 | 524 | 0.29 | 0.879097 | 0.995 | 1071448, 376486, 7233, 1718625 |
| 18 | 1.26 GB | 80.8 | 992.0 | 0.80 | 0.8791344 | 0.995 | 1285186, 451604, 8679, 2062755 |
Table 3.
Classic(Frequentist) Logistic Regression Predictions using PySpark: Classification Metrics, Inference Time, Memory and CPU Usage for Testing Sets.
Table 3.
Classic(Frequentist) Logistic Regression Predictions using PySpark: Classification Metrics, Inference Time, Memory and CPU Usage for Testing Sets.
| CPU | Acc. | Spec. | TP | FN | FP | TN | ||||
|---|---|---|---|---|---|---|---|---|---|---|
| 3 | 215.0 MB | 73.11 | 28.0K | 5.7% | 0.8922 | 0.868 | 239995 | 49467 | 19025 | 327071 |
| 6 | 430.0 MB | 166.62 | 32.0K | 2% | 0.8924 | 0.868 | 479963 | 98741 | 37702 | 651614 |
| 9 | 645 MB | 80.15 | 180K | 6.1% | 0.8922 | 0.868 | 719446 | 148657 | 56547 | 978703 |
| 12 | 860.2 MB | 64.86 | 132.0K | 5.3% | 0.8922 | 0.868 | 959656 | 197645 | 75929 | 1305684 |
| 15 | 1.05 GB | 96.1 | 184.0K | 5.5% | 0.8924 | 0.868 | 1199943 | 246919 | 94539 | 1631224 |
| 18 | 1.26 GB | 138.62 | 664.0K | 1% | 0.8923 | 0.868 | 1440301 | 296489 | 113412 | 1958022 |
Table 4.
Bayesian Logistic Regression Predictions using Pandas Df and numpy: Classification Metrics, Inference Time, Memory and CPU Usage for Testing sets containing data over a period of 3, 6, 9, 12, 15, and 18 years, respectively.
Table 4.
Bayesian Logistic Regression Predictions using Pandas Df and numpy: Classification Metrics, Inference Time, Memory and CPU Usage for Testing sets containing data over a period of 3, 6, 9, 12, 15, and 18 years, respectively.
| CPU (%) | Acc. | Spec. | TP | FN | FP | TN | ||||
|---|---|---|---|---|---|---|---|---|---|---|
| 3 | 215.0 | 55.694 | 15,300 | 0.6 | 0.8709 | 0.945 | 291511 | 53600 | 28218 | 260712 |
| 6 | 430.0 | 85.869 | 30,800 | 0.7 | 0.8712 | 0.945 | 582671 | 106754 | 56533 | 521564 |
| 9 | 645.0 | 143.675 | 43,600 | 4.1 | 0.8712 | 0.945 | 873587 | 160375 | 84546 | 782416 |
| 12 | 860.2 | 147.869 | 59,200 | 8.5 | 0.8713 | 0.945 | 1167395 | 214209 | 112668 | 1045064 |
| 15 | 1050 | 175.82 | 73,700 | 8.7 | 0.8712 | 0.945 | 1458769 | 267570 | 141097 | 1305656 |
| 18 | 1260 | 268.03 | 89,600 | 5.7 | 0.8712 | 0.945 | 1750169 | 321265 | 169295 | 1567495 |
Disclaimer/Publisher’s Note: The statements, opinions and data contained in all publications are solely those of the individual author(s) and contributor(s) and not of MDPI and/or the editor(s). MDPI and/or the editor(s) disclaim responsibility for any injury to people or property resulting from any ideas, methods, instructions or products referred to in the content. |
© 2023 by the authors. Licensee MDPI, Basel, Switzerland. This article is an open access article distributed under the terms and conditions of the Creative Commons Attribution (CC BY) license (https://creativecommons.org/licenses/by/4.0/).
Share and Cite
MDPI and ACS Style
Vlachou, E.; Karras, A.; Karras, C.; Theodorakopoulos, L.; Halkiopoulos, C.; Sioutas, S. Distributed Bayesian Inference for Large-Scale IoT Systems. Big Data Cogn. Comput. 2024, 8, 1. https://doi.org/10.3390/bdcc8010001
AMA Style
Vlachou E, Karras A, Karras C, Theodorakopoulos L, Halkiopoulos C, Sioutas S. Distributed Bayesian Inference for Large-Scale IoT Systems. Big Data and Cognitive Computing. 2024; 8(1):1. https://doi.org/10.3390/bdcc8010001
Chicago/Turabian StyleVlachou, Eleni, Aristeidis Karras, Christos Karras, Leonidas Theodorakopoulos, Constantinos Halkiopoulos, and Spyros Sioutas. 2024. "Distributed Bayesian Inference for Large-Scale IoT Systems" Big Data and Cognitive Computing 8, no. 1: 1. https://doi.org/10.3390/bdcc8010001