1. Introduction
Lava dome collapse is a serious threat in volcanic regions [
1]. The collapse of the dome can be devastating to settlements and infrastructure at the foot of the mountain. There are four possible causes of lava dome collapse: (1) excessive steepening due to gravity, (2) dome failure due to volcanic gas pressure, (3) rainfall, and (4) the dome and its underlying structure [
2]. Among these, volcanic domes are considered susceptible to rainfall, and the dome collapse of 20 March 2000, at Soufriere volcano, Montserrat, (Lesser Antilles, UK) was considered to have been caused by rainfall before and during the collapse [
3]. The mechanism of dome collapse due to rainfall is thought to be a combination of destabilization by an erosion of the dome front, steam and water action on the potential failure surface inside the dome, the rapid cooling of the lava, and small phreatomagmatic explosions [
3], but the details in individual lava domes are unknown. At Unzen volcano (Kyushu island, Japan), the lava dome that developed at the summit crater of Mount Unzen during its last eruption between 1991 and 1995 has remained stable since the end of the eruption without major collapse. However, it continues to slide downward. In quiescent periods, gravity waxed by water from rainfalls or other sources can be hypothesized to be the main origin of dome movement especially because, even during the eruption, rainfall is thought to have helped trigger some of the dome collapse and pyroclastic flow [
4].
Scientists therefore agree that rainfall plays a role on volcanic dome collapses, but rainfall data measurement frequency, the location of rain gauges, and other limitations inherent to volcanoes make these correlations still difficult to quantify. For this purpose, accurate precipitation measurements are needed to predict dome fluctuations, and even with such a dataset, several limitations persist, such as the difficulty to account for local convective precipitation systems near the top of volcanoes [
5]. In fact, precipitation measurements at Soufriere volcano [
3] and Unzen [
4] were made at distances of about 5.7 km from the lava dome and 5 km from the crater, respectively, and precipitation falling directly on the dome was not accurately measured. Therefore, there is a research gap in the quantification of relations between dome movement and rainfalls for scientific and technical reasons.
Therefore, in the present study, high-resolution dome movement was recorded using ground-based radar, and the precipitation directly over the lava dome of Fugendake were collected using the Japanese rainfall radar data (XRAIN) operated by the Ministry of Land, Infrastructure, Transport and Tourism, with the aim to quantify the relationship between rainfalls and dome movement.
2. Research Location and Method
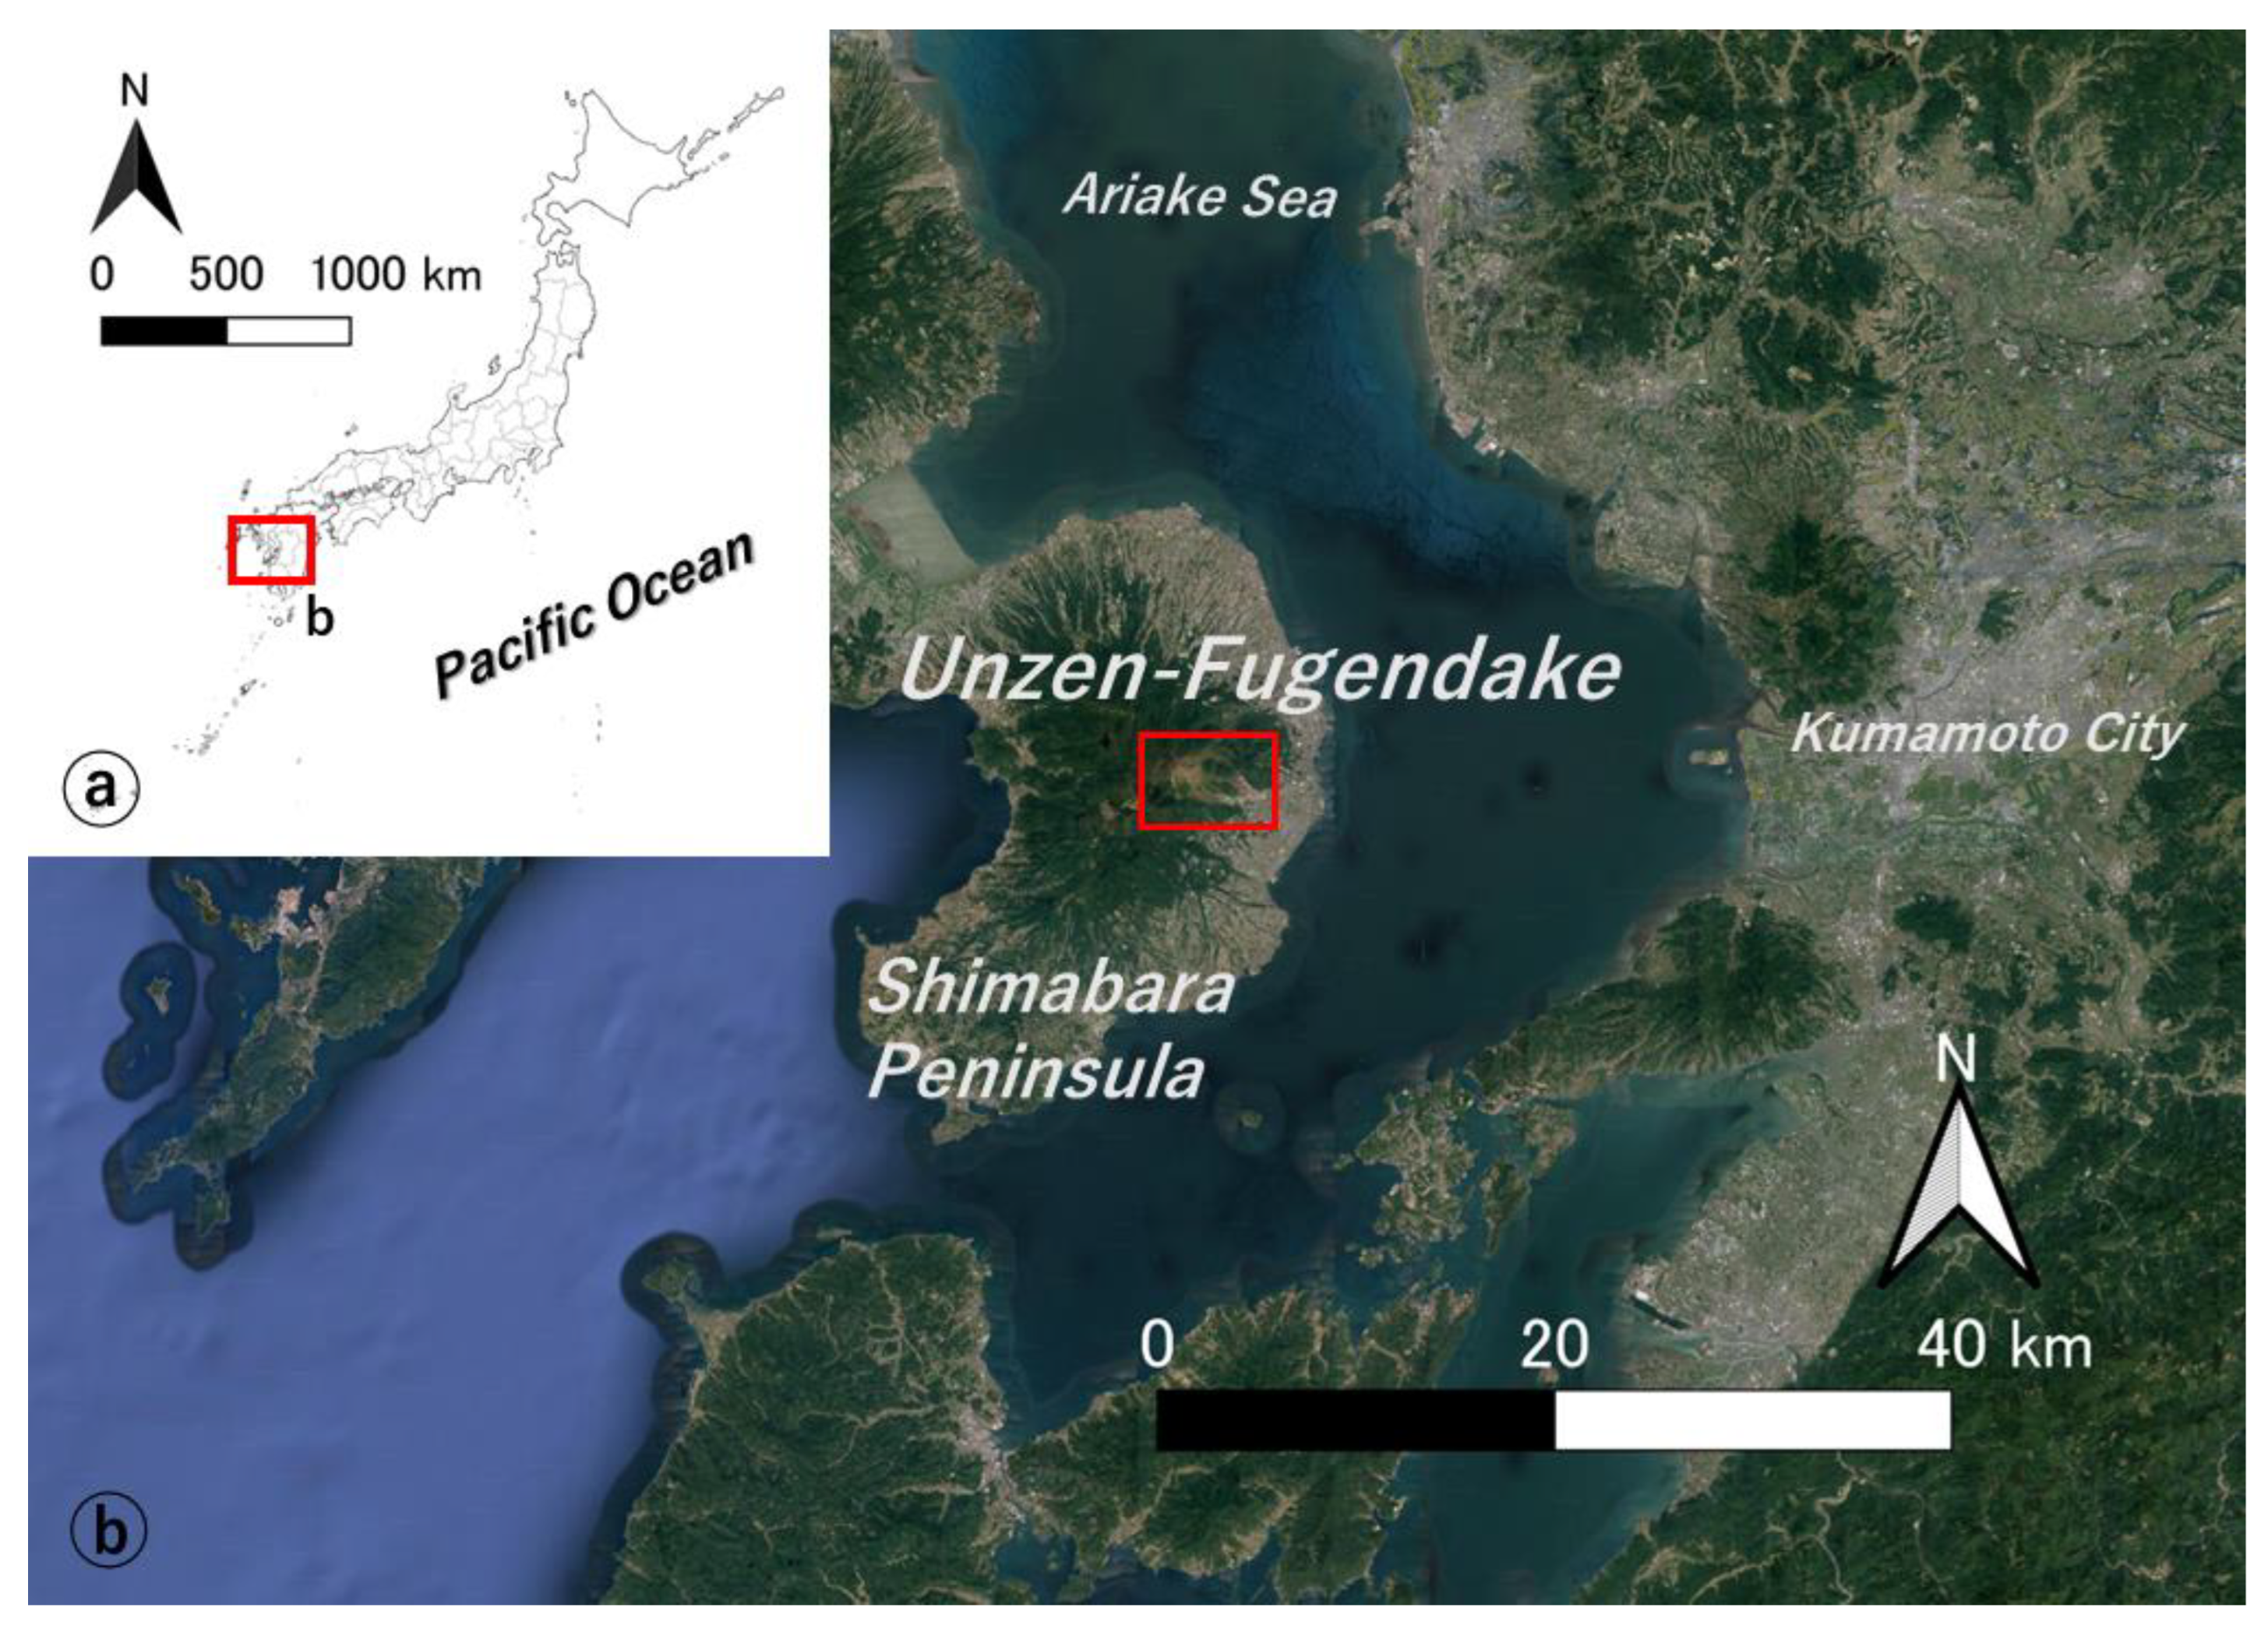
To reach this aim, we worked from the lava dome of Mt. Unzen Fugendake, located on the Shimabara Peninsula in the Kyushu region, southwest of the Japanese archipelago (
Figure 1).
Unzen Fugendake is mainly composed of andesite and dacites (SiO
2 58–68%) [
6]. It has grown in its own graben separated by two parallel faults roughly oriented East–West in Shimabara Peninsula (
Figure 1). The volcano has erupted frequently during the historical period, the oldest recorded eruption being in 1663, when basaltic andesite lava containing olivine flowed down a slope about 1 km from the crater. In 1792, dacite-type lava erupted and flowed 2 km to the north. A few months after this eruption, Mayu-yama collapsed, causing a landslide that devastated Shimabara City and further entered the sea, hitting the opposite shore of Shimabara Bay and generating a massive tsunami, taking the lives of 15,000 people [
6,
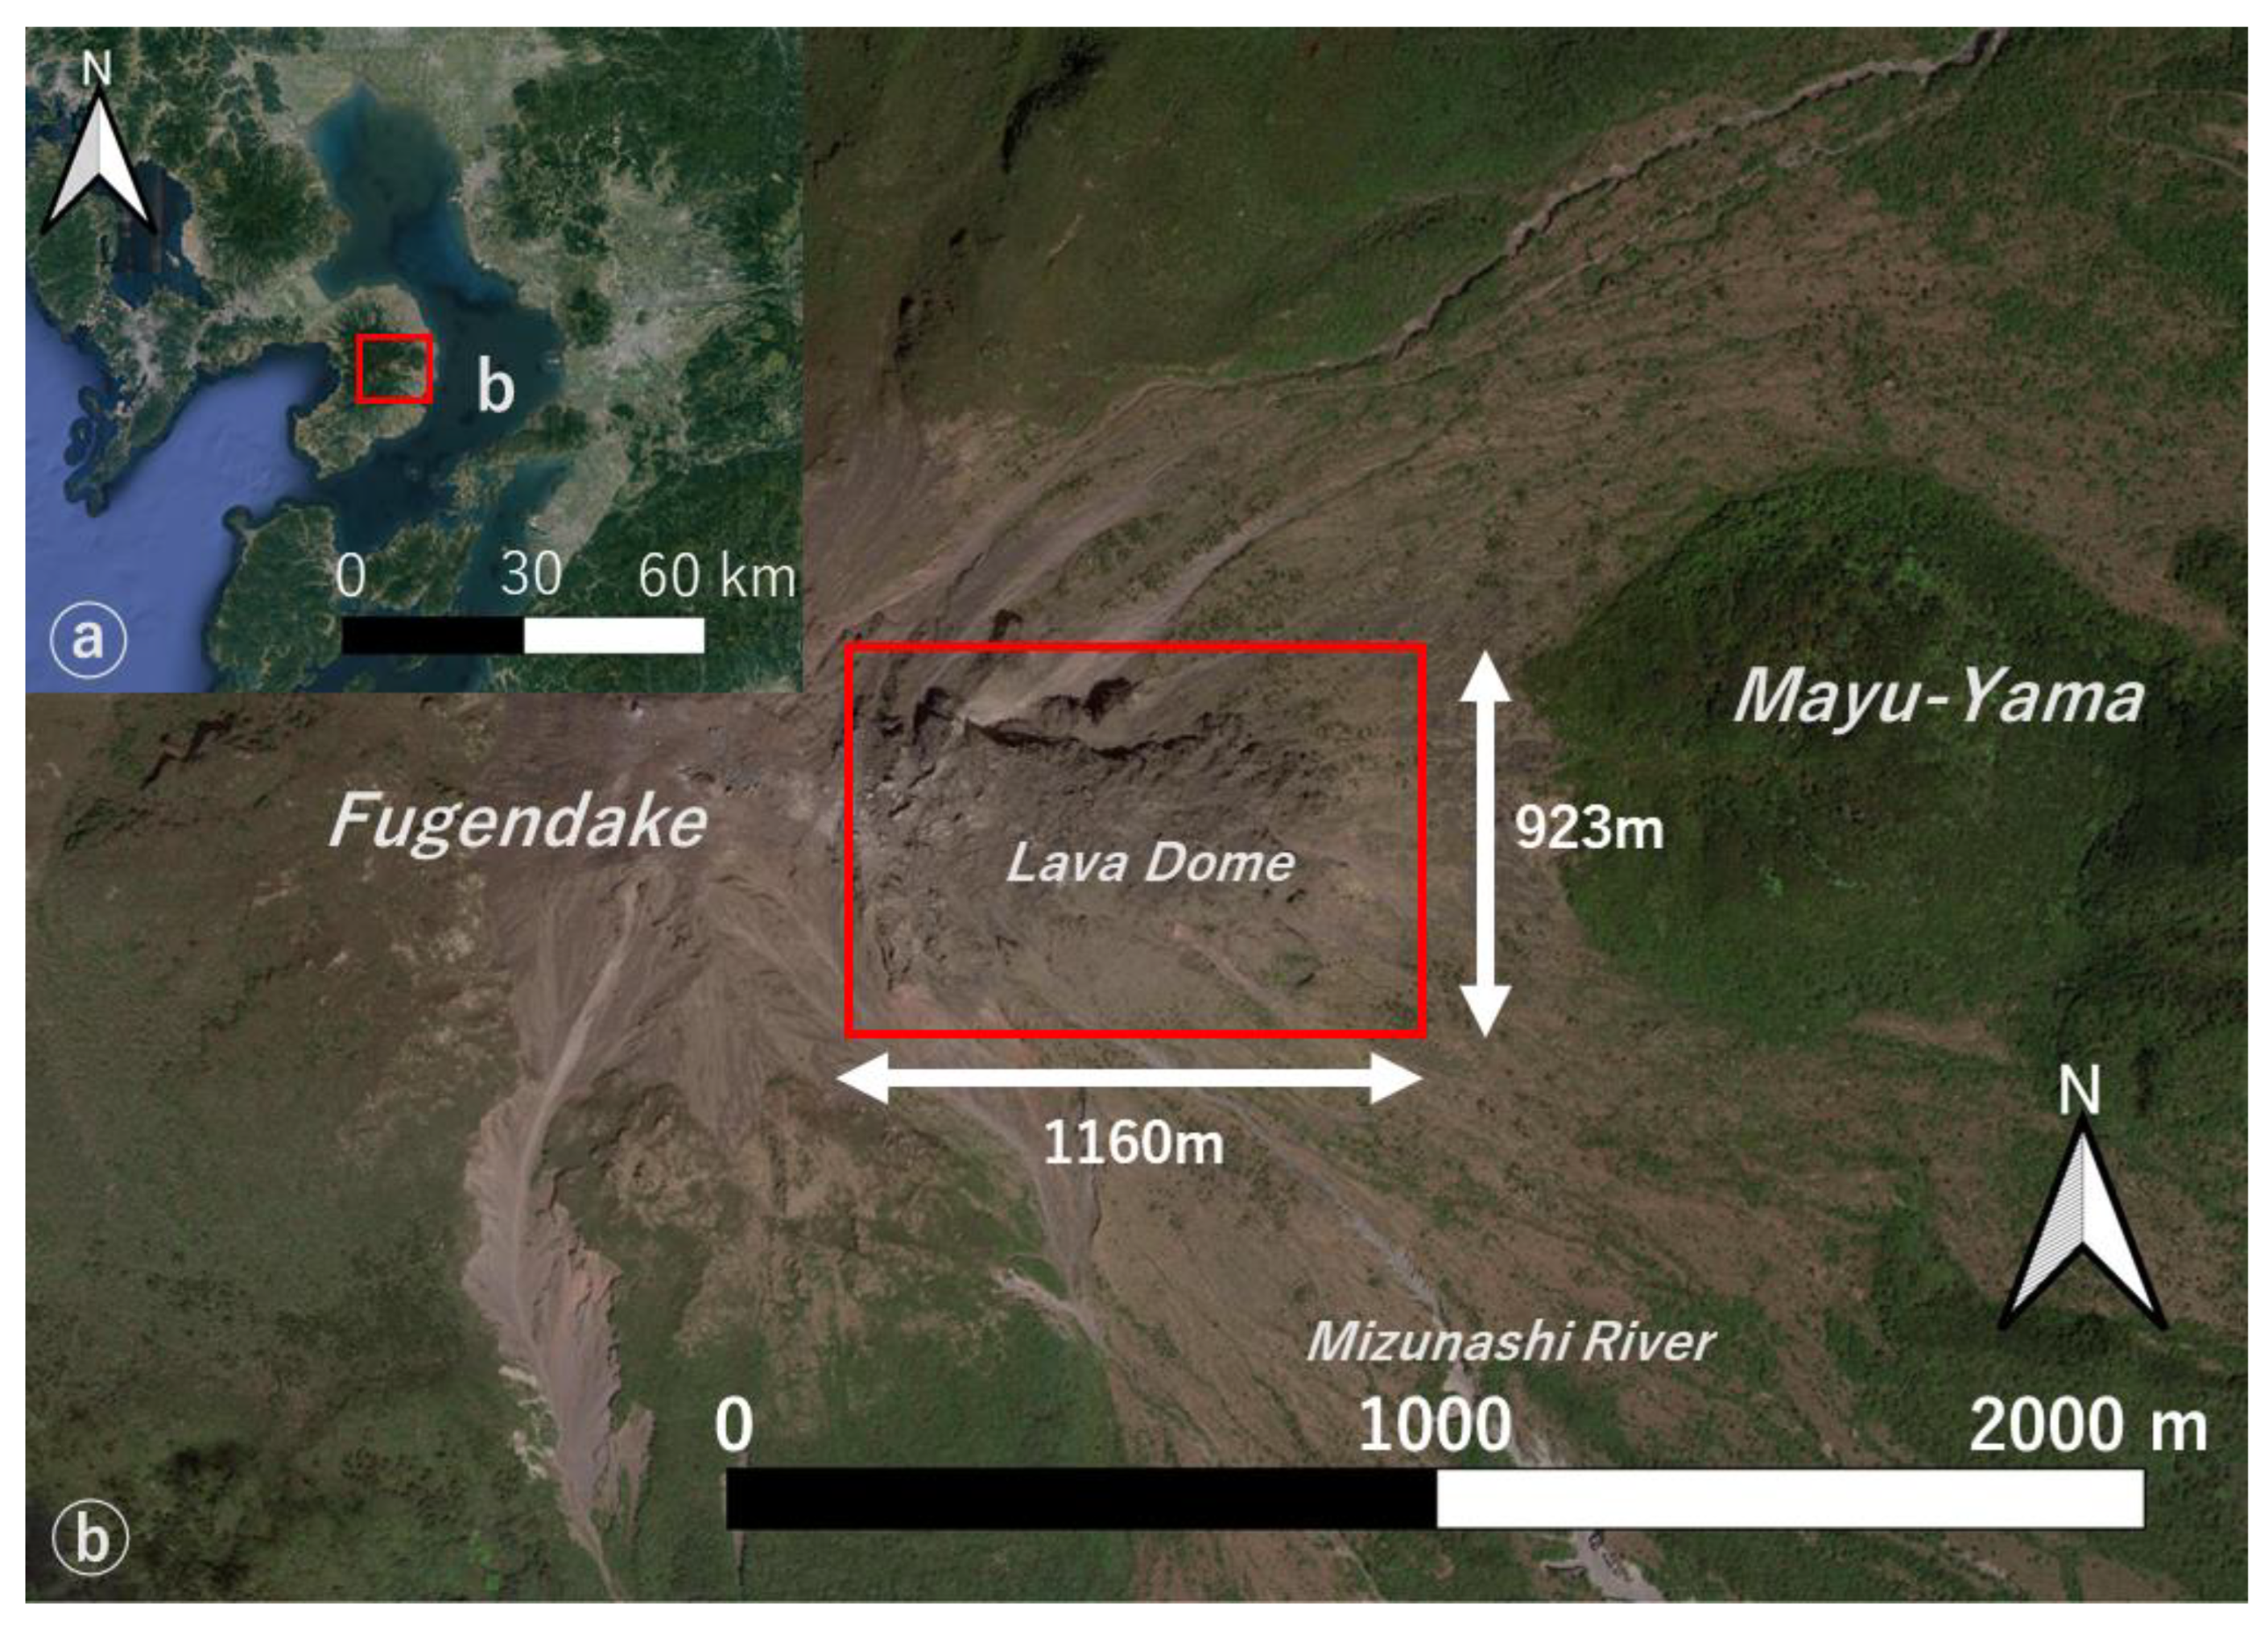
7]. The 1991–1995 eruption formed a lava dome on the east side of Fugendake. Pyroclastic flows and lahars frequently swept this area, and the Mizunashi River (Yamamizu Valley and Jigoku Valley) to the south of the lava dome (
Figure 2).
The displacement of the lava dome is minute and to account for these small variations, we used a ground-based synthetic aperture radar (GBSAR). It has the greater advantage of being able to measure areas of relatively large displacement and not requiring the installation of equipment in inaccessible locations. In the present study, we used the GBSAR at the Akamatsu Valley Observatory operated by Pasco Corporation (
Figure 2). As the dome of Mt. Unzen is recognized to be generated from several lobes, the observation system was calibrated to observe them (as attested by the radar swath range—
Figure 2a). Therefore, we have analyzed the data separately for each of the five domes, using a dataset collected with a return period of 48 h. For the present research, we were provided with the data from 2 June 2018 to 31 December 2020. The reference for displacement here is the position of the dome in the previous 48 h, respectively. In this paper, this position is defined as 0 mm, and the displacement is defined as the distance moved during the 48 h.
At Unzen volcano, as it is the case of all active volcanoes, instrumentation is always a trade-off between ideal position and safety and practical aspects, often leading to data gaps. This issue is particularly acute with rainfalls as complex topography lead to numerous local effects.
In this study, we used an X-band MP radar-based rainfall observation system called XRAIN (extended radar information network) operated by the Ministry of Land, Infrastructure, Transport and Tourism. This system combines the high-resolution features of X-band radar with the high real-time performance of MP-band radar, enabling observations at higher frequencies (5 times more frequently than conventional radar at 1 min intervals) and a higher resolution (16 times more frequently than conventional radar at 250 m intervals) than conventional C-band radar. This rainfall observation system was applied to an area of approximately 1000 m square directly above the lava dome (red frame in
Figure 3), enabling a measurement of localized rainfall at the summit of the mountain.
The XRAIN precipitation data used in this study were hourly precipitation data. In addition, each cycle contained precipitation data for a total of 16 areas: 4 areas from East to West and 4 areas from North to South. The data for these 16 areas were then averaged to calculate the hourly precipitation for the area circled by the red box in
Figure 3. In addition, since the lava dome displacement data were for two days, the hourly average precipitation data for the two days (48 h) were added to calculate the precipitation for the two days.
3. Results
3.1. Overall Displacement
The 48 h displacement for each dome ranges from ~8 mm to ~51 mm for the period from 2 June 2018 to 31 December 2020, with domes 1 and 2 moving twice to 6 times faster than domes 3 to 5. This movement is the result of a total rainfall of > 9.4 thousand millimeters. These values can be divided between downward movement and upward movement. Domes 1 to 3 moved ‘upward’ (positive values) while domes 4 and 5 moved ‘downward’ (negative values in
Table 1). During this period, the total displacements for domes 1 to 3 were 49.581 mm, 51.226 mm, and 16.410 mm, respectively, indicating that the domes descended the slope, whereas domes 4 and 5 were −8.454 mm and −24.236 mm, respectively, indicating an upward slope movement (
Table 1). This equates to an average velocity of 0.0529 mm/day to −0.009 mm/day for the two extreme values provided by dome 1 and dome 4.
3.2. Temporal Distribution of Displacement and Apparent Relations with Rainy Events
During the study period, four distinct sets of events with rainfalls exceeding 150 mm/48 h were recorded, with three of these events having recurring peaks within a couple of weekly periods (
Figure 4). Event 1 (Ev1) occurred in June 2018 with at least two peaks of rainfalls exceeding 150 mm (arbitrary thresholds used for the present study, further work on its significance is necessary). This event has created a visible increase in the GBSAR data for domes 3, 4, and 5 with sets of pronounced peaks of dome movement. The lower domes have shown the highest changes in amplitude, and the lower the dome, the longer the sequence of change is shown to last. At dome number 5, the change lasted for almost 6 months. Event number 2 occurred in July–August of 2019 and, similarly, it presents visible excitation in the signal for domes 3 to 5 with the highest amplitude and duration for the lower domes. For event three, changes in all the domes from 1 to 5 occurred almost at the same time as the rainfall, and although there were no clear observations of these changes at dome 1 and dome 2, domes 3 to 5 displayed important movement until the end of 2020. Another >150 mm rainfall event was also detected at the end of March 2020, but it is isolated with less “background rainfall” compared to events 1 to 3 and it is difficult to know whether it had an impact on the dome as it does not clearly show in the signal. This result shows that it is the combination of a high rainfall volume concentrated over a few days combined with “background” rainy events that are best linked to the displacement of the dome.
3.3. Upward and Downward Displacement
Combining the displacement and the rainfall data for every 48 h periods confirms the data provided temporally (
Figure 5). Combined with the correlation coefficients in
Table 2, both upward and downward displacements are not correlated with the amount of rainfall at the time of displacement, but the displacement tends to be smaller with more rainfall and larger with less rainfall. This indicates that precipitation for a short period of time (48 h) alone is unlikely to trigger the displacement of the dome. This result further emphasizes the importance of background rainfall, which was shown earlier in 3.2.
Focusing only on dome rise, the displacement of domes 1 and 2, which are located at the top of the slope, is within approximately 2 mm, while the displacement of domes 3, 4, and 5, which are located at the bottom of the slope, is within approximately 4 mm, indicating that domes 3, 4, and 5, which are located at the bottom of the slope, tend to rise in a short period of time (
Figure 5a,b). In contrast, all the domes have a similar scattering pattern in terms of descent, indicating that there is no significant difference in descent in 48 h regardless of the slope location.
4. Discussion
The comparison of rainfall events and dome displacement has shown that the dome is moving at a different rhythm in its upper area, compared to the lower area, with vertical changes in the lower part that is almost twice the change in the upper part. These changes are, however, not immediate after heavy rainfall events, and they can also last for months after a rainfall event, where peaks exceed 150 mm/48 h. We have also seen that the rainfall peaks that are associated with background rainfall are more effective in triggering dome movement.
The present movement thus reveals a time delay, which is not a similar process to that of dome collapse [
4], as it was pointed out that the relation between “hot” dome collapse generating pyroclastic density currents and rainfall was almost immediate. Carn et al. [
3] showed that rainfall and collapse responded quickly to the collapse of the lava dome at Soufriere volcano on 29 July 2001, but this result is different from the Unzen displacement data.
As explained in Kelfoun et al.’s work [
2], four causes of lava dome collapse and thus movement can be inferred: (1) an excessive steepening of the lava dome due to gravity, (2) dome failure due to volcanic gas pressure, (3) precipitation, and (4) the structure of the dome and its lower layer. However, the slow response of precipitation and displacement in the Unzen lava dome suggests that the displacement of the Unzen lava dome may have been caused by a combination of (1), (3), and (4), especially because the dome position on the slope seems to define the amount of movement recorded.
This result is therefore essential for its use in hazard and disaster risk research because it shows that volcanic domes during quiescent times show a different reaction time to rainfall events, and that in a critical case, it would be important to extend temporally the alert time to account for the slow response of the dome.
5. Conclusions
In conclusion, the Unzen Fugendake dome is reacting to a complex of high intensity and background rainfall, and so, over several monthly periods, we suggest that the vadose zone and the groundwater movement may play an important controlling role. Furthermore, this time lag suggests that hazards and disaster risk alerts need to be adapted to account for those delayed changes. The next step in this research will now be to model the time lag of the dome to rainfall events.
Author Contributions
Conceptualization, R.D., C.G. and B.B.; methodology, R.D.; software, R.D.; validation, C.G., N.H. and Y.S.; formal analysis, R.D. and C.G.; investigation, R.D., C.G., N.H. and Y.S.; resources, R.D.; data curation, R.D.; writing—original draft preparation, R.D.; writing—review and editing, C.G. and B.B.; visualization, R.D.; supervision, R.D.; project administration, R.D. All authors have read and agreed to the published version of the manuscript.
Funding
This research received no external funding.
Institutional Review Board Statement
Not applicable.
Informed Consent Statement
Not applicable.
Data Availability Statement
The datasets generated and/or analyzed during the current study are available from the corresponding author on reasonable request.
Acknowledgments
In this study, XRAIN precipitation data were downloaded from DIAS. In addition, GBSAR data were provided by the Kyushu Regional Development Bureau, Ministry of Land, Infrastructure, Transport and Tourism, Unzen Sediment Control Management Center and Pasco Corporation.
Conflicts of Interest
The authors declare no conflict of interest.
References
- Herd, R.A.; Edmonds, M.; Bass, V.A. Catastrophic Lava Dome Failure at Soufrière Hills Volcano, Montserrat, 12–13 July 2003. J. Volcanol. Geotherm. Res. 2005, 148, 234–252. [Google Scholar] [CrossRef]
- Kelfoun, K.; Santoso, A.B.; Latchimy, T.; Bontemps, M.; Nurdien, I.; Beauducel, F.; Fahmi, A.; Putra, R.; Dahamna, N.; Laurin, A.; et al. Growth and Collapse of the 2018–2019 Lava Dome of Merapi Volcano. Bull. Volcanol. 2021, 83, 8. [Google Scholar] [CrossRef]
- Carn, S.A.; Watts, R.B.; Thompson, G.; Norton, G.E. Anatomy of a Lava Dome Collapse: The 20 March 2000 Event at Soufrière Hills Volcano, Montserrat. J. Volcanol. Geotherm. Res. 2004, 131, 241–264. [Google Scholar] [CrossRef]
- Yamasato, H.; Kitagawa, S.; Komiya, M. Effect of Rainfall on Dacitic Lava Dome Collapse at Unzen Volcano, Japan. Pap. Met. Geophys. 1998, 48, 73–78. [Google Scholar] [CrossRef]
- Matthews, A.J.; Barclay, J.; Carn, S.; Thompson, G.; Alexander, J.; Herd, R.; Williams, C. Rainfall-Induced Volcanic Activity on Montserrat. Geophys. Res. Lett. 2002, 29, 22-1–22-4. [Google Scholar] [CrossRef]
- Yasuo, O.; Masakazu, T.; Atsushi, S.; Shigeru, K.; Yoshio, I. The List of Volcanoes and Their Activities Records in the Adjacent Seas of Japan, 3rd ed.; Report of Hydrographic and Oceanographic Reserchies No. 40; Japan Coast Guard: Tokyo, Japan, 2004.
- Hoshizumi, H.; Uto, K.; Watanabe, K. Geology and eruptive history of Unzen volcano, Shimabara Peninsula, Kyushu, SW Japan. J. Volcanol. Geotherm. Res. 1999, 89, 81–94. [Google Scholar] [CrossRef]
| Disclaimer/Publisher’s Note: The statements, opinions and data contained in all publications are solely those of the individual author(s) and contributor(s) and not of MDPI and/or the editor(s). MDPI and/or the editor(s) disclaim responsibility for any injury to people or property resulting from any ideas, methods, instructions or products referred to in the content. |
© 2023 by the authors. Licensee MDPI, Basel, Switzerland. This article is an open access article distributed under the terms and conditions of the Creative Commons Attribution (CC BY) license (https://creativecommons.org/licenses/by/4.0/).


 ,
, 


