Article

Thermal Modeling of Temperature Distribution in Metal Additive Manufacturing Considering Effects of Build Layers, Latent Heat, and Temperature-Sensitivity of Material Properties

1
Woodruff School of Mechanical Engineering, Georgia Institute of Technology, Atlanta, GA 30332, USA
2
Carpenter Technology Corporation, Senior Additive Manufacturing Engineer, Huntsville, AL 35671, USA
3
Siemens Digital Factory, Product Lifecycle Management, Nonnendammallee 101, Bauteil C, 13629 Berlin, Germany
4
Department of Power Mechanical Engineering, National Tsing Hua University, Hsinchu 30013, Taiwan
*
Author to whom correspondence should be addressed.
J. Manuf. Mater. Process. 2018, 2(3), 63; https://doi.org/10.3390/jmmp2030063
Submission received: 12 August 2018 / Revised: 31 August 2018 / Accepted: 8 September 2018 / Published: 12 September 2018
(This article belongs to the Special Issue Anniversary Feature Papers)

Abstract

:
A physics-based analytical model is proposed in order to predict the temperature profile during metal additive manufacturing (AM) processes, by considering the effects of temperature history in each layer, temperature-sensitivity of material properties and latent heat. The moving heat source analysis is used in order to predict the temperature distribution inside a semi-infinite solid material. The laser thermal energy deposited into a control volume is absorbed by the material thermodynamic latent heat and conducted through the contacting solid boundaries. The analytical model takes in to account the typical multi-layer aspect of additive manufacturing processes for the first time. The modeling of the problem involving multiple layers is of great importance because the thermal interactions of successive layers affect the temperature gradients, which govern the heat transfer and thermal stress development mechanisms. The temperature profile is calculated for isotropic and homogeneous material. The proposed model can be used to predict the temperature in laser-based metal additive manufacturing configurations of either direct metal deposition or selective laser melting. A numerical analysis is also conducted to simulate the temperature profile in metal AM. These two models are compared with experimental results. The proposed model also well captured the melt pool geometry as it is compared to experimental values. In order to emphasize the importance of solving the problem considering multiple layers, the peak temperature considering the layer addition and peak temperature not considering the layer addition are compared. The results show that considering the layer addition aspect of metal additive manufacturing can help to better predict the surface temperature and melt pool geometry. An analysis is conducted to show the importance of considering the temperature sensitivity of material properties in predicting temperature. A comparison of the computational time is also provided for analytical and numerical modeling. Based on the obtained results, it appears that the proposed analytical method provides an effective and accurate method to predict the temperature in metal AM.

1. Introduction

Metal additive manufacturing (AM) is a “process of joining materials to make objects from 3D model data, usually layer upon layer, as opposed to subtractive manufacturing methodologies” [1]. Additive manufacturing (AM) processes have potential to be the pillar of the next industrial revolution. AM can be used to improve existing manufacturing processes and rapidly introduce new prototypes and products [2,3]. It also offers the potential to spin off entirely new industries and lead to new production methods [4]. AM offers design flexibility, the ability to produce complex parts, and lower cost due to the reduced requirement of materials and decreased lead time.
AM may also hold the potential for the repair and replacement of existing plant components [5,6]. Results from on-line monitoring and complimentary non-destructive evaluation (NDE) inspections can provide indications of component health and enable repair or replacement prior to a forced outage situation. As an example, imaging tools and software can be leveraged to create a digital image of the damaged component which can be used to 3-D print a new one. This can be especially advantageous if the component is no longer in production and/or would require a long-lead time to fabricate.
There are many challenges that necessitate being focused on this field in order to expedite the adoption of AM as an advanced manufacturing technology. The issues in this field can be classified in to: the distortion, fatigue, defects, and residual stress of the manufactured parts [7,8,9]. The modeling in additive manufacturing technology is a key to the advancement of the field due to obstacles in in-situ measurements of temperature, thermal stress, residual stress, and distortion. The available knowledge and technology to-date on the descriptions and predictions of the metal AM process have been fragmented, mostly driven by phenomenological or numerical observations [10,11,12,13], and primarily limited to macroscopic analysis in nature [14,15], thus restricting the full capability and potential of the AM process. Using numerical methods and experiments are not just expensive, but also time-consuming. On the other hand, the physics-based analytical modeling eliminates all the above-mentioned difficulties and can help to better understand the physical aspects of the metal additive manufacturing process.
The most important part of the metal AM process modeling and prediction is the prediction of the temperature induced by laser since the non-uniform temperature will cause the thermal stress to appear in the structure. As a result of thermal stress in the build material, the tensile residual stress on the surface accelerates the crack propagation and growth [16,17]. Several researchers worked on predicting the temperature profile during the additive manufacturing process. Fergani et al. introduced an analytical model to predict the temperature in the direct metal deposition process. They predict the temperature using a moving point heat source analysis. In this work, the effect of material temperature sensitivity is ignored [18]. C.Y. Yap et al. have proposed an analytical model to predict the energy input required to process different metallic materials for selective laser melting (SLM) process. The model holds many assumptions, such as a semi-circular cross-section for melt tracks, temperature-independent specific heat, no heat loss to the surroundings and absorptance of material to laser irradiation based on bulk material properties. The melting, solidification, and solid-state phase change is also not considered in their model. The simplified model is able to predict the required energy input within an order of magnitude and provide researchers with a useful model to estimate the optimal SLM parameters [19].
Predicting the temperature precisely in metal AM is the pillar for predicting the thermal stress, residual stress, and part distortion. The non-uniform heating during AM processes may lead to the thermal stress. The large thermal gradient and cooling rate during the metal AM processes can generate complex microstructures in the build material [20]. Kelly et al. used the temperature in the AM processes in order to predict the microstructure evolution in the build part. In their work, the melting/solidification phase change is not considered [21]. Hoadley and Rappaz introduced a 2D quasi-stationary model to predict the temperature in the laser cladding process. Their research focused on the influence of the laser speed and power on the layer thickness [22]. Toyserkani et al. developed a 3D model, their proposed model tried to solve the heat problem using a coupled multi-physics system. They have used thermal analysis in order to predict the melt pool shape [23]. Cao and Ayalew have developed a control-oriented multiple input multiple output modeling of the laser-aided powder deposition processes. The objective of their work is to control the height and the temperature of a layer. Their investigation described the essential role of temperature modeling to control the quality of the final part [24]. Hitzler et al. investigated the influence of scan strategy on material characteristics, such as strength, hardness, and young’s modulus [25,26]. Rashid et al. worked on the effect of scan strategy on density and metallurgical properties of a build part during the selective laser melting (SLM) process. Their results showed that parts which are made using a single scan have higher levels of hardness than parts that are made by scanning each layer twice [27].
Due to the complexity of the additive manufacturing processes, such as direct metal deposition (DMD), and SLM, not only is it time-consuming to do the experiments in order to capture the physical aspects of the metal AM processes, but it is also expensive. In the past few decades, the numerical simulations appear to be the only effective way to achieve an understanding of metal additive manufacturing processes [28,29]. The numerical methods have low computational efficiency and cannot capture all the physical aspects of the metal AM processes. On the other hand, physics-based analytical models provide a deep understanding of the physical concepts of AM. The analytical solutions have the potential to predict the key AM attributes in ways significantly faster than finite element method (FEM) simulations, by two or more orders of magnitudes [30]. Efficient and accurate predictions are therefore enabled, and the optimization of metal additive manufacturing processes which would be too complicated to cope with by the majority of other studies, who have resorted to empirical and FEM attempts. It also reduces, if not completely eliminates, the need for a costly and lengthy trial and error developmental curve for new material and components [31]. A complete build analysis with high accuracy becomes computationally tractable using the analytical model.
The AM process is a coupling of many physical phenomena such as heat transfer, fluid dynamics, phase transformation and solid mechanics. Moreover, the transient nature of heat transfer phenomena and interaction of layers make it a complicated multi-physics problem. Many researchers tried to predict the temperature in metal additive manufacturing, but each of them has several limitations. For example, not considering the temperature dependent material properties, the melting/solidification phase change, and layering aspect of metal AM. The key advantage of the proposed model is the ability to capture the most physical phenomena in metal AM, which has mostly been ignored in previous works. In this work, all the above-mentioned limitations are considered in the analytical solution of temperature. It is assumed that the thermal properties of material are temperature dependent. The melting, solidification, and solid-state phase change is included by using the modified specific heat, which relates the specific heat and latent heat of fusion. As each layer is deposited, the temperature profile is predicted using the moving heat source analysis. The laser thermal energy deposited into a control volume is absorbed by the material thermodynamic latent heat and conducted through the contacting solid boundaries. The deposited energy on the first layer introduces a thermal profile. The thermal behavior in the second pass of the laser will not be the same as the first pass since the thermal interaction of the successive layers have an influence on heat transfer. The melt pool geometry is well captured based on the proposed model, since it considers most of the previous lacks.
The outline of the paper is as follows. Section 2 presents the mathematical and practical details of the proposed analytical and numerical models. Section 3 presents detail of the experimental work which is used for validation of the proposed model, the results and a detailed discussion about the obtained results. Last but not least, Section 4 presents the conclusion of this research.

2. Approach and Methodology

2.1. Analytical Modeling

There are various engineering applications, such as turning, grinding, welding, and 3D printing in which the computation of the temperature field in the solid is modeled as a problem of heat conduction involving a moving heat source. The objective of this section is to present the mathematical formulation and the method of solution of heat conduction by considering the moving heat source, which indeed is the case in metal additive manufacturing [32].
In this study, the basic premise is that the powder is situated in the desirable location relative to the melt pool. In other words, there is no moment or mass transfer consideration in this work, and only the heat transfer is considered. Although the effect of time difference between the two consecutive irradiations on temperature profile is not considered in this work, it is worth noting that considering the existence of the time difference between two consecutive irradiations may cause an increase in predicted temperature during the metal AM processes. This is because the predicted temperature at time t + Δ t will be the materials-response-coupled superposition considering the temperature sensitivity of thermal properties at time t and t + Δ t .
By considering a line heat source of constant strength g l c (W/ m ) located at the x-axis and oriented parallel to the z-axis, the source releases its energy continuously over time as it moves with a constant velocity of v in the positive x-direction. The medium is initially at room temperature. It is assumed ( T z ) = 0   everywhere in the medium. Hence, the differential equation of heat conduction in the x, y coordinates in now taken as
  2 T x 2 + 2 T y 2 + 1 k g ( x , y , t ) = 1 α T t  
where T   T ( x , y , t ) . k is thermal conductivity, and α is the thermal diffusivity. The line heat source g l c (W/ m )   is related to the equivalent volumetric source g ( x , y , t ) ( W / m 3 ) by the delta function notation as
  g ( x , y , t ) =   g l c   δ ( y ) δ ( x v t )  
In order to consider the moving heat source, it is assumed that the coordinate system transfers from the x ,   y fixed coordinate system to ζ ,   y coordinate moving with the line heat source by using the transformation
  ζ = x v t  
Using the abovementioned transformation, the heat conduction equation for the moving coordinate system can be written as
  2 T ζ 2 + 2 T y 2 + 1 k g l c δ ( ζ ) δ ( y ) = 1 α ( T t v T ζ )  
Equation (4) can be solved by the assumption of the quasi-stationary condition [32]. Using the separation of variables, the closed form solution of the temperature field can be obtained as
  T =   P 4 π K R exp v ( R x ) 2 α + T 0  
where P is the laser power, K is thermal conductivity, v is scan speed (laser velocity). α is thermal diffusivity which can be calculated as K ρ c . In which ρ is material density and c is material heat capacity. R = x 2 + y 2 is the radial distance from the heat source. T 0 is the initial temperature. The material is considered homogeneous and isotropic. As the laser moves along the surface it deposited some energy. Figure 1 depicts the heat transfer in metal AM. The heat loss from the surface by radiation and convection are not considered in this study.
It is worth noting that the process parameters such as laser power, scanning speed, powder size, powder distribution, etc. have influence on material properties in the metal AM processes since it may change the predicted temperature [33]. As a result, the material properties are assumed to be temperature dependent as shown in Table 1 [34].
During the metal AM process such as SLM and DMD, the melting, solidification and solid-state phase transformation take place. This is considered using modified heat capacity.
C P m = C P ( T ) + L f f T
In which C p ( T ) is temperature dependent specific heat, L f is latent heat of fusion, and f is liquid fraction which can be calculated from
  f = { 0 , T < T s T T s T L T s ,   T s < T < T L 1 ,             T > T L  
where, T s is solidus temperature and T L is liquidus temperature.
The process parameters such as laser power and scan speed are defined to start the calculation of the vertical distribution of temperature during the laser-based metal AM. At first, it is assumed the powder is at room temperature. As the laser moves along the x-axis, it deposits the energy on the powder and causes the powder to melt, as the laser passes the affected region, the melt pool starts to solidify. As it creates the first layer, the temperature profile is calculated for that layer. Next, it starts the second layer with the dwell time of zero. It is possible that the first layer has not had enough time to cool down to the room temperature when the second layer is starting to build. As a result, it affects the heat transfer during the metal AM processes. Considering the layer addition also has a substantial influence on thermal stress and residual stress predictions. The fellow chart of considering the build layers is illustrated in Figure 2.

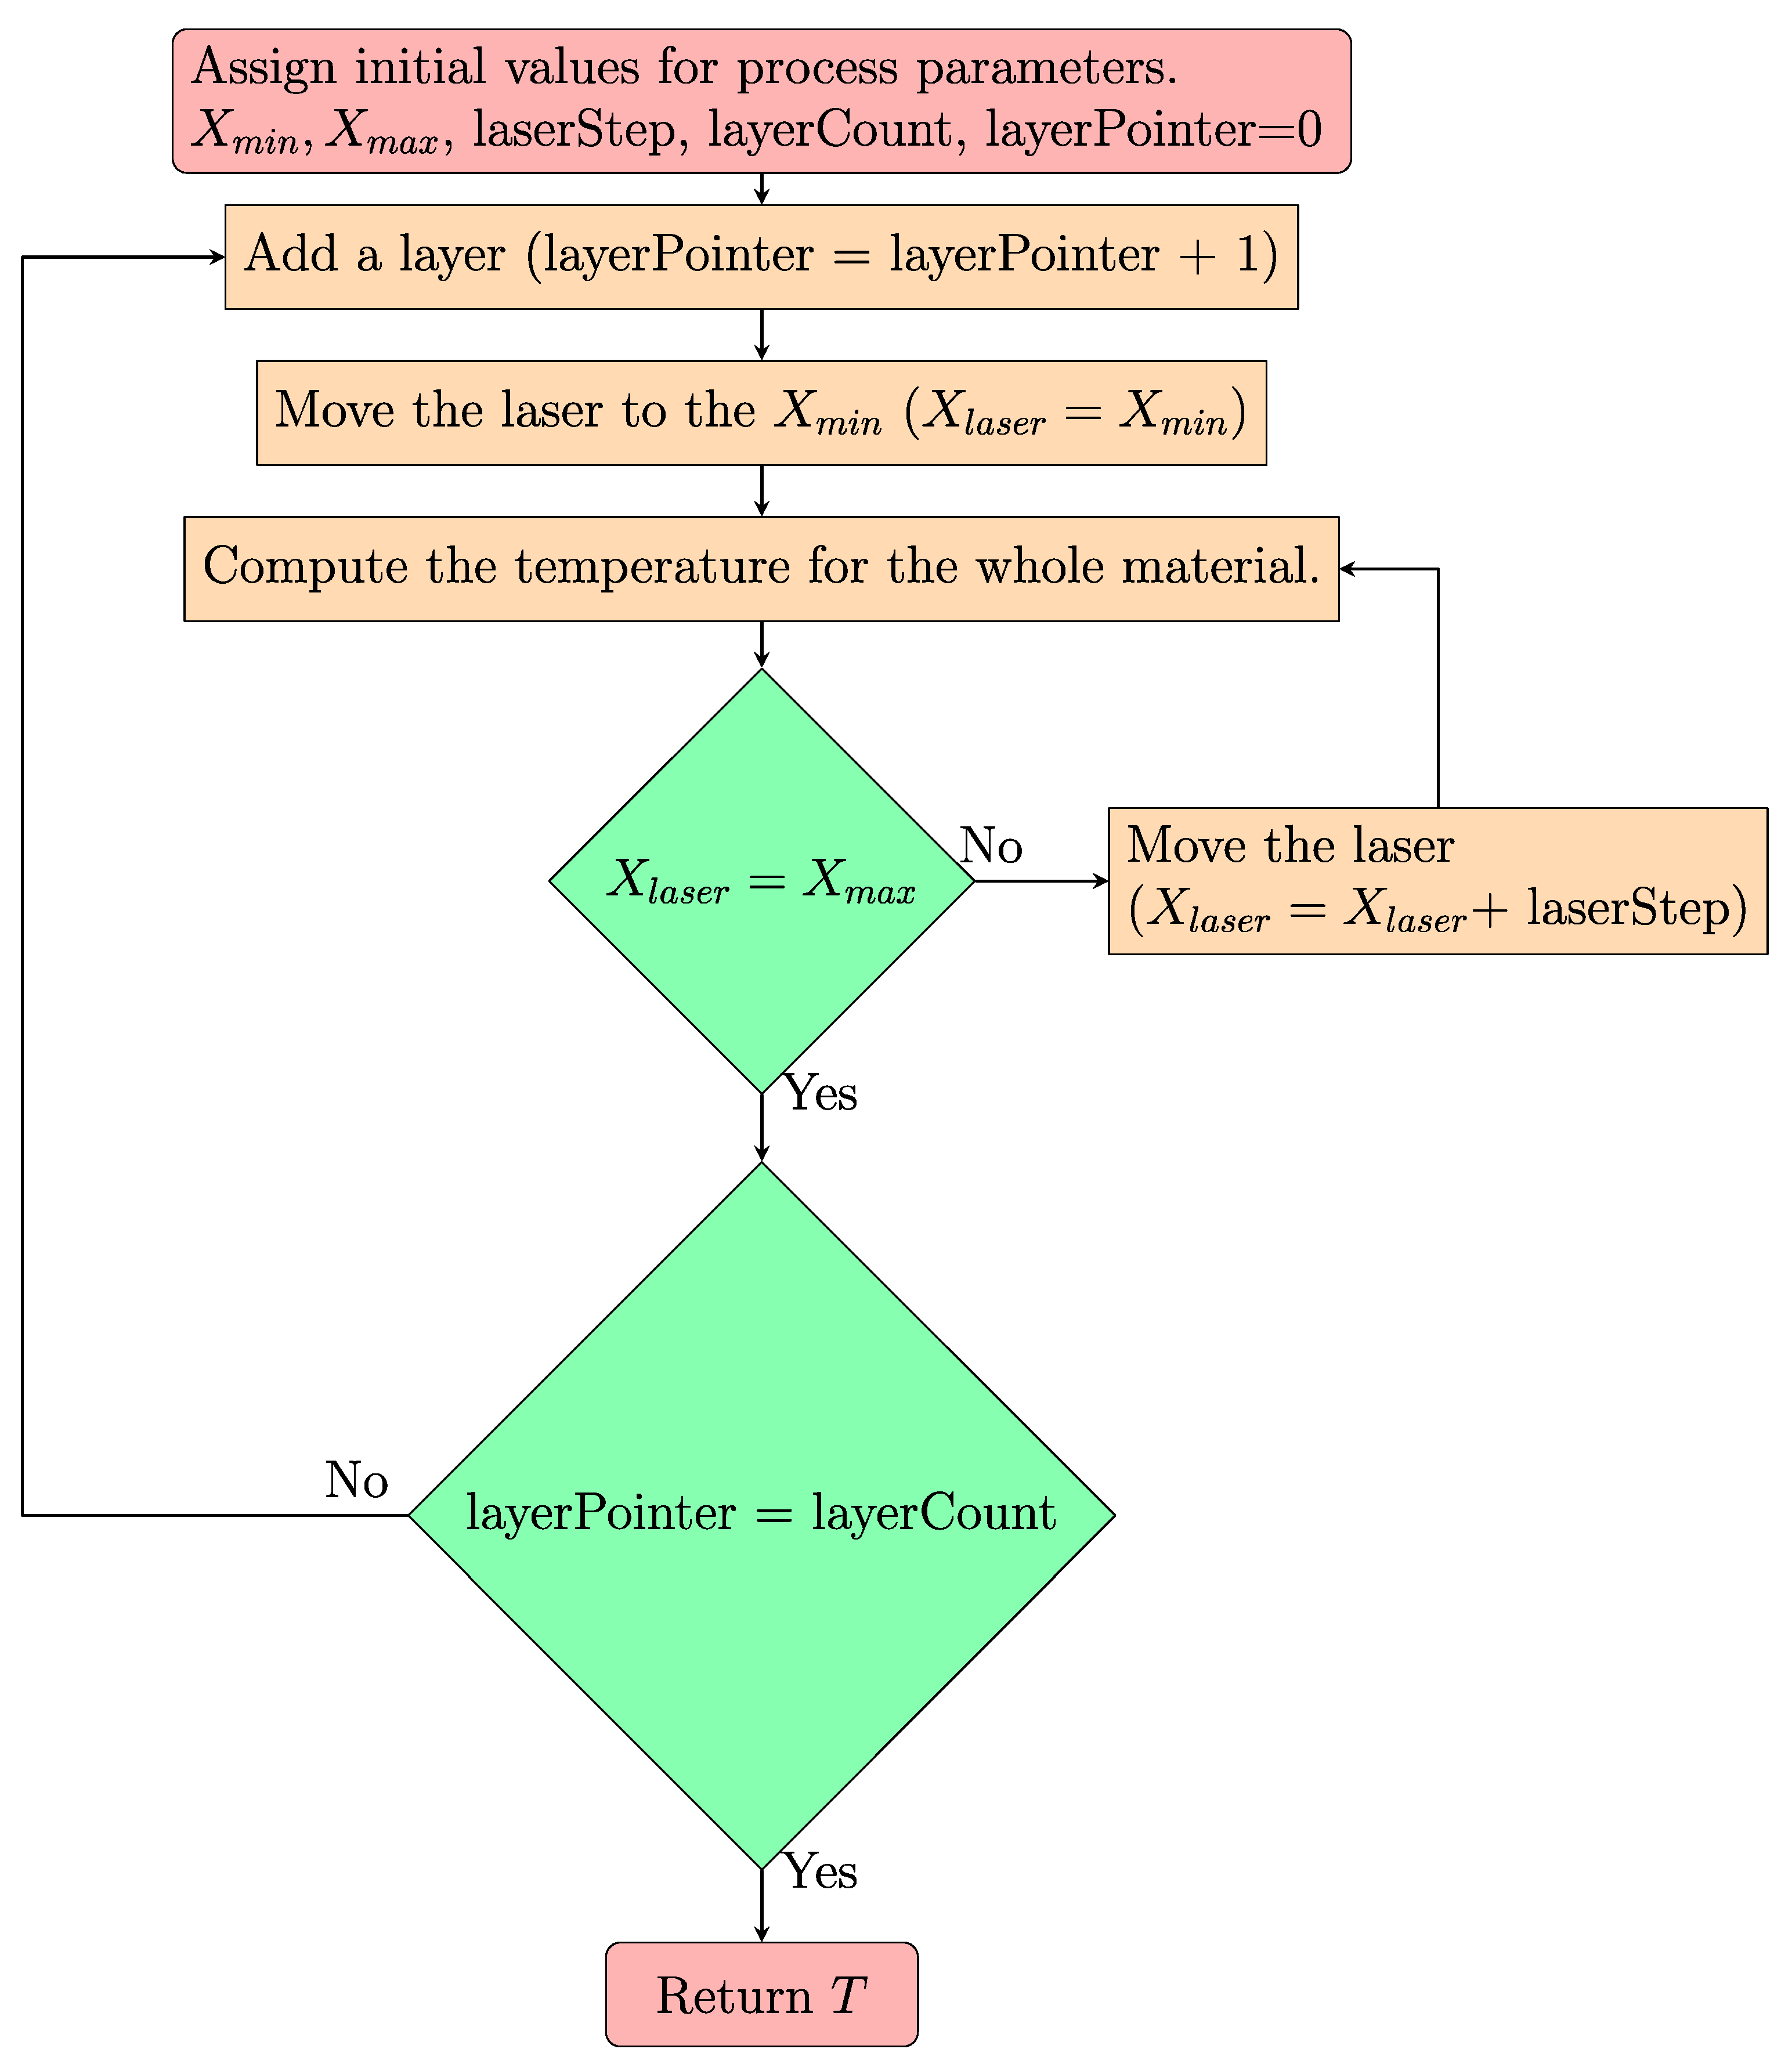
2.2. Numerical Modeling

For further validation of this work, finite element analysis is used. The temperature profile is modeled using a moving heat source analysis. The user defined functions (UDF) code is written in ANSYS Fluent software using Equation (8) in order to run a FEA on a 2D geometry, as shown in Figure 3. The build part material is Ti-6Al-4V. The heat loss from the surface due to conduction and radiation is considered. The material properties are assumed to be temperature dependent as shown in Figure 4.
The geometry of the build part is a rectangle shape of 30 × 10 mm. The quadratic element with the mesh size of 0.5 mm is chosen for all the simulations, as shown in Figure 3.
The laser power distribution on the laser beam focus plane is described by the Gaussian equation [32], as
  q ( x , y ) = D   P π r 2 e ( B ( x v t ) 2 r 2 )  
where, P is the total laser power input,   r is laser spot radius, v is scanning speed B is gaussian shape factor, and D is a numerical parameter used to fit the experimental data. It accounts for the absorptivity of the material, the heat lost to the metal powder before it falls into the melt pool and the angle of the surface with the laser beam. The values of the process parameters are listed in Table 2. The melting temperature of Ti-6Al-4V is in the range of 1538–1649 °C. In this study, 1620 is selected as the melting temperature of Ti-6Al-4V. The two-dimensional heat transfer in a rectangular surface could be described by
  ρ C ( T t + v T x ) = ( k T ) + S  
where ρ  is material density, C is specific heat, k is thermal conductivity, and S is the heat sink.
The boundary condition on the laser heating surface is defined as
  k T y = q ( x , y ) h ( T T 0 ) σ ε ( T 4 T 0 4 )  
where q(x,y) is laser power input, h is the heat transfer coefficient, σ is the thermal radiation coefficient, ε is the material emissivity, T 0 is the ambient temperature. The initial condition could be as

3. Modeling Results and Experimental Comparison

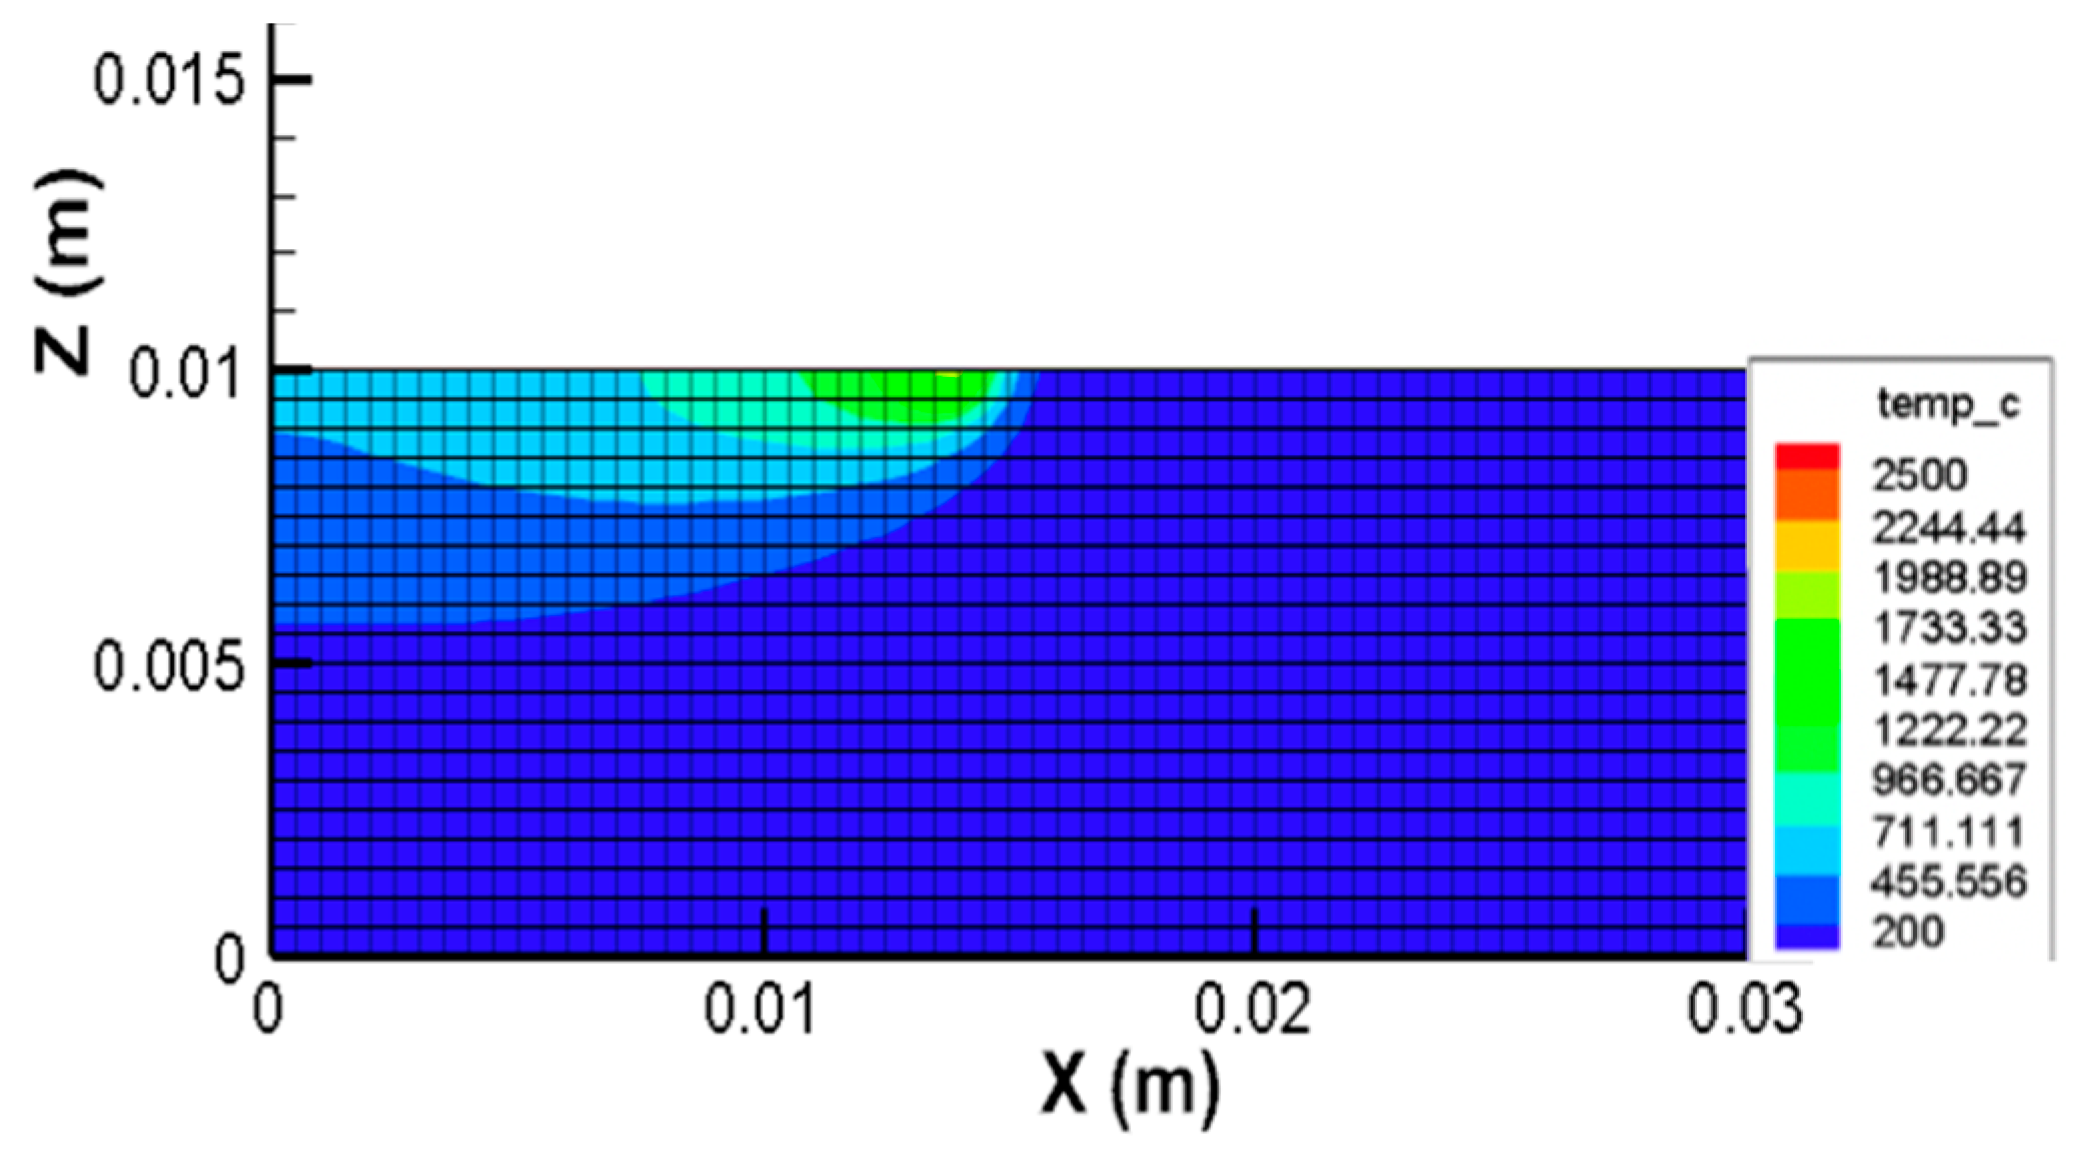
3.1. Temperature Profile, Maximum Temperature, and Surface Temperature

In this section, the temperature profile, maximum temperature and surface temperature are predicted and compared to the experimental results. A moving heat source analysis is used in order to predict the temperature distribution associated with the dynamic heat deposition. The explicit and closed-form temperature solutions are calculated in Section 2.1. The general differential equation of heat conduction in the 2D plane is used. In order to consider the moving heat source, it is assumed that the coordinate system moves with the heat source by using a transformation as shown in Equation (3). Finally, using the separation of variables, the closed-form solution of temperature is obtained in Equation (5). The material properties are assumed to be temperature dependent. The melting/solidification phase change is also considered. The analytical and numerical analysis are conducted in this work.
In order to validate the proposed model, the experimental temperature data are used from the work of Pauzet [35]. The Ti-6Al-4V samples are manufactured using the DMD machine. The dimensions of the samples are 2 mm in width, 70 mm in depth and 80 mm in length. The temperature on the build part surface is measured using the thermocouple of type K. In order to control the experimental setup, the authors used a thermal-camera and a high-speed camera to provide comparison bases for the temperature and the melt-pool size. The DMD machine has used the laser with the wavelength of 1030 nm. The scanning speed of 0.2 m/min and 0.4 m/min and the laser power of 400 W and 600 W are studied. The initial temperature of each layer depends on the final temperature of the previous layer, as the process is multi-layered.
Figure 5 shows the temperature profile of the build part. The temperature is predicted using both the analytical model and the numerical model. The laser moves along the x-axis from left to right. The small red spot on top shows the laser location. The layer thickness is chosen to be 80 μ m . The distance of the laser from the powder is 0.4 mm. For the same power, as the velocity is increased the maximum temperature is decreased since the powder has less time to absorb the energy. Different combinations of the process parameters are presented in Figure 5, specifically scanning speed and laser power.
The evolution of the surface temperature is plotted as a function of time for each case as shown in Figure 6. A study point will be chosen from the 2D geometry. When the laser is far away from the study point, the powder is at room temperature. As the laser approaches the study point, the temperature increases continuously. The maximum temperature on the curve corresponds to the moment that the laser is above the study point. After the laser passes the point, the temperature is decreased which shows that the material is cooling down. As shown in these plots, the cooling rate in the AM process is substantially high.
In order to understand the influence of the process parameters on the maximum temperature, and surface temperature, a sensitivity study is designed to investigate both the scan speed and laser power. The short computational time associated with the analytical modeling approach allows for a better understanding of the influence of the process parameters as discussed previously. Figure 7 depicts the influence of the scan speed and laser power on temperature, as predicted by the analytical model and compared to the experimental results.
The results of the simulations from the analytical model illustrates that the maximum temperature decreases linearly as the scan speed increases since the material has less time to absorb the energy. On the other hand, for the fixed scanning speed, as the power increases the maximum temperature increases. The four experimental data are also pointed in Figure 7. The predicted temperature from the analytical model is slightly higher than the experimental values. This error is mainly because the temperature is measured using thermocouples which are a little below the surface.
Figure 8 represents the influence of the laser on the surface temperature. As the power increases from 200 W to 600 W, the surface temperature increases for a fix scanning speed. On the other hand, the surface temperature will decrease as the scanning velocity increases from 0.1 m/min to 0.6 m/min for a fix laser power as shown in Figure 9.
As explained, the proposed model considers the multi-layer aspects of metal additive manufacturing. The effect of considering the layer addition on peak temperature is compared to the obtained peak temperature without considering the layer addition, and also compared to the experimental results.
To further validate the proposed model, the peak temperature is plotted as a function of scanning speed for different laser powers. Two different values of laser power (400 W and 600 W) and scanning speed (0.2 m/min and 0.4 m/min) are chosen. The temperature considering the layer addition, the temperature not considering the layer addition, and also experimental values are compared. The values are listed in Table 3. The observations show that considering layer addition improves the prediction of temperature, as shown in Figure 10. For example, the predicted temperature for scanning velocity of 0.2 m/min and laser power of 400 W without considering the layer addition is 2042 °C, but when considering the layering aspect of AM, the predicted temperature reduces to 1802.8 °C which shows that it affects the heat transfer mechanisms.
A comparison is also conducted among the analytical model considering the layer addition and dwell time, numerical model and experimental values as shown in Figure 11.
Overall, the temperature on the surface in terms of magnitude is well captured by both analytical and numerical approaches. The analytical model better approached the experimental measurements. This comparison shows the capability to accurately predict the temperature profile on the surface using the analytical modeling. The analytical approach also provides the power of a short computational time.
In order to illustrate the importance of considering the temperature dependent material properties, a sensitivity analysis is conducted to compare the predicted surface temperature with and without considering the property’s temperature-sensitivity. The obtained results demonstrate a significant difference between them as shown in Figure 12. The thermal conductivity of the Ti-6Al-4V is 6.7 W/m·°C which results in a low rate of heat transfer in the build part. However, the thermal conductivity of Ti-6Al-4V varies from 6 to 35 W/m·°C with respect to temperature. The increase in heat transfer rate induced by the increase in thermal conductivity, causes the predicted surface temperature decrease. In the cases that the temperature sensitivity of the material properties is considered, as the velocity increases from 0.2 m/min to 0.4 m/min, the variation of predicted surface temperature is less than 100 °C. However, when the temperature sensitivity of material properties is not considered, the variation of temperature is more than 1000 °C. As it is shown in Figure 12 the predicted temperature can be quite unrealistic without considering the material properties sensitivity to temperature.

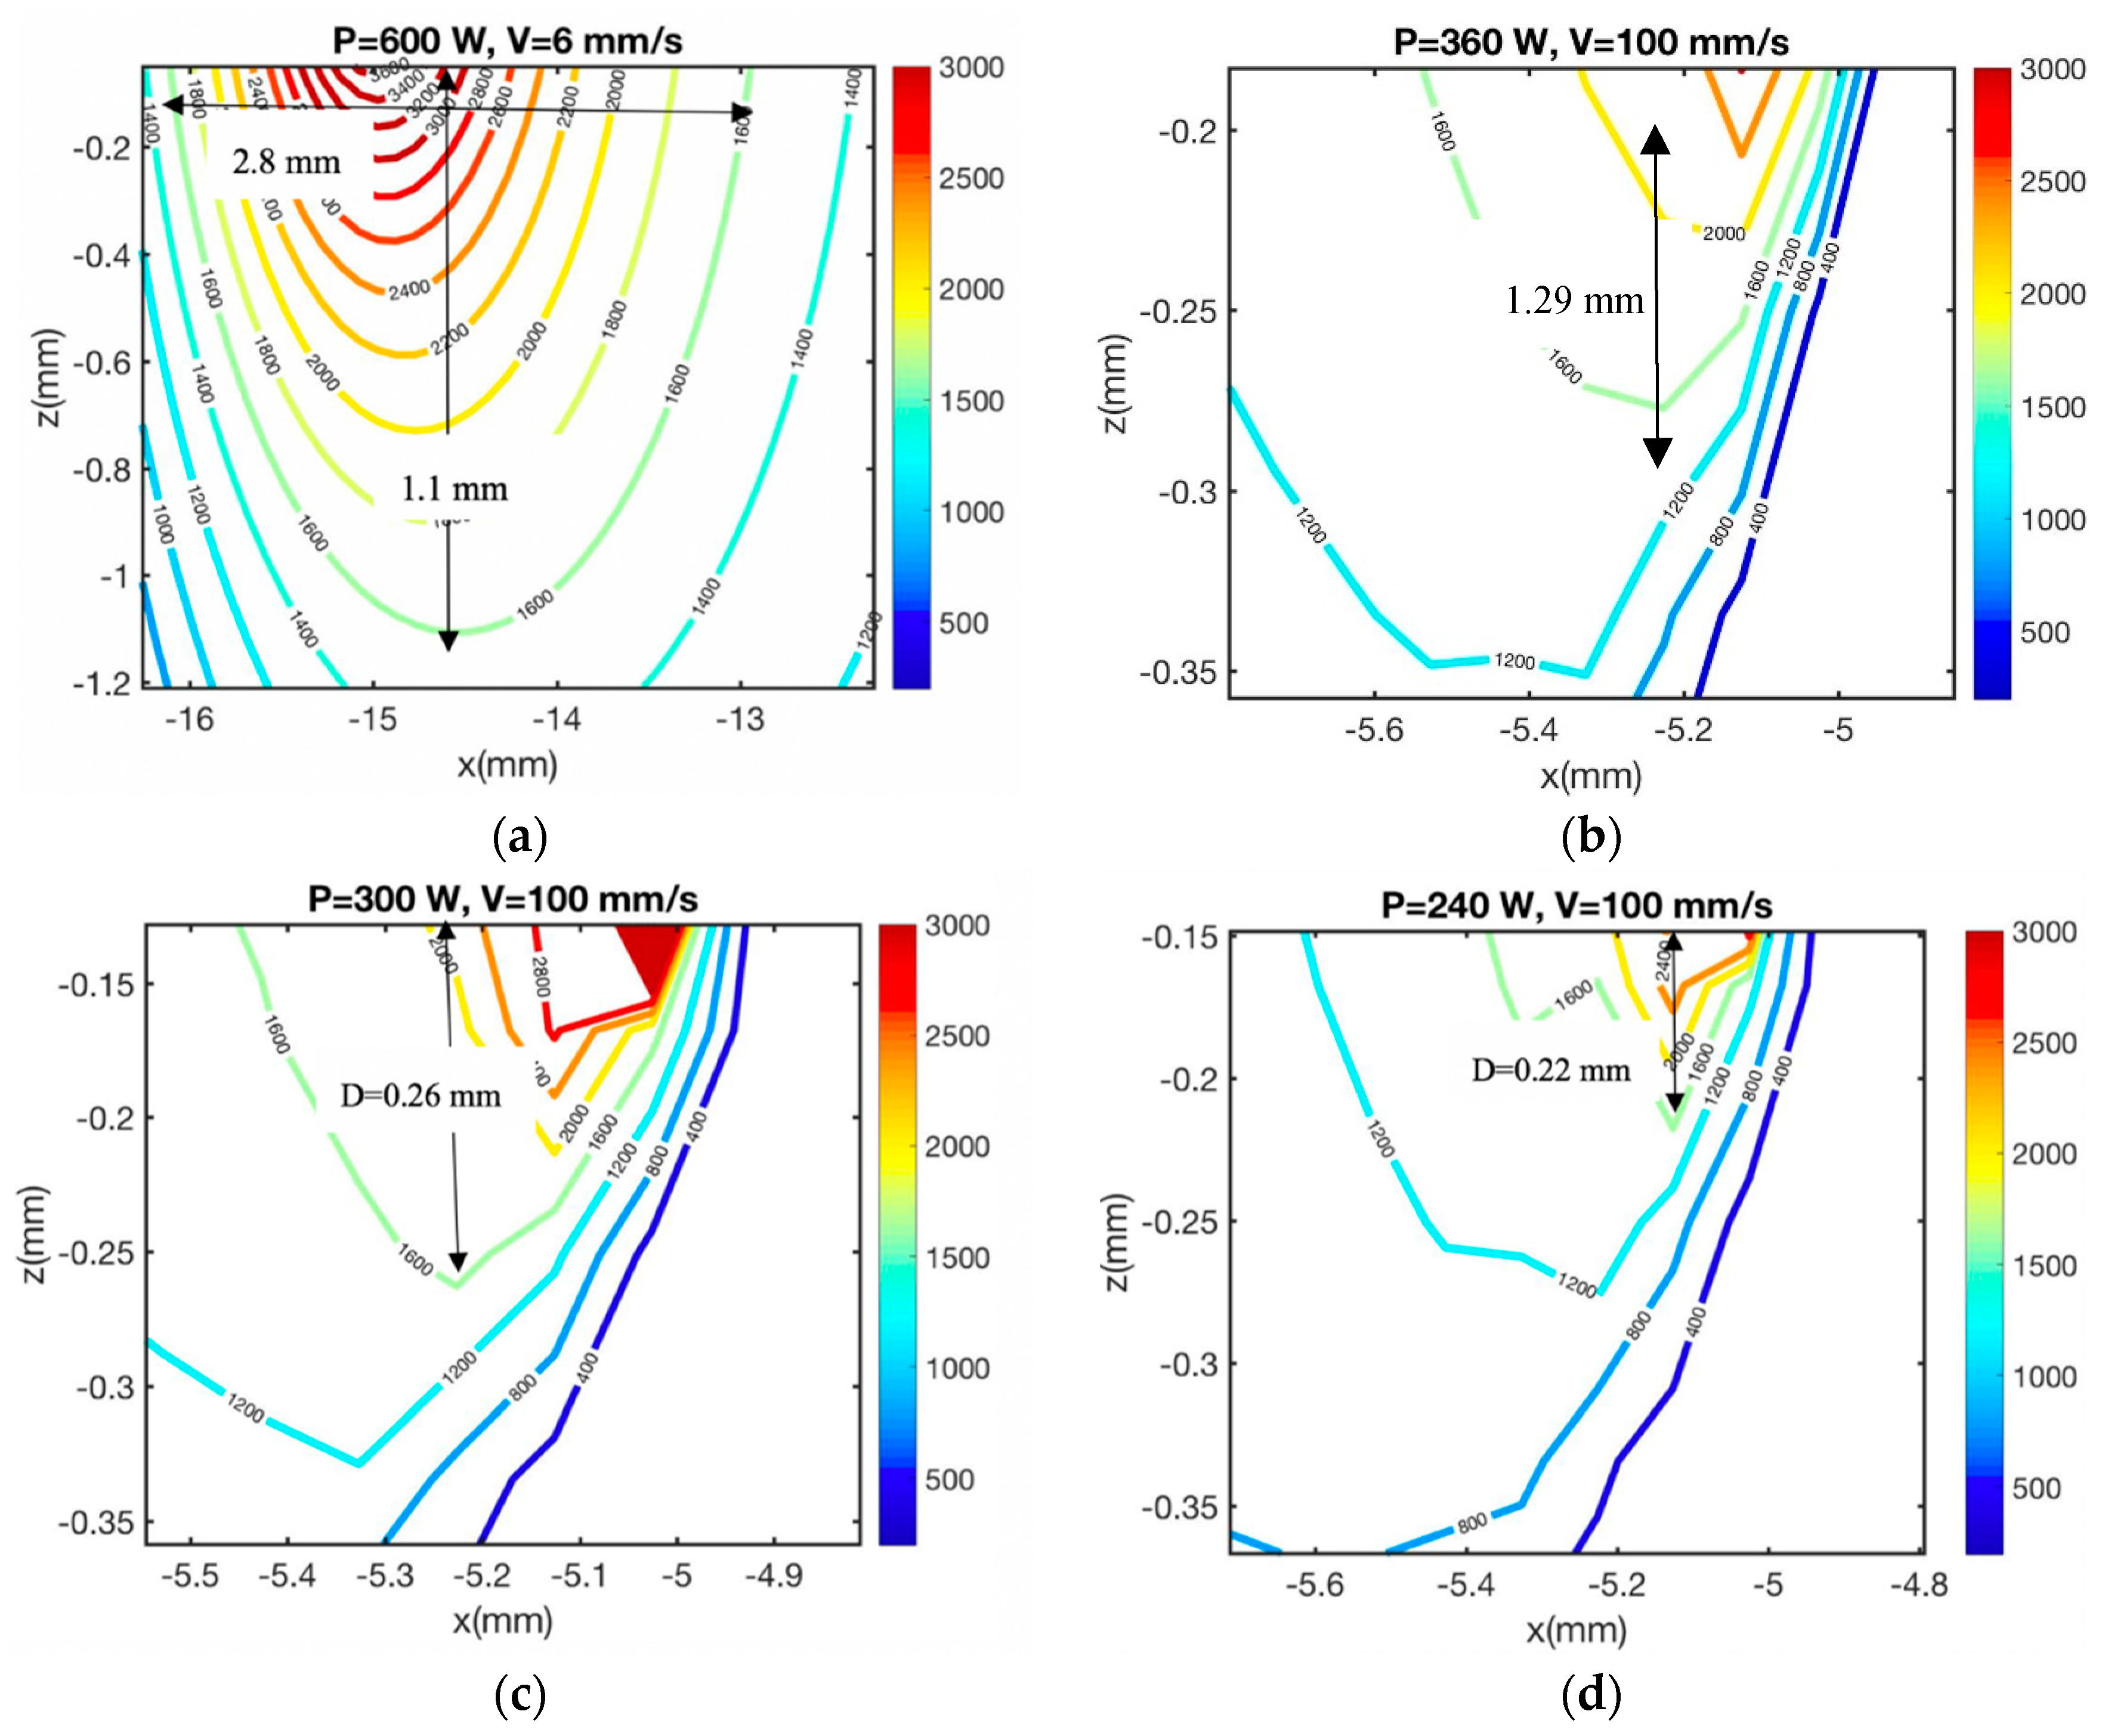
3.2. Experimental Validation Based on Melt Pool Geometry Measurement

In order to predict the morphology of the manufactured part, most of the researchers have used FEA or empirical models [36,37]. The proposed analytical model is used to predict the melt pool size. A comparison between the model and experimental results are conducted. The different process parameters such as laser power and scanning speed are used to predict the melt pool geometry. Figure 13 shows the experimental measurement of melt pool size from Peyre [38]. In this experiment, a high-speed C-Mos camera (Fastcam Photron) is used to measure the melt pool size which is generated by the DMD process.
Figure 14 demonstrates the predicted melt pool size and geometry for different process parameters in metal AM. The laser distance from powder is 1 μ m .
As shown in Figure 14, the melt pool depth and length are obtained using the analytical solution of temperature that is given in Section 2.1. The maximum error in length and depth is 7.6% and 3.7%, respectively. Table 4 listed the process parameters, predicted melt pool size, the experimental values, and also the corresponding error. Based on the calculated error, it is shown that the proposed 2D model can accurately capture the melt pool size. As a result, it eliminates the needs for doing costly experiments and also time-consuming FEM.

4. Conclusions

Analytical models and numerical model are used to predict the temperature in laser-based metal additive manufacturing configurations of either direct metal deposition or selective laser melting. In the past few decades, many researchers have been trying to understand the relationships between the process parameters and temperature using FEM. The numerical methods have low computational efficiency, and it cannot capture all the physical aspects of the metal AM processes. The lack of a physics-based analytical model that captures all the physical phenomena of the AM processes is sensible. The physics-based analytical modeling provides accurate results. The high computational efficiency and easy implementation are the other advantages of the analytical model for the additive manufacturing modeling.
In this work, an analytical model is proposed to predict the distribution of the temperature profile by considering the interaction of the layers during the laser metal additive manufacturing process. The material properties are assumed to be temperature dependent, and also the melting/solidification phase change is considered in this work. The temperature profile, the peak temperature, and the evolution of surface temperature are obtained from the proposed model. The analytical model of the temperature is based on the moving heat source assumption, as described in Section 2. The general differential equation of heat conduction is used to obtain the closed-form temperature solution using the separation of variables in a semi-infinite medium. The material is assumed to be homogeneous and isotropic. The predicted temperature from the analytical model are compared with the experimental values and FEM results. For further validation, a comparison of peak temperature considering the layer addition and without considering the layer addition is conducted and compared with experimental values.
The results of the temperature distribution considering the layering aspects of metal additive manufacturing showed better agreement with experimental values in comparison with the predicted temperature not considering the layer addition. The observations suggest that for a fixed laser power, the laser speed increases as the temperature decreases, since the material has less time to absorb the energy. Also, for a given scanning speed, the laser power increases as the maximum temperature increases.
A numerical model is also used to predict the temperature in the metal additive manufacturing process. The material properties are assumed to be temperature dependent. In the numerical model, the heat loss due to convection and radiation is considered. The temperature is well obtained using numerical models.
A comparison is conducted in order to capture the effect of considering the temperature sensitivity of material properties. A significant difference is observed between them. The main reason is that the thermal conductivity of Ti-6Al-4V is low, so the heat transfer rate decreases and causes the surface temperature to increase. However, by considering the temperature dependent material properties, the thermal conductivity increases by increasing the temperature. As a result, the heat transfer rate increases and causes the obtained surface temperature to be less compared to the case in which the thermal conductivity is constant.
The proposed model can also predict the melt pool size with the error margin being less than 7.6%. Hence, it eliminates the costly experiments and time-consuming FEM for predicting the melt pool size. This 2D model also shows that there is no need for doing 3D simulations in order to predict the melt pool size and geometry.
The proposed analytical model shows a good agreement with the experimental values. The proposed analytical model reduces the computational time to a fraction when compared to finite element analysis. The analytical model has also eliminated the costly experiments in order to understand the physical concepts of laser metal additive manufacturing. The influence of scanning speed and laser power on the temperature profile, surface temperature, and also peak temperature are investigated and the relations between them are established.

Author Contributions

E.M. conceived and developed the proposed analytical model, extracted and analyzed the data, and wrote the paper. J.N., P.B., O.F., and K.-N.C. provided general guidance. S.Y.L. provided general guidance and proofread the manuscript writing.

Funding

The funding is confidential.

Conflicts of Interest

The authors declare no conflict of interest.

References

  1. Mellor, S.; Hao, L.; Zhang, D. Additive manufacturing: A framework for implementation. Int. J. Prod. Econ. 2014, 149, 194–201. [Google Scholar] [CrossRef] [Green Version]
  2. Bikas, H.; Stavropoulos, P.; Chryssolouris, G. Additive manufacturing methods and modelling approaches: A critical review. Int. J. Adv. Manuf. Technol. 2016, 83, 389–405. [Google Scholar] [CrossRef]
  3. Turner, B.N.; Strong, R.; Gold, S.A. A review of melt extrusion additive manufacturing processes: I. Process design and modeling. Rapid Prototyp. J. 2014, 20, 192–204. [Google Scholar] [CrossRef]
  4. Kruth, J.-P.; Levy, G.; Klocke, F.; Childs, T. Consolidation phenomena in laser and powder-bed based layered manufacturing. CIRP Ann. 2007, 56, 730–759. [Google Scholar] [CrossRef]
  5. Woesz, A. Rapid prototyping to produce porous scaffolds with controlled architecture for possible use in bone tissue engineering. In Virtual Prototyping & Bio Manufacturing in Medical Applications; Springer: New York, NY, USA, 2008; pp. 171–206. [Google Scholar]
  6. Frazier, W.E. Metal additive manufacturing: A review. J. Mater. Eng. Perform. 2014, 23, 1917–1928. [Google Scholar] [CrossRef]
  7. Vasinonta, A.; Beuth, J.L.; Griffith, M.L. Process maps for controlling residual stress and melt pool size in laser-based SFF processes. In Proceedings of the Solid Freeform Fabrication Symposium, Austin, TX, USA, 7–9 August 2000; p. 206. [Google Scholar]
  8. Pang, T.H.; Guertin, M.D.; Nguyen, H.D. Accuracy of Stereolithography Parts: Mechanism and Modes of Distortion for a “Letter H” Diagnostic Part. In Proceedings of the Solid Free Form Fabrication Symposium, Austin, TX, USA, 7–9 August 1995; pp. 170–180. [Google Scholar]
  9. Zhang, Y.; Chou, Y.K. A parametric study of part distortions in FDM using 3D FEA. In Proceedings of the 17th Solid Freeform Fabrication Symposium, Austin, TX, USA, 14–16 August 2006; pp. 410–420. [Google Scholar]
  10. Roberts, I.A.; Wang, C.; Esterlein, R.; Stanford, M.; Mynors, D. A three-dimensional finite element analysis of the temperature field during laser melting of metal powders in additive layer manufacturing. Int. J. Mach. Tools Manuf. 2009, 49, 916–923. [Google Scholar] [CrossRef]
  11. Michaleris, P. Modeling metal deposition in heat transfer analyses of additive manufacturing processes. Finite Elem. Anal. Des. 2014, 86, 51–60. [Google Scholar] [CrossRef]
  12. Krol, T.; Seidel, C.; Zaeh, M. Prioritization of process parameters for an efficient optimisation of additive manufacturing by means of a finite element method. Procedia CIRP 2013, 12, 169–174. [Google Scholar] [CrossRef]
  13. Hu, D.; Kovacevic, R. Sensing, modeling and control for laser-based additive manufacturing. Int. J. Mach. Tools Manuf. 2003, 43, 51–60. [Google Scholar] [CrossRef]
  14. Contuzzi, N.; Campanelli, S.; Ludovico, A. 3 D Finite Element Analysis in the Selective Laser Melting Process. Int. J. Simul. Model. 2011, 10, 113–121. [Google Scholar] [CrossRef]
  15. Ding, J.; Colegrove, P.; Mehnen, J.; Ganguly, S.; Almeida, P.S.; Wang, F.; Williams, S. Thermo-mechanical analysis of Wire and Arc Additive Layer Manufacturing process on large multi-layer parts. Comput. Mater. Sci. 2011, 50, 3315–3322. [Google Scholar] [CrossRef] [Green Version]
  16. Denlinger, E.R.; Heigel, J.C.; Michaleris, P.; Palmer, T. Effect of inter-layer dwell time on distortion and residual stress in additive manufacturing of titanium and nickel alloys. J. Mater. Process. Technol. 2015, 215, 123–131. [Google Scholar] [CrossRef]
  17. Aggarangsi, P.; Beuth, J.L. Localized preheating approaches for reducing residual stress in additive manufacturing. In Proceedings of the SFF Symposium, Austin, TX, USA, 14–16 August 2006; pp. 709–720. [Google Scholar]
  18. De La Batut, B.; Fergani, O.; Brotan, V.; Bambach, M.; El Mansouri, M. Analytical and Numerical Temperature Prediction in Direct Metal Deposition of Ti6Al4V. J. Manuf. Mater. Process. 2017, 1, 3. [Google Scholar] [CrossRef]
  19. Yap, C.Y.; Tan, H.K.; Du, Z.; Chua, C.K.; Dong, Z. Selective laser melting of nickel powder. Rapid Prototyp. J. 2017, 23, 750–757. [Google Scholar] [CrossRef]
  20. Galarraga, H.; Warren, R.J.; Lados, D.A.; Dehoff, R.R.; Kirka, M.M.; Nandwana, P. Effects of heat treatments on microstructure and properties of Ti-6Al-4V ELI alloy fabricated by electron beam melting (EBM). Mater. Sci. Eng. A 2017, 685, 417–428. [Google Scholar] [CrossRef]
  21. Kelly, S.; Kampe, S. Microstructural evolution in laser-deposited multilayer Ti-6Al-4V builds: Part II. Thermal modeling. Metall. Mater. Trans. A 2004, 35, 1869–1879. [Google Scholar] [CrossRef]
  22. Hoadley, A.; Rappaz, M. A thermal model of laser cladding by powder injection. Metall. Trans. B 1992, 23, 631–642. [Google Scholar] [CrossRef]
  23. Toyserkani, E.; Khajepour, A.; Corbin, S. 3-D finite element modeling of laser cladding by powder injection: Effects of laser pulse shaping on the process. Opt. Lasers Eng. 2004, 41, 849–867. [Google Scholar] [CrossRef]
  24. Cao, X.; Ayalew, B. Control-oriented MIMO modeling of laser-aided powder deposition processes. In Proceedings of the American Control Conference (ACC), Chicago, IL, USA, 1–3 July 2015; IEEE: Piscataway, NJ, USA, 2015; pp. 3637–3642. [Google Scholar]
  25. Hitzler, L.; Hirsch, J.; Heine, B.; Merkel, M.; Hall, W.; Öchsner, A. On the anisotropic mechanical properties of selective laser-melted stainless steel. Materials 2017, 10, 1136. [Google Scholar] [CrossRef] [PubMed]
  26. Hitzler, L.; Merkel, M.; Hall, W.; Öchsner, A. A Review of Metal Fabricated with Laser-and Powder-Bed Based Additive Manufacturing Techniques: Process, Nomenclature, Materials, Achievable Properties, and its Utilization in the Medical Sector. Adv. Eng. Mater. 2018, 20, 1700658. [Google Scholar] [CrossRef]
  27. Rashid, R.; Masood, S.; Ruan, D.; Palanisamy, S.; Rashid, R.R.; Brandt, M. Effect of scan strategy on density and metallurgical properties of 17-4PH parts printed by Selective Laser Melting (SLM). J. Mater. Process. Technol. 2017, 249, 502–511. [Google Scholar] [CrossRef]
  28. Wang, L.; Jiang, X.; Zhu, Y.; Zhu, X.; Sun, J.; Yan, B. An approach to predict the residual stress and distortion during the selective laser melting of AlSi10Mg parts. Int. J. Adv. Manuf. Technol. 2018, 97, 3535–3546. [Google Scholar] [CrossRef]
  29. Shiva, S.; Palani, I.; Paul, C.; Singh, B. Laser annealing of laser additive–manufactured Ni-Ti structures: An experimental–numerical investigation. Proc. Inst. Mech. Eng. Part B J. Eng. Manuf. 2018, 232, 1054–1067. [Google Scholar] [CrossRef]
  30. Mirkoohi, E.; Bocchini, P.; Liang, S.Y. An Analytical Modeling for Designing the Process Parameters for Temperature Specifications in Machining. Preprints 2018. [Google Scholar] [CrossRef]
  31. Mirkoohi, E.; Bocchini, P.; Liang, S.Y. An analytical modeling for process parameter planning in the machining of Ti-6Al-4V for force specifications using an inverse analysis. Int. J. Adv. Manuf. Technol. 2018, 98, 2347–2355. [Google Scholar] [CrossRef]
  32. Carslaw, H.; Jaeger, J. Conduction of Heat in Solids: Oxford Science Publications; Oxford University Press: Oxford, UK, 1959. [Google Scholar]
  33. Mirkoohi, E.; Malhotra, R. Effect of Particle Shape on Neck Growth and Shrinkage of Nanoparticles. In Proceedings of the ASME 2017 12th International Manufacturing Science and Engineering Conference Collocated with the JSME/ASME 2017 6th International Conference on Materials and Processing, Los Angeles, CA, USA, 4–8 June 2017; American Society of Mechanical Engineers: New York, NY, USA, 2017; p. V002T001A026. [Google Scholar]
  34. Mills, K.C. Recommended Values of Thermophysical Properties for Selected Commercial Alloys; Woodhead Publishing: Cambridge, UK, 2002. [Google Scholar]
  35. Pouzet, S.B. Fabrication Additive de Composites à Matrice titane par Fusion Laser de Poudre Projetée; ENSAM: Paris, France, 2015. [Google Scholar]
  36. Pinkerton, A.J.; Li, L. Modelling the geometry of a moving laser melt pool and deposition track via energy and mass balances. J. Phys. D Appl. Phys. 2004, 37, 1885–1895. [Google Scholar] [CrossRef]
  37. Cheng, B.; Chou, K. Melt pool geometry simulations for powder-based electron beam additive manufacturing. In Proceedings of the 24th Annual International Solid Freeform Fabrication Symposium—An Additive Manufacturing Conference, Austin, TX, USA, 12–14 August 2013; pp. 644–654. [Google Scholar]
  38. Peyre, P.; Aubry, P.; Fabbro, R.; Neveu, R.; Longuet, A. Analytical and numerical modelling of the direct metal deposition laser process. J. Phys. D Appl. Phys. 2008, 41, 025403. [Google Scholar] [CrossRef]
Figure 1. Heat transfer during laser-based metal additive manufacturing.
Jmmp 02 00063 g001
Figure 2. Fellow chart of considering build layers.
Jmmp 02 00063 g002
Figure 3. Representation of the mesh and numerical model.
Jmmp 02 00063 g003
Figure 4. Material properties as a function of temperature, (a) specific heat, (b) thermal conductivity.
Jmmp 02 00063 g004
Figure 5. Predicted temperature profile using (ad) physics-based modeling and (eh) numerical modeling.
Jmmp 02 00063 g005
Figure 6. Evolution of surface temperature as a function of time for (a) P = 400 W, V = 0.4 m/min, (b) P = 600 W, V = 0.4 m/min, (c) P = 400 W, V = 0.2 m/min, (d) P = 600 W, V = 0.2 m/min.
Jmmp 02 00063 g006
Figure 7. Effect of scan speed and laser power on peak temperature.
Jmmp 02 00063 g007
Figure 8. Comparison of evolution of surface temperature for (a) V = 0.3 m/min, and (b) V = 0.6 m/min.
Jmmp 02 00063 g008
Figure 9. Comparison of evolution of surface temperature for (a) P = 400 W, and (b) P = 600 W.
Jmmp 02 00063 g009
Figure 10. Comparison of prediction of temperature with and without considering the layers with experimental values.
Jmmp 02 00063 g010
Figure 11. Comparison of predicted temperature among analytical model, experimental values, and FEA.
Jmmp 02 00063 g011
Figure 12. Comparison of predicted temperature considering the temperature sensitivity of material properties (WMTS), and without temperature sensitivity of material properties (WoMTS).
Jmmp 02 00063 g012
Figure 13. Experimental measurement of melt pool size for P = 600 W and V = 6 mm/s.
Jmmp 02 00063 g013
Figure 14. Predicted melt pool size in metal AM process for (a) P = 600 W, V = 6 mm/s (b) P = 360 W, V = 100 mm/s (c) P = 300 W, V = 100 mm/s, (d) P = 240 W, V = 100 mm/s
Jmmp 02 00063 g014
Table 1. Material properties of Ti-6Al-4V.
PropertiesTi-6Al-4V
Liquidus temperature (K)1928
Solidus temperature (K)1878
Thermal conductivity (W/m K) { K s = 1.57 + 1.6 × 10 2 T 1 × 10 6 T 2     1268   <   T   <   1928 K l =   33.4                   T   =   1928 K l =   34.6                   T   =   1978
Specific heat (J/Kg K) { C p = 492.4 + 0.025 T 4.18 × 10 6 T 2    1268   <   T   <   1928 C p = 830                   T   >   1928
Density (Kg/m3)4420
Viscosity (Kg/m s)4 × 10⁻³
Latent heat (J/Kg)2 × 105
Table 2. Material parameters used for numerical modeling.
NameValue
Thermal radiation coefficient (W/m2·°C4)5.67 × 10−8
Heat transfer coefficient (W/m2·°C)24
Material emissivity0.9
D[0.2–0.4]
Gaussian shape factor2
Laser spot radius (mm)0.7
Ambient temperature25
Table 3. Comparison of temperature prediction among considering layer addition, not considering the layer addition, and experimental values.
Laser Power (W)400400600600
Scanning Speed (m/min)0.20.40.20.4
Max Temperature w/o Layer2043.71998.12603.72538.1
Max Temperature with Layer1802.81733.62298.12222.7
Experimental Values1730160521001970
Table 4. Predicted and experimental measurements of melt pool size.
P (W)V (mm/s)Melt Pool Length (mm) ModelMelt Pool Length (mm) Exp/simMelt Pool Depth (mm) ModelMelt Pool Depth (mm) Exp/simError in LengthError in Depth
600 [38]62.802.601.101.207.60%2.00%
360 [37]100--0.290.30-3.40%
300 [37]100--0.260.27-3.70%
240 [37]100--0.220.20-1.00%

