1. Introduction
Interest in laser powder bed fusion (LPBF) additive manufacturing (AM) has spiked in many industries, creating a high demand for new AM-ready metallic materials [
1]. However, the mechanical properties, surface finish, and precision of LPBF parts are dependent on more than 60 processing parameters [
2], which all need to be optimized. There are currently two main ways to realize this process optimization for new alloys. Most often, this optimization is carried out by defining an experiment plan that covers different arrangements of laser power, scanning speed, hatching space, layer thickness, scanning strategy and part orientation for a given alloy [
3,
4,
5,
6,
7,
8,
9,
10]. Once the specimens are printed, their mechanical properties are evaluated and a conclusion is drawn on the influence of the different processing parameters on the final part geometric and service attributes. This approach yields satisfying results, but requires multiple printing jobs and time-consuming post-processing experiments. It could easily be realized for a single alloy, but becomes prohibitively expensive if multiple process optimization campaigns are required.
Another way a new AM material can be introduced is by applying a numerical modeling approach with the objective of finding the appropriate printing parameters, as shown in [
11,
12,
13,
14,
15]. However, due to a large number of variables, these models require significant time and computer resources to model a single laser track, let alone a complex part. Moreover, the more complex the model, the more laborious the calibration procedure, which makes the process optimization more cumbersome and labor-intensive.
In this work, we investigate the possibility of using a combination of a simplified analytical model of the melt pool and of an experimental calibration routine to create a density control algorithm for the laser powder bed fusion process. The main objective of this approach is to reduce the time, the number of printing jobs and the quantity of post-processing characterization work needed to optimize the process for any given powder feedstock and any given LPBF system.
2. Methodology
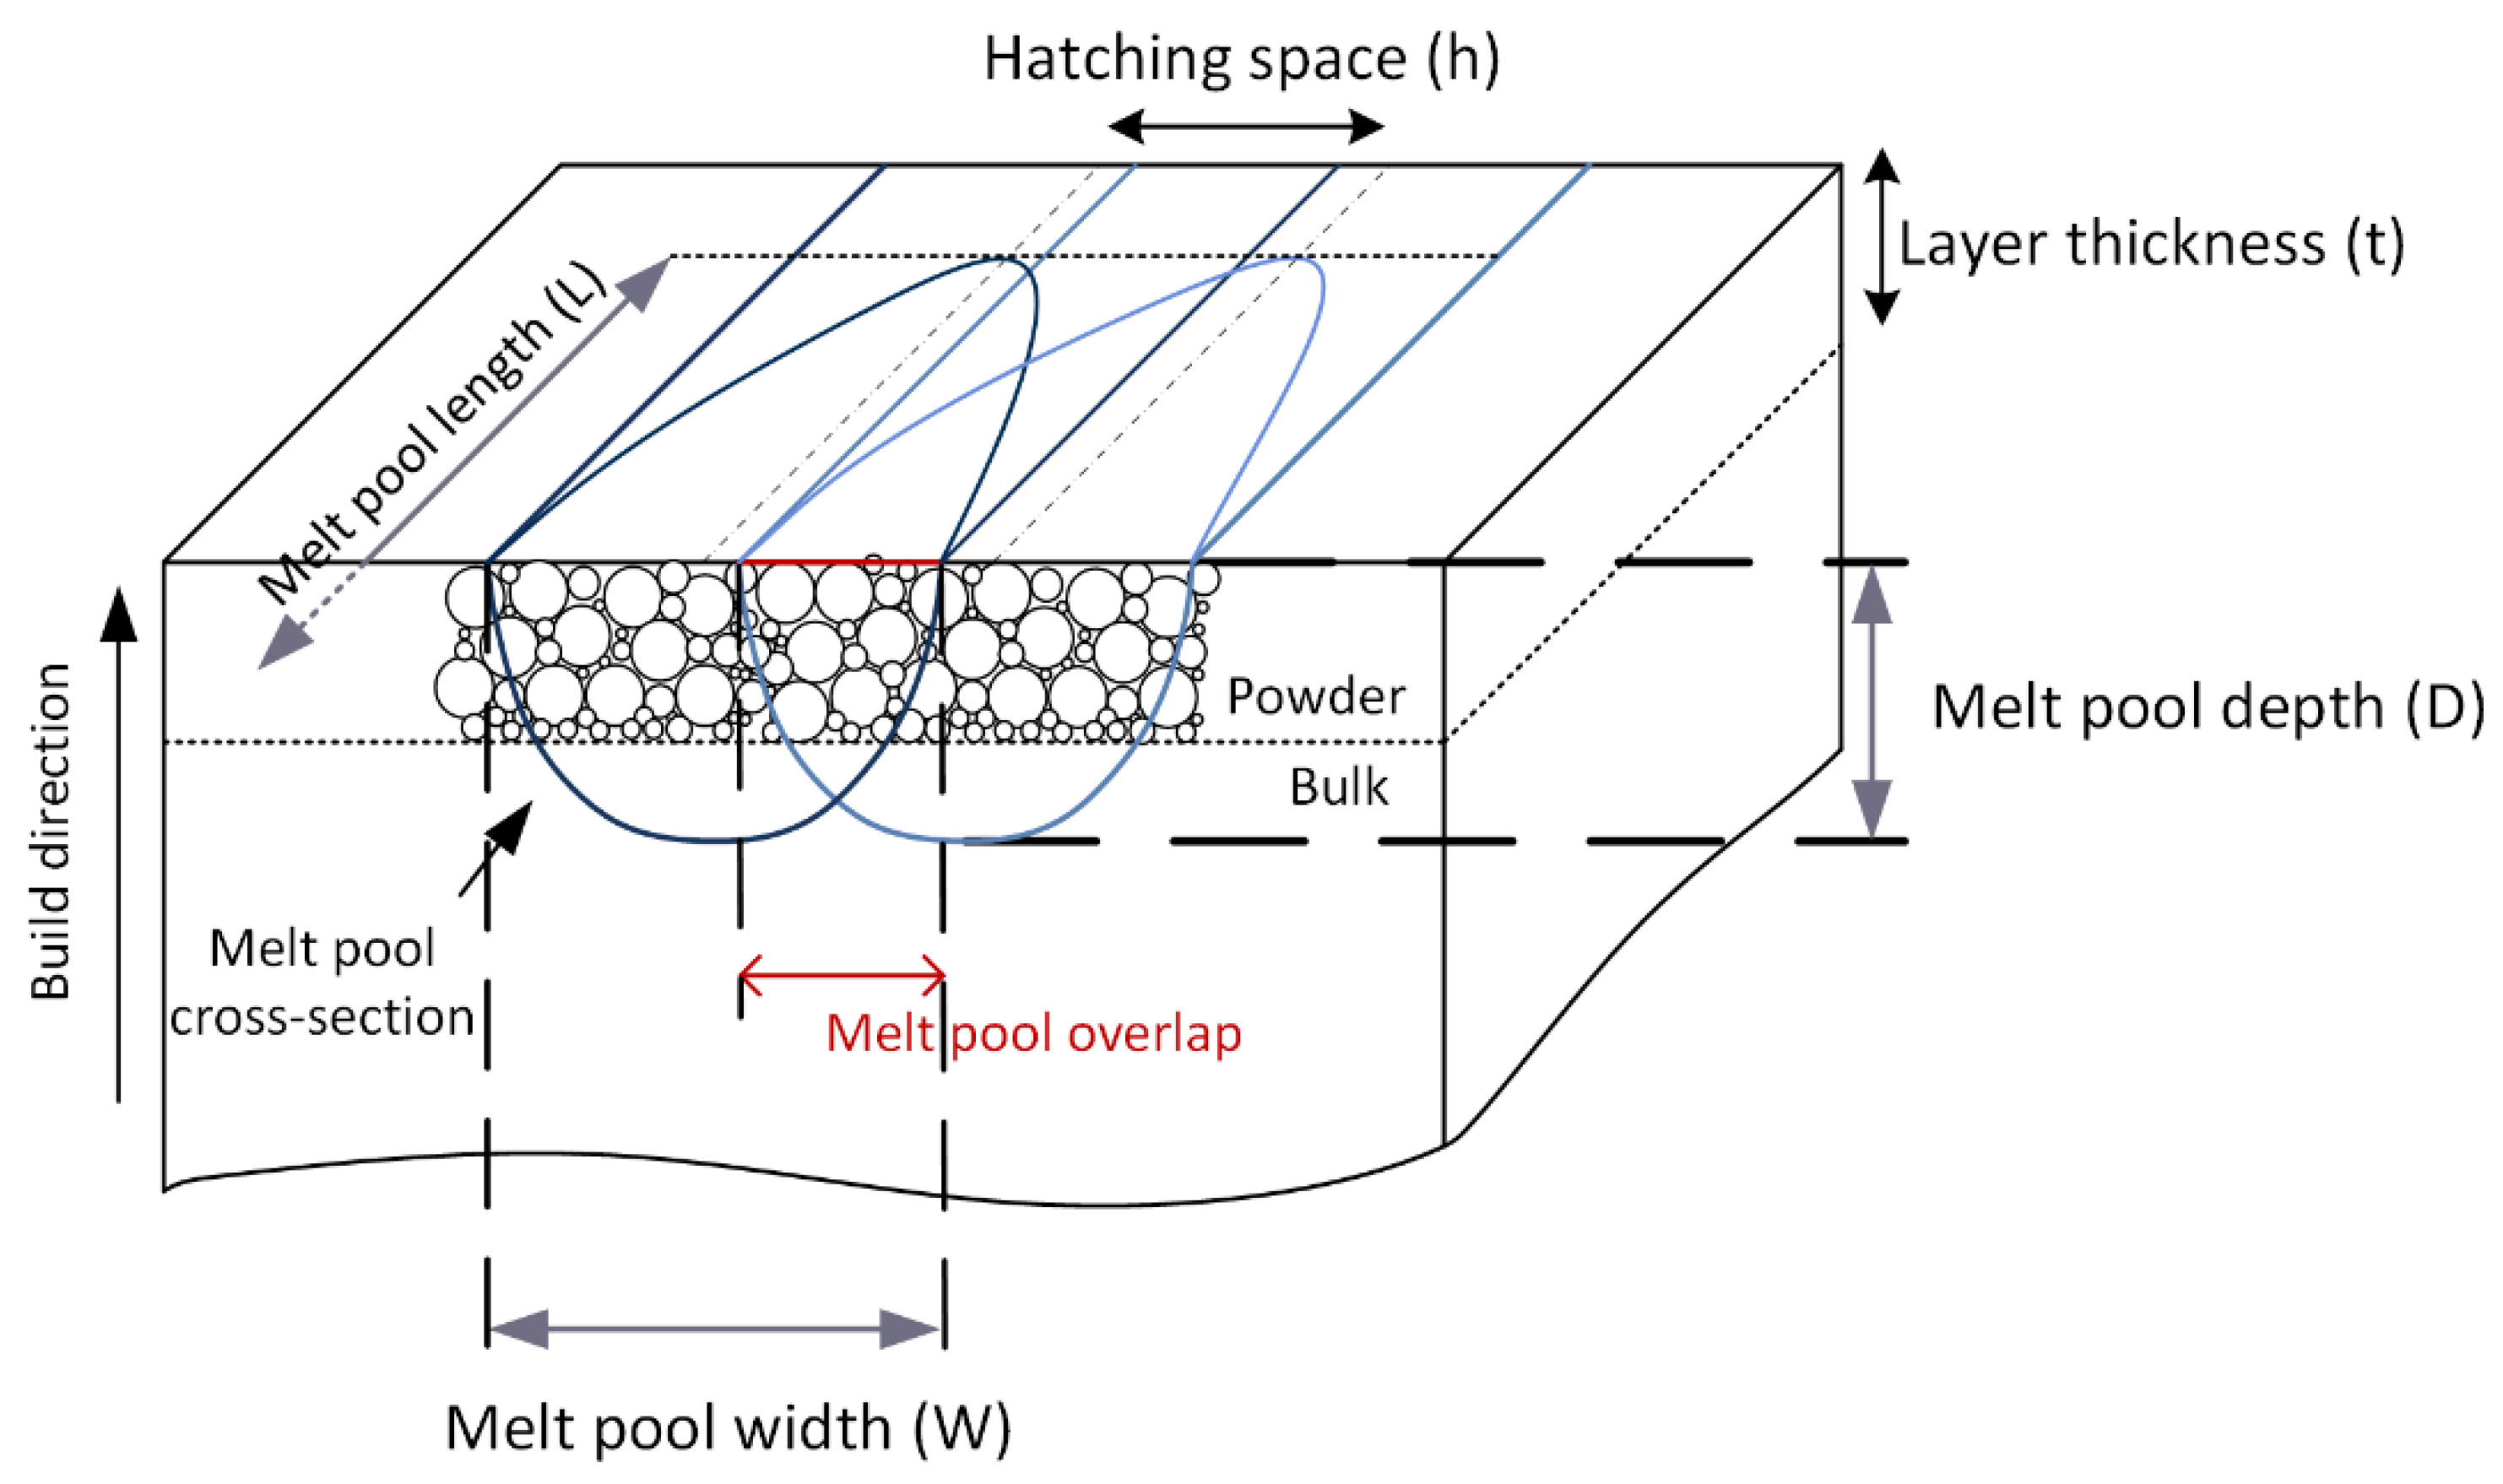
Previous studies have demonstrated that the density of LPBF manufactured parts is mostly dependent on the following three dimensionless melt pool metrics (
Figure 1): melt pool depth-to-layer thickness ratio (
D/t), melt pool width-to-hatching space ratio (
W/h), and melt pool length-to-melt pool width ratio (
L/W), and that the highest density is generally obtained for 1.5 <
D/t < 2, 1.5 <
W/h < 2.5 and
L/W < 2Pi [
16,
17]. Based on these observations, we investigated the possibility of using the
D/t,
W/h and
L/W ratios to correlate a specific combination of LPBF processing parameters (laser power, scanning speed, layer thickness, and hatching space) with the density of a printed material.
This study was conducted in three phases: first, the analytical model of a thermal field generated by a moving heat source in a solid body is used to evaluate the melt pool dimensions for a given set of LPBF processing parameters. Then, a relationship between the melt pool dimensions and the density of the printed material was found experimentally for a given material and LPBF system. Finally, using the numerical model developed and the experimental relationship found, the LPBF processing parameters were linked to the density of the manufactured parts with the objective of developing a porosity prediction algorithm for different materials and different LPBF systems.
2.1. Melt Pool Calculations
First, calculations of the LPBF melt pool dimensions were carried out using the analytical model of a semi-infinite solid with a moving Gaussian heat source [
19]. This model has been successfully used for the determination of the LPBF processing parameters for pure iron [
18] and Ti-Zr-Nb alloy [
20]. The Gaussian model involves a symmetrical distribution of laser irradiance across the beam. The energy from the laser is assumed to be applied on the powder bed surface for a time interval defined by the scanning speed and the laser spot size. In this case, for a Gaussian beam moving with a given velocity, the temperature distribution
T(
x·y·z) in the powder bed is calculated by Equations (1)–(3):
where
T0 is the powder bed temperature (°C);
A, the absorptivity;
P, the laser power (W);
k, the thermal conductivity (W/(m·K));
rf, the laser beam radius (m);
Pe, the Peclet number;
ν, the scanning speed (m/s);
α, the thermal diffusivity (m
2/s);
ρ, the material density (kg/m
3);
cp, the specific heat (J/(kg·K)), and
t, time (s).
The laser energy absorptivity
A is estimated using Equation (4) from the Drude’s theory [
19,
21]:
where
λ is the laser wavelength (μm),
σ0, the electrical conductivity (S/m), and
ρ0, the electrical resistivity of the irradiated material (Ohm·m).
2.2. Experimental Calibration
2.2.1. Materials, Equipment and Plan of Experiment
The experimental part of this study was conducted using the EOS-supplied IN625 powder and an EOSINT M280 LPBF system (EOS GmbH, Munich, Germany) equipped with a 400 W ytterbium fiber laser (beam radius
rf = 50 μm). The initial temperature of the substrate (build platform)
T0 = 60 °C. To design the plan of experiments, the analytical model represented by Equations (1)–(4) was used first. To this end, the following physical properties of an irradiated body: thermal conductivity
k0 [
22], specific heat
Cp0 [
23], and electrical resistivity
ρ0 [
24] need to be calculated, taking into account the effective powder bed density
φ, the latter being the powder morphology and spreading mechanism-dependent:
In this work, the density
ϕ of IN625 powder spread by a standard EOS metal doctor blade and measured using the encapsulated samples method [
25] was found to be close to 60%. Given the preceding, the IN625 alloy properties used for calculations are shown in
Table 1. They were taken at room temperature, and it is considered that the preceding layer cools down to 60 °C between two scanning runs.
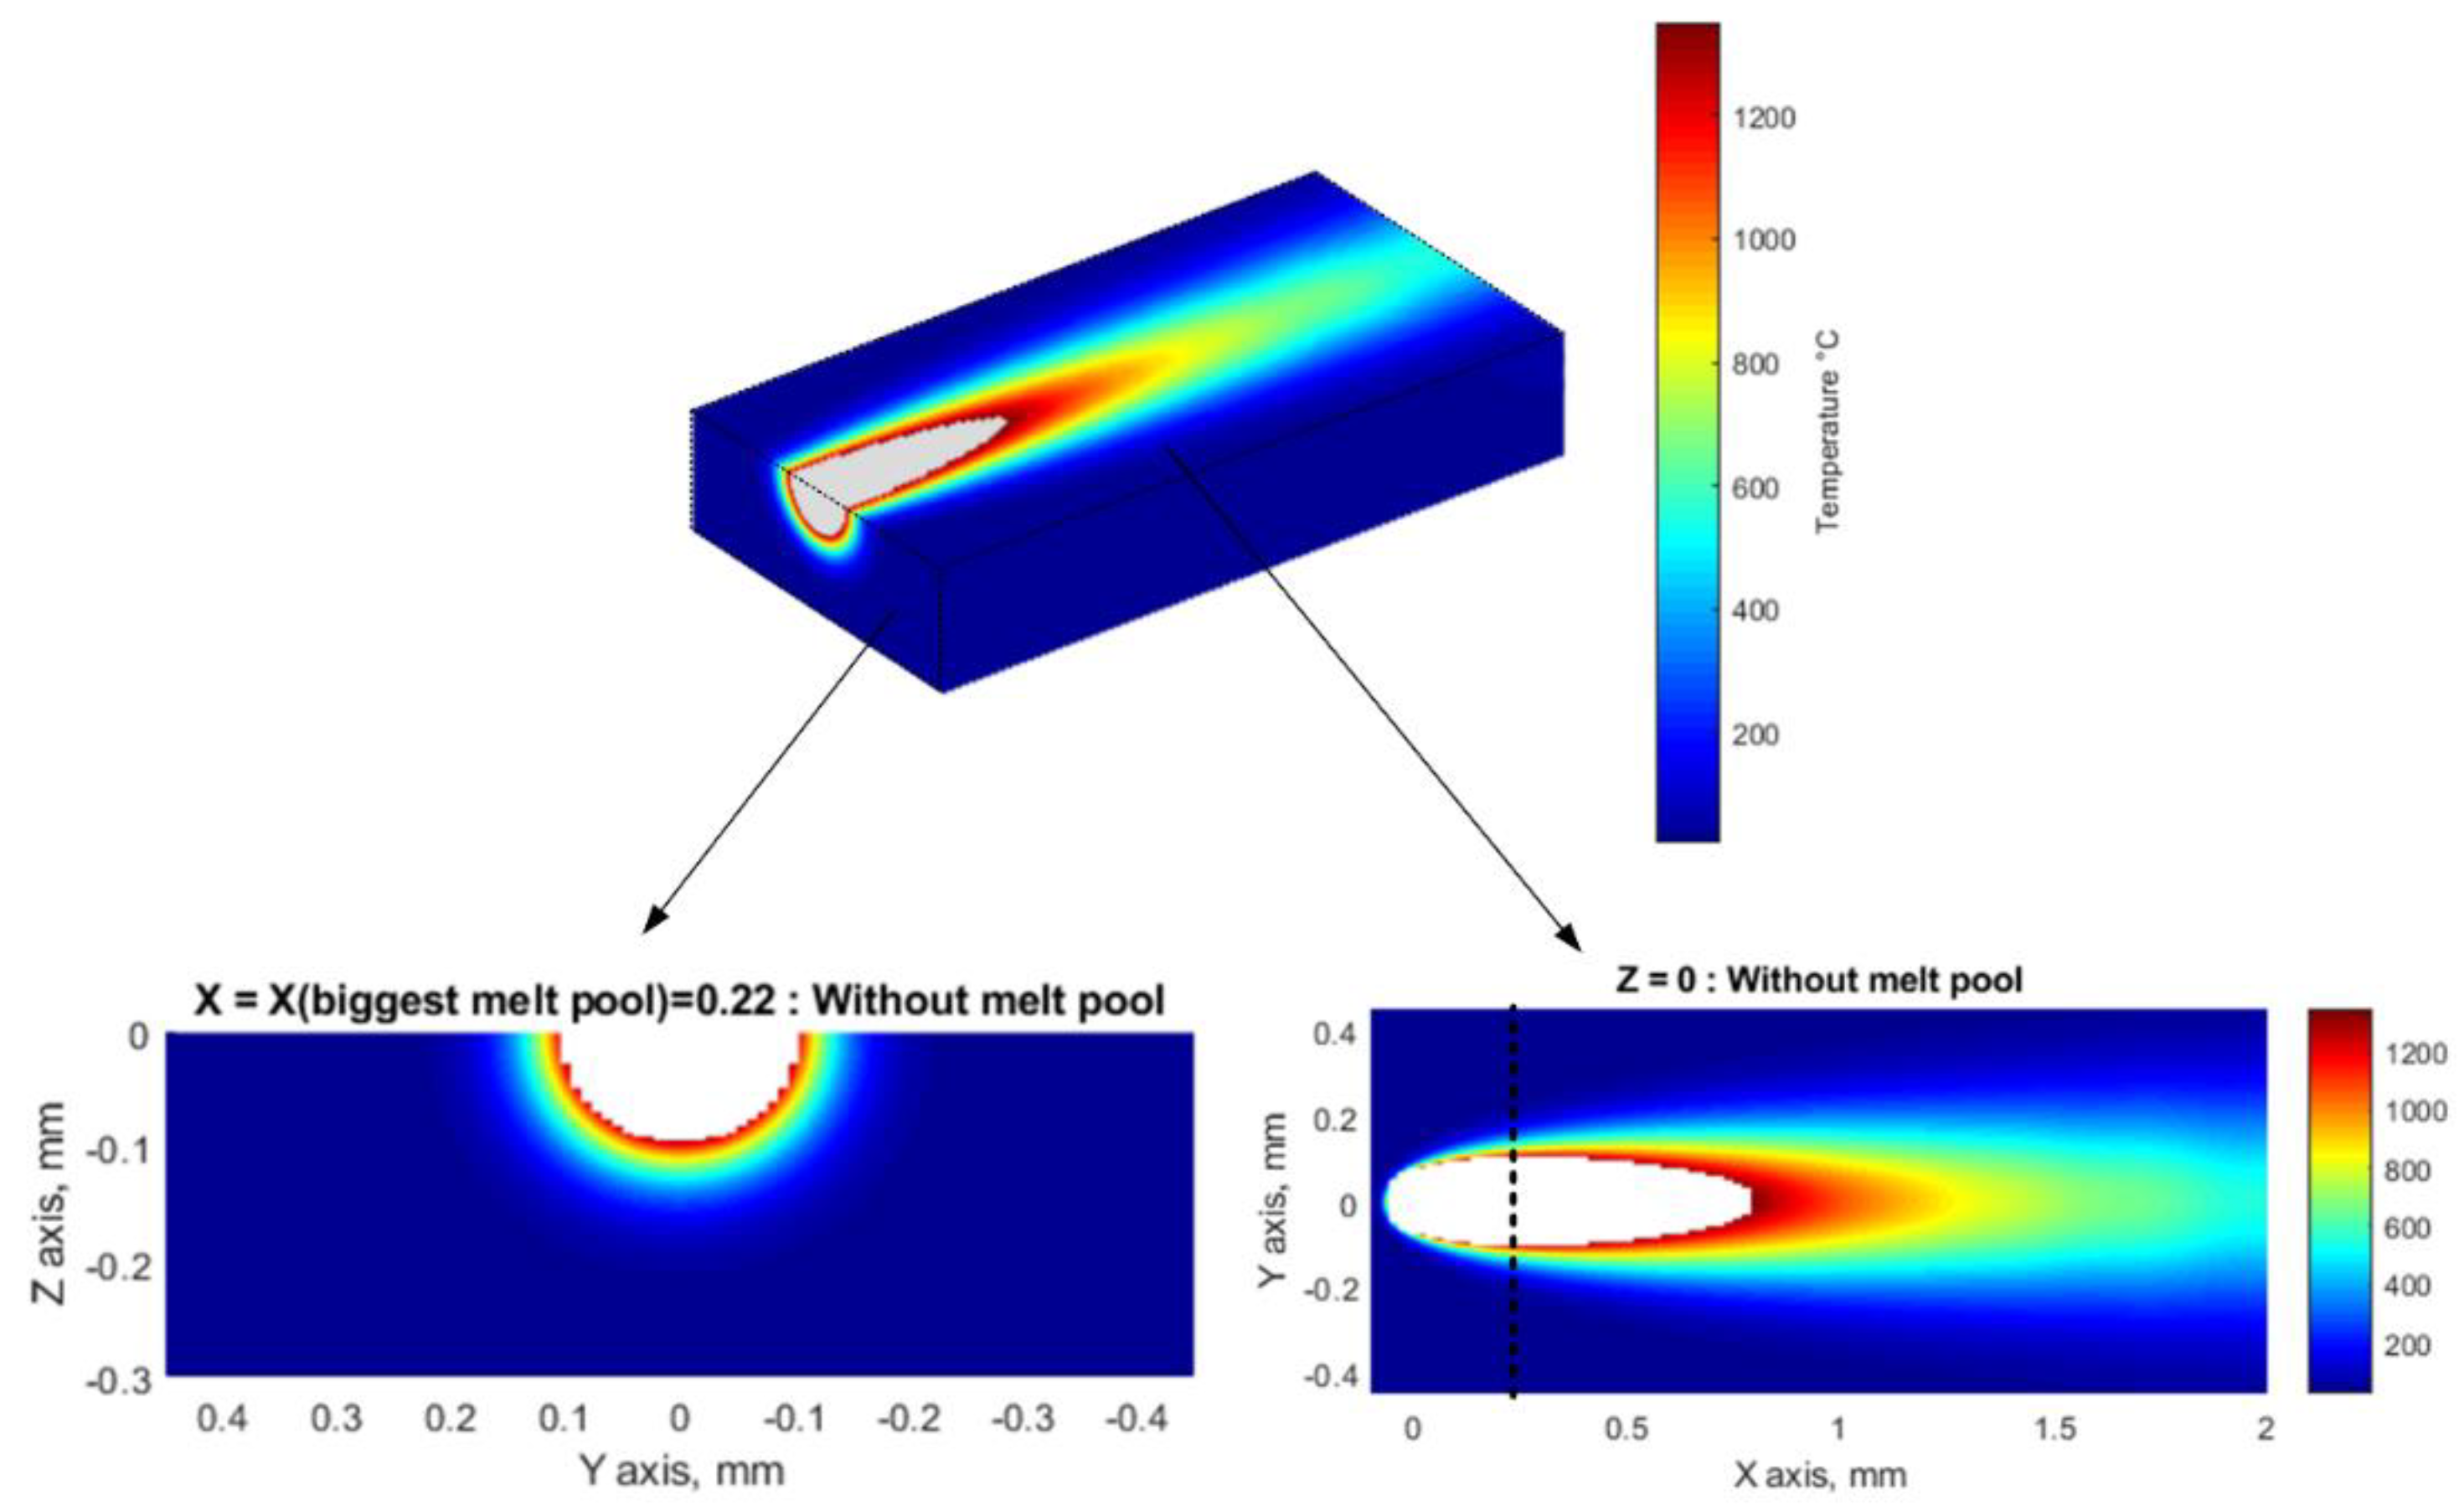
The temperature distribution map shown in
Figure 2 represents an example of calculations using Equations (1)–(5). It corresponds to the following set of LPBF processing parameters:
P = 270 W,
v = 1000 mm/s, and
t = 40 μm applied to IN625 powder (
Table 1). From this temperature map, the melt pool width, depth and length are delimited by the alloy melting temperature of 1350 °C:
W = 173 μm,
D = 89 μm, and
L = 806 μm, which correspond to the following dimensionless metrics:
D/t = 2.2 and
L/W = 4.7 (since only a single track is modeled, the hatching space
h is not considered at this stage). This calculation procedure can be repeated for any material and any given set of processing parameters.
2.2.2. Melt Pool Dimensions-Density Relationship
To establish the relationship between the previously defined dimensionless melt pool metrics and the density of manufactured parts, 10 mm-diameter 15 mm-height cylindrical coupons of IN625 alloy were printed to cover a
D/t ratio ranging from 1 to 3.5,
W/h, from 0.5 to 3 and
L/W, from 3 to 6. To find the LPBF parameters resulting in these melt pool dimensions, the following ranges of printing parameters were reversely computed using the melt pool model presented in
Section 2.1: the laser power varying from 160 to 350 W, the scanning speed, from 560 to 2800 mm/s, and the hatching space, from 30 to 550 µm; the layer thickness t was kept constant at 40 μm (see
Table 2 for the selected values of the LPBF processing parameters). Two specimens were printed for each set of printing parameters.
After processing, the printed coupons were cut off the build plate and their densities measured using the Archimedes’ technique (ASTM B962-15). Each density measurement using a SARTORIUS Secura 324-1s scale (Sartorius, Goettingen, Germany), having a precision of ~0.001 g, was repeated at least 3 times.
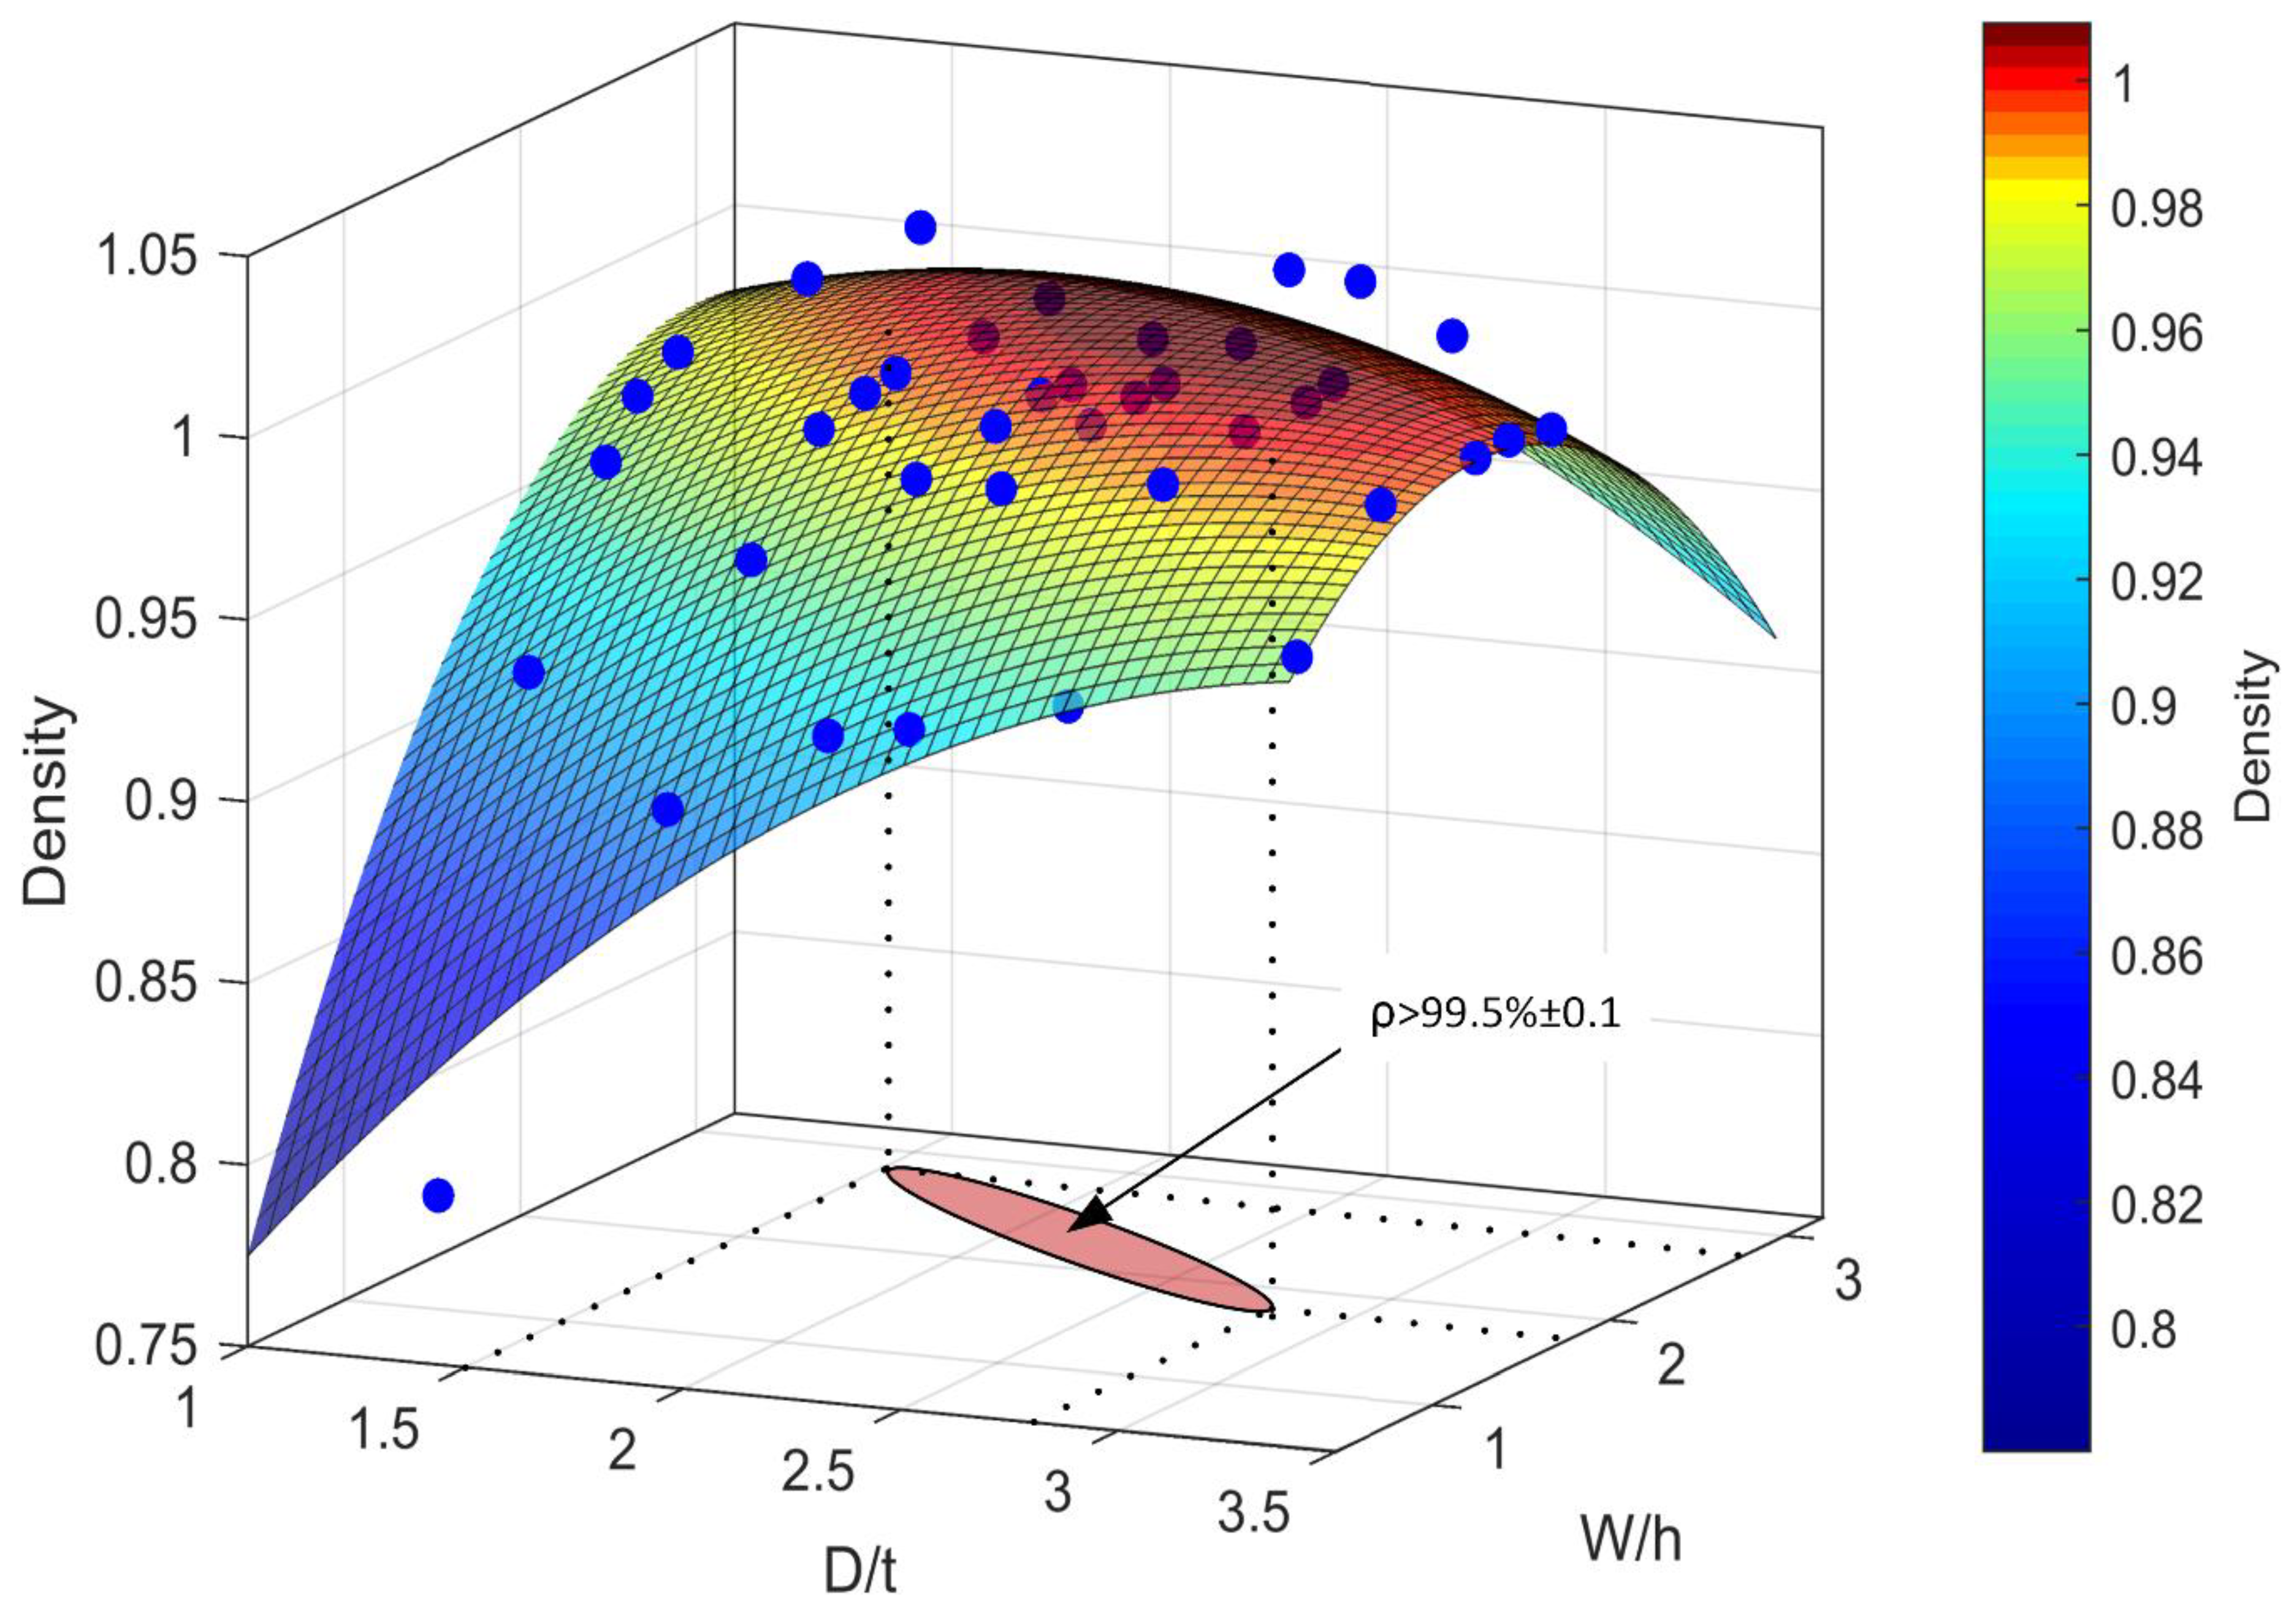
The results of this experiment are collected in
Table 3 (
Appendix A) and plotted in
Figure 3 in the
D/t-
W/h-density coordinates. It can be seen from this figure that the density of IN625 coupons exceeding 99.5% (this value was selected arbitrarily to limit the amount of experimental data, while leaving enough space for optimization) was obtained for a
D/t ratio ranging from 1.5 to 2.75 and a
W/h ratio ranging from 1.8 to 2.8. The corresponding
L/W ratio ranged from 3.8 to 4.6 (not shown on this diagram). Note that the calculated values fall close to the ranges recommended in the literature, which are 1.5 <
D/t < 2, 1.5 <
W/h < 2.5 and
L/W < 2Pi [
28].
From
Figure 3, assuming that the calculated
D/t,
W/h ratios correspond to the effectively obtained melt pool dimensions, the materials density can be expressed as their function as follows:
where
a0 = 0.512,
a1 = 0.212,
a2 = 0.225,
a3 = −0.027,
a4 = −0.384, and
a5 = −0.031.
2.3. Energy Density-Build Rate Processing Map
In this work, the LPBF processing conditions were expressed by a combination of two metrics: the volumetric laser energy density
E (J/mm
3) (7) and the material build rate
BR (cm
3/h) (8); the product of both corresponds to the laser power
P (Watts).
Next, the analytical model (1–5) and
Table 1 were used to map three
E–BR areas corresponding to the experimentally obtained optimal ranges of the melt pool metrics (
Figure 4a):
D/t = 1.5–2.75,
W/h = 1.8–2.8, and
L/W = 3.8–4.6. These maps are calculated by varying the laser power from 20 to 380 W; the scanning speed, from 100 to 4000 mm/s; the hatching space, from 30 to 200 μm, and the layer thickness, from 20 to 80 μm.
Three
E–BR areas of
Figure 4a were then superposed in
Figure 4b to schematically delimit a common processing window, which must guarantee the maximum density of printed IN625 parts. Next, the densities of the printed coupons (
Figure 3 and
Table 1 in the Annex) were superposed on this processing window, and it can be seen that the coupons with a density ≥99.5% are indeed located, within a certain margin of error, in the numerically predicted optimal processing window. By refining the scanning steps and using calibration Equation (6), the described approach can then be used to build a more detailed processing map for IN625 powder (
Figure 4c).
2.4. Validation Strategy for the Proposed Processing Optimization Approach
We hypothesize that such a combined processing optimization approach is valid for any material processed by a given LPBF system. In our case it is the EOS M280 LPBF system. To verify this hypothesis, the results of such an optimization were compared with the numerical and experimental data found in the literature. This comparison was carried out in two phases: first, the melt pool dimensions were calculated for AlSi10Mg and 316L powders using a simplified analytical model of this work (Equations (1)–(5)), and then compared against those obtained for the same feedstock material, but using more powerful finite element models (FEM). These FEM models take into account the optical penetration depth, the mass transfer-related phenomena, such as the Marangoni convection and the Rayleigh capillary flow, and the heat losses to the environment [
11,
29]. Secondly, the numerically predicted densities for pure iron and Ti-6Al-4V alloy powders are compared with their experimentally measured equivalents from [
6] and [
18]. The optimal processing windows for all these validation studies were obtained using the algorithm previously presented. The data used for these calculations were taken from the corresponding literature sources.
3. Validation
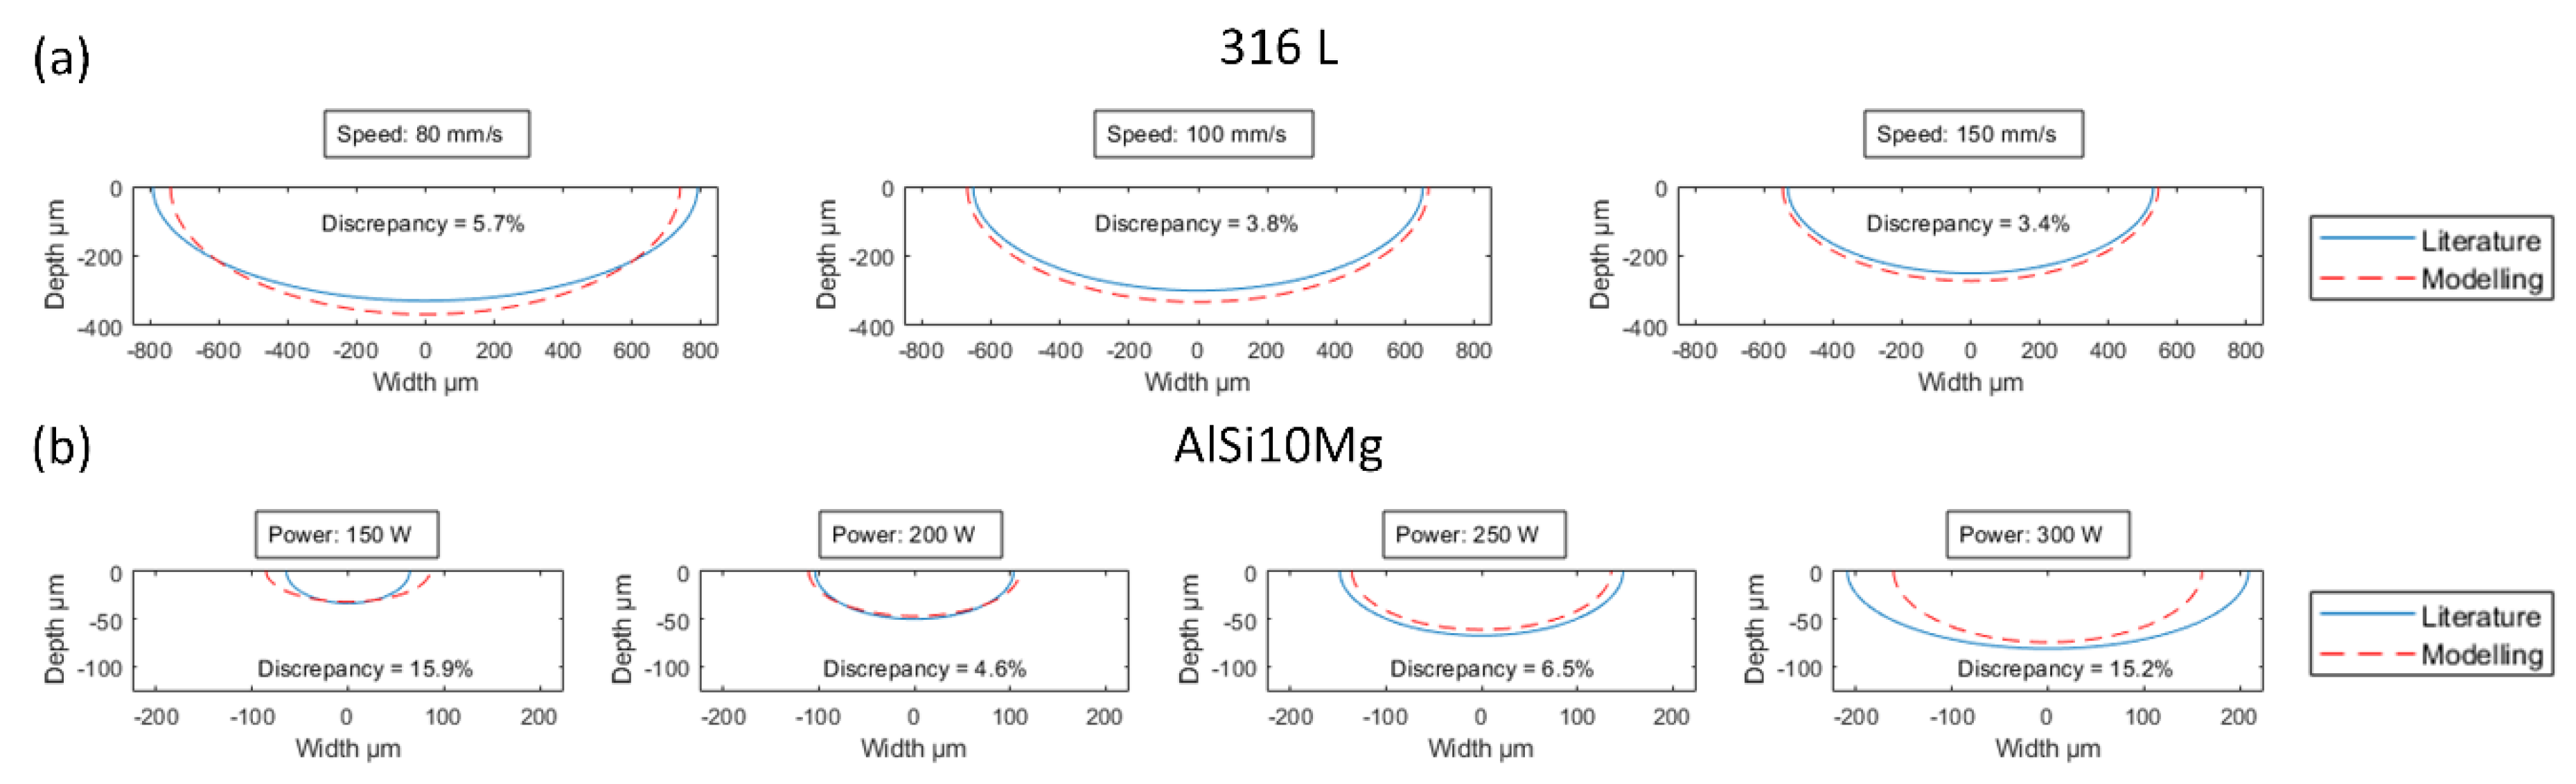
3.1. Melt Pool Dimensions (Single Track)
As experimental validation of the melt pool model used in this study (Equations (1)–(5)) has already been carried out in our previous work [
20], a decision was made to extend the validation experiments to literature data. With this objective in mind, the single track melt pool dimensions calculated by the said analytical model were compared with those calculated by two different finite element models. Note that each of these models was experimentally validated by their authors for two different alloys: 316L [
11] and AlSi10Mg [
14]. For ease of understanding and because the width and the depth of the melt pool are the most important characteristics impacting the density of the printed material, the geometric validation was limited to these two characteristics.
Regarding 316L, the simulations were carried out with an initial powder bed temperature of 296 K (first track in [
11]), a fixed laser power of 110 W and a scanning speed ranging from 80 to 150 mm/s. For AlSi10Mg, the simulations were realized for a laser power ranging from 150 to 300 W and a fixed scanning speed of 200 mm/s [
14]. In both cases, computations using (Equations (1)–(5)) were carried out using the physical properties taken from the corresponding literature sources (
Table 3). In other words, the electrical resistivity, the thermal conductivity and the specific heat capacity values used in our calculations were set identical to those used in [
11] and [
14] and recalculated for a 60% powder bed density. This last value was selected on the basis of our previous results because no such information was provided in the literature sources.
The melt pool profiles calculated by the model of this study and those found in the literature are plotted in
Figure 5 for different sets of printing parameters. The mean deviations between the results of the analytical and the finite element models are 4.3 ± 1.2% for 316L and 10.5 ± 5.8% for AlSi10Mg. (Note that the numerically estimated impact of a 5.8% deviation in the AlSi10Mg melt pool dimensions would have introduced only ~0.2% variation in the predicted density values; the last number being calculated by introducing a value of 5.8% in the density Equation (6)).
3.2. Density of the Same Alloy Printed with Two Different Layer Thicknesses
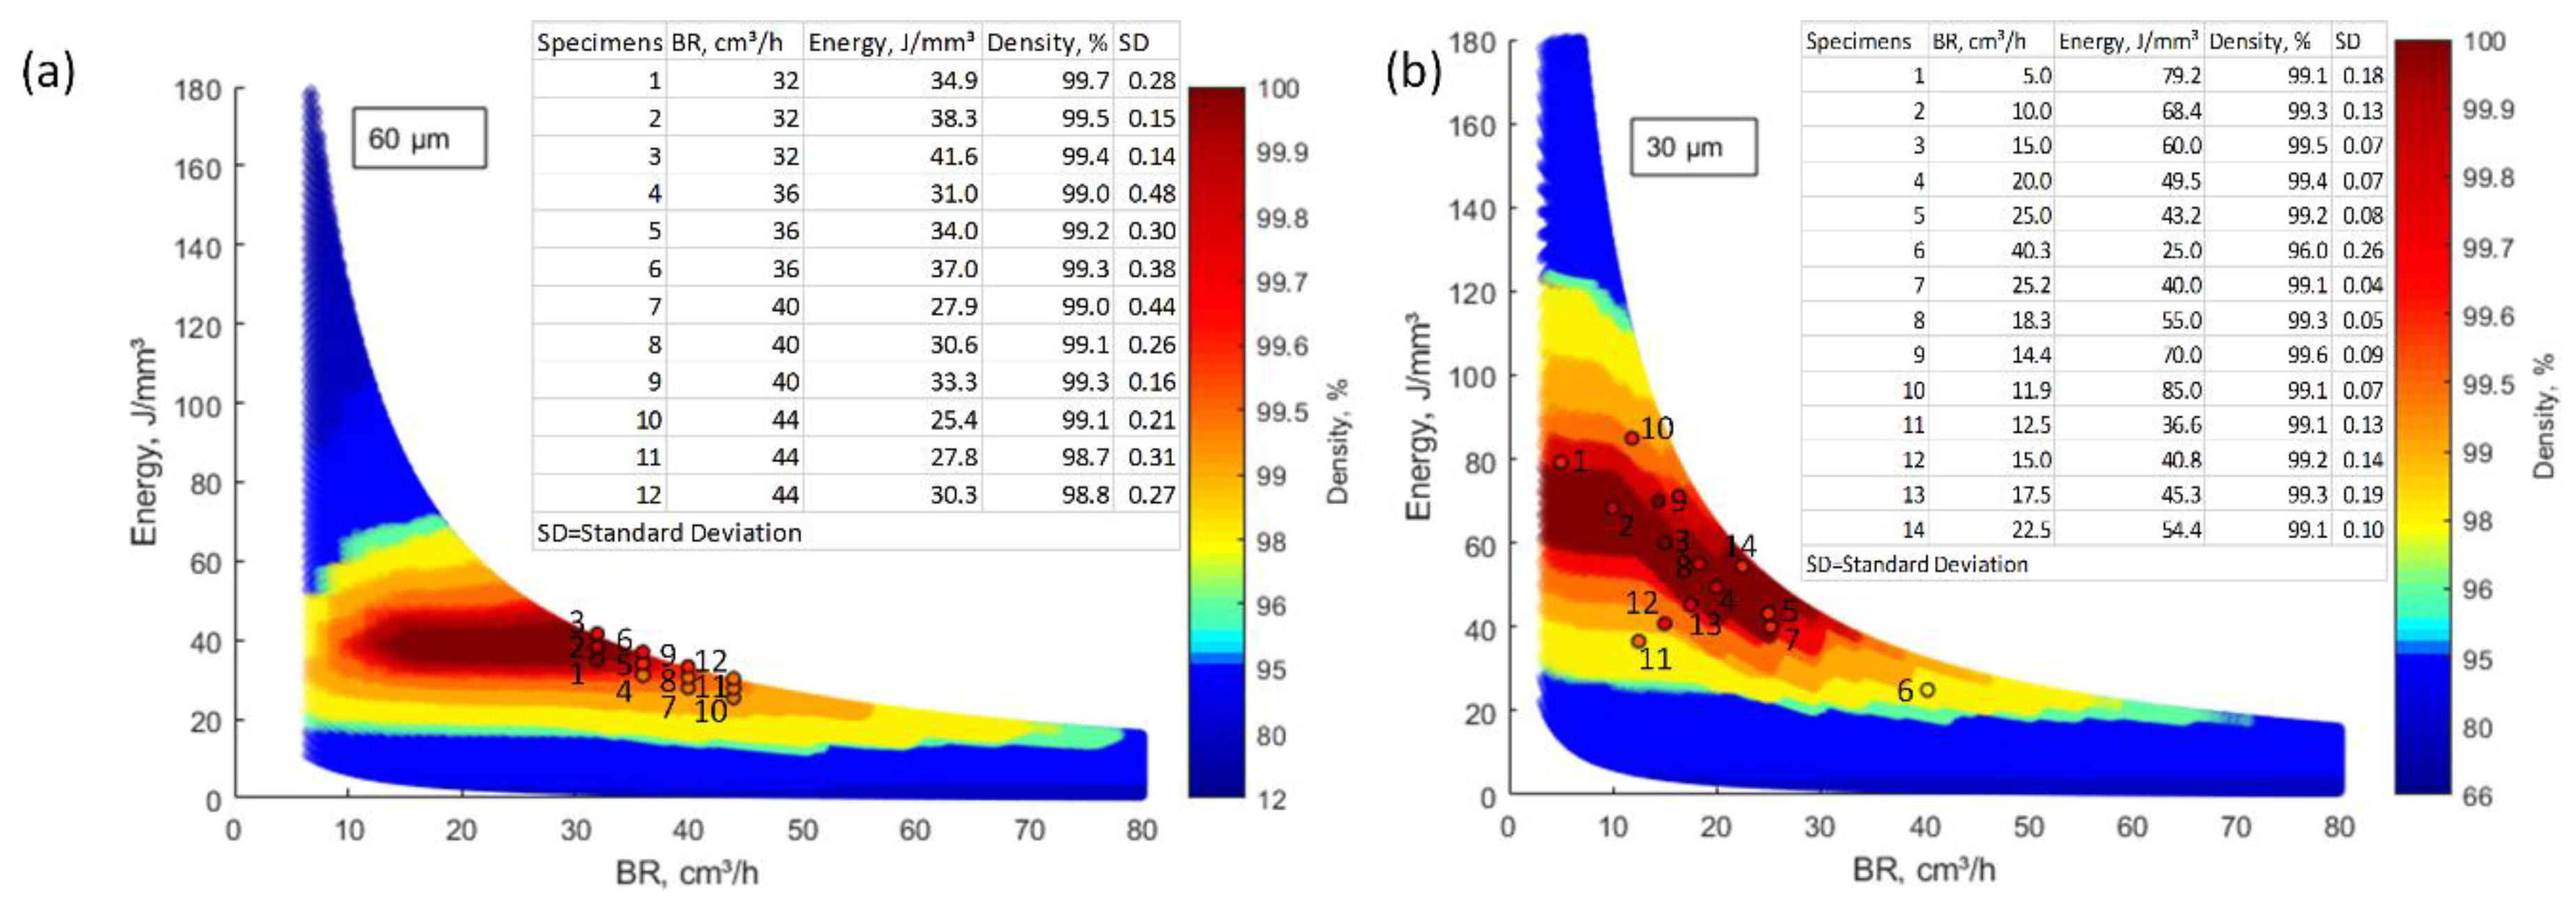
Using a combination of the analytical modeling of melt pool dimensions (Equations (1)–(5)) and Equation (6), representing the correspondence between the melt pool dimensions and the density of the printed parts, processing windows can be calculated for multi-track LPBF. To validate this approach, processing maps for Ti64 alloy printed with two layer thicknesses (30 and 60 um) are plotted in
Figure 6. The physical properties used for these calculations are collected in
Table 4.
Note that the powder bed densities (evaluated using the method of encapsulated samples [
25]) in these two cases are not identical: it is higher in the former than in the latter case, with φ = 70% for
t = 30 μm and φ = 60% for
t = 60 μm. These changes in the powder bed density are due to the differences in the powder spreading conditions for different layer thicknesses as demonstrated in [
31]. If a layer thickness is smaller than the D90 value of the powder particle distribution [
32], the density increases because the biggest particles are kept at the top of the layer and finally swept out by the recoater [
33], which increases the powder bed density. It can be seen from
Figure 6 that the higher the powder bed density (70%,
Figure 6b, instead of 60%,
Figure 6a), the higher the optimal laser power density, while the lower the build rate of the process. Similar results were reported in [
31].
The experimentally measured densities of Ti64 coupons printed with the layer thicknesses of
t = 60 μm (
Figure 6a) and 30 μm (
Figure 6b) were then superposed on the calculated processing maps (these coupons were printed using EOS Ti64 powder and the EOS M280 system of this study). The mean porosity deviations for
t = 60 μm corresponded to 0.8%, while for
t = 30 μm, it was 0.4%.
3.3. Density of Two Different Alloys
The reliability of the proposed processing optimization approach was then studied for Fe [
18] and AlSi10Mg [
35] powders. The density predictions were made using the physical properties of
Table 5 and the processing maps are plotted in
Figure 7a,b. The experimentally measured density values were superposed, and the deviations between the model and the experiment corresponded to 0.8% for Fe and 0.7% for AlSi10Mg powders.
4. Discussion and Application Example
Notwithstanding that the simplified analytical model used in this study does not take into account the specificities of a given printing system in terms of heat exchange and powder spreading conditions, which both influence the density of the manufactured parts, it was demonstrated that such a model could provide useful information in terms of the energy density and the build rate values, which are potentially suitable for the printing of dense parts. However, to determine the exact set of processing parameters, such as the laser power, speed, hatching space, and layer thickness, an additional condition must be respected, and this condition corresponds to the ratio between the hatching space and the layer thickness, h/t.
To establish such a condition, the previously developed model was used to plot the density of IN625 components as a function of the
h/t ratio for different layer thicknesses (
Figure 8a). From this plot, it is clear that to maximize the material density, the selection of a hatching space must be related to the selection of a layer thickness (
Figure 8b). For example, to guarantee the maximum material density ≥99.8%, with a layer thickness of
t = 30 μm, the hatching space variations must be limited to the 50 to 80 μm range, while for a layer thickness of
t = 90 μm, the hatching space variations must be limited to the 110 to 220 μm range.
These results are shown in
Figure 8b to present the
h-t area corresponding to the maximum density of IN625 parts. In the same figure, corresponding
h-t areas are plotted for AlSi10Mg (
Table 3) and Ti64 (
Table 4) alloys, for comparison. Finally, once obtained, such plots provide guidance for the selection of the most appropriate hatching space/layer thickness combinations.
Note that even though this combined modeling-experiment approach was validated for only one specific LPBF system (EOS M 280), we hypothesize that it can be extended to any LPBF system, provided an adequate calibration experiment is carried out. To this end, after generating the first processing map assuming the physical properties of the material taken from the literature and a powder bed density of 60%, a series of calibration coupons must be printed. Once the density of the printed coupons is measured, the model must be adjusted to fit the experimentally obtained values, by modifying the coefficients of Equation 6. Finally, the relation between the hatching space and the layer thickness can be plotted for a maximum printed material density (see
Figure 8b). Once all these conditions are met, the LPBF processing parameters (laser powder, scanning speed, hatching space and layer thickness) can be determined using the following protocol:
The layer thickness is selected first to provide a required precision/performance relationship (
Figure 9a). If we take
t = 40 μm to favor precision, the processing map for this layer thickness can be built as shown in
Figure 9c.
As, in this case,
h can vary from 50 to 110 μm (
Figure 9b), the highest hatch value of 110 μm can be specified to improve the process productivity.
To print components with a material density ≥99.8% and a maximum allowable build rate of
BR = 15 cm
3/h (
Figure 9), the corresponding volumetric laser energy density corresponds to
E = 67 J/mm
3 (see the dot in
Figure 9c). Since
t = 40 μm and
h = 110 μm, the remaining LPBF parameters can easily be defined using the energy density and build rate definitions of Equations (7) and (8): laser power ~285 W and scanning speed ~960 mm/s [
36].
As it is widely assumed that the smaller the layer thickness, the better the surface finish and part precision, but the lower the build rate, it is recommended to work with layer thicknesses of 30 or 40 µm when precision is required, and of 50 or 60 μm, when process productivity is more important.
5. Conclusions
A simplified analytical model of the LPBF process was used to develop the density prediction algorithm for a given powder feedstock and a given LPBF system. Using a set of density calibration coupons built with the laser power varying from 160 to 350 W; the scanning speed, from 500 to 2800 mm/s; the hatching space, from 30 to 550 µm, and the layer thickness, from 30 to 60 µm, this model was adapted for the IN625 alloy powder and an M280 EOS LPBF system. This approach was then validated for different alloys and processing conditions using literature data, thus demonstrating its potential for the LPBF process optimization. It was also shown that the layer thickness value has a direct influence on the creation of the processing map and must be taken into account during the calibration step. This step represents a must-follow requirement to improve the prediction capability of the model because it takes into account the specificities of a given LPBF system related to particular powder recoating and heat transfer conditions, which differ from one printer to another, and influence the final density of the manufactured parts. However, once calibrated for a selected LPBF system, the model could be used for different alloys processed with this same system, avoiding trial-and-error-based process optimization routines.
To further this work, a comprehensive study should be conducted to evaluate the influence of parts’ geometry, size, orientation and support on the density predictions.
Author Contributions
The work plan was developed by M.L. to meet the study objectives defined by himself and V.B. The specimen design and the alloy selection were carried out by all the coauthors based upon the state of the art, previous research of V.B., and the current trends in the field. The design, fabrication and testing of the specimens were performed by M.L., V.B. contributed to the data organization, results interpretation and manuscript redaction.
Funding
This research received no external funding.
Acknowledgments
The authors would like to express their appreciation for the financial support provided by NSERC (Natural Sciences and Engineering Research Council of Canada) and for the technical support provided by M. Samoilenko.
Conflicts of Interest
The authors declare no conflict of interest.
Appendix A
Table A1.
Printing parameters, melt pool geometry and density of IN625 test coupons (M280 EOS).
Table A1.
Printing parameters, melt pool geometry and density of IN625 test coupons (M280 EOS).
| Spec. | Power, W | Speed, m/s | Hatching space, mm | Energy density, J/mm3 | Build rate, cm3/h | Mel pool geometry | Density, % | SD ±% |
|---|
| D/t | W/h | L/W |
|---|
| 1 | 160 | 2.8 | 0.092 | 15.6 | 37.0 | 1 | 1 | 5.7 | 78.3 | 0.7 |
| 2 | 160 | 2.8 | 0.061 | 23.3 | 24.7 | 1 | 1.5 | 5.7 | 87.6 | 0.2 |
| 3 | 160 | 2.8 | 0.052 | 27.4 | 21.0 | 1 | 1.76 | 5.7 | 91.6 | 0.3 |
| 4 | 160 | 2.8 | 0.046 | 31.1 | 18.5 | 1 | 2 | 5.7 | 95.6 | 0.1 |
| 5 | 160 | 2.8 | 0.037 | 38.9 | 14.8 | 1 | 2.5 | 5.7 | 95.6 | 0.1 |
| 6 | 160 | 2.8 | 0.031 | 46.7 | 12.3 | 1 | 3 | 5.7 | 97.7 | 0.1 |
| 7 | 225 | 1.94 | 0.265 | 10.9 | 74.1 | 1.5 | 0.5 | 5.7 | 79.03 | 1.1 |
| 8 | 225 | 1.94 | 0.133 | 21.9 | 37.1 | 1.5 | 1 | 5.7 | 92.5 | 0.2 |
| 9 | 225 | 1.94 | 0.088 | 32.8 | 24.7 | 1.5 | 1.5 | 5.7 | 97.3 | 0.1 |
| 10 | 225 | 1.94 | 0.075 | 38.5 | 21.1 | 1.5 | 1.76 | 5.7 | 98.7 | 0.1 |
| 11 | 225 | 1.94 | 0.066 | 43.7 | 18.5 | 1.5 | 2 | 5.7 | 99.5 | 0.1 |
| 12 | 225 | 1.94 | 0.053 | 54.6 | 14.8 | 1.5 | 2.5 | 5.7 | 99.6 | <0.1 |
| 13 | 225 | 1.94 | 0.044 | 65.6 | 12.4 | 1.5 | 3 | 5.7 | 99.6 | <0.1 |
| 14 | 350 | 1.68 | 0.347 | 15.0 | 83.9 | 2 | 0.5 | 5.4 | 85.0 | 0.3 |
| 15 | 350 | 1.68 | 0.173 | 30.0 | 42.0 | 2 | 1 | 5.4 | 96.4 | 0.1 |
| 16 | 350 | 1.68 | 0.116 | 45.0 | 28.0 | 2 | 1.5 | 5.4 | 99.1 | <0.1 |
| 17 | 350 | 1.68 | 0.099 | 52.8 | 23.8 | 2 | 1.76 | 5.4 | 99.4 | <0.1 |
| 18 | 350 | 1.68 | 0.087 | 60.0 | 21.0 | 2 | 2 | 5.4 | 99.6 | <0.1 |
| 19 | 350 | 1.68 | 0.069 | 75.1 | 16.8 | 2 | 2.5 | 5.4 | 99.4 | 0.1 |
| 20 | 350 | 1.68 | 0.058 | 90.1 | 14.0 | 2 | 3 | 5.4 | 99.6 | 0.1 |
| 21 | 350 | 1.18 | 0.388 | 19.1 | 65.9 | 2.45 | 0.5 | 5.0 | 93.0 | 0.6 |
| 22 | 350 | 1.18 | 0.194 | 38.2 | 32.9 | 2.45 | 1 | 5.0 | 98.9 | 0.1 |
| 23 | 350 | 1.18 | 0.129 | 57.4 | 22.0 | 2.45 | 1.5 | 5.0 | 99.3 | <0.1 |
| 24 | 350 | 1.18 | 0.110 | 67.3 | 18.7 | 2.45 | 1.76 | 5.0 | 99.5 | 0.1 |
| 25 | 350 | 1.18 | 0.097 | 76.5 | 16.5 | 2.45 | 2 | 5.0 | 99.4 | 0.1 |
| 26 | 350 | 1.18 | 0.078 | 95.6 | 13.2 | 2.45 | 2.5 | 5.0 | 99.6 | 0.1 |
| 27 | 350 | 1.18 | 0.065 | 114.7 | 11.0 | 2.45 | 3 | 5.0 | 99.7 | 0.2 |
| 28 | 345 | 1.06 | 0.429 | 19.0 | 65.4 | 2.5 | 0.5 | 4.5 | 93.3 | 0.1 |
| 29 | 345 | 1.06 | 0.214 | 38.0 | 32.7 | 2.5 | 1 | 4.5 | 98.7 | 0.2 |
| 30 | 345 | 1.06 | 0.143 | 57.0 | 21.8 | 2.5 | 1.5 | 4.5 | 99.3 | 0.2 |
| 31 | 345 | 1.06 | 0.122 | 66.8 | 18.6 | 2.5 | 1.76 | 4.5 | 99.4 | 0.1 |
| 32 | 345 | 1.06 | 0.107 | 75.9 | 16.4 | 2.5 | 2 | 4.5 | 99.4 | <0.1 |
| 33 | 345 | 1.06 | 0.086 | 94.9 | 13.1 | 2.5 | 2.5 | 4.5 | 99.5 | <0.1 |
| 34 | 345 | 1.06 | 0.071 | 113.9 | 10.9 | 2.5 | 3 | 4.5 | 99.7 | 0.1 |
| 35 | 350 | 0.8 | 0.469 | 23.3 | 54.1 | 3 | 0.5 | 3.9 | 94.3 | 0.1 |
| 36 | 350 | 0.8 | 0.235 | 46.6 | 27.0 | 3 | 1 | 3.9 | 99.1 | 0.1 |
| 37 | 350 | 0.8 | 0.156 | 69.9 | 18.0 | 3 | 1.5 | 3.9 | 99.5 | <0.1 |
| 38 | 350 | 0.8 | 0.133 | 82.0 | 15.4 | 3 | 1.76 | 3.9 | 99.5 | 0.1 |
| 39 | 350 | 0.8 | 0.117 | 93.2 | 13.5 | 3 | 2 | 3.9 | 99.7 | 0.1 |
| 40 | 350 | 0.8 | 0.094 | 116.5 | 10.8 | 3 | 2.5 | 3.9 | 99.4 | 0.1 |
| 41 | 340 | 0.56 | 0.551 | 27.5 | 44.4 | 3.5 | 0.5 | 3.4 | 96.3 | 0.1 |
| 42 | 340 | 0.56 | 0.276 | 55.1 | 22.2 | 3.5 | 1 | 3.4 | 99.4 | 0.1 |
| 43 | 340 | 0.56 | 0.184 | 82.6 | 14.8 | 3.5 | 1.5 | 3.4 | 99.4 | 0.2 |
| 44 | 340 | 0.56 | 0.157 | 97.0 | 12.6 | 3.5 | 1.76 | 3.4 | 99.5 | 0.1 |
| 45 | 340 | 0.56 | 0.138 | 110.2 | 11.1 | 3.5 | 2 | 3.4 | 99.2 | 0.2 |
References
- Huang, Y.; Leu, M.C.; Mazumder, J.; Donmez, A. Additive manufacturing: Current state, future potential, gaps and needs, and recommendations. J. Manuf. Sci. Eng. 2015, 137, 014001. [Google Scholar] [CrossRef]
- Brandt, M. Laser Additive Manufacturing: Materials, Design, Technologies, and Applications; Woodhead Publishing: Cambridge, UK, 2016. [Google Scholar]
- Kasperovich, G.; Haubrich, J.; Gussone, J.; Requena, G. Correlation between porosity and processing parameters in TiAl6V4 produced by selective laser melting. Mater. Des. 2016, 105, 160–170. [Google Scholar] [CrossRef]
- Delgado, J.; Ciurana, J.; Rodríguez, C.A. Influence of process parameters on part quality and mechanical properties for DMLS and SLM with iron-based materials. Int. J. Adv. Manuf. Technol. 2012, 60, 601–610. [Google Scholar] [CrossRef]
- Kurzynowski, T.; Chlebus, E.; Kuźnicka, B.; Reiner, J. Parameters in Selective Laser Melting for processing metallic powders. In Proceedings of the High Power Laser Materials Processing: Lasers, Beam Delivery, Diagnostics, and Applications, San Francisco, CA, USA, 24–26 January 2012; Volume 8239. [Google Scholar]
- Bartolomeu, F.; Faria, S.; Carvalho, O.; Pinto, E.; Alves, N.; Silva, F.S.; Miranda, G. Predictive models for physical and mechanical properties of Ti6Al4V produced by Selective Laser Melting. Mater. Sci. Eng. A 2016, 663, 181–192. [Google Scholar] [CrossRef]
- Ahmed, A.; Wahab, M.S.; Raus, A.A.; Kamarudin, K.; Bakhsh, Q.; Ali, D. Effects of Selective Laser Melting Parameters on Relative Density of AlSi10Mg. Int. J. Eng. Technol. 2016, 8, 2552–2557. [Google Scholar] [CrossRef] [Green Version]
- Cherry, J.A.; Davies, H.M.; Mehmood, S.; Lavery, N.P.; Brown, S.G.; Sienz, J. Investigation into the Effect of process parameters on microstructural and physical properties of 316L stainless steel parts by selective laser melting. Int. J. Adv. Manuf. Technol. 2014, 76, 869–879. [Google Scholar] [CrossRef]
- Rashid, R.; Masood, S.H.; Ruan, D.; Palanisamy, S.; Rahman Rashid, R.A.; Elambasseril, J.; Brandt, M. Effect of energy per layer on the anisotropy of selective laser melted AlSi12 aluminium alloy. Addit. Manuf. 2018, 22, 426–439. [Google Scholar] [CrossRef]
- Rashid, R.; Masood, S.H.; Ruan, D.; Palanisamy, S.; Rashid, R.R.; Brandt, M. Effect of scan strategy on density and metallurgical properties of 17-4PH parts printed by Selective Laser Melting (SLM). J. Mater. Process. Technol. 2017, 249, 502–511. [Google Scholar] [CrossRef]
- Foroozmehr, A.; Badrossamay, M.; Foroozmehr, E. Finite element simulation of selective laser melting process considering optical penetration depth of laser in powder bed. Mater. Des. 2016, 89, 255–263. [Google Scholar] [CrossRef]
- Fischer, P.; Karapatis, N.; Romano, V.; Glardon, R.; Weber, H.P. A model for the interaction of near-infrared laser pulses with metal powders in selective laser sintering. Appl. Phys. A 2002, 74, 467–474. [Google Scholar] [CrossRef]
- Fischer, P.; Romano, V.; Weber, H.P.; Karapatis, N.P.; Boillat, E.; Glardon, R. Sintering of commercially pure titanium powder with a Nd: YAG laser source. Acta Mater. 2003, 51, 1651–1662. [Google Scholar] [CrossRef]
- Li, Y.; Gu, D. Parametric analysis of thermal behavior during selective laser melting additive manufacturing of aluminum alloy powder. Mater. Des. 2014, 63, 856–867. [Google Scholar] [CrossRef]
- Zhang, Z.; Huang, Y.; Kasinathan, A.R.; Shahabad, S.I.; Ali, U.; Mahmoodkhani, Y.; Toyserkani, E. 3-Dimensional heat transfer modeling for laser powder-bed fusion additive manufacturing with volumetric heat sources based on varied thermal conductivity and absorptivity. Opt. Laser Technol. 2019, 109, 297–312. [Google Scholar] [CrossRef]
- Yadroitsev, I.; Yadroitsava, I.; Bertrand, P.; Smurov, I. Philippe Bertrand and Igor Smurov, Factor analysis of selective laser melting process parameters and geometrical characteristics of synthesized single tracks. Rapid Prototyp. J. 2012, 18, 201–208. [Google Scholar] [CrossRef]
- Aboulkhair, N.T.; Everitt, N.M.; Ashcroft, I.; Tuck, C. Reducing porosity in AlSi10Mg parts processed by selective laser melting. Addit. Manuf. 2014, 1, 77–86. [Google Scholar] [CrossRef] [Green Version]
- Letenneur, M.; Brailovski, V.; Kreitcberg, A.; Paserin, V.; Bailon-Poujol, I. Laser powder bed fusion of water-atomized iron-based powders: Process optimization. J. Manuf. Mater. Process. 2017, 1, 23. [Google Scholar] [CrossRef]
- Schuöcker, D. Handbook of the Eurolaser Academy; Springer Science & Business Media: Vienna, Austria, 1998; Volume 2. [Google Scholar]
- Kreitcberg, A.; Brailovski, V.; Prokoshkin, S. New biocompatible near-beta Ti-Zr-Nb alloy processed by laser powder bed fusion: Process optimization. J. Mater. Process. Technol. 2018, 252, 821–829. [Google Scholar] [CrossRef]
- Hagen, E.; Rubens, H. Über Beziehungen des Reflexions-und Emissionsvermögens der Metalle zu ihrem elektrischen Leitvermögen. Ann. Phys. 1903, 316, 873–901. [Google Scholar] [CrossRef]
- Bala, K.; Pradhan, P.R.; Saxena, N.S.; Saksena, M.P. Effective thermal conductivity of copper powders. J. Phys. D Appl. Phys. 1989, 22, 1068. [Google Scholar] [CrossRef]
- Sumirat, I.; Ando, Y.; Shimamura, S. Theoretical consideration of the effect of porosity on thermal conductivity of porous materials. J. Porous Mater. 2006, 13, 439–443. [Google Scholar] [CrossRef]
- Liu, P.; Fu, C.; Li, T. Calculation formula for apparent electrical resistivity of high porosity metal materials. Sci. China Ser. E Technol. Sci. 1999, 42, 294–301. [Google Scholar] [CrossRef]
- Jacob, G.; Donmez, A.; Slotwinski, J.; Moylan, S. Measurement of powder bed density in powder bed fusion additive manufacturing processes. Meas. Sci. Technol. 2016, 27, 115601. [Google Scholar] [CrossRef] [Green Version]
- American Society for Metals. Metals Handbook. 2. Properties and Selection: Nonferrous Alloys and Special-Purpose Materials; American Society for Metals: Materials Park, OH, USA, 1990. [Google Scholar]
- Davis, J.R. ASM Specialty Handbook: Heat-Resistant Materials; ASM International: Materials Park, OH, USA, 1997. [Google Scholar]
- Gunenthiram, V.; Peyre, P.; Schneider, M.; Dal, M.; Coste, F.; Fabbro, R. Analysis of laser-melt pool-powder bed interaction during the selective laser melting of a stainless steel. J. Laser Appl. 2017, 29, 022303. [Google Scholar] [CrossRef]
- King, W.E.; Anderson, A.T.; Ferencz, R.M.; Hodge, N.E.; Kamath, C.; Khairallah, S.A.; Rubenchik, A.M. Laser powder bed fusion additive manufacturing of metals; physics, computational, and materials challenges. Appl. Phys. Rev. 2015, 2, 041304. [Google Scholar] [CrossRef] [Green Version]
- Silbernagel, C.; Ashcroft, I.; Dickens, P.; Galea, M. Electrical resistivity of additively manufactured AlSi10Mg for use in electric motors. Addit. Manuf. 2018, 21, 395–403. [Google Scholar] [CrossRef]
- Abd-Elghany, K.; Bourell, D. Property evaluation of 304L stainless steel fabricated by selective laser melting. Rapid Prototyp. J. 2012, 18, 420–428. [Google Scholar] [CrossRef]
- Spierings, A.B.; Levy, G. Comparison of density of stainless steel 316L parts produced with selective laser melting using different powder grades. In Proceedings of the Annual International Solid Freeform Fabrication Symposium, Austin, TX, USA, 3–5 August 2009. [Google Scholar]
- Jacob, G.; Brown, C.U.; Donmez, M.A. The Influence of Spreading Metal Powders with Different Particle Size Distributions on the Powder Bed Density in Laser-Based Powder Bed Fusion Processes; Advanced Manufacturing Series (NIST AMS) 100-17; National Institute of Standards and Technology (NIST): Gaithersburg, MD, USA, 2018.
- Polmear, I.J. Light Alloys: From Traditional Alloys to Nanocrystals, 4th ed.; Elsevier: Oxford, UK, 2005. [Google Scholar]
- Krishnan, M.; Atzeni, E.; Canali, R.; Calignano, F.; Manfredi, D.; Ambrosio, E.P.; Iuliano, L. On the effect of process parameters on properties of AlSi10Mg parts produced by DMLS. Rapid Prototyp. J. 2014, 20, 449–458. [Google Scholar] [CrossRef]
- Poulin, J.-R.; Letenneur, M.; Terriault, P.; Brailovski, V. Influence of intentionally-induced porosity and post-processing conditions on the mechanical properties of laser powder bed fused inconel 625. In Selected Technical Papers (STP1620), Proceedings of ASTM Symposium on Structural Integrity of Additive Manufactured Parts, Washington, DC, USA, 6–8 November 2018; ASTM International: West Conshohocken, PA, USA, 2018. [Google Scholar]
© 2019 by the authors. Licensee MDPI, Basel, Switzerland. This article is an open access article distributed under the terms and conditions of the Creative Commons Attribution (CC BY) license (http://creativecommons.org/licenses/by/4.0/).


