Thread Quality Control in High-Speed Tapping Cycles


1
TECNALIA, Basque Research and Technology Alliance (BRTA), Parque Científico, Parque Científico y Tecnológico de Gipuzkoa, E20009 Donostia-San Sebastián, Spain
2
Department of Mechanical Engineering, Tecnun-University of Navarre, E20018 Donostia-San Sebastián, Spain
*
Author to whom correspondence should be addressed.
J. Manuf. Mater. Process. 2020, 4(1), 9; https://doi.org/10.3390/jmmp4010009
Submission received: 10 January 2020
/
Revised: 29 January 2020
/
Accepted: 31 January 2020
/
Published: 4 February 2020
(This article belongs to the Special Issue Manufacturing Processes, Intelligent Machines, and Smart Factories IoT in the Ibero-American Scenario)
Abstract
:Thread quality control is becoming a widespread necessity in manufacturing to guarantee the geometry of the resulting screws on the workpiece due to the high industrial costs. Besides, the industrial inspection is manual provoking high rates of manufacturing delays. Therefore, the aim of this paper consists of developing a statistical quality control approach acquiring the data (torque signal) coming from the spindle drive for assessing thread quality using different coatings. The system shows a red light when the tap wear is critical before machining in unacceptable screw threads. Therefore, the application could reduce these high industrial costs because it can work self-governance.
1. Introduction
Knowing that the tapping process is a complex removal operation of internal screw holes, the complexity generated by a critical synchronism between tap rotation and vertical movement and the large contact between tool and workpiece enhancing is critical when sculpting threads in high cutting conditions [1,2]. Therefore, the necessity of screw quality control is made a priority to reduce the high industrial costs and time in the machining of the coupling of mechanical parts through threaded elements.
Thread quality has not been studied in the literature because the gauges guaranteed this quality. However, Mezentsev et al. [3] proposed a thread quality predicting method which estimates some faults like tap-hole axes misalignment and tap runout on the screw height. Currently, there is more investigation analyzing the thread quality. Fernández Landeta et al. [4] studied the correlation between tap wear/thread quality and the process monitoring parameters when threading steel cold forged components with form taps. Elosegui et al. [5] selected the best physical vapor deposition (PVD) coating for the tapping of austempered ductile iron 900 in order to analyze the cutting performance. Gil Del Val et al. [6] studied the relationship between the thread quality and the wear mechanisms when tapping nodular cast iron. Zawada-Tomkiewicz et al. [7] studied the metric screw thread applying the quality management stages approach proposed by Taguchi. They used statistical control charts to control the measured quality features using a method called the closed-loop manufacturing (CLM) system. Freitas et al. [8] verified the thread profile quality based on the ISO metric thread basic profile according to ISO-68-1 and ISO 68-2 when threading carbon fiber reinforced polymer (CFRP) samples. Finally, Monka et al. [9] studied the screw quality when a tap failure happens in machining C45.
Focusing on tapping monitoring systems, Chen et al. [10] proposed a classification approach of three common faults (tap wear level, misalignment between hole and tap axis and under/oversized predrilled holes diameter) based on condition probability functions throughout torque and forces parameters. Then, Liu et al. [11] studied the same faults analyzing the same signals based on neuronal networks. Both investigations used intrusive sensors to register the signals. On the other hand, Li et al. [12] developed a monitoring system based on hall effect external sensors and wavelet decomposition analysis. Moreover, the approach studied a large set of parameters and, therefore, PCA was used to reduce the dimensionality. Finally, the classification stage was neuronal networks. Currently, Liu et al. [13] proposed a diagnosis strategy based on features of torque and forces from an intrusive sensor (Kistler dynamometer) chosen by sequential forward performance. The diagnosis strategy uses an adaptive neuro-fuzzy interface system to classify the same faults described above. The monitoring systems proposed by the bibliography are developed using complex optimization strategies and intrusive sensors. Currently, Bustillo et al. [14] developed some different data-mining techniques for the prediction of form tap wear. Rotation Forest with unpruned Regression Trees was selected to classify this industrial fault.
Torque signal is used widely in tapping measurements to control, monitor and predict the faults (misalignment, tool runouts, breakage, wear, etc.) and the thread quality. Currently, Oezkaya et al. [15] have proposed the development of a geometrical torque prediction method to determine relative torque values for tapping processes with various tapping tools and diameters. The results have been validated with experimental tests. This research focuses on torque as the main signal to control and make the decision in tapping processes. Therefore, this paper selects the torque as the main signal to provide decision-making when the process is out of the tolerance range.
Related to statistical strategies in manufacturing processes, the PCA has been used in the tapping process [12]. However, Lorentz [16] was a pioneer because it was used for optimizing the tap geometry design.
On the other hand, statistical control process (SPC) has been used to improve the quality of the product and avoid faults, which soar the industrial cost. Ming et al. [17,18] proposed to allocate control charts in a multistage process to detect industrial faults. These two studies validated the control charts with different examples: automotive assembly and a hood assembly, respectively. In addition to this, the optimization of inspection requires the methodologies to raise customer satisfaction. Oppermann et al. [19] developed a quality cost model based on SPC in the electronics production of big companies.
This investigation is based on developing and validating a thread quality control system when manufacturing screw profiles at high-speed cutting conditions. Firstly, materials and methods are defined throughout the thread quality, the experimental configuration, torque signal selected and the statistical background. Secondly, the results of measurements, statistical strategies and the thread quality control charts per treatment and coating are illustrated, respectively. Thirdly, the control approach is discussed from an industrial point. Finally, the conclusions are described.
2. Materials and Methods
2.1. Thread Quality
In machining processes, the lack of thread quality is defined manually by the “go/no-go” gauge. Although this manual inspection will be used to assess the thread quality in this investigation work, two threads (acceptable and unacceptable) from Tap 1 are cut by wire electrical discharge machining (WEDM) and then they are polished and are studied in an optical microscope (Leica DC 300) related to verify the current thread quality. The images are post-processed by Leica Image Manage software. Figure 1 illustrates the undersizing of the screw profiles.
As can be seen in Figure 1, the workpiece thread diameter is reduced when the tap has a high level of wear and consequently; the head of the “go” gauge does not go. Therefore, the screw is under-sized. The present investigation strategy wanted to avoid this type of fault on the thread profile to guarantee the thread dimensional quality on industrial components.
2.2. Experimental Layout and Signal
Tapping measurements were carried out on a vertical computer numerical control (CNC) machining center, as it is shown in Figure 2. The cutting conditions were 65 m/min and without coolant. Nine high-speed steel (HSS) straight flutes taps of metric M10 × 1.5 mm were used to develop the control strategy. Besides, they were treated with steam and coated with PVD technology. These selected coatings were TiCN and AlCrN. The coating average thicknesses were 3.4 and 3.5 mm, respectively, according to Oerlikon Blazers’ X-ray fluorescence analysis. Tool manufacturers consider this number of taps as a good representative to develop the control system. The workpiece material was nodular cast iron (GGG50) in 250 × 450 × 20mm plates as can be seen in Figure 2. The chemical composition of GGG50 nodular cast iron is 93.4% Fe, 3.71% C and 2.44% Si, although there are others less than 1% (Mn, P, S, Cu, Mg and Ni). Besides, these plates are from the same batch. Holes of the appropriate diameter are predrilled and consequently, inspected by a micrometer. The tap holder allows a 4 mm axial extension, 0.8 mm axial compression. Finally, all the screw profiles (6H) were inspected by the “go/no-go” gauge.
The control approach is essentially a non-intrusive sensor solution because the internal signal is the torque from the Varispeed-626MTIII CNC machine tool drive of spindle motor as can be noticed in Figure 2. The conversion to obtain the torque is 7.4 N m/V (Yaskawa’s technical information). This calibration of this conversion parameter was calibrated and validated in a previous study [20]. The measurements need a data acquisition system to belong to National Instruments TM, the frequency rate is 1000 Hz and a principal component (PC) as it can be seen in Figure 2.
This torque is proportional to the electrical current signals of the CNC machine tool and is known to be sensitive to the tap wear status or, in other words, to the thread quality. Figure 3 shows the evolution of the torque signal in the threading of an acceptable thread (dark color) and unacceptable thread (light color).
Moreover, Figure 3 illustrates the two stages of a tapping cycle and the seven area features. The first part of the cycle is the cutting stage. The tap sculpts the screw profile from the reference to stop planes (RP and SP, respectively) and four area features can be estimated: A1 (the acceleration torque), A2 (the cutting torque), A3 (the deceleration torque) and A4 (torque to maintain the synchronization between rotational and feed movements). The second one is the reverse stage. In this case, the tap returns from SP to RP and three area features are extracted: A5 (the acceleration torque), A6 (the friction torque) and A7 (the deceleration torque).
These area features are calculated knowing the torque between two integrated points as can be seen in the following equation:
To reduce the dimensionality of the tapping features, a PCA is proposed. Finally, an SPC approach is used to guarantee the thread quality.
2.3. Statistical Control Strategy
2.3.1. Principal Component Analysis
PCA is a statistical technique that groups a set of parameters or original variables in a set of linear and uncorrelated functions called principal components (PCs). Although the number of PCs is equal to original variables, it is easy, however, to find that only a few of them (two or three) can provide a high enough percent (80%–95%) of the evolution of process [21]. This is called a dimensional reduction [21].
Knowing that X is an matrix constituted of the n observations of the p features, in the tapping process, n is the thread number and p is the area features, so p is 7:
where is the standard deviation of the ith column of X and Y (the PCs) and the matrix of linear combinations of the (standardized) data. However, Yi,j are the PCs returning to the initial features:
where i and j are the thread number and the PC number, respectively. Besides, wi,j is the PCA weights.
2.3.2. Statistical Control Process
To control the screw quality, an SPC approach of the tapping process based on PCs is presented and maintained concerning an in-control state of the process [7], and hence the training data consists only of non-defective threads machined while the process was in a state of statistical control [22]. SPC is an anticipatory technique that suggests stopping a process before the production of a defective part. Therefore, the proposed SPC scheme could suggest stopping the tapping process and replace the tap tool before the end of the tool life threshold.
The generalized variance (GV) chart, which monitors the variances of the principal components, was found to be much more effective in this process, and hence it was adopted [22]:
where n is the number of PCs, m is the learning period and is the average vector of PCs for each tap over the training period. The learning period was selected according to the tool manufacturer experience and, therefore, it is calculated when A2 is 1.3 times the average of the first five threads.
The upper control limit UCL is calculated according to the following equation:
where B4 is a bias and is the average of GV values during the learning period [22]. The process is out of control when the GV of the ith thread is greater than the UCL threshold.
2.3.3. Thread Quality Approach
Figure 4 illustrates the screw quality control flowchart developed in LabVIEWTM. The strategy has four modules to control the quality in the operation. The first module is the acquisition of torque signals by the data acquisition (DAQ) system. Moreover, it filters the signal and calculates the area features per thread. Finally, the training period is selected when the A2 value of the current thread (i) is greater than 1.3 times of the A2 average of the five first threads according to the tool manufacturers’ experience. This learning period is sent to the third module.
The second and third modules are the PCA approach and SPC scheme, respectively. The first one calculates the PCs and the second one estimates the GV values per thread and UCL threshold to control the quality in the process. The last module is the decision-making module. The GV value of the current thread is compared against the UCL threshold calculated with the learning period data. When the GV value is greater than the UCL value, the quality control system warns to stop the tapping process and recommends the replacement of the tap tool. Otherwise, the process continues because it is in control.
3. Results
3.1. Experimental Results
Table 1 represents the results of tapping experiments. The first column is the number of taps, the second column is the treatment or coatings and the last column shows the alarm of the screw quality control system to stop the operation.
The tool manufacturers’ experience is aware of this data dispersion in tap lives when machining screws in high-speed cutting conditions. Nevertheless, the control system should be independent of these behaviors.
3.2. PCA Results
PCA has been performed for all nine taps and, in most cases, it was possible to reduce dimensionality to, only, two PCs (Equations (7) and (8)) [12], explaining at the same time more than 90% percent of the variability [21].
The physical interpretation of these PCs is straightforward: the first PC represents the average of all the torque areas necessary to accelerate or decelerate the spindle motor, while the second one is the average of the two main components of the cutting torque (A2) and the friction torque (A6) when extracting the tap.
3.3. Thread Quality Control Charts
Figure 5 shows the control quality interface, friendly for the worker when the process is in quality control after mating the 15th thread. The main plot is a thread control chart and consists of GV values drawing against the current sculpting thread. Thus, the UCL line enables when the system calculates the training period. Over this main plot, there are two alerts. The main one is the alarm because it warns the operator visually about the state of the process. When the alarm is switched on, the operation is out of quality control. Otherwise, the process is in control and continues. The message about stopping the operation and replacing the tool is the second alert.
On the top and right in the interface, the user has the cutting conditions to be selected and the online information about the tapping process. Besides, there is an option to save the tapping data to analyze after finishing the operation.
Before explaining the results of the quality control charts, a tool has been selected per treatment or coating to show the results because GV graphics are similar and do not provide additional information. Thus, two charts are illustrated to discuss the effectiveness of the strategy. The first chart describes the in-control process, that is, one thread before switching on the alarm and the second one is when the tapping process is out of quality control.
3.3.1. Steam Treatment
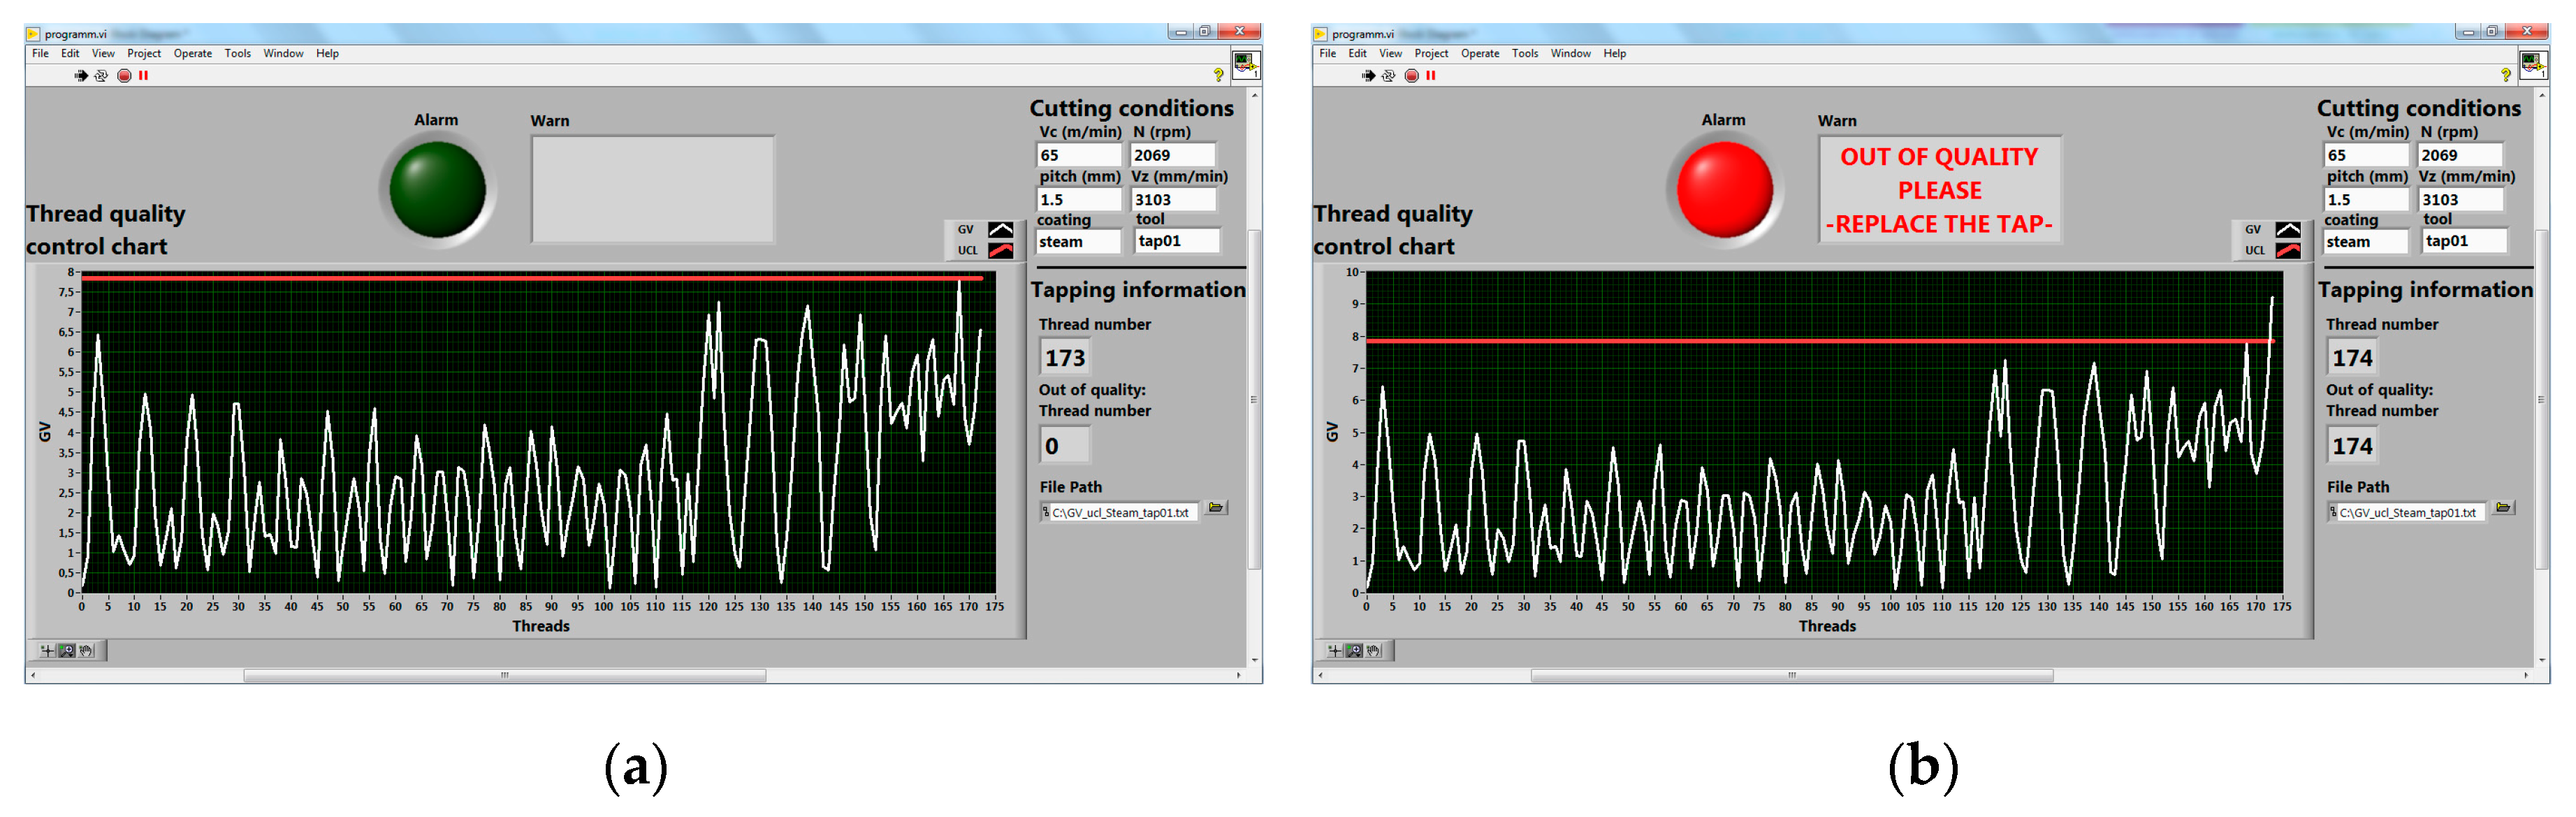
Figure 6a shows the tapping process in control of the steam-treated tool. The GV statistic is lower than the UCL threshold for all the values. Consequently, screw quality is guaranteed. Besides, the worker can see four stages in the trend of GV ones. Tap 1 starts with high dispersion values till the 55th screw. Then, this dispersion decreases until the 115th thread. Finally, the third and fourth stages have a high dispersion value till 155th one and a high average GV value till the 173rd thread. Consequently, the system is a warning that something wrong is happening in the process (micro-chipping, wear, etc.).
On the other hand, Figure 6b illustrates when the process goes out of quality control. The 174th thread GV value is greater than the UCL value. Therefore, the alarm is switched on in red color and a message appears warning that the operation is out of control and it could require a tap replacement. To verify the screw quality, all the threads were inspected by the “go/no-go” gauge. All the threads were acceptable.
3.3.2. AlCrN Coating
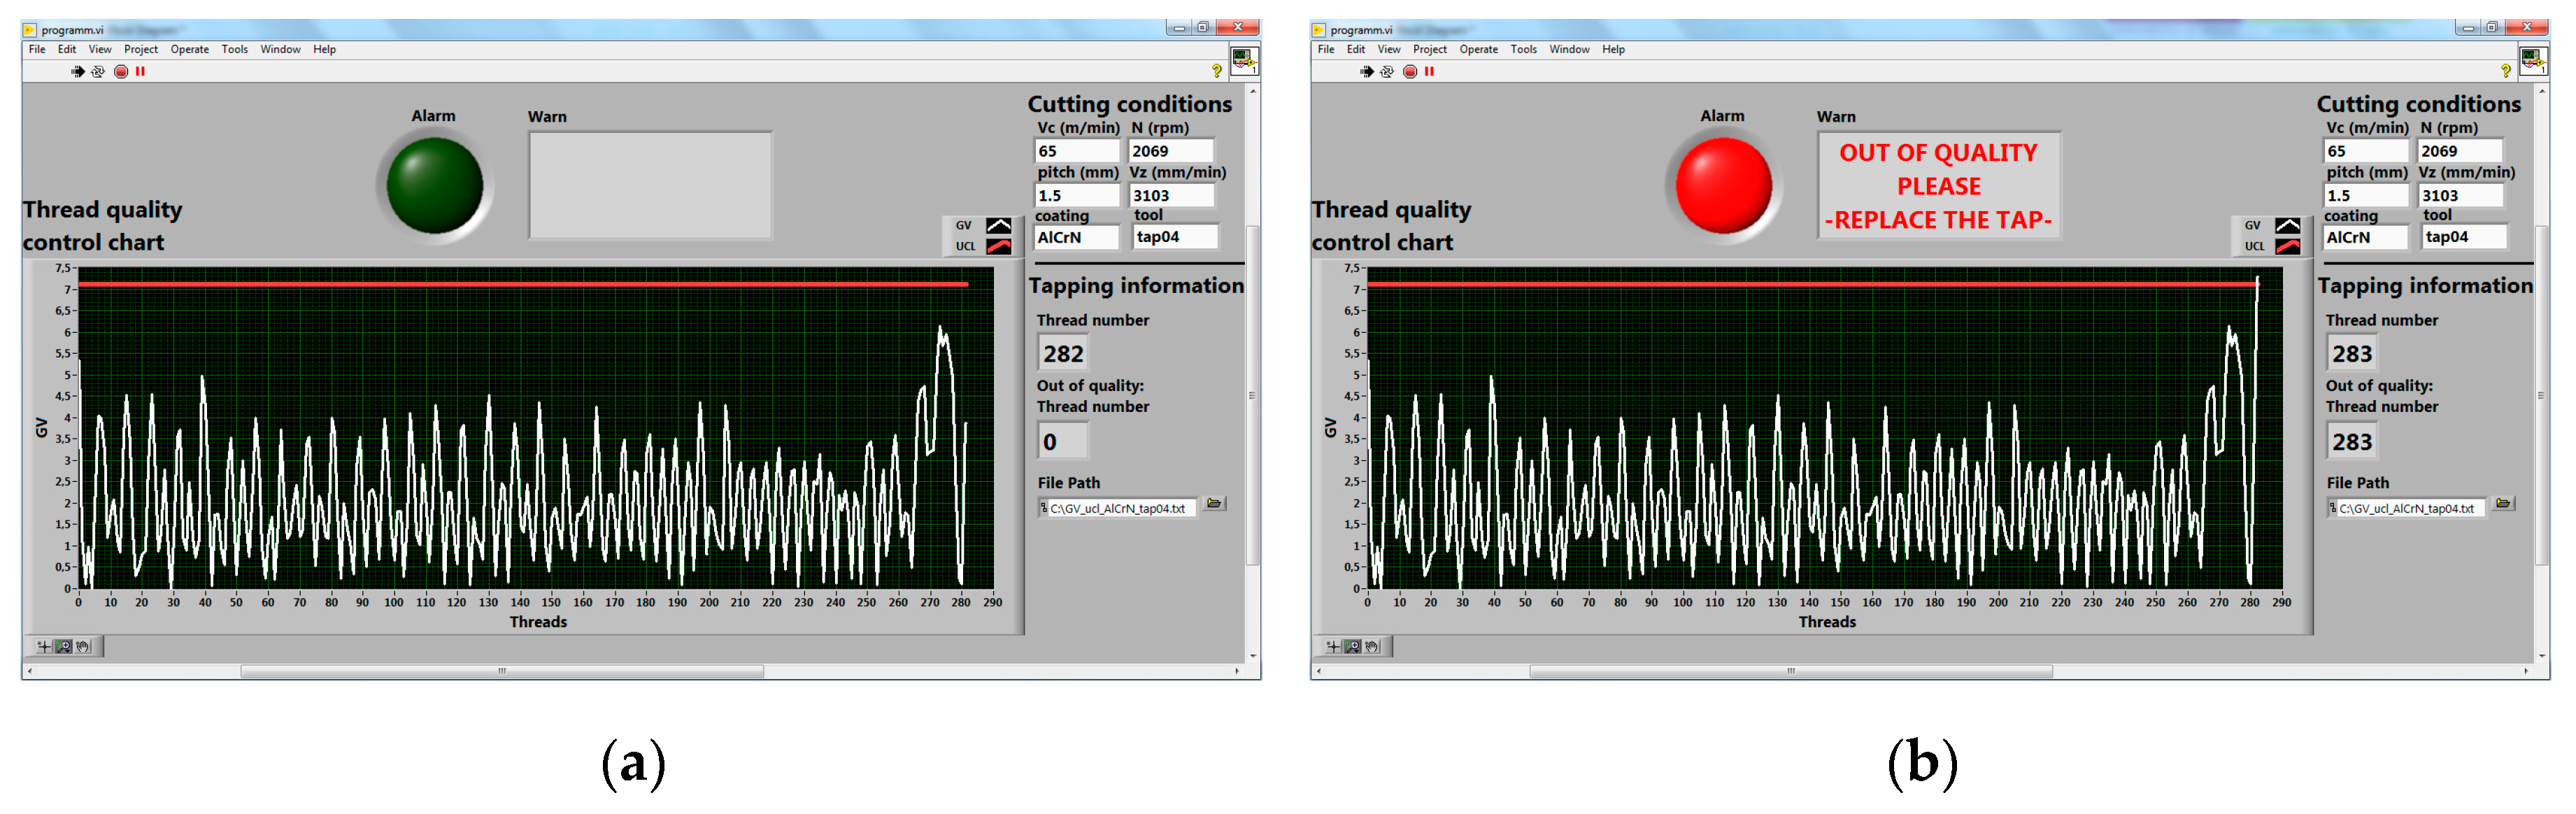
In this case, AlCrN-coated tap 4 has been selected to explain the quality control approach. The GV values are lower than the UCL threshold as can be noted in Figure 7a. However, the GV statistic values have a change in average level and dispersion after 265th thread due to micro-chipping or a level of wear and the worker can notice that there is something anomalous in the operation.
Afterward, the tapping process goes out of quality control in the 283rd thread as can be observed in Figure 7b. All the threads were acceptable by the “go/no-go” gauge. In this case, manufacturing safety has been guaranteed for more than 250 screw holes.
3.3.3. TiCN Coating
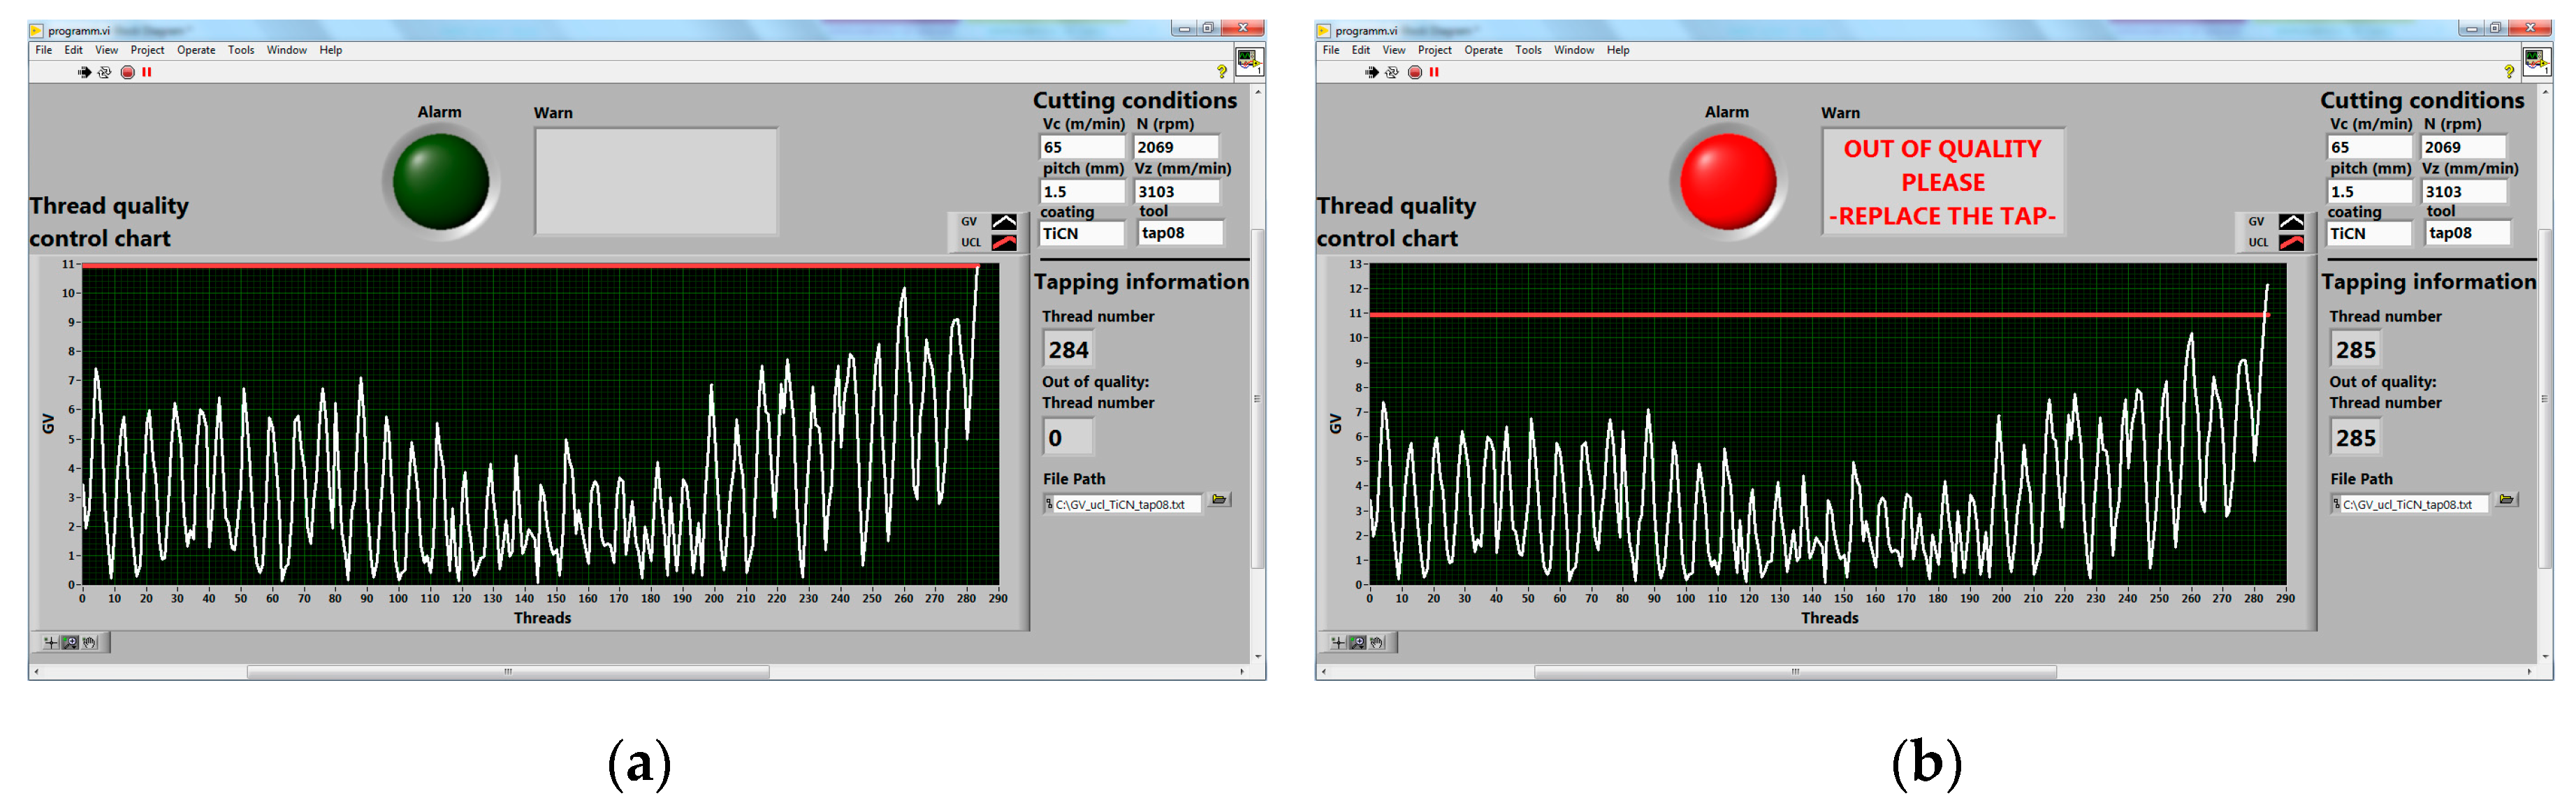
Tap 8 with the TiCN coating has been selected to explain the performance of the thread quality system. This tool has three behaviors, as can be shown in Figure 8a when the process is in control because all the GV values are lower than the UCL threshold value. The first stage has a GV average value of three units from the 1st to 120th thread. The second one is smoother from the 120th to 199th thread. However, there is an increase to 10 units in the 284th thread. This information can be vital for operator decision-making.
The following thread (258th) is out of control owing to a micro-chipping or micro tooth breakage or a high level of wear. Consequently, the GV value of this thread is greater than the UCL value. However, all the screw profiles passed the manual quality inspection.
These three examples summarize the viability of the screw thread profile system because there is no manual inspection and the process security is sure throughout the tapping cycles.
4. Discussion
The quality control system assures safety along the tapping process and the quality of the screw manufacturing profiles. Consequently, the approach can reduce the high industrial costs and time because the worker could look after another manufacturing cell or process. Nevertheless, this strategy stops the operation before sculpting an unacceptable thread and there is a lack of knowledge about the end of thread quality or, in other words, the end of tool life.
Therefore, a new indicator called a tap penalty is defined to know the penalization by having stopped the process when the alarm is turning on in the first screw. The penalty is calculated as:
where alarm thread number and unacceptable thread number come from Table 1 and Table 2, respectively.
The tapping process continues after having switched on the alarm until the first defected thread happens. This lack of quality is under-sized for all the threads because the head of the “go” gauge does not enter throughout the screw profile.
Table 2 illustrates the screw quality inspected by the “go/no-go” gauge and the penalty by stopping the process when the control approach switched on the alarm. The first column indicates the number of taps. The next column provides the number of first tapped holes that do not pass the “go/no-go” gauge test and the thread quality (6H). Finally, the last column is the percentage of the industrial penalty.
The penalty of the control system over the tapping operation oscillates between 6% and 16%. The penalty average is 10%. The manufacturing users assume this penalty over the tap tools because the screw quality is in control and the tapping operation safety and effectiveness are guaranteed.
5. Conclusions
A control system for assessing thread quality in high-speed tapping cycles using internal torque signal of the spindle motor has been developed and validated. Despite this main conclusion, some partial conclusions can be described:
- The approach works without sensor because it feeds on internal signals from the CNC machine drive control.
- The system provides a unique threshold by each tap supplying to the strategy a huge versatility independent of tool life and different coatings or treatments.
- The process safety is guaranteed because it could be working work self-governance and without sculpting a defective screw. Also, the tool life is only reduced by an average of 10%.
- This self-governance will reduce the high industrial costs and times because there will never be a manual inspection.
Author Contributions
A.G.D.V. and F.V. conceived, performed and designed the experiments; A.S. and M.A. analyzed the data; A.G.D.V. and F.V. developed the program; A.G.D.V., F.V., A.S. and M.A. wrote the paper and A.S. and M.A. supervised the results and the paper. All authors have read and agreed to the published version of the manuscript.
Funding
This research was funded by the vice-counseling of technology, innovation and competitiveness of the Basque Government grant agreements IT-2005/00201, ZL-2019/00720 (HARDCRAFT project) and KK-2019/00004 (PROCODA project).
Acknowledgments
The authors acknowledge Tivoly Groupe by its tool manufacturing knowledge.
Conflicts of Interest
The authors declare no conflict of interest.
Acronyms
| Abbreviation | Definition |
| CLM | Closed-Loop Manufacturing |
| ISO | International Standards Organization |
| CFRP | Carbon Fiber Reinforced Polymer |
| WEDM | Wire Electrical Discharge Machining |
| PCA | Principal Component Analysis |
| SPC | Statistical Control Process |
| CNC | Computer Numerical Control |
| HSS | High-Speed Steel |
| PVD | Physical Vapor Deposition |
| TiCN | Titanium Carbon Nitride |
| AlCrN | Aluminum Chromo Nitride |
| DAQ | Data Acquisition |
| PC | Personal Computer |
| A | Area |
| RP | Reference Plane |
| SP | Stop Plane |
| GV | Generalized Variance |
| UCL | Upper Control Limit |
References
- Ahn, J.H.; Lee, D.J.; Kim, S.H.; Cho, K.K. Effects of Synchronizing Errors in Cutting Performance in the Ultrahigh- Speed Tapping. CIRP Ann. Manuf. Technol. 2003, 52, 53–56. [Google Scholar] [CrossRef]
- Agapiou, J.S. Evaluation of the effect of high speed machining on tapping. J. Eng. Ind. 1994, 116, 457–462. [Google Scholar] [CrossRef]
- Mezentsev, O.A.; DeVor, R.E.; Kapoor, S.G. Prediction of Thread Quality by Detection and Estimation of Tapping Faults. J. Manuf. Sci. Eng. 2002, 124, 643–650. [Google Scholar] [CrossRef]
- Fernández Landeta, J.; Fernández Valdivielso, A.; López de Lacalle, L.N.; Girot, F.; Pérez Pérez, J.M. Wear of form taps in threading of steel cold forged parts. J. Manuf. Sci. Eng. 2015, 137. [Google Scholar] [CrossRef]
- Elosegui, I.; Alonso, U.; Lopez de Lacalle, L.N. PVD coatings for thread tapping of austempered ductile iron. Int. J. Adv. Manuf. Technol. 2017, 91, 2663–2672. [Google Scholar] [CrossRef]
- Gil Del Val, A.; Diéguez, P.M.; Arizmendi, M.; Estrems, M. Experimental study of tapping wear mechanisms on nodular cast iron. Procedia Eng. 2015, 132, 190–196. [Google Scholar] [CrossRef] [Green Version]
- Zawada-Tomkiewicz, A.; Wierucka, I. A case study in technological quality assurance of a metric screw thread. Measurement 2018, 114, 208–2017. [Google Scholar] [CrossRef]
- De Freitas, S.A.; Vieira, J.T.; Filho, S.L.M.R.; Cardoso, L. Experimental investigation of tapping in CFRP with analysis of torque-tension resistance. Int. J. Adv. Manuf. Technol. 2019, 104, 757–766. [Google Scholar] [CrossRef]
- Monka, P.; Monkova, K.; Modrak, V.; Hric, S.; Pastucha, P. Study of a tap failure at the internal threads machining. Eng. Fail. Anal. 2019, 100, 25–30. [Google Scholar] [CrossRef]
- Chen, Y.B.; Sha, J.L.; Wu, S.M. Diagnosis of tapping process by information measure and probability voting approach. J. Ind. Eng. 1990, 112, 319–325. [Google Scholar] [CrossRef]
- Liu, T.I.; Ko, E.J.; Sha, S.L. Diagnosis of Tapping Operations Using an AI Approach. J. Mater. Shap. Technol. 1991, 9, 39–46. [Google Scholar] [CrossRef]
- Li, W.; Li, D.; Ni, J. Diagnosis of tapping process using spindle motor current. Int. J. Mach. Tools Manuf. 2002, 43, 73–79. [Google Scholar] [CrossRef]
- Liu, T.-I.; Lee, J.; Liu, G.; Wu, Z. Monitoring and diagnosis of the tapping process for product quality and automated manufacturing. Int. J. Adv. Manuf. Technol. 2013, 64, 1169–1175. [Google Scholar] [CrossRef]
- Bustillo, A.; López de Lacalle, L.N.; Fernández-Valdivielso, A.; Santos, P. Data-mining modeling for the prediction of wear on forming-taps in the threading of steel components. J. Comput. Des. Eng. 2016, 3, 337–348. [Google Scholar] [CrossRef] [Green Version]
- Oezkaya, E.; Biermann, D. Development of a geometrical torque prediction method (GTPM) to automatically determine the relative torque for different tapping tools and diameters. Int. J. Adv. Manuf. Technol. 2018, 97, 1465–1479. [Google Scholar] [CrossRef]
- Lorentz, G. Principal component analysis in technology. Ann. CIRP 1989, 38, 107–109. [Google Scholar] [CrossRef]
- Ming, J.; Tsung, F. A chart allocation strategy for multistage processes. IIE Trans. 2009, 41, 790–803. [Google Scholar]
- Ming, J.; Li, Y.; Tsung, F. Chart allocation strategy for serial-parallel multistage manufacturing processes. IIE Trans. 2010, 42, 577–588. [Google Scholar]
- Oppermann, M.; Sauer, W.; Wohlrabe, H. Optimization of inspection strategies by use of quality cost models and SPC. In Proceedings of the 24th International Spring Seminar on Electronics Technology: Concurrent Engineering in Electronic Packaging, Conference Proceedings, Calimanesti-Caciulata, Romania, 5–9 May 2001; pp. 293–297. [Google Scholar]
- Gil Del Val, A.; Fernández, J.; del Castillo, E.; Arizmendi, M.; Veiga, F. Monitoring of thread quality when tapping nodular cast iron with TiN-coated HSS cutting taps. Int. J. Adv. Manuf. Technol. 2013, 69, 1273–1282. [Google Scholar] [CrossRef]
- Jackson, J.E. A User’s Guide to Principal Components, 10th ed.; John Wiley & Sons: New York, NY, USA, 1991. [Google Scholar]
- Montgomery, D.C. Introduction to Statistical Quality Control, 3rd ed.; John Wiley & Sons: New York, NY, USA, 1996. [Google Scholar]
Figure 1.
Thread quality definition: superposed profiles of unacceptable and acceptable threads.

Figure 2.
Experimental layout: setup of measurements and configuration scheme of registered torque signal in the computer numerical control (CNC) machine.
Figure 2.
Experimental layout: setup of measurements and configuration scheme of registered torque signal in the computer numerical control (CNC) machine.

Figure 3.
Superposed torque signals of unacceptable and acceptable threads and the seven area feature to characterize the tapping process.
Figure 3.
Superposed torque signals of unacceptable and acceptable threads and the seven area feature to characterize the tapping process.

Figure 4.
Thread quality control flowchart.

Figure 5.
Thread control chart when the process is in control.

Figure 6.
Thread control charts of steam-treated Tap 1: (a) when the process is in control; (b) when the process is out of control.
Figure 6.
Thread control charts of steam-treated Tap 1: (a) when the process is in control; (b) when the process is out of control.

Figure 7.
Thread control charts of AlCrN-coated Tap 4: (a) when the process is in control; (b) when the process is out of control.
Figure 7.
Thread control charts of AlCrN-coated Tap 4: (a) when the process is in control; (b) when the process is out of control.

Figure 8.
Thread control charts of TiCN-coated Tap 8: (a) when the process is in control; (b) when the process is out of control.
Figure 8.
Thread control charts of TiCN-coated Tap 8: (a) when the process is in control; (b) when the process is out of control.


Table 1.
Taps, coating and alarm (thread number) of measurements.
| Tap | Coating | Alarm |
|---|---|---|
| 1 | steam | 174 |
| 2 | steam | 242 |
| 3 | steam | 232 |
| 4 | AlCrN | 283 |
| 5 | AlCrN | 409 |
| 6 | AlCrN | 204 |
| 7 | TiCN | 158 |
| 8 | TiCN | 285 |
| 9 | TiCN | 281 |
Table 2.
Manufacturing penalty by stopping the tapping process.
| Tap | Unacceptable Thread | Penalty (%) |
|---|---|---|
| 1 | 190 | 8 |
| 2 | 260 | 7 |
| 3 | 260 | 10 |
| 4 | 300 | 6 |
| 5 | 450 | 9 |
| 6 | 240 | 15 |
| 7 | 170 | 7 |
| 8 | 340 | 16 |
| 9 | 320 | 12 |
© 2020 by the authors. Licensee MDPI, Basel, Switzerland. This article is an open access article distributed under the terms and conditions of the Creative Commons Attribution (CC BY) license (http://creativecommons.org/licenses/by/4.0/).
Share and Cite
MDPI and ACS Style
Gil Del Val, A.; Veiga, F.; Suárez, A.; Arizmendi, M. Thread Quality Control in High-Speed Tapping Cycles. J. Manuf. Mater. Process. 2020, 4, 9. https://doi.org/10.3390/jmmp4010009
AMA Style
Gil Del Val A, Veiga F, Suárez A, Arizmendi M. Thread Quality Control in High-Speed Tapping Cycles. Journal of Manufacturing and Materials Processing. 2020; 4(1):9. https://doi.org/10.3390/jmmp4010009
Chicago/Turabian StyleGil Del Val, Alain, Fernando Veiga, Alfredo Suárez, and Mikel Arizmendi. 2020. "Thread Quality Control in High-Speed Tapping Cycles" Journal of Manufacturing and Materials Processing 4, no. 1: 9. https://doi.org/10.3390/jmmp4010009