
Effect of Electric Current on SPS Densification of Spherical Copper Powder

 and
and
Abstract
:1. Introduction
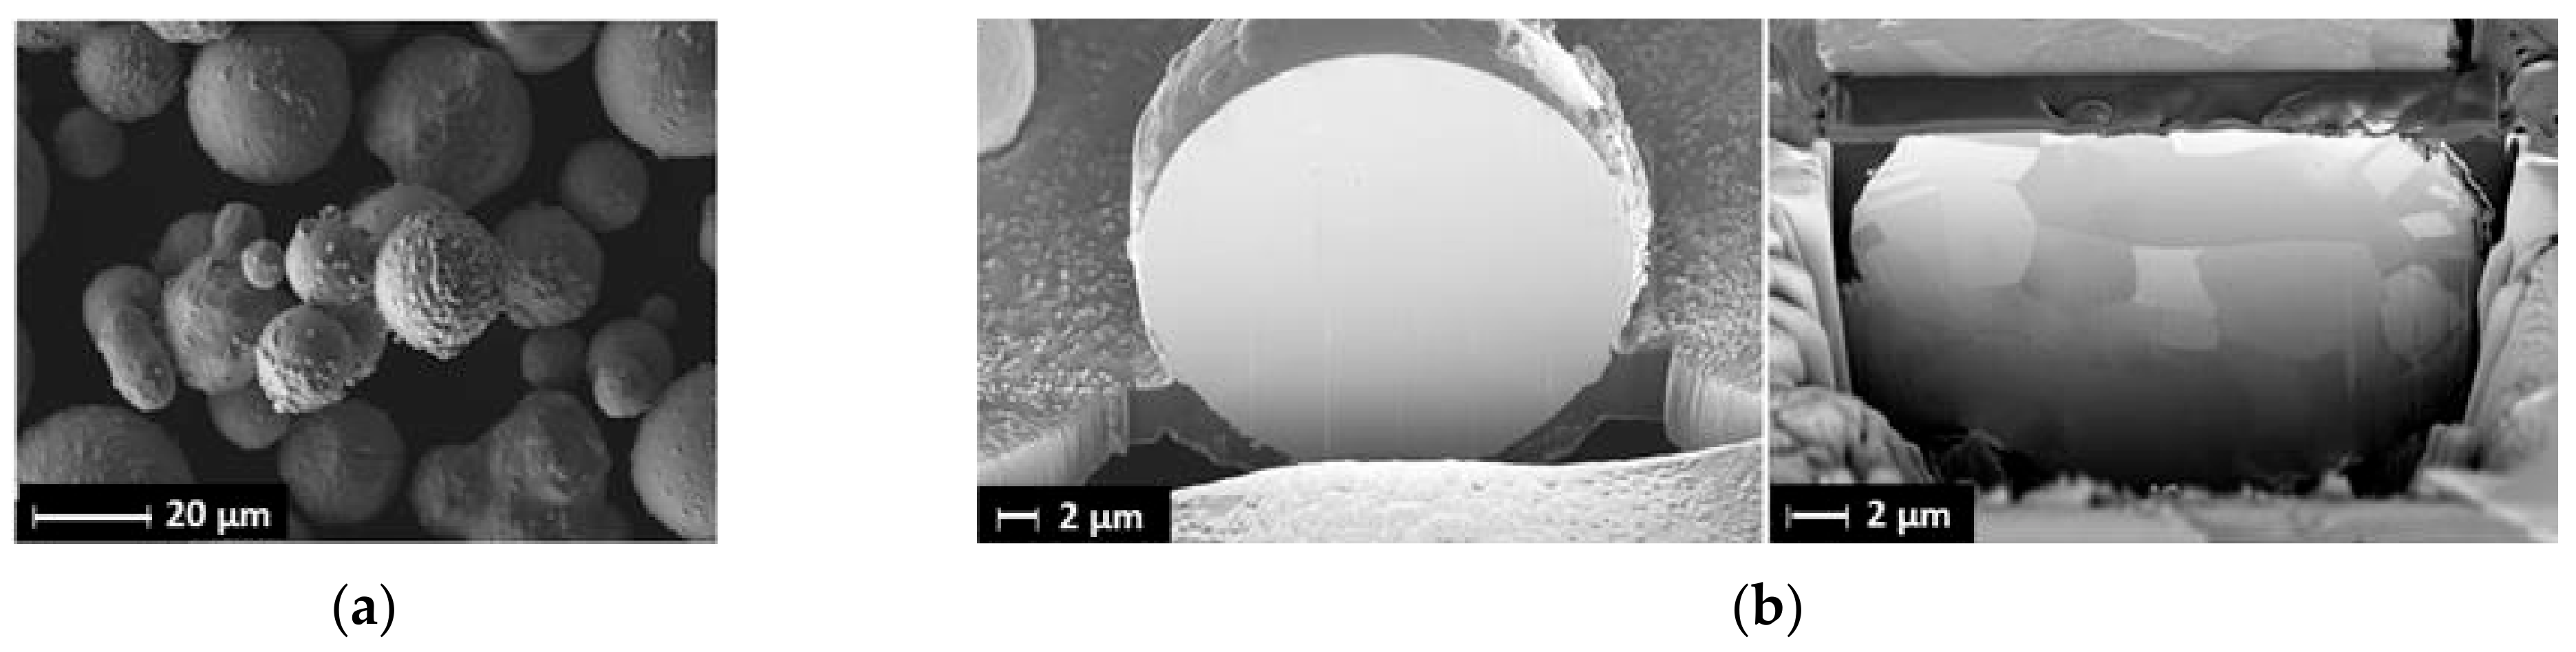
2. Materials and Methods
3. Results
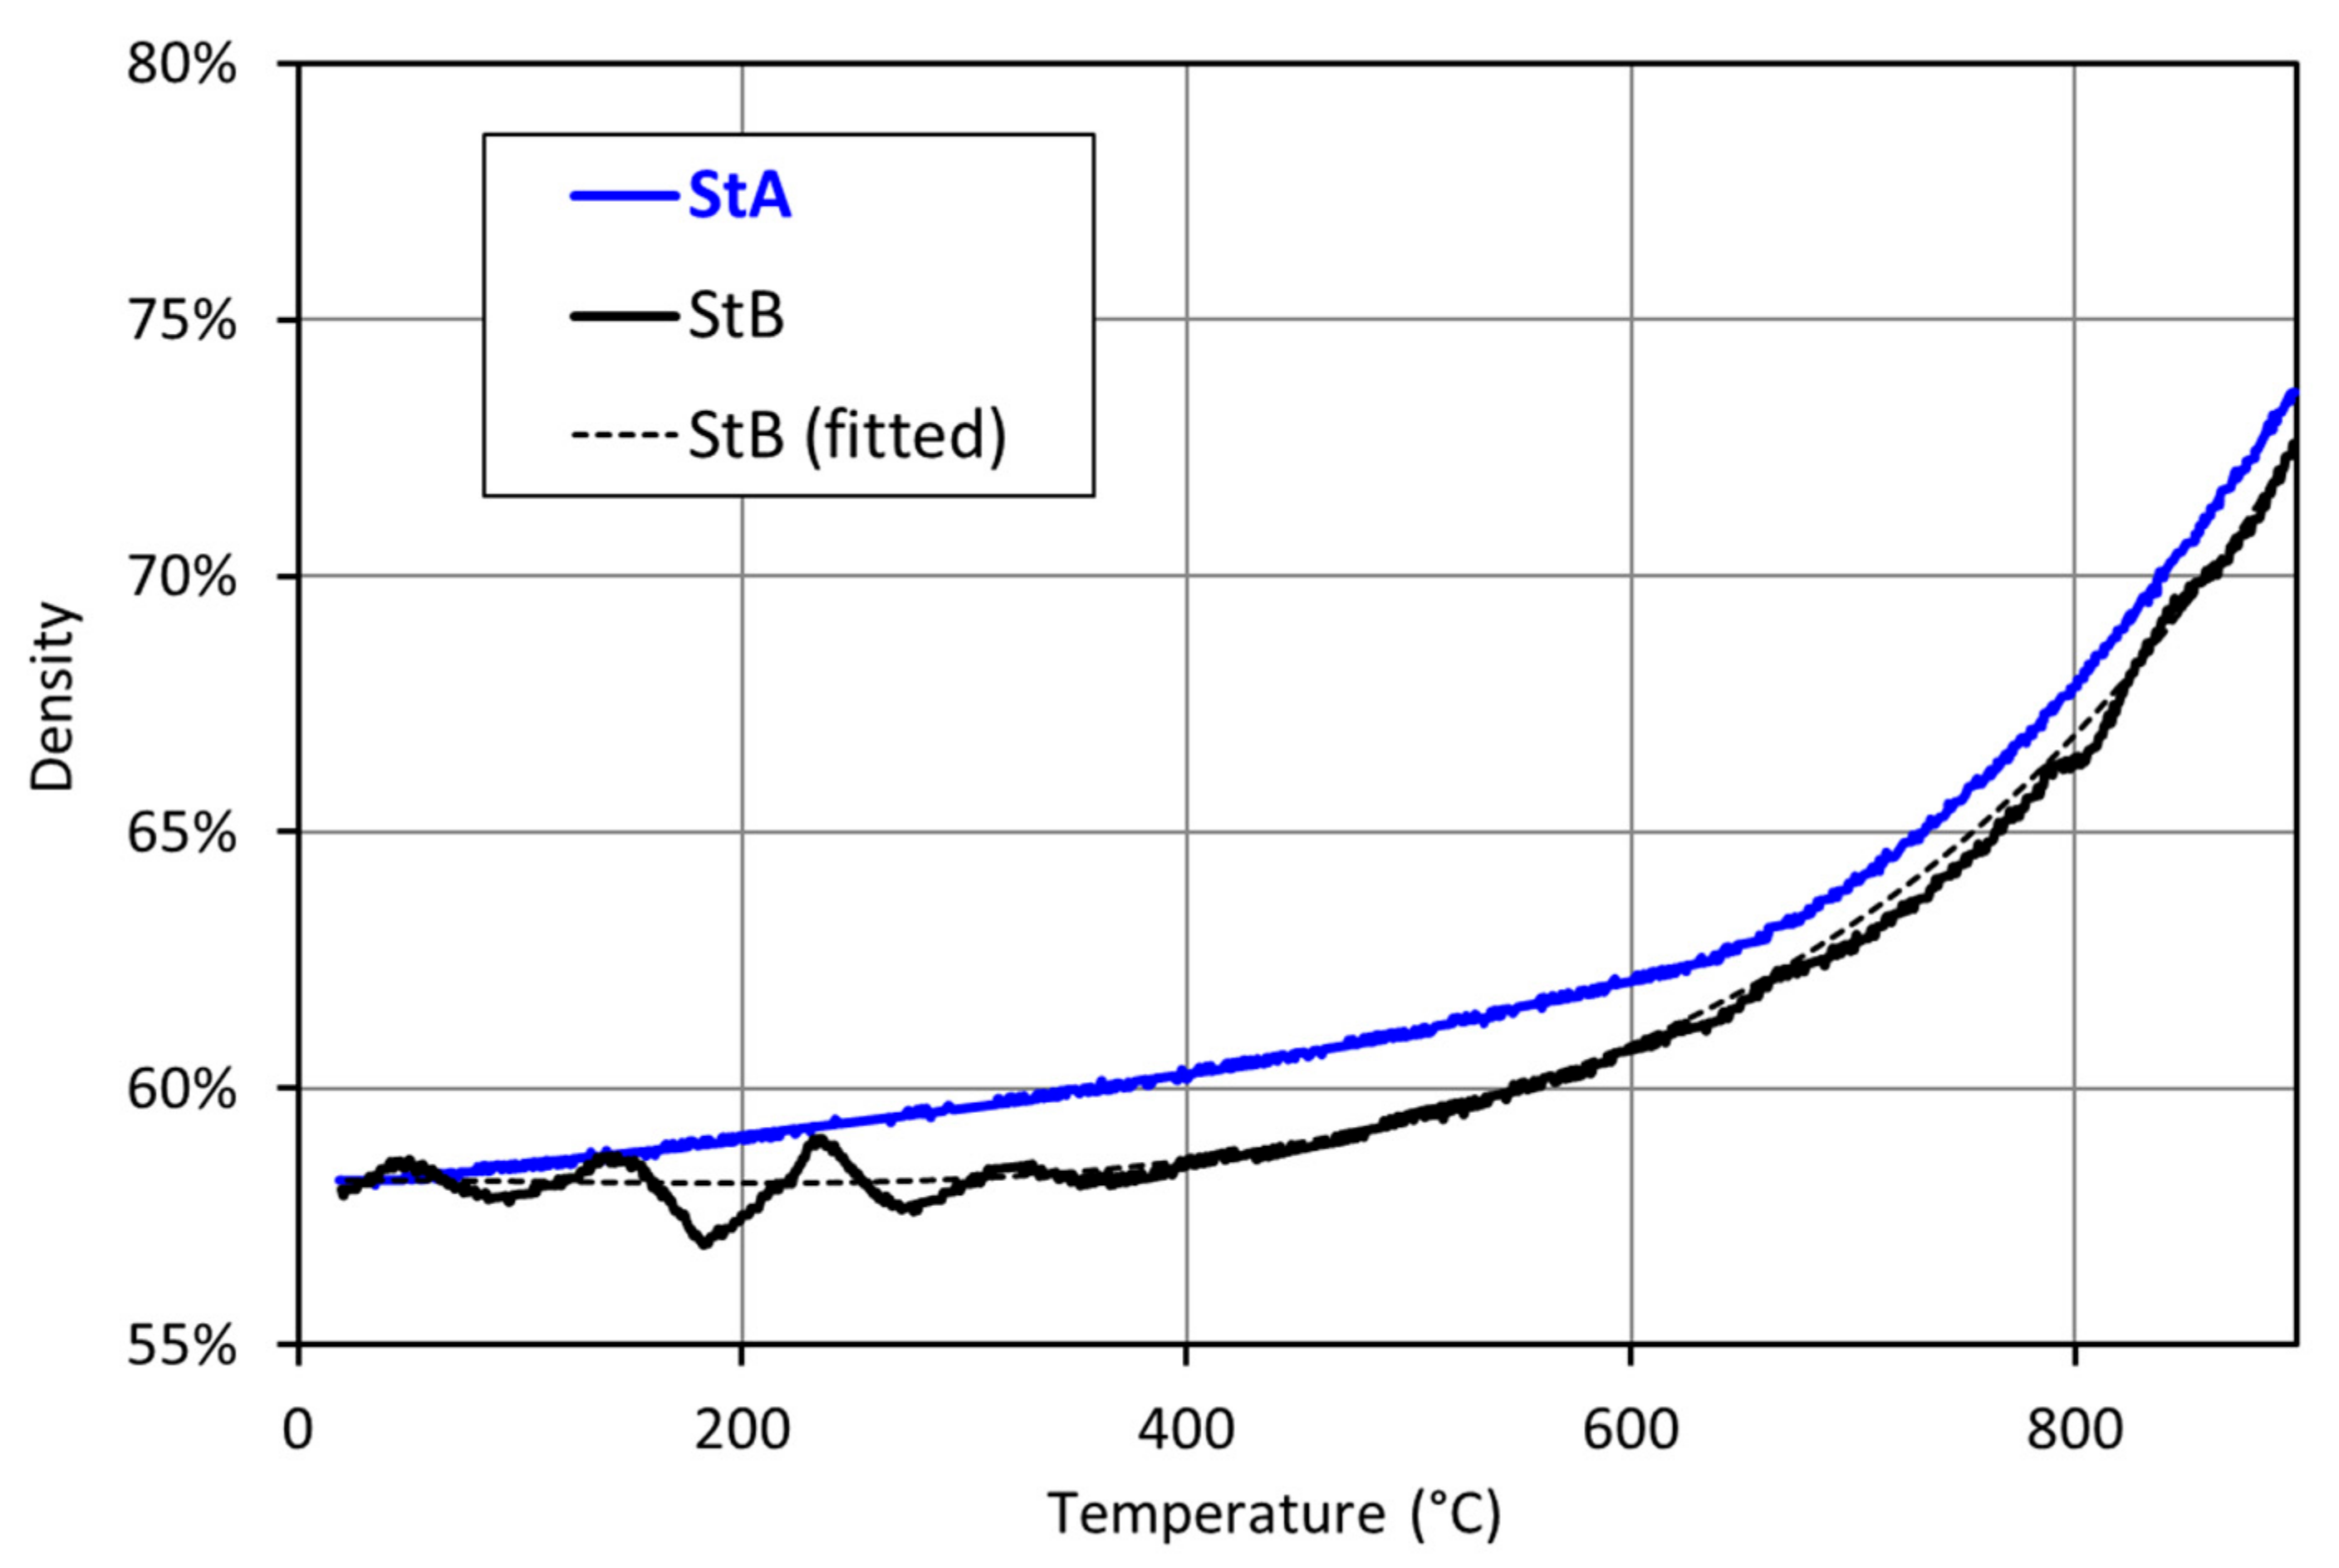
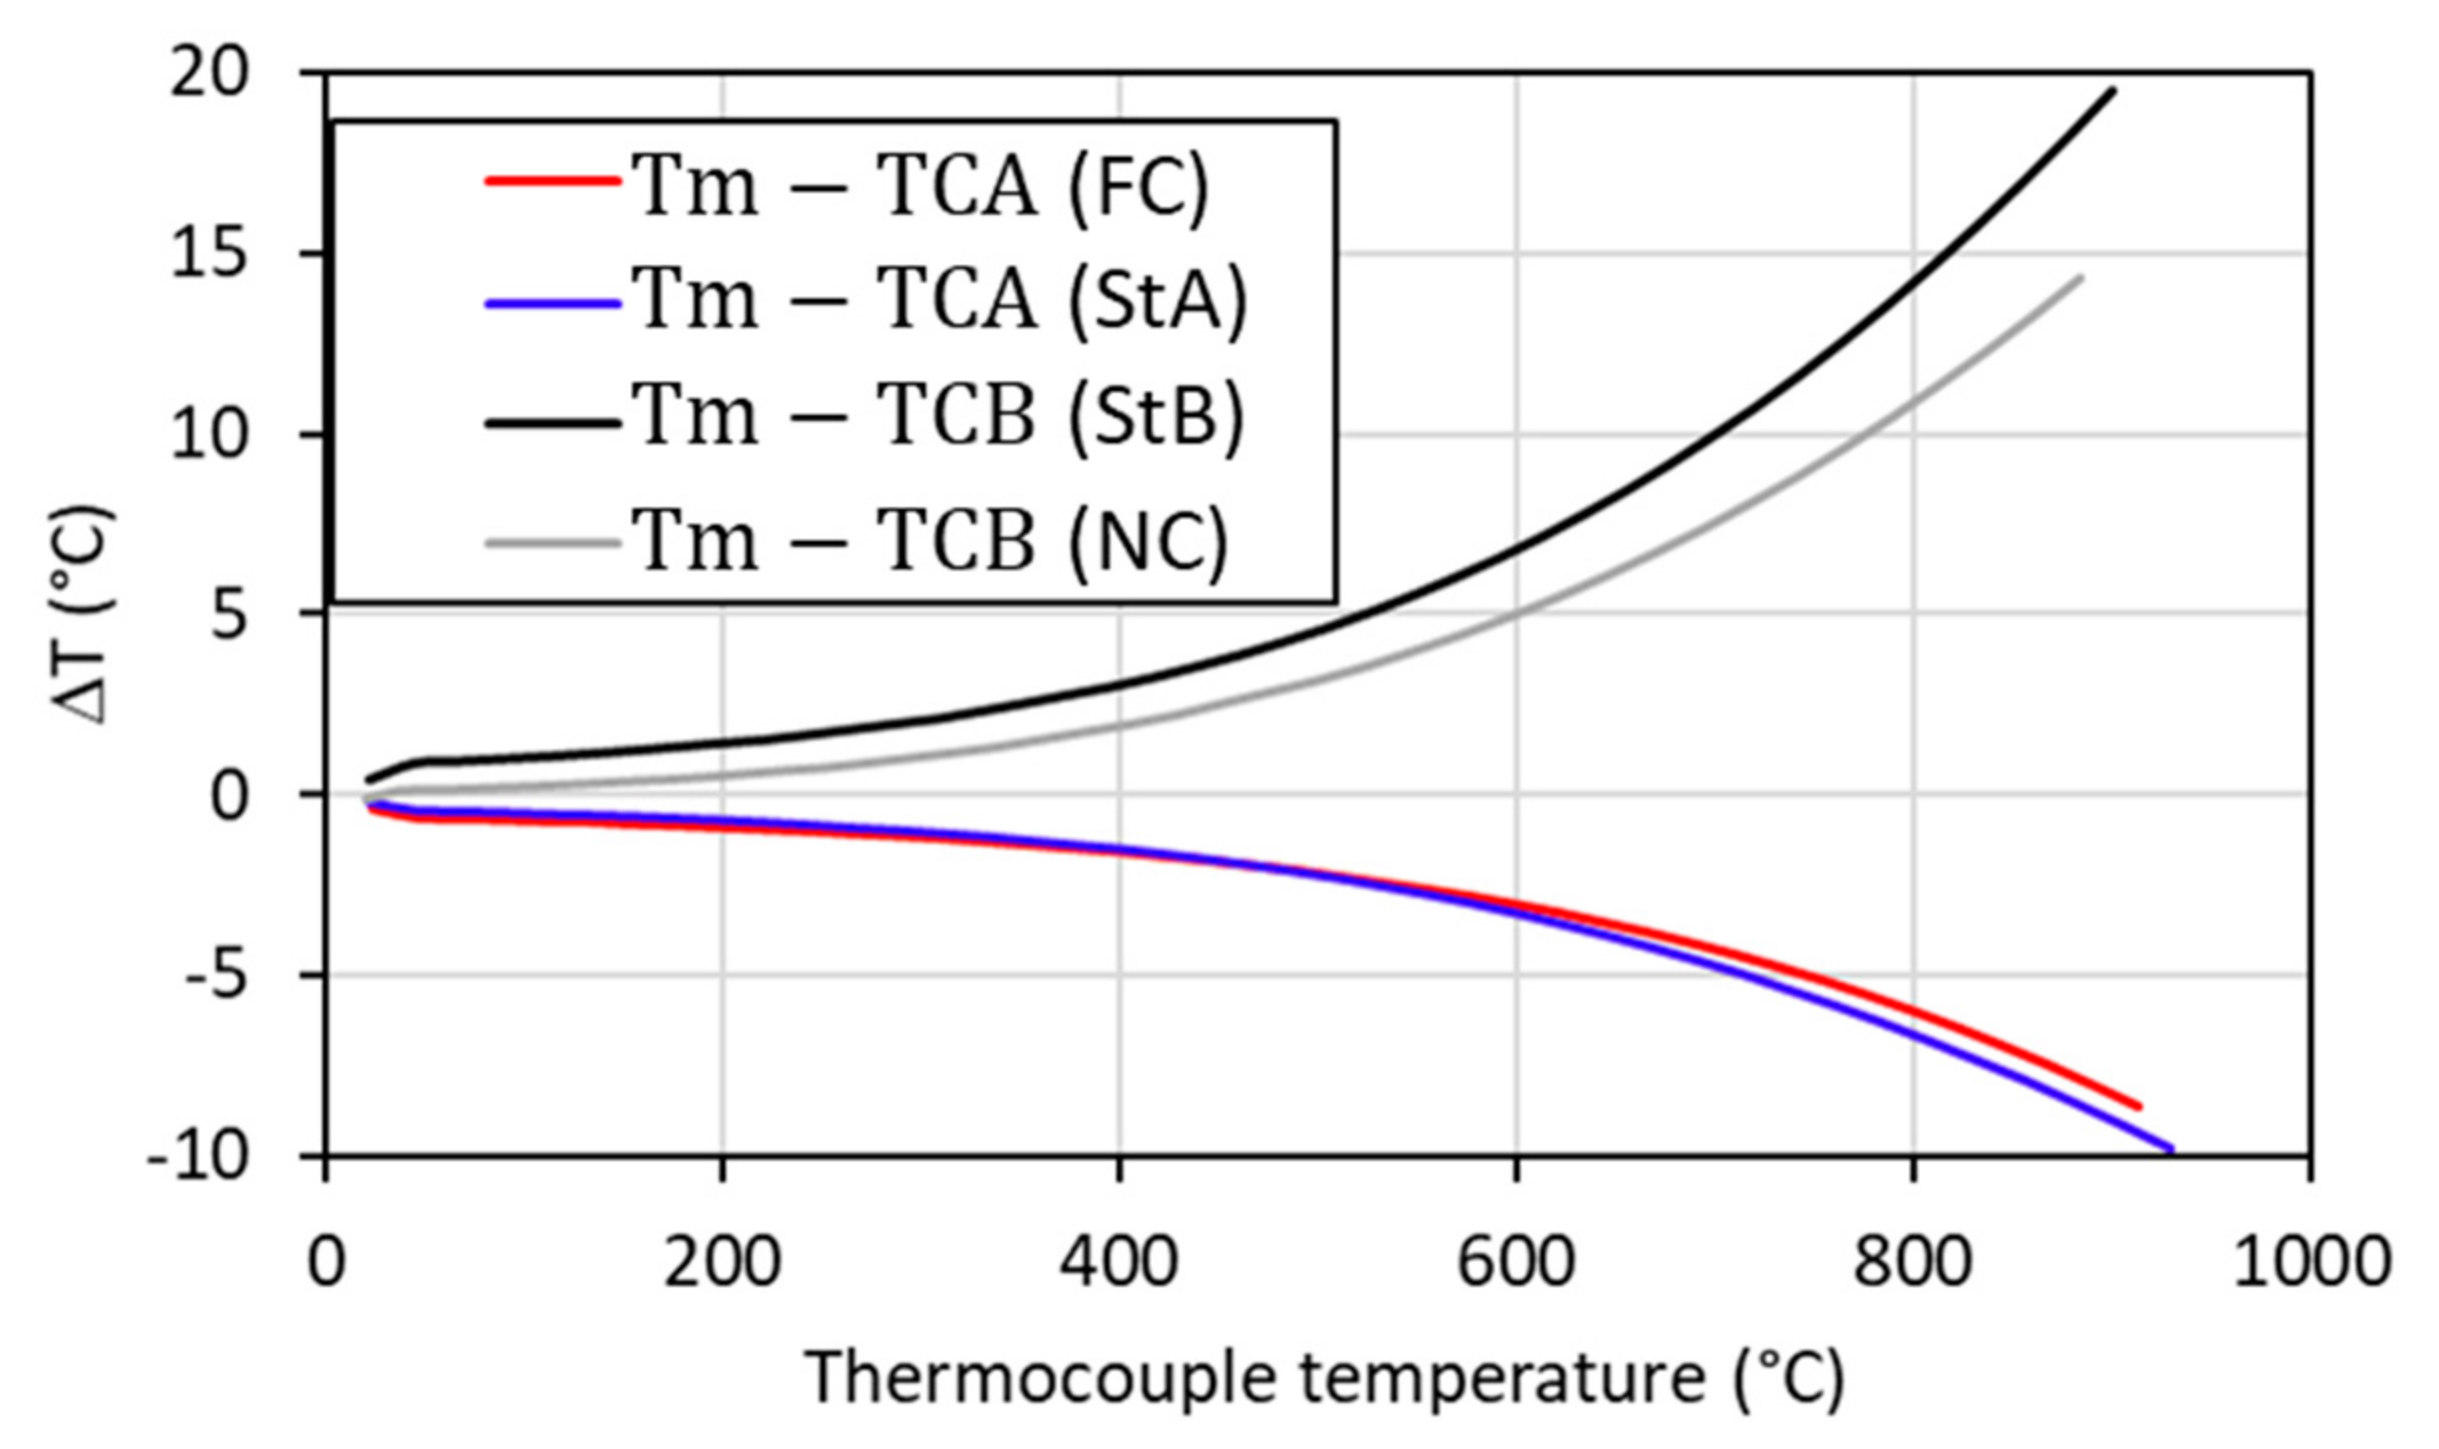
3.1. Comparison of Standard SPS Conditions with Different Thermocouple Positions (StA and StB)
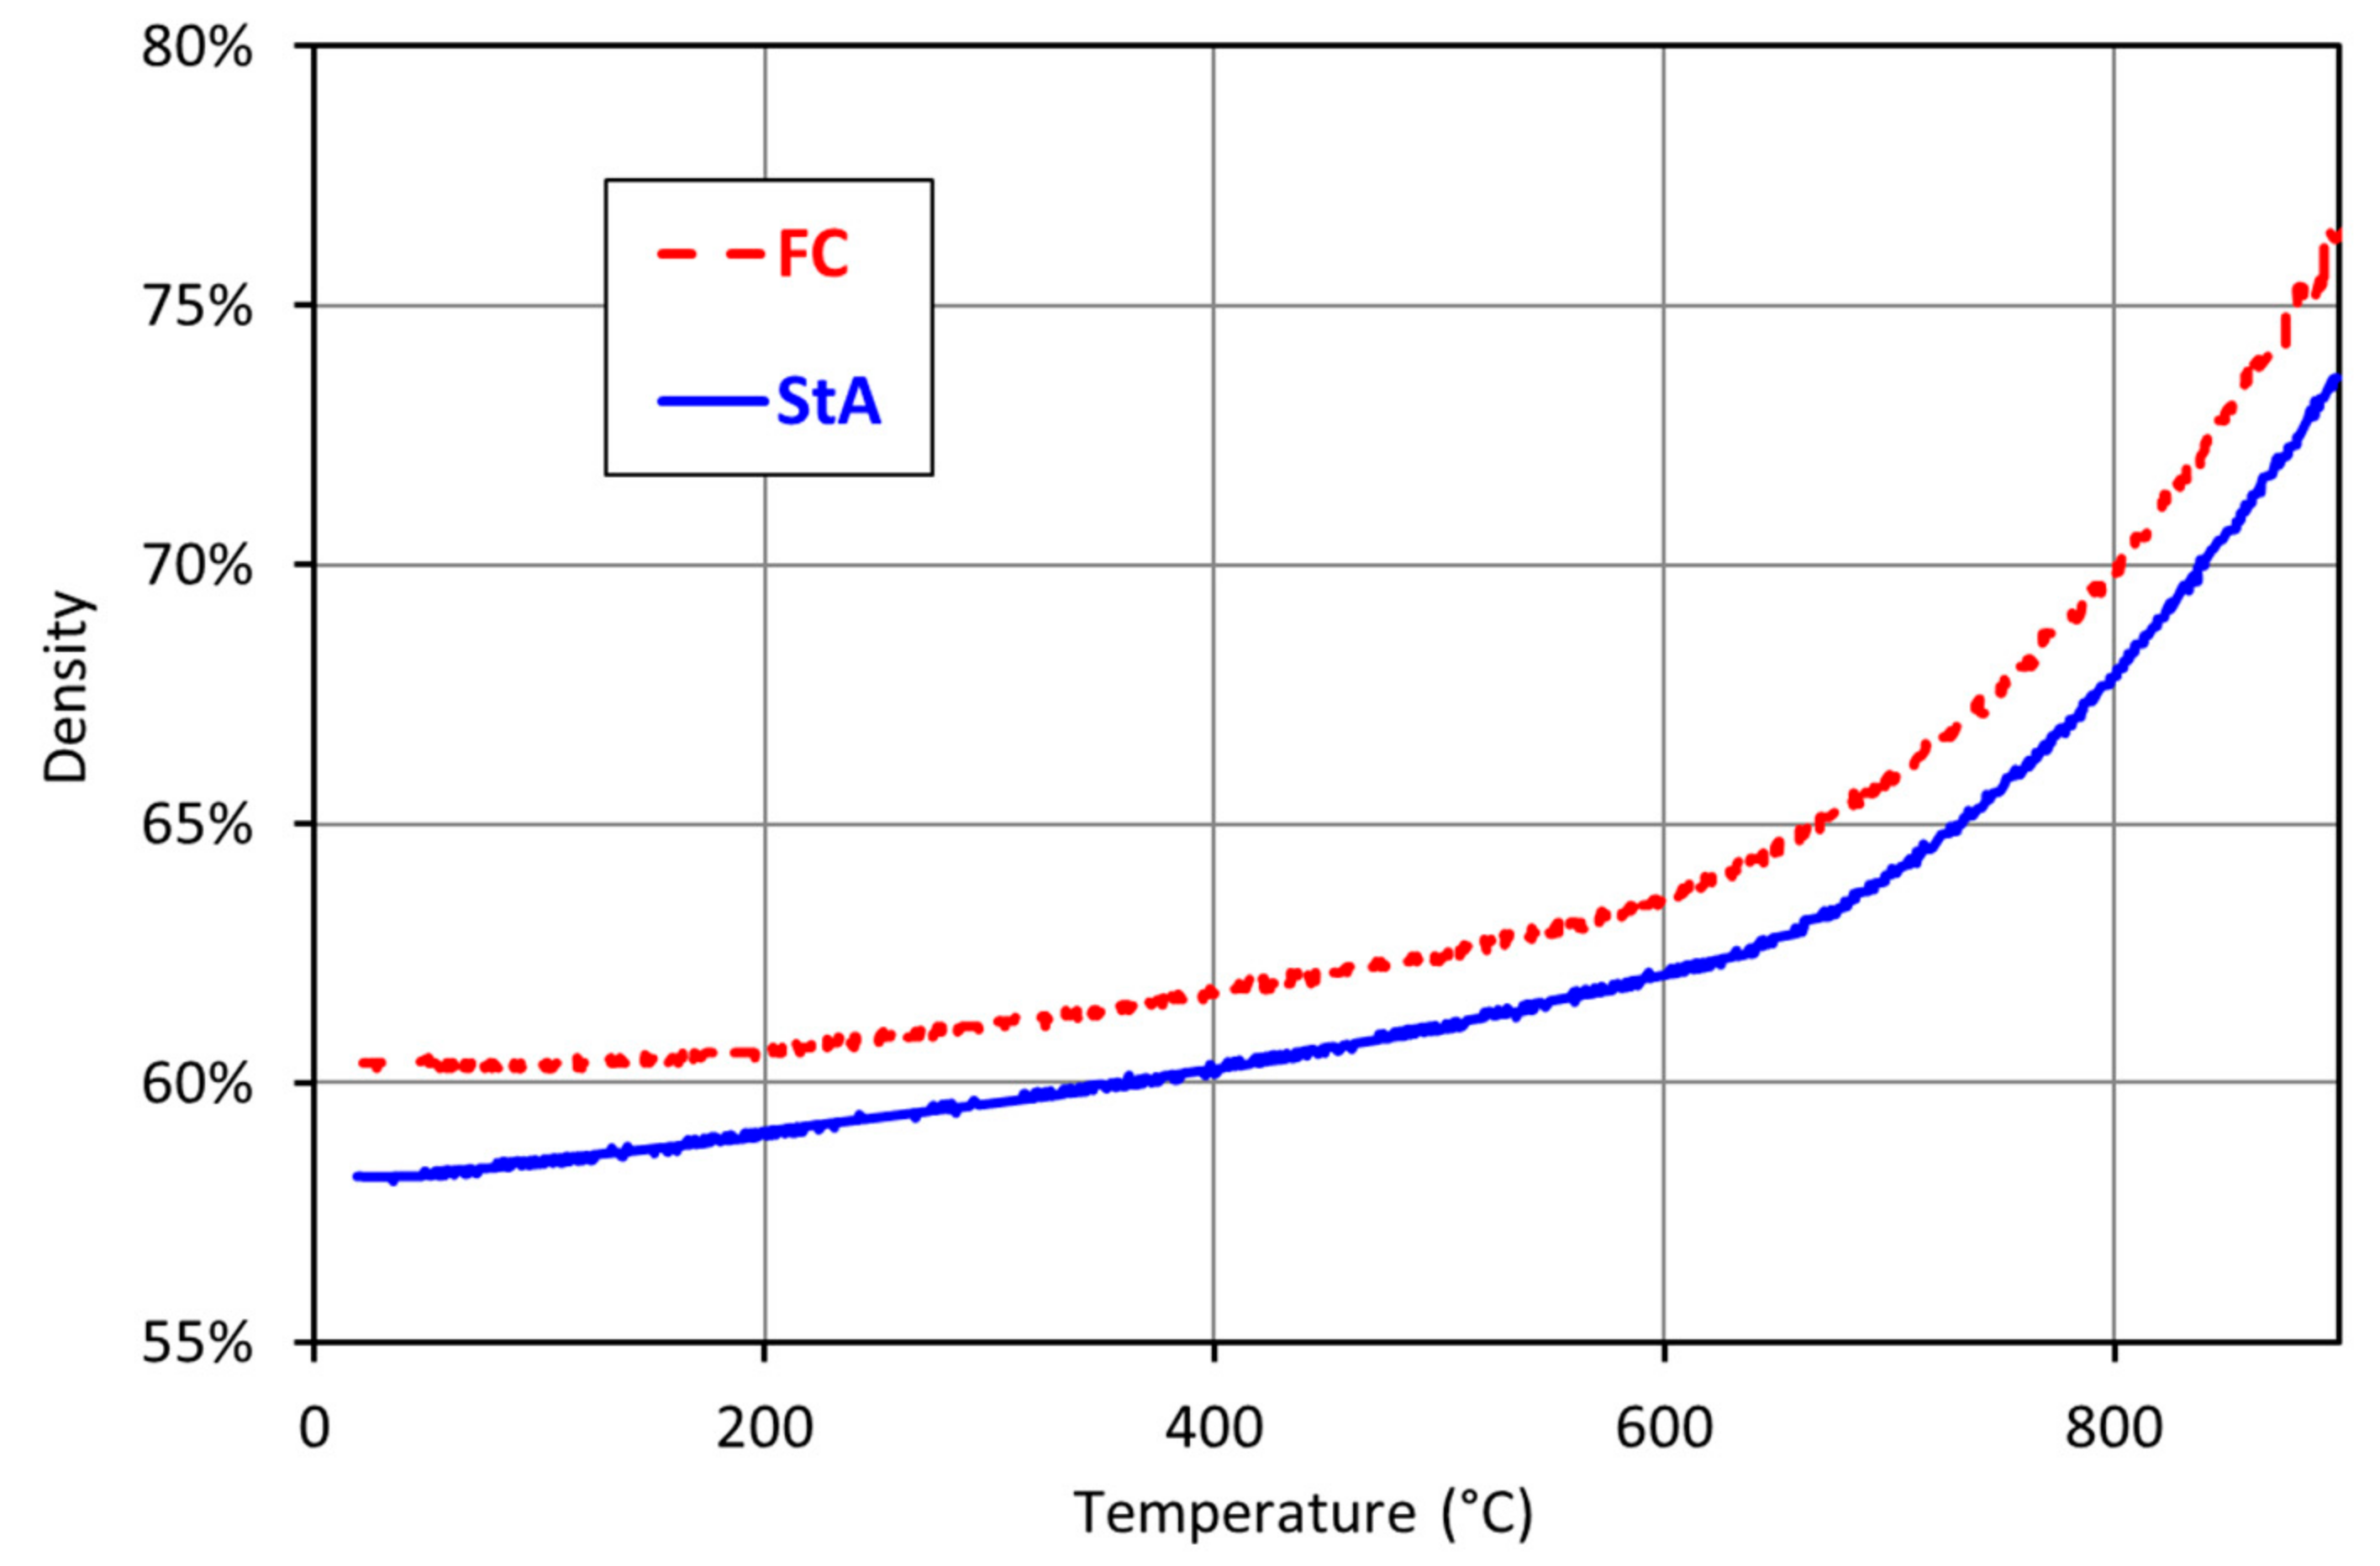
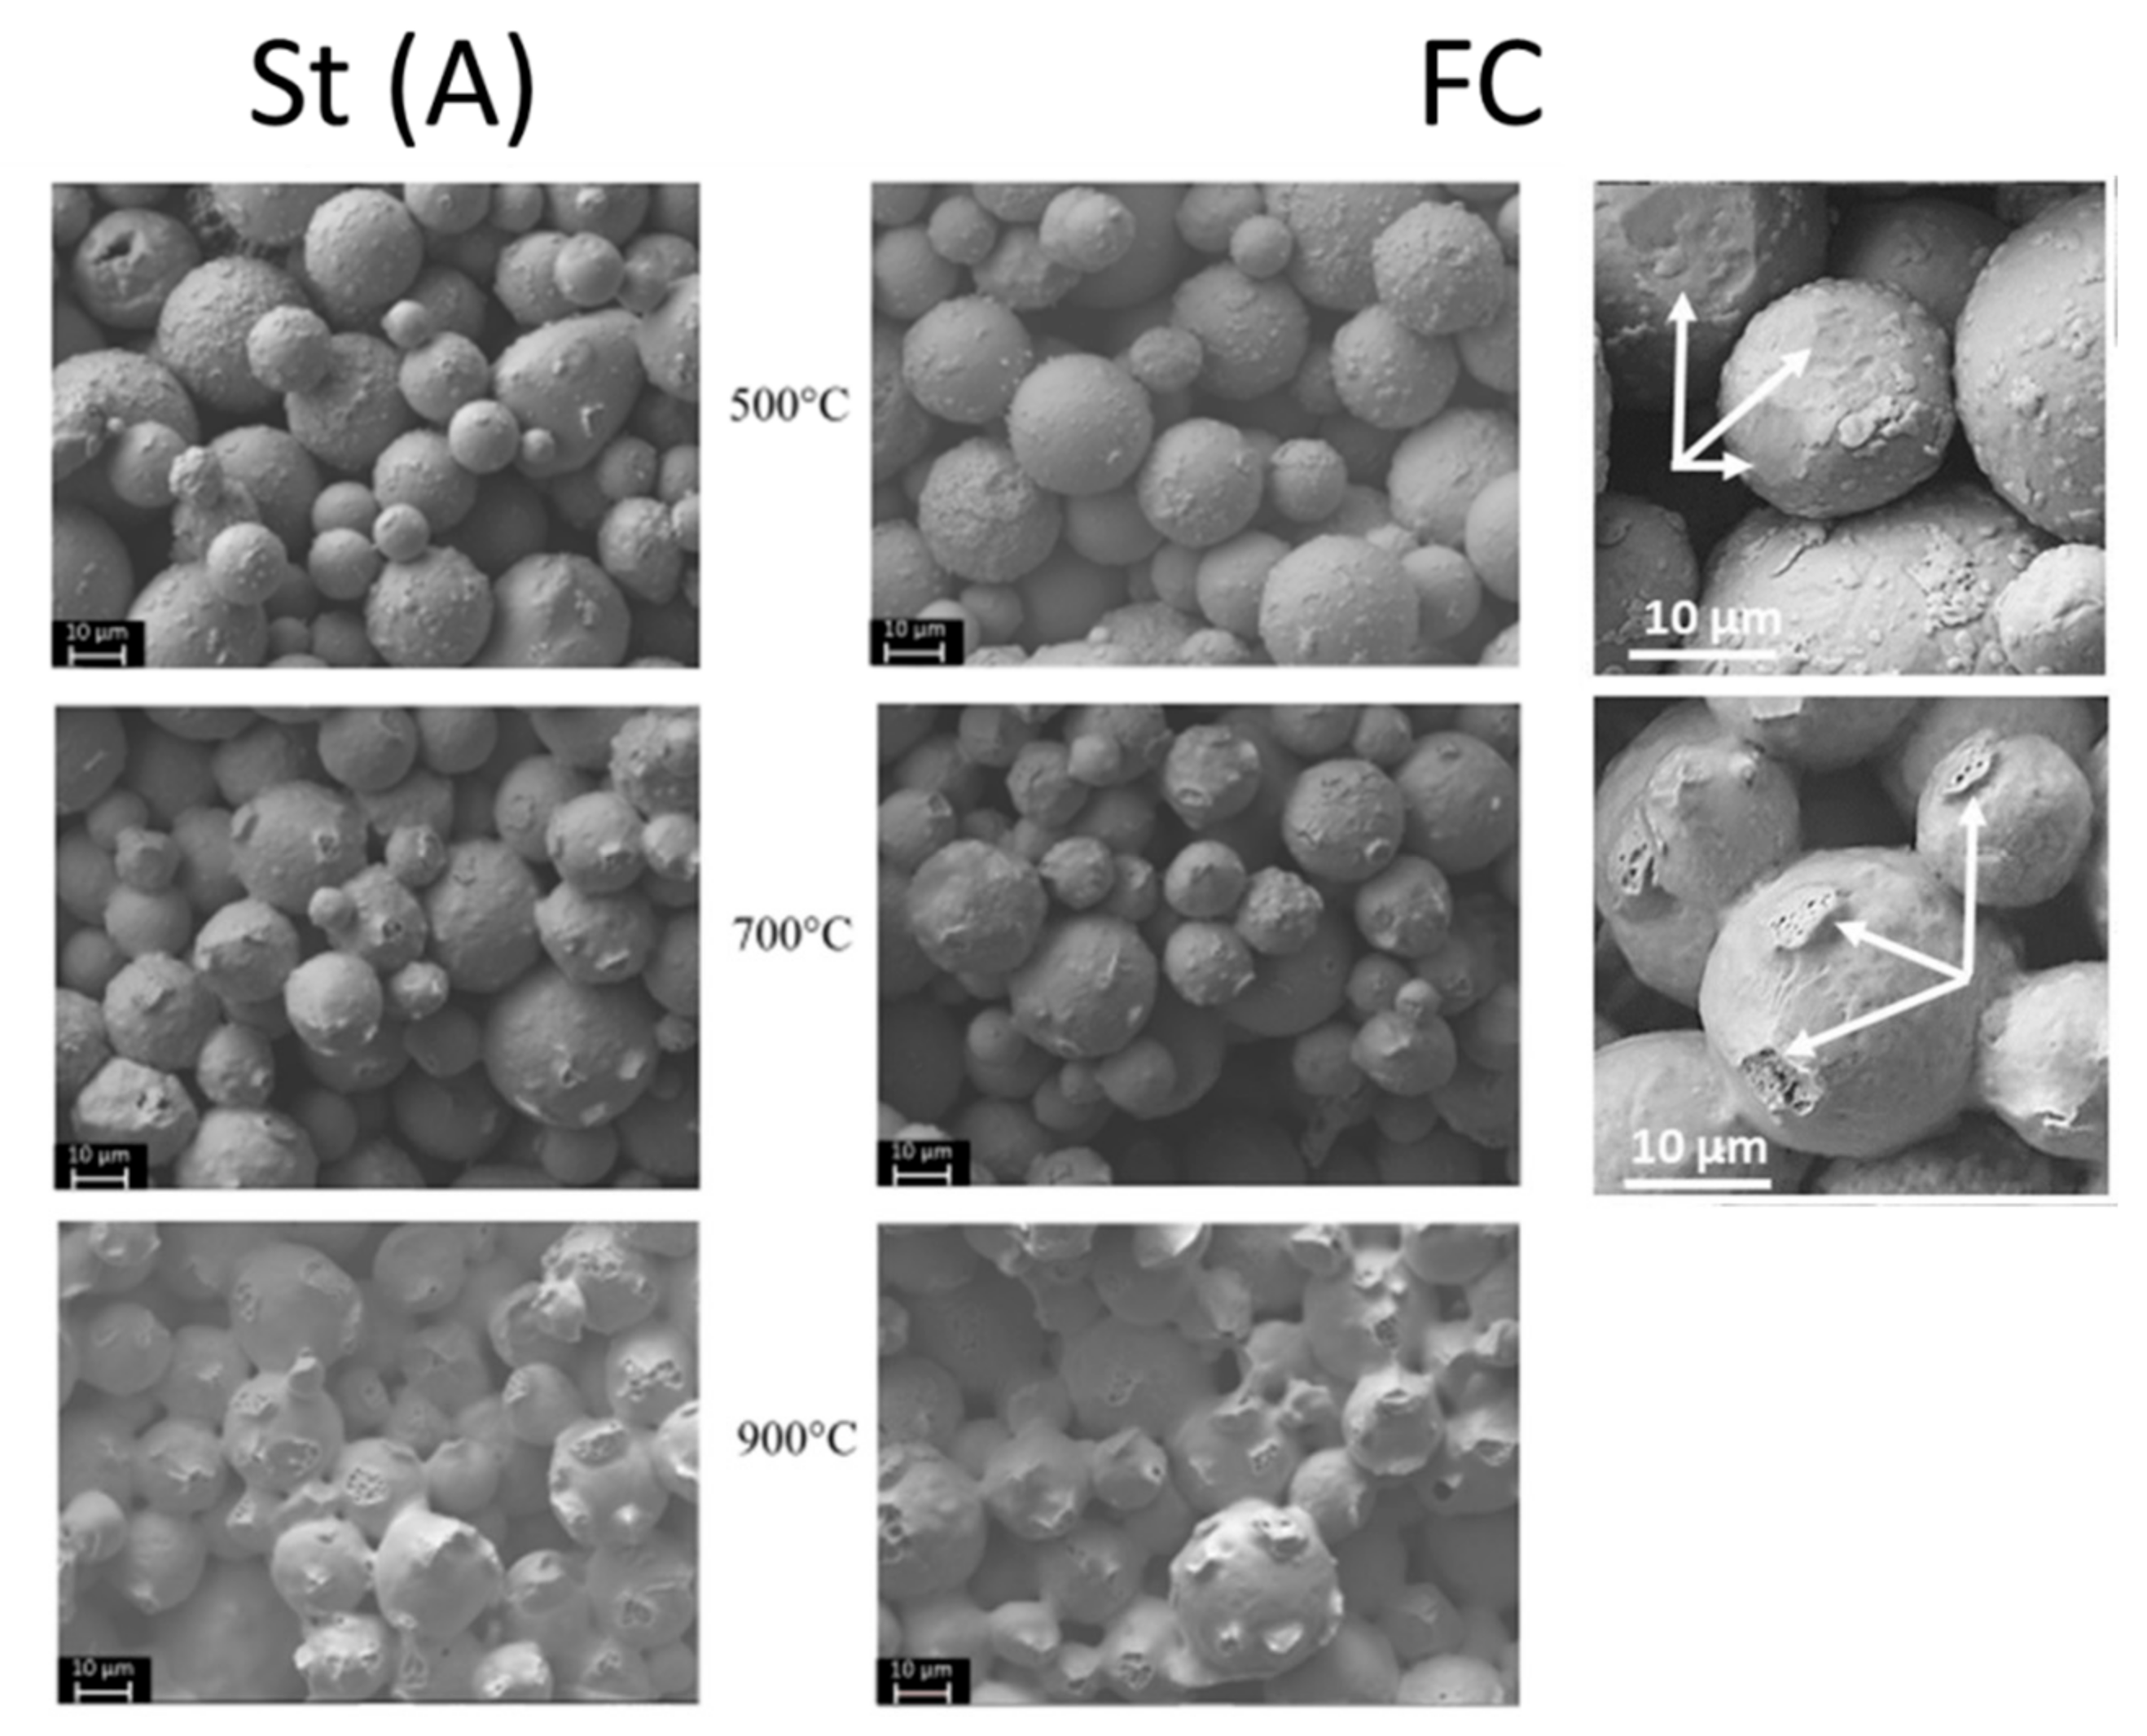
3.2. Comparison between Standard SPS (StA) and Forced Current (FC) Conditions
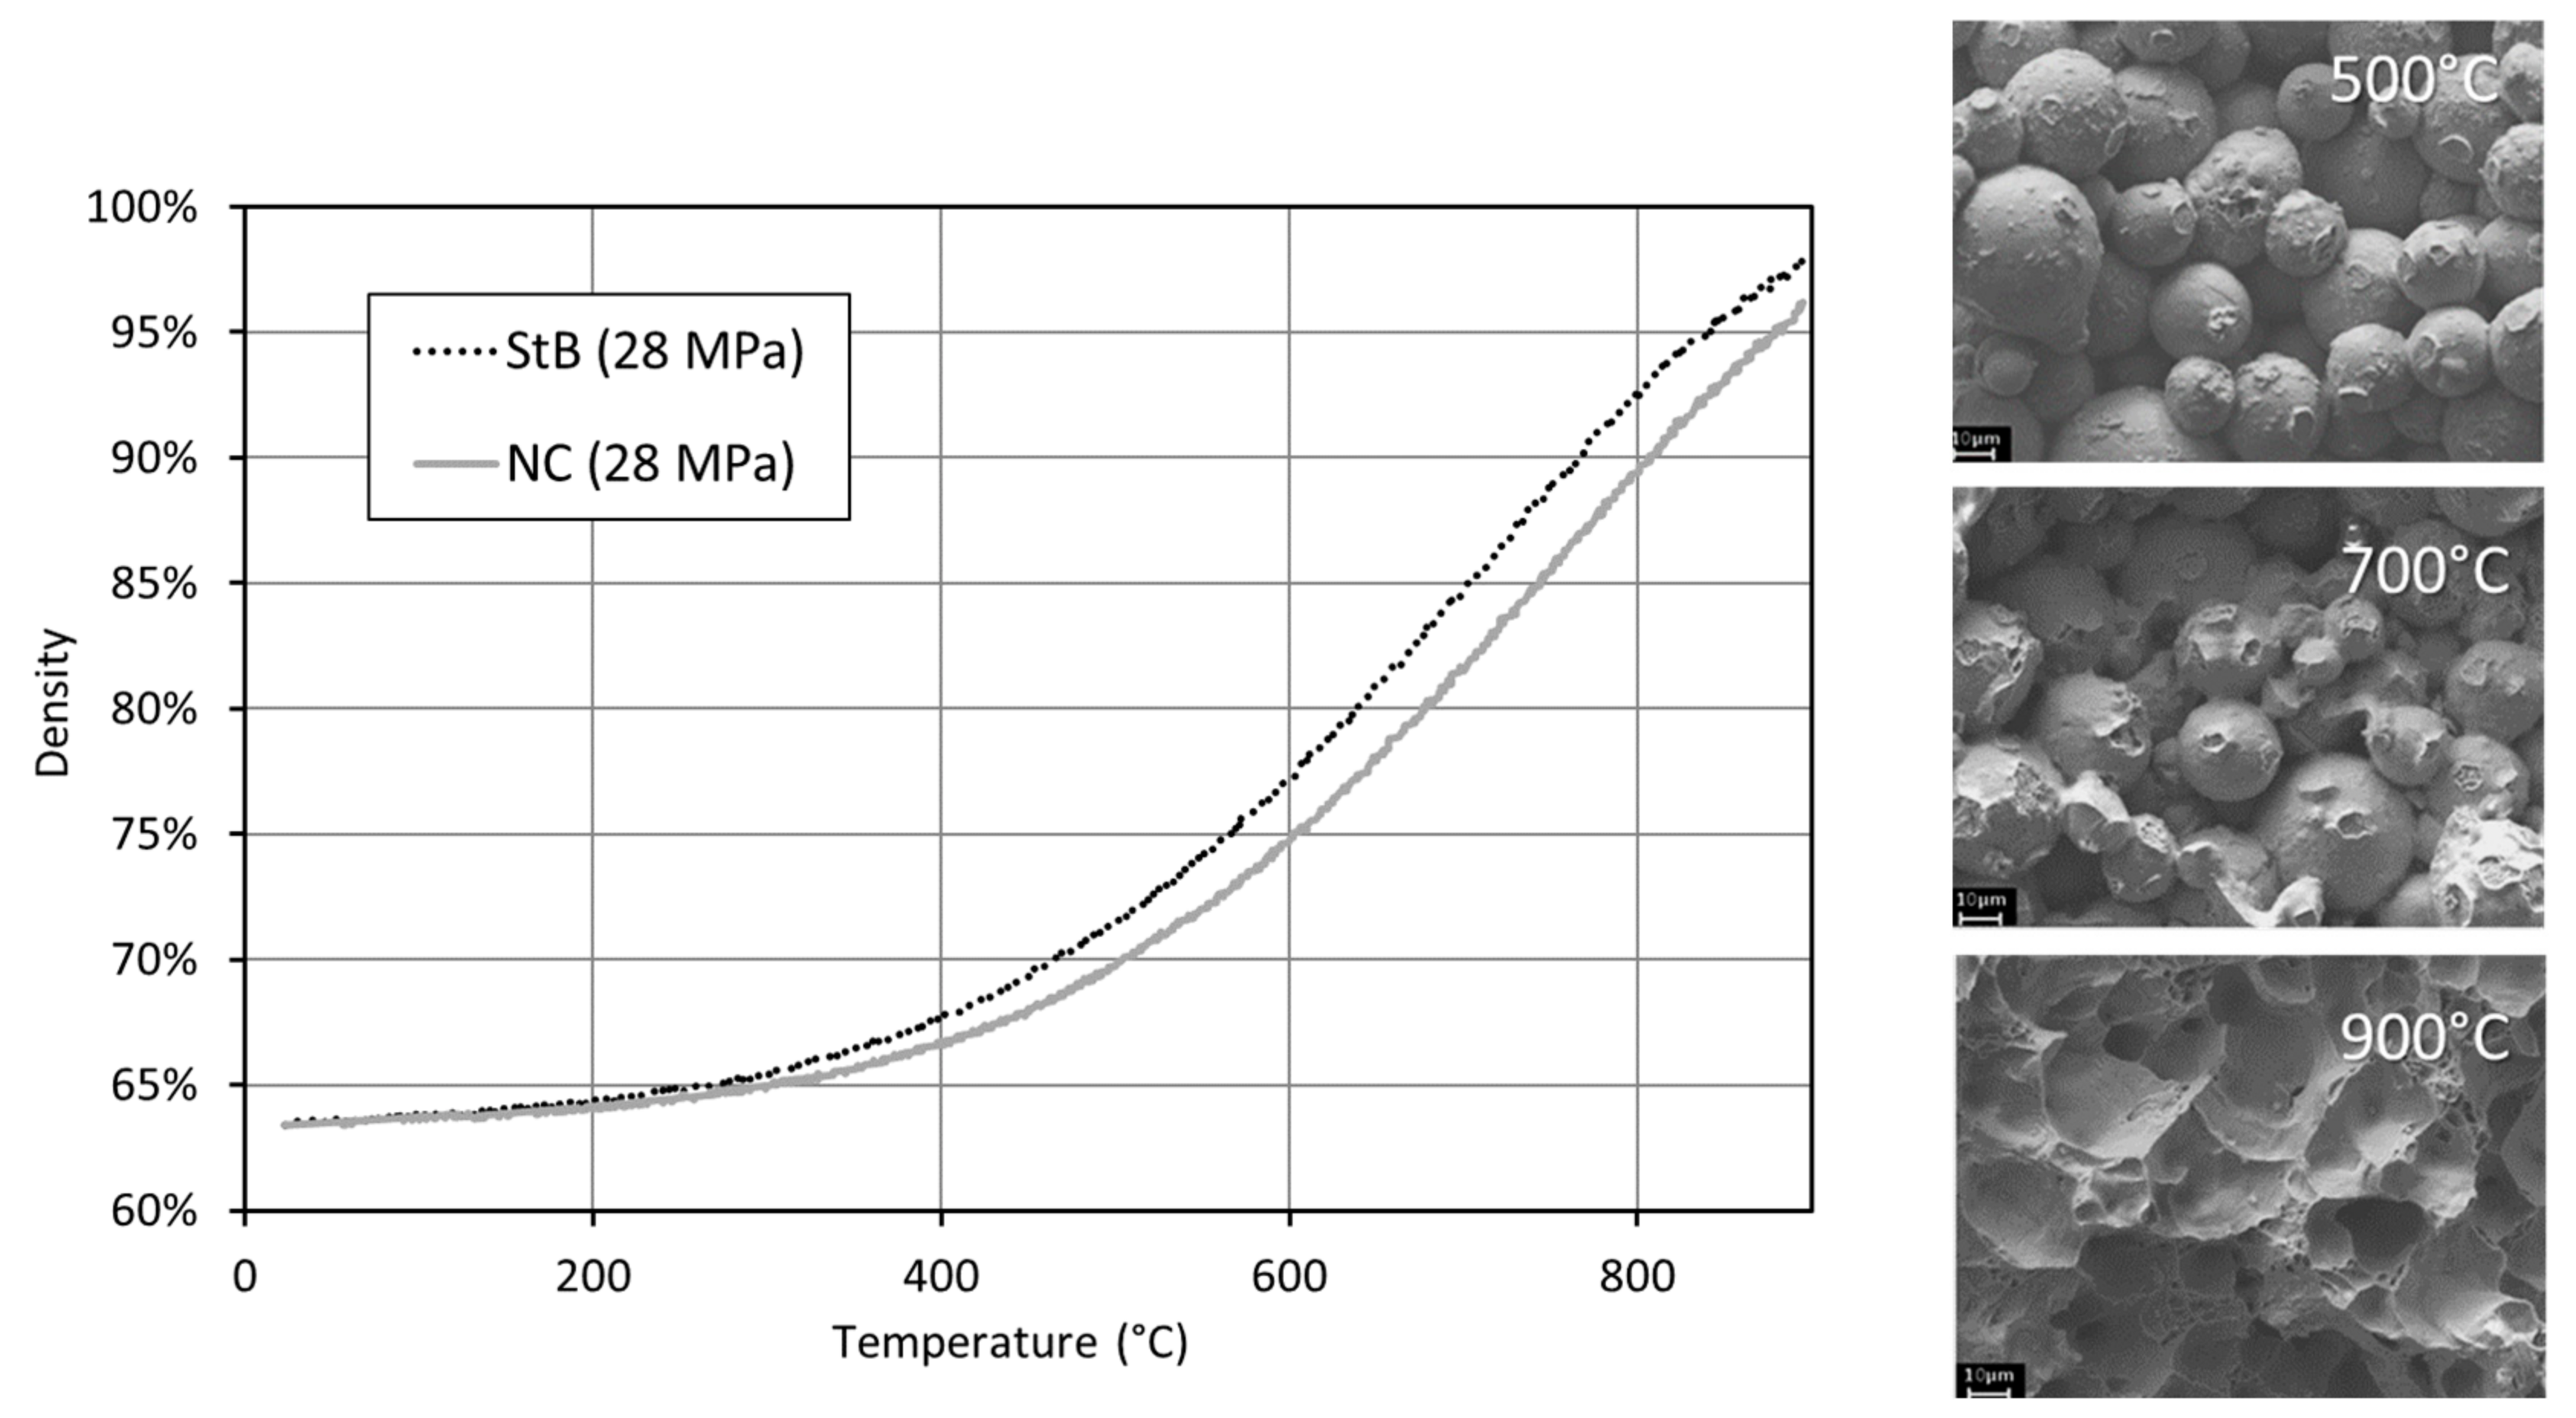
3.3. Comparison of Standard SPS (StB) and No Current (NC) Conditions
4. Discussion
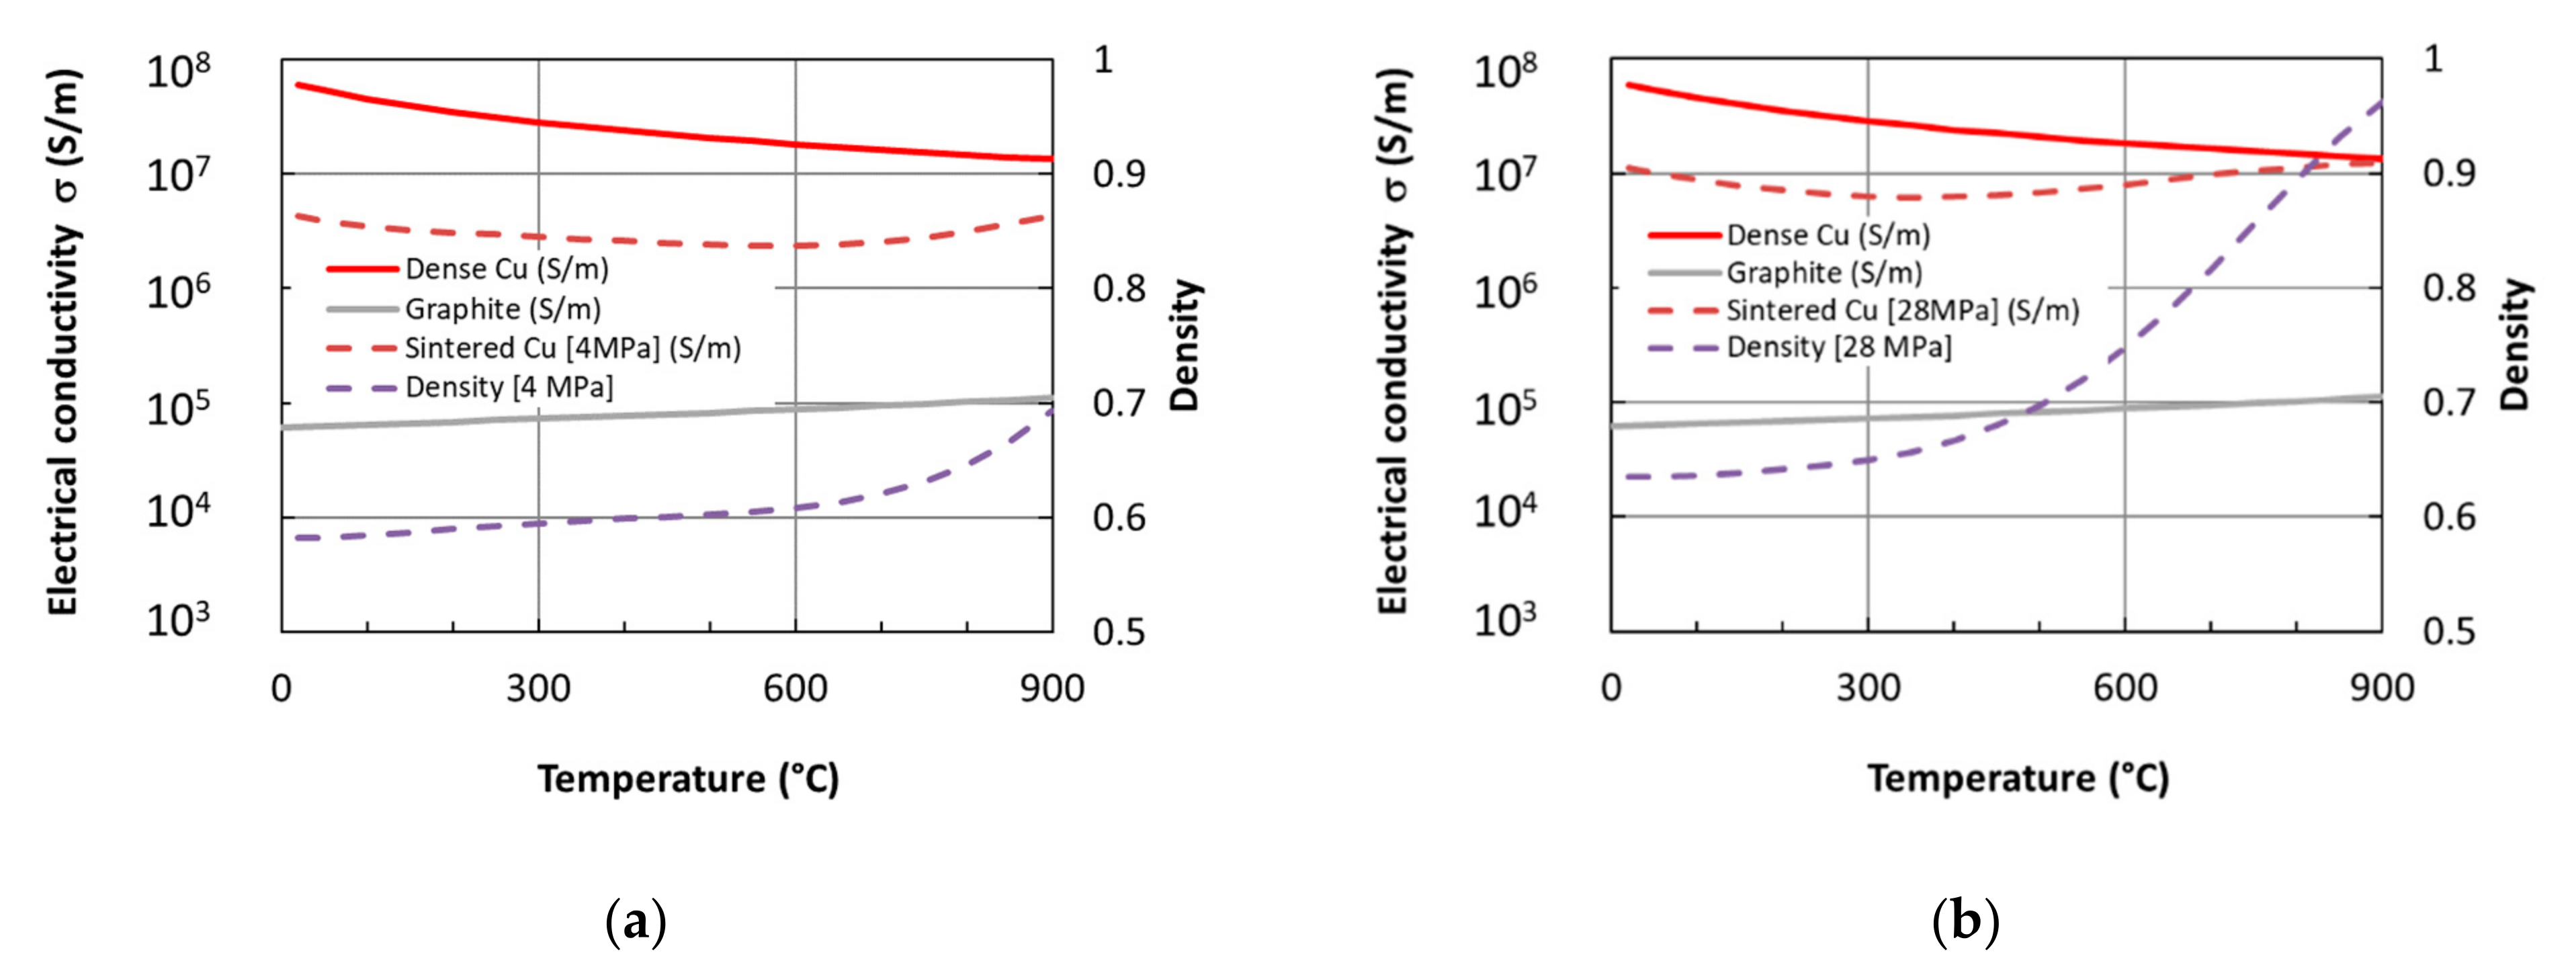
4.1. Electrical Conductivity throughout the SPS Process
- -
- From room temperature to around 450 °C, the sample conductivity decreases because the bulk conductivity decrease overrides the slow sintering processes. This estimation assumes that good conductivity contacts are formed, which is required for applying (2). At the very beginning of the SPS process, the powder conductivity is much lower, due to the abovementioned point;
- -
- Above 450 °C, the strong densification while the temperature is increasing leads to an increase in the effective electrical conductivity.
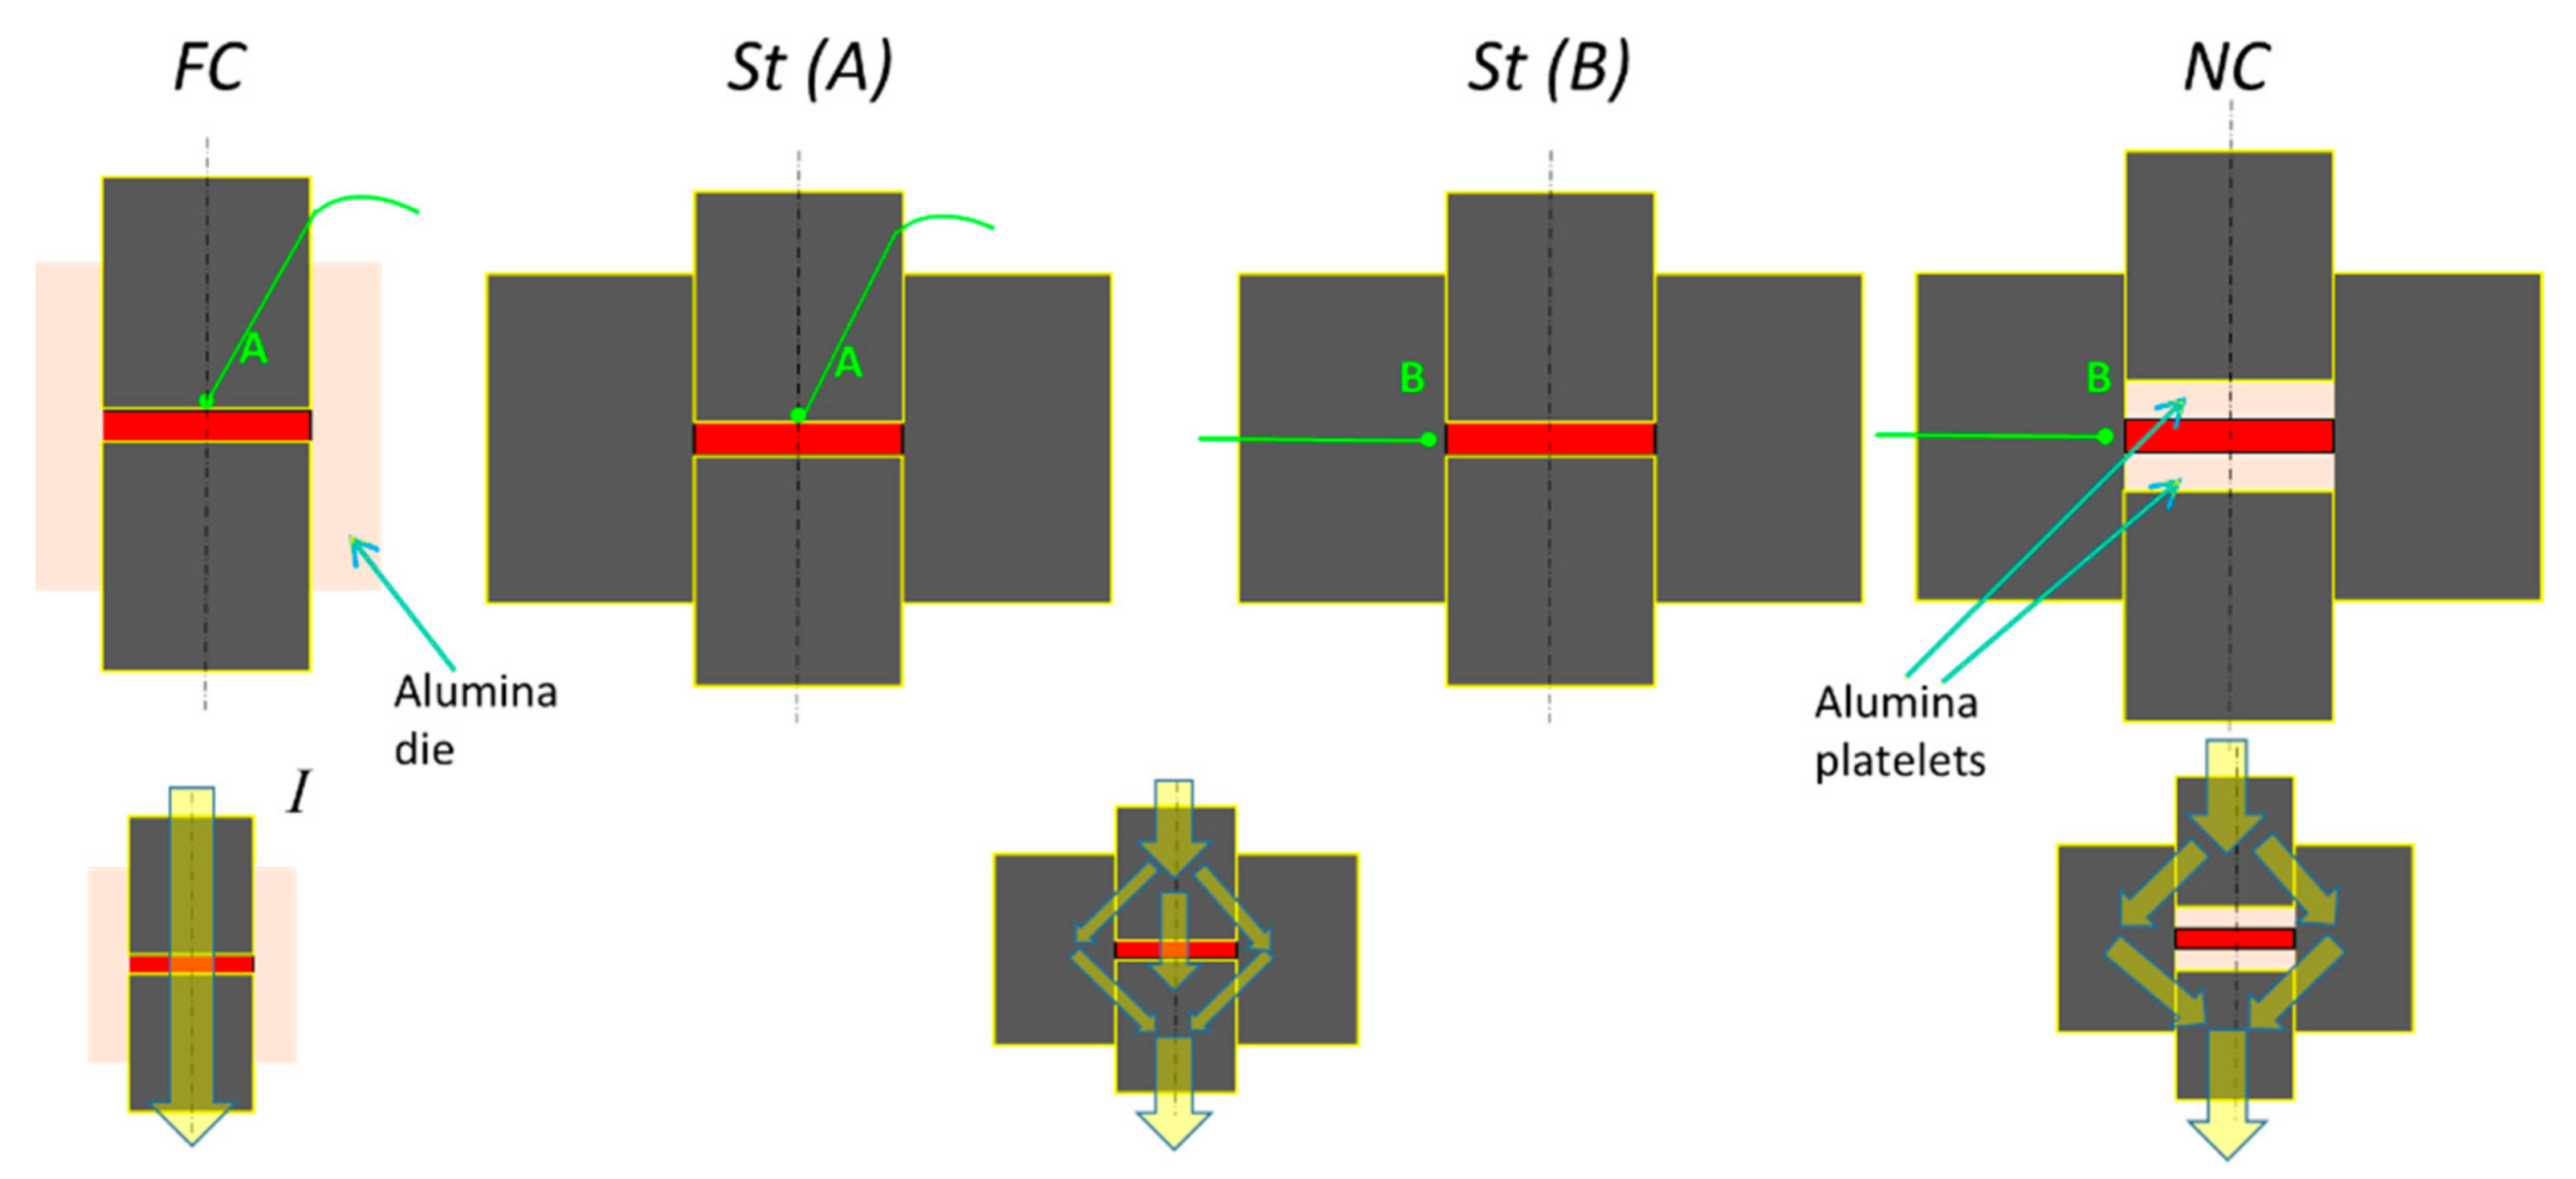
4.2. FEM Simulations of the Different Configurations
4.3. Simulations vs. Experimental Results
5. Conclusions
Author Contributions
Funding
Data Availability Statement
Acknowledgments
Conflicts of Interest
References
- Tokita, M. Trends in advance SPS Spark Plasma Sintering systems and technology. J. Soc. Powder Technol. Jpn. 1993, 30, 790–804. [Google Scholar] [CrossRef] [Green Version]
- Song, X.; Liu, X.; Zhang, J. Neck Formation and Self-Adjusting Mechanism of Neck Growth of Conducting Powders in Spark Plasma Sintering. J. Am. Ceram. Soc. 2006, 89, 494–500. [Google Scholar] [CrossRef]
- Diouf, S.; Fedrizzi, A.; Molinari, A. A fractographic and microstructural analysis of the neck regions of coarse copper particles consolidated by spark plasma sintering. Mater. Lett. 2013, 111, 17–19. [Google Scholar] [CrossRef]
- Zhang, Z.H.; Liu, Z.F.; Lu, J.F.; Shen, X.B.; Wang, F.C.; Wang, Y.D. The sintering mechanism in spark plasma sintering—Proof of the occurrence of spark discharge. Scripta Mater. 2014, 81, 56–59. [Google Scholar] [CrossRef]
- Aman, Y.; Garnier, V.; Djurado, E. Pressure-less spark plasma sintering effect on non-conventional necking process during the initial stage of sintering of copper and alumina. J. Mater. Sci. 2012, 47, 5766–5773. [Google Scholar] [CrossRef]
- Guyot, P.; Rat, V.; Coudert, J.F.; Jay, F.; Maître, A.; Pradeilles, N. Does the Branly effect occur in spark plasma sintering? J. Phys. D Appl. Phys. 2012, 45, 092001. Available online: https://iopscience.iop.org/article/10.1088/0022-3727/45/9/092001 (accessed on 1 November 2021). [CrossRef]
- Ratzker, B.; Sokol, M.; Kalabukhov, S.; Frage, N. Compression creep of copper under electric current studied by a spark plasma sintering (SPS) apparatus. Mater. Sci. Eng. A. 2018, 712, 424–429. [Google Scholar] [CrossRef]
- Collet, R.; Le Gallet, S.; Charlot, F.; Lay, S.; Chaix, J.M.; Bernard, F. Oxide reduction effects in SPS processing of Cu atomized powder containing oxide inclusions. Mater. Chem. Phys. 2016, 173, 498–507. [Google Scholar] [CrossRef]
- Hulbert, D.M.; Anders, A.; Andersson, J.; Lavernia, E.J.; Mukherjee, A.K. A discussion on the absence of plasma in spark plasma sintering. Scr. Mater. 2009, 60, 835–838. [Google Scholar] [CrossRef]
- Demuynck, M.; Erauw, J.P.; Van der Biest, O.; Delannay, F.; Cambier, F. Densification of alumina by SPS and HP: A comparative study. J. Eur. Ceram. Soc. 2012, 32, 1957–1964. [Google Scholar] [CrossRef]
- Medri, V.; Monteverde, F.; Balbo, A.; Bellosi, A. Comparison of ZrB2-ZrC-SiC Composites Fabricated by Spark Plasma Sintering and Hot-Pressing. Adv. Eng. Mater. 2005, 7, 159–163. [Google Scholar] [CrossRef]
- Bernard-Granger, G.; Addad, A.; Fantozzi, G.; Bonnefont, G.; Guizard, C.; Vernat, D. Spark plasma sintering of a commercially available granulated zirconia powder: Comparison with hot-pressing. Acta Mater. 2010, 58, 3390–3399. [Google Scholar] [CrossRef]
- Lee, G.; Olevsky, E.A.; Maniere, C.; Maximenko, A.; Izhvanov, O.; Back, C.; McKittrick, J. Effect of electric current on densification behavior of conductive ceramic powders consolidated by spark plasma sintering. Acta Mater. 2018, 144, 524–533. [Google Scholar] [CrossRef]
- Balbo, A.; Sciti, D. Spark plasma sintering and hot pressing of ZrB2–MoSi2 ultra-high-temperature ceramics. Mater. Sci. Eng. A. 2008, 475, 108–112. [Google Scholar] [CrossRef]
- Langer, J.; Hoffmann, M.J.; Guillon, O. Direct comparison between hot pressing and electric field-assisted sintering of submicron alumina. Acta Mater. 2009, 57, 5454–5465. [Google Scholar] [CrossRef]
- Trzaska, Z.; Bonnefont, G.; Fantozzi, G.; Monchoux, J.P. Comparison of densification kinetics of a TiAl powder by spark plasma sintering and hot pressing. Acta Mater. 2017, 135, 1–13. [Google Scholar] [CrossRef] [Green Version]
- Collet, R.; Le Gallet, S.; Lay, S.; Charlot, F.; Bonnefont, G.; Fantozzi, G.; Chaix, J.M.; Bernard, F. SPS Mechanisms in Spherical Copper Powders. In Proceedings of the Congress Proceedings from World PM2016 Congress & Exhibition, Hamburg, Germany, 9–13 October 2016. [Google Scholar]
- Saunders, T.; Grasso, S.; Reece, M.J. Plasma formation during electric discharge (50 V) through conductive powder compacts. J. Eur. Ceram. Soc. 2015, 35, 871–877. [Google Scholar] [CrossRef]
- Chaim, R. Densification mechanisms in spark plasma sintering of nanocrystalline ceramics. Mater. Sci. Eng. A. 2007, 443, 25–32. [Google Scholar] [CrossRef]
- Munir, Z.A.; Anselmi-Tamburini, U.; Ohyanagi, M. The effect of electric field and pressure on the synthesis and consolidation of materials: A review of the spark plasma sintering method. J. Mater. Sci. 2006, 41, 763–777. [Google Scholar] [CrossRef]
- Collet, R.; Le Gallet, S.; Naimi, F.; Charlot, F.; Bonnefont, G.; Fantozzi, G.; Chaix, J.M.; Bernard, F. Effect of current on the sintering of pre-oxidized copper powders by SPS. J. Alloys Compd. 2017, 692, 478–484. [Google Scholar] [CrossRef]
- Collard, C.; Trzaska, Z.; Durand, L.; Chaix, J.M.; Monchoux, J.P. Theoretical and Experimental Investigations of Local Overheating at Particle Contacts in Spark Plasma Sintering. Powder Technol. 2017, 321, 458–470. [Google Scholar] [CrossRef]
- Anselmi-Tamburini, U.; Gennari, S.; Garay, J.E.; Munir, Z.A. Fundamental investigations on the spark plasma sintering/synthesis process: II. Modeling of current and temperature distributions. Mater. Sci. Eng. A 2005, 394, 139–148. [Google Scholar] [CrossRef]
- Trapp, J.; Kieback, B. Fundamental principles of spark plasma sintering of metals: Part I—Joule heating controlled by the evolution of powder resistivity and local current densities. Powder Metall. 2019, 62, 297–306. [Google Scholar] [CrossRef]
- Minier, L.; Le Gallet, S.; Grin, Y.; Bernard, F. Influence of the current flow on the SPS sintering of a Ni powder. J. Alloys Compd. 2010, 508, 412–418. [Google Scholar] [CrossRef]
- Bruggemann, D.A.G. Calculation of Effective Constitutive Parameters of Heterogeneous Substances, I, Permittivity and Conductivity for Dilute Composite Mediums of Isotropic Substances. Ann. Phys. 1935, 24, 636–679. [Google Scholar]
- Argento, C.; Bouvard, D. Modeling the effective thermal conductivity of random packing of spheres through densification. Lnt. J. Heat Mass Transfer. 1996, 39, 1343–1350. [Google Scholar] [CrossRef]
- Lide, D.R. CRC Handbook of Chemistry and Physics, 64th ed.; Lide, D.R., Ed.; CRC Press: Boca Raton, FL, USA, 2004. [Google Scholar]


| Configuration | Thermocouple Location | Pressure P (MPa) | Final Height Lf (mm) | Initial Density d0 (%) | Final Density df (%) | Shrinkage ΔL/L0 (%) |
|---|---|---|---|---|---|---|
| Punch (A) | 4 | 4.83 | 60.6 | 76.4 | 20.7 |
| Punch (A) | 4 | 4.90 | 58.2 | 73.6 | 20.8 |
| Die (B) | 4 | 3.62 | 58.5 | 72.6 | 19.4 |
| Die (B) | 4 | 3.90 | 58.7 | 69.8 | 16 |
| Die (B) | 28 | 3.40 | 63.1 | 97.3 | 35.1 |
| Die (B) | 28 | 3.44 | 63.4 | 96 | 34 |
| Configuration | Standard SPS (St) 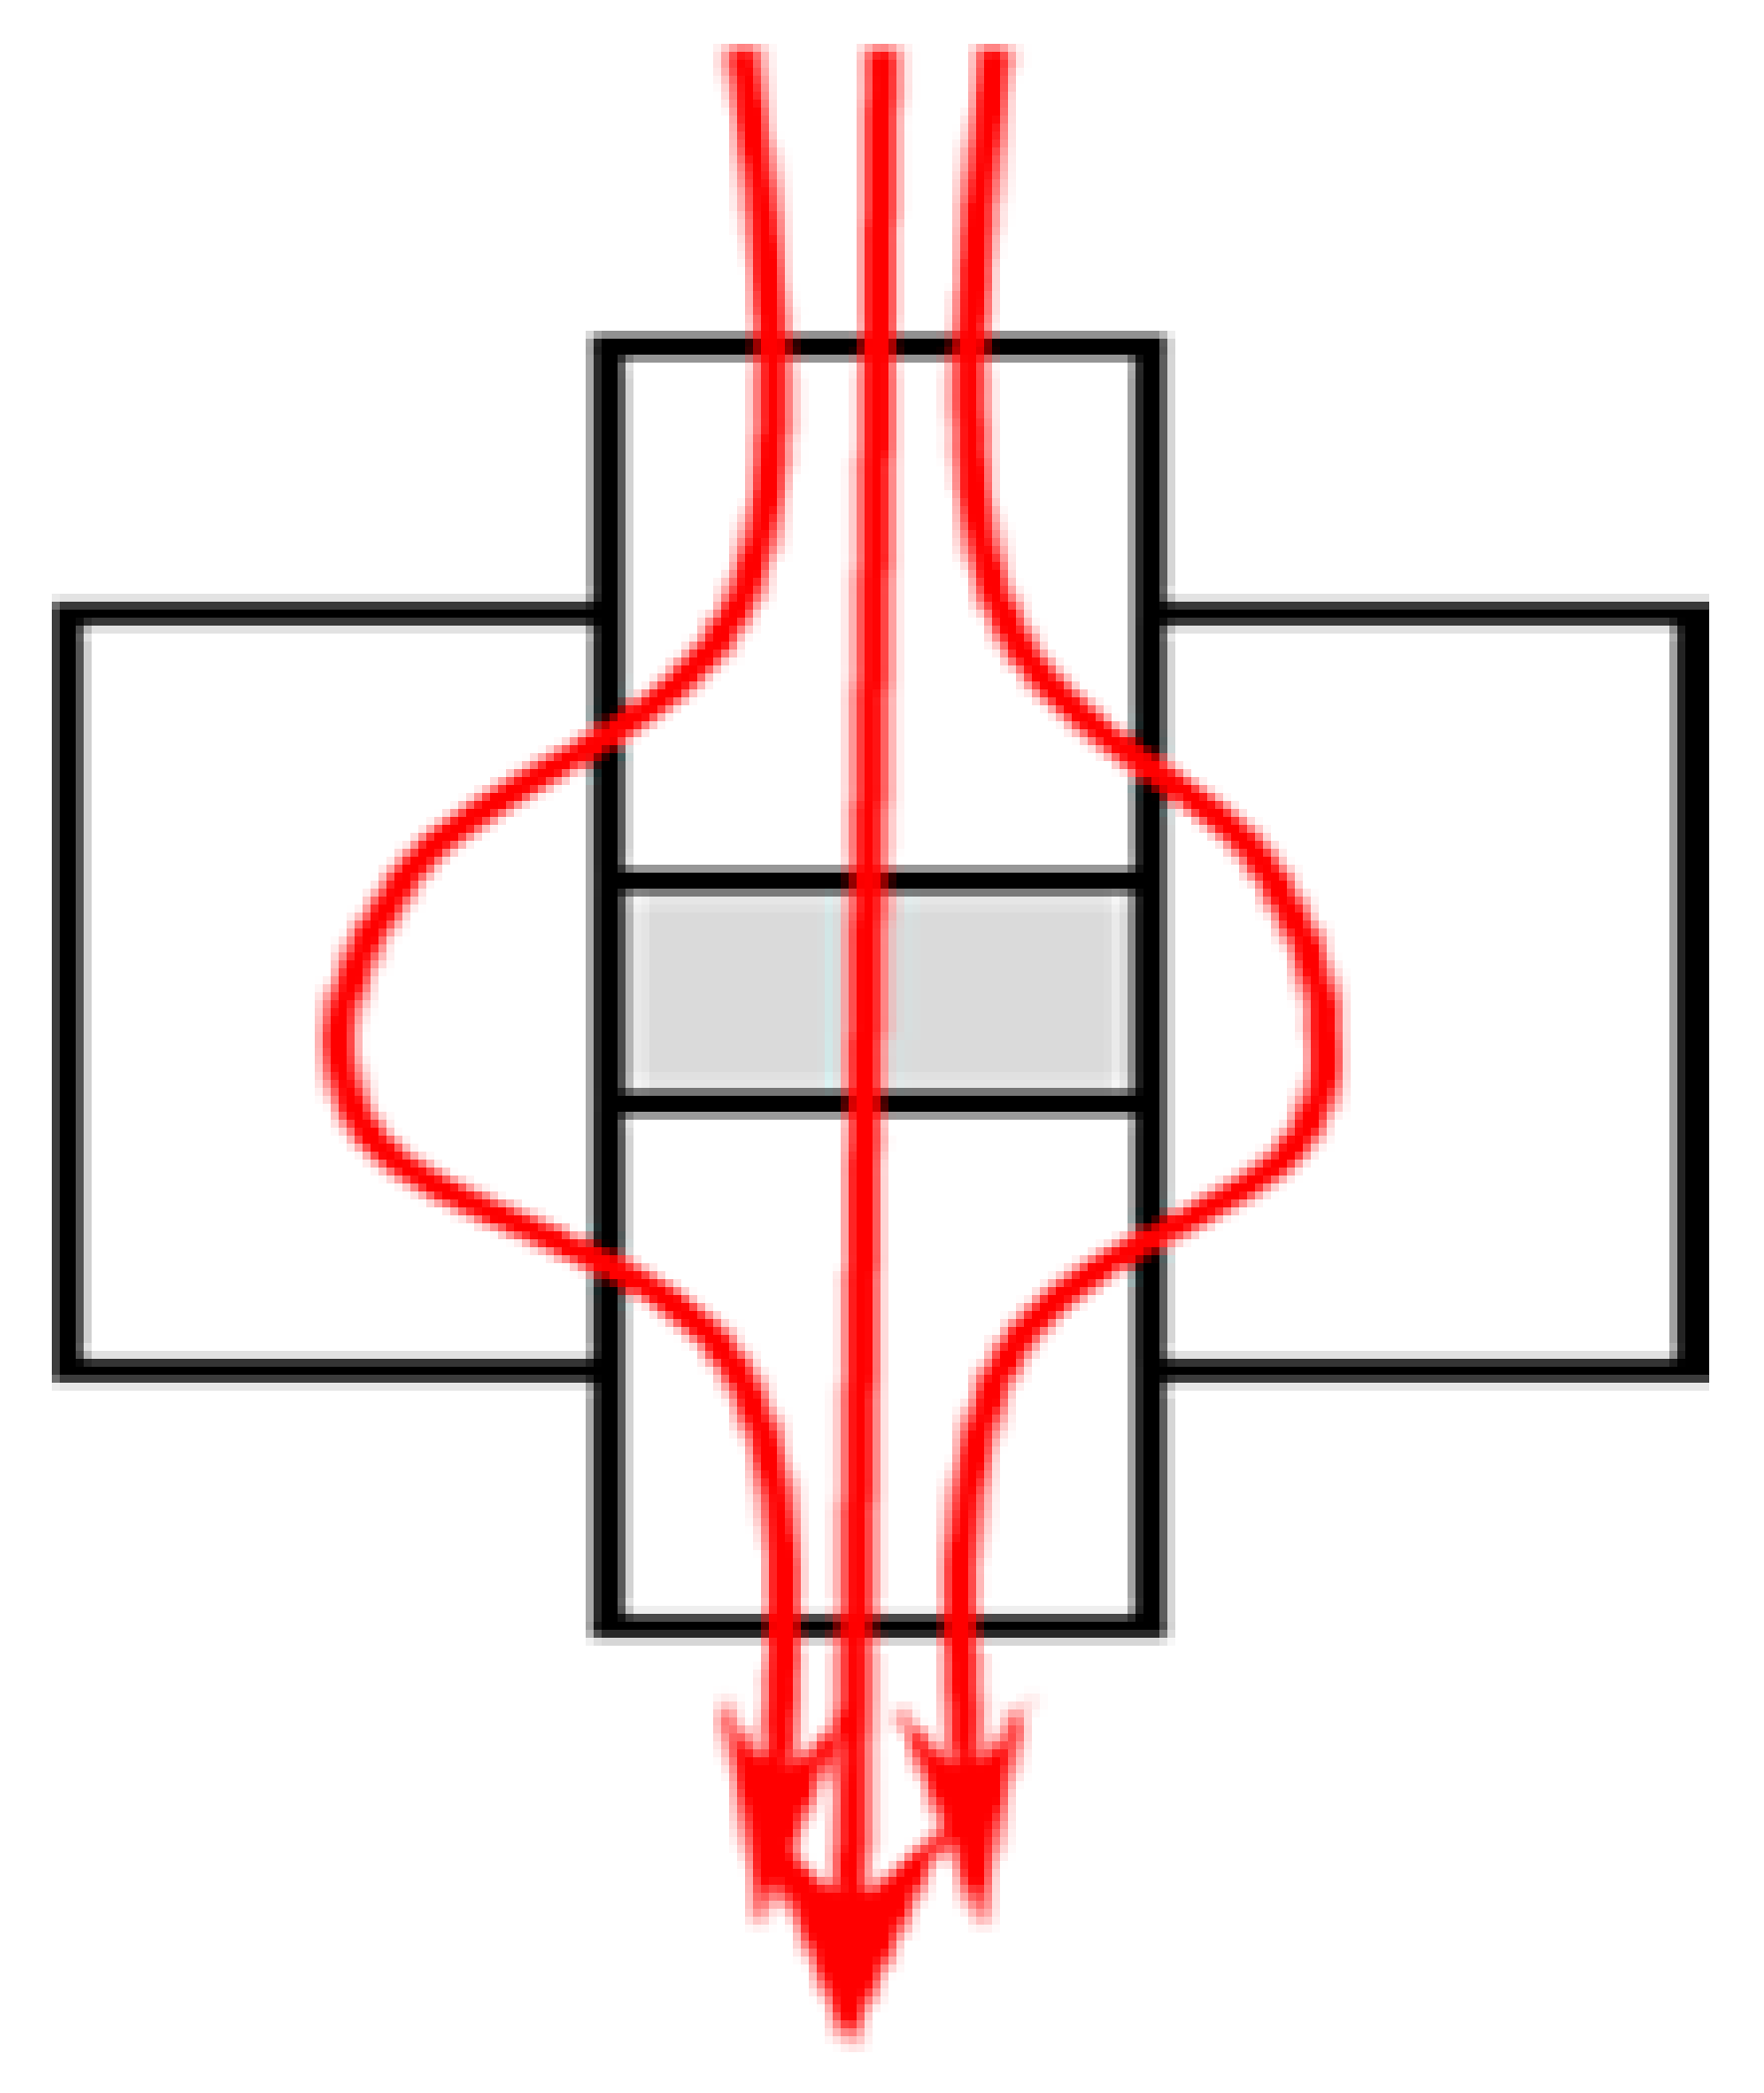 | Forced Current (FC)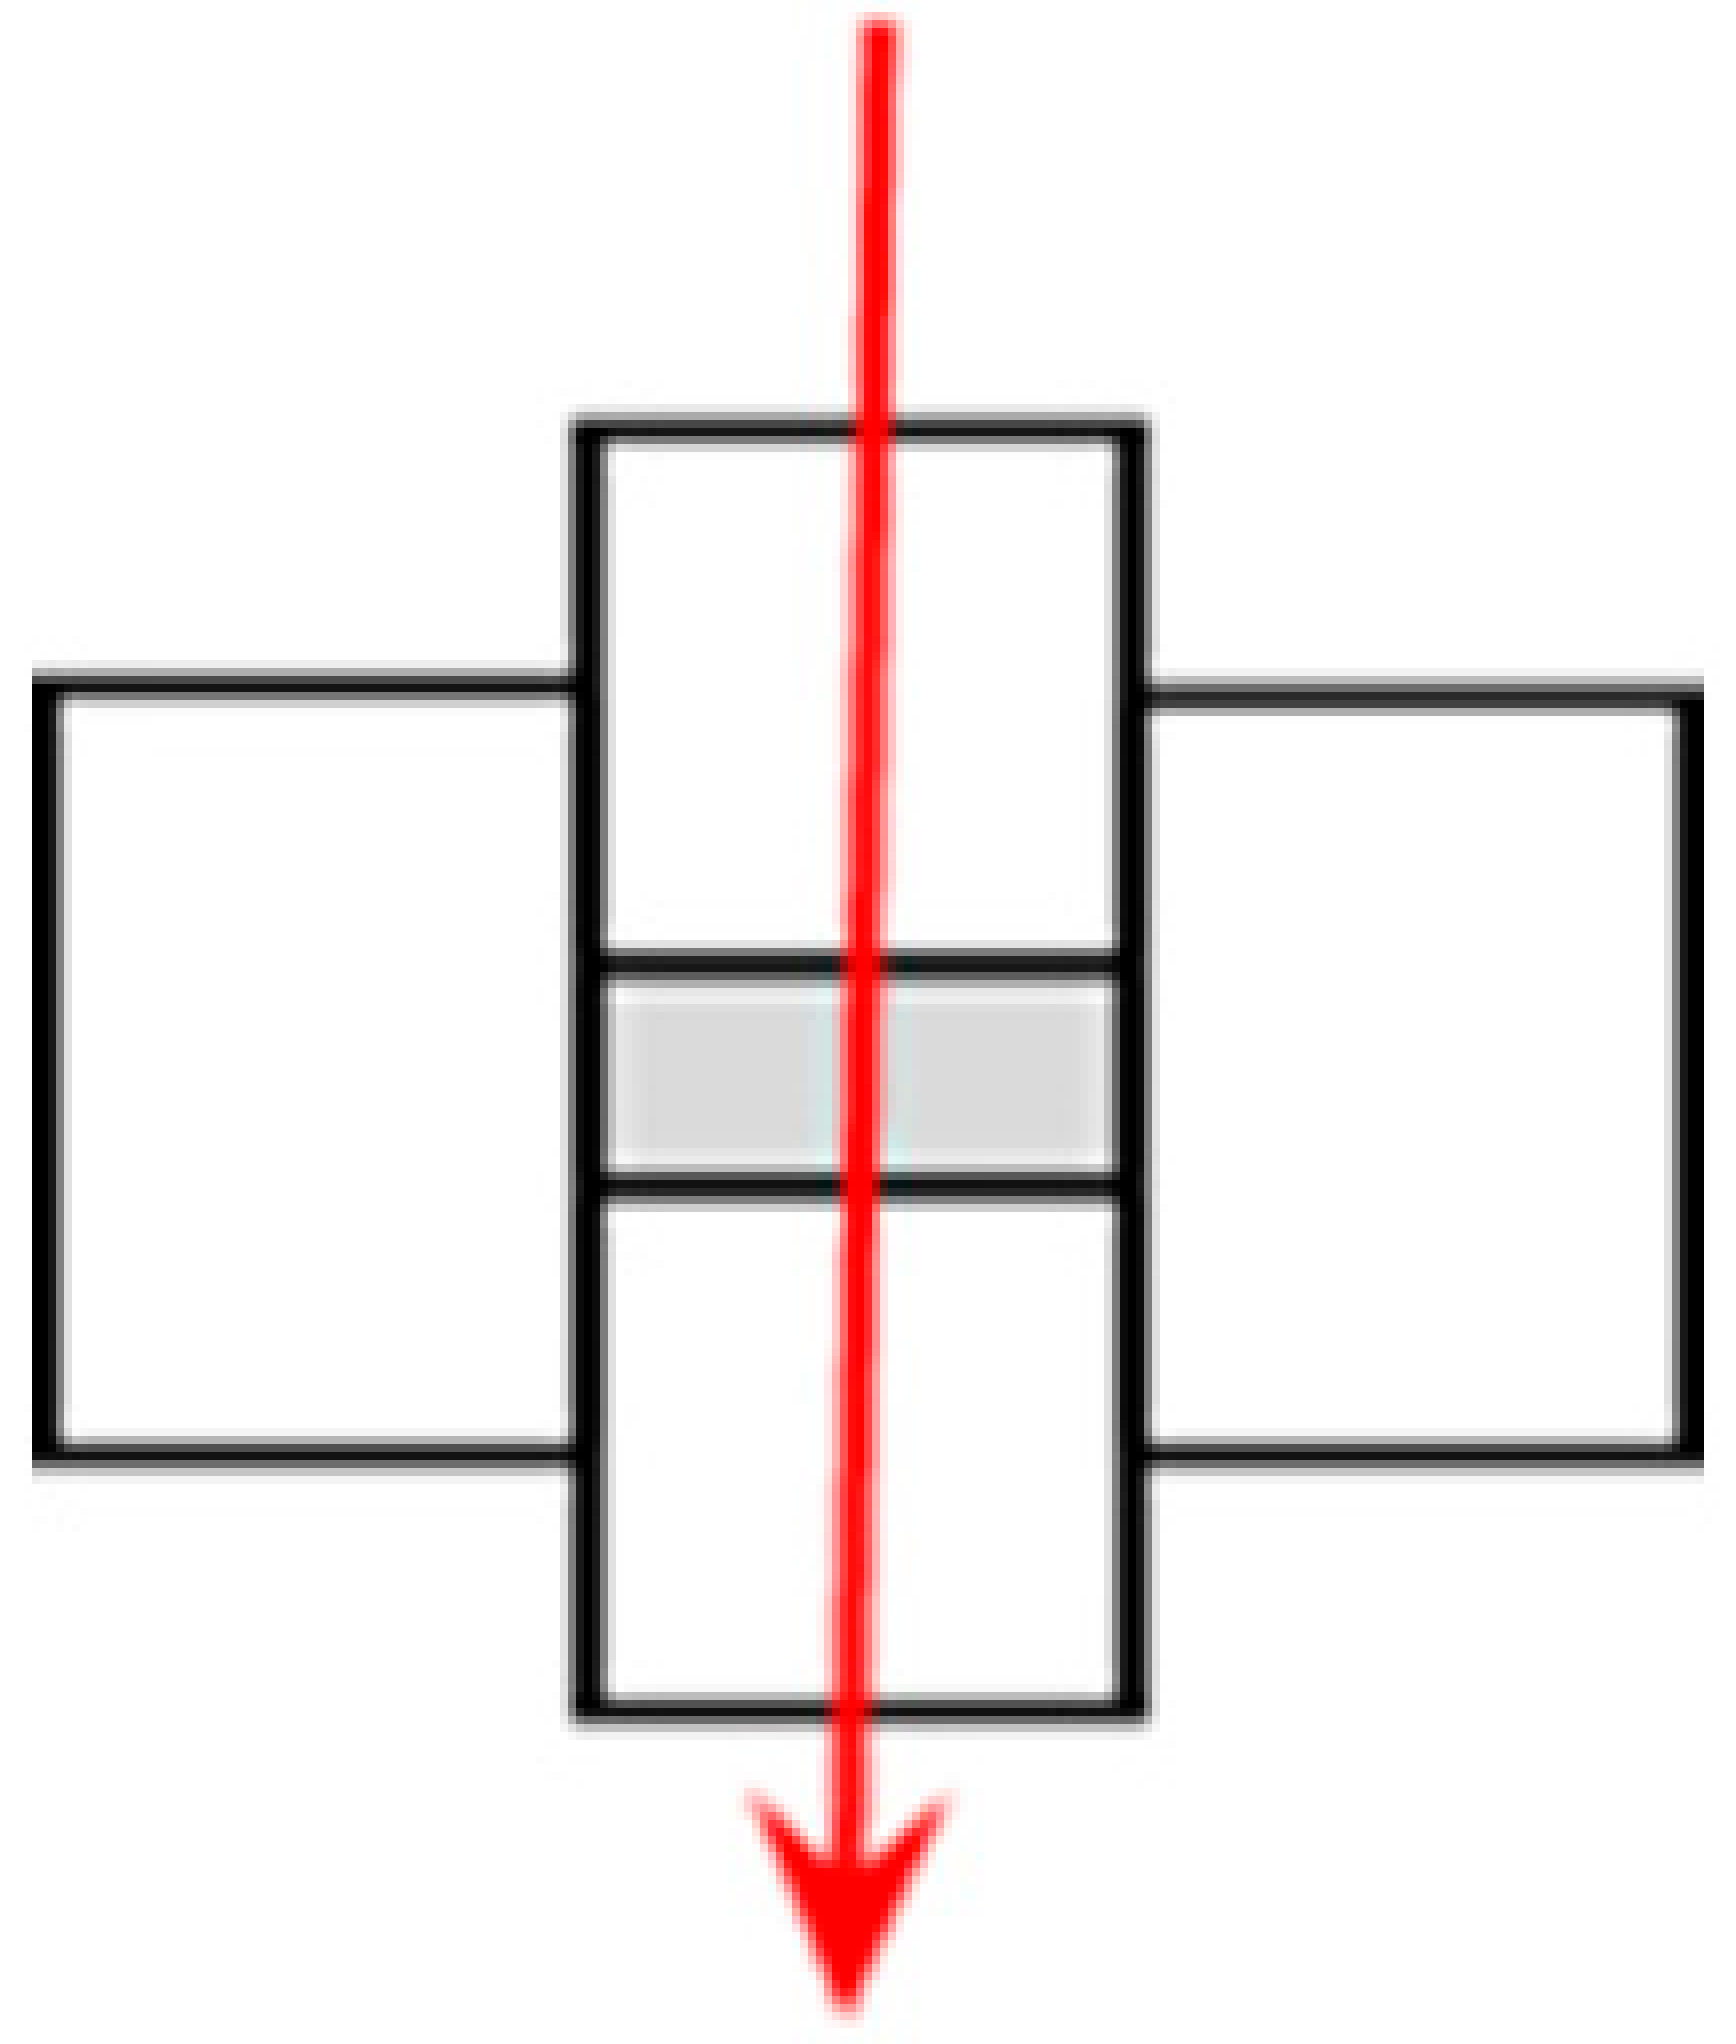 | No Current (NC)  |
|---|---|---|---|
| 28% | 100% | 1% | |
| 410 | 130 | 1250 | |
| −360 | −110 | −1000 |
Publisher’s Note: MDPI stays neutral with regard to jurisdictional claims in published maps and institutional affiliations. |
© 2021 by the authors. Licensee MDPI, Basel, Switzerland. This article is an open access article distributed under the terms and conditions of the Creative Commons Attribution (CC BY) license (https://creativecommons.org/licenses/by/4.0/).
Share and Cite
Collet, R.; Le Gallet, S.; Charlot, F.; Lay, S.; Chaix, J.-M.; Bernard, F. Effect of Electric Current on SPS Densification of Spherical Copper Powder. J. Manuf. Mater. Process. 2021, 5, 119. https://doi.org/10.3390/jmmp5040119
Collet R, Le Gallet S, Charlot F, Lay S, Chaix J-M, Bernard F. Effect of Electric Current on SPS Densification of Spherical Copper Powder. Journal of Manufacturing and Materials Processing. 2021; 5(4):119. https://doi.org/10.3390/jmmp5040119
Chicago/Turabian StyleCollet, Romaric, Sophie Le Gallet, Frédéric Charlot, Sabine Lay, Jean-Marc Chaix, and Frédéric Bernard. 2021. "Effect of Electric Current on SPS Densification of Spherical Copper Powder" Journal of Manufacturing and Materials Processing 5, no. 4: 119. https://doi.org/10.3390/jmmp5040119