
Moving toward Smart Manufacturing with an Autonomous Pallet Racking Inspection System Based on MobileNetV2


School of Computing and Engineering, University of Huddersfield, Queensgate, Huddersfield HD1 3DH, UK
*
Author to whom correspondence should be addressed.
J. Manuf. Mater. Process. 2022, 6(4), 75; https://doi.org/10.3390/jmmp6040075
Submission received: 26 May 2022
/
Revised: 29 June 2022
/
Accepted: 4 July 2022
/
Published: 8 July 2022
Abstract
:Pallet racking is a fundamental component within the manufacturing, storage, and distribution centers of companies around the World. It requires continuous inspection and maintenance to guarantee the protection of stock and the safety of personnel. At present, racking inspection is manually carried out by certified inspectors, leading to operational down-time, inspection costs and missed damage due to human error. As companies transition toward smart manufacturing, we present an autonomous racking inspection mechanism using a MobileNetV2-SSD architecture. We propose a solution that is affixed to the adjustable cage of a forklift truck, enabling adequate coverage of racking in the immediate vicinity. Our proposed approach leads to a classifier that is optimized for deployment onto edge devices, providing real-time alerts of damage to forklift drivers, with a mean average precision of 92.7%.
1. Introduction
Smart Manufacturing also known as Industry 4.0 is the coined term for referring to manufacturing facilities that are fully integrated, collaborative, and able to action on data in real time. Looking deeper into the concept at a production floor level, we find that the automation of specific tasks leads to the generation of data; this data, facilitated by communication protocols is collected, processed, and then actioned upon. The collection and actioning of the data and its ability to provide interconnectedness between the different operations within the facility and beyond is concisely known as Smart Manufacturing. This research focuses on the initial part of this hierarchy, that is the need for automation of a particular process.
Warehouses, distribution centers, and storage sites have a common storage infrastructure that is critical to the daily operation of their respective businesses, known as pallet racking. Racking allows businesses to store their stock in a secure and accessible manner. Such infrastructure also presents potential safety hazards. Damaged racking can lead to spoiled stock, injured employees, and also loss of life, particularly if the racking subsequently collapses. There are two major causes that can lead to racking collapsing. The first is a result of incorrect installation of racking. This can lead to an accumulation of stress within the racking over time as stock is loaded onto it. The second is a result of careless operation of forklifts whilst loading on/from racking. In this case, the driver may unintentionally damage the racking through impact whilst trying to pick or place stock with a forklift. This damage can remain unnoticed for long periods of time, leading to an accumulation of stress damage, until the racking fails completely. This paper focuses on the timely detection of the latter type of damage through the use of computer vision-based algorithms.
1.1. Literature Review
At present there is a dearth of literature examining the use of deep learning for racking inspection. We have broadened our literature search to include related work in the use of computer vision for structural health monitoring.
Chuan-Zi Dong et al. [1] provides a review of computer vision (CV) techniques and applications for structural health monitoring (SHM). He starts by categorizing SHM into two distinct groups: local and global. In the former category he identifies use cases such as crack, delamination, and loose bolt detection. The global group includes placement measurement, structural behavior analysis, vibration serviceability, modal identification, and damage detection. The author concludes that CV-SHM requires high quality data to provide fruitful results. In many applications the scale of data required to train the model can be huge. The lack of data acquisition setups referring to image data within the manufacturing industry can be highlighted as one of the major constraints for the slow growth of CV within this industry.
Hong-Hu Zhu et al. [2] reviewed image processing techniques adapted by researchers for CV-SHM applications. They author presents, the “inherent distinctive” advantages of CV-SHM as non-contact, long distance, electromagnetic inferences, and multiple object detection. Discussing the constraints of the technology and its applications, the author explains how most of the work around CV-SHM is limited to laboratories. He argues due to this “constrained-environment” testing, that trained models have a higher risk of failing in production owing to complicated site conditions. In our research we address this issue by training our models on data originating directly from the production facility. Furthermore, once the model is trained, testing is not constrained to the software realm, but rather we deploy our model to a hardware device and conduct inferences in production without specifying any test rig. The author also highlights another adverse effect as data quality issues, such as environmental lighting and ground variations. Our research proves how this no longer is a major issue in the field of CV due to the introduction of “data augmentation” techniques. However, our research also provides evidence of diminishing model accuracy due to random data augmentation without domain knowledge.
Taking a deeper look into the backend infrastructure of computer vision, we find the recent and rapid development of deep learning techniques in particular convolutional neural networks (CNN) combined with transfer learning have been major contributors in delineating CV. AlexNet [3], was developed by Hinton and team in 2012, introducing a graphics processing unit (GPU) to accelerate calculations. To increase the speed of model convergence, the team implemented a rectified linear activation function (ReLU). Over the last decade, myriad of state-of-the-art CNN networks have been developed by GoogleNet [4], VGGNet [5], R-CNN [6], Fast R-CNN [7], Faster R-CNN [8]. The motive behind the development of all these algorithms was to continuously improve the level of accuracy in object detection.
The above models are widely implemented in certain industries such as medicine [9,10,11], and autonomous vehicles [12,13,14,15,16]. However, their use is mostly limited to R&D in many businesses. A similar trend is also seen in the manufacturing industry [17]. The lack of device deployment within production is due to the fact that all algorithms mentioned above demand a significant amount of computational resources [18]. Therefore, in most cases they reside in the cloud and data are transferred from the production facility to the cloud for inferences based on which an action may be triggered. With the continuous evolvement of IoT, Industry 4.0 and GDPR [19], in general, businesses are more vigilant to the issue of data security. This has given rise to edge device deployments, where internet connectivity may not be required making the system less vulnerable to attack.
Developers across the deep learning domain have been working on addressing the challenges of deploying computer vision models on edge devices. Two algorithms, Single Shot Detector (SSD MobileNets) [20] and You Only Look Once (YOLO), are lightweight with considerations given to speed and accuracy on edge devices. Researchers are continuously improving the architecture of these models with the fifth version of YOLO introduced in April 2021, YOLOv5 [21].
Dhiraj et al. [22], present a 1-D CNN-based architecture for the detection and classification of bearing faults on time-series data. The research is based on four different datasets with the aim to provide a computationally light-weight solution to problem. The work compares the feature extraction capabilities of the proposed 1-D convolutional network with a 2-D network via sensitivity analysis achieving an accuracy in the range of 99.34–99.49% as compared to 97.74% for the 2-D CNN. The authors present their contribution as a computationally inexpensive solution and an alternative to the computationally intensive bearing fault detection processes found in the industry.
Venkat Anil et al. [23], proposed a YOLOv2 object detection model for the inspection of printed circuit boards (PCB). The model was trained on 11,000 images annotated by domain experts, achieving a detection accuracy of 98.79%. Although, the accuracy is very impressive for a defect detection model, the author does not carry out any data augmentation techniques in order to introduce more variance and cater for environmental and site-specific condition at the manufacturing site, such as dim lightning, various production line configurations. In our research, we propose domain-specific augmentations to be applied to datasets in the absence of large amounts of data for improved generalization.
Yiting Li et al. [24], proposed a MobileNet-SSD model for real-time accurate detection of surface defects such as breaches, dents, and abrasions on sealing surfaces of a container. The author presents a two-stage data pre-processing and augmentation process, however, the relationship between selected augmentations and ground floor reality is not explicit. Furthermore, results show the model was able to detect all types of “breach” defect class. However, other classes had a noticeable reduction in detection accuracy with “dent” only being detected with an accuracy of 90%. The author justifies this by explaining that the “dent” class was much harder to visualize with the human eye, which in turn makes it difficult for the model to detect.
Fahimeh Farahnakian et al. [25], present the only available research literature found to directly focus on the implementation of automated pallet racking inspection (2021). The authors collect their own racking data, after acknowledging that no racking data were publicly available. The authors chose to take the image segmentation approach rather than the popular object detection for localization and defect classification. The authors select the Mask-RCNN architecture with ResNet-101 as the backbone for feature extraction. The report network performance achieves mean-average-precision (MAP) of 93.45% at Intersection over Union (IoU) of 50%. However, the selection of image segmentation adds additional processing and computational load into the workflow, rendering deployment onto computationally constrained edge devices infeasible. We provide an in-depth comparison with our proposed methodology based on object detection and [25] in the results section.
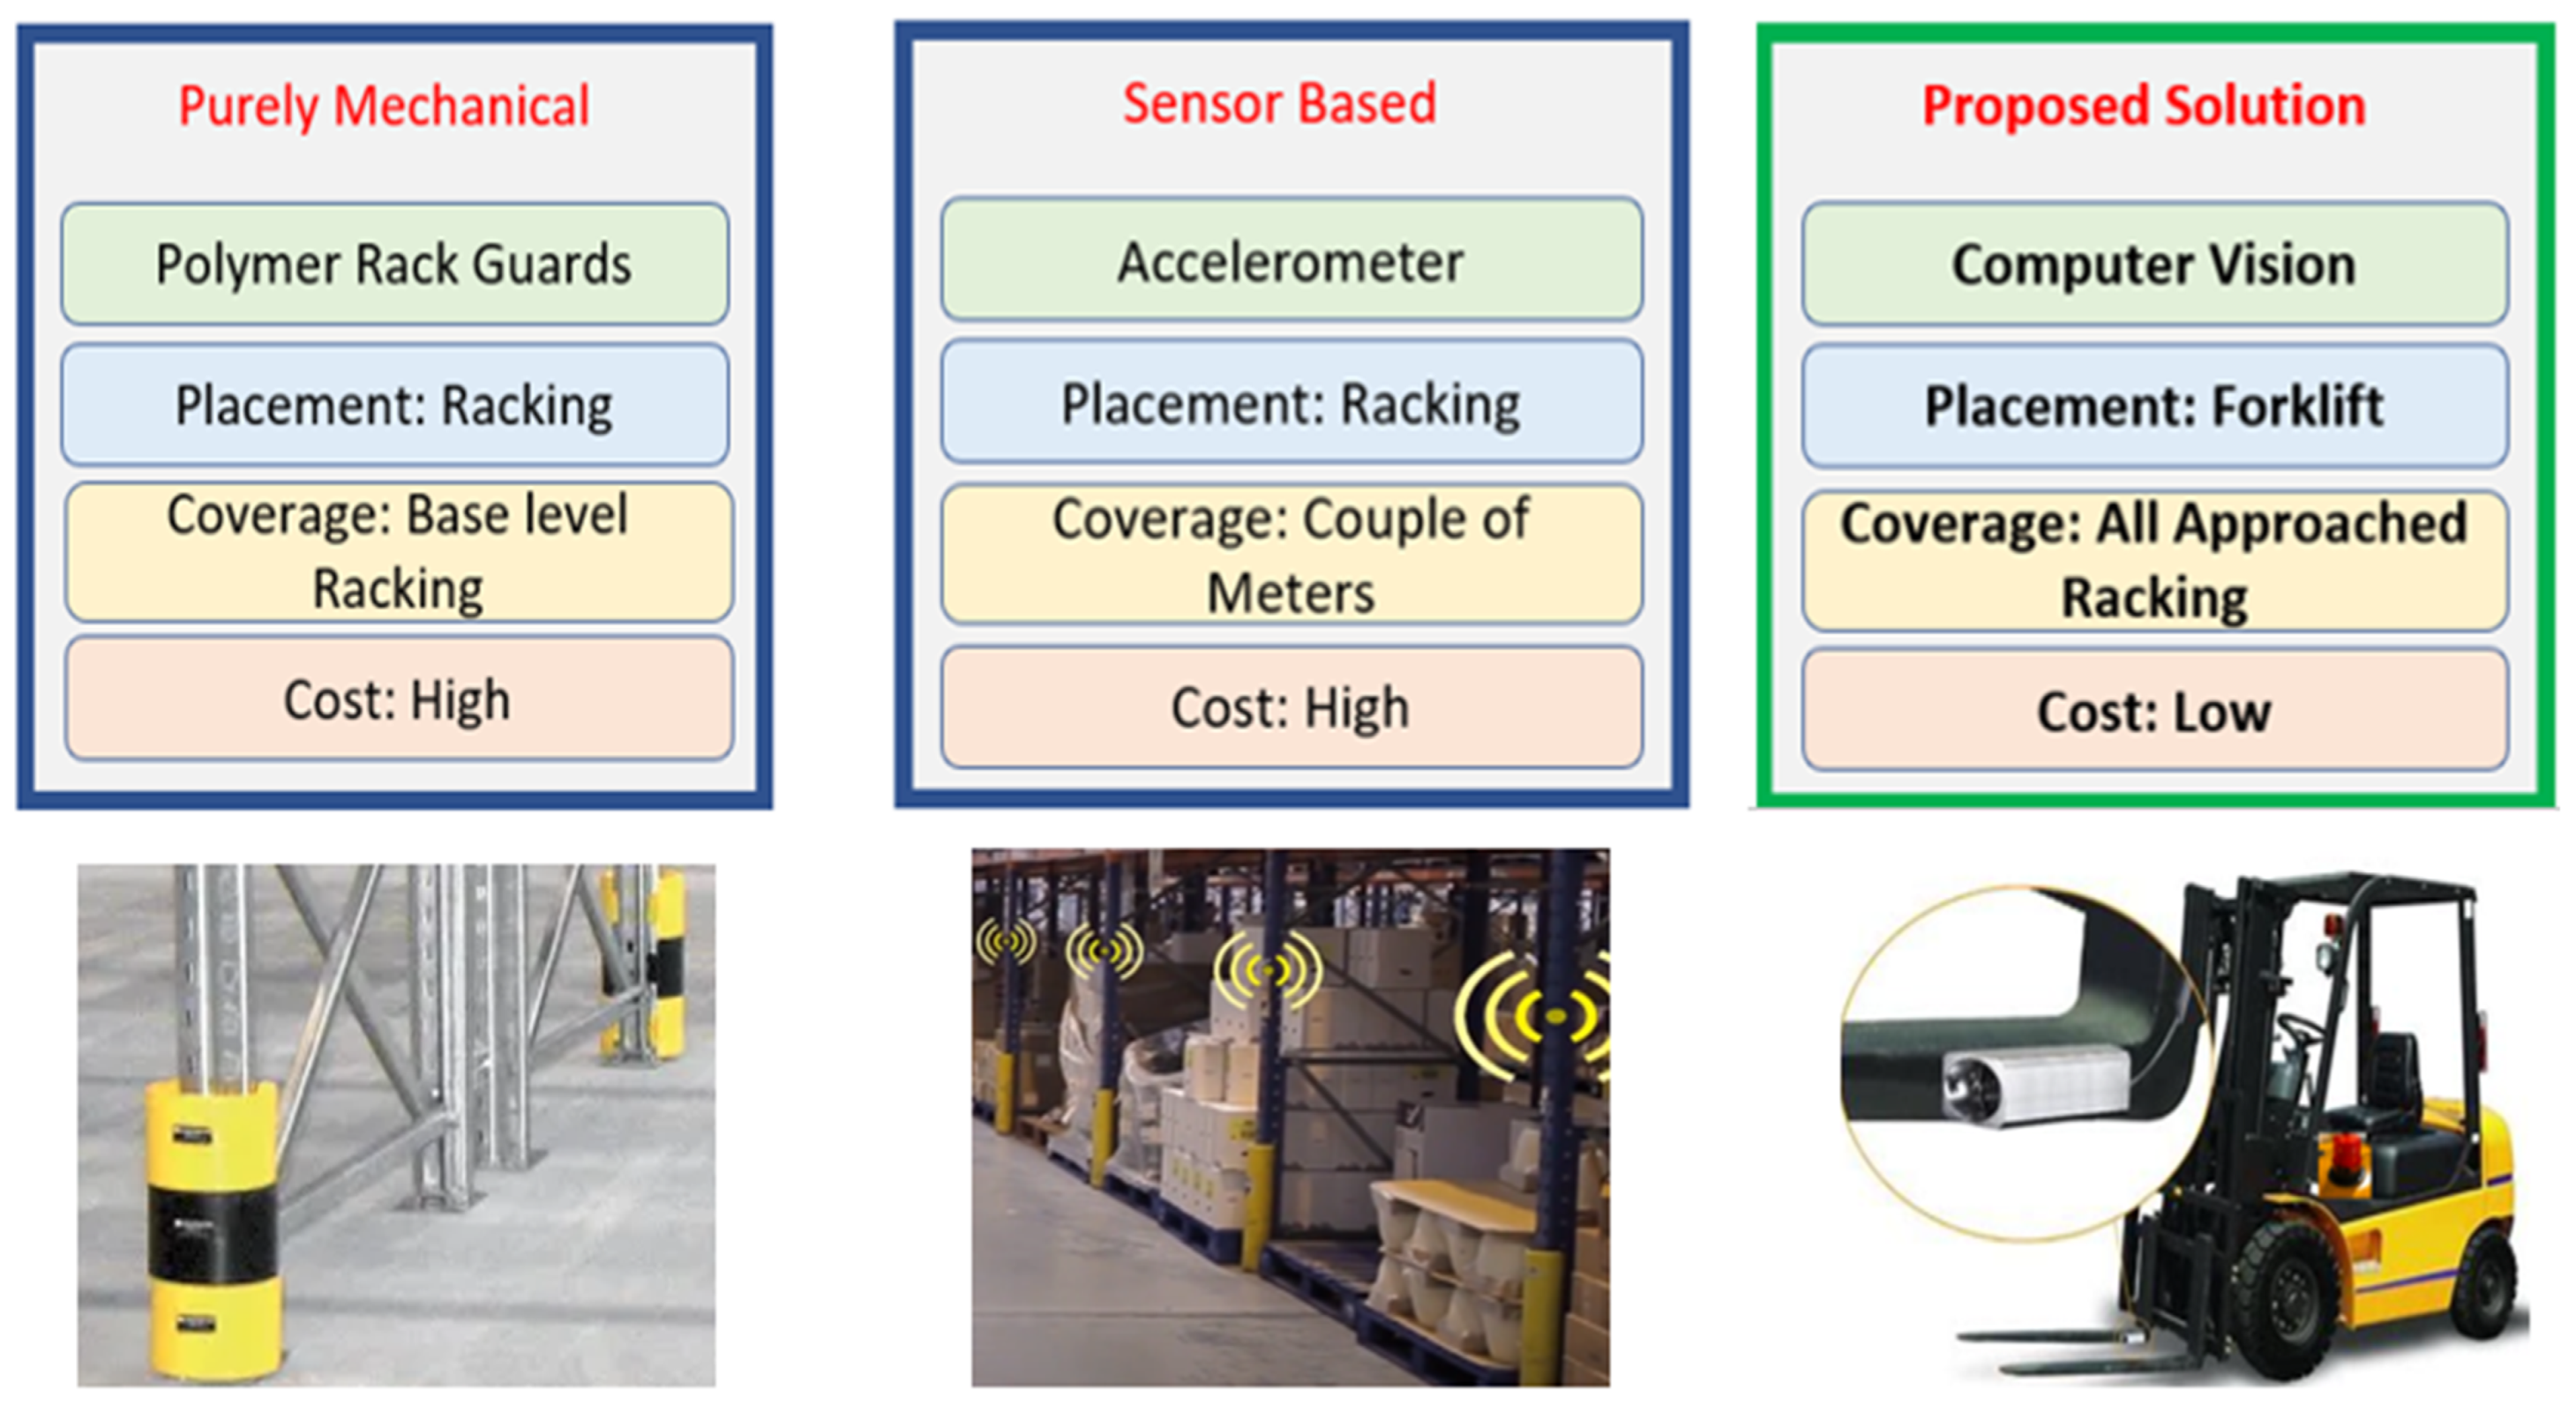
The majority of products commercially available are designed to limit the severity of impact to racking legs in the form of polymer guards such as “Rack Armour” from Rack Group [26] and “Rack Bull” from Boplan [27]. The issue with these products is that they are purely mechanical and as a result, they can only be deployed for dampening the impact rather than discovering, alerting, and classifying damage. Companies such as A-Safe [28] have tried to embed intelligence into their racking solutions by shifting their R&D toward sensor-enabled products, Rackeye [28], respectively. Although, the transition toward intelligence-based rack monitoring enables continuous monitoring of racking, it has certain logistical, technical, and financial limitations. Rackeye fundamentally determines an impact based on the readings from an accelerometer. As a result, large distribution centers such as Amazon or Coca Cola would require thousands of these sensor devices (one for each racking leg) to provide coverage of every racking leg. This is costly to purchase and also creates on-going maintenance cost for powering the devices (battery replacement). Furthermore, accelerometers have a sensitivity range (couple of meters), hence, even after attaching a sensor to every racking leg, damage caused to higher level racking (more likely due to less driver visibility) may go unnoticed.
Summing the literature, we find that there is a lack of consideration given to model quantization for deployment purposes. For example, the opting of defect segmentation in [25] as opposed to bounding box approach, eliminates the potential of the trained MaskRCNN, being deployed onto an edge device for close to source inferences. Furthermore, there is a lack of domain-specific augmentation implementation, this is a key factor when it comes to addressing data scarcity, whilst maintaining representative network performance. From the deployment side, we observe the lack of intelligence based solution deployment, this again circles back to the design decisions taken in algorithmic development stage, resulting in computationally demanding architectures, incapable of being deployed onto computationally constrained (CPU-based) edge devices.
1.2. Paper Contribution
To overcome the issues attached to purely mechanical and sensor-based solutions discussed in the previous section and the computational inefficiencies of two-stage detectors, we propose the implementation of a MobileNet-SSD architecture for detecting damage to pallet racking. Furthermore, we extend our research to deployment of the trained architecture onto an edge device (Raspberry Pi [29]). We demonstrate how the strategic placement of the edge device onto the forklift rather than the racking itself enables coverage to all levels of racking.
The selection of the forklift for facilitating the edge device means it can be directly powered from the host (Forklift), hence no external power costs are involved i.e., periodic battery replacements. Additionally, our solution means the required number of devices are proportional to the number of forklifts rather than the number of racking legs. This makes our solution attractive to large distribution centers as it reduces the amount of hardware required for coverage. Figure 1 presents a high-level overview of our proposed solution against the conventional systems, benchmarked on three key metrics: placement, coverage, and cost.
2. Methodology
2.1. Data Procurement
To the best of our understanding no open-source data consisting of representative racking images is available, a plausible explanation for the lack of automated architectures for racking damage. Our research addresses this primary requirement by partnering with various local warehouses within West Yorkshire, UK, enabling us to accumulate the first racking dataset, that could be used for training object detection architectures.
Figure 2 presents our methodological approach for collecting the dataset. To obtain a representative dataset, we attached a smartphone to the cage of the forklift with the camera facing towards the racking. The video recorder was enabled whilst the forklift was being operated around the warehouse loading and unloading stock onto the racking. The collected data were transferred onto a laptop via Dropbox, and the video stream was split based on one-second per split.
As an alternative strategy for data collection, we could have taken random images of racking via an online search for “warehouse racking”. However, data collected in this fashion would not have the variance, background details, various levels of damage, to train a well generalized architecture that can be deployed onto an actual production floor for live testing.
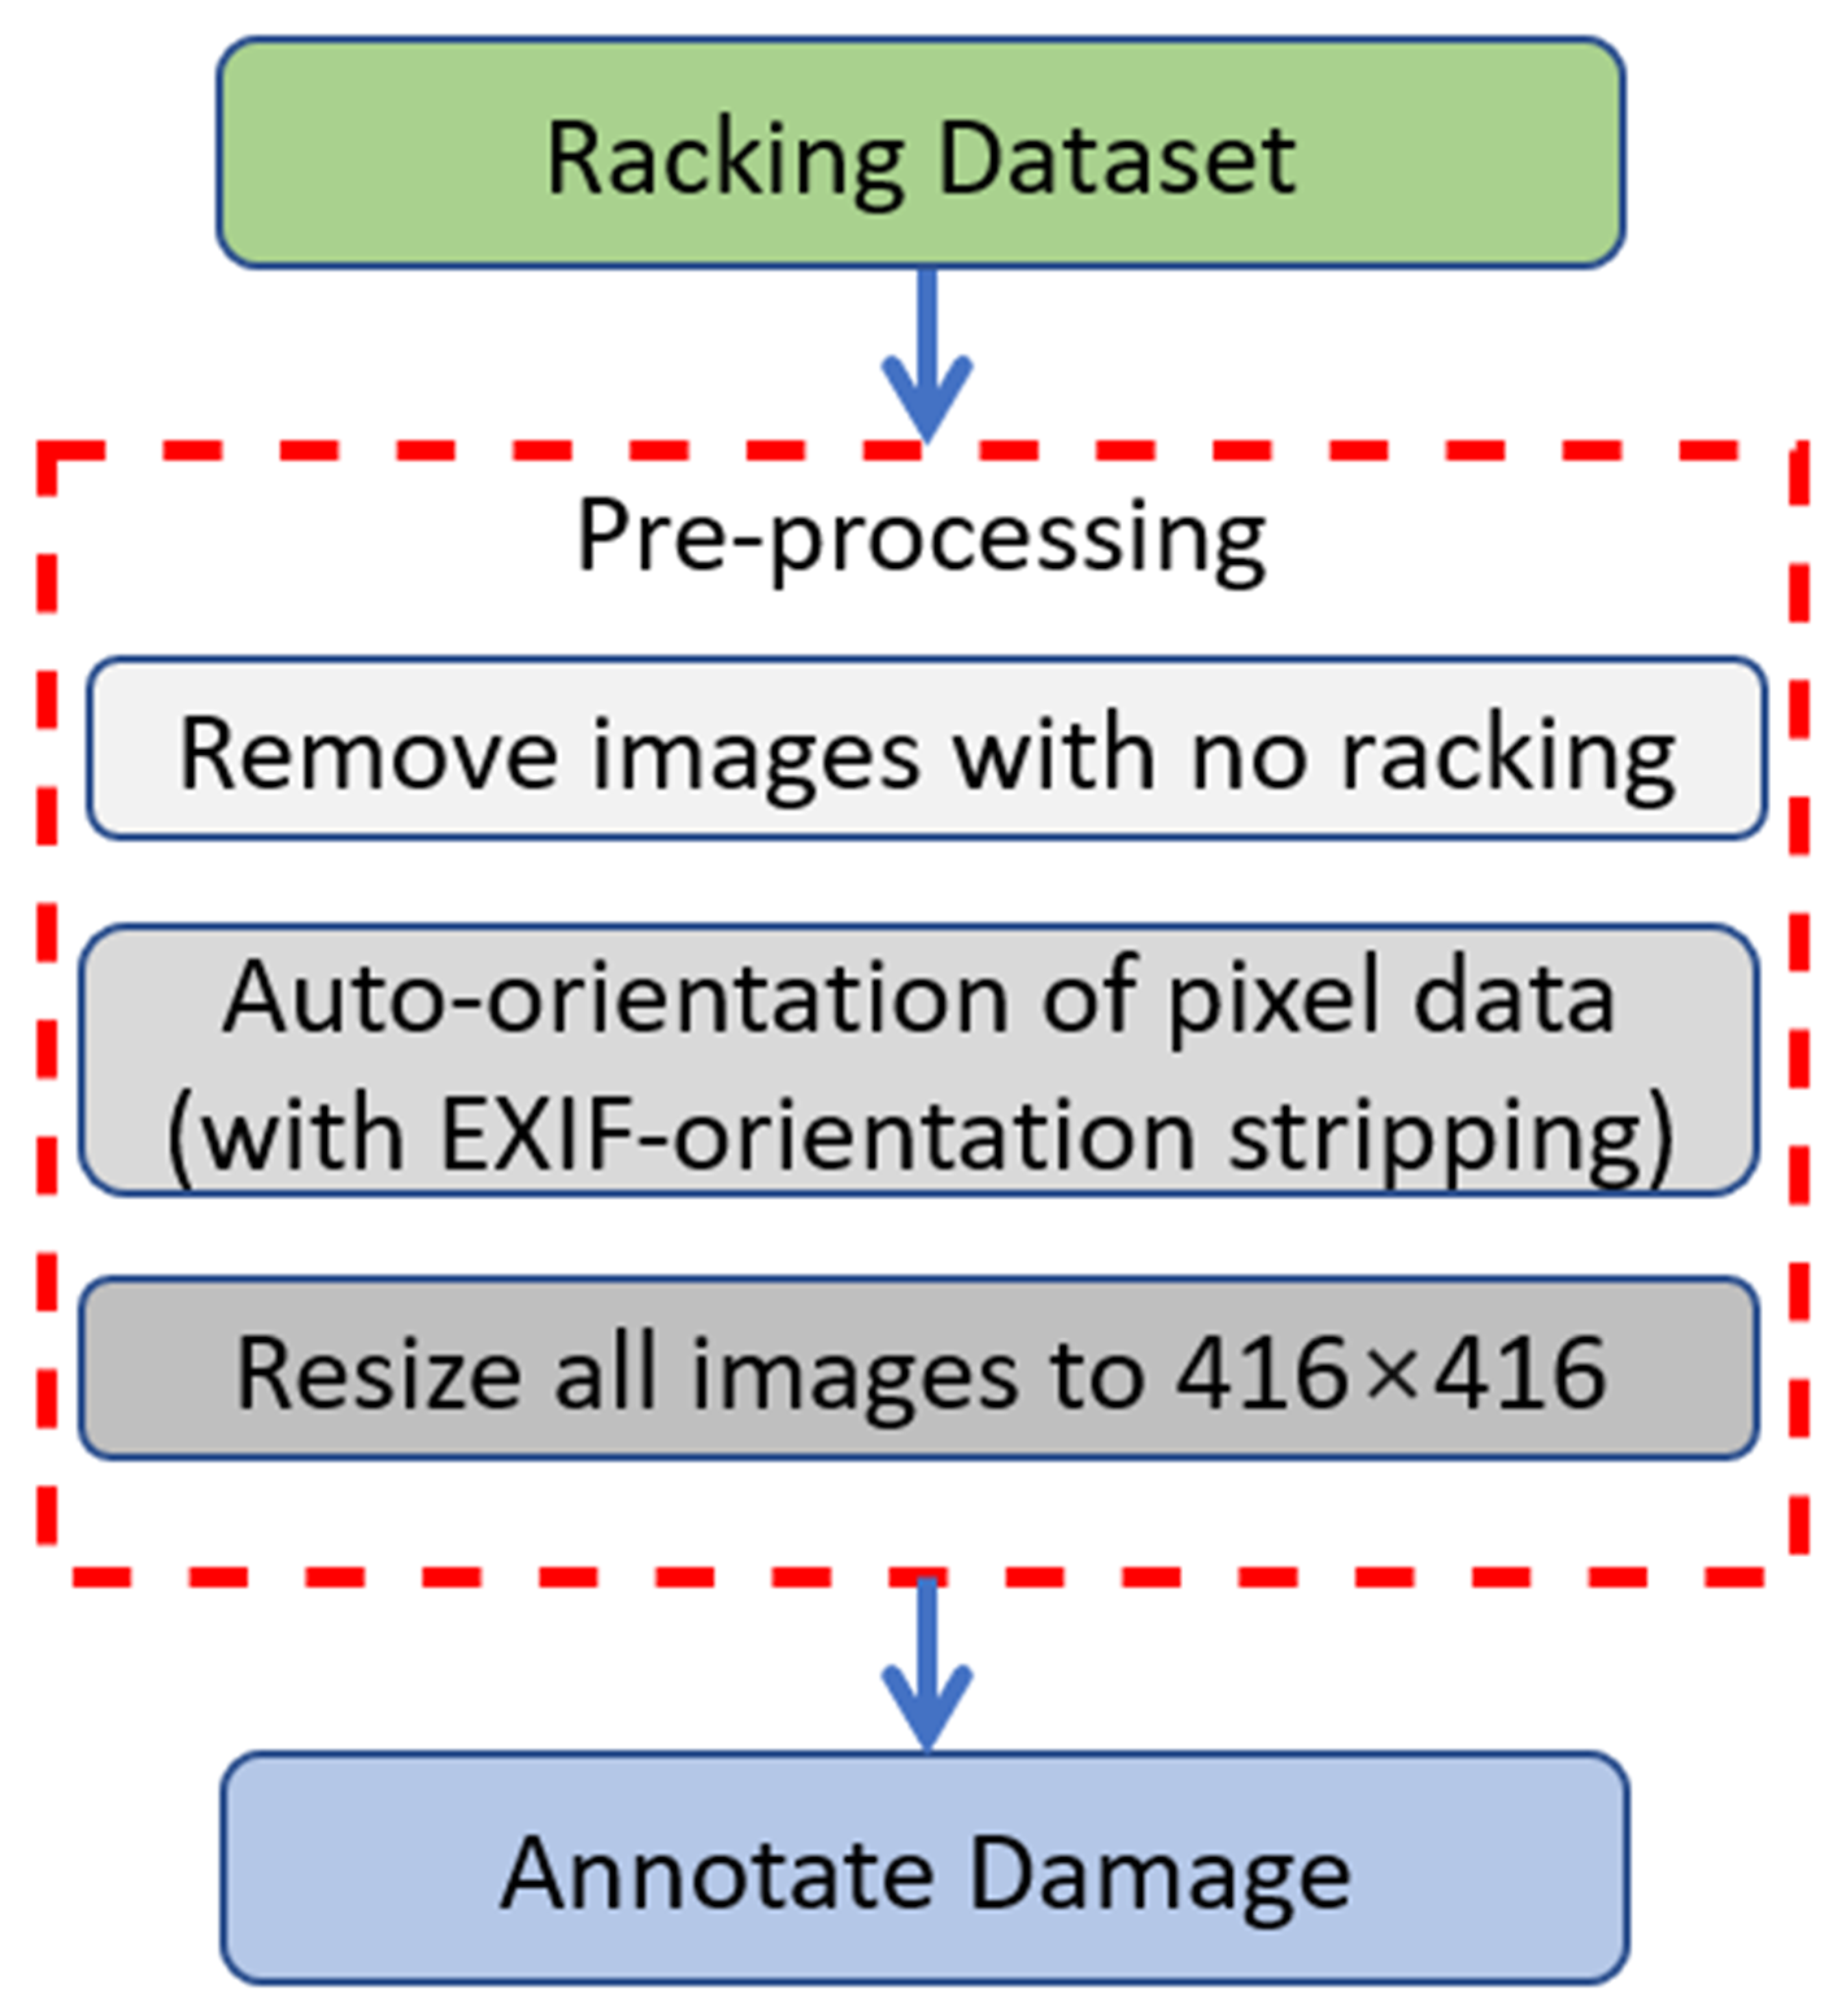
2.2. Data Pre-Processing
The methodological process for preprocessing of the static dataset is shown in Figure 3. First, due to the selection of video for data capturing without human intervention, the captured dataset was indiscriminate of racking. Therefore, after splitting of the frames, many images contained no racking, for example as the forklift moved away from the racking area, hence these images were filtered out of the network.
Although this process was carried out manually, an innovative idea arose from this process, that is, the development of a sub-classifier that can determine the presence of racking in an image and remove images that lack any racking content. This is not the scope of this research, however, a key direction for future work that will assist with streamlining huge amounts video content for creating representative racking datasets and can be extended to other applications.
Next, auto-orientation of pixel data was carried out. When capturing an image, the metadata dictating the pixel deployment is stored in the Exchangeable Image File Format (EXIF). This enables faster image encoding so the camera device sample data without undesirable artifacts. All images were resized to 416 × 416 pixels as the final step of the pre-processing stage.
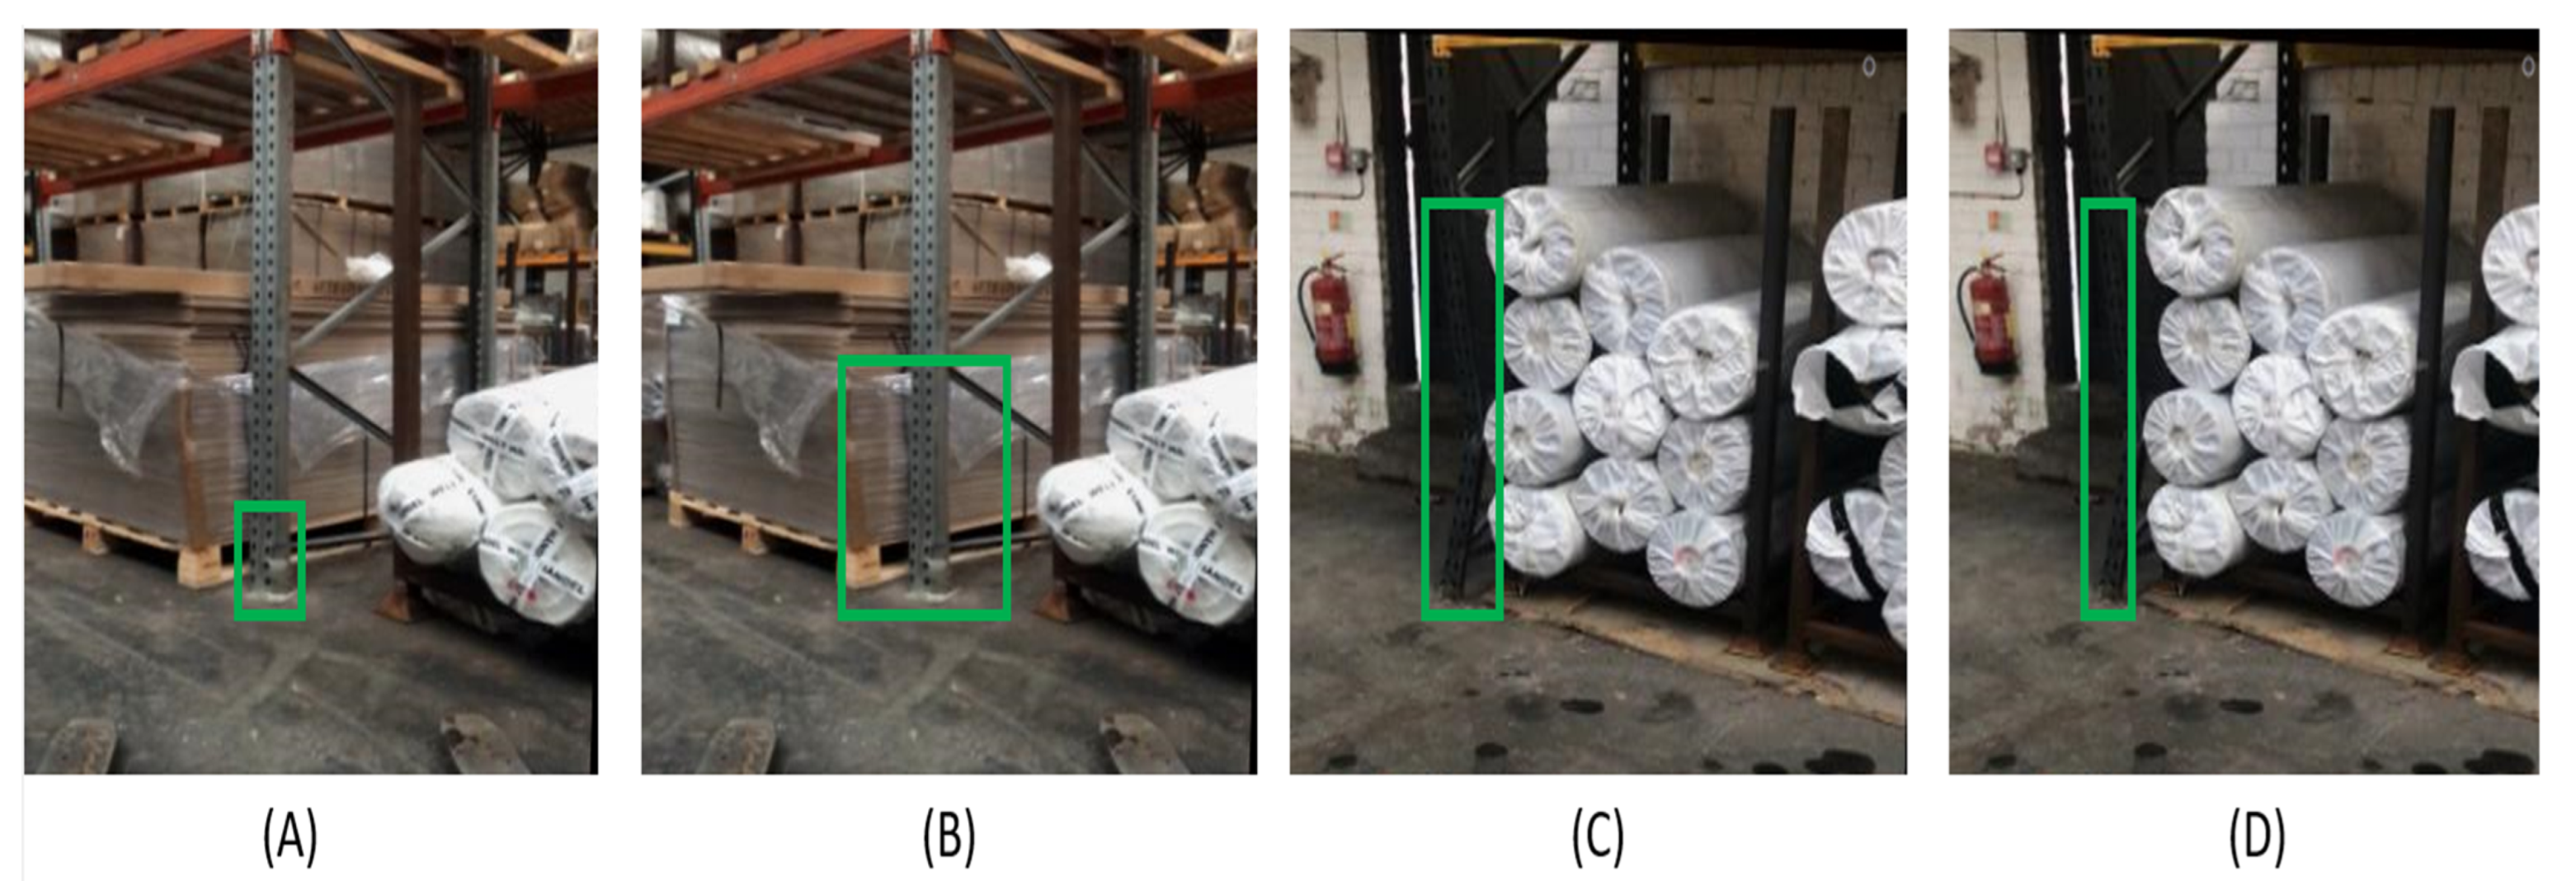
As the task here was to determine and localize the fault i.e., object detection rather than image classification, creating bounding boxes around the areas of interest (damaged racking), was critical. Computer Vision Annotation Tool (CVAT) by OpenCV was used for applying bounding boxes to the dataset. The determination of bounding boxes was as critical as these would serve as the ground truth priors to which the accuracy of predicted bounding boxes during the training phase would be judged. The applying of bounding boxes was based on the nature of our dataset. From the sample images shown in Figure 4, it can be observed that the image is “rich” in content, that is to say there are many details around the area of interest (damaged racking). Hence, the applying of bounding boxes would need to be “tightly-bound”, focusing on only the area of damage, in order to provide the training phase with sufficient data for generalization. Figure 4A presents the correctly applied bounding box, whilst Figure 4B captures unwanted pixels details that can mislead the generalization of the architecture during training.
Another factor that was observed in the dataset was the issue of background-pixel neutralization with respect to the racking. For example, in Figure 4C,D, it can be observed that the distinctness of the racking is compromised due to the background also being the same color. In addition to this, we also observe that the stock (white rolls) introduces a slight degree of occlusion near the damaged racking section. Endorsing, the possibility of the level of occlusion being of a greater degree, Figure 4C presents our approach for applying the bounding box. It can be seen that rather than avoiding the small section of occlusion, this is included in the bounding area so that the architecture during training appreciates the fact that occlusions are a real possibility rather than ignoring all racking containing occlusions. Figure 4D shows the application of the bounding box, ignoring the occluded area, as a result it can be seen that a section of the damage is also not included in the area of interest.
2.3. Data Augmentations
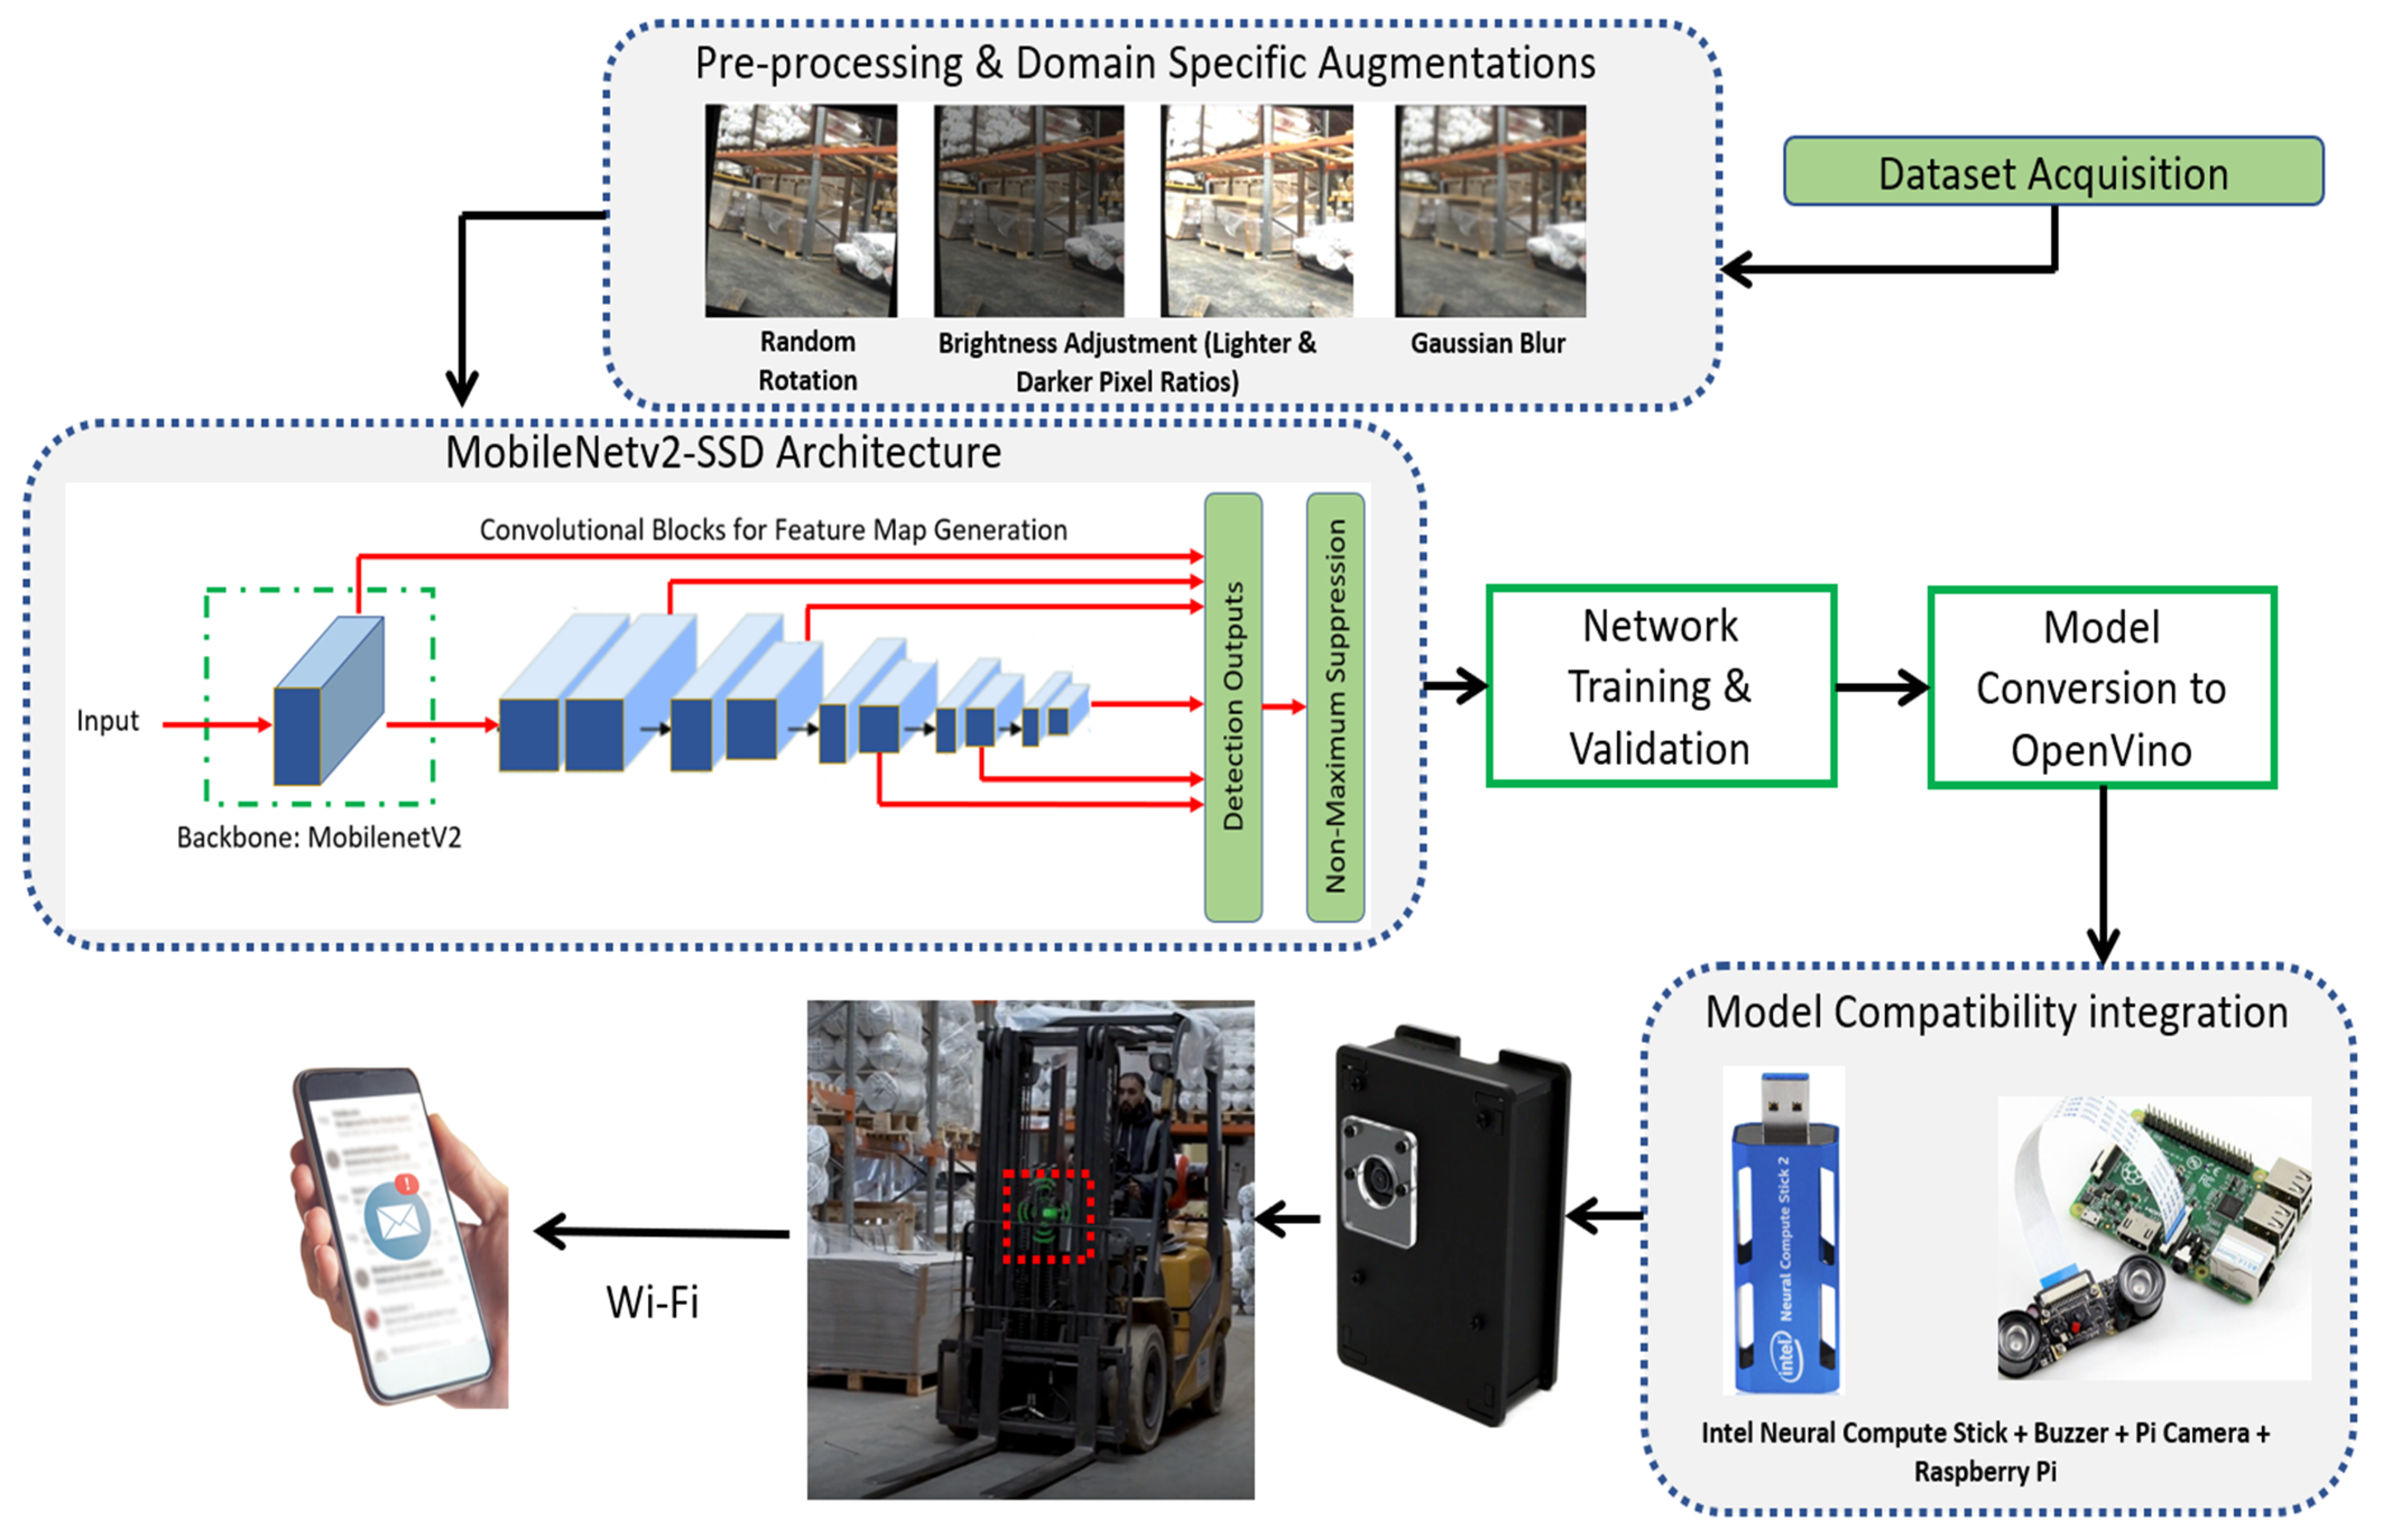
The next phase of the methodology involves the introduction of domain-specific augmentations for introducing variance into the dataset and aims to boosting the generalization ability of the architecture during training.
The first augmentation to be applied was the random cropping of image; specifically, 0–3% of the image would be cropped. This would essentially create a random subset of the original sample. The rationale for selecting random cropping was due to the fact that the area of interest, i.e., damaged racking would not always be entirely visible due to stock-based occlusions nor the same distance with respect to the camera.
Second, random rotation augmentation between −6 and +6 degrees was applied to the original dataset. The rationale for this was due to the fluctuations in angles that the racking appeared in the image as a result of the camera being placed on the Forklift (continuously in motion i.e., approaching and moving away from the racking). Figure 5A presents a sample image from the racking dataset. As explained in the dataset collection section earlier, the image is a biproduct of a video captured via a smartphone placed on the Forklift. Figure 5B presents an augmented sample of the original image with a random rotation of 6 degrees. This simulates a very realistic scenario where the placement of the camera is offset whilst loading or off-loading stock due to its close proximity.
Next, random brightness adjustment was introduced varying between −5 and +5%. The justification for this was to simulate the fluctuations in the light level intensity (LUX) that may be experienced at different distribution centers. Figure 5C,D presented darker and lighter augmented samples of the original image in Figure 5A circling back to the selection criteria based on domain specific augmentation selection, it can confidently be stated that the generated augmentations (Figure 5C,D) are representative of production floor camera output due to various lightning conditions.
Furthermore, to address the issue of non-static camera placement, Gaussian Blur was introduced. As mentioned earlier, the edge device housing the camera would be placed on the adjustable forks on the Forklift. Whilst this provides coverage to all levels of racking, relative to the Forklift, the device is exposed to continuous movement, which can lead to blurred output. However, due to the reduced speed of Forklifts whilst operating around racking, the blur factor would not completely render the image content as unreadable. Hence, we introduced pixel wise Gaussian Blur for simulating blurred image samples. Figure 5E shows the generated output image after applying pixel-wise Gaussian Blur to the original image (Figure 5A). Similar to the case for applying random brightness adjustments, Gaussian Blur would introduce representative variance that might be caused due to an impact leading to reduced camera focus.
Summarizing the selection of augmentations, we would like to point out that deep learning development frameworks such as Pytorch, TensorFlow, and Keras provide a wide range of inbuilt augmentations that can be deployed without much effort. However, rather than indiscriminate use of augmentations we opted for representative sample generation based on our deployment environment. As a result, we were able to train our architecture in a couple of hours using Google Collaboratory GPU’s without any timeout issue. Conversely, the use of wide-ranging augmentations without any justification would have led to increased training time, increased training time and the need for dedicated GPU’s rather than utilizing freely available cloud GPU resources offered by Google, Microsoft Azure, Amazon Web Services etc.
2.4. Architecture Selection
Once the dataset transformation was complete, the next step was the selection of the architecture that would be used for training in the dataset. There are many object detection architectures available for defect detection, however the majority of these require dedicated GPU’s and are usually hosted on the cloud due to the high computational demand. This is due to the deployment of a “two-stage” detection methodology, whereby, the architecture first generates regional proposals and then object classification is carried out on each proposal. Although this does provide a higher degree of accuracy, the increased computational load makes it undeployable at the edge. The purpose of this research was to train a Lightweight architecture that is able to carry out inference within an enclosed environment (raspberry pi) with a high degree of accuracy and in real-time. Hence, we decided to select a “one-shot” detector, carrying out both classification and bounding-box regression in a single stage.
2.5. Examining the Single Shot Multibox Architecture
Single Shot Detector (SSD) is a popular single-stage architecture for high-speed inference where the highest degree of accuracy is not a primary requirement. The SSD network architecture, implemented with the VGG16 network as the backbone providing six feature maps with varying dimensions and aspect ratios for the back-end detection of objects.
Next, a non-maximum suppression (NMS) mechanism is applied to the detection outputs. In the case of multiple overlapping detection outputs, the detection output with the highest confidence score is proposed. While the use of VGG16 as the backbone enables useful feature extraction capabilities, its internal architecture is extremely deep, containing over 130 million parameters making it difficult to attain real-time inference on edge devices with constrained computational capacities.
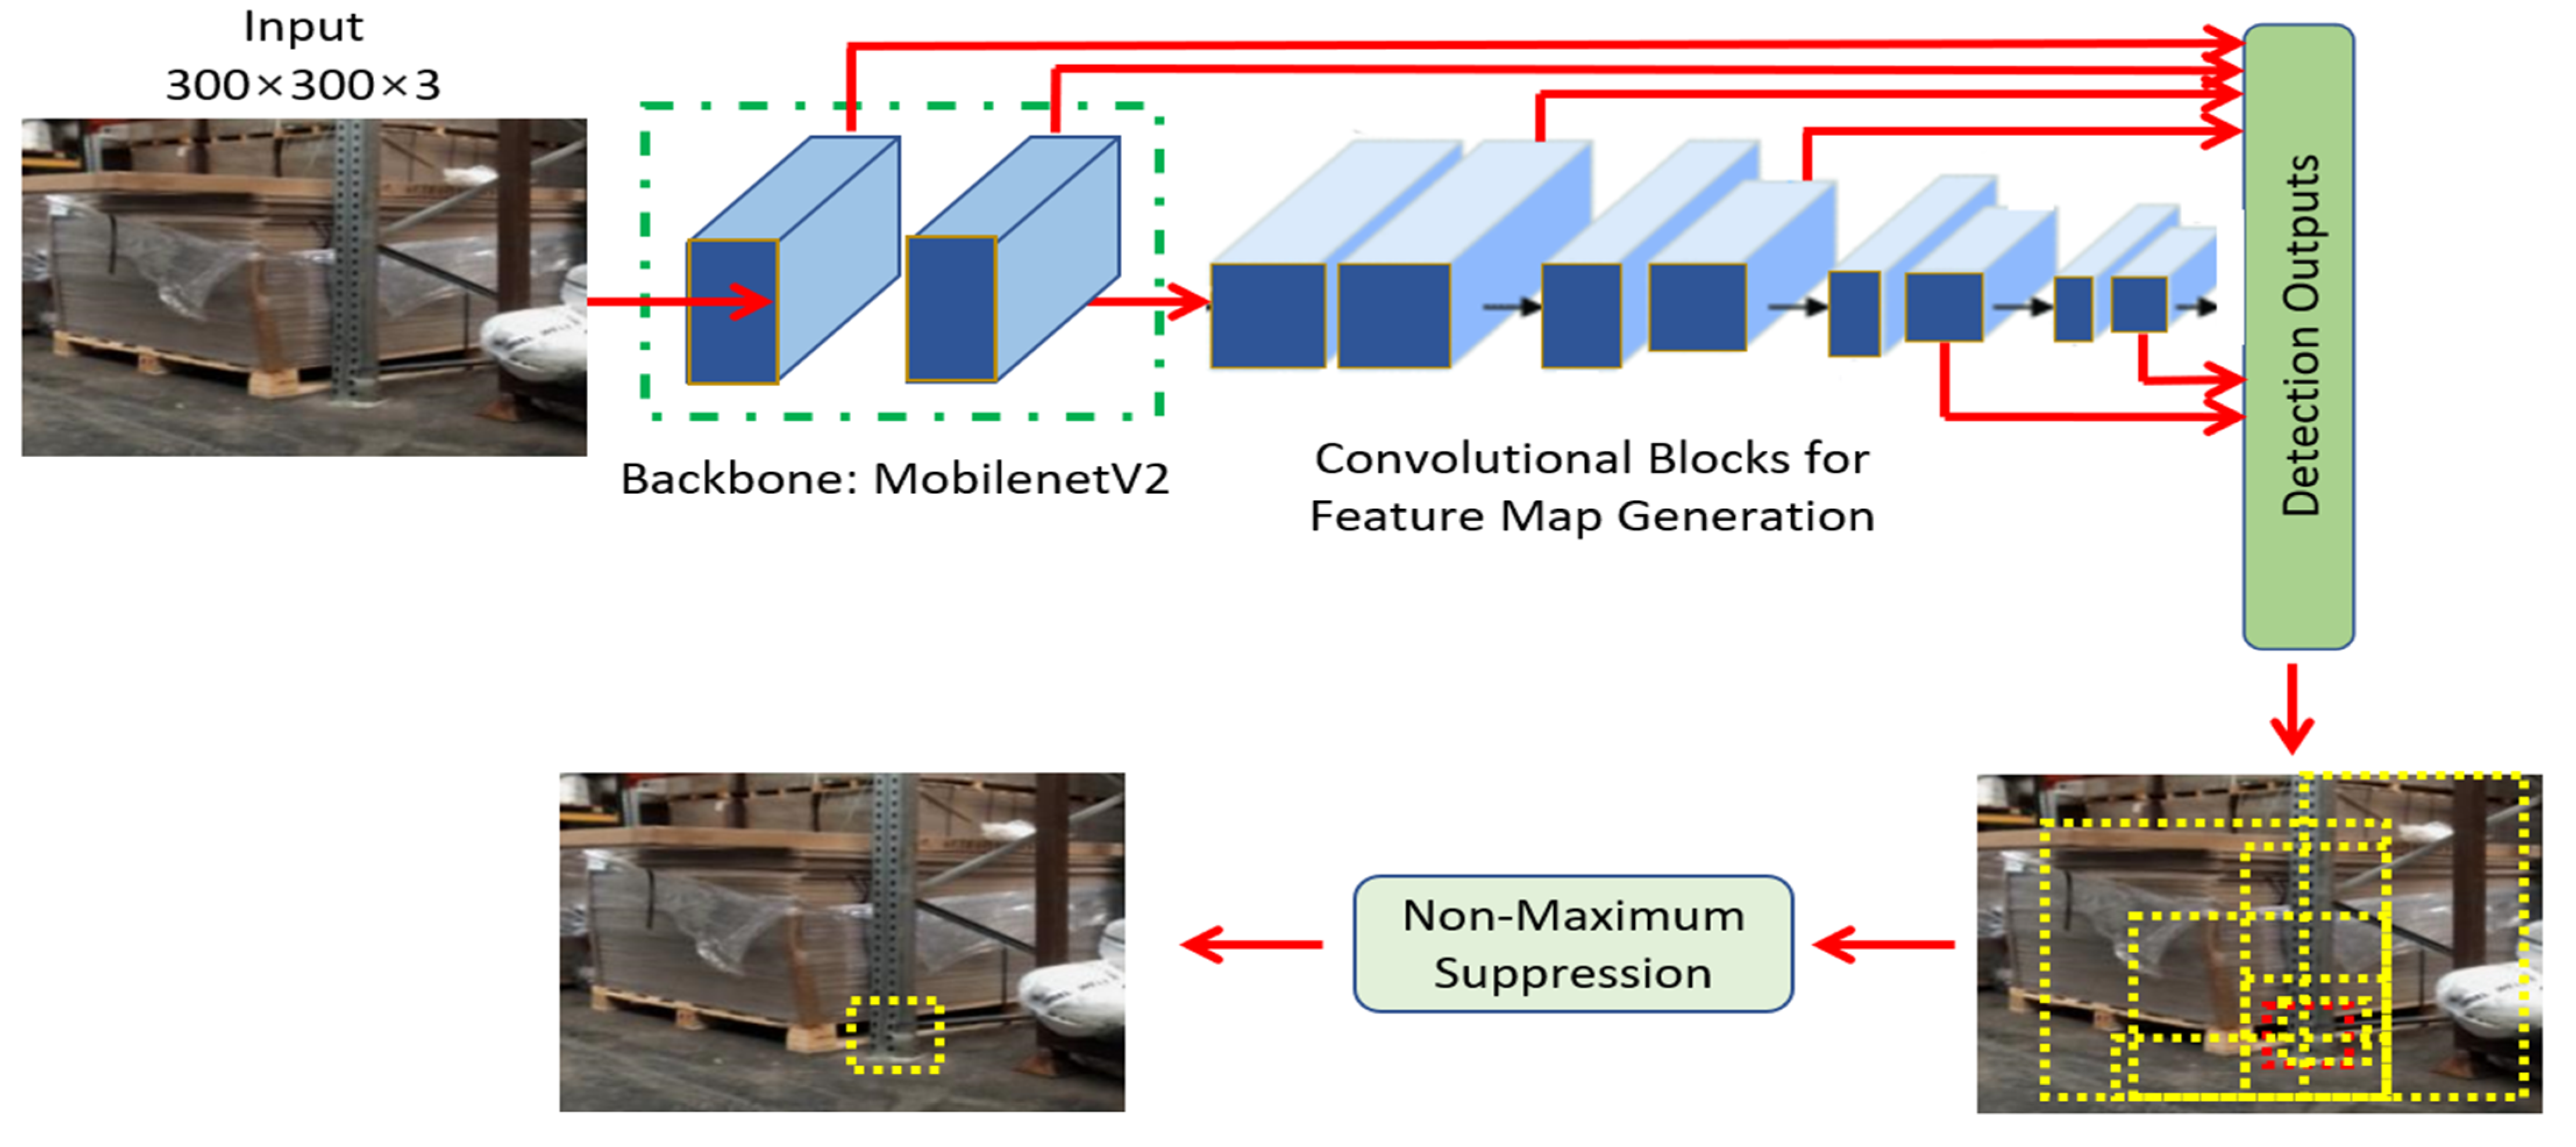
2.6. MobileNetV2 Coupling with SSD
To address the issue of computational complexity as a result of VGG16 as backbone for the SSD detector, Google [15] replaced the VGG16 architecture with the Mobilenet network, leading to improved real-time inference for the SSD architecture. Figure 6 presents Mobilenet-v2, as the backbone of the SSD network for our application.
Mobilnetv2-SSD implements a concept known as depth-wise separable convolutions. This is essentially a form of factorized convolutions, factorizing any standard convolution into two parts: depth-wise convolutions and point-wise convolutions. This factorization of the convolutions in this manner drastically reduces the computation depth and overall size of the architecture. Notice the importance of NMS in suppressing the potential positive candidate predictions to the one with the highest Intersection Over Union (IoU) with the ground truth bounding box (red).
The computational ratio for the depth-wise convolutions and standard convolutions is expressed in Equation (1), where the dimensions of the convolution kernel are , depth-wise, pointwise filters are and 1 × 1 × M, respectively, M represents number of input channels and N gives number of output channels.
2.7. System Architecture
The overall system architecture is presented in Figure 7. After completing the data transformation stage and selection of architecture (discussed in preceding sections), the next stage was the training of the selected architecture on the data. The hyperparameters used for training along with the results are discussed in details in the result section. However, we would like to discuss the proposed deployment process post architectural training.
Once the architecture was trained, the next stage was the conversion of the TensorFlow code to the OpenVino format, in order to facilitate its deployment on the edge device. The edge device selected for our application was Raspberry Pi 4 Model B. The small size of the device was suitable, but the main reason for its selection over similar devices such as Arduino was its enhanced onboard processing power coupled with Wi-Fi connectivity. The latter i.e., Wi-Fi was a fundamental component, required for fulfilling the theme of Smart Manufacturing as it provides a medium for interconnectivity between the devices and extraction of key data. In our case, if the edge device, attached to the forklift, detected damage to the racking it was operating on, the buzzer would go high, alerting the driver to inspect the damage but also an email alert with the time stamp, type of damage, and an image of the damaged racking would be emailed to the assigned personnel.
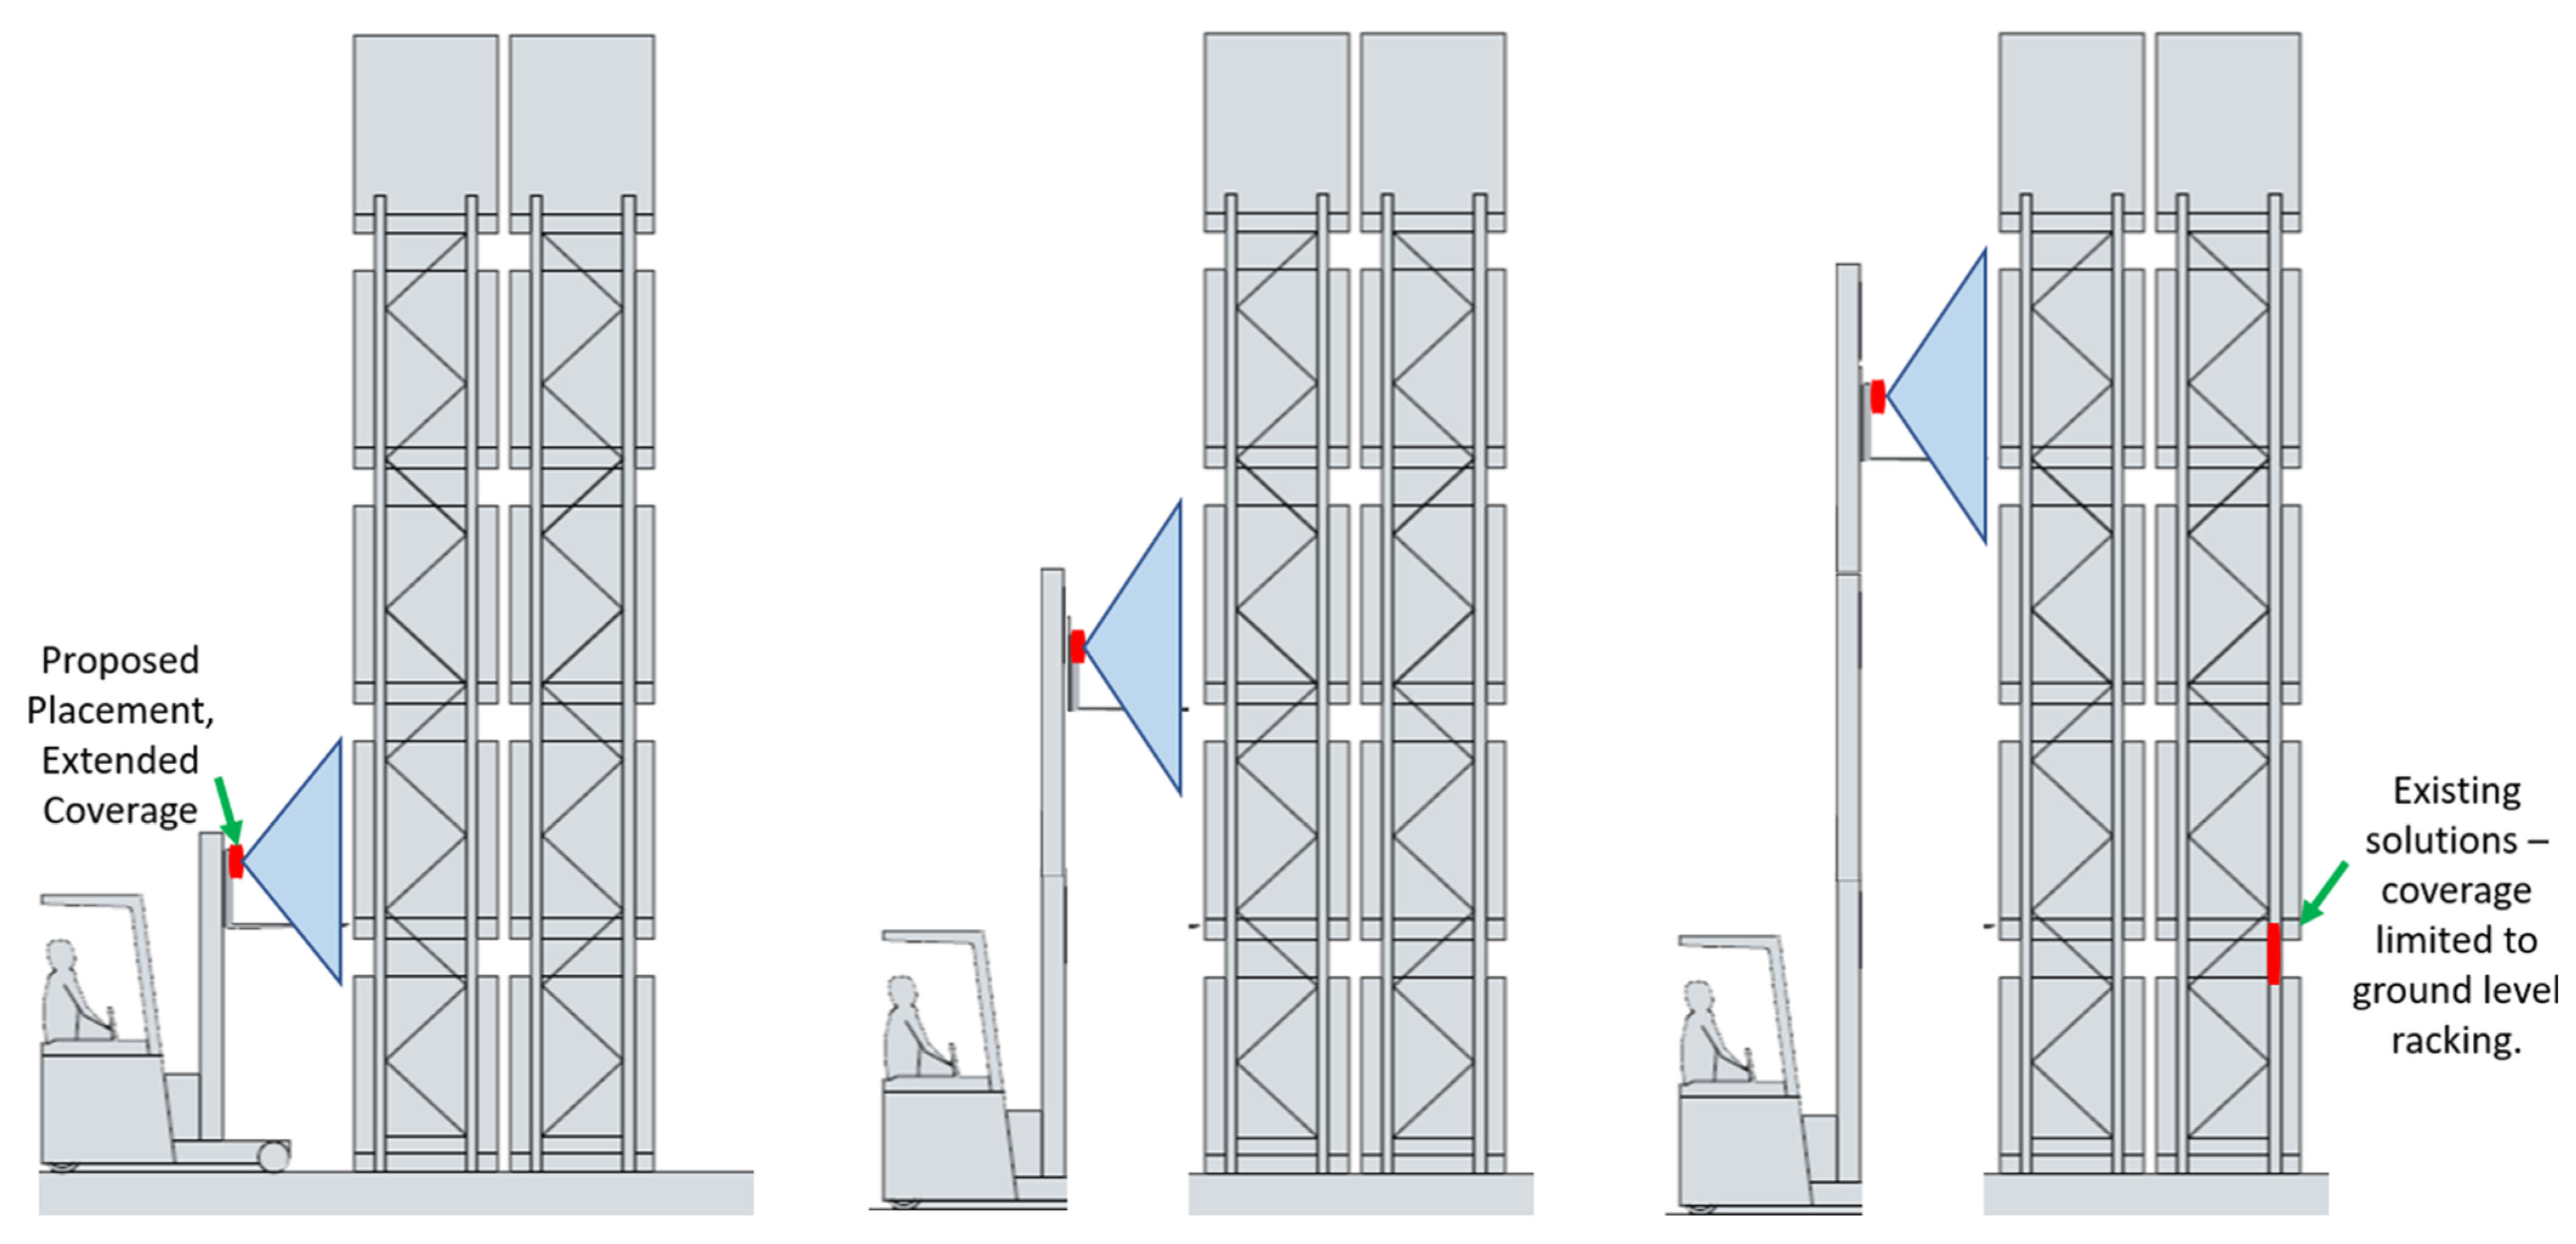
2.8. Strategic Placement for Extended Coverage
One of the primary advantages our proposed solution has over all existing sensor-based rack damage products in the market is its ability to provide coverage to all levels of racking. As mentioned earlier, our proposed system is not placed on the racking, rather we utilize the forklift for device placement.
We strategically proposed the placement of the device onto the adjustable forklift cage. The rationale for this is due to the fact that the case is relative to the “forks” used for accessing the racking. Figure 8, illustrates the extending of the racking cage for accessing racking at various heights whilst the forklift is stationary. Hence the placement of the device onto the cage enables coverage to racking at any level whilst loading and off-loading is being carried out.
3. Results
3.1. Hyper-Parameters
The size of the transformed dataset used for training the MobileNetV2-SSD architecture is presented in Table 1. The training and validation class contained a corresponding “xml” file for each image with the co-ordinates for the bounding boxes around the damage, for assisting with the evaluation process. It may be argued that the training set is significantly higher than the validation and training sets. The reason for this was first due to the fact that the training set alone contains all generated augmentations. Second, and most importantly due to the limited number of damage samples it is important to validate and test the model on unique samples rather than simply add repetitive samples to increase the size. At the same time, we overcome the risk of overfitting on the validation dataset due to the limited number of samples as compared to the training set. The hyperparameters used for training MobileNetV2-SSD architecture are presented in Table 2.
3.2. Model Evaluation
The training of the architecture was undertaken in Google Colab, as this provides free GPU access for speeding-up the training time, albeit with time restrictions on use. The results for model evaluation are presented in Table 3.
Before dwelling into the results presented in Table 3, it is important to provide the rationale for the selection of metrics for the model evaluation. Intersection over Union (IoU) also known as the Jaccard Index is the fundamental and guiding principal for evaluating object detection architectures. IoU enables the quantification of similarity between the predicted and ground truth bounding boxes, as shown in Equation (2):
In our case the defined overlap between and was 50%, so a 50% overlap between the ground truth bounding box (defined in the annotation stage by the user), and the predicted bounding box had to be achieved by the model for a correct classification.
Furthermore, MAP (mean average precision) was selected as it provides an appropriate measure of the model’s sensitivity. The precision, recall, and F1-score were computed for a confidence threshold defined as 50%. The MAP was computed as Equation (3), where is the average precision for the i-th class and C is the number of classes:
Circling back to Table 3, we observe that the model was evaluated based on the mean average precision based on an IoU of 50%. The model achieved an 92.7% (MAP@50 (IoU)). This is an impressive performance on many fronts. First, the network was only trained for 10,000 steps, whereas object detection architectures for production floor deployments can require over 100,000 steps for reaching acceptable performance. This endorses our methodological approach in determining appropriate augmentations for enabling true generalization of the architecture during training.
Second, the dataset was directly acquired from the production floor rather than utilizing a pre-processed readily available dataset. As a result, the size of the dataset was less than 20,000 samples in total, whilst convolutional neural networks (CNN) require humongous amounts of image data for training and high generalization. The small sized dataset even after applying augmentations (<20,000 samples) again is a manifestation of the successful capturing of the domain specific variance through tailored generation of new samples as discussed in the methodology section.
From Table 3, we observe that the initial loss was at 4.54 reaching a final loss of 1.96. We are confident that the loss could have been further reduced to less than zero by increasing considerably the training duration, i.e., increasing steps. However, due to the limitations on free GPU accessibility in Google Colab, we constrained our training to 10,000 steps. Nevertheless, we feel the overall performance of the architecture at 92.7% MAP shows the effectiveness of our approach.
Finally, Table 3 shows that the architecture required less than 2 h for generalization at 92.7% MAP with 10,000 steps. It is well-known that CNN architectures for image classification and in particular object detection in general require significant amounts of training time, in some cases weeks, for acceptable performance. However, by providing a quality dataset coupled with the selection of a light-weight architecture utilizing depth-wise convolutions to limit the number of parameters, we were able to present a high performant model achieving an MAP of 92.7% @ IoU-50 in less than 2 h.
4. Discussion
4.1. Two Stage Detector Comparison
Table 4 compares the architectural performance of the MobileNetV2-SSD architecture against a two-stage detector. Here we evaluate the Faster-RCNN with a VGG backbone for feature extraction against the proposed MobileNetV2 as the backbone.
Observing the architectural metrics in Table 4, it is evident that the selected architecture is computationally more effective and hence more suitable for deployment onto computationally demanding devices such as a Raspberry Pi. Looking at the input dimension requirements, it can be observed that the two-stage detector required an input image of 600 × 850 pixels leading to more computational parameters through the convolutional process.
4.2. Proposed Solution vs. Similar Research Comparison
As mentioned earlier, Ref. [25] was the only research found to be based on the detection of pallet racking damage within warehouses. Table 5 presents a comparison of our research with that undertaken recently by [25] for automated damage detection of pallet racking.
Starting with the research approach, it can be observed from Table 5, there is a distinct difference between the two works. Authors in [25] decide to go down the image segmentation approach for proposing a defect detection mechanism for pallet racking. Although this is a perfectly reasonable methodological approach, we would point out that this approach increases the preprocessing work required post data acquisition. As acknowledged by the authors, the dataset required segment-specific annotations utilizing polygons for capturing the overall shape of the defect region on a pixel basis. Although, this would not have been a major issue for the authors as the dataset only consisted of 75 images, in realistic terms the dataset would consist of thousands of images (in our case ~20,000), therefore the segmented annotation requirement would demand much more pixel-wise accuracy, effort, and time. In our case, the selection of object detection as opposed to image segmentation, allowed us to annotate images using rectangular bounding boxes and provided more pixel-wise flexibility.
Looking at the architecture selection, Table 5 shows that authors in [25] opted for a two-stage detector in the form of Mask-RCNN with ResNet-101 as the backbone for feature extraction. Although this results in better accuracy compared to our selected architecture, albeit by a small margin of 0.75%, the selection of the ResNet-101 means additional computational load making the architecture undeployable on constrained edge devices. Simply, comparing the number of learnable parameters, the ResNet-101 contains 44.5 M whilst the MobileNetV2 contains 22 M. Although, authors in [25] do not mention training time, we feel this would be significantly higher as compared to less than 2 h for training on our dataset due to the substantially higher amount of parameters that need to be tuned for the ResNet-101.
Figure 9 presents visual image comparison between the two works. When comparing our dataset with that of [25], it can be observed that although both works aim to solve the issue of rack damage detection in warehouses, the images are distinctly different in their content.
Our dataset was collected with the aim to provide representative data for training an architecture that can truly generalize for racking defect detection. Hence, the images contained deployed pallet racking with various loads. Conversely, authors in [25] base their research on racking that is not actually deployed in the warehouse (Figure 9), but rather single close-up images of racking are taken and then segmentation is applied to the damaged region. Although, this may provide high training performance we feel, when deployed within a warehouse environment for real-time monitoring, the model would face significant data drift issues due to the lack of variance captured for training the dataset.
5. Conclusions
In conclusion, our research has led to the proposal of the first Deep Learning-based real-time damage detection of pallet racking within distribution centers, warehouses, and retail storage facilities. Our proposed solution provides an overall MAP of 92.7% and the selection of MobileNetV2-SSD as the CNN underlying architecture facilitates edge device deployment with a detection latency of 1 s. The inference can be termed as real-time based on our application. That is the forklift operating close to the racking i.e., whilst loading onto or from the racking would be stationary, therefore the device has a leverage of at least a couple of seconds for scanning the status of the racking and providing an alert in the case of detecting damage. Our successful methodological approach for selective data augmentations based on production floor variations, enabled us to achieve over mean average precision at 0.5 of 92.7%. Although, [25] achieved a higher accuracy, the difference was 0.75%. however, looking at the broader implications of the decision decisions, our approach was based on the implementation of a single shot detector making it a feasible option for edge device deployment. Whilst the MaskRCNN had slightly higher accuracy (margin of 0.75%), its computationally demand due to 44.5 Million (ResNet-101 backbone) learnable parameters, ruled out edge device deployment on a CPU device. We also feel that our data collection and augmentation strategy was more representative, that is the dataset consisted of the background stock as opposed to a close-up image of just the racking. This again enabled the model to highly generalize. It also saves computational processing steps, as the model no longer requires a background subtraction mechanism before it is able to carry out the inference.
In contrast from conventional products, we have proposed the placement of the deployed solution onto the adjustable forklift cage for extended coverage to higher level racking. Additionally, our research collects and collates the first racking dataset based on real pallet racking images procured from various operational warehouses. We aim to further enhance the solution, contributing toward smart manufacturing by interconnecting forklifts via damage detection alerts and creating damage racking reports, and defect cluster reporting to assist floor managers with pallet racking optimization.
A limitation of this research was that only a single damage class was examined, that is vertical damage. This was due to the data only being available for this class. We aim to extend our research by incorporating multiple types of damage detection classes such as horizontal, support, and base plate damage. We aim to work with the standard racking agency SEMA for developing a defect detection architecture that ensures damage levels set by the agency can be successfully detected via our network. We also aim to categorize each damage into major or minor enabling floor managers to make informed decision on the urgency of replacement on a case by case basis. This would provide the racking industry with a mechanism for continuous monitoring of the racking as opposed to quarterly or annual racking inspections, providing a more safer operating environment.
Author Contributions
Conceptualistion, Methodology, Software, Investigation, Formal Analysis, Data Curation, Writing—original draft preparations, M.H.; Writing—review and editing, Supervision, T.C., Writing—review and editing, R.H. All authors have read and agreed to the published version of the manuscript.
Funding
This research received no external funding.
Informed Consent Statement
Not applicable.
Data Availability Statement
Data sharing not applicable.
Acknowledgments
We would like to appreciate Spark Intelligence UK for providing access to the warehouses for the data collection. We would also like to show our appreciation to all warehouses within the Yorkshire region UK, for permitting us to procure and assemble a representative dataset without which this research would not have been possible. As a result of this collaboration, we have been successful in assembling the first racking defect dataset based on real images, that can be utilized by developers for creating novel AI enabled architectures for automated racking inspection.
Conflicts of Interest
The authors declare no conflict of interest.
References
- Dong, C.-Z.; Catbas, F.N. A review of computer vision–based structural health monitoring at local and global levels. Struct. Health Monit. 2020, 20, 692–743. [Google Scholar] [CrossRef]
- Zhu, H.-H.; Dai, F.; Zhu, Z.; Guo, T.; Ye, X.-W. Smart sensing technologies and their applications in civil infrastructures 2016. J. Sens. 2016, 2016, 8352895. [Google Scholar] [CrossRef]
- Krizhevsky, A.; Sutskever, I.; Hinton, G.E. ImageNet classification with deep convolutional neural networks. Commun. ACM 2017, 60, 84–90. [Google Scholar] [CrossRef]
- Ran, H.; Wen, S.; Shi, K.; Huang, T. Stable and compact design of Memristive GoogLeNet neural network. Neurocomputing 2021, 441, 52–63. [Google Scholar] [CrossRef]
- Yang, Z. Classification of picture art style based on VGGNET. J. Phys. Conf. Ser. 2021, 1774, 012043. [Google Scholar] [CrossRef]
- Gajja, M. Brain tumor detection using mask R-CNN. J. Adv. Res. Dyn. Control Syst. 2020, 12, 101–108. [Google Scholar] [CrossRef]
- Liu, S. Pedestrian detection based on Faster R-CNN. Int. J. Perform. Eng. 2019, 15, 1792. [Google Scholar] [CrossRef]
- Fu, L.; Majeed, Y.; Zhang, X.; Karkee, M.; Zhang, Q. Faster R–CNN–based apple detection in dense-foliage fruiting-wall trees using RGB and depth features for robotic harvesting. Biosyst. Eng. 2020, 197, 245–256. [Google Scholar] [CrossRef]
- Litjens, G.; Kooi, T.; Bejnordi, B.E.; Setio, A.A.A.; Ciompi, F.; Ghafoorian, M.; Van Der Laak, J.A.; Van Ginneken, B.; Sánchez, C.I. A survey on deep learning in medical image analysis. Med. Image Anal. 2017, 42, 60–88. [Google Scholar] [CrossRef] [Green Version]
- Farinella, G.M.; Kanade, T.; Leo, M.; Medioni, G.G.; Trivedi, M. Special issue on assistive computer vision and robotics—Part I. Comput. Vis. Image Underst. 2016, 148, 1–2. [Google Scholar] [CrossRef]
- Hansen, L.; Siebert, M.; Diesel, J.; Heinrich, M.P. Fusing information from multiple 2D depth cameras for 3D human pose estimation in the operating room. Int. J. Comput. Assist. Radiol. Surg. 2019, 14, 1871–1879. [Google Scholar] [CrossRef]
- Ghosh, S.; Pal, A.; Jaiswal, S.; Santosh, K.C.; Das, N.; Nasipuri, M. SegFast-V2: Semantic image segmentation with less parameters in deep learning for autonomous driving. Int. J. Mach. Learn. Cybern. 2019, 10, 3145–3154. [Google Scholar] [CrossRef]
- Grigorescu, S.; Trasnea, B.; Cocias, T.; Macesanu, G. A survey of deep learning techniques for autonomous driving. J. Field Robot. 2019, 37, 362–386. [Google Scholar] [CrossRef]
- Grigorescu, S.; Cocias, T.; Trasnea, B.; Margheri, A.; Lombardi, F.; Aniello, L. Cloud2Edge elastic AI framework for prototyping and deployment of AI inference engines in autonomous vehicles. Sensors 2020, 20, 5450. [Google Scholar] [CrossRef] [PubMed]
- Grigorescu, S.M.; Trasnea, B.; Marina, L.; Vasilcoi, A.; Cocias, T. NeuroTrajectory: A Neuroevolutionary approach to local state trajectory learning for autonomous vehicles. IEEE Robot. Autom. Lett. 2019, 4, 3441–3448. [Google Scholar] [CrossRef] [Green Version]
- Cocias, T.; Razvant, A.; Grigorescu, S. GFPNet: A deep network for learning shape completion in generic fitted primitives. IEEE Robot. Autom. Lett. 2020, 5, 4493–4500. [Google Scholar] [CrossRef]
- Zubritskaya, I.A. Industry 4.0: Digital transformation of manufacturing industry of the Republic of Belarus. Digit. Transform. 2019, 3, 23–38. [Google Scholar] [CrossRef] [Green Version]
- Cao, B.; Wei, Q.; Lv, Z.; Zhao, J.; Singh, A.K. Many-objective deployment optimization of edge devices for 5G networks. IEEE Trans. Netw. Sci. Eng. 2020, 7, 2117–2125. [Google Scholar] [CrossRef]
- Sun, S.; Zheng, X.; Villalba-Díez, J.; Ordieres-Meré, J. Data handling in industry 4.0: Interoperability based on distributed ledger technology. Sensors 2020, 20, 3046. [Google Scholar] [CrossRef]
- Wang, X.; Hua, X.; Xiao, F.; Li, Y.; Hu, X.; Sun, P. Multi-object detection in traffic scenes based on improved SSD. Electronics 2018, 7, 302. [Google Scholar] [CrossRef] [Green Version]
- Hu, X.; Liu, Y.; Zhao, Z.; Liu, J.; Yang, X.; Sun, C.; Chen, S.; Li, B.; Zhou, C. Real-time detection of uneaten feed pellets in underwater images for aquaculture using an improved YOLO-V4 network. Comput. Electron. Agric. 2021, 185, 106135. [Google Scholar] [CrossRef]
- Neupane, D.; Kim, Y.; Seok, J.; Hong, J. CNN-based fault detection for smart manufactuing. Appl. Sci. 2021, 11, 11732. [Google Scholar] [CrossRef]
- Adibhatla, V.A.; Chih, H.-C.; Hsu, C.-C.; Cheng, J.; Abbod, M.F.; Shieh, J.-S. Defect detection in printed circuit boards using you-only-look-once convolutional neural networks. Electronics 2020, 9, 1547. [Google Scholar] [CrossRef]
- Li, Y.; Huang, H.; Xie, Q.; Yao, L.; Chen, Q. Research on a surface defect detection algorithm based on MobileNet-SSD. Appl. Sci. 2018, 8, 1678. [Google Scholar] [CrossRef] [Green Version]
- Farahnakian, F.; Koivunen, L.; Makila, T.; Heikkonen, J. Towards Autonomous Industrial Warehouse Inspection. In Proceedings of the 2021 26th International Conference on Automation and Computing (ICAC), Portsmouth, UK, 2–4 September 2021. [Google Scholar] [CrossRef]
- Rack Armour. The Rack Group. Available online: https://therackgroup.com/product/rack-armour/ (accessed on 25 May 2022).
- RE RackBull®. Boplan, 25 September 2015. Available online: https://www.boplan.com/en/products/flex-impactr/rack-protection/re-rackbullr (accessed on 25 May 2022).
- Warehouse Racking Impact Monitoring|RackEye from A-SAFE. A-SAFE. Available online: https://www.asafe.com/en-gb/products/rackeye/ (accessed on 25 May 2022).
- Raspberry Pi 4 Model B. The Pi Hut. Available online: https://thepihut.com/collections/raspberry-pi/products/raspberry-pi-4-model-b (accessed on 25 May 2022).
Figure 1.
Abstract solution comparison.

Figure 2.
Data procurement strategy.

Figure 3.
Data preprocessing.

Figure 4.
Considerations for bounding boxes (A) Tightly bound (correct), (B) Loosely bound (incorrect), (C) Occluded Damage (correct) and (D) Occluded Damage (incorrect).
Figure 4.
Considerations for bounding boxes (A) Tightly bound (correct), (B) Loosely bound (incorrect), (C) Occluded Damage (correct) and (D) Occluded Damage (incorrect).

Figure 5.
Domain specific augmentations (A) original, (B) Random Rotation, (C) Brightness adjustment (darker), (D) Brightness adjustment (lighter) and (E) Gaussian blur.
Figure 5.
Domain specific augmentations (A) original, (B) Random Rotation, (C) Brightness adjustment (darker), (D) Brightness adjustment (lighter) and (E) Gaussian blur.

Figure 6.
SSD coupled with MobileNetV2 as backbone.

Figure 7.
Proposed system architecture.

Figure 8.
Proposed device placement and resultant coverage.

Figure 9.
Inference comparison between the two architectures, (A) Fahimeh Farahnakian, (B) Predictions on our dataset.
Figure 9.
Inference comparison between the two architectures, (A) Fahimeh Farahnakian, (B) Predictions on our dataset.


Table 1.
Transformed dataset.
| Data | Samples |
|---|---|
| Training | 19,600 |
| Validation | 78 |
| Test | 39 |
Table 2.
Hyperparameters.
| Batch Size | 24 |
| Steps | 10,000 |
| Learning Rate | 0.004 |
| Optimizer | RMS-PROP |
Table 3.
Model evaluation.
| MAP@50 (IOU) | 92.7% |
| Initial Loss | 4.54 |
| Final Loss | 1.96 |
| Training Time | 1 h:54 m:41 s |
Table 4.
Architectural performance.
| Model | Input | GMAC (G) | Parameters (MB) |
|---|---|---|---|
| MobileNetv2-SSD | 300 × 300 | 2.88 | 22 |
| Faster-RCNN | 600 × 850 | 344 | 523 |
Table 5.
Recent work comparison.
| Our Research | Research by [25] | |
|---|---|---|
| Approach | Object Detection | Image Segmentation |
| Dataset Size | 19,717 | 75 |
| Detector | Single Shot | Two Stage |
| Architecture | MobileNetV2-SSD | Mask-RCNN-ResNet-101 |
| MAP@0.5(IoU) | 92.7% | 93.45% |
Publisher’s Note: MDPI stays neutral with regard to jurisdictional claims in published maps and institutional affiliations. |
© 2022 by the authors. Licensee MDPI, Basel, Switzerland. This article is an open access article distributed under the terms and conditions of the Creative Commons Attribution (CC BY) license (https://creativecommons.org/licenses/by/4.0/).
Share and Cite
MDPI and ACS Style
Hussain, M.; Chen, T.; Hill, R. Moving toward Smart Manufacturing with an Autonomous Pallet Racking Inspection System Based on MobileNetV2. J. Manuf. Mater. Process. 2022, 6, 75. https://doi.org/10.3390/jmmp6040075
AMA Style
Hussain M, Chen T, Hill R. Moving toward Smart Manufacturing with an Autonomous Pallet Racking Inspection System Based on MobileNetV2. Journal of Manufacturing and Materials Processing. 2022; 6(4):75. https://doi.org/10.3390/jmmp6040075
Chicago/Turabian StyleHussain, Muhammad, Tianhua Chen, and Richard Hill. 2022. "Moving toward Smart Manufacturing with an Autonomous Pallet Racking Inspection System Based on MobileNetV2" Journal of Manufacturing and Materials Processing 6, no. 4: 75. https://doi.org/10.3390/jmmp6040075