
Determination of the Shear Angle in the Orthogonal Cutting Process

Institute for Machine Tools, University of Stuttgart, Holzgartenstraße 17, 70174 Stuttgart, Germany
*
Author to whom correspondence should be addressed.
J. Manuf. Mater. Process. 2022, 6(6), 132; https://doi.org/10.3390/jmmp6060132
Submission received: 25 September 2022
/
Revised: 18 October 2022
/
Accepted: 26 October 2022
/
Published: 28 October 2022
(This article belongs to the Special Issue Advances in Metal Cutting and Cutting Tools)
Abstract
:Determination of the shear angle by experimental and analytical methods, as well as by numerical simulation, is presented. Experimental determination of the shear angle was performed by analyzing the chip roots obtained by the method of cutting process quick stop through purposeful fracture of the workpiece in the area surrounding the primary cutting zone. The analytical determination of the shear angle was carried out using the chip compression ratio and was based on the principle of a potential energy minimum. Measurement of the shear angle in the numerical simulation of orthogonal cutting was performed using the strain rate pattern of the machined material at the selected simulation moment. It was analyzed how the parameters of the Johnson–Cook constitutive equation and the friction model affect the shear angle value. The parameters with a predominant effect on the shear angle were determined. Then the generalized values of these parameters were established with a software algorithm based on identifying the intersection of the constitutive equation parameter sets. The use of generalized parameters provided the largest deviation between experimental and simulated shear angle values from 9% to 18% and between simulated and analytically calculated shear angle values from 7% to 12%.
1. Introduction
Thermo-mechanical and geometrical characteristics of the cutting process, one of the main methods of shaping various products, ensuring their necessary accuracy and manufacturing quality, have been the subject of research by numerous researchers for more than 150 years. Along with cutting force and temperature, chip morphology and chip compression ratio, and contact length of the tool rake face with the chip, the shear angle belongs to the main characteristics of cutting that uniquely determine the machining process [1]. It is difficult to overestimate the knowledge of the shear angle since it provides an opportunity to determine such important characteristics of the cutting process as energy consumption for chip formation, chip compression ratio and its thickness, kinetic characteristics of the chip forming zone, etc.
The shear angle has been used very often in modeling and experimental studies of the cutting process [2]. This cutting characteristic serves as a reference value of simulation results for numerical cutting models [3]. The value of the shear angle can serve as a reference point to assess the correctness of the constitutive equation parameters and of the friction model parameters for their use in numerical cutting models. Thus, the determination of the shear angle is an important aspect in the study of the cutting process mechanics, which will improve the accuracy and reliability of the modeling results of various cutting processes. This paper discusses experimental, analytical, and simulation studies on determining the shear angle for further use in analytical and numerical cutting models.
The shear angle is the causal result of complex thermo-mechanical mechanisms and a variety of influencing factors. An investigation of the shear angle can therefore only be carried out relatively. The methods and models developed in recent decades for determining the shear angle can be divided into three main areas: analytical models, experimental study, and numerical simulation. As the cutting process is a process accompanied by large plastic deformations, significant attention was paid to the analytical determination of the size and position of the deformation zone, since many practically important characteristics of the cutting process depend on these parameters. The basic dimensions and position of the deformation zone for a single shear plane, shown in Figure 1, are characterized by two main parameters: the inclination angle of the conventional shear plane ϕ and the contact length of the tool rake face with the chip lC. However, to simplify this problem, the theoretical definition of only one parameter was solved—the inclination angle of the conditional shear plane ϕ.
The first known solution to this problem was proposed by K. A. Zworykin [4]. Using the scheme of the deformation zone with a single shear plane and applying the minimum condition of the chip forming force, he obtained the following equation for determining the shear angle:
where γ is the rake angle, η is the average friction angle on the tool rake face, η1 is the “internal friction” angle, taking into account the influence of normal stresses on tangential stresses and ω is the action angle of the equipotential chip forming force.
Subsequently, solutions in Formula (1) and close solutions to this form were obtained by other researchers. Ernst and Merchant [5], using the scheme of the deformation zone with a single shear plane and the hypothesis about the minimum energy required to deform the machined material, obtained the equation for calculating the shear angle ϕ as follows [6]:
This hypothesis was subsequently used by many researchers. The chip forming power minimum was investigated under the assumption that all parameters determining this power were constant, except for the shear angle ϕ. In this case, the results of calculating the shear angle using the hypothesis of chip forming power minimum and minimum chip forming forces were very close.
Lee and Shaffer used the sliding line method to determine the shear angle [7]. In this case, one of the sliding lines was taken as a conventional shear plane, and a set of other sliding lines was arranged perpendicular to the first line at the friction angle η to the tool rake face. This assumption defined the geometry of the plastic region and allowed the shear angle to be defined as:
De Chiffre also used the minimum energy principle to determine the basic characteristics of the cutting process, in particular the shear angle, for dry and wet cutting [8]. Furthemore, De Chiffre further analyzed existing models for determining the main characteristics of the cutting process. The steps that are reasonable to take for extending the validity range of simple shear zone models was discussed [9]. The application of the analytical models considered for spatial processing was considered by Usui and colleagues [10]. Ueda and his colleagues examined machining at different states of the cutting process in an experimental study of the machining equation compatibility [11]. As a result, the most adaptive machining equation was proposed. The researches carried out at this stage allowed to identify the main most promising areas for further developments in the analytical determination of the main characteristics of cutting [12,13].
Improving some characteristics that were simplified or missed in previous models was the next significant step in the development of analytical cutting models. Models with a single conditional shear plane assumed uniform shear stress in the shear plane and the absence of strain hardening. In addition, it was assumed that the friction in the contact between the tool rake face and the chip is characterized by a constant friction coefficient. More general cutting models were obtained by assuming the development of machined material deformation in a narrow band along the shear plane. The effect of yield strength varying with strain, and sometimes with strain rate and temperature, was considered by Oxley [14]. Oxley determined the inclination angle of the conventional shear plane by limiting the chip formation zone with parallel lines. As a result of this constraint, the strain rate and strain at each point in the primary deformation zone could be calculated. The strain rate was derived from the variation in velocity as a function of position, and the strains were calculated by integrating the strain rate over time along the flow line. Similar assumptions were made to calculate strain rates and strains in the secondary deformation zone. Machining mechanics was further developed in Oxley’s predictive machining theory [15,16]. Elements of this theory have found wide application in analytical studies of cutting processes by extending Oxley’s mechanistic model, see e. g., [17,18,19,20,21]. To characterize the mechanical properties of the machined material, these studies generally use the Johnson–Cook constitutive equation [22].
Armarego and Brown noted that the simplest and most perfect solutions for determining the shear angle were obtained by using the deformation zone scheme as a single shear plane [23]. This is also confirmed in the studies by Grzesik [24] and many other authors. The question of whether a particular scheme can be applied is closely related to the other assumptions used to solve the problem. This requires special justification in each case. In the analytical solution of the chip zone slope problem, researchers have used various principles: the variational principle or the energy minimum hypothesis, see e.g., [6,25], the construction method of sliding line fields see e.g., [7], thermal and mechanical energy balance equation [26]. The possibility and validity of applying these principles were discussed by Kobayashi and Thomsen [27]. They showed that the thermal and mechanical energy balance equation is equivalent to the force equilibrium condition and is not sufficient to determine the position of the chip formation zone. In addition to the conditions of force equilibrium or the condition of balance, an additional principle is needed. Based on the ideal plastic body theory, Kobayashi and Thomsen concluded that the slip line method is the lower estimate of the work applied in deforming the machined material. The deformation energy minimum method, on the other hand, is the upper estimate of this work [13].
Variation principles have found wide application in solving problems of continuum mechanics due to their relative simplicity [28,29]. Simplification has been achieved by the fact that the possible velocities in the relative displacement of the contacted bodies should be compatible only with the medium continuity equations. These velocities do not have to be consistent with the equations of motion in stresses [28]. Tsekhanov and Storchak applied the variational principle to develop an analytical cutting model, taking into account the contact interaction conditions of the tool with the chip in the secondary cutting zone and of the tool with the workpiece in the tertiary cutting zone [25].
A significant part of the studies on creating analytical models for determining the shear angle has also been focused on taking into account different conditions of the cutting process. Lee et al. studied the effect of the machined material anisotropy on the shear angle value [30]. They proposed an analytical correlation for determining the shear angle using a minimum of the Taylor factor. A determination of the shear angle by the generalization of the Lee–Shaffer solution [7] was proposed by A. M. Kovrizhnykh [31]. A new model for determining the shear angle for a special alloy GH4169 was suggested by Zou et al. [32]. An analytical calculation of the shear angle, taking into account the machined material properties and cutting modes was proposed by Toropov and Ko [33]. The experimental determination of shear angle on chip compression ratio during the machining of steel and aluminum alloys showed a satisfactory agreement with the calculation results in this study.
Experimental methods for determining the shear angle can predominantly be divided into three groups: measurement of chip thickness from microphotographs and subsequent calculation of chip compression ratio; direct measurement from microphotographs of the chip root using methods of the quick-stop cutting process; direct measurement of the inclination angle on the conventional shear plane by means of high-speed filming of the cutting process (imaging techniques).
To determine the shear angle based on the chip compression ratio (the first group), a metallographic section of the chip is collected and prepared, its thickness is measured, and the chip compression ratio is determined, see, e.g., [34,35,36]. In this case, the shear angle is calculated according to the dependence known from the cutting process mechanics (see Equation (4)). This method is mainly used when examining the cutting process of ductile metals, which is accompanied by the formation of flow chips, as in the study of the orthogonal cutting [37,38], and in the case of the spatial cutting processes study [39]. The application of this method in the case of shear band chip formation (serrated chips), e.g., when machining hard-to-machine materials or titanium alloys, requires multiple measurements of the chip thickness due to its significant variability [40,41].
In the case of interrupted cutting with the quick-stop method, the tool is abruptly separated from the workpiece so that the deformations in the material caused by the cutting process are maintained [42,43]. The chip root obtained in this way can be microscopically analyzed after a metallographic preparation. However, it must always be considered that the cutting interruption cannot proceed infinitely fast due to the masses being accelerated. Therefore, the chip root obtained in this way does not present a stationary condition at a given cutting speed, but rather a state that arises during the transient interruption of the cut [23,24]. A quick stop of the cutting process is realized by moving the tool or workpiece out of the cutting zone [44]. Various mechanisms are used to remove them from the cutting zone, such as compression springs [45], potential masses [46], electromagnetic devices [47], and others.
The method of high-speed filming of the cutting process, so-called imaging techniques, which has appeared in recent decades, makes it possible to determine the shear angle quite accurately and conveniently [48]. This method also provides a continuous measurement of the shear angle during the cutting process [49]. A limitation of this method is that it is mainly applicable to orthogonal and quasi-orthogonal cutting processes [50].
Recently, numerical cutting models, such as FEM models, have been a promising and powerful tool for determining the main characteristics of the cutting process, in particular the shear angle [1,3]. The determination of the shear angle by using finite element models of the cutting process has been performed according to two main scenarios. Either the chip compression ratio has been used to measure the chip thickness during simulation (see e.g., [36,51,52,53,54]) or the inclination angle of the conventional shear plane has been directly measured on a photo of the cutting process simulation (see e.g., [32,55,56,57,58]). Establishing the chip compression ratio from the results of the cutting simulation has been usually performed with planar FEM cutting models. In this case, the chip thickness has been measured both in the region around the contact between the tool rake face and the chip [51,52,54] as well as outside the area of this contact [36,53]. If it has been necessary to simulate spatial cutting processes, the FEM model has been linearized and reduced to a planar model [51]. The shear angle has been directly measured at a pre-selected simulation moment either from the stress pattern in the machined material [32,55] or from the strain or strain rate pattern [56,57,58].
The current state of knowledge presented above indicates a long development of research on determining the shear angle in the cutting process. Numerous influencing parameters considerably complicate the imitation modeling of the shear angle. However, the study of thermomechanical and kinetic processes by the numerical simulation of cutting can only be performed by the correct determination of the shear angle. This paper shows an approach for the analytical determination and inverse adaptation of the shear angle value in the simulation to experimentally determined reference values when machining AISI 1045 steel.
2. Materials and Methods
2.1. Materials
Experimental studies of the shear angle value were performed with the linear turning and milling center CTX 420 by Gildemeister—Figure 2a. Heat-treatable AISI 1045 steel was used as test material. The mechanical and thermal properties of this steel are listed in Table 1.
The workpiece made of annealed AISI 1045 steel, was a roll with a diameter of 80 mm and an original length of 200 mm. Two predetermined fracture points, which were point-symmetrical to the center of the workpiece, are used to obtain two chip roots for each test round. This was achieved by drilling two holes parallel to the axis of the workpiece, the wall of which was located close enough to the outer surface of the workpiece to ensure the realization of fracture when the cutter passes through the area of these holes. Preformed copper pins were pressed into the holes—Figure 2b,d. The workpiece was clamped in the 3-jaw chuck of the machine and additionally supported by a headstock (see Figure 2a). A groove was turned into the workpiece for each test round to ensure a free quasi orthogonal cutting. In this way, a 3 mm wide disc was formed, which was machined during the test run. After each test cut of the disc, the remaining part of it was removed and a new disc was prepared by turning a new groove.
The dry quasi orthogonal cutting process was carried out using the tool with a clamped changeable cemented carbide insert SNMG-SM-1105 by Sandvik Coromant. The mechanical and thermal properties of this carbide insert are listed in Table 1. The geometry of the tool wedge necessary for cutting was guaranteed by positioning and grinding as well as polishing the tool clearance face [61,62]. The tool clearance angle was 8°, and the radius of cutting-edge rounding was 20 µm in all tests. Experimental studies were carried out for three values of the tool rake angle γ: −10°, 0°, and 10°. The tool was clamped in a 3-component dynamometer, type 9121 by Kistler, for the measurement of cutting forces (see Figure 2a). The cutting process of AISI 1045 steel was analyzed for varying cutting speeds VC: 48 m/min, 72 m/min, 96 m/min, and 144 m/min. The cutting speed values were chosen so that the Peclet similarity criterion (Peclet number) [63,64] was an integer and varied from 20 to 60 at a cutting depth of 0.2 mm. The cutting depth a (undeformed chip thickness) was 0.2 mm for all conducted studies.
To ensure the reliability of the obtained experimental values, each cutting test (for each value of cutting speed and tool rake angle) was repeated at least 5 times. Error bars were determined by the minimum and maximum experimental values of the shear angle and chip compression ratio. The confidence interval was chosen to be 0.9. The choice of the confidence interval was based on a scatter analysis of the separate experimental values of the shear angle and chip compression ratio. Since there were no significant differences between the individual measured values of the shear angle and chip compression ratio, the mean was used as a representative value of these measured data.
A schematic diagram of chip root formation is shown in Figure 2d. The chip roots resulting from the workpiece fracture as the tool passes over the pin (see Figure 2c) were collected for analysis after each test. Microphotographs of these chip roots were subjected to morphological analysis [65,66]. To perform this analysis, the collected chip roots were placed in a silicone box filled with a compound consisting of epoxy resin and hardener [66]. After the final curing of the compound, the samples were ground and polished with abrasive tools and pastes [61,62]. To analyze the microstructure, the polished end surface of the chip root was subjected to etching. Nitric acid with a concentration of 3% was chosen as an etchant [66]. The optical microscope Carl Zeiss Axio Observer was used for morphological analysis of the chip root, the determination of the shear angle, the chip compression ratio, and the analysis of the chip structure after etching—Figure 2c.
2.2. Methods
In addition to the experimental method of determining the shear angle described above, this cutting process characteristic was also established by analytical and numerical methods.
2.2.1. Analytic
To determine the shear angle with the analytical method, two basic approaches were used here: the chip compression ratio [12,14,67] and the variational method using the principle of minimum potential energy [25]. The determination of the shear angle ϕ according to the first approach was carried out by means of the dependence known from the mechanics of the cutting process [12,14,64]:
where, Ka—is the chip compression ratio.
The chip compression ratio was determined with one of the most common methods: the ratio of chip thickness to the undeformed chip thickness a (cutting depth for the case of the orthogonal cutting process) [12,14]:
where, aCh—is the chip thickness.
Establishing the shear angle ϕ according to the second approach was performed with the analytical cutting model [25], in which the balance of the total cutting power was taken into consideration. In this case, the total cutting power WC consisted of the plastic deformation power in the shear plane WS, the power of the friction forces on the tool rake face WFS and the power of the friction force on the tool clearance face WFC. The shear angle value was determined by the minimum of the total cutting power according to the known variation principle [25,28]:
The total cutting power WC and its components WS, WFS, WFC were calculated according to the following dependences [25]:
where w is the cutting width, τS is the tangential stress in the conditional shear plane, fr is the friction coefficient on the tool rake face, fC is the friction coefficient on the tool clearance face, lC is the wear mark value on the tool’s clearance face.
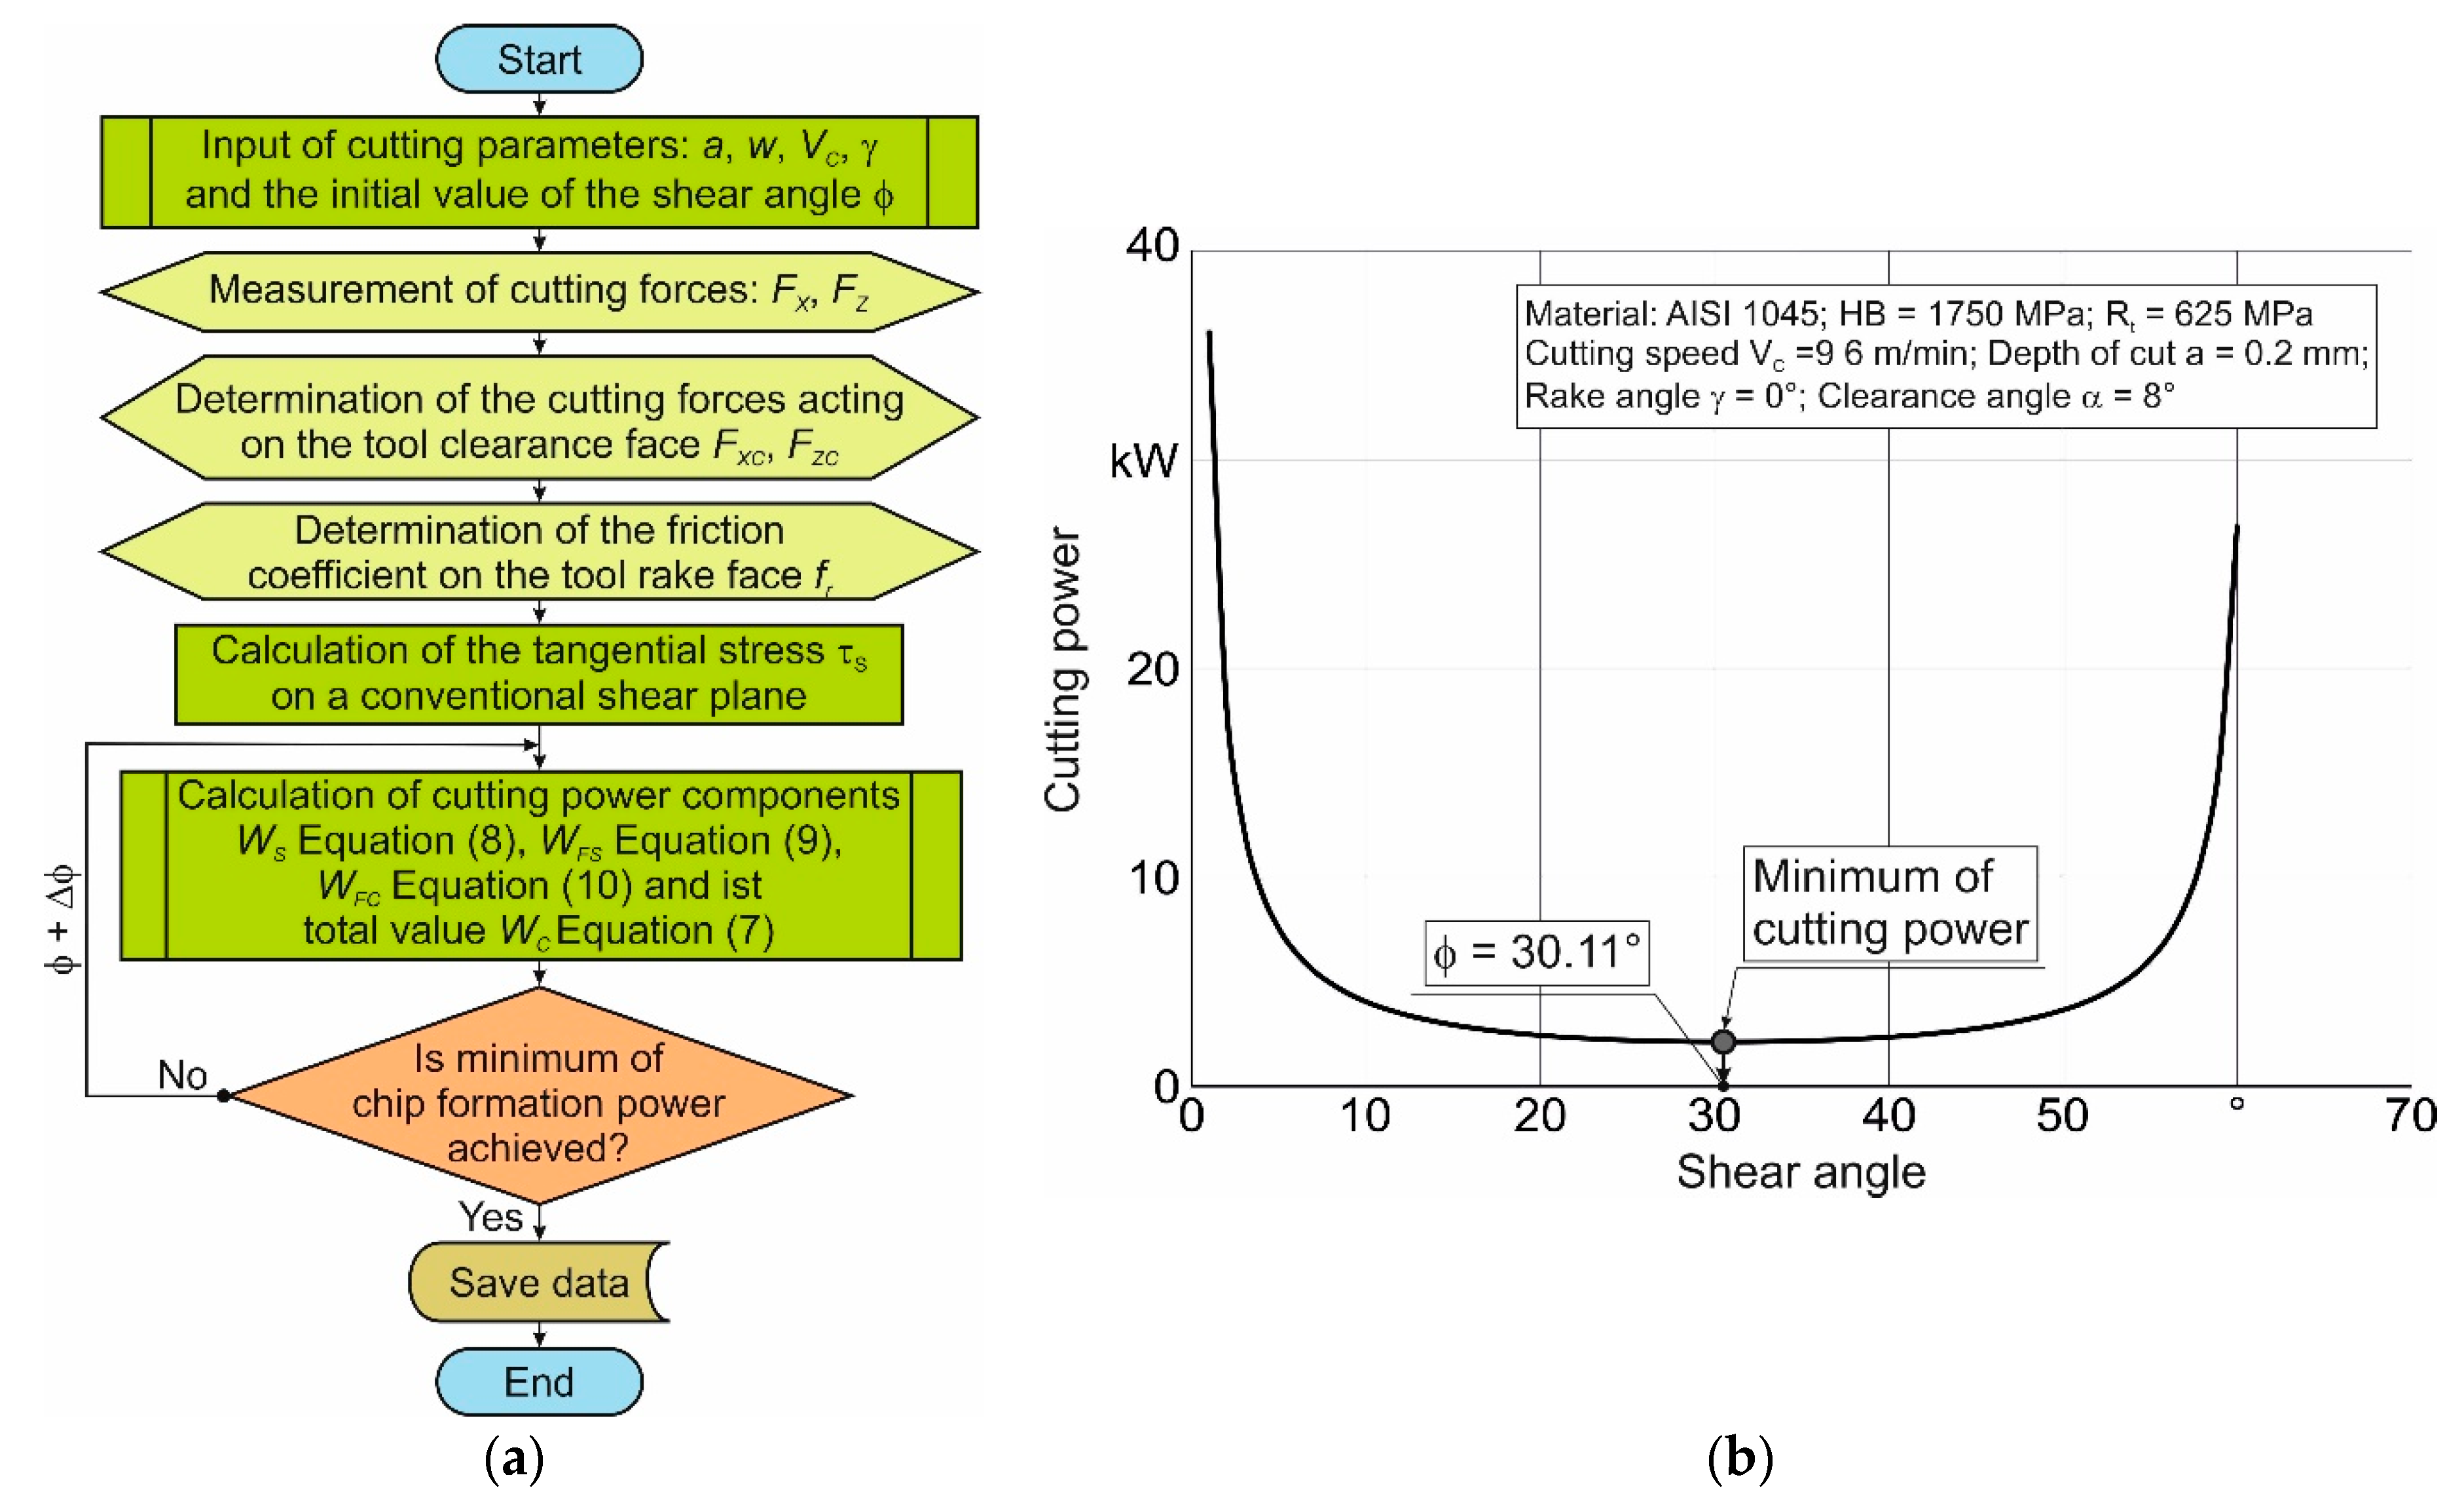
The flowchart of the software-implemented algorithm for determining the shear angle according to principle (6) is shown in Figure 3a. Figure 3b illustrates the variation of the total cutting power when determining the shear angle for one of the specific parameters set for the studied cutting process.
The main difficulties when calculating the total cutting power WC and its components (WS, WFS, WFC) are caused by determining the tangential stress τS in the conditional shear plane (see Figure 1) and determining the friction coefficient fr on the tool rake face. The tangential stress τS was determined by the following dependence [12,68]:
where FX and FZ are the experimental cutting and thrust forces respectively (in the case of orthogonal cutting), FXC and FZC are the cutting and thrust forces on the clearance face of the tool wedge (in the tertiary cutting zone) respectively.
The cutting forces FX and FZ were determined by measuring during experimental studies (see Figure 2a). The cutting forces on the tool clearance face FXC and FZC were determined by extrapolating the relationship between the measured cutting forces and the depth of cut a to zero depth of cut [12,64,68]. To calculate the tangential stress τS, the preliminary value of the shear angle ϕ established from the chip compression ratio Ka (see above) was used. The friction coefficient fr on the tool rake face was determined for the selected experimental conditions according to the methodology [68].
2.2.2. Simulation
The use of numerical simulation significantly reduces the effort to determine the cutting process characteristics, especially for real spatial machining processes, such as turning, drilling, milling, etc. A finite element model of the orthogonal cutting process was developed for the numerical simulation to determine of the shear angle. This model was developed based on an updated implicit Lagrangian formulation method. The workpiece material was modeled as an isotropic plastic type material [69]. Tool wear and deformation are not taken into account in the orthogonal cutting simulation to determine the shear angle, so a rigid type of tool material type was chosen. The material model of AISI 1045 steel was described by the Johnson–Cook constitutive equation [22] with the initial values of the model parameters presented in Table 2 [59,65].
The contacts between tool and chip as well as between tool and workpiece were reproduced separately using the Coulomb model in the secondary and tertiary cutting zones according to the methodology [68,70]. In this case, the contact in the secondary cutting zone was modeled separately for the plastic and elastic areas [68]. Chip formation when machining AISI 1045 steel is a continuous process with the generation of a flow chips [12,14], whereas, for example, the chip formation in the machining of titanium alloys, which is characterized by the generation of the serrated chips [65,71]. Therefore, a special damage model of the machined material [72] was not provided in the developed FE cutting model. In this case, the damage occurred automatically, according to the algorithm used in the software package [73].
An exemplary geometric model with a mesh and boundary conditions for a tool with a rake angle γ of 0° is shown in Figure 4.
The FE model was identical for tools with other rake angles taken into consideration in this study. The boundary conditions were defined by fixing the tool in the direction of the Z-axis, perpendicular to the cutting speed vector VC. The movements of the workpiece were constrained in all directions. The initial thermal conditions Tr were defined by the tool and workpiece boundaries not involved in the contact during simulation. The working movement of the tool at a cutting speed VC was set so that the cutting process was at its absolute movement in the negative direction of the X-axis. The depth of cutting (unformed chip thickness) was determined by the value a (see Figure 4).
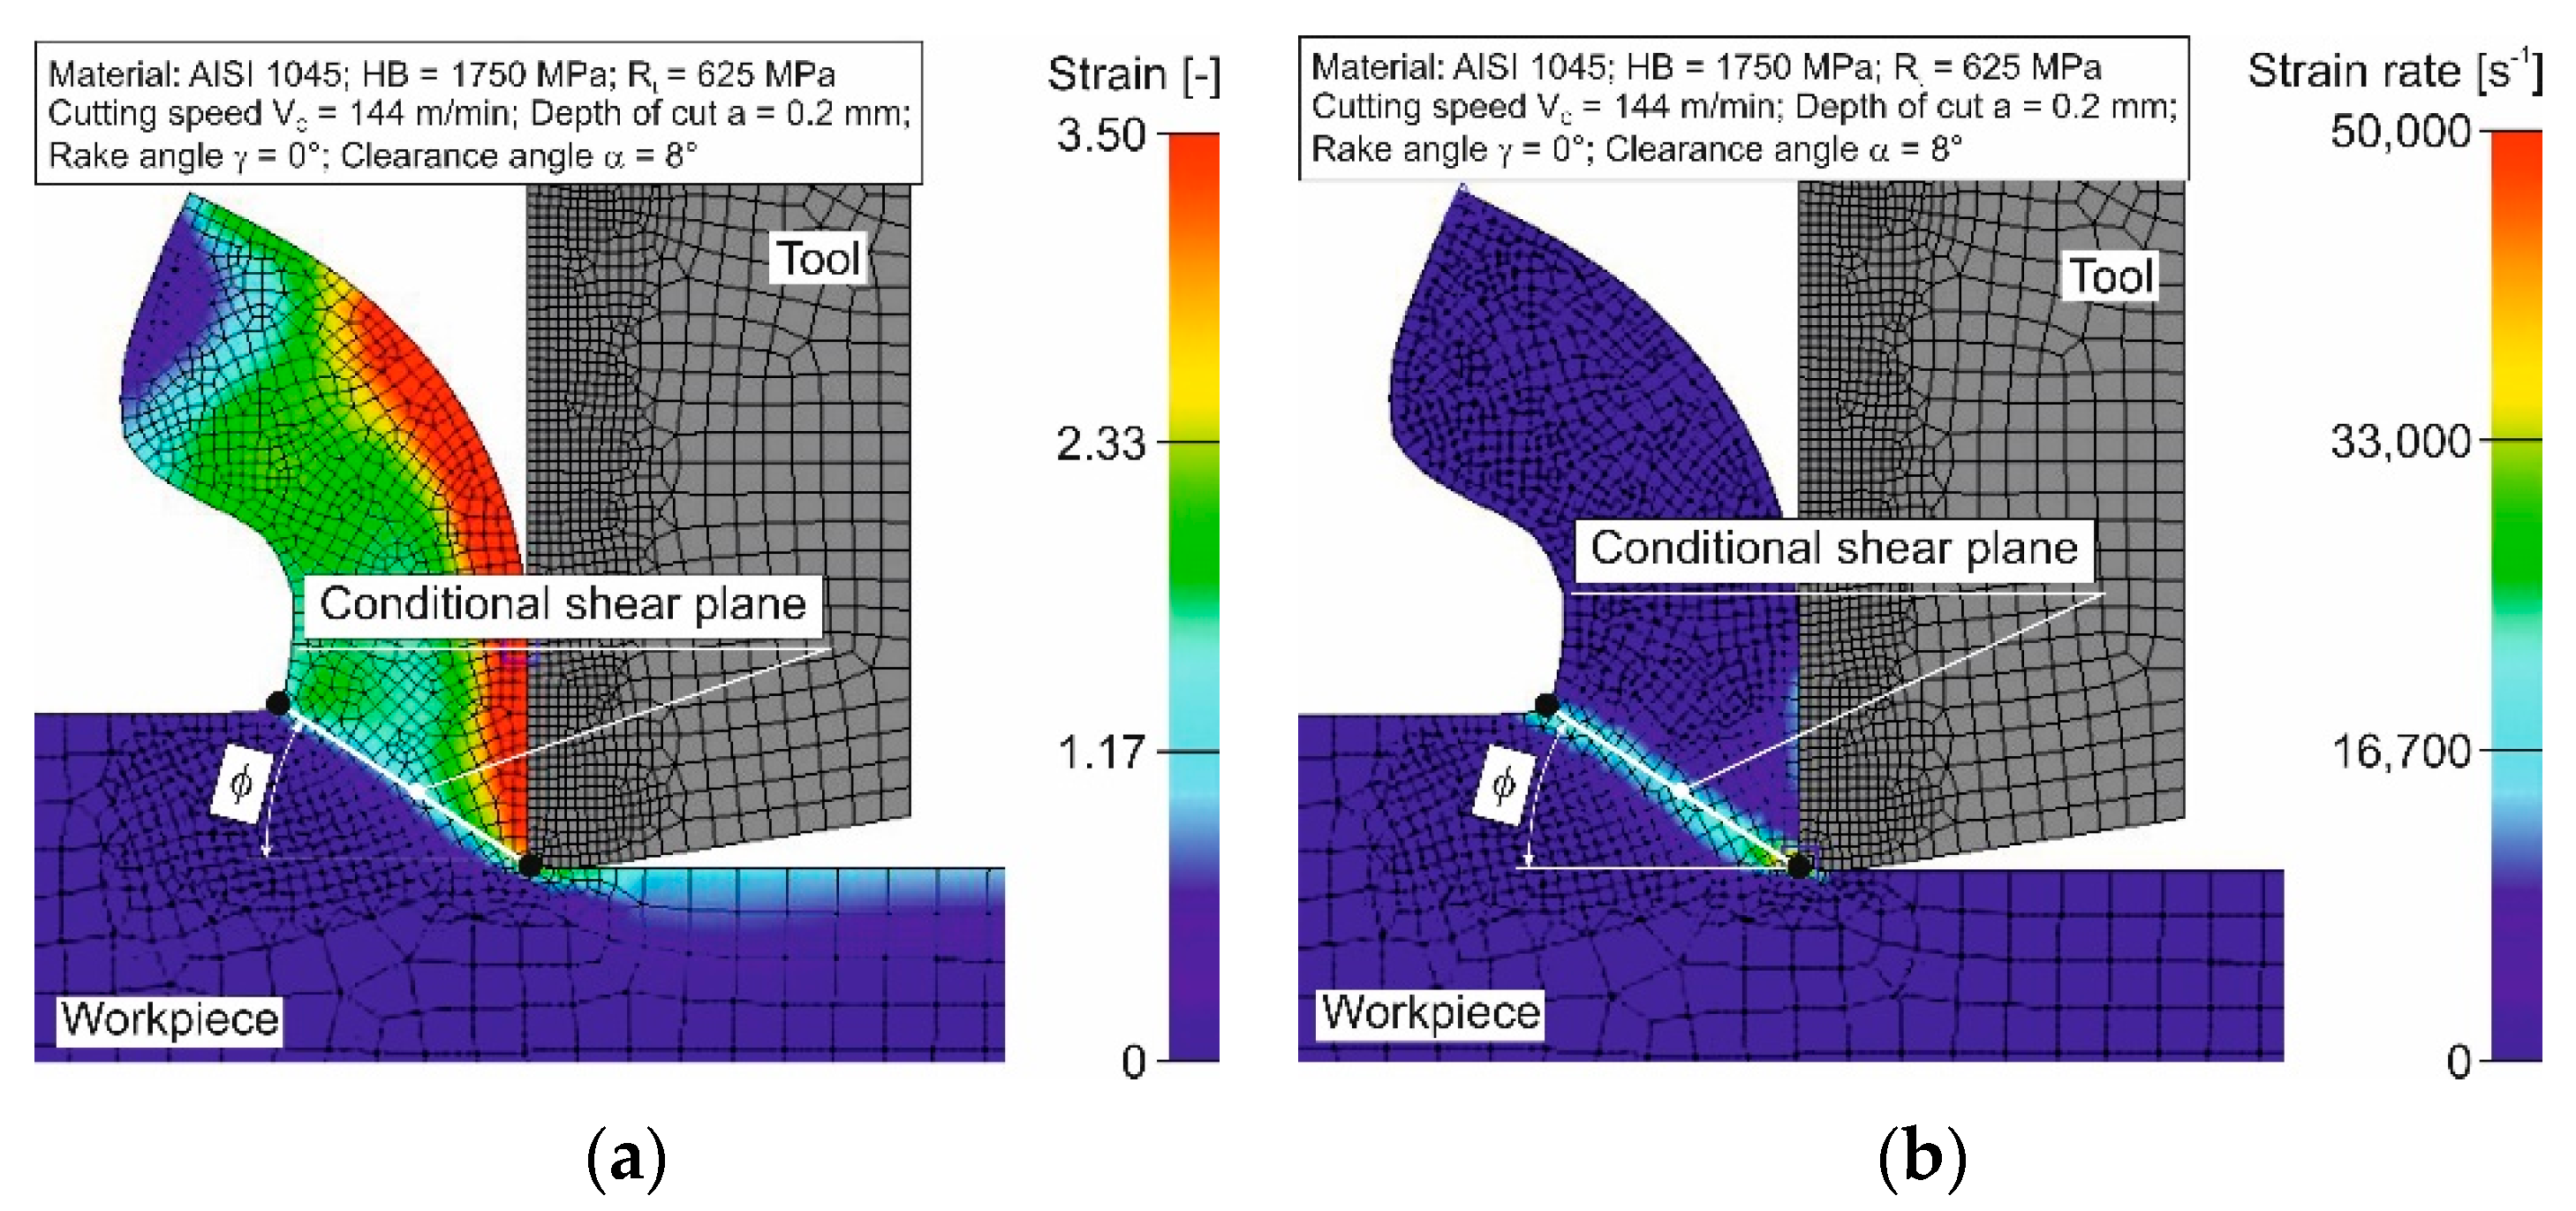
According to the distribution of strain or strain rates of the machined material, the most precise determination of the shear angle ϕ could be obtained when simulating the cutting process with the developed FE model—Figure 5. To establish the shear angle based on the deformation of the machined material, the conditional shear plane must be located parallel to the lower boundary of the essential deformation distribution of the machined material (see Figure 5a). In order to establish the shear angle from the strain rate of the machined material, the conditional shear plane must be located in the area of the highest strain rate values and parallel to the upper and lower boundaries of this strain rate distribution (see Figure 5b). The results of the shear angle determination for different conditions of the cutting process showed that the smallest scatter of shear angle values was achieved when it was established by the strain rate distribution of the machined material. This method was used to determine the shear angle value later on.
3. Results and Discussion
3.1. Experimental and Analytical Determination of the Shear Angle
The experimental determination of the shear angle was performed according to the methodology described in Section 2.1. Figure 6 shows the experimental dependence of the shear angle on the cutting speed for different values of the tool rake angle. The shear angle increased monotonically with rising cutting speed and decreased almost proportionally with increasing tool rake angle. The largest scatter of the measured values for the shear angle does not exceed 11% (see Figure 6).
Determination of the shear angle using the analytical method by the first approach (see Section 2.2) involves using the chip compression ratio. The chip compression ratio was determined experimentally by analyzing chip root microphotographs (see Section 2.1) as a ratio of chip thickness and depth of cut (undeformed chip thickness)—Equation (5). The dependence of the chip compression ratio on the cutting speed for different values of the tool rake angles is shown in Figure 7. The chip compression ratio decreases monotonically with increasing cutting speed and grows proportionally with decreasing tool rake angle (see Figure 7). The scatter of measured chip compression ratio values does not exceed 12%.
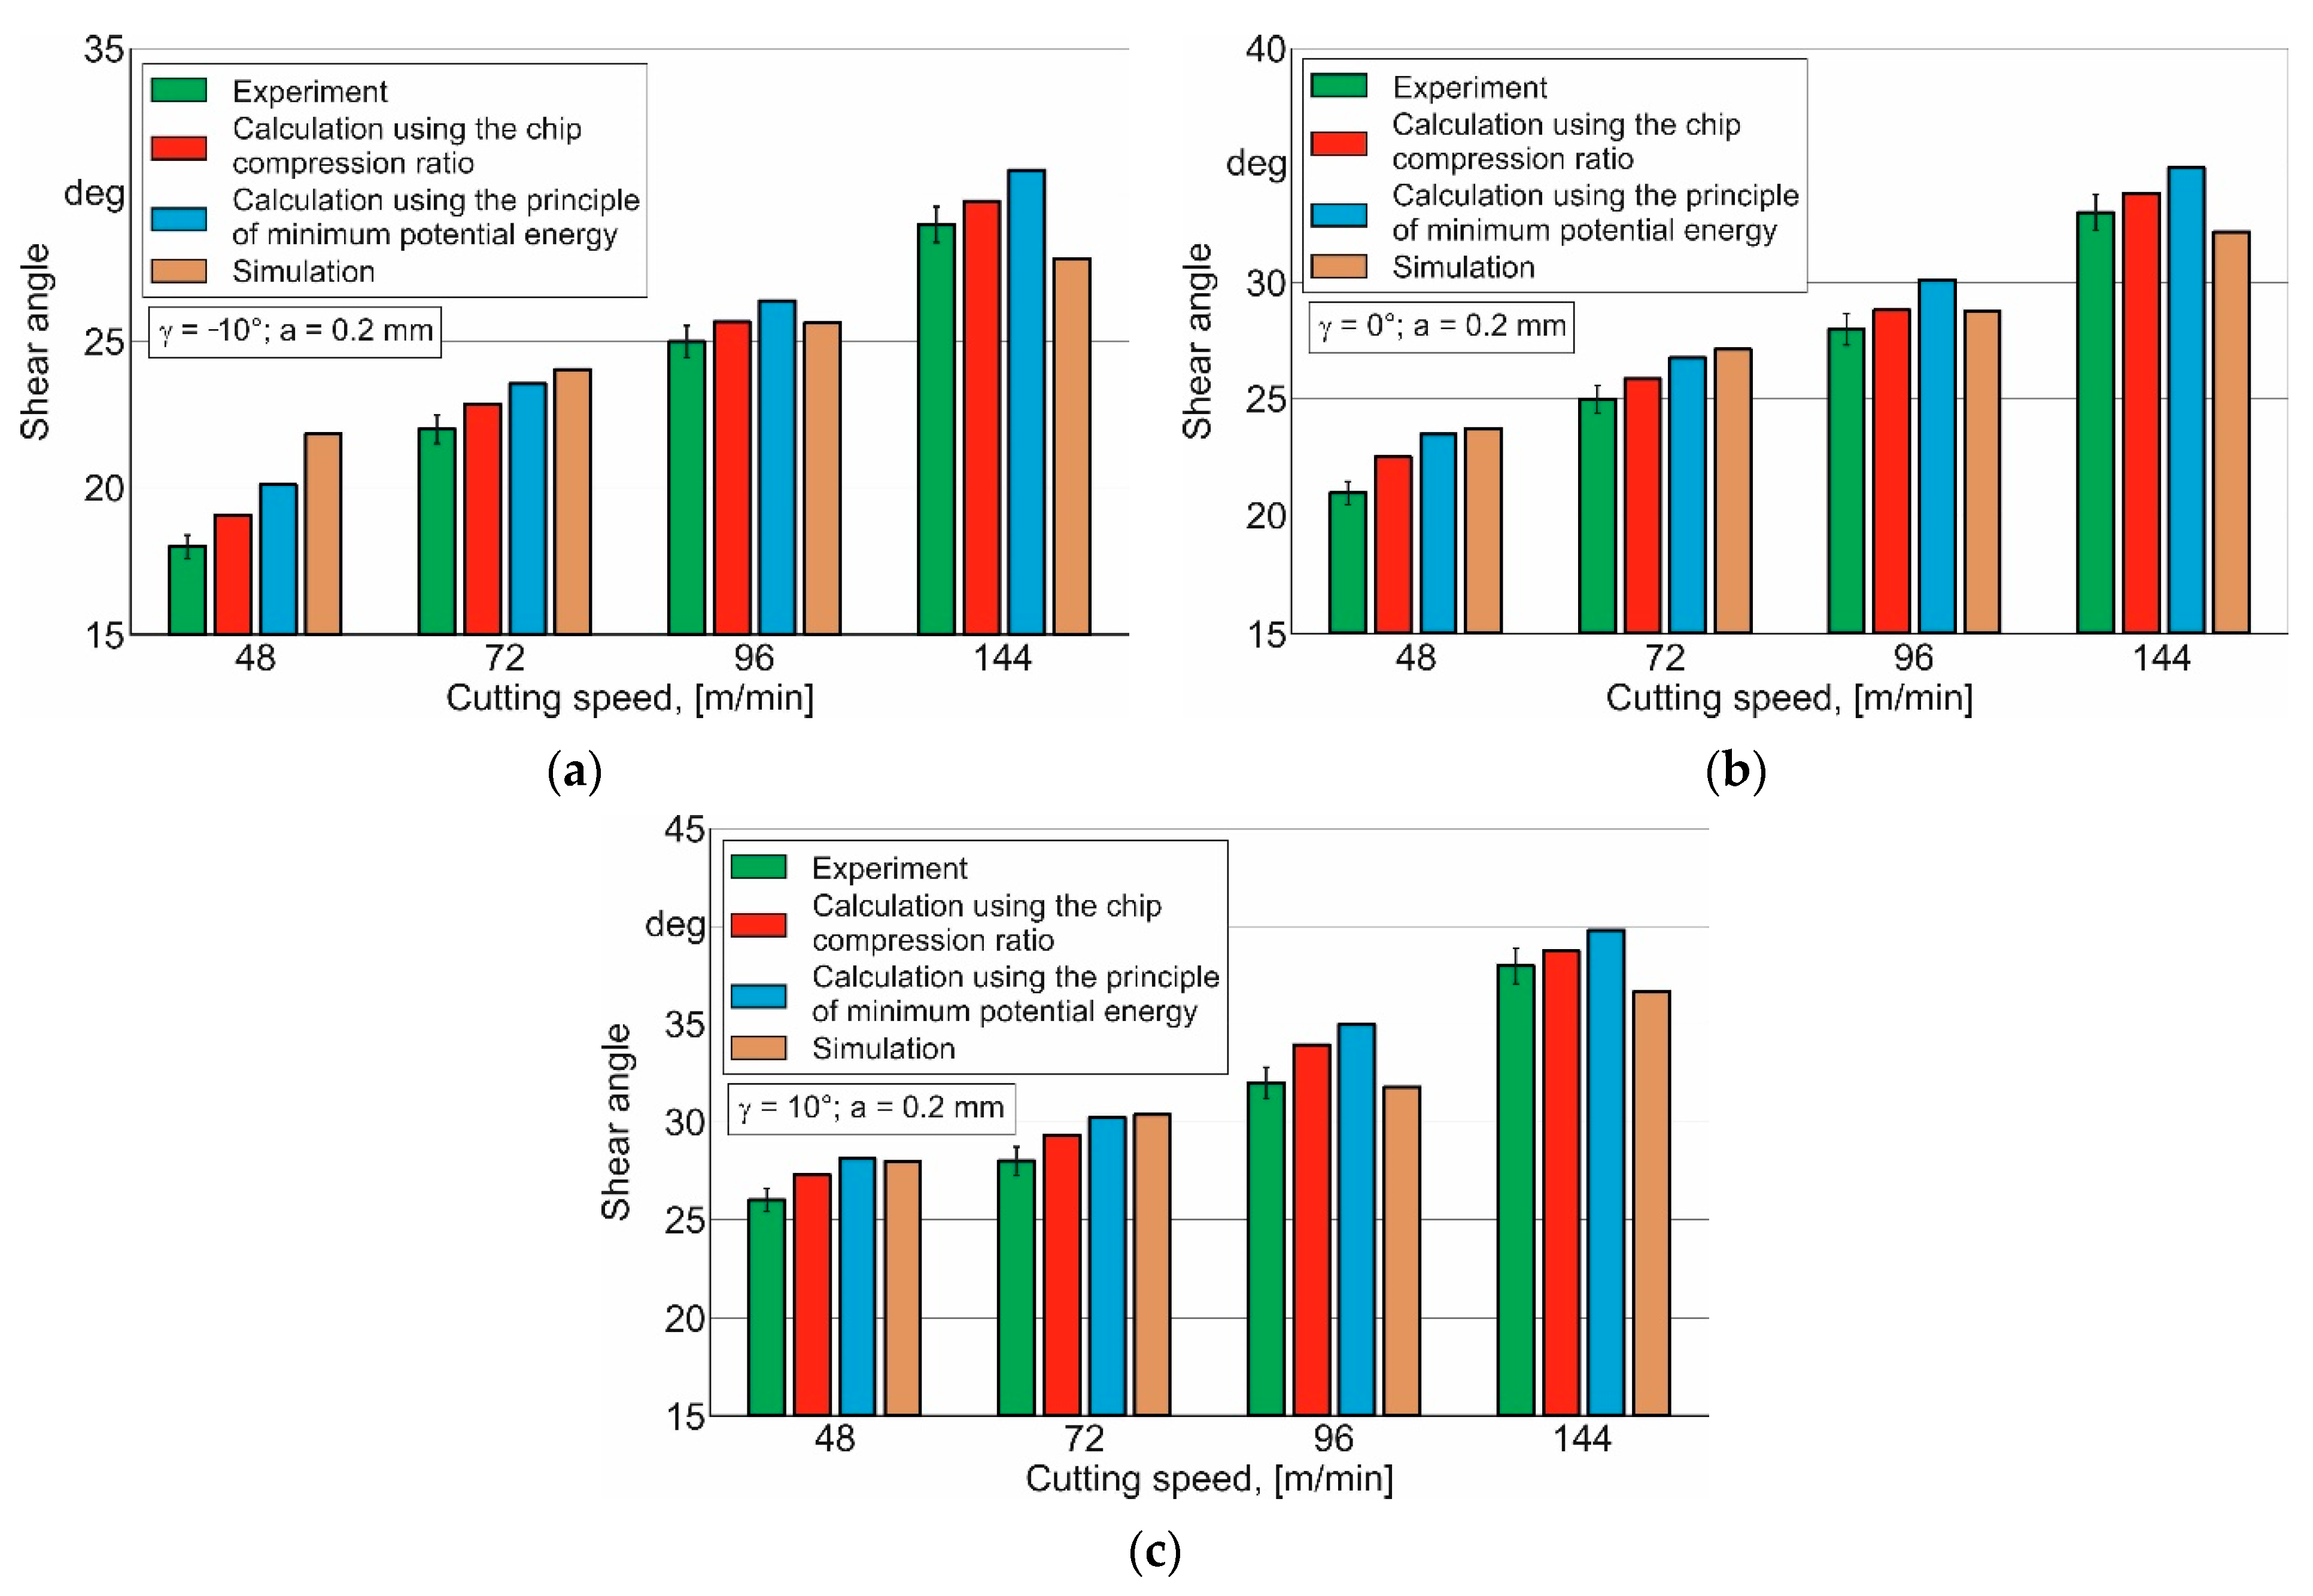
The experimental values of the chip compression ratio shown in Figure 7 were used to determine shear angles (see Equation (4)). At the same time, the shear angles were calculated according to the developed algorithm (see Figure 3a) of the second approach (see Section 2.2.1) using the developed algorithm (see Figure 3a). The results of comparing experimentally and analytically determined shear angle values for different tool rake angles as well as the results of numerical simulations are shown in Figure 11.
A comparison between experimental and calculated values showed that the calculated values of shear angle were a little bit overestimated for all examined cutting speeds and tool rake angles, in contrast to the experimental values.
The shear angles determined by the first approach, i.e., by using the chip compression ratio, were insignificant (up to 1°–1.5°) greater than the values of the shear angles determined experimentally, which does not exceed 5%. This difference is well within the margin of error provided by the chip thickness measurement methods obtained in the experimental studies. In addition, this difference is explained by some variability in the cutting depth (undeformed chip thickness) resulting from the vibrations of the technological system links during cutting. It should also be noted the effect of inertia stopping the cutting process to obtain the chip root on the shear angle measurement results. Since the cutting process cannot be stopped instantly due to a certain mass value of the workpiece, tool, and other technological system links, the resulting chip root is somewhat different from the chip root in a non-stop cutting process. All of these factors inevitably cause differences between the experimental values of the shear angle and the values determined from the experimental chip compression ratio.
The shear angles determined by the second method, i.e., using the analytical cutting model, exceed the experimental values of shear angles by up to 3°, which is about 12%. Thus, it will be possible in future to establish the shear angle with the considered analytical methods instead of time-consuming experimental studies. The exceeding of the shear angle values determined by the second method (using the developed cutting model [25]) over its experimental values is due primarily to the well-known fact that the deformation energy minimum principle gives the upper estimate of this energy [12,13], and hence the upper estimate of the cutting forces determined based on this principle. Based on this principle, an analytical cutting model used to determine the shear angle was also developed. It can be reasonably assumed that the calculation of other cutting characteristics, such as shear angle, calculated by this model also gives an overestimate. Differences between the experimental values of the shear angle and those determined by the analytical model are also due to the fact that this model does not take into account real thermomechanical phenomena in the cutting zones. Thus, this model takes into account friction in the secondary and tertiary cutting zones, defined as Coulomb friction. In the real process, however, the contact phenomena in the cutting zones are significantly more complicated than their representation as Coulomb friction. In addition, the used analytical friction model does not provide for adiabatic hardening of the machined material, its isothermal softening (see, for example, [29]), and the hardening of this material due to the strain rate. Of course, taking these all phenomena and factors into account is a very difficult task, which has not yet been solved even for a relatively simple orthogonal cutting process. Therefore, it is quite reasonable to observe differences between the experimental values of the shear angle and those determined by both analytical methods and numerical simulations.
3.2. Determination of Shear Angle Using Numerical Simulation
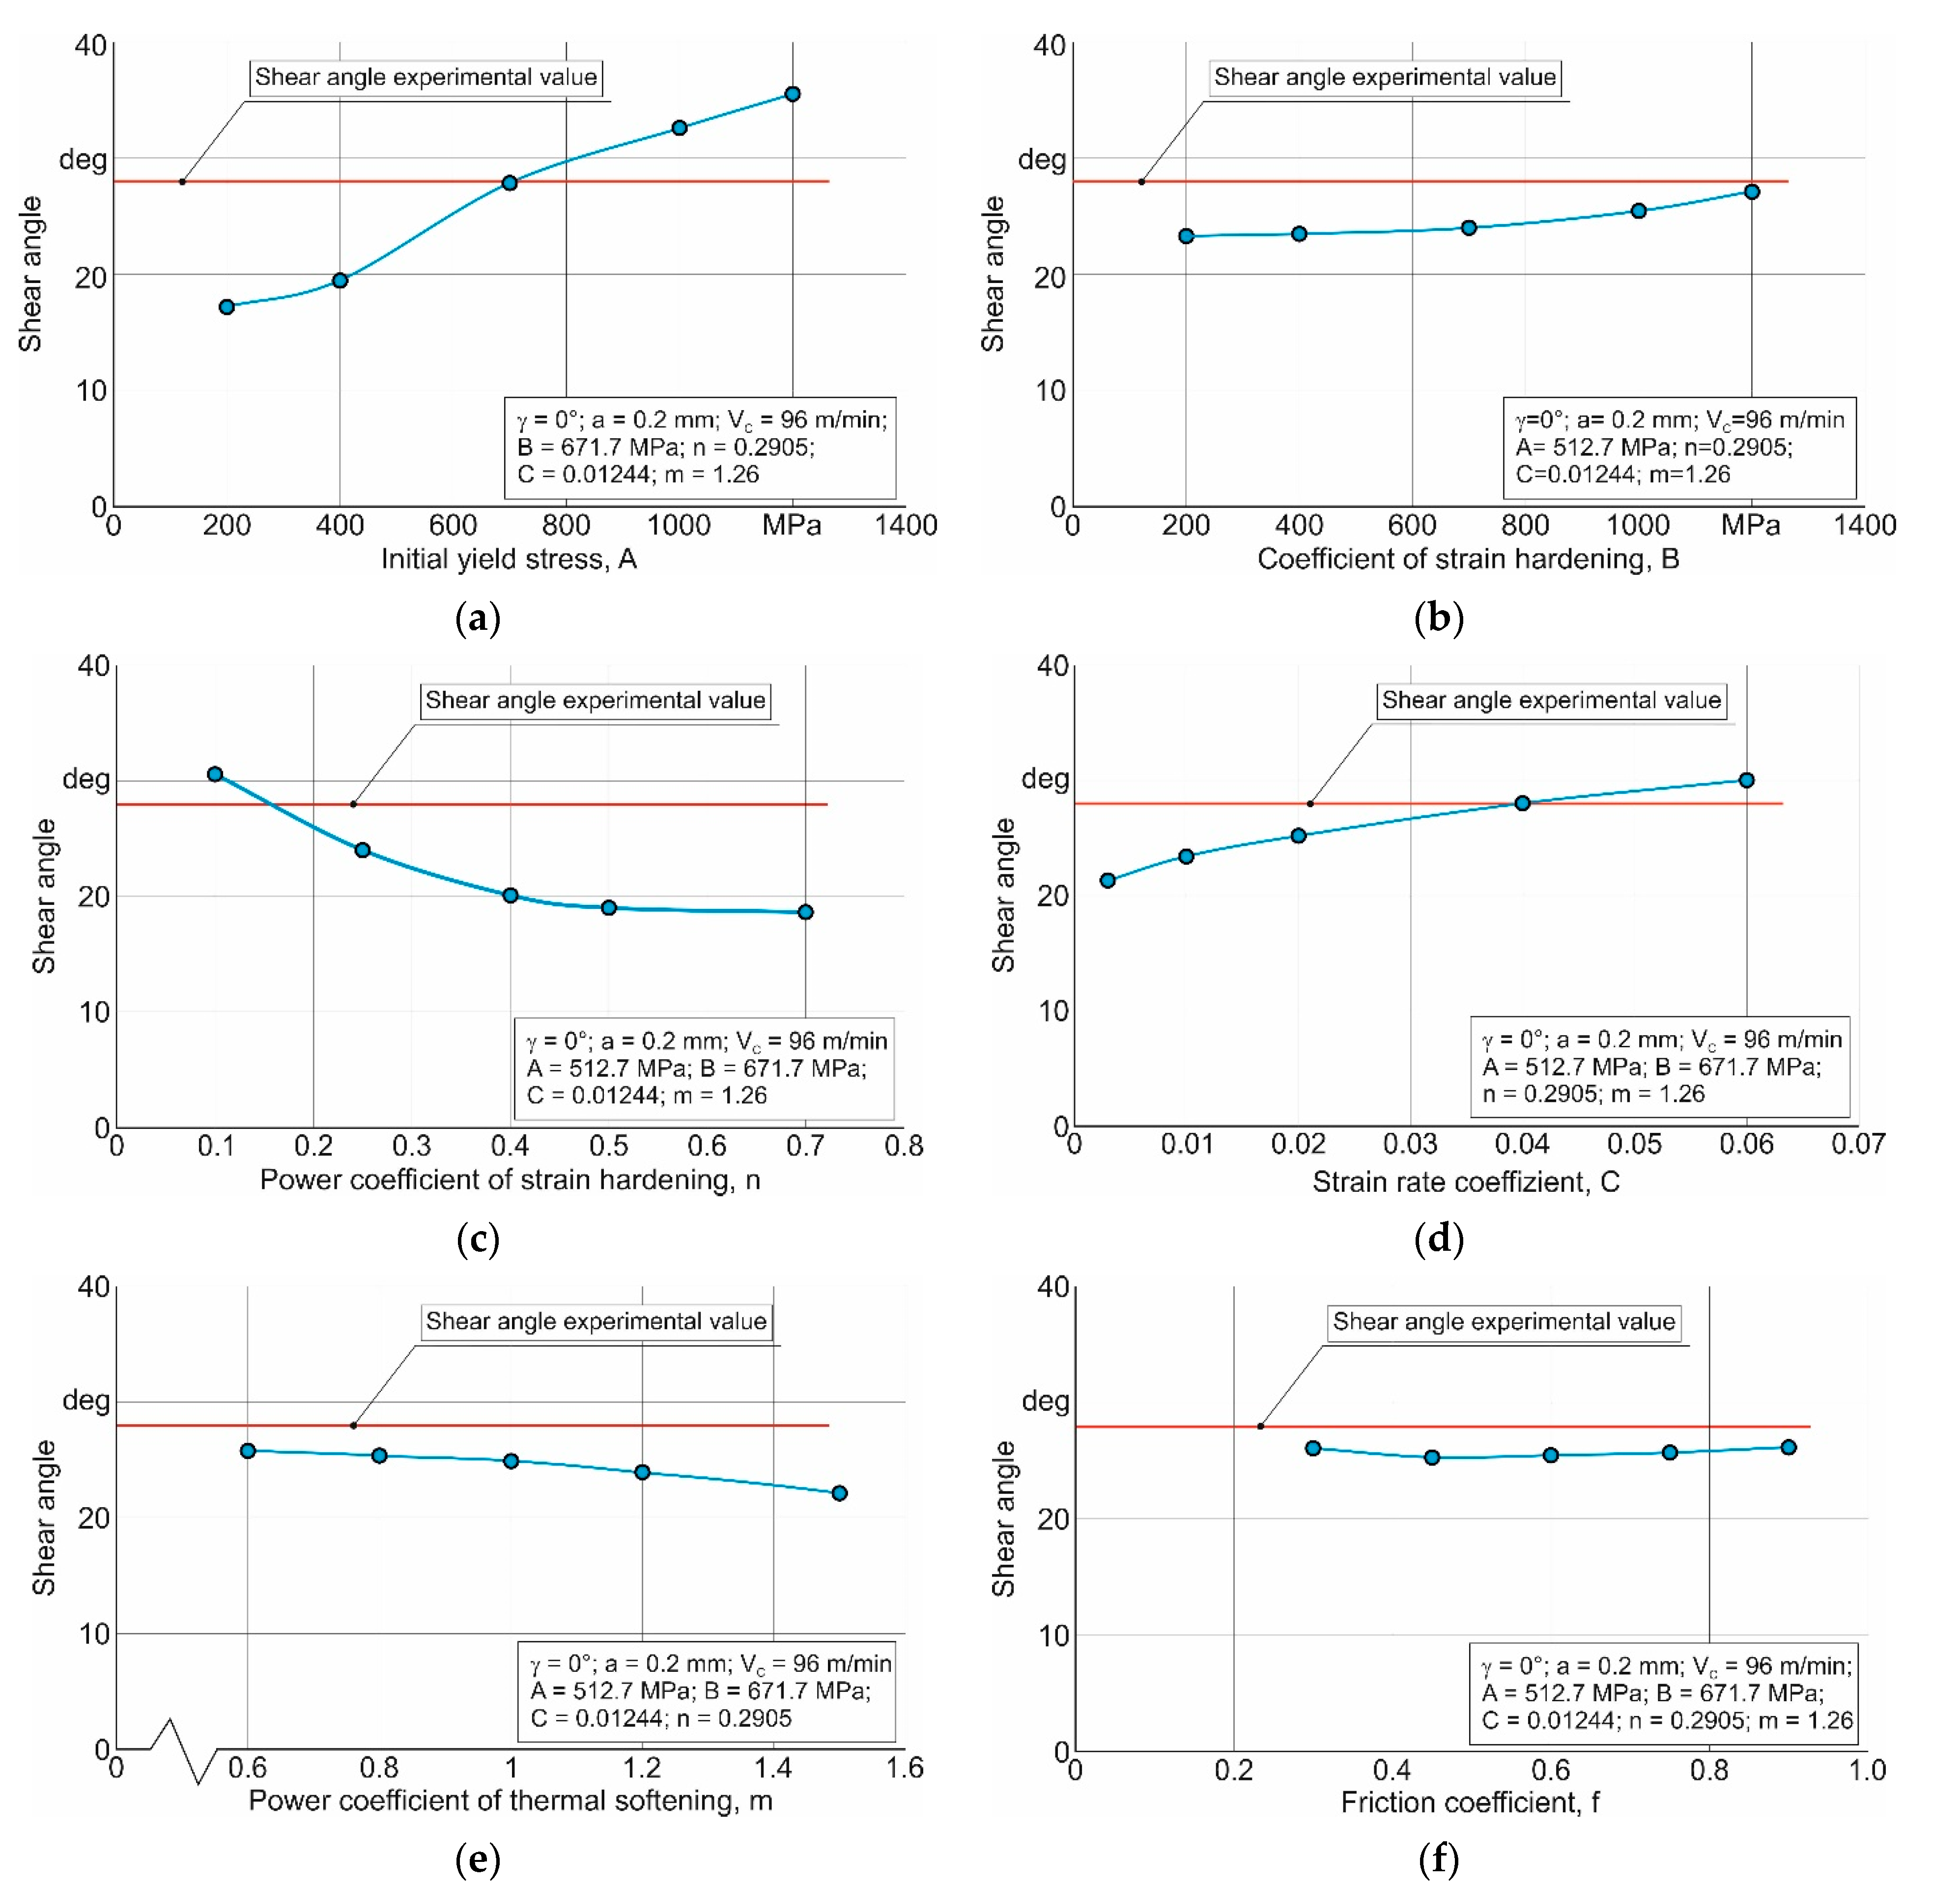
To determine the effect of the material model and friction model parameters on the shear angle value, simulations of the orthogonal cutting process were carried out for changing values of individual parameters were performed. Figure 8 presents an example of these numerical analyses for a cutting speed of 96 m/min is shown in. The same trend was obtained for the other studied cutting speeds. The friction model parameter—friction coefficient—shows practically the absence of any influence on the shear angle value (Figure 8f). Thus, it would be quite logical to use constant, previously defined, values of these parameter in further simulations of the studied cutting process. The power coefficient of thermal softening m has some influence on the shear angle (see Figure 8e). However, the effect of this coefficient on the shear angle is insignificant compared to the influence of other parameters of the constitutive equation on this studied cutting characteristic. Especially this influence is insignificant within the change limits of the coefficient m, which is possible and acceptable to use in the numerical simulation of the cutting process (from about 0.8 to 1.3). In this regard, in further modeling of the studied cutting process, a constant, previously determined value of the coefficient m is used.
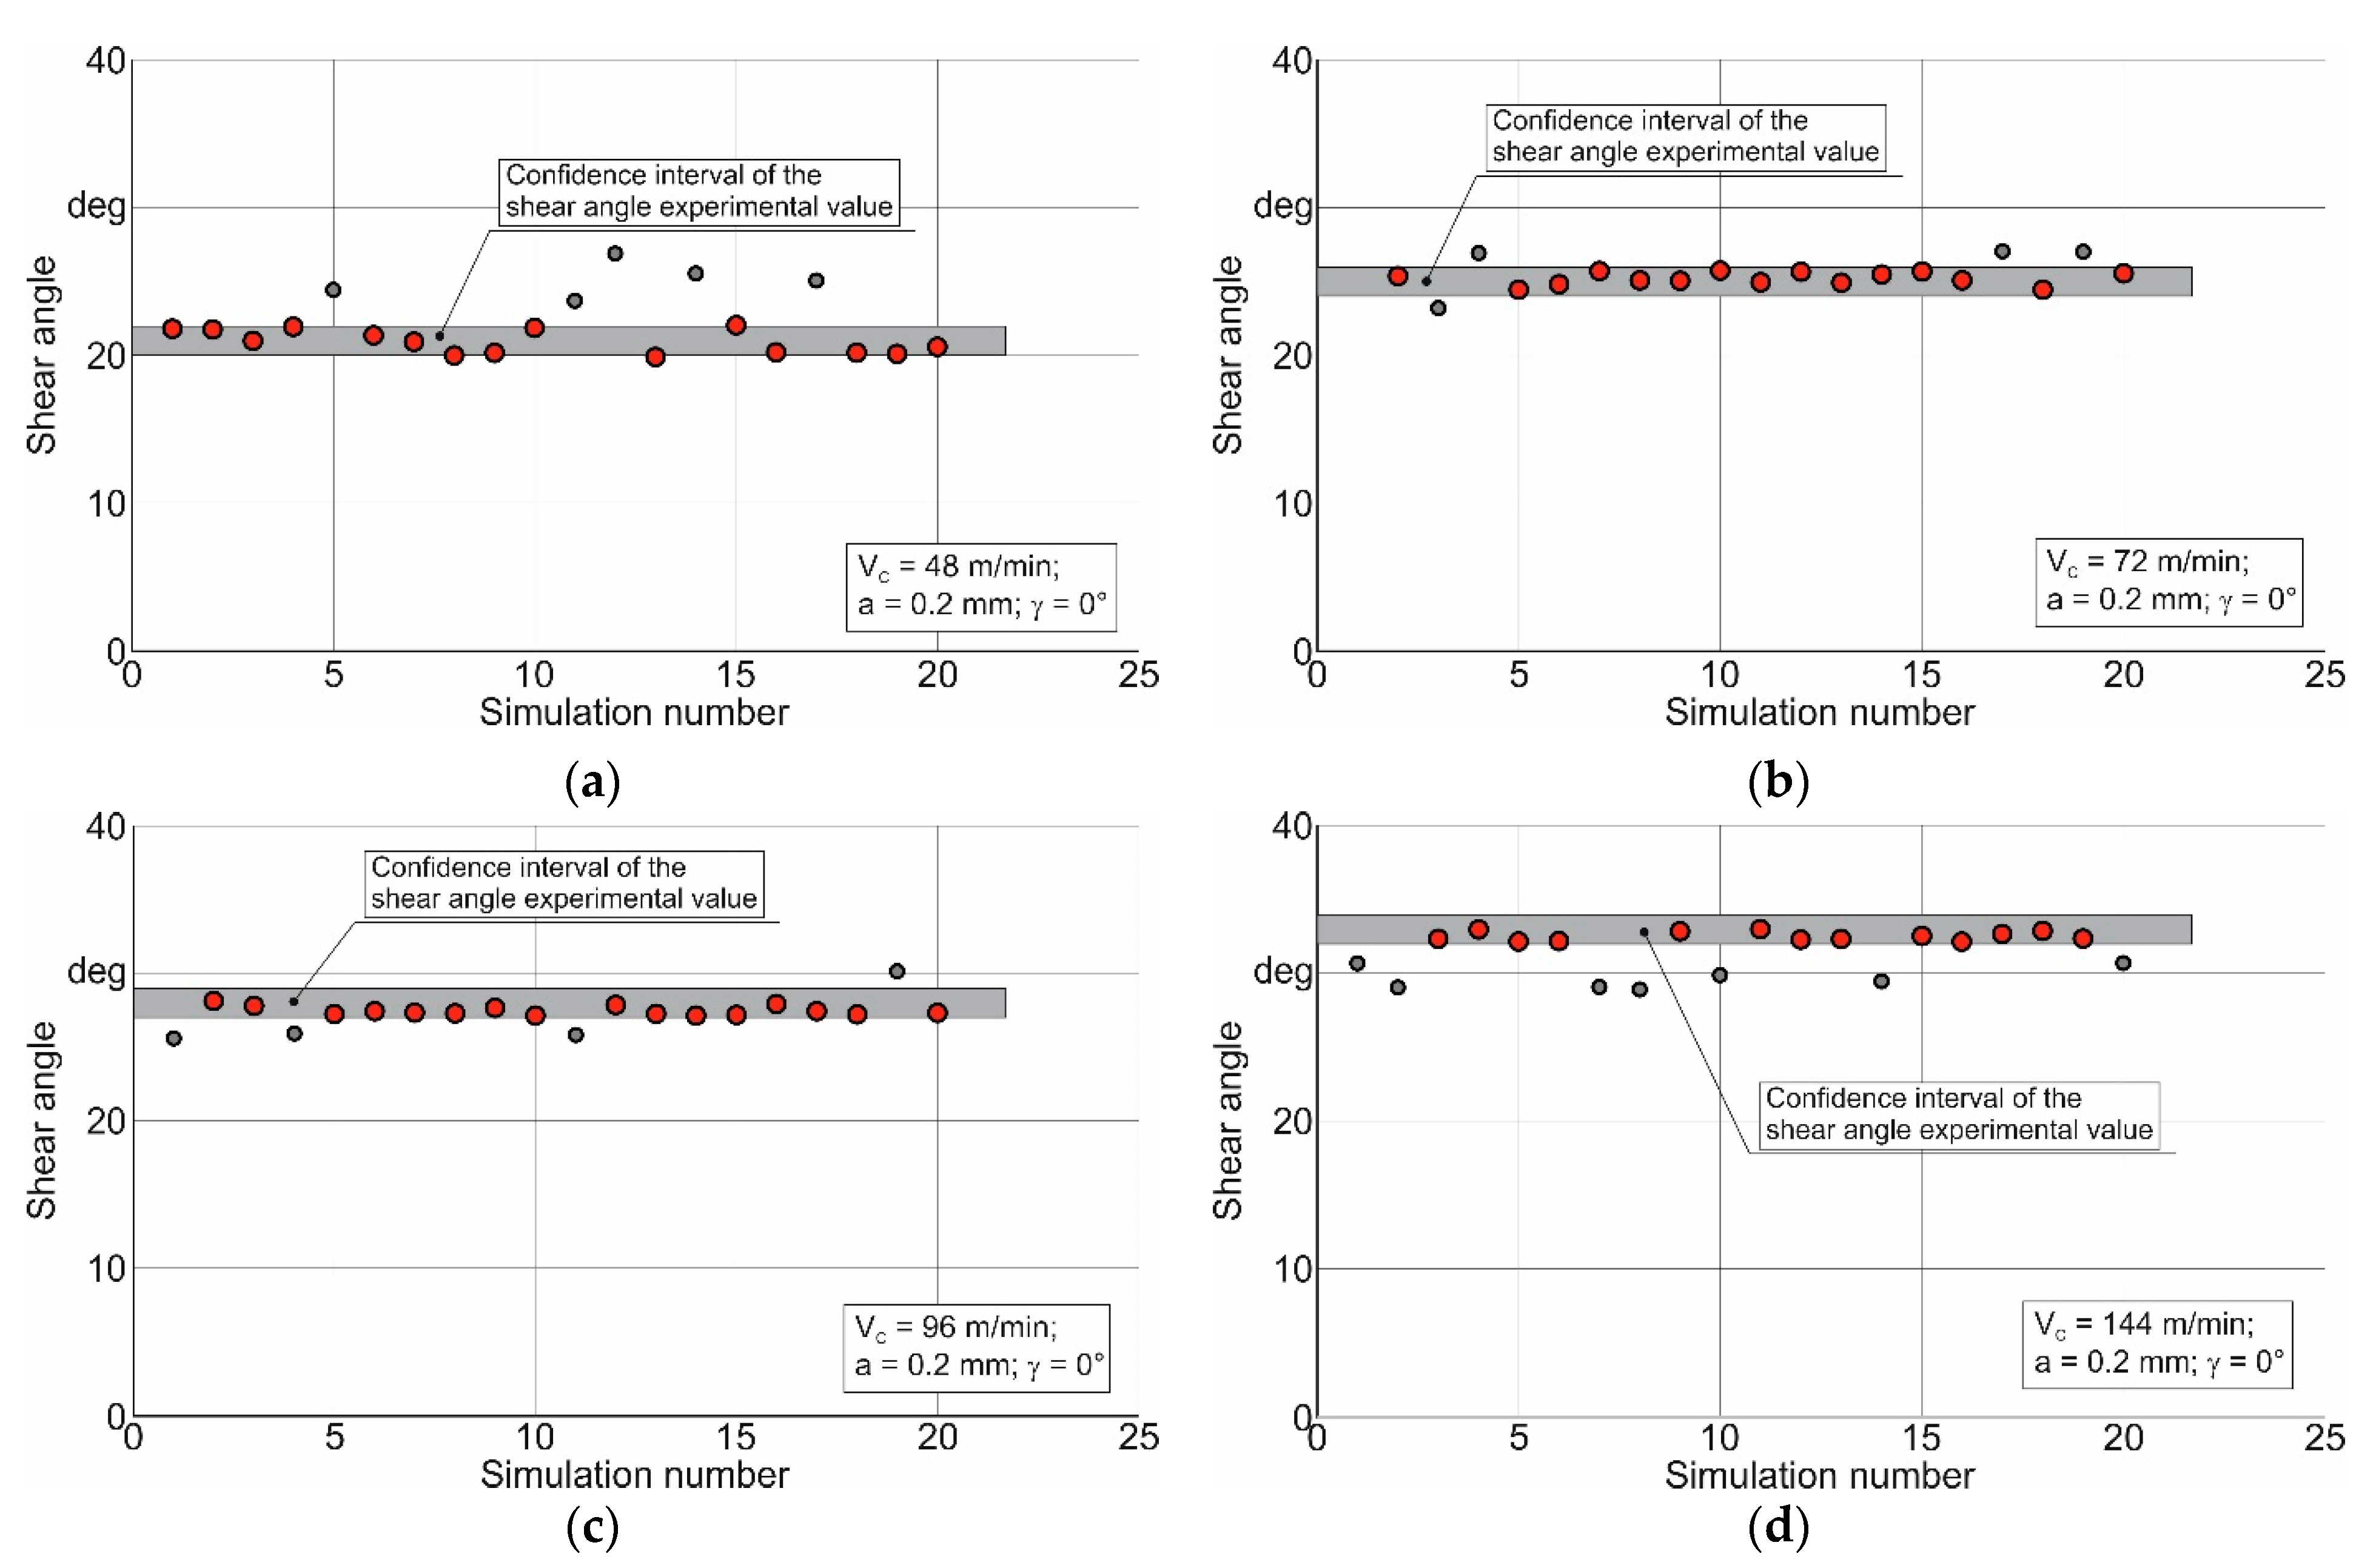
The values of the material model parameters that had a significant effect on the shear angle were determined by the method of repeated DOEs (design of experiments) [59,65]. The first iteration of determining the previously selected material model parameters (Johnson–Cook constitutive equation parameters) is shown in Figure 9. For this iteration, the parameter limits of the constitutive equation were specified in a wide range of values established by estimating the influence of individual parameters (see Figure 8).
A few constitutive equation parameter sets are within the confidence interval of the experimental shear angle (marked in grey) indicated in the diagram. These simulations with their corresponding parameter sets are marked with red circles in the diagrams. Such a small number of parameter sets in the confidence interval of the experimental shear angle indicated that the parameter interval of the constitutive equation, which provides shear angle values corresponding to its experimental value, was quite narrow. In this case the small number of parameter sets ensured that the experimental and simulated values of the shear angle corresponded only to the specific cutting conditions under which the experimental studies and calculations were performed. Increasing the number of these sets could ensure that the experimental and simulated shear angle values correspond to a wide range of cutting conditions, such as cutting modes, tool geometry, etc. In order to increase the number of parameter sets of the constitutive equation that lay within the confidence interval of the experimental shear angle values, it was necessary to limit the variation interval for individual parameters of the constitutive equation. Based on the analysis of how the effect of individual parameters of the constitutive equation affected the shear angle value and on the results obtained in the first DOE iteration, the limits of these parameters variations were specified.
The specified parameter variation limits are shown in Table 3. The limits of individual parameters variation specified in Table 3 were used for the second iteration of the DOE.
The results of the second iteration are shown in Figure 10. When these specified limits were used, a much larger number of constitutive equation parameter sets were within the confidence interval of the experimental shear angle values.
When so many constitutive equation parameter sets lay within the confidence interval of the experimental shear angle values it was possible to find generalized parameters of the constitutive equation. In order to find the generalized values of the constitutive equation parameters, a previously developed software algorithm was used [59]. According to this algorithm, the generalized values of the constitutive equation parameters were found as the intersection of these parameter sets determined as a result of the second and, if necessary, subsequent DOE iterations. Table 4 presents generalized values of the parameters determined by means of this algorithm.
These generalized values were used to simulate orthogonal cutting at different cutting speeds and tool rake angles. The shear angles established in these simulations are shown in Figure 11. By comparison, these diagrams also show the corresponding experimental values of the shear angles and their values determined analytically. The largest variation between the experimental data of shear angles and their simulated values were observed at cutting speeds of 48 m/min and tool rake angles of −10° and 0°. These variations are 18% and 12%, respectively. The variations for the other studied cutting speeds and tool rake angles did not exceed 9%. The variation of simulated shear angles from analytically calculated values was no more than 7%. The only exception equal to 12% was the corresponding deviation at a cutting speed of 48 m/min and a tool rake angle of −10°.
The shear angle values determined by numerical simulation using generalized values of the constitutive equation parameters retain the tendency to increase with increasing cutting speed and tool rake angle. However, the proportions of these trends differ from the corresponding proportional changes in shear angles with increasing cutting speed and the tool rake angle determined experimentally and by analytical methods. The shear angle values determined by numerical simulation mainly depend on the parameters of the triad models that constitute the numerical (in this case, finite-element) model of cutting: the material model, the friction model and the fracture model of the machined material. The friction model parameter, the Coulomb friction coefficient, was assumed constant. The fracture model of the machined material was not included in the calculation algorithm. In the used software product, fracture for ductile machinable materials, to which steel AISI 1045 belongs, is realized by penetrating the tool into this material and the subsequent remeshing [73]. Therefore, the main influence on the shear angle was caused by the parameters of the Johnson–Cook constitutive equation [22] as a model of the machined material. This model is well-established and used in the vast majority of numerical cutting models due to its relative simplicity and clarity. However, despite the significant advantages of this model as a model of the machined material, it does not describe the deformation and fracture mechanisms of the machined material during cutting. This constitutive equation does not take into account the mutual influence of temperature, strain, strain rate and yield stress. This equation also does not describe the conditions of transition from the hardening of the deformed material to its softening, and, ultimately, does not provide the maximum values of the yield strength in the primary cutting zone (chip formation zone) and in the secondary cutting zone (at the tool rake face) [29]. This is, in this case, the reason for the difference between the experimental and simulated values of the shear angle. Thus, a significant excess of the shear angle determined as a result of cutting process simulation over its experimental value at low cutting speeds and especially at a tool rake angle of −10° indicates insufficient consideration in the used constitutive equation of the machined material hardening as a result of its deformation during cutting. At the same time, these differences at high cutting speeds and all studied tool rake angles indicate both insufficient consideration of the machined material softening in the material model and insufficient consideration of the influence of the strain rate of the machined material on the interaction of its hardening and softening process.
However, despite the above disadvantages of the used material model, the greatest difference between the experimental, calculated, and simulated values of the shear angle obtained in these studies is only 18%. Thus, the generalized parameter set of the constitutive equation, determined by means of the previously developed software algorithm [59], provided a satisfactory variation of the simulated shear angle values both from the experimental data and the analytically calculated values, when changing cutting conditions and tool geometry within a relatively wide range.
4. Conclusions
The present study deals with the experimental and analytical determination as well as the numerical simulation of the shear angle during orthogonal cutting for a wide range of cutting speeds and tool rake angles. The following conclusions could be drawn from the conducted studies:
- Based on the use of the chip compression ratio and the minimum potential energy principle, analytical methods for determining the shear angle produced insignificantly greater values than experimentally established shear angle values for the studied range of cutting speeds and tool rake angles:
- ➢
- The shear angles determined by the chip compression ratio were insignificantly lower (up to 1°–2°) than the shear angles determined by the minimum potential energy principle.
- ➢
- The greatest variation between the values of shear angles determined experimentally and analytically was no more than 12%.
- ➢
- Thus, the examined analytical methods for determining the shear angle can be used instead of time-consuming experimental studies.
- The shear angle value in the numerical simulation of the orthogonal cutting process was mainly influenced by the constitutive equation parameters: initial yield stress A, coefficient of strain hardening B, power coefficient of hardening n, and strain rate coefficient C.
- The generalized values of these parameters for simulating the cutting process at a wide range of machining conditions were determined by means of a software algorithm based on finding the intersection of the constitutive equation parameter sets.
- Using these generalized parameters produced the largest deviation between experimental and simulated shear angle values of 9% to 18% and between simulated and analytically calculated shear angle values of 7% to 12%.
Author Contributions
Conceptualization, M.S.; methodology, M.S.; software, M.S.; validation, M.S.; formal analysis, M.S.; investigation, M.S.; resources, T.S. and H.-C.M.; data curation, M.S.; writing—original draft preparation, M.S.; writing—review and editing, M.S.; visualization, M.S.; project administration, H.-C.M. and T.S.; funding acquisition, H.-C.M. and T.S. All authors have read and agreed to the published version of the manuscript.
Funding
This study was funded by the German Research Foundation (DFG) in the project HE-1656/153-1 “Development of a Concept for Determining the Mechanical Properties of the Cutting Material in Machining”.
Data Availability Statement
Not applicable.
Acknowledgments
The authors would like to thank the German Research Foundation (DFG) for their support, which is highly appreciated.
Conflicts of Interest
The authors declare no conflict of interest. The funders had no role in the design of the study; in the collection, analyses, or interpretation of data; in the writing of the manuscript; or in the decision to publish the results.
References
- Melkote, S.; Liang, S.Y.; Ozel, T.; Jawahir, I.S.; Stephenson, D.A.; Wang, B. A Review of Advances in Modeling of Conventional Machining Processes: From Merchant to the Present. ASME J. Manuf. Sci. Eng. 2022, 144, 110801. [Google Scholar] [CrossRef]
- Mourtzis, D.; Doukas, M.; Bernidaki, D. Simulation in Manufacturing: Review and Challenges. Procedia CIRP 2014, 25, 213–229. [Google Scholar] [CrossRef] [Green Version]
- Arrazola, P.J.; Özel, T.; Umbrello, D.; Davies, M.; Jawahir, I. Recent advances in modelling of metal machining processes. CIRP Ann. Manuf. Technol. 2013, 62, 695–718. [Google Scholar] [CrossRef]
- Zvorikin, K.A. Required work and force for separation of metal chip. In Engineering Collection and Manufacturing News; Russkaya Tipo-Litogr: Moscow, Russia, 1893; 91p. (In Russian) [Google Scholar]
- Ernst, H.; Merchant, M.E. Chip formation, friction and high quality machined surfaces. Surf. Treat. Met. ASM 1941, 29, 299–378. [Google Scholar]
- Merchant, M.E. Mechanics of the Metal Cutting Process. I. Orthogonal Cutting and a Type 2 Chip. J. Appl. Phys. 1945, 16, 267–275. [Google Scholar] [CrossRef]
- Lee, E.H.; Shaffer, B.W. The Theory of Plasticity Applied to a Problem of Machining. J. Appl. Mech. 1951, 18, 405–413. [Google Scholar] [CrossRef]
- De Chiffre, L. Mechanics of metal cutting and cutting fluid action. Int. J. Mach. Tool Des. Res. 1977, 17, 225–234. [Google Scholar] [CrossRef]
- De Chiffre, L.; Wanheim, T. What Can We Do About Chip Formation Mechanics? CIRP Ann. 1985, 34, 129–132. [Google Scholar] [CrossRef]
- Usui, E.; Hirota, A.; Masuko, M. Analytical Prediction of Three Dimensional Cutting Process—Part 1: Basic Cutting Model and Energy Approach. J. Eng. Ind. 1978, 100, 222–228. [Google Scholar] [CrossRef]
- Ueda, N.; Matsuo, T.; Hoshi, T. An Investigation of some Shear Angle Theories. CIRP Ann. 1986, 35, 27–30. [Google Scholar] [CrossRef]
- Zorev, N.N. Metal Cutting Mechanics; Pergamon Press GmbH: Frankfurt am Main, Germany, 1966; 526p, ISBN 978-0080107233. [Google Scholar]
- Vereshchaka, A.S.; Kushner, V.S. Cutting of Metals; High School: Moscow, Russia, 2009; 535p, ISBN 978-5-06-004415-7. (In Russian) [Google Scholar]
- Oxley, P.L.B.; Shaw, M.C. Mechanics of Machining. An Analytical Approach to Assessing Machinability; Ellis Horwood: Chichester, UK, 1989; 242p. [Google Scholar] [CrossRef]
- Oxley, P.L.B. Development and Application of a Predictive Machining Theory. Mach. Sci. Technol. 1998, 2, 165–189. [Google Scholar] [CrossRef]
- Adibi-Sedeh, A.H.; Madhavan, V.; Bahr, B. Extension of Oxley’s Analysis of Machining to Use Different Material Models. J. Manuf. Sci. Eng. 2003, 125, 656–666. [Google Scholar] [CrossRef] [Green Version]
- Madhavan, V.; Adibi-Sedeh, A.H. Understanding of Finite Element Analysis Results under the Framework of Oxley’s Machining Model. Mach. Sci. Technol. 2005, 9, 345–368. [Google Scholar] [CrossRef]
- Xiong, L.; Wang, J.; Gan, Y.; Li, B.; Fang, N. Improvement of algorithm and prediction precision of an extended Oxley’s theoretical model. Int. J. Adv. Manuf. Technol. 2014, 77, 1–13. [Google Scholar] [CrossRef]
- Aydın, M. Cutting temperature analysis considering the improved Oxley’s predictive machining theory. J. Braz. Soc. Mech. Sci. Eng. 2016, 38, 2435–2448. [Google Scholar] [CrossRef]
- Sagar, C.K.; Kumar, T.; Priyadarshini, A.; Gupta, A.K. Prediction and optimization of machining forces using oxley’s predictive theory and RSM approach during machining of WHAs. Def. Technol. 2019, 15, 923–935. [Google Scholar] [CrossRef]
- Ning, J.; Liang, S.Y. Prediction of Temperature Distribution in Orthogonal Machining Based on the Mechanics of the Cutting Process Using a Constitutive Model. J. Manuf. Mater. Process. 2018, 2, 37. [Google Scholar] [CrossRef] [Green Version]
- Johnson, G.R.; Cook, W.H. A constitutive model and data for metals subjected to large strains, high strain and high temperatures. In Proceedings of the 7th International Symposium on Ballistics, Hague, The Netherlands, 19–21 April 1983; pp. 541–547. [Google Scholar]
- Armarego, E.J.A.; Brown, R.H. The Machining of Metals; Prentice Hall, Inc.: Englewood Cliffs, NJ, USA, 1969; 437p, ISBN 9780135422090. [Google Scholar]
- Grzesik, W. Advanced Machining Processes of Metallic Materials. Theory, Modelling, and Applications, 2nd ed.; Elsevier: Amsterdam, The Netherlands, 2017; 578p, ISBN 978-0-444-63711-6. [Google Scholar]
- Tsekhanov, J.; Storchak, M. Development of analytical model for orthogonal cutting. Prod. Eng. 2014, 9, 247–255. [Google Scholar] [CrossRef]
- Silin, S.S. Similarity Method in Material Cutting; Mashinostroenie: Moscow, Russia, 1979; 152p, ISBN 2704040000. (In Russian) [Google Scholar]
- Kobayashi, S.; Thomsen, E.G. Metal-Cutting Analysis—I: Re-Evaluation and New Method of Presentation of Theories. J. Eng. Ind. Ser. B 1962, 84, 63–70. [Google Scholar] [CrossRef]
- Chakrabarty, J. Theory of Plasticity, 3rd ed.; Elsevier: Oxford, UK, 2006; 896p, ISBN 978-0-7506-6638-2. [Google Scholar]
- Kushner, V.; Storchak, M. Modelling the material resistance to cutting. Int. J. Mech. Sci. 2017, 126, 44–54. [Google Scholar] [CrossRef]
- Lee, W.B.; To, S.; Sze, Y.K.; Cheung, C.F. Effect of material anisotropy on shear angle prediction in metal cutting—A mesoplasticity approach. Int. J. Mech. Sci. 2003, 45, 1739–1749. [Google Scholar] [CrossRef]
- Kovrizhnykh, A.M. Determining the shear angle, forces, and sizes of shearing elements during metal cutting. J. Appl. Mech. Tech. Phys. 2009, 50, 147–154. [Google Scholar] [CrossRef]
- Zou, Z.-F.; He, L.; Chen, Y.-W. Study on Shear Angle Model for Superalloy GH4169. In Proceedings of the 2017 International Conference on Manufacturing Engineering and Intelligent Materials ICMEIM, Guangzhou, China, 25–26 February 2017; Volume 100, pp. 465–470. [Google Scholar] [CrossRef] [Green Version]
- Toropov, A.; Ko, S.-L. Prediction of shear angle for continuous orthogonal cutting using thermo-mechanical constants of work material and cutting conditions. J. Mater. Process. Technol. 2007, 182, 167–173. [Google Scholar] [CrossRef]
- Das, N.S.; Dundur, S.T. Slipline field solutions for metal machining with adhesion friction and elastic effects at the chip-tool contact region. Proc. Inst. Mech. Eng. Part B J. Eng. Manuf. 2005, 219, 57–72. [Google Scholar] [CrossRef]
- Zhou, J.; Li, J.F.; Sun, J. Experimental Study on the Chip Geometry and Shear Angle in Micro-Cutting Aluminum 7050-T7451. Key Eng. Mater. 2010, 443, 657–662. [Google Scholar] [CrossRef]
- Hao, M.; Xu, D.; Feng, P. Numerical and experimental investigation of the shear angle in high-speed cutting of Al6061-T6. Int. J. Adv. Manuf. Technol. 2018, 100, 3037–3044. [Google Scholar] [CrossRef]
- Vinogradov, A.A. On the calculation of cutting forces and chip-tool contact interaction characteristics in cutting ductile metals. J. Superhard Mater. 2013, 35, 183–191. [Google Scholar] [CrossRef]
- Xu, D.; Feng, P.; Li, W.; Ma, Y.; Liu, B. Research on chip formation parameters of aluminum alloy 6061-T6 based on high-speed orthogonal cutting model. Int. J. Adv. Manuf. Technol. 2014, 72, 955–962. [Google Scholar] [CrossRef]
- Aksu, B.; Çelebi, C.; Budak, E. An experimental investigation of oblique cutting mechanics. Mach. Sci. Technol. 2016, 20, 495–521. [Google Scholar] [CrossRef]
- Hase, A.; Wada, M.; Koga, T.; Mishina, H. The relationship between acoustic emission signals and cutting phenomena in turning process. Int. J. Adv. Manuf. Technol. 2013, 70, 947–955. [Google Scholar] [CrossRef]
- Ren, C.; Ke, Z.; Chen, G.; Wu, J. Modeling of tool-chip contact length for orthogonal cutting of Ti-6Al-4V alloy considering segmented chip formation. Trans. Tianjin Univ. 2016, 22, 525–535. [Google Scholar] [CrossRef]
- Amini, S.; Kazemiyoun, M. Effect of Ultrasonic Vibrations on Chip–Tool Contact Zone in Turning of AISI304. Mater. Manuf. Process. 2014, 29, 627–633. [Google Scholar] [CrossRef]
- Monkova, K.; Monka, P.P.; Sekerakova, A.; Tkac, J.; Bednarik, M.; Kovac, J.; Jahnatek, A. Research on Chip Shear Angle and Built-Up Edge of Slow-Rate Machining EN C45 and EN 16MnCr5 Steels. Metals 2019, 9, 956. [Google Scholar] [CrossRef] [Green Version]
- Jaspers, S.P.F.C.; Dautzenberg, J.H. Material behaviour in metal cutting: Strains, strain rates and temperatures in chip formation. J. Mater. Process. Technol. 2002, 121, 123–135. [Google Scholar] [CrossRef]
- Chern, G.-L. Development of a new and simple quick-stop device for the study on chip formation. Int. J. Mach. Tools Manuf. 2005, 45, 789–794. [Google Scholar] [CrossRef]
- Mhamdi, M.B.; Rajhi, W.; Boujelbene, M.; Ben Salem, S.; Ezeddini, S.; Ben Amara, M. A new quick-stop device to study the chip formation mechanism in metal cutting: Computational and experimental investigation. Proc. Inst. Mech. Eng. Part C J. Mech. Eng. Sci. 2021, 236, 2884–2900. [Google Scholar] [CrossRef]
- Wu, C.; Wang, K.; Tsai, L. A new electromagnetic quick stop device for metal cutting studies. Int. J. Adv. Manuf. Technol. 2005, 29, 853–859. [Google Scholar] [CrossRef]
- Nie, G.; Yang, Z.; Zhang, D.; Zhang, X.; Outeiro, J.; Ding, H. Dynamics of chip formation during the cutting process using imaging techniques: A review. Int. J. Mech. Syst. Dyn. 2022, 2, 27–49. [Google Scholar] [CrossRef]
- Berezvai, S.; Molnar, T.G.; Bachrathy, D.; Stepan, G. Experimental investigation of the shear angle variation during orthogonal cutting. Mater. Today Proc. 2018, 5, 26495–26500. [Google Scholar] [CrossRef]
- Sutter, G. Chip geometries during high-speed machining for orthogonal cutting conditions. Int. J. Mach. Tools Manuf. 2005, 45, 719–726. [Google Scholar] [CrossRef]
- Mac, T.-B.; Luyen, T.-T.; Nguyen, D.-T. A Study for Improved Prediction of the Cutting Force and Chip Shrinkage Coefficient during the SKD11 Alloy Steel Milling. Machines 2022, 10, 229. [Google Scholar] [CrossRef]
- Bil, H.; Kılıç, S.E.; Tekkaya, A.E. A comparison of orthogonal cutting data from experiments with three different finite element models. Int. J. Mach. Tools Manuf. 2004, 44, 933–944. [Google Scholar] [CrossRef]
- Lotfi, M.; Amini, S. Effect of ultrasonic vibration on frictional behavior of tool–chip interface: Finite element analysis and experimental study. Proc. Inst. Mech. Eng. Part B J. Eng. Manuf. 2016, 232, 1212–1220. [Google Scholar] [CrossRef]
- Ortiz-De-Zarate, G.; Sela, A.; Saez-De-Buruaga, M.; Cuesta, M.; Madariaga, A.; Garay, A.; Arrazola, P.J. Methodology to establish a hybrid model for prediction of cutting forces and chip thickness in orthogonal cutting condition close to broaching. Int. J. Adv. Manuf. Technol. 2018, 101, 1357–1374. [Google Scholar] [CrossRef]
- Lee, W.B.; Wang, H.; Chan, C.Y.; To, S. Finite element modelling of shear angle and cutting force variation induced by material anisotropy in ultra-precision diamond turning. Int. J. Mach. Tools Manuf. 2013, 75, 82–86. [Google Scholar] [CrossRef]
- Li, P.; Chang, Z. Numerical Modeling of the Effect of Cutting-Edge Radius on Cutting Force and Stress Concentration during Machining. Micromachines 2022, 13, 211. [Google Scholar] [CrossRef]
- Ucun, I.; Aslantas, K. Numerical simulation of orthogonal machining process using multilayer and single-layer coated tools. Int. J. Adv. Manuf. Technol. 2010, 54, 899–910. [Google Scholar] [CrossRef]
- Wang, T.; Xie, L.J.; Wang, X.B. A Comparative Study of High Speed Orthogonal Turning of AISI4340 by Three Different Finite Element Models. Key Eng. Mater. 2013, 589–590, 111–116. [Google Scholar] [CrossRef]
- Storchak, M.; Drewle, K.; Menze, C.; Stehle, T.; Möhring, H.-C. Determination of the Tool–Chip Contact Length for the Cutting Processes. Materials 2022, 15, 3264. [Google Scholar] [CrossRef]
- Storchak, M.; Stehle, T.; Möhring, H.-C. Determination of thermal material properties for the numerical simulation of cutting processes. Int. J. Adv. Manuf. Technol. 2021, 118, 1941–1956. [Google Scholar] [CrossRef]
- Filatov, Y.D.; Filatov, A.Y.; Syrota, O.O.; Yashchuk, V.P.; Monteil, G.; Heisel, U.; Storchak, M. The influence of tool wear particles scattering in the contact zone on the workpiece surface microprofile formation in polishing quartz. J. Superhard Mater. 2010, 32, 415–422. [Google Scholar] [CrossRef]
- Filatov, Y.D.; Sidorko, V.I.; Filatov, O.Y.; Yaschuk, V.P.; Heisel, U.; Storchak, M. Surface quality control in diamond abrasive finishing. Proc. SPIE 2009, 7389, 73892O. [Google Scholar] [CrossRef]
- Storchak, M.; Kushner, V.; Möhring, H.-C.; Stehle, T. Refinement of temperature determination in cutting zones. J. Mech. Sci. Technol. 2021, 35, 3659–3673. [Google Scholar] [CrossRef]
- Kushner, V.; Storchak, M. Determining mechanical characteristics of material resistance to deformation in machining. Prod. Eng. Res. Dev. 2014, 8, 679–688. [Google Scholar] [CrossRef]
- Storchak, M.; Jiang, L.; Xu, Y.; Li, X. Finite element modeling for the cutting process of the titanium alloy Ti10V2Fe3Al. Prod. Eng. Res. Dev. 2016, 10, 509–517. [Google Scholar] [CrossRef]
- Storchak, M.; Mohring, H.-C. Numerical and Experimental Analysis of Chip Formation at Ultrahigh Cutting Speed. MM Sci. J. 2019, 2019, 3243–3249. [Google Scholar] [CrossRef]
- Kushner, V.; Storchak, M. Determination of Material Resistance Characteristics in Cutting. Procedia CIRP 2017, 58, 293–298. [Google Scholar] [CrossRef]
- Storchak, M.; Möhring, H.-C.; Stehle, T. Improving the friction model for the simulation of cutting processes. Tribol. Int. 2021, 167, 107376. [Google Scholar] [CrossRef]
- Heisel, U.; Krivoruchko, D.V.; Zaloha, W.A.; Storchak, M.; Stehle, T. Thermomechanical material models in the modeling of cutting processes. ZWF Z. Wirtsch. Fabr. 2009, 104, 482–491. [Google Scholar] [CrossRef]
- Heisel, U.; Krivoruchko, D.V.; Zaloha, W.A.; Storchak, M.; Stehle, T. Thermomechanical exchange effects in machining. ZWF Z. Wirtsch. Fabr. 2009, 104, 263–272. [Google Scholar] [CrossRef]
- Storchak, M.; Zakiev, I.; Träris, L. Mechanical properties of subsurface layers in the machining of the titanium alloy Ti10V2Fe3Al. J. Mech. Sci. Technol. 2018, 32, 315–322. [Google Scholar] [CrossRef]
- Heisel, U.; Krivoruchko, D.V.; Zaloha, W.A.; Storchak, M.; Stehle, T. Breakage models for the modeling of cutting processes. ZWF Z. Wirtsch. Fabr. 2009, 104, 330–339. [Google Scholar] [CrossRef]
- Fluhrer, J. Deform-User Manual Deform V12.0; SFTC: Columbus, OH, USA, 2019. [Google Scholar]
Figure 1.
Layout of chip formation for the orthogonal cutting process. (The following symbols are used in the figure: VC—cutting speed; VCh—chip speed; a—undeformed chip thickness; aCh—chip thickness; σS and τS—normal and tangential stress, respectively; lCp and lCe—the length of the plastic and elastic contact zone, respectively; α—tool clearance angle; FC and FT—cutting and thrust force, respectively).

Figure 2.
Experimental set-up for cutting forces measurement: (a)—experimental setup; (b)—basic view of the workpiece with the tool to obtain the chip root; (c)—chip root; (d)—scheme of obtaining the chip root.
Figure 2.
Experimental set-up for cutting forces measurement: (a)—experimental setup; (b)—basic view of the workpiece with the tool to obtain the chip root; (c)—chip root; (d)—scheme of obtaining the chip root.
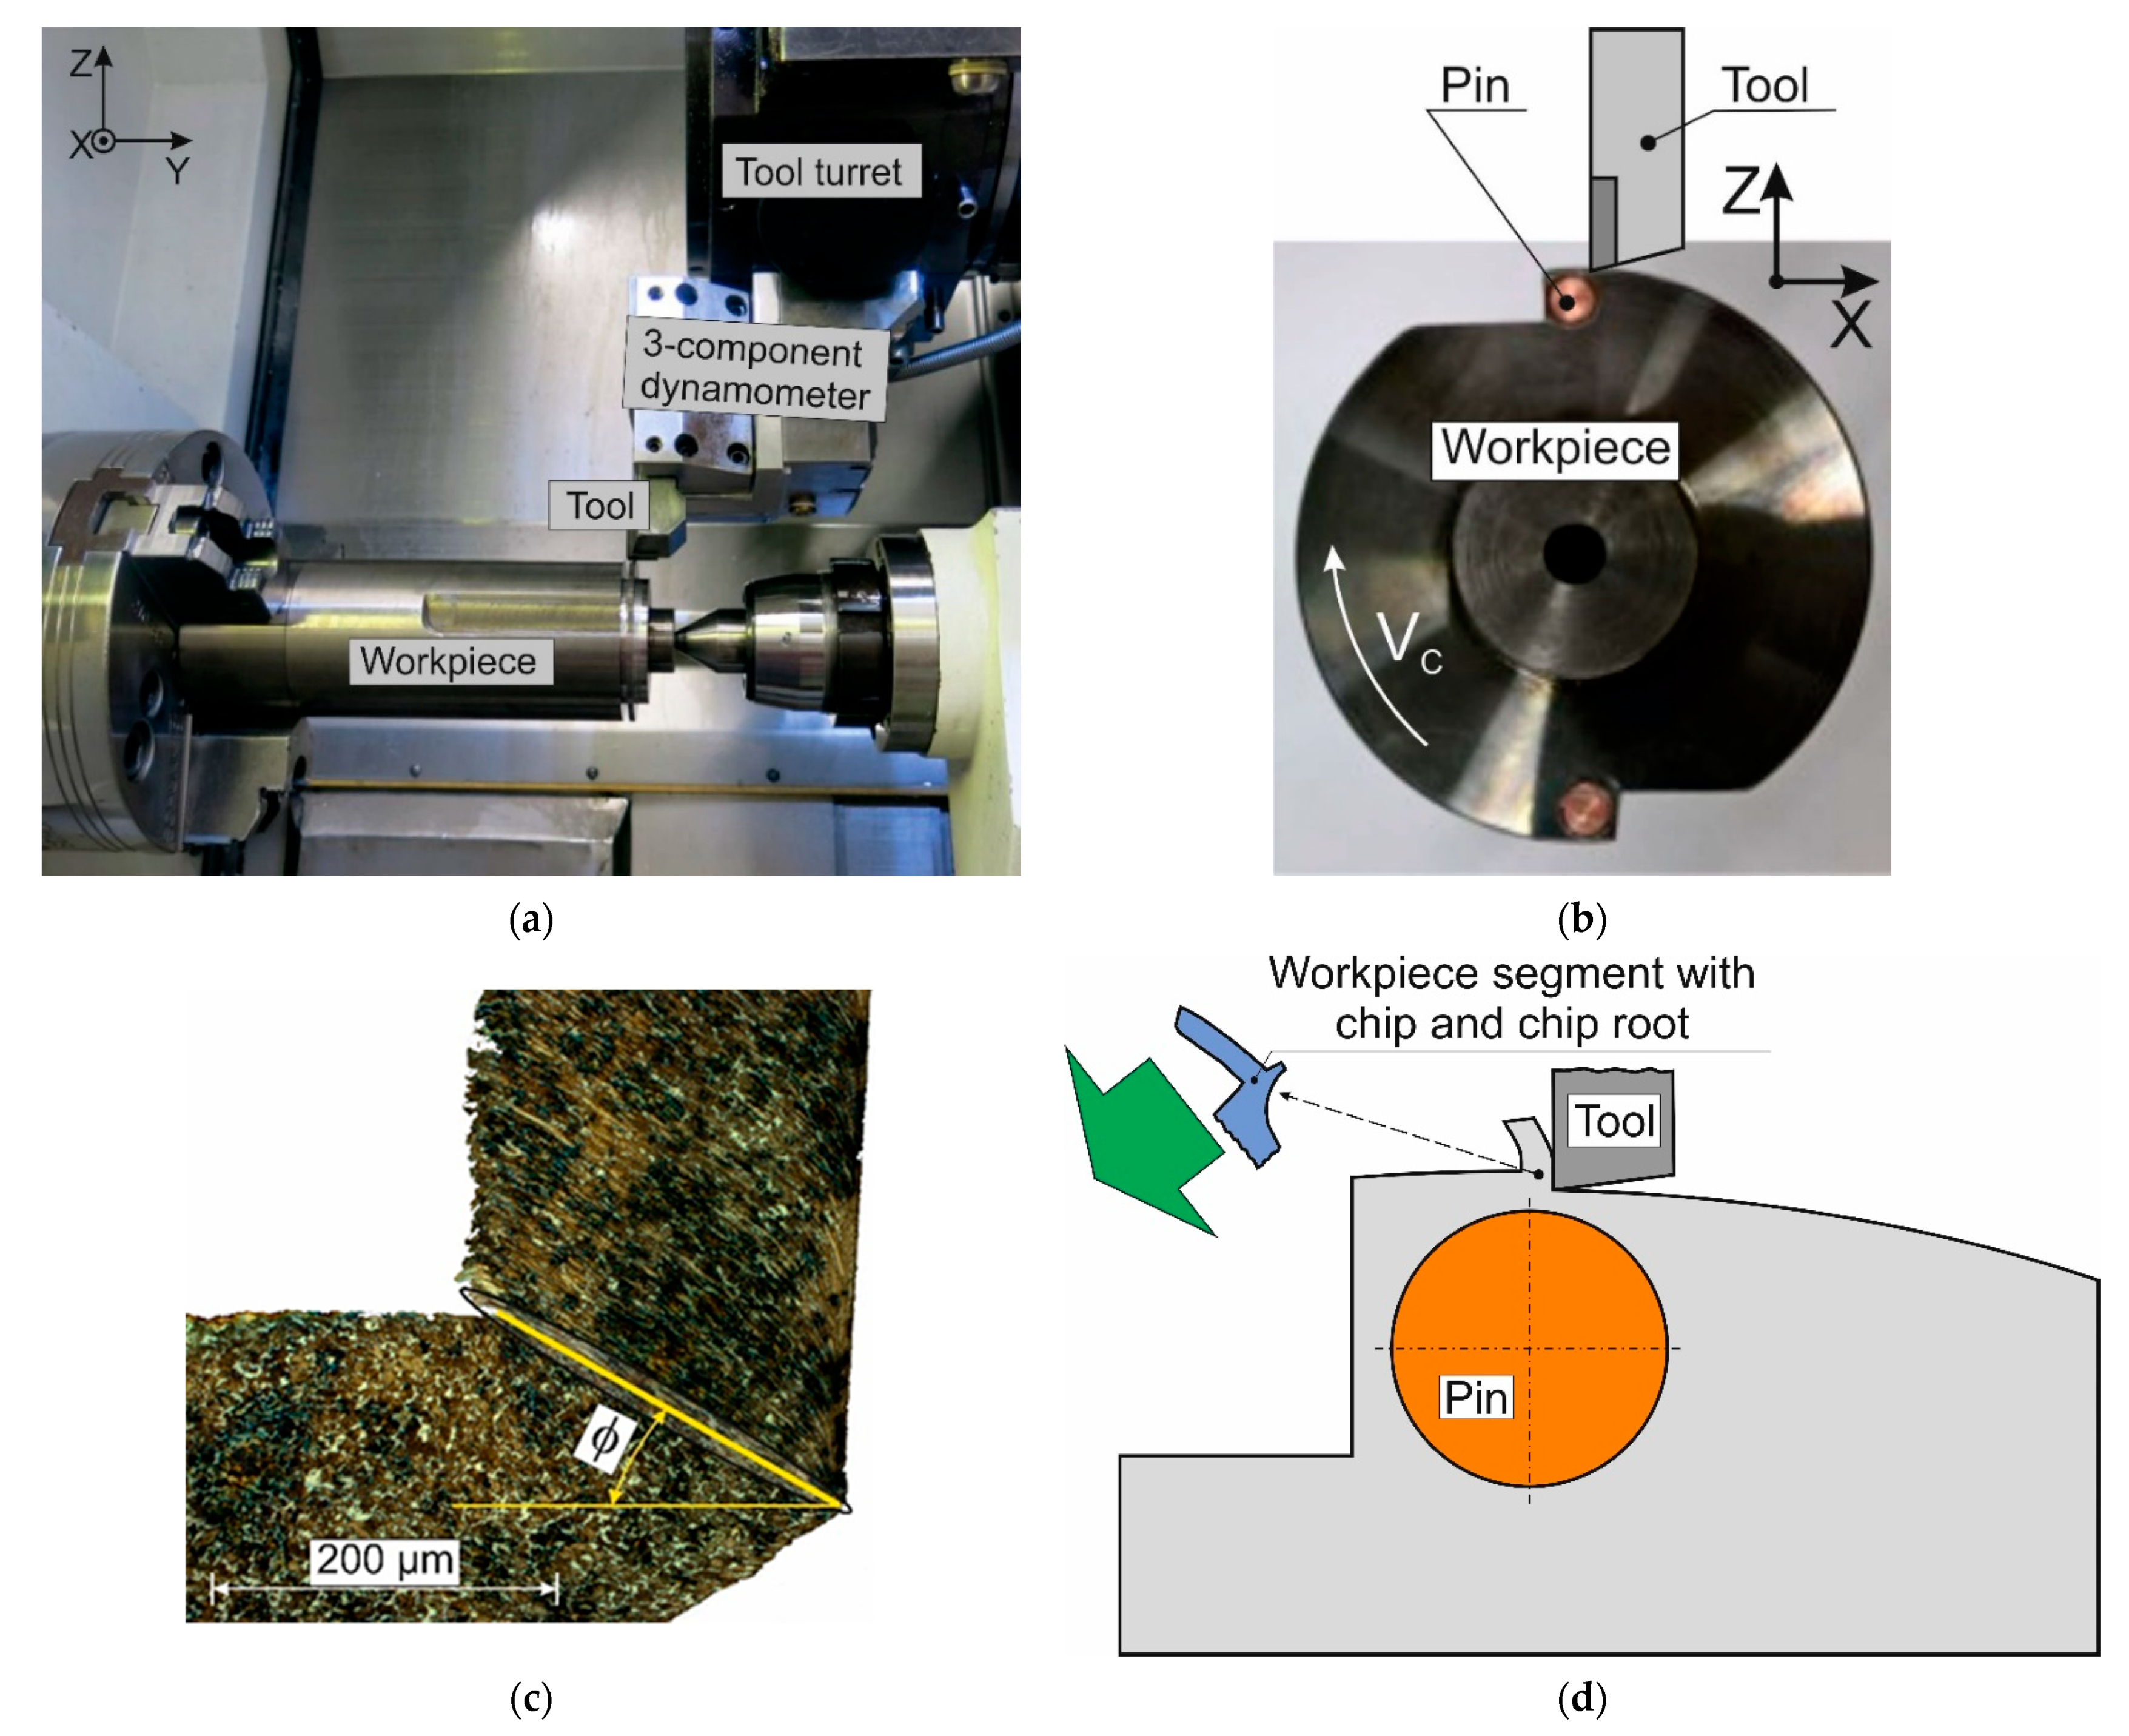
Figure 3.
Flowchart for determination of the shear angle (a) and cutting power change with a variation of the shear angle (b).
Figure 3.
Flowchart for determination of the shear angle (a) and cutting power change with a variation of the shear angle (b).

Figure 4.
Initial geometry, boundary conditions, and mesh of the FE cutting model.
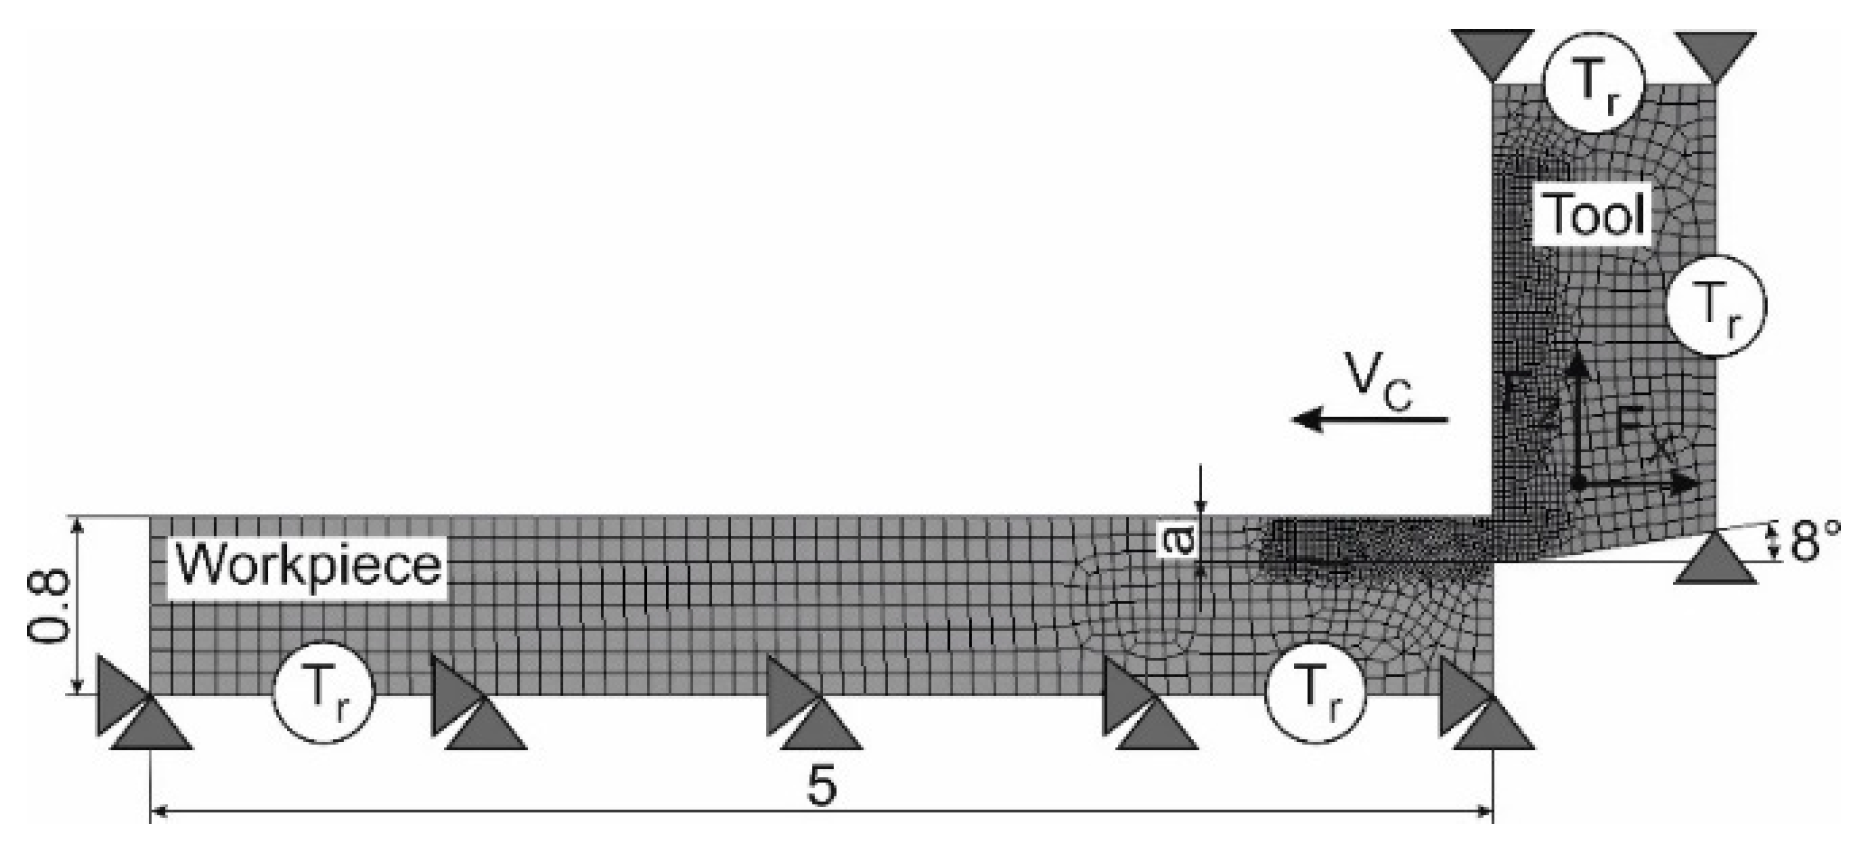
Figure 5.
Simulation of strain (a) and strain rate distribution (b) in the cutting zones of the machined material.
Figure 5.
Simulation of strain (a) and strain rate distribution (b) in the cutting zones of the machined material.

Figure 6.
Changing the shear angle depending on the cutting speed and the tool rake angle.
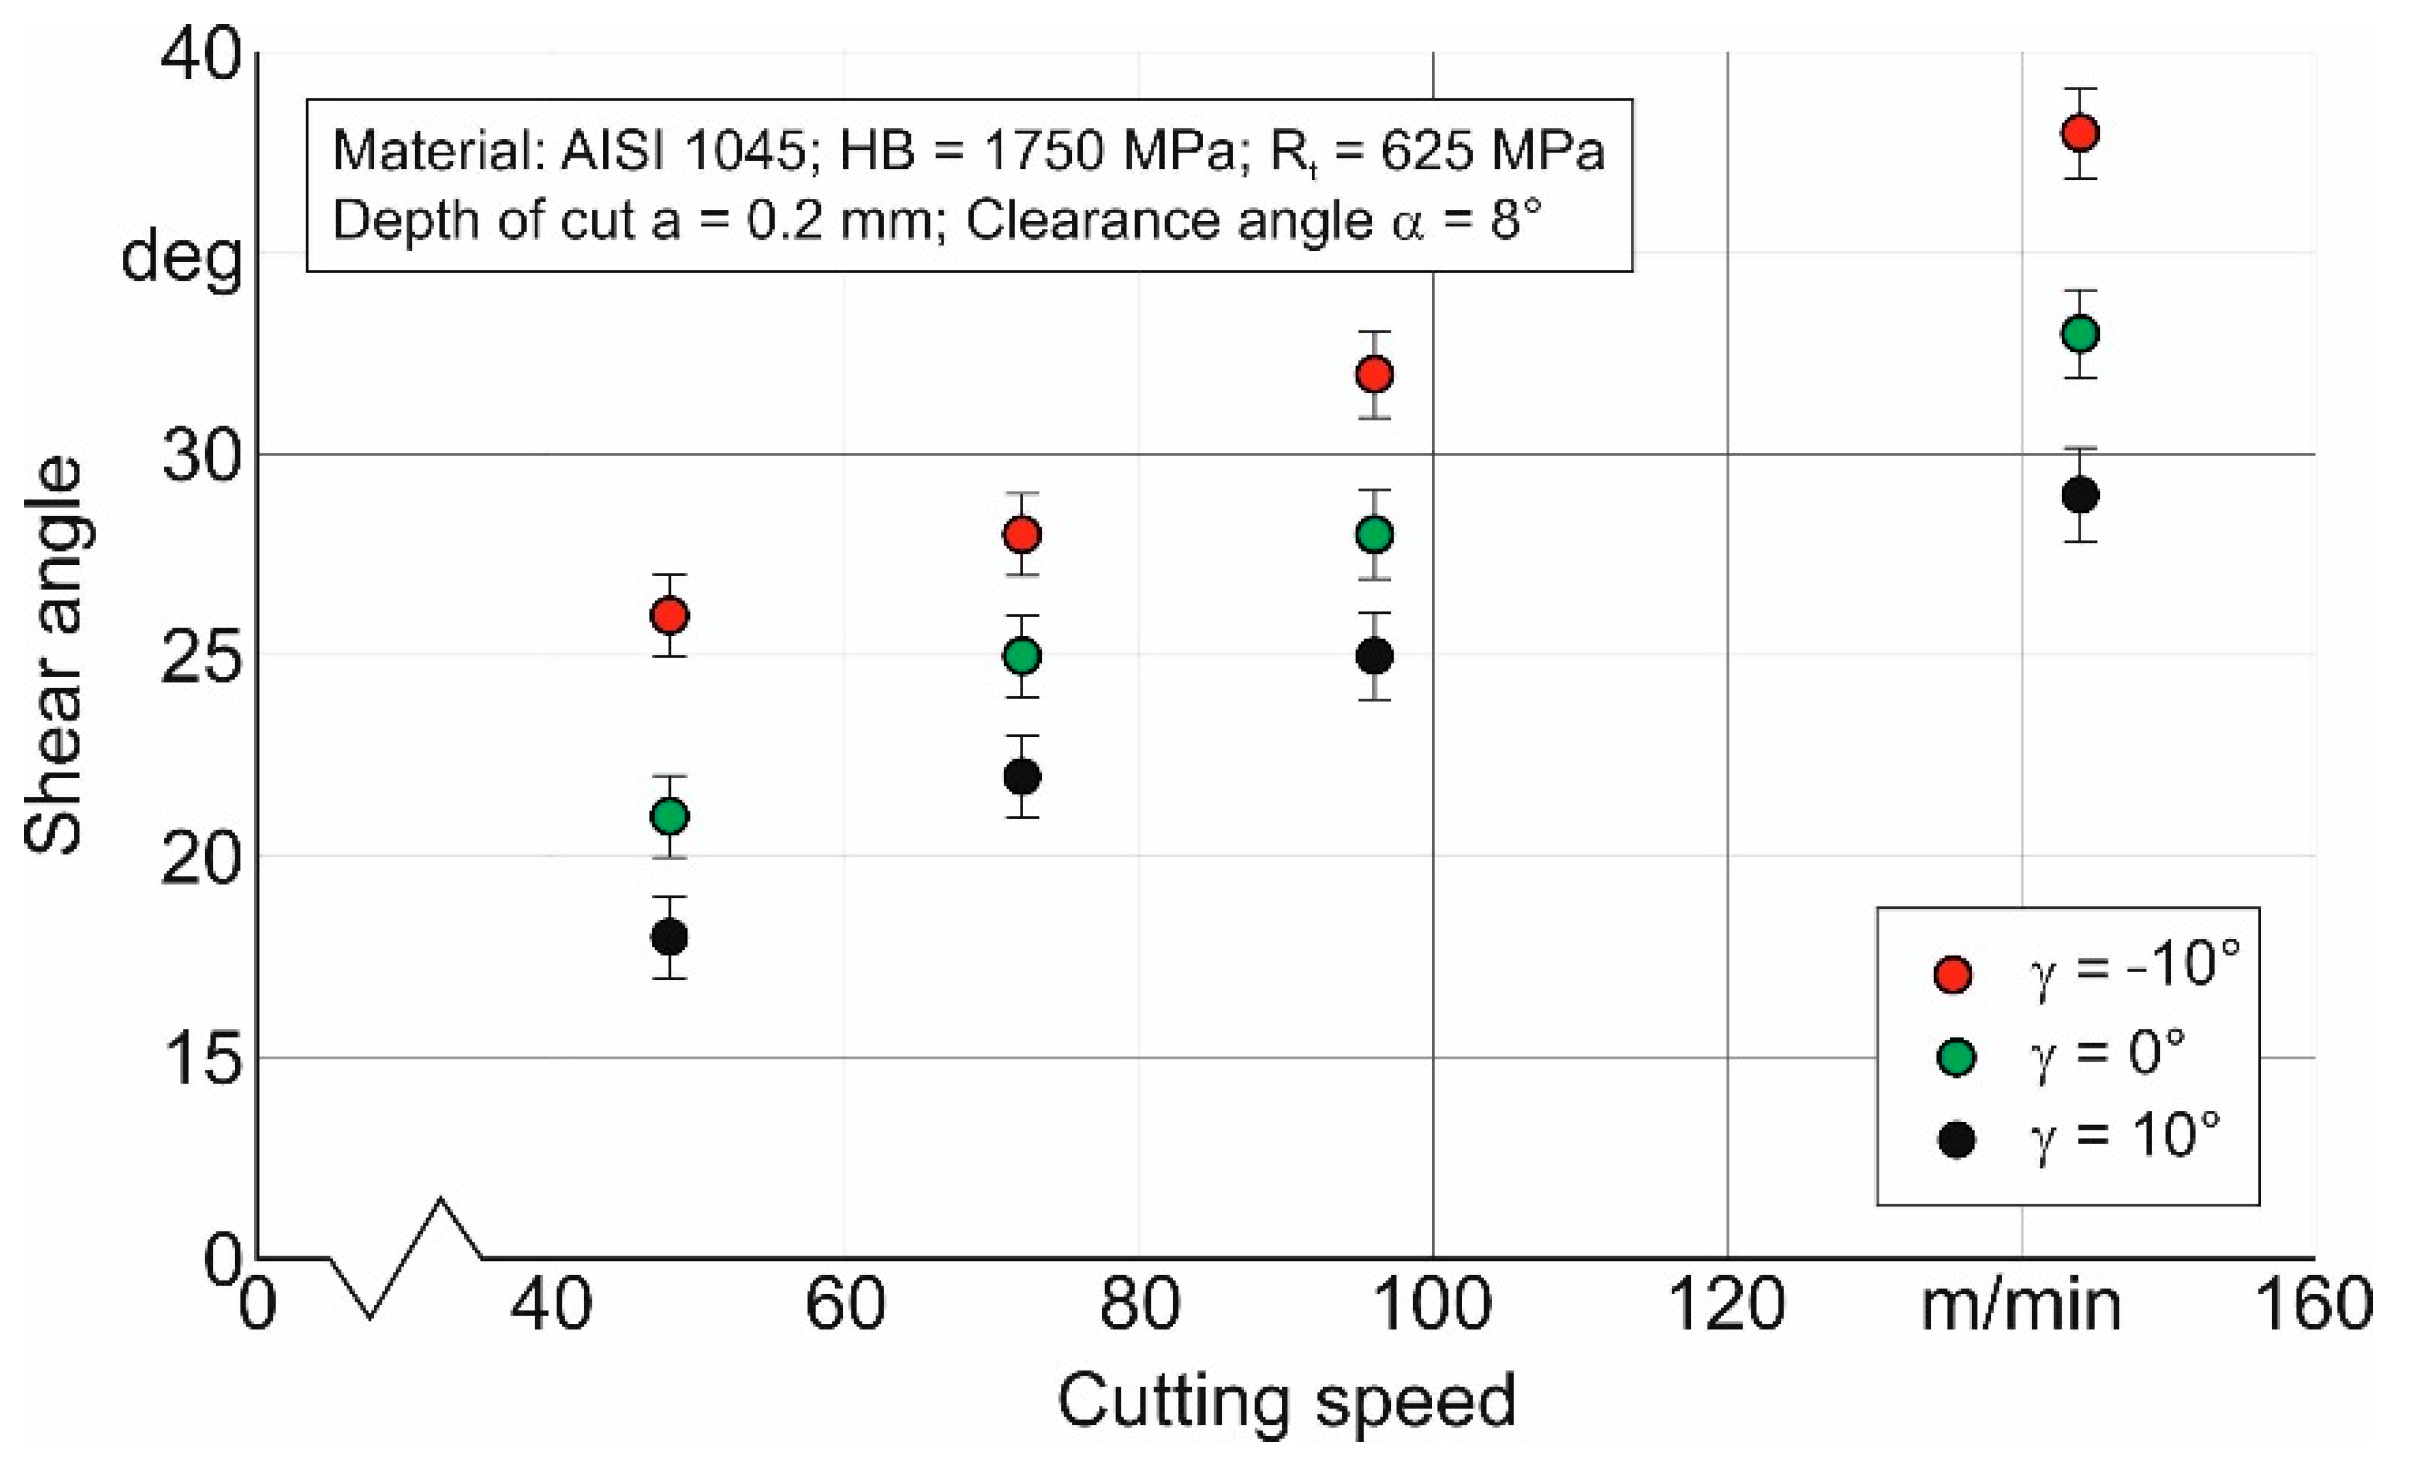
Figure 7.
Changing the chip compression ratio depending on the cutting speed and the tool rake angle.
Figure 7.
Changing the chip compression ratio depending on the cutting speed and the tool rake angle.
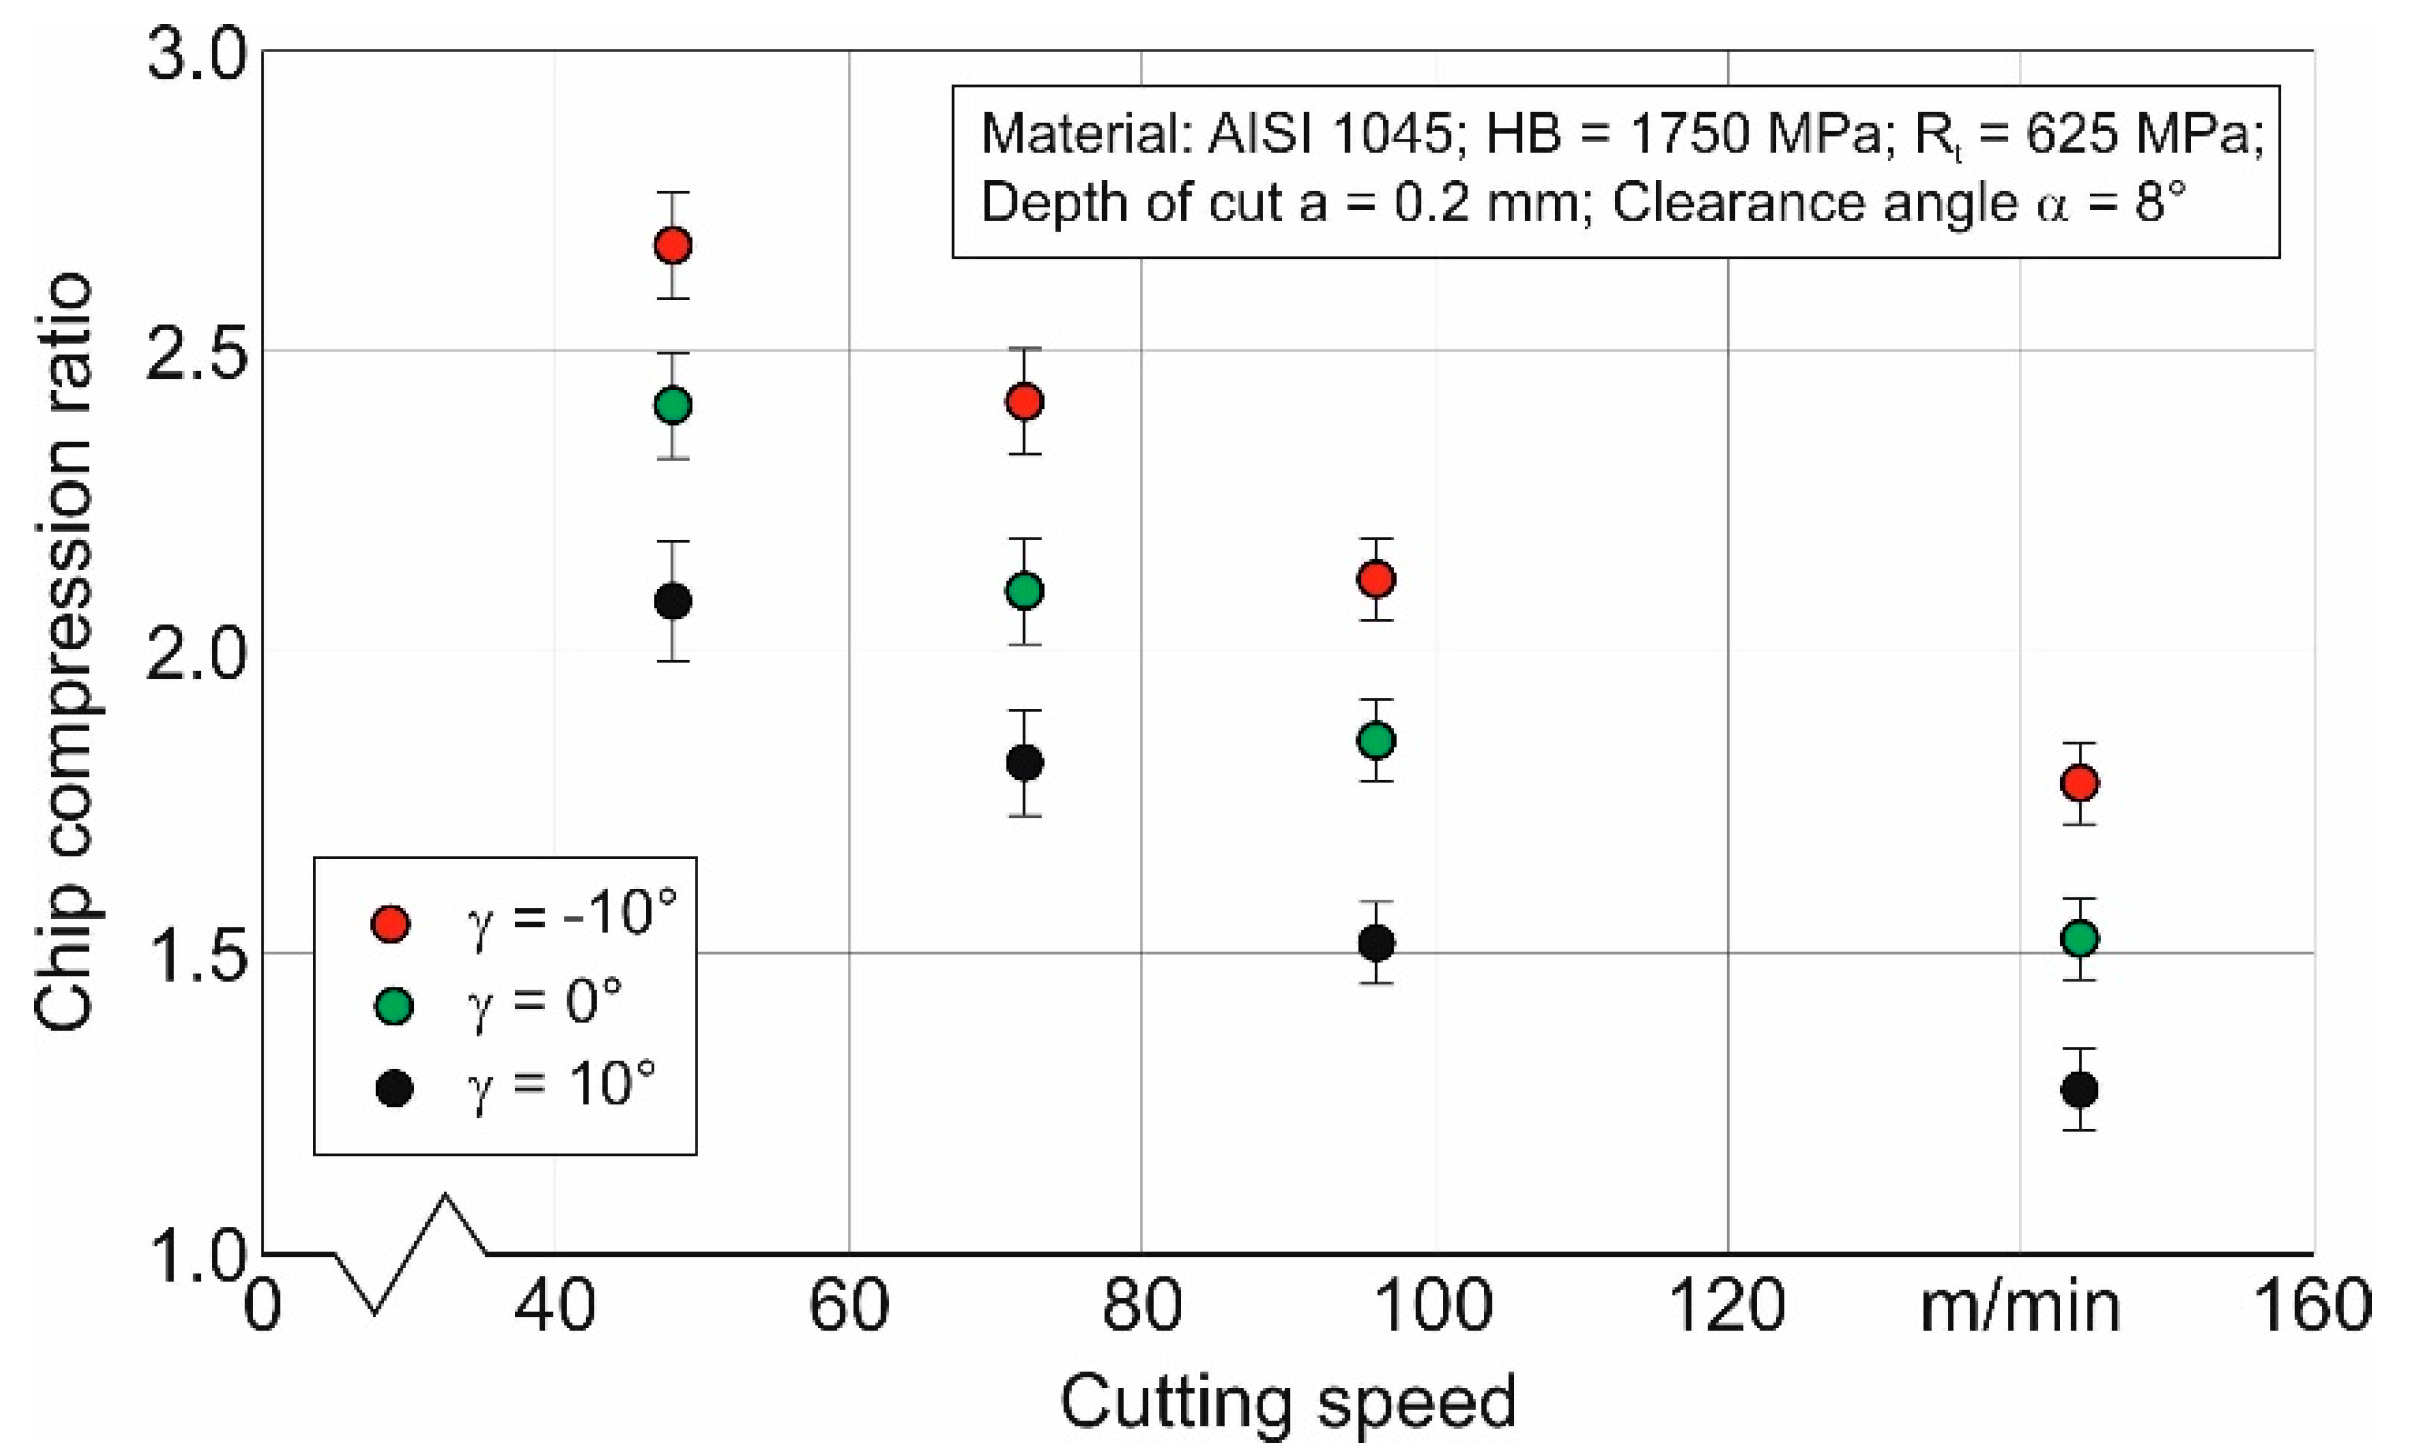
Figure 8.
Changing the shear angle from separate parameters of the material model and the friction model: (a) initial yield stress A, (b) strain-hardening coefficient B, (c) power factor of stress hardening n, (d) strain rate coefficient C, (e) power coefficient of thermal softening m, (f) friction coefficient f.

Figure 9.
The first iteration of the simulated shear angle distribution relative to its experimental values for different cutting speed: (a)—cutting speed 48 v/min; (b)—cutting speed 72 m/min; (c)—cutting speed 96 m/min; (d)—cutting speed 144 m/min.
Figure 9.
The first iteration of the simulated shear angle distribution relative to its experimental values for different cutting speed: (a)—cutting speed 48 v/min; (b)—cutting speed 72 m/min; (c)—cutting speed 96 m/min; (d)—cutting speed 144 m/min.
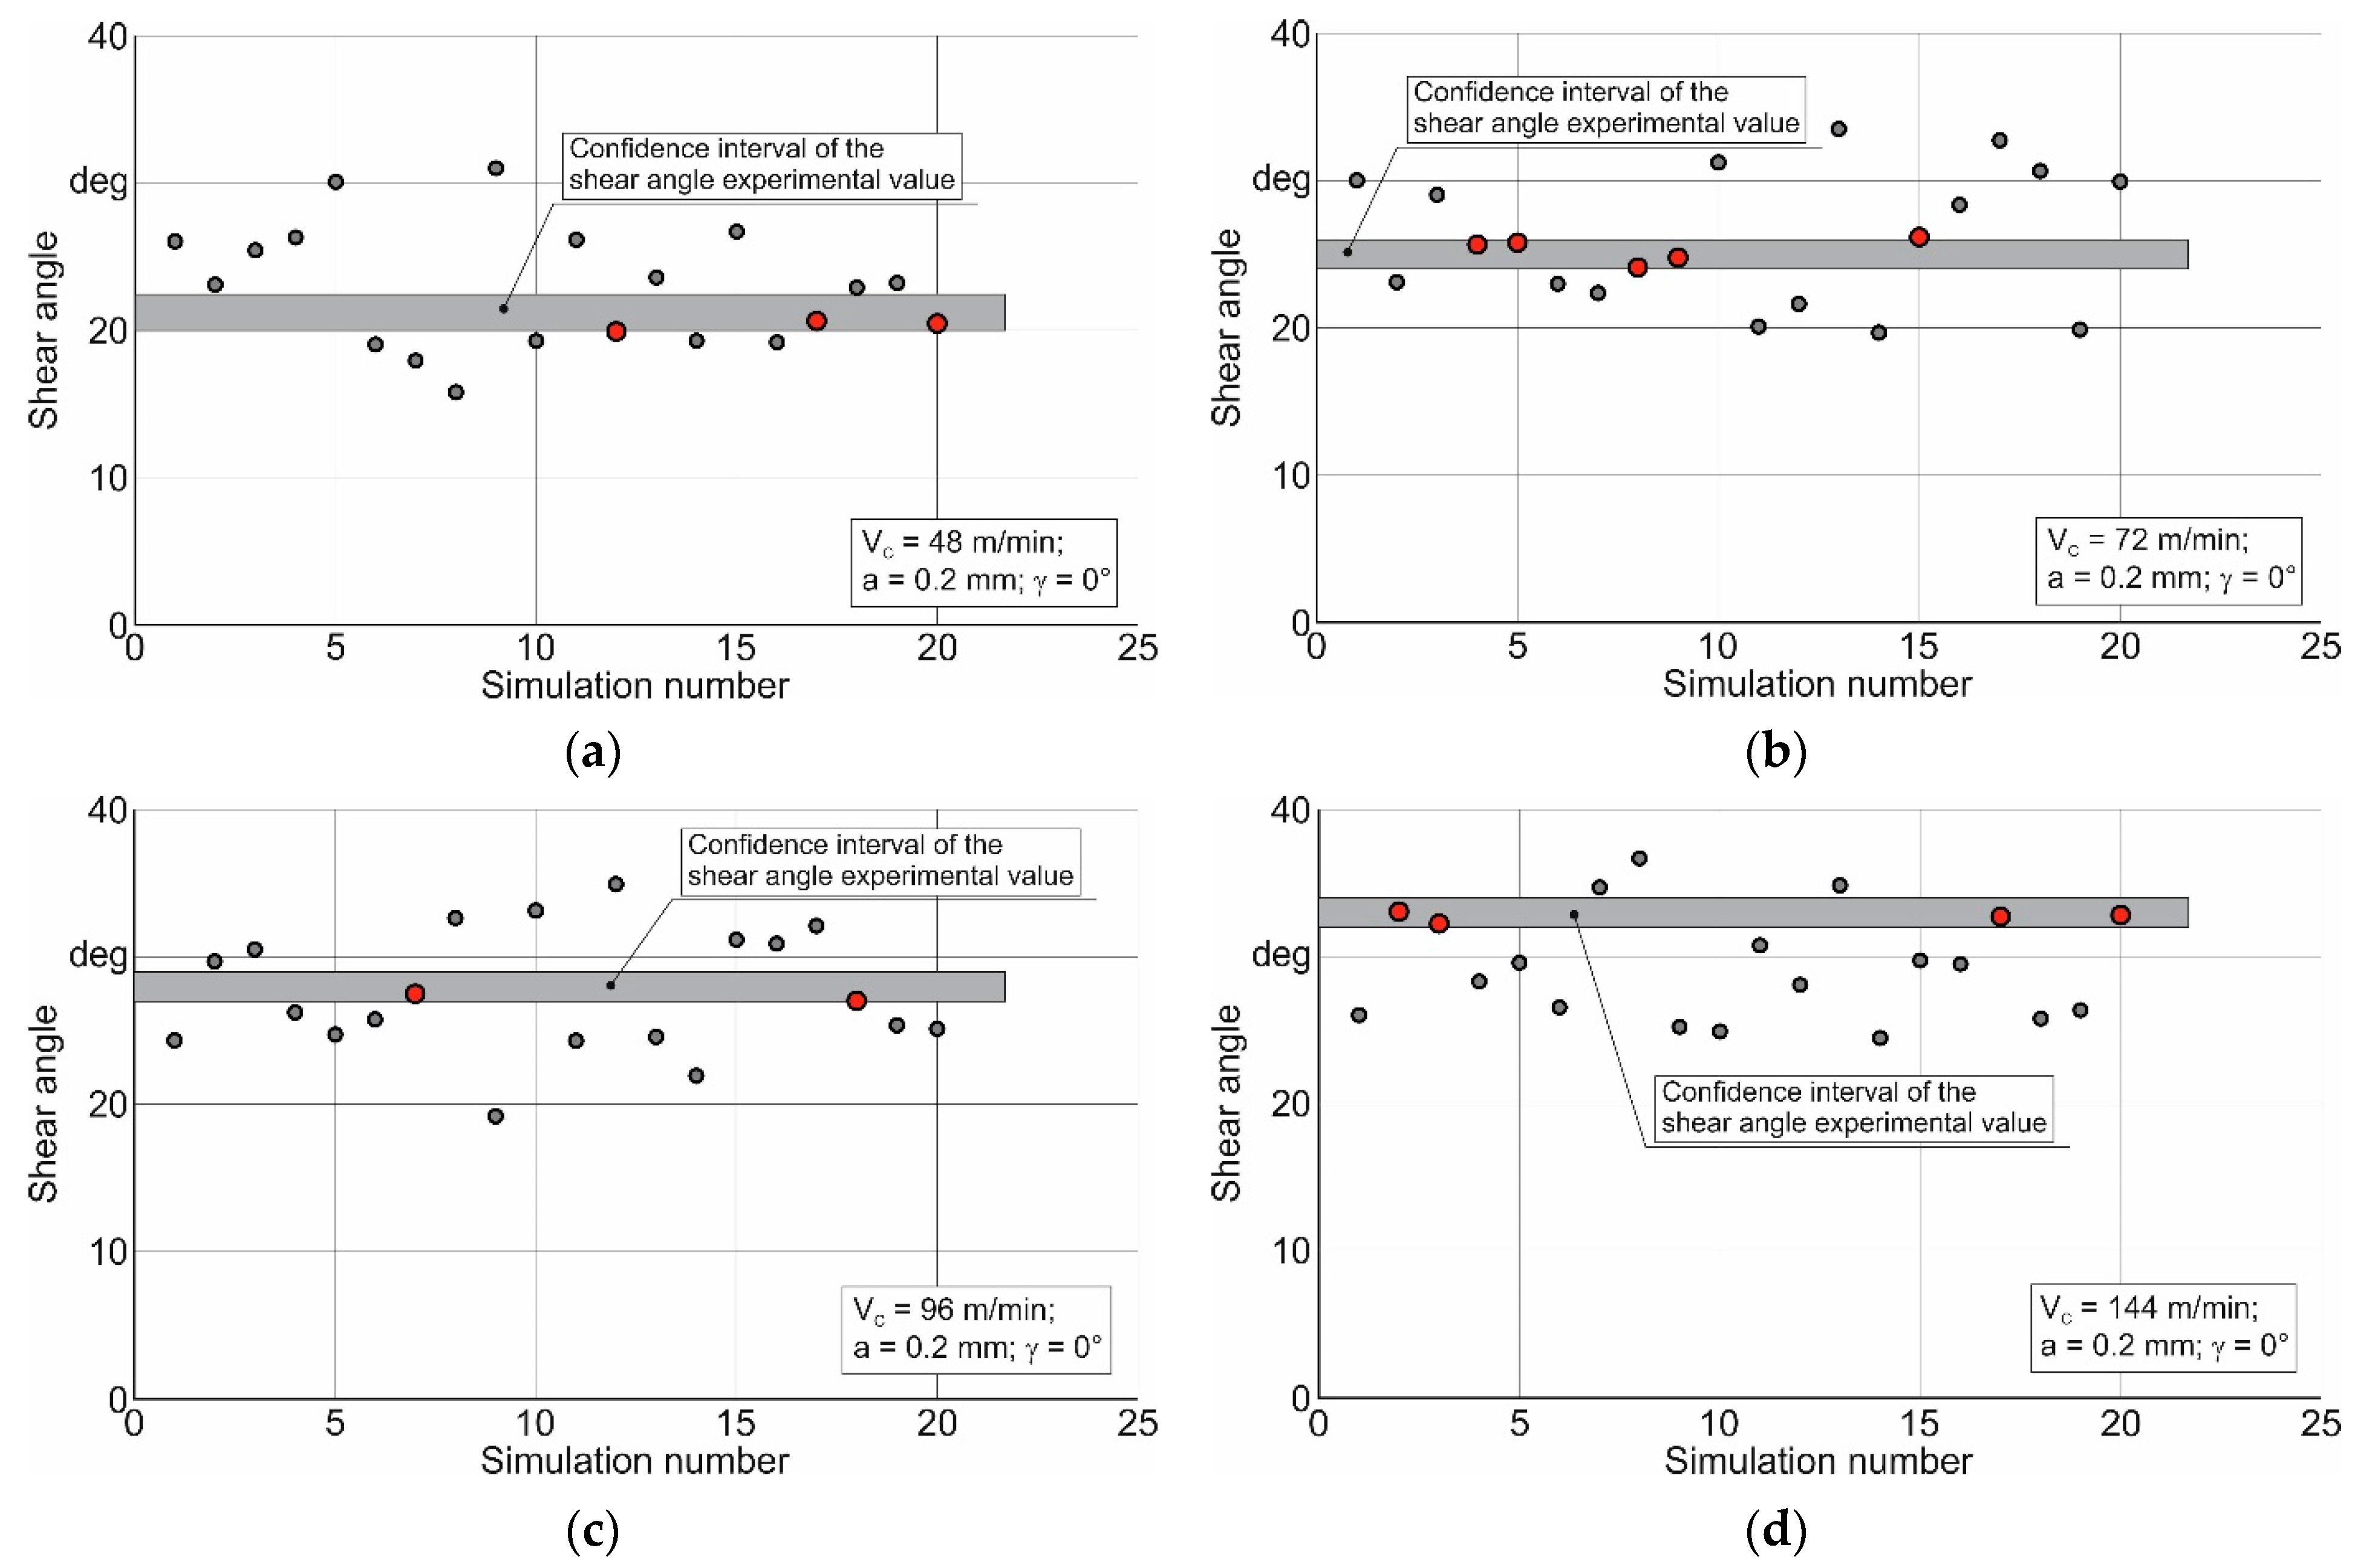
Figure 10.
Second iteration of the simulated shear angle distribution relative to its experimental values for different cutting speeds: (a)—cutting speed 48 v/min; (b)—cutting speed 72 m/min; (c)—cutting speed 96 m/min; (d)—cutting speed 144 m/min.
Figure 10.
Second iteration of the simulated shear angle distribution relative to its experimental values for different cutting speeds: (a)—cutting speed 48 v/min; (b)—cutting speed 72 m/min; (c)—cutting speed 96 m/min; (d)—cutting speed 144 m/min.

Figure 11.
Comparison of experimental, calculated, and simulated shear angle values for different cutting speeds and rake angles: (a)—tool rake angle γ = −10°; (b)—tool rake angle γ = 0°; (c)—tool rake angle γ = 10°.
Figure 11.
Comparison of experimental, calculated, and simulated shear angle values for different cutting speeds and rake angles: (a)—tool rake angle γ = −10°; (b)—tool rake angle γ = 0°; (c)—tool rake angle γ = 10°.


| Material | Strength (MPa) | Elastic Modulus (GPa) | Elongation (%) | Hard-Ness | Poisson’s Ratio | Specific Heat (J/kg·K) | Thermal Expansion (µm/m·°C) | Thermal Conductivity (W/m·K) | |
|---|---|---|---|---|---|---|---|---|---|
| Tensile | Yield | ||||||||
| AISI 1045 | 690 | 620 | 206 | 12 | HB 180 | 0.29 | 486 | 14 | 49.8 |
| SNMG-SM-1105 | - | - | 650 | - | HRC 76 | 0.25 | 251 | - | 59 |
Table 2.
Initial parameters of the Johnson–Cook constitutive equation.
| Constitutive Parameters | ||||
|---|---|---|---|---|
| A [MPa] | B [MPa] | n | C | m |
| 512.3 | 671.7 | 0.2905 | 0.01244 | 1.26 |
Table 3.
Variation limits for the constitutive equation parameters.
| A [MPa] | B [MPa] | n [−] | C [−] | ||||
|---|---|---|---|---|---|---|---|
| Upper limit | Lower limit | Upper limit | Lower limit | Upper limit | Lower limit | Upper limit | Lower limit |
| 1000 | 600 | 1200 | 800 | 0.27 | 0.08 | 0.1 | 0.05 |
Table 4.
Generalized values of the constitutive equation parameters.
| Constitutive Parameters | ||||
|---|---|---|---|---|
| A [MPa] | B [MPa] | n | C | m |
| 853.5 | 925.6 | 0.19565 | 0.0657 | 1 |
Publisher’s Note: MDPI stays neutral with regard to jurisdictional claims in published maps and institutional affiliations. |
© 2022 by the authors. Licensee MDPI, Basel, Switzerland. This article is an open access article distributed under the terms and conditions of the Creative Commons Attribution (CC BY) license (https://creativecommons.org/licenses/by/4.0/).
Share and Cite
MDPI and ACS Style
Storchak, M.; Stehle, T.; Möhring, H.-C. Determination of the Shear Angle in the Orthogonal Cutting Process. J. Manuf. Mater. Process. 2022, 6, 132. https://doi.org/10.3390/jmmp6060132
AMA Style
Storchak M, Stehle T, Möhring H-C. Determination of the Shear Angle in the Orthogonal Cutting Process. Journal of Manufacturing and Materials Processing. 2022; 6(6):132. https://doi.org/10.3390/jmmp6060132
Chicago/Turabian StyleStorchak, Michael, Thomas Stehle, and Hans-Christian Möhring. 2022. "Determination of the Shear Angle in the Orthogonal Cutting Process" Journal of Manufacturing and Materials Processing 6, no. 6: 132. https://doi.org/10.3390/jmmp6060132