

Experimental Analysis and Spatial Component Impact of the Inert Cross Flow in Open-Architecture Laser Powder Bed Fusion

Abstract
:1. Introduction
1.1. L-PBF Process Parameters
1.2. Spatter
1.3. The Plume
1.4. Cross-Flow Requirements and Flow Conditioners
- The gas flow velocity should be as high as possible to optimize the removal of the process byproducts and to avoid redeposits;
- The flow should be as close to the powder bed as possible to minimize the interaction between the laser and the byproducts;
- Flow separations and turbulence resulting in velocity in the z direction should be reduced to a minimum to decrease the probability of disturbances of the laser beam path by process byproducts;
- The flow velocity profile should not disturb or otherwise entrain the powder bed;
- The height of the flow profile should be sufficient to avoid ejecta escaping the cross flow.
1.5. Gas Flow Analysis
2. Materials and Methods
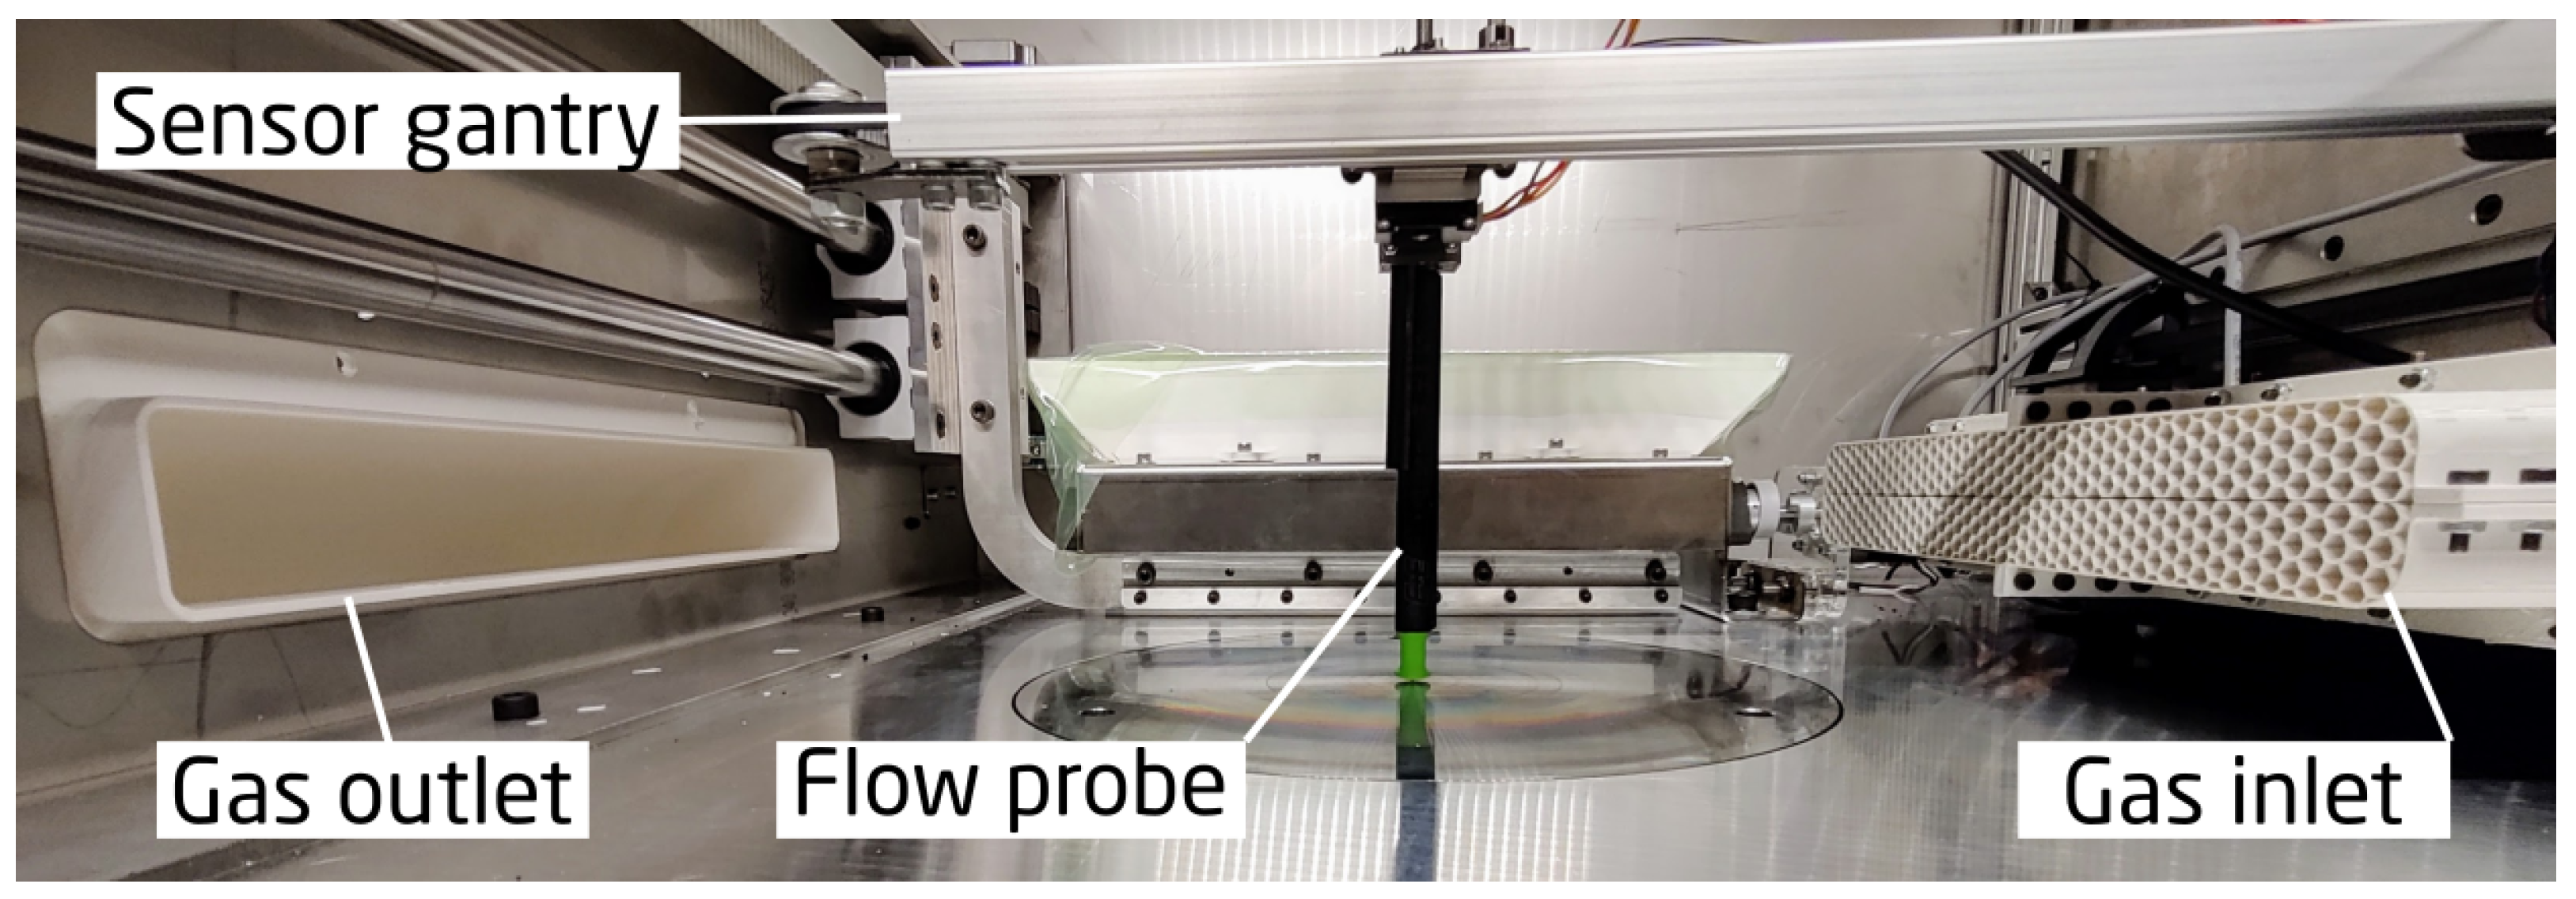
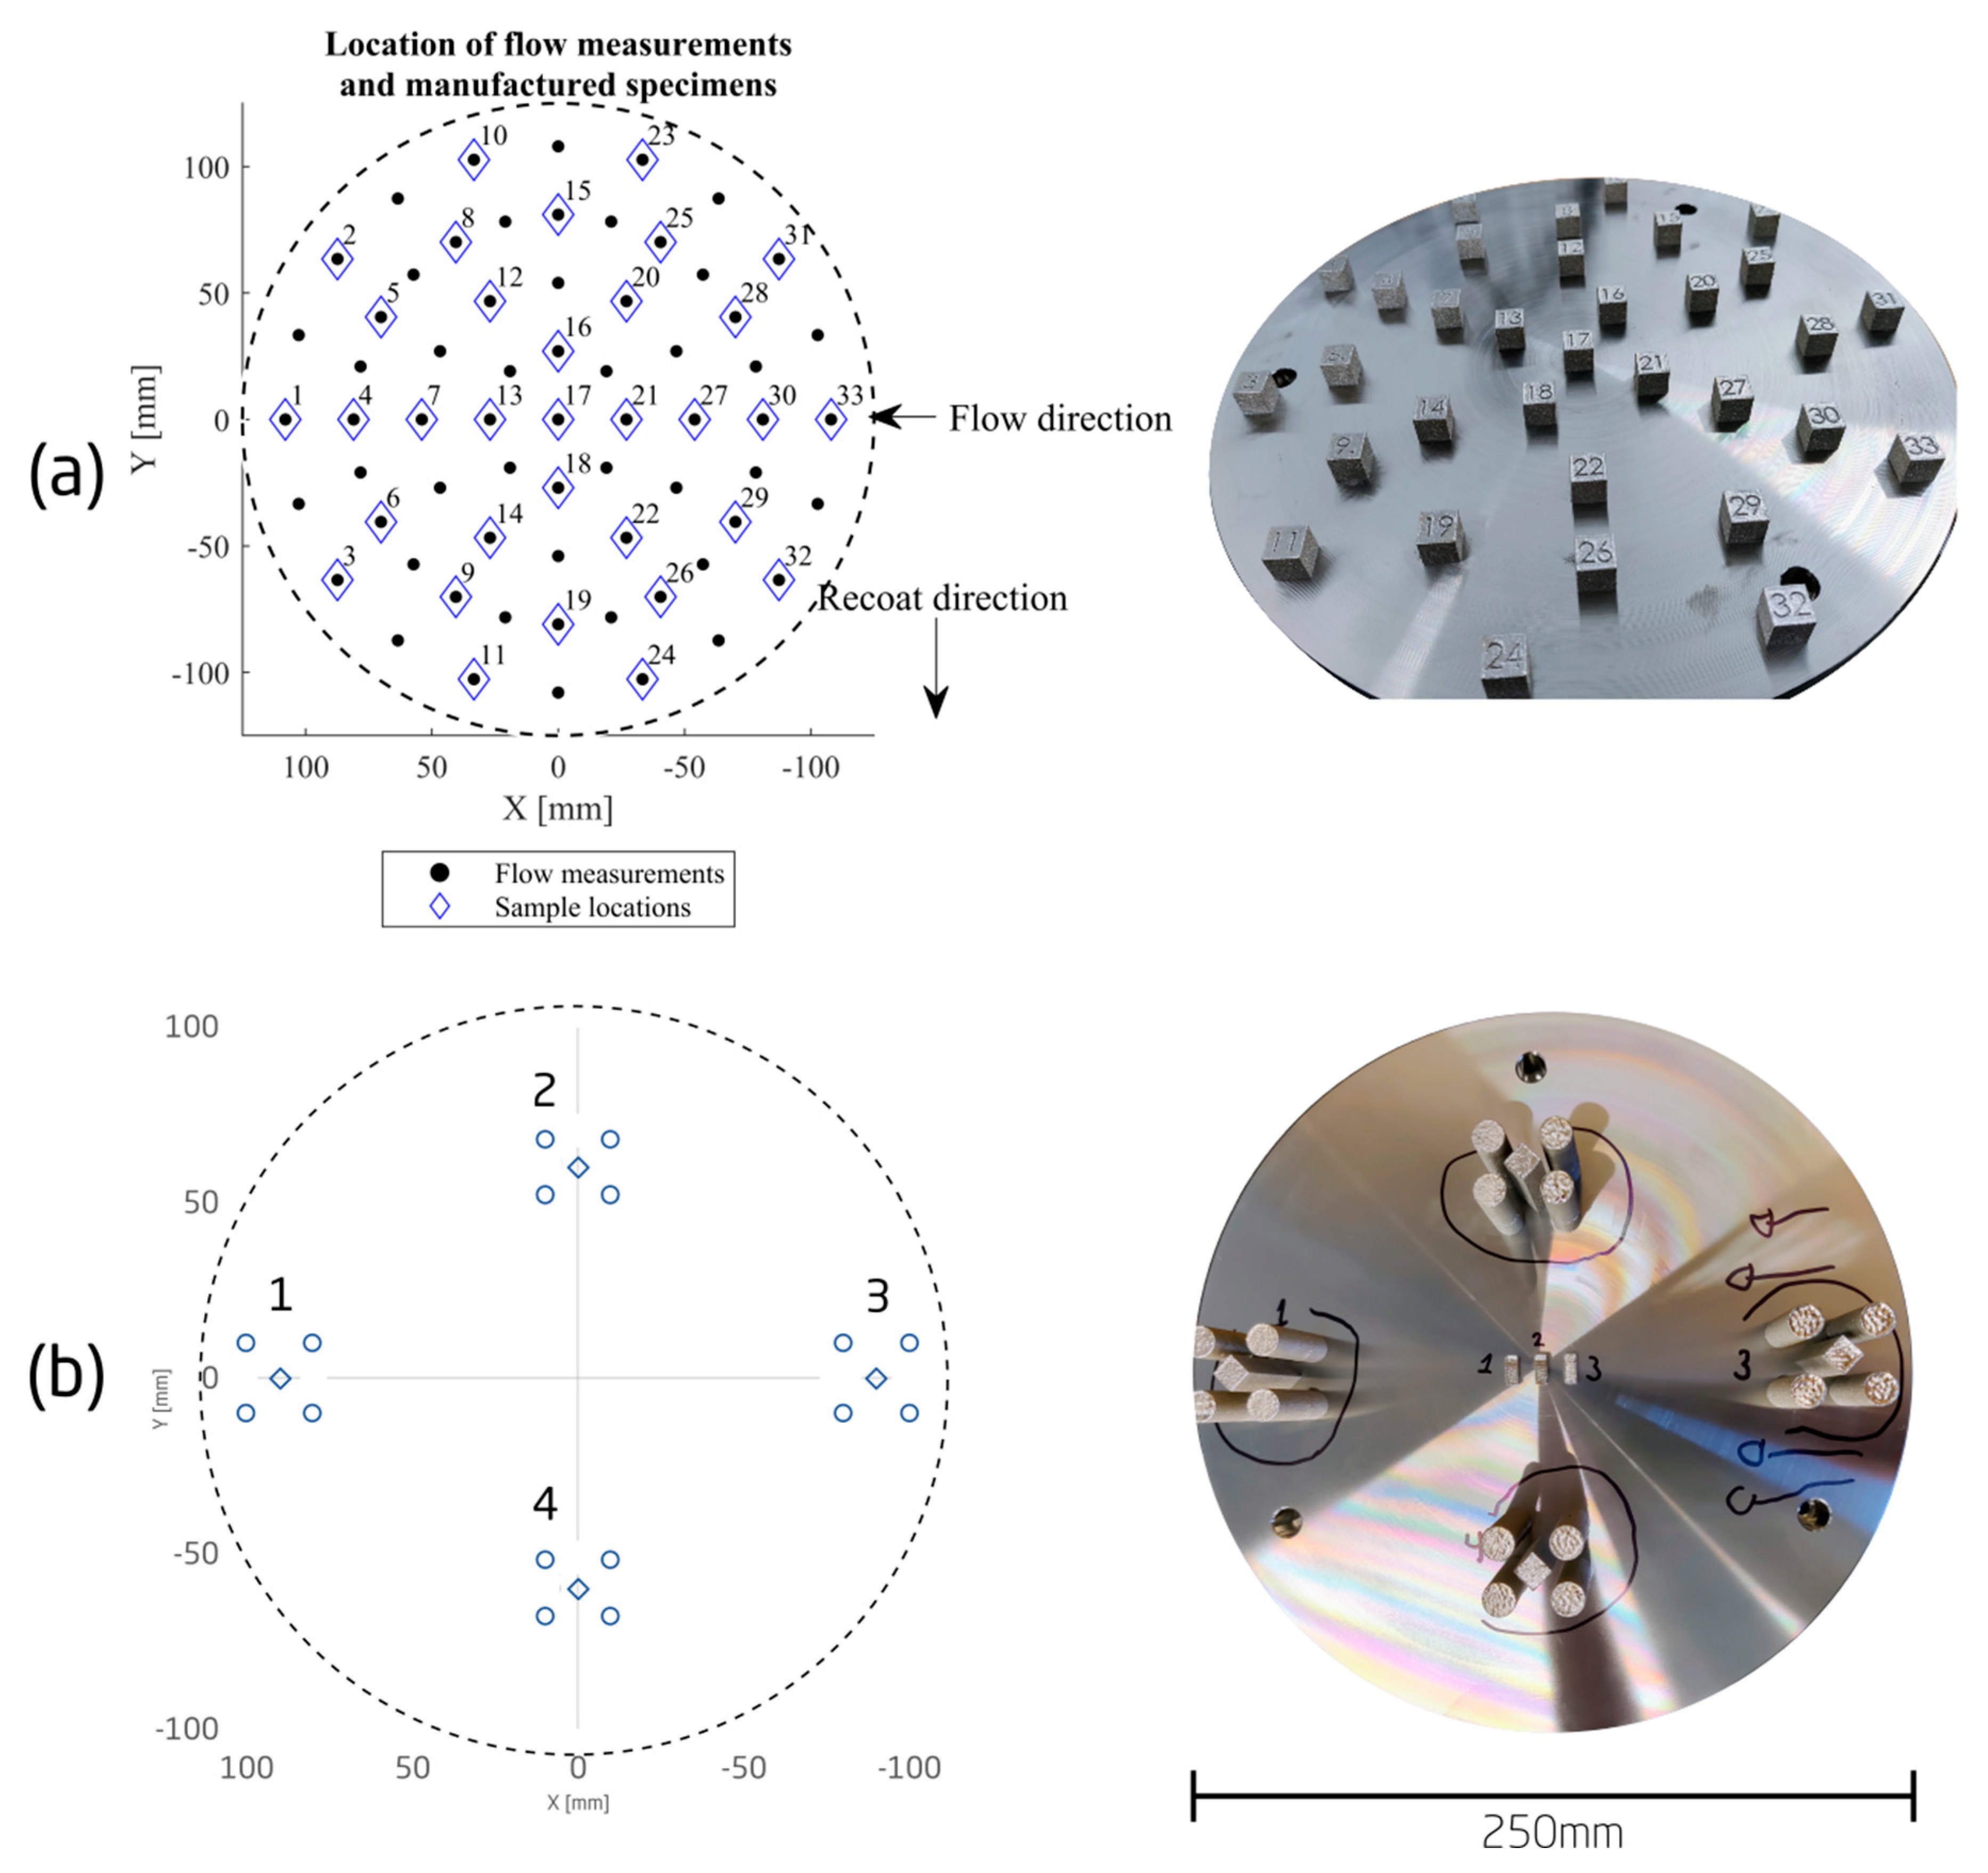
2.1. Flow Measurements
2.2. Manufacturing
2.3. Density Measurements
2.4. Melt-Pool Dimensions
3. Results
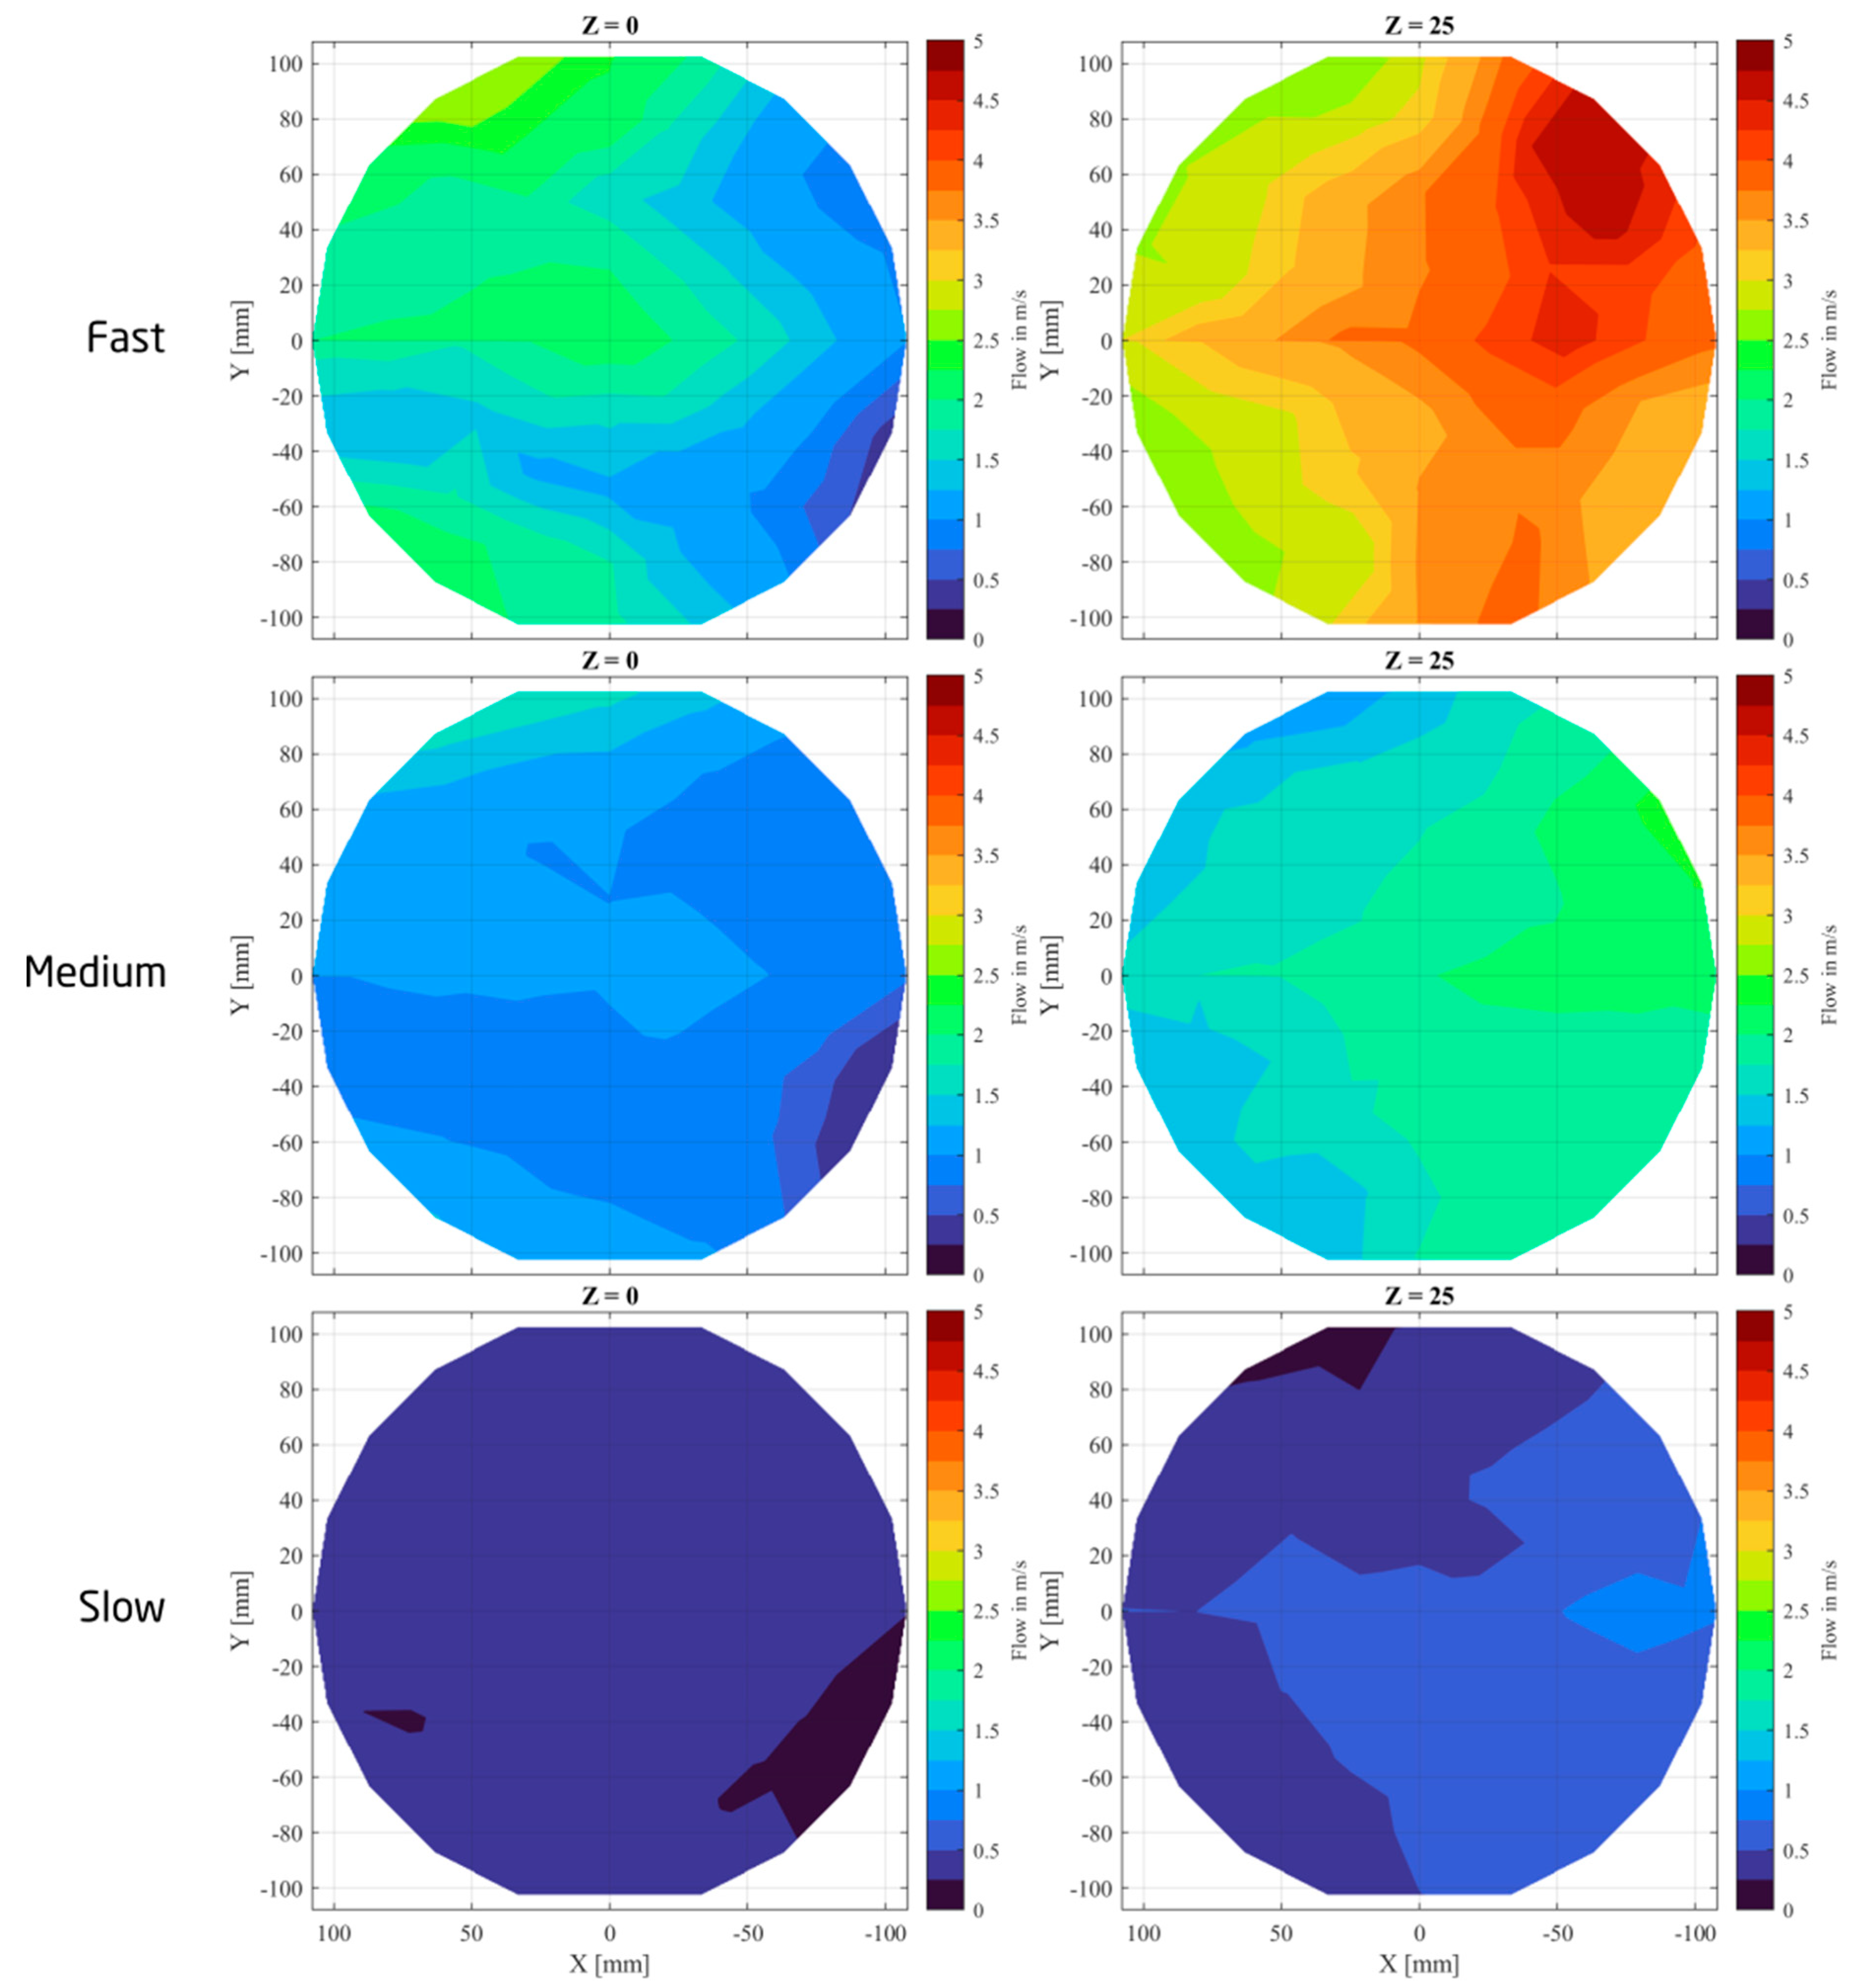
3.1. Flow Maps
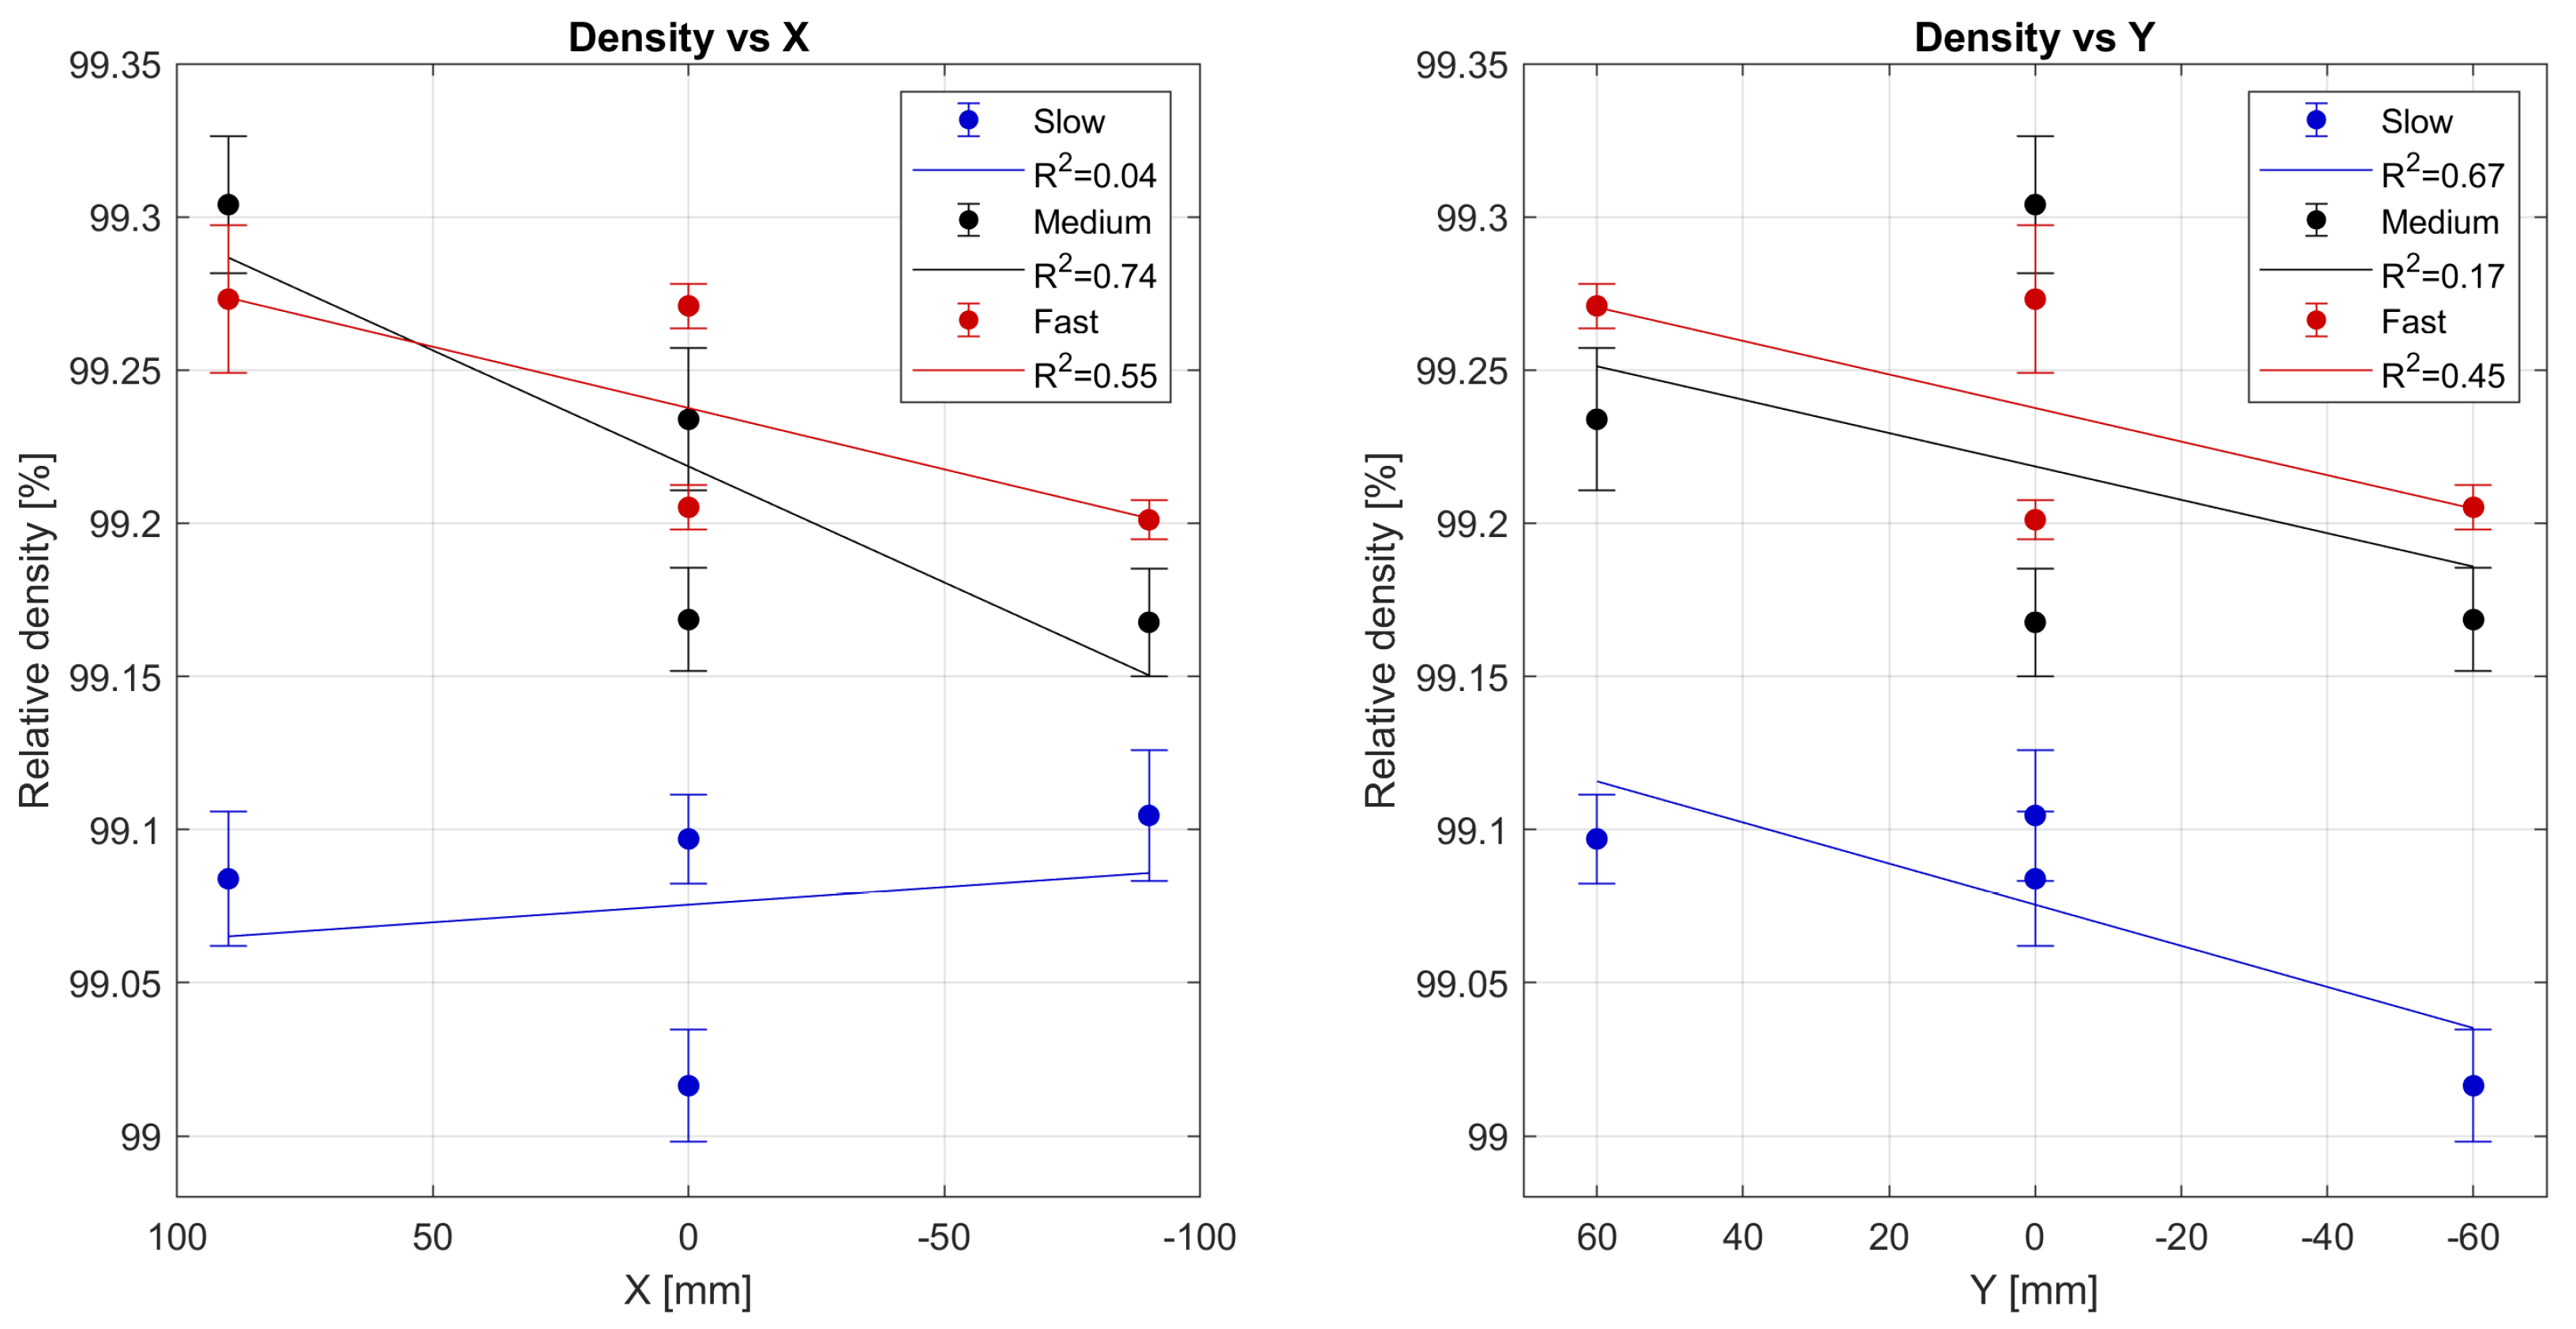
3.2. Bulk Density
3.2.1. Cubes
3.2.2. Cylinders
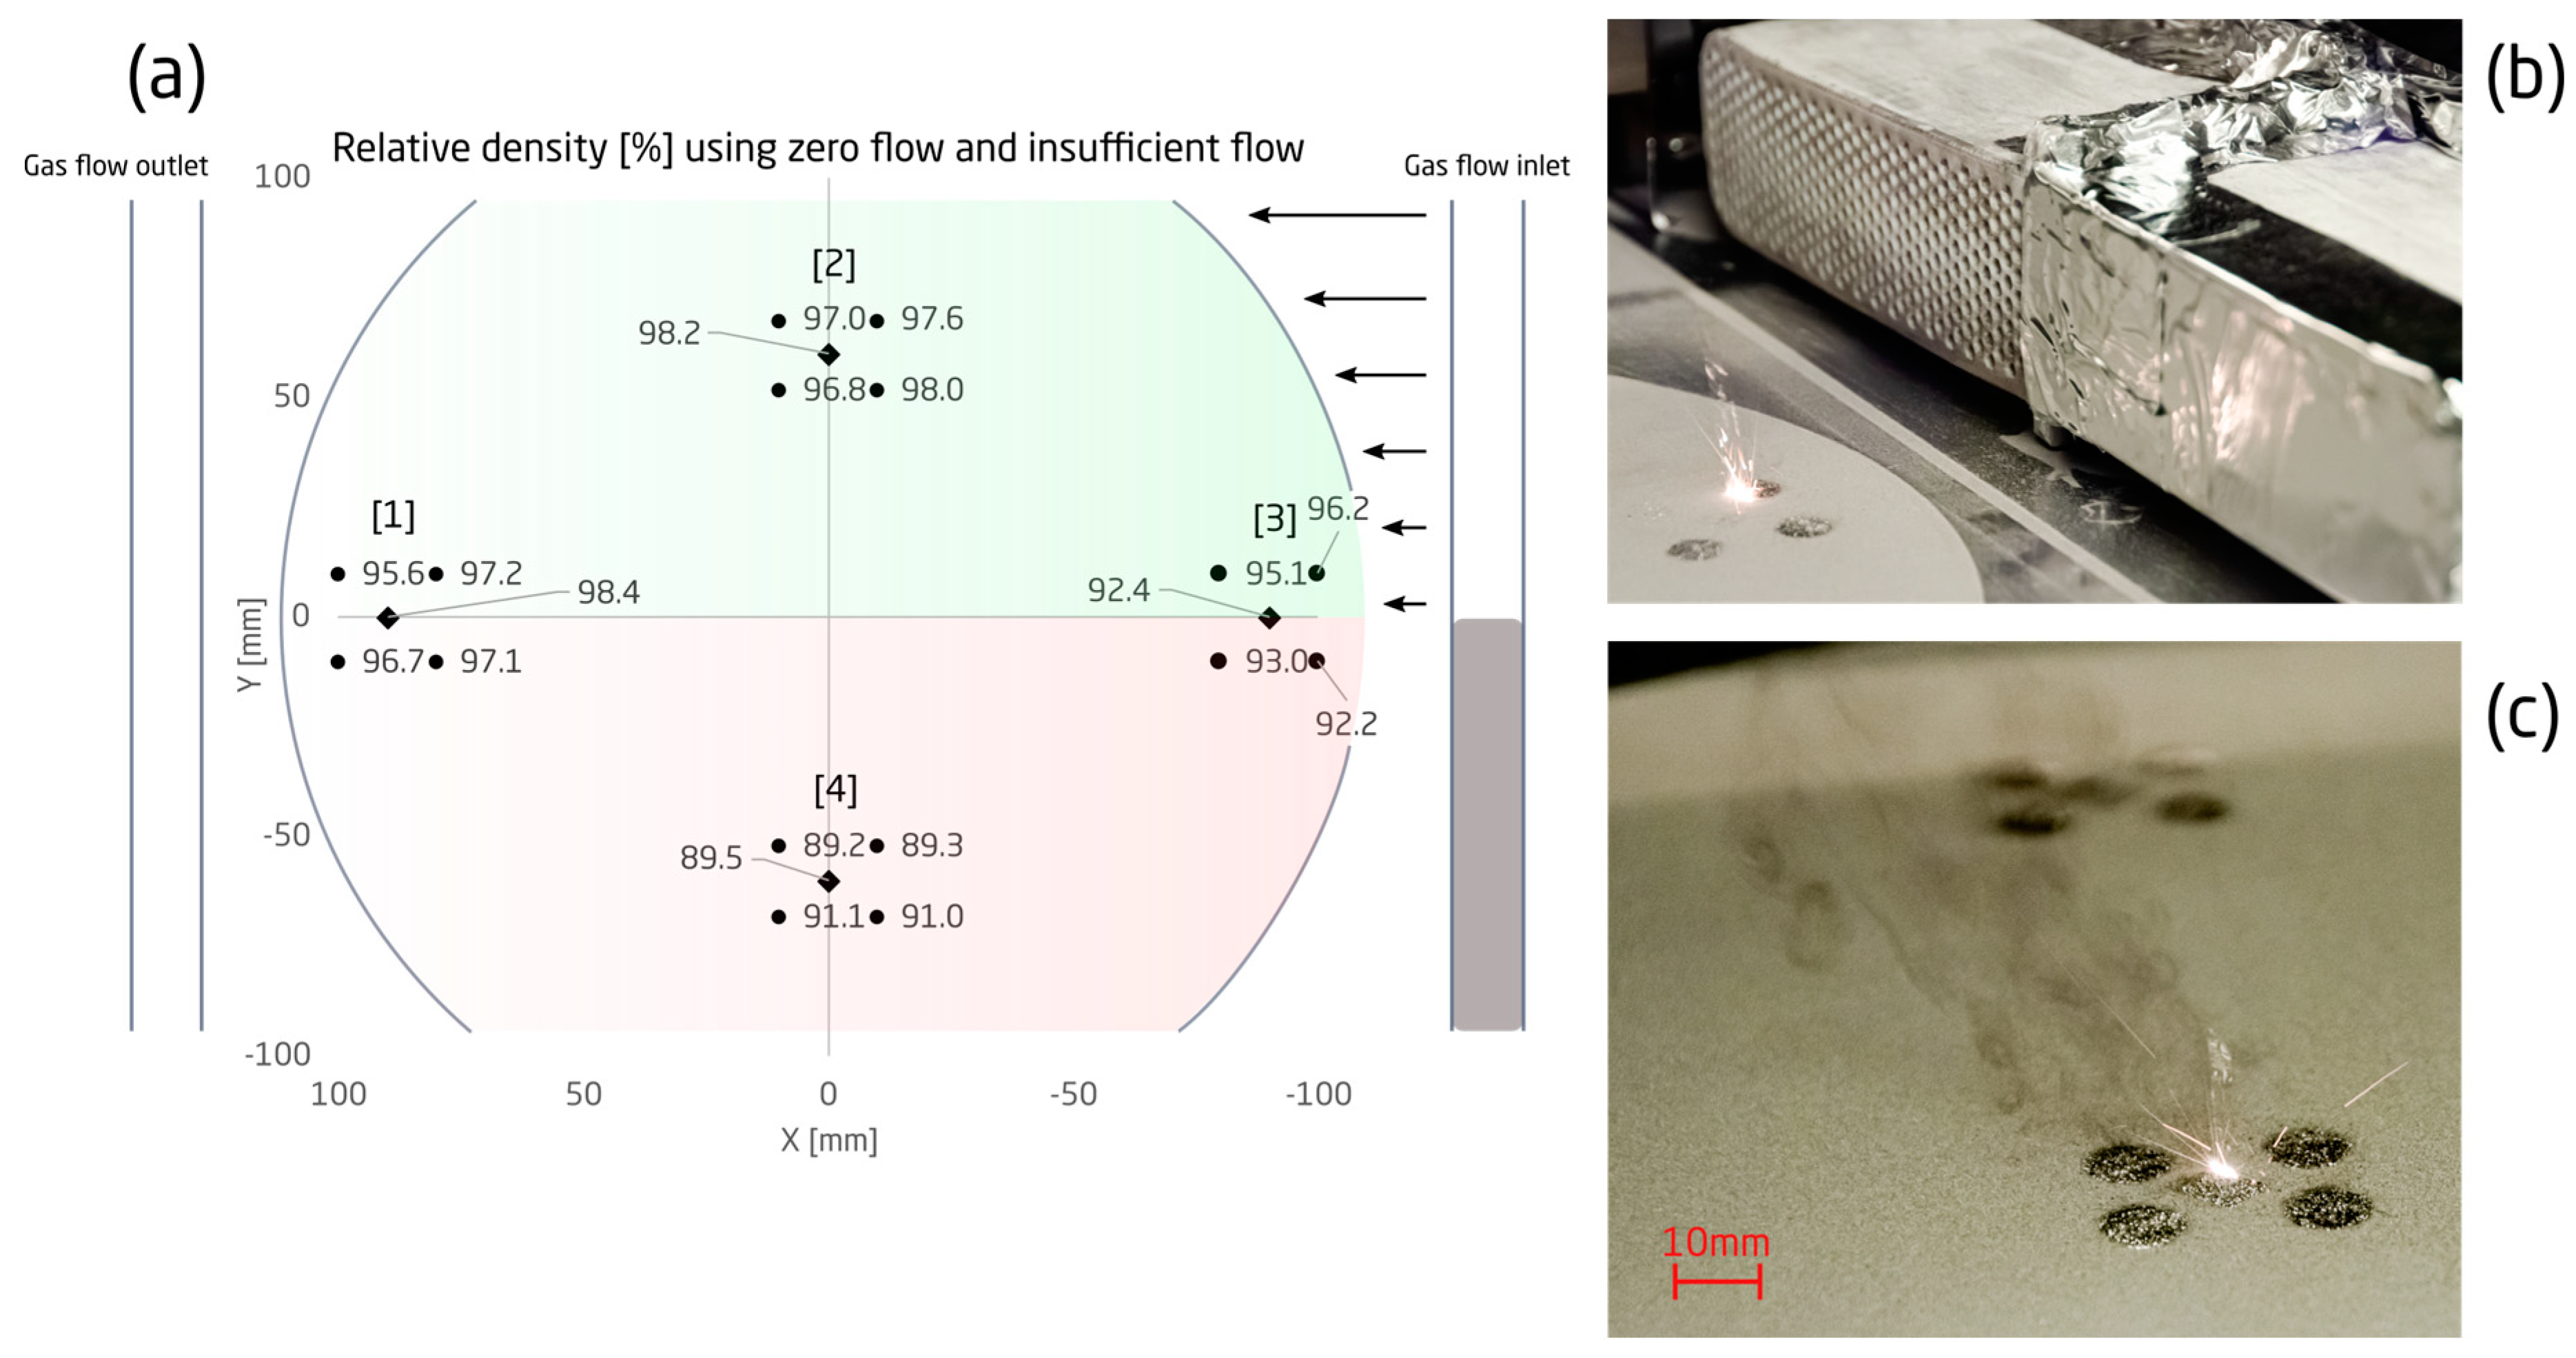
3.2.3. No Gas Flow
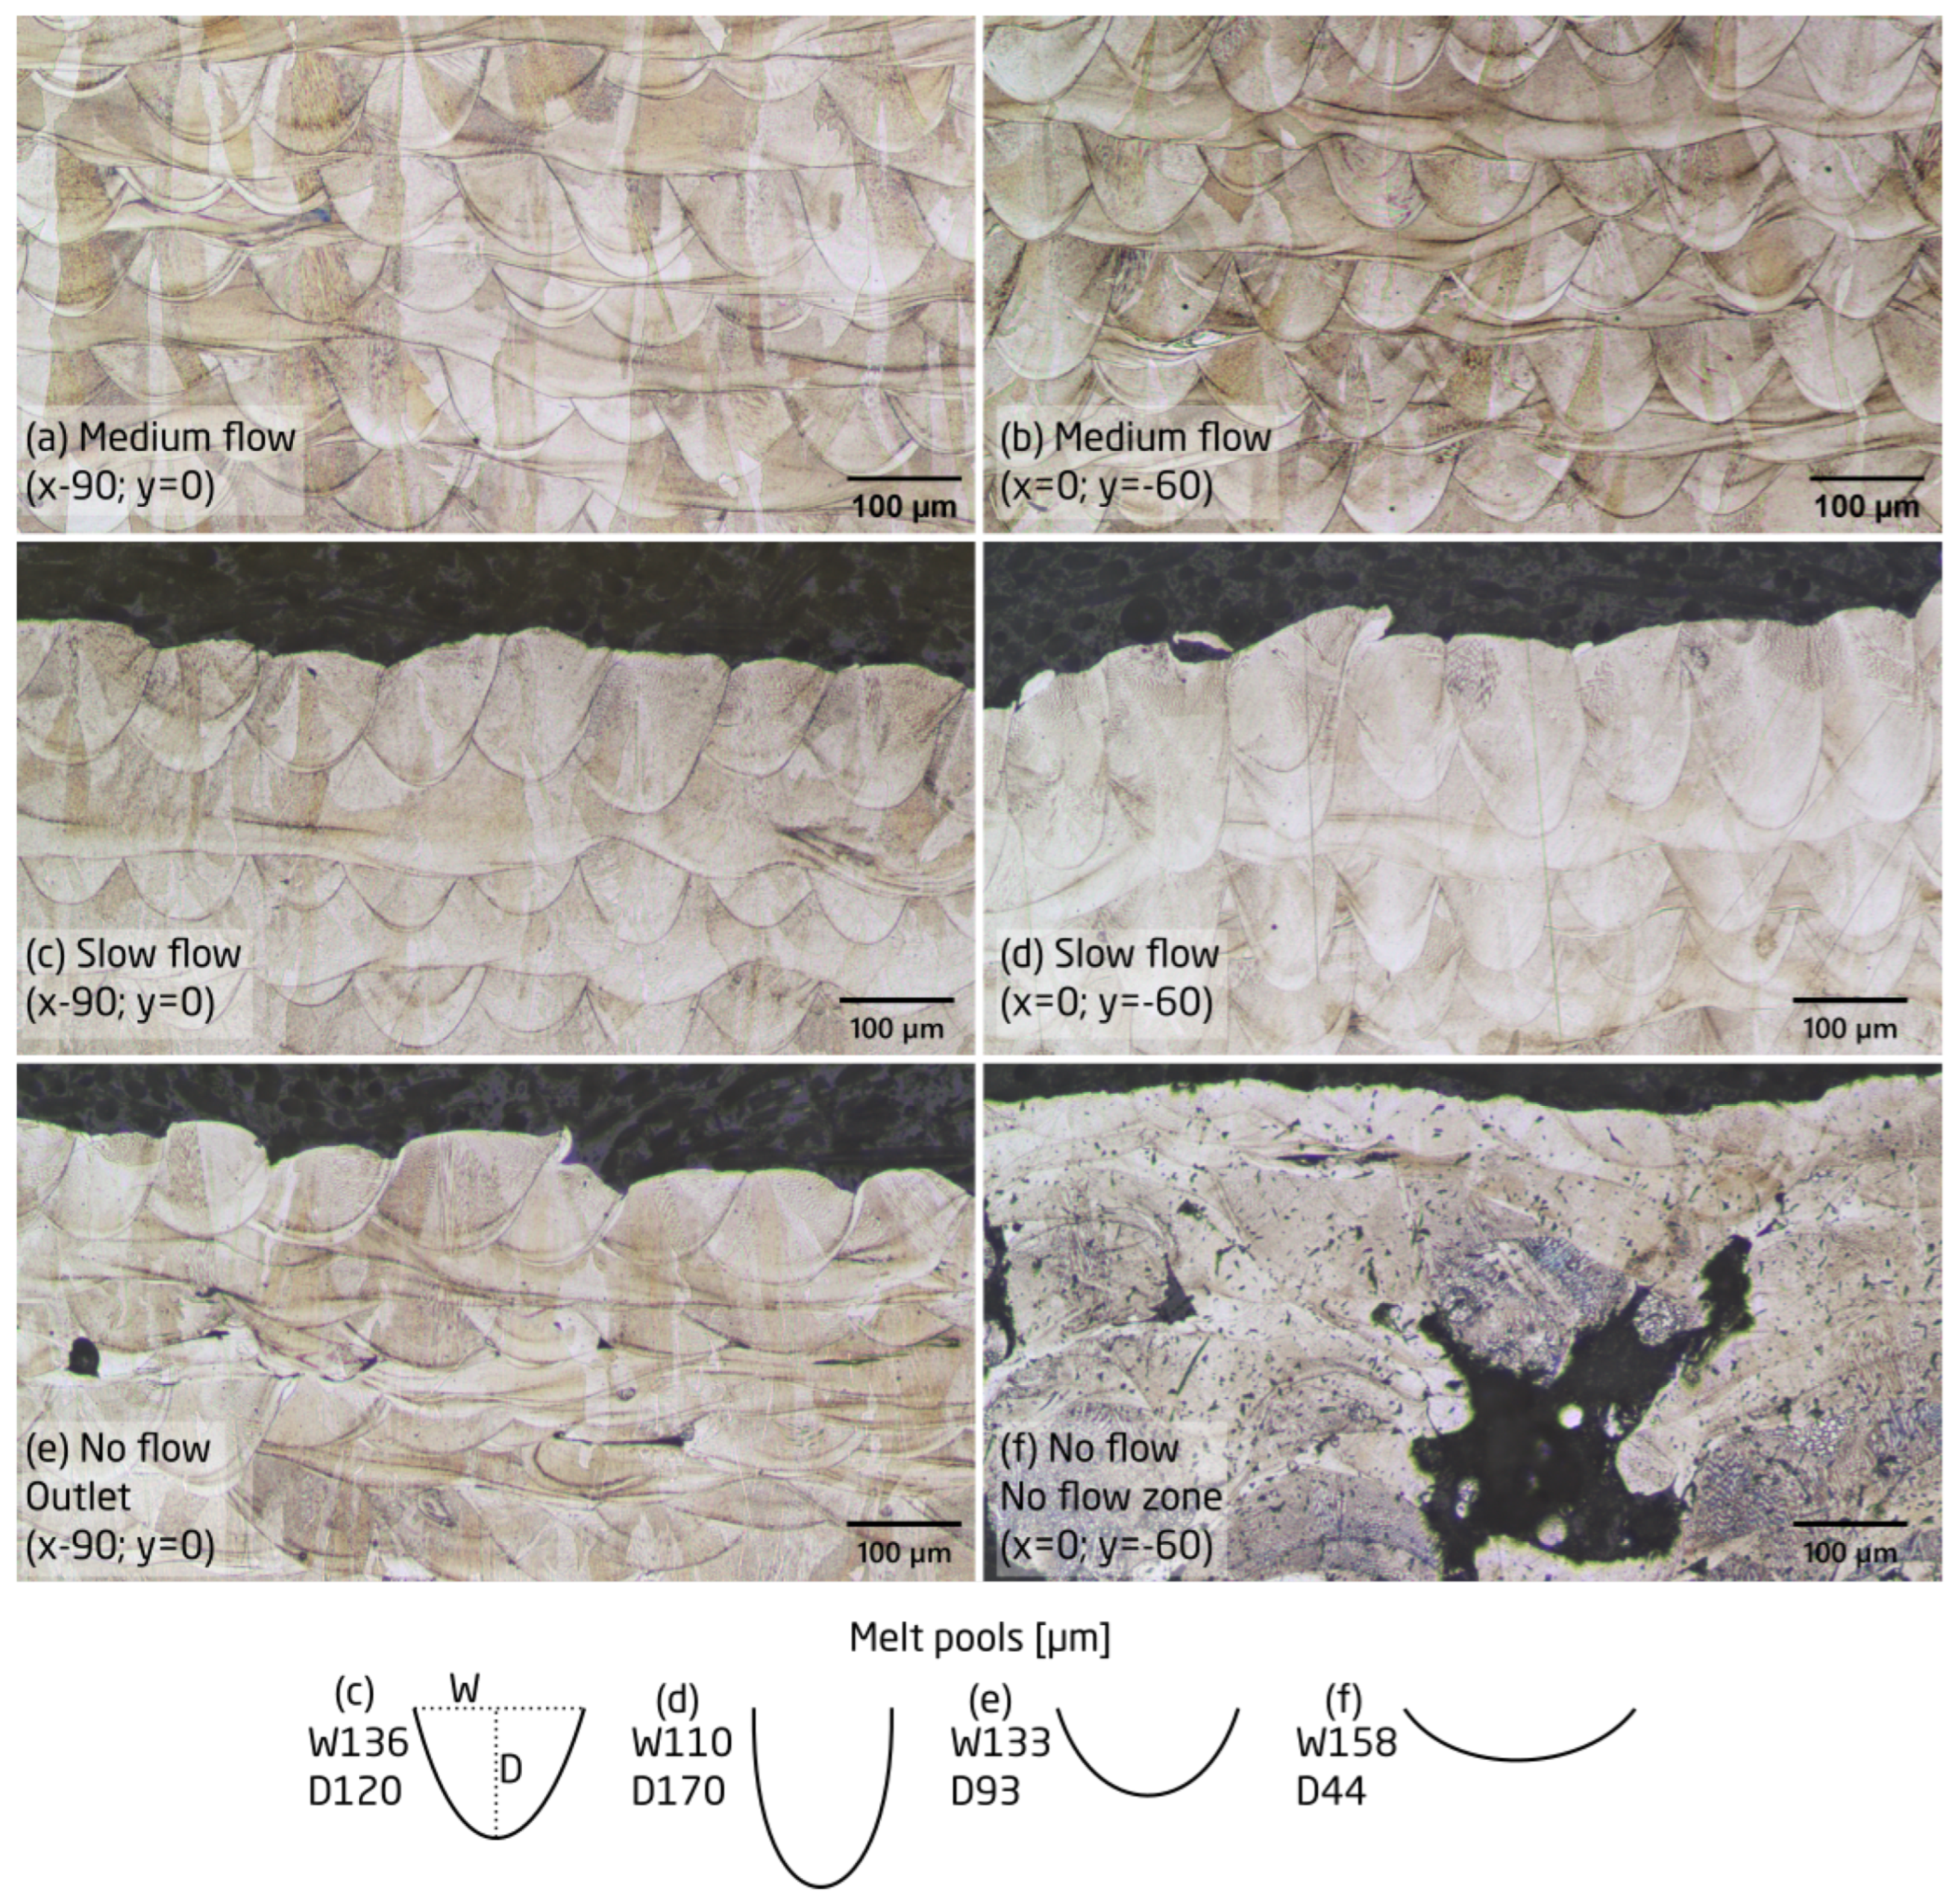
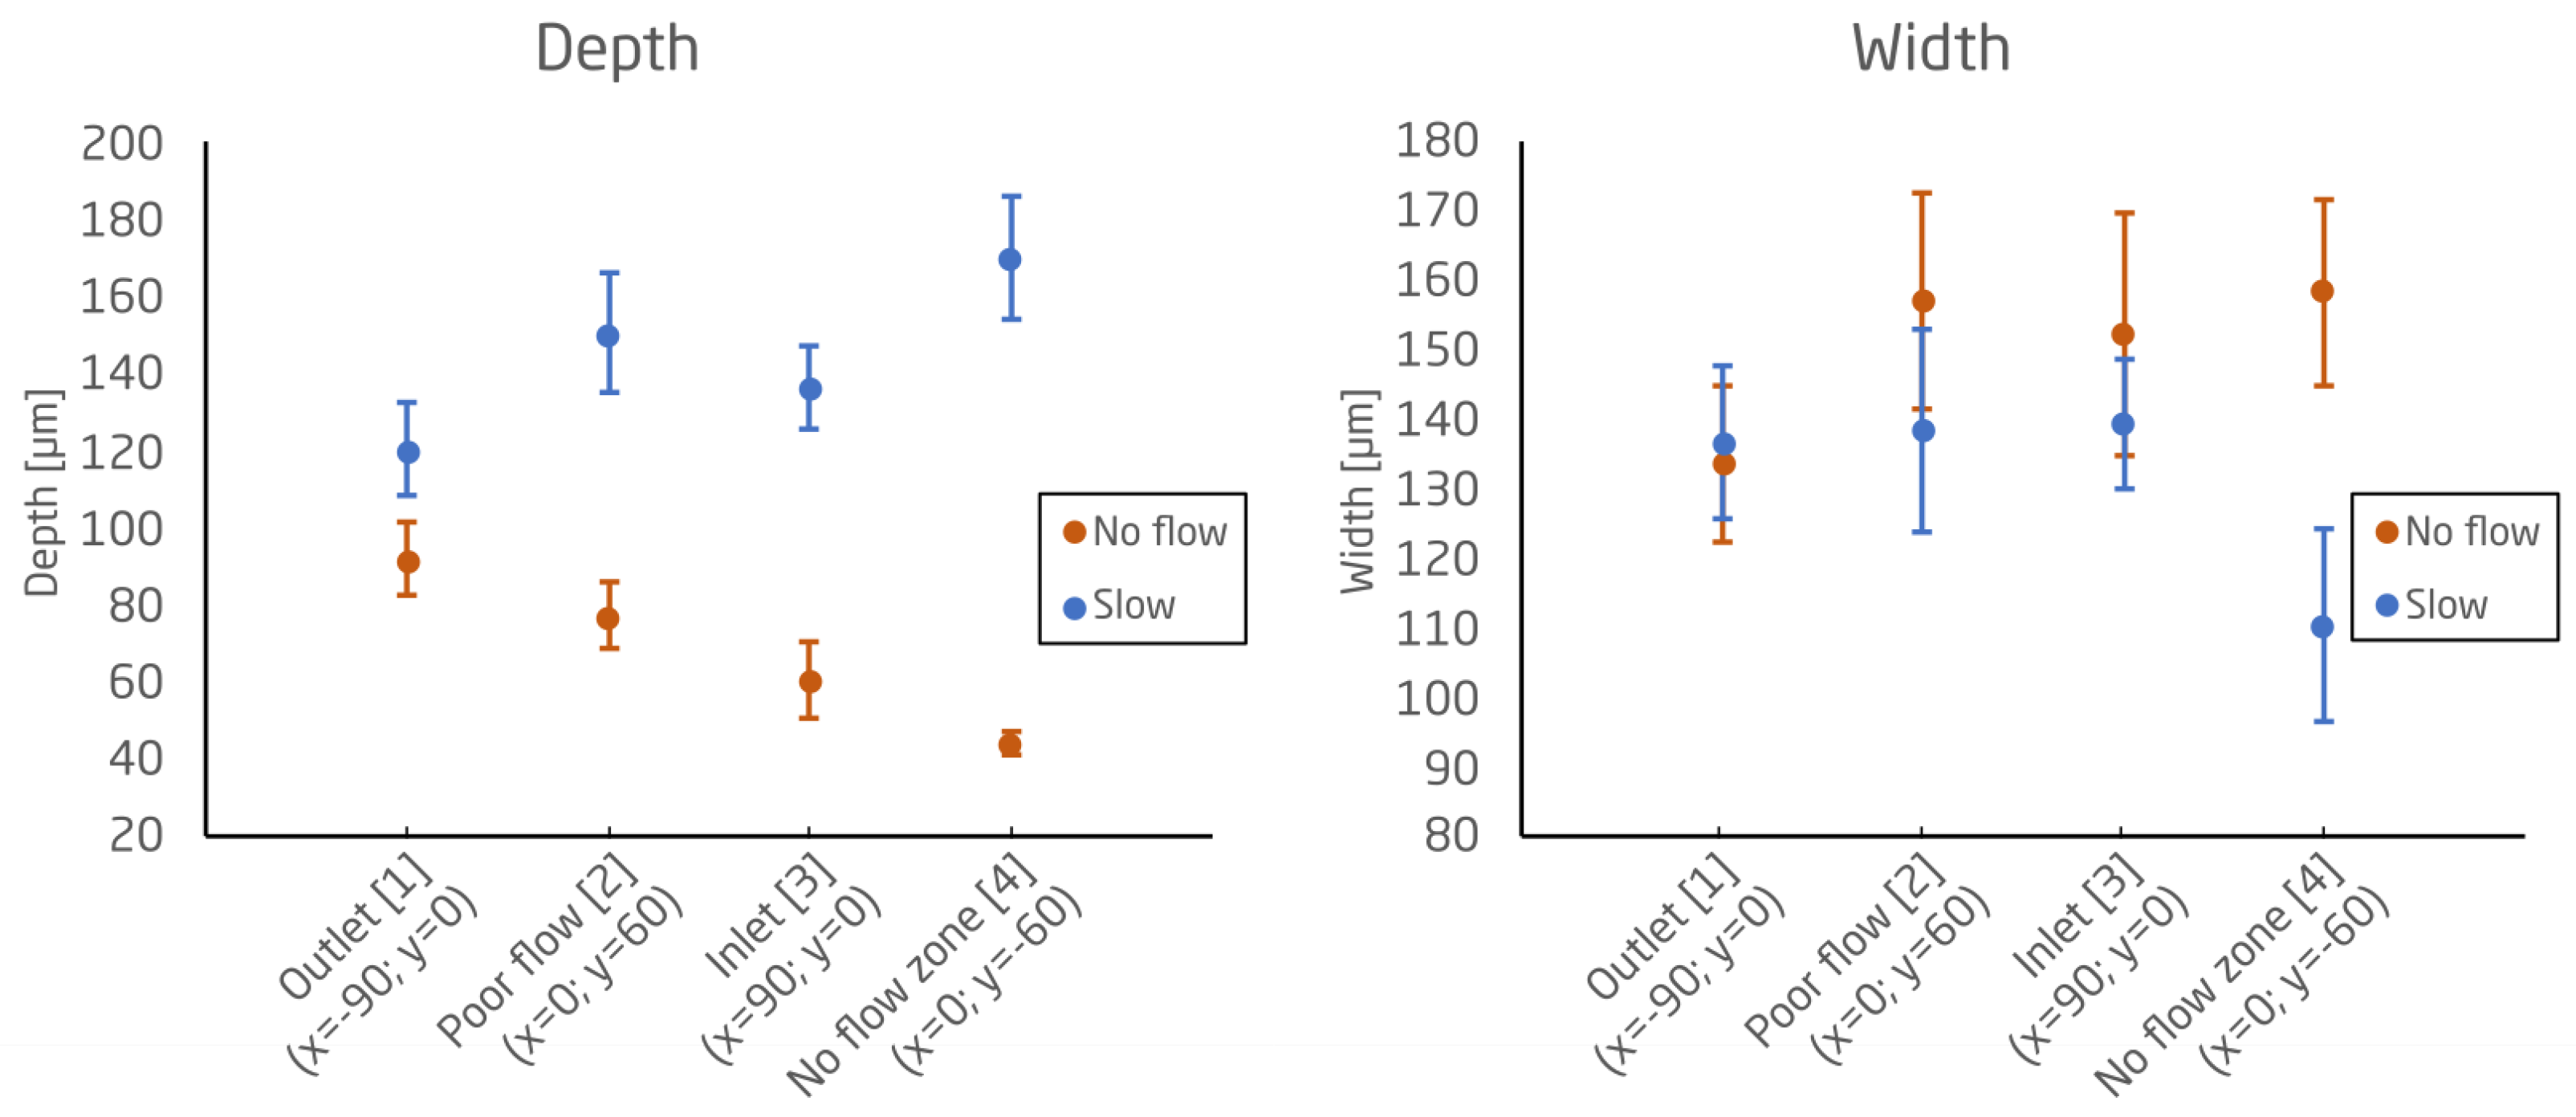
3.3. Melt Pools
3.4. Summary
4. Discussion and Conclusions
- Based on the results, it is recommended to use a shielding cross flow with a minimum average velocity at the build plate of 1 m/s under the assumption of a uniform flow;
- It is recommended to keep the height of the inlet from the bottom surface as low as possible, keeping in mind the distance to the processing area;
Author Contributions
Funding
Data Availability Statement
Acknowledgments
Conflicts of Interest
Abbreviations
| L-PBF | Laser powder bed fusion |
| AM | Additive manufacturing |
| VED | Volumetric energy density |
| NC | Numerical control |
References
- Zhang, Y.; Wu, L.; Guo, X.; Kane, S.; Deng, Y.; Jung, Y.G.; Lee, J.H.; Zhang, J. Additive Manufacturing of Metallic Materials: A Review. J. Mater. Eng. Perform. 2018, 27, 1–13. [Google Scholar] [CrossRef] [Green Version]
- Ladani, L.; Sadeghilaridjani, M. Review of Powder Bed Fusion Additive Manufacturing for Metals. Metals 2021, 11, 1391. [Google Scholar] [CrossRef]
- Culmone, C.; Smit, G.; Breedveld, P. Additive manufacturing of medical instruments: A state-of-the-art review. Addit. Manuf. 2019, 27, 461–473. [Google Scholar] [CrossRef]
- Blakey-Milner, B.; Gradl, P.; Snedden, G.; Brooks, M.; Pitot, J.; Lopez, E.; Leary, M.; Berto, F.; du Plessis, A. Metal additive manufacturing in aerospace: A review. Mater. Des. 2021, 209, 110008. [Google Scholar] [CrossRef]
- Wohlers, T.T.; Campbell, I.; Diegel, O.; Huff, R.; Kowen, J. Wohlers Report 2022: 3D Printing and Additive Manufacturing Global State of the Industry; Technical Report; ASTM International: West Conshohocken, PA, USA, 2022. [Google Scholar]
- Scipioni Bertoli, U.; Wolfer, A.J.; Matthews, M.J.; Delplanque, J.P.R.; Schoenung, J.M. On the limitations of Volumetric Energy Density as a design parameter for Selective Laser Melting. Mater. Des. 2017, 113, 331–340. [Google Scholar] [CrossRef] [Green Version]
- Ahmed, N.; Barsoum, I.; Haidemenopoulos, G.; Al-Rub, R.K. Process parameter selection and optimization of laser powder bed fusion for 316L stainless steel: A review. J. Manuf. Process. 2022, 75, 415–434. [Google Scholar] [CrossRef]
- Bidare, P.; Bitharas, I.; Ward, R.M.; Attallah, M.M.; Moore, A.J. Fluid and particle dynamics in laser powder bed fusion. Acta Mater. 2018, 142, 107–120. [Google Scholar] [CrossRef]
- Bitharas, I.; Burton, A.; Ross, A.J.; Moore, A.J. Visualisation and numerical analysis of laser powder bed fusion under cross-flow. Addit. Manuf. 2021, 37, 101690. [Google Scholar] [CrossRef]
- Tenbrock, C.; Kelliger, T.; Praetzsch, N.; Ronge, M.; Jauer, L.; Schleifenbaum, J.H. Effect of laser-plume interaction on part quality in multi-scanner Laser Powder Bed Fusion. Addit. Manuf. 2021, 38, 101810. [Google Scholar] [CrossRef]
- Reijonen, J.; Revuelta, A.; Riipinen, T.; Ruusuvuori, K.; Puukko, P. On the effect of shielding gas flow on porosity and melt pool geometry in laser powder bed fusion additive manufacturing. Addit. Manuf. 2020, 32, 101030. [Google Scholar] [CrossRef]
- Shen, H.; Rometsch, P.; Wu, X.; Huang, A. Influence of Gas Flow Speed on Laser Plume Attenuation and Powder Bed Particle Pickup in Laser Powder Bed Fusion. J. Miner. Met. Mater. Soc. 2020, 72, 1039–1051. [Google Scholar] [CrossRef] [Green Version]
- Ion, J.C. Laser Processing of Engineering Materials: Principles, Procedure and Industrial Application; Elsevier: Boca Raton, FL, USA, 2005; pp. 1–556. [Google Scholar]
- Wang, D.; Wu, S.; Fu, F.; Mai, S.; Yang, Y.; Liu, Y.; Song, C. Mechanisms and characteristics of spatter generation in SLM processing and its effect on the properties. Mater. Des. 2017, 117, 121–130. [Google Scholar] [CrossRef]
- Ladewig, A.; Schlick, G.; Fisser, M.; Schulze, V.; Glatzel, U. Influence of the shielding gas flow on the removal of process by-products in the selective laser melting process. Addit. Manuf. 2016, 10, 1–9. [Google Scholar] [CrossRef]
- Taylor, H.C.; Wicker, R.B. Impacts of microsecond control in laser powder bed fusion processing. Addit. Manuf. 2022, 60, 103239. [Google Scholar] [CrossRef]
- Stokes, M.A.; Khairallah, S.A.; Volkov, A.N.; Rubenchik, A.M. Fundamental physics effects of background gas species and pressure on vapor plume structure and spatter entrainment in laser melting. Addit. Manuf. 2022, 55, 102819. [Google Scholar] [CrossRef]
- Ghasemi-Tabasi, H.; Jhabvala, J.; Boillat, E.; Ivas, T.; Drissi-Daoudi, R.; Logé, R.E. An effective rule for translating optimal selective laser melting processing parameters from one material to another. Addit. Manuf. 2020, 36, 101496. [Google Scholar] [CrossRef]
- Weaver, J.S.; Schlenoff, A.; Deisenroth, D.C.; Moylan, S.P. Inert Gas Flow Speed Measurements in Laser Powder Bed Fusion Additive Manufacturing; NIST Advanced Manufacturing Series 100-43; National Institute of Standards and Technology: Gaithersburg, MD, USA, 2021. [Google Scholar] [CrossRef]
- Zhang, X.; Cheng, B.; Tuffile, C. Simulation study of the spatter removal process and optimization design of gas flow system in laser powder bed fusion. Addit. Manuf. 2020, 32, 101049. [Google Scholar] [CrossRef]
- Cattafesta, L.; Bahr, C.; Mathew, J. Fundamentals of Wind-Tunnel Design. In Encyclopedia of Aerospace Engineering; Wiley Online Library: Hoboken, NJ, USA, 2010. [Google Scholar] [CrossRef]
- Elkins, C.; Mireles, J.; Estrada, H.; Morgan, D.; Taylor, H.; Wicker, R. Resolving the Three-Dimensional Flow Field within Commercial Metal Additive Manufacturing Machines: Application of Experimental Magnetic Resonance Velocimetry. Addit. Manuf. 2023, 75, 103651. [Google Scholar] [CrossRef]
- Yang, Y.; Chen, Z.; Liu, Z.; Wang, H.; Zhang, Y.; Wang, D. Influence of shielding gas flow consistency on parts quality consistency during large-scale laser powder bed fusion. Opt. Laser Technol. 2023, 158, 108899. [Google Scholar] [CrossRef]
- Schniedenharn, M.; Wiedemann, F.; Schleifenbaum, J.H. Visualization of the shielding gas flow in SLM machines by space-resolved thermal anemometry. Rapid Prototyp. J. 2018, 24, 1296–1304. [Google Scholar] [CrossRef]
- Philo, A.M.; Sutcliffe, C.J.; Sillars, S.; Sienz, J.; Brown, S.G.; Lavery, N.P. A study into the effects of gas flow inlet design of the Renishaw AM250 laser powder bed fusion machine using computational modelling. In Proceedings of the 28th Annual International Solid Freeform Fabrication Symposium—An Additive Manufacturing Conference, SFF 2017, Austin, TX, USA, 7–9 August 2017; pp. 1203–1219. [Google Scholar]
- Kjer, M.B.; Zwicker, R.L.; Nadimpali, V.; Pedersen, D.B. Experimental Analysis and Optimization of Gas Flow in an Open-Architecture Metal L-PBF System. In Proceedings of the 33rd Annual International Solid Freeform Fabrication (SFF) Symposium, Austin, TX, USA, 25–27 July 2022; Volume 33, pp. 1321–1330. [Google Scholar]


| Job | Scan Velocity | Laser Power | Hatch Spacing | Layer Thickness | VED |
|---|---|---|---|---|---|
| Cubes | 600 mm/s | 250 W | 90 µm | 50 µm | 92.6 Jmm |
| Cylinders | 650 mm/s | 250 W | 100 µm | 50 µm | 76.9 Jmm |
Disclaimer/Publisher’s Note: The statements, opinions and data contained in all publications are solely those of the individual author(s) and contributor(s) and not of MDPI and/or the editor(s). MDPI and/or the editor(s) disclaim responsibility for any injury to people or property resulting from any ideas, methods, instructions or products referred to in the content. |
© 2023 by the authors. Licensee MDPI, Basel, Switzerland. This article is an open access article distributed under the terms and conditions of the Creative Commons Attribution (CC BY) license (https://creativecommons.org/licenses/by/4.0/).
Share and Cite
Kjer, M.B.; Pan, Z.; Nadimpalli, V.K.; Pedersen, D.B. Experimental Analysis and Spatial Component Impact of the Inert Cross Flow in Open-Architecture Laser Powder Bed Fusion. J. Manuf. Mater. Process. 2023, 7, 143. https://doi.org/10.3390/jmmp7040143
Kjer MB, Pan Z, Nadimpalli VK, Pedersen DB. Experimental Analysis and Spatial Component Impact of the Inert Cross Flow in Open-Architecture Laser Powder Bed Fusion. Journal of Manufacturing and Materials Processing. 2023; 7(4):143. https://doi.org/10.3390/jmmp7040143
Chicago/Turabian StyleKjer, Magnus Bolt, Zhihao Pan, Venkata Karthik Nadimpalli, and David Bue Pedersen. 2023. "Experimental Analysis and Spatial Component Impact of the Inert Cross Flow in Open-Architecture Laser Powder Bed Fusion" Journal of Manufacturing and Materials Processing 7, no. 4: 143. https://doi.org/10.3390/jmmp7040143