Article

Mesoscale Simulation of Laser Powder Bed Fusion with an Increased Layer Thickness for AlSi10Mg Alloy

1
Kintech Lab Ltd., 3rd Khoroshevskaya St. 12, 123298 Moscow, Russia
2
Catalysis Lab, National University of Science and Technology MISIS, Leninskiy Prospekt 4, 119049 Moscow, Russia
3
Center for Materials Technologies, Skolkovo Institute of Science and Technology, Bolshoy Boulevard 30 Bld. 1, 121205 Moscow, Russia
*
Author to whom correspondence should be addressed.
J. Manuf. Mater. Process. 2024, 8(1), 7; https://doi.org/10.3390/jmmp8010007
Submission received: 15 November 2023 / Revised: 5 December 2023 / Accepted: 8 December 2023 / Published: 1 January 2024

Abstract

:
Low performance is considered one of the main drawbacks of laser powder bed fusion (LPBF) technology. In the present work, the effect of the AlSi10Mg powder layer thickness on the laser melting process was investigated to improve the LPBF building rate. A high-fidelity simulation of the melt pool formation was performed for different thicknesses of the powder bed using the Kintech Simulation Software for Additive Manufacturing (KiSSAM, version cd8e01d) developed by the authors. The powder bed after the recoating operation was obtained by the discrete element method. The laser energy deposition on the powder particles and the substrate was simulated by ray tracing. For the validation of the model, an experimental analysis of single tracks was performed on two types of substrates. The first substrate was manufactured directly with LPBF technology, while the second was cast. The simulation was carried out for various combinations of process parameters, predominantly with a high energy input, which provided a sufficient remelting depth. The calculations revealed the unstable keyhole mode appearance associated with the low absorptivity of the aluminum alloy at a scanning speed of 300 mm/s for all levels of the laser power (325–375 W). The results allowed formulating the criteria for the lack of fusion emerging during LPBF with an increased layer thickness. This work is expected to provide a scientific basis for the analysis of the maximum layer thickness via simulation to increase the performance of the technology.

1. Introduction

In recent decades, the Additive Manufacturing (AM) concept has received increased attention and is being actively studied due to the new capabilities in manufacturing parts with complex geometries from different materials [1,2]. Among the various AM techniques for the production of metal parts, laser powder bed fusion (LPBF) is an established process with one of the highest levels of technology readiness [3]. Thus, LPBF has a broad range of applications, and it is replacing conventional manufacturing technologies in industries such as aerospace [4], biomedicine [5], automotive [6], etc.
LPBF is an AM technology that uses a spherical metal powder as a raw material. During the process, the powder is deposited on a base plate by a recoater blade, forming a dense and homogeneous powder layer. The laser beam scans the powder bed and melts the material according to a predefined strategy. After the solidification of the metal, the base plate is lowered by a platform step h, and the powder deposition procedure is executed once more. Previously melted areas serve as the substrate for the newly formed layers. In this manner, the process is repeated until the entire part is manufactured.
LPBF technology allows obtaining parts with a feature size of 150 µm [7], indicating a high resolution. However, this advantage simultaneously results in the lowest building rate among metal AM technologies [4]. The aforementioned limiting factor constrains the efficient utilization of LPBF; therefore, many approaches have been considered to increase the building rate. Among the known solutions, the installation of additional lasers on LPBF machines has been proposed [8]. Another approach involves increasing the nominal laser power to provide higher energy input to melt more powder per single scan [9]. However, such modifications have led to a significant increase in the equipment costs and could be economically inefficient. Another possibility to improve the building rate can be implemented through the increase of the layer thickness by discretizing the part into fewer layers to process. It should be noted that the scanning speed and the hatching distance also affect the building rate; however, the layer thickness is the most influential process parameter. DeSouza et al. achieved a 40% reduction in the manufacturing time, increasing the layer thickness by a factor of 1.6 while maintaining the quality of the part [10]. Nevertheless, without the required optimization of the layer thickness, a lack of fusion defects may appear. Nguyen studied the same influence for Inconel 718 and proved that the lower the layer thickness, the denser and higher dimensional accuracy was achieved [11] (20, 30, 40, and 50 µm). Gullane [12] conducted experiments with multiple layer thicknesses (30, 60, 90 µm) within one part made of Ti6Al4V and studied the effect on the mechanical properties. The results showed that such fabrication is possible, but interfacial porosity needs to be decreased to minimize the penalty on mechanical performance.
However, experimental studies on the layer thickness effect comprise the most costly procedure because the trial for each level of the layer thickness requires an additional launch of the machine. In this regard, in many works, only the main process conditions have been experimentally studied, including the laser power, scanning speed, and hatch distance [9,13,14,15,16]. Only a few works have described the variation in the layer thickness, yet the number of levels has been limited [17,18,19]. The results of single track analysis obtained on a solid substrate cannot be utilized for a higher layer thickness. The scanning of a powder layer significantly differs since the heat transfer in the powder depends on the particle size distribution, the particles’ shapes, and the uniformity of the powder spread. On the other side, single track experiments on a powder bed are also complicated in terms of the layer thickness consistency [20]. If more configuration parameters are included, such as the beam shape and size, the granulometric composition of the powder, the delay time between adjacent tracks, the preheating of the substrate, etc., the cost of the trials increases drastically. Mesoscale simulation of the melt pool, which necessarily considers the powder layer properties, is a reasonable solution for the described issues. The problem requires taking into account the ray reflectivity between the particles, the spreading process of the powder, and the matching of the granulometric composition. In this regard, all the optimal parameters, including the layer thickness, could be estimated using high-fidelity simulations, which allows conducting significantly fewer trials and is less expensive.
Computer simulation software has become an integral part of LPBF process research and development [21,22,23,24,25]. The codes vary in the level of detail of the described phenomena. Some codes simulate the temperature dynamics in a metal and treat the material as a continuous medium without particles and pores [26]. To study the influence of the powder bed properties, the particles should be resolved with a corresponding mesh size. We have to simulate not only the heat transfer but also the fluid motion, the movement of the fluid surface, and the laser reflections in the geometry. The software used for such tasks include the ALE3D software [27] (based on the arbitrary Lagrangian Eulerian method), the CFD-ACE+ code by ESI Group [28], Flow3D [29], ANSYS [30] (finite-element CFD method), and OpenFOAM [31] (finite-volume CFD method), etc.
In the present work, we addressed the problem of the melt pool simulation during laser powder bed fusion to increase the layer thickness. The results of the study will allow for improvement in the building rate of AlSi10Mg parts via LPBF, providing the fundamentals for new industrial applications. All the Al-based alloys have a relatively low laser absorption coefficient (0.1 for solid state), which distinguishes these materials in the analysis of laser–matter interaction. AlSi10Mg is the mostly applicable Al alloy with a low melting point and eutectic composition, which enables easy processing by the laser-based systems [9,13,14,16,17,18,19,32] and exhibits good weldability and hardenability while maintaining good corrosion resistance and high thermal conductivity. However, to our best knowledge, no work has been reported on LPBF simulation with an increased powder layer thickness for AlSi10Mg.

2. Materials and Methods

2.1. Numerical Model and KiSSAM Software

In the present study, the fluid dynamics of the melted metal is modeled using the lattice Boltzmann method (LBM) [33] coupled with the volume of fluid (VoF) approach [34,35] for the simulation of a fluid–gas interface and the final geometry of the solidified melt. The basis of the simulation procedure evolved from the methods described in works [36,37,38]. The model is implemented in the KiSSAM software (Kintech Simulation Software for Additive Manufacturing). The major difference between the code from a similar state-of-the-art software is the high-performance GPU-based implementation that was introduced in the previous work [39]. KiSSAM software introduces several features including dynamic grids, bicomponent evaporation, import of scanning vectors’ coordinates directly from the LPBF installation, etc.
The simulation domain is discretized on three dynamic meshes: a fine and uniform melt pool mesh fitted around a liquid metal, a sparse mesh to store the geometry of the whole sample, and an adaptive grid to store the temperature data for the whole sample. In the melt pool mesh, the cells are classified as solid, fluid, void (no material), or interface (fluid cells adjacent to void cells). In fluid cells, LBM equations are solved for fluid dynamics. In fluid and solid cells, LBM is used for the heat conduction problem. Phase changes in the material (melting and solidification) are tracked by calculating temperature fields. Surface tension, wetting and Marangoni convection are taken into account as boundary conditions for interface cells. The evaporation solver is based on the works of Knight and Klassen [40,41]. The implemented approach allows for calculating the recoil pressure and estimating the energy and mass losses during the evaporation in the melt pool. The energy source from the laser beam is modeled with ray tracing while considering multiple reflections and energy absorption.
The simulation results as well as the initial geometry, which includes the powder layer and substrate, are stored in the VDB format [42]. For initialization of the simulation, a VDB file can be generated with external software or with special tools included in KiSSAM. One of these tools is the powder deposition solver (PowDEM [43]), which is used in the present work. PowDEM is based on the discrete element method (DEM) which is known to be a high-fidelity approach to accurately describe the spreading of the powder for the PBF simulations with the possibility to predict the powder layer characteristics [29,44,45,46]. Following the main fluid dynamic solver architecture, PowDEM also has a high-performance GPU implementation proposed in the work [47]. The powder particles are modeled as spheres, since the LPBF process requires high sphericity of the powder to guarantee flowability and dense packing. The size distribution is taken from experimental data, and the spheres are deposited on the surface by the free fall approach. The surface can be taken as a flat or triangulated isosurface of the material filling fraction data on a mesh in the VDB file from the previous simulation. The recoating blade movement pattern is executed, and after reaching the state of relaxation, the powder parameters are written into a file. The result of the PowDEM simulation is a list of spheres’ coordinates and sizes in text format. These data can be converted to the mesh in the VDB format with the required resolution, which is used in the melt pool simulation.
To summarize, KiSSAM provides a high-fidelity 3D model that takes into account all the main phenomena, which affects the geometry of the solidified melt. The most important features are high performance and low storage requirements for multi-scale 3D simulation. In this regard, a vast number of simulations (or even volumetric LPBF consolidation) can be performed, stored for future queries, and analyzed for the construction of processing maps with high resolution. For a broad description of the KiSSAM and its predecessor FaSTLab, we refer to the papers [43,48] and [39,49] respectively.

2.2. Experimental Procedure

For the experimental procedure, the AlSi10Mg powder purchased from RUSAL Co., (Moscow, Russia) was used as a raw material. The powder was manufactured by the Electrode Inert Gas Atomization (EIGA) technique, ensuring the high sphericity of particles. The morphology of the particles demonstrated in Figure 1 was studied with Scanning Electron Microscopy (SEM) using Vega 3 (Tescan, Czech Republic, Brno). The initial powder had the following chemical composition: Al 88.5 wt%, Si 10.8 wt%, Mg 0.3 wt%, Cu 0.1 wt%, Fe 0.2 wt%, and less than 0.1% of other impurities. The granulometric analysis was performed with the laser particle sizer Analysette 22 (Fritsch, Germany, Idar-Oberstein). The Particles Size Distribution (PSD) is unimodal (Figure 1) with the percentiles of equivalent diameters: d 10 = 24.3 µm, d 50 = 39.1 µm, and d 90 = 61.7 µm.
For validation of the numerical model, single-track experiments were performed on two types of substrates. The first substrate was cut in the form of a 21 × 7 × 3 mm plate from a part obtained by conventional gravity casting. The obtained substrate had the following chemical composition: Al 88.6 wt%, Si 10.8 wt%, Mg 0.3 wt%, Cu 0.1 wt%, Fe 0.1 wt%, and less than 0.1% of other impurities. The second substrate was manufactured by the LPBF technique from the powder and had the same dimensions. The main technological parameters used for the LPBF process are presented in Table 1. The LPBF process parameters’ window was chosen based on the previous study [13]. Both types of plates were ground on the upper side to guarantee the same surface condition.
The LPBF procedure was performed on the AddSol D50 (Additive Solutions, Russia, Moscow) installation. The machine is equipped with a YLR-400-WC (IPG Photonics, Russia, Fryazino) ytterbium fiber laser. The laser has a spot size of 80 μ m, a nominal laser power of 400 W, and a wavelength of 1070 µm. The process was carried out in the argon atmosphere with a purity of 99.999 % . The oxygen content (see Table 1) was controlled by a built-in lambda sensor. The slicing procedure was performed in Gliser software (version 2.0.1, Additive Technology Software Solution, Russia, Moscow) [50].
For further analysis, the substrates were cut on an electrical discharge machine (EDM) GX-320L (CHMER, Taiwan, Taichung) perpendicularly to the laser movement directions in 3 places. All samples were mounted into resin, ground, and polished using TechPress and MetPrep (Allied, USA, CA, Compton) equipment, respectively. To reveal the melt pool boundaries, samples were etched with Keller’s reagent (1% HF, 1.5% HCl, 2.5% HNO 3 , 95% distilled H 2 O). The remelting depth and width were obtained by optical microscopy (OM) utilizing Axioscope A1 (Zeiss, Germany, Oberkochen) of the melt pool.

2.3. Simulation Setup and Thermophysical Properties

The simulation domain was in the 0 < x < 7 mm, 0 < y < 4 mm, and 0 < z < 3.5 mm coordinate range. At the initial stage, a volume of 0 < z < 3 mm represented the substrate. Following the laser specification (Section 2.2), the energy source was represented by a laser beam yielding a Gaussian power density distribution with a spot of D 4 σ = 80 µm. The start of the laser influence corresponded to a position with coordinates x 0 = 1 mm, y 0 = 2 mm, and the destination was at x 1 = 5 mm and y 1 = 2 mm. The beam power P and the scanning speed v were varied in the simulation, according to Table 1.
The finest size of the mesh was set to Δ r = 3 µm for the melt pool domain. The time step for the fluid and temperature dynamics was Δ t = 20 ns.
All simulations were performed on a workstation equipped with a Nvidia RTX 3090 graphics card (24 GB of GPU memory). The simulation time depended on the total time of the scanning ( ( x 1 x 0 ) / v ) and the size of the melt pool, since the mesh size was dynamically resized to fit the liquid. The total simulation time ranged from 80 min ( v = 1200 mm/s, P = 325 W) to 20 h ( v = 300 mm/s, P = 375 W). Code performance for conventional regimes ( v 1000 mm/s, melt pool size of ∼100–200 µm) was 1 h of calculations per 1 ms of the process.
Thermophysical properties of materials reported in the works [32,51,52,53,54] were used to compile the material properties of the AlSi10Mg alloy in the simulation. Paper [51] describes the alloys with the closest composition, namely LM13 and LM25. The adjustment of surface tension, coefficient of absorption, and wetting angles for the melt on a solid substrate and on powder particles were performed. It was found that the modeling result was highly sensitive to the adjustment of surface tension and absorption coefficient; therefore, the values were fitted with the most care. The final values that were used in the simulations reported in the current paper are presented in Table 2.
The saturated vapor pressure P s a t ( T ) is calculated using the Antoine model [55], according to the expression:
P s a t ( T ) [ Pa ] = 10 A B / C + T [ K ] ,
where the coefficients A, B, and C are provided in Table 2 as well.

3. Results

There are two types of calculations in the following section. The first type is the simulation performed on a bare substrate without powder. The obtained results were comprehensively compared to experimental data for model validation. The second type of calculations included single-tracks simulations on a powder bed with a broad variation in layer thickness.

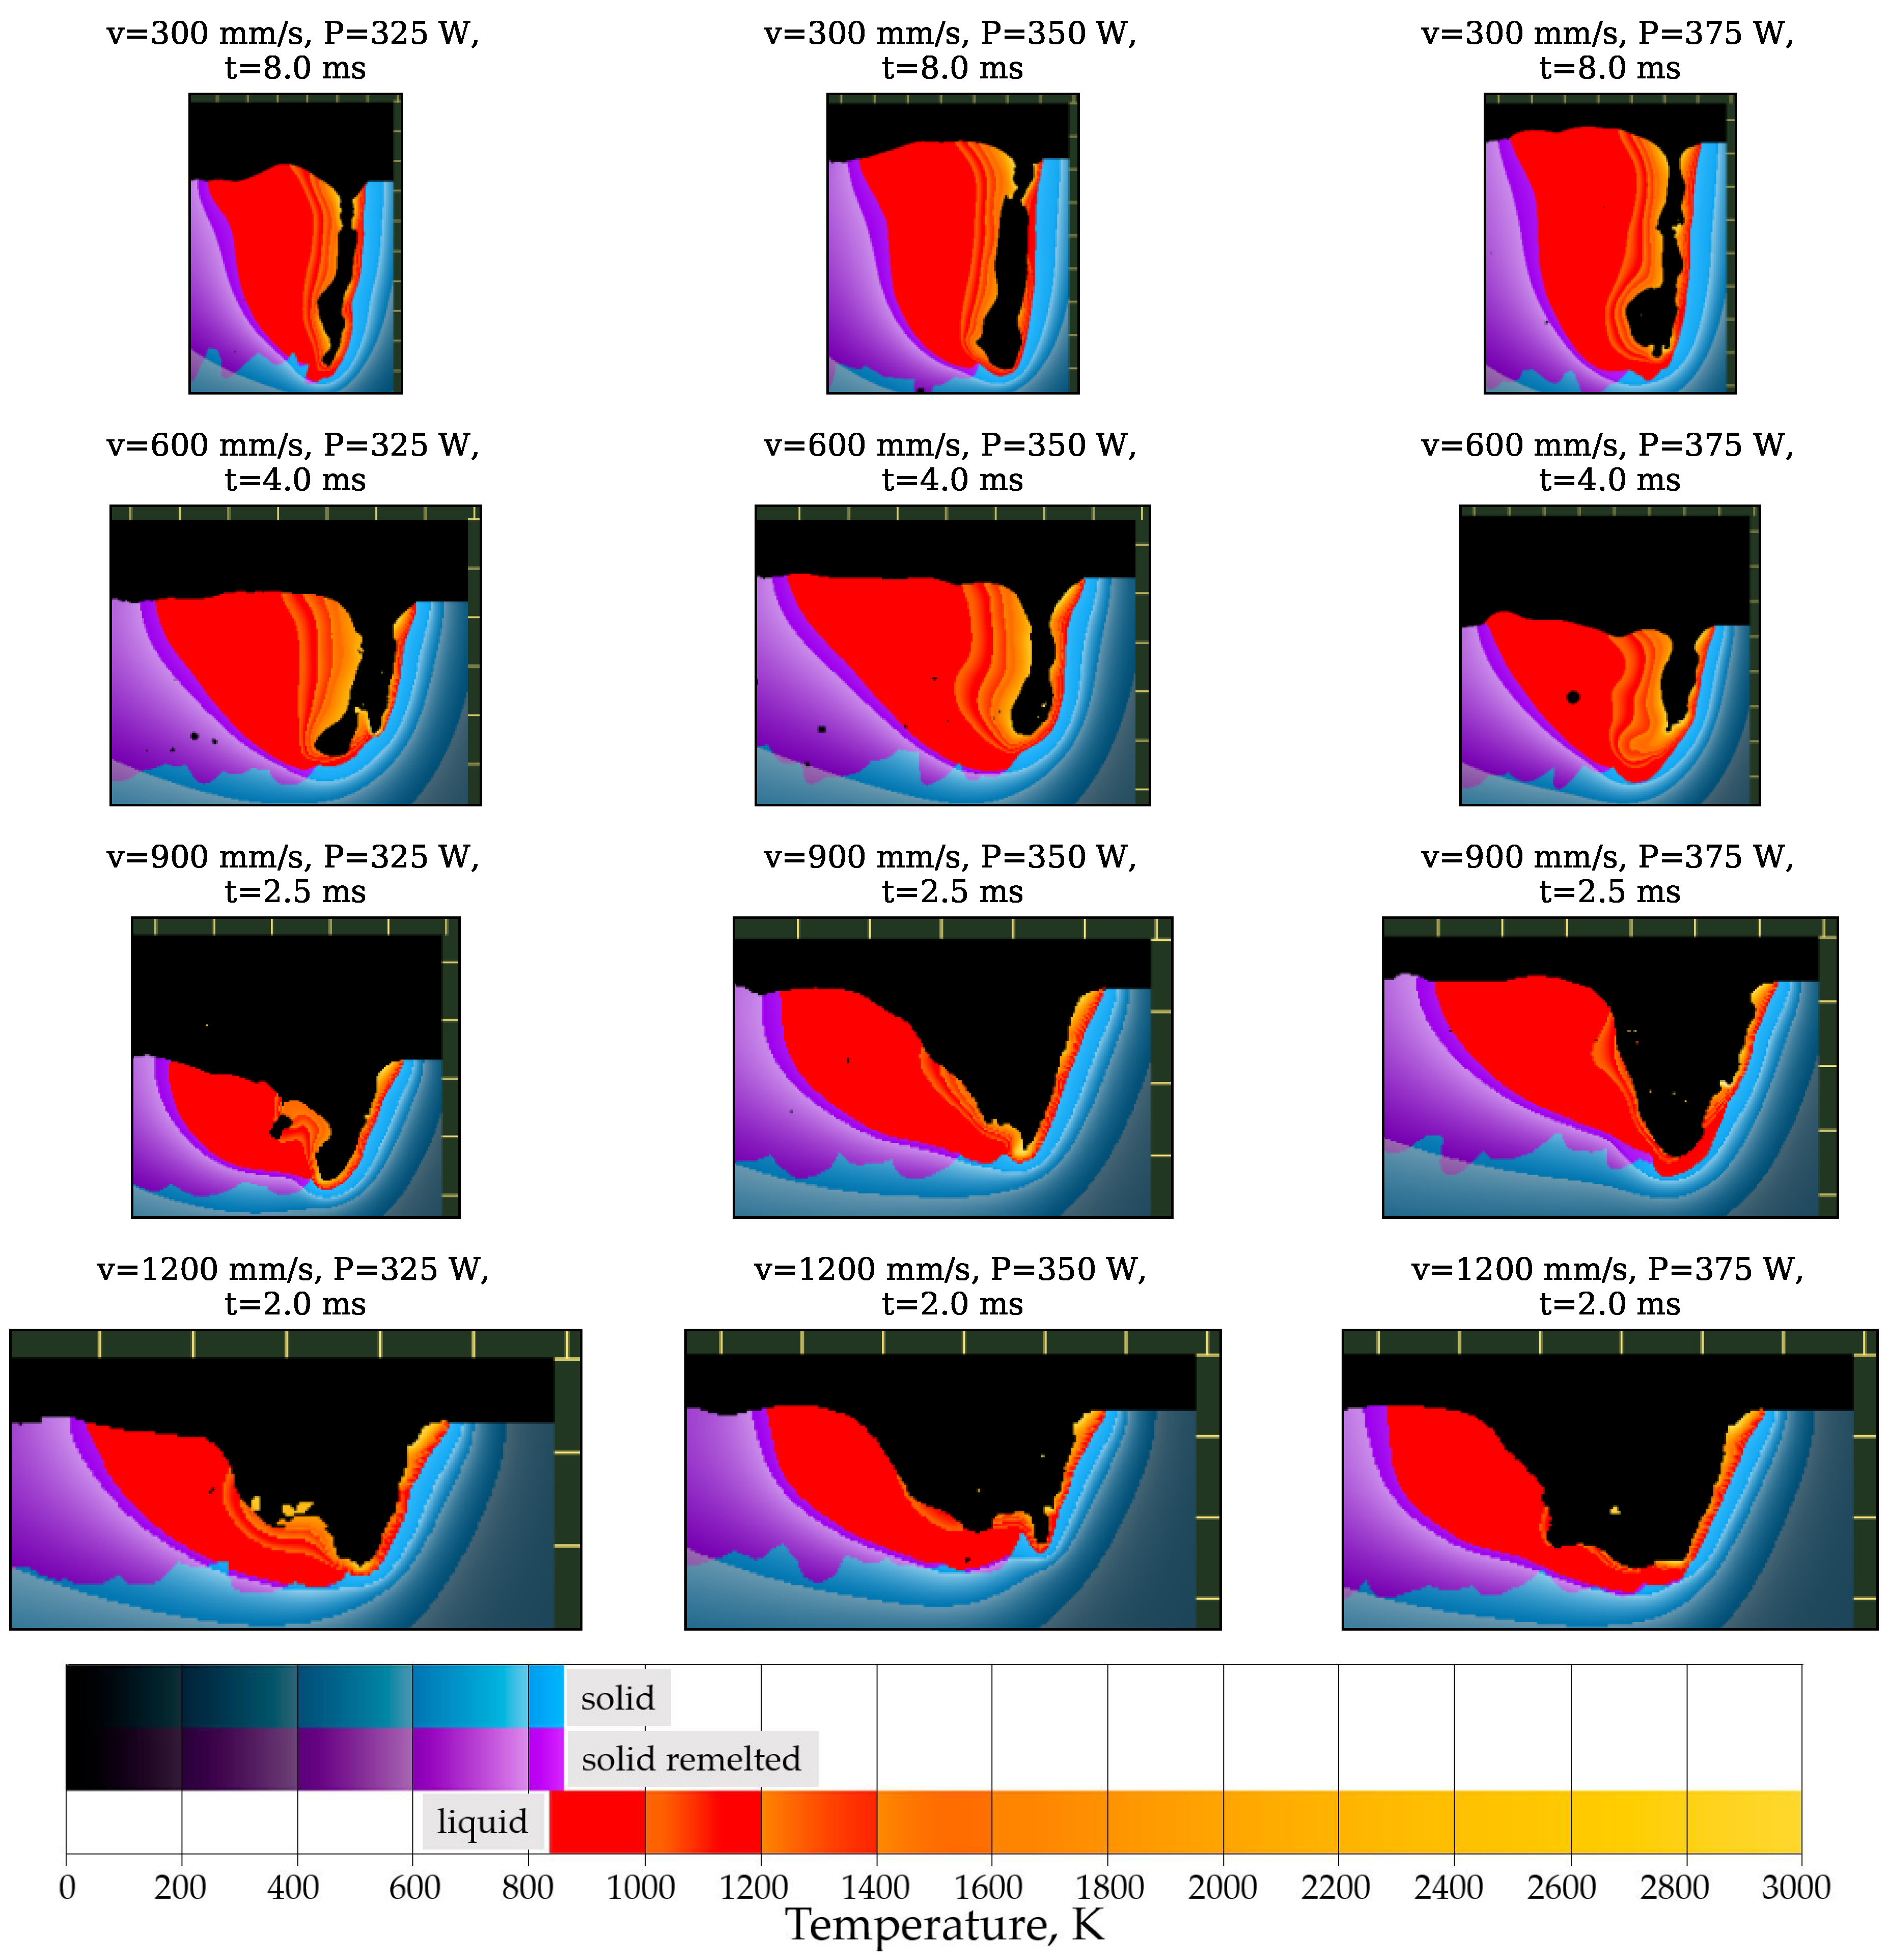
3.1. No Powder Case Simulation

The track morphology is considered one of the most influential factors for the entire LPBF process. When the conventional layer thickness was used, there was a window of optimal process parameters, which provided continuous tracks (no balling effect) without excessive keyholing. During volumetric consolidation, track discontinuities result in the lack of fusion pores, and excessive keyholing may lead to metallurgical or gas pores formation. The current study is focused on increased thickness of the layer; therefore, the keyhole regime cannot be avoided as far as a relatively large volume of powder should be melted at once.
Moreover, aluminum-based alloys are known to have a low laser absorptivity. Thus, in this study, the regimes with a laser power close to the nominal maximum of YLR-400WC were used (Table 1).
Figure 2 depicts cross-sections of the melt pool grid along the laser movement in the middle of the track ( y 0 = 2 mm). The data are presented for the time instant t different for each scanning speed when a quasi-stationary behavior was achieved. In the studied window of regimes, the keyhole mechanism of melting was observed for all combinations of laser power and scanning speed. Such process conditions cause multiple ray reflections in the depression zone; therefore, the simulation results are highly sensitive to the absorption coefficient of the material. According to Huang et al., the keyhole modes are subdivided into quasi-stable, transition, and unstable depending on the front wall angle [56]. The quasi-stable mode is associated with significant deformation of the liquid surface due to the recoil pressure during evaporation. Such a mode was observed in all cases with scanning speeds of 900 mm/s and 1200 mm/s. The transition mode is considered to be the case where the front wall angle is large, but the morphology of the melt pool is still shallow. Finally, an unstable keyhole appeared for all simulations with a scanning speed of 300 mm/s. The mode results in the drilling effect with the narrowest keyhole. This morphology enables a significantly higher number of reflections occurring directly inside the keyhole, which is followed by a rapid growth in the melt pool depth. In the simulation, the pore formation occurred predominantly in unstable and transient modes, which is in good agreement with the experimental findings [56]. It should be noted that only the general morphology of the melt pool can be determined via the in situ X-ray experiment, whereas the high-fidelity modeling approach enables the analysis of the fluid motion taking into account the surface tension, capillary forces, wetting, etc. In this regard, the combination of these tools contributes to a deeper understanding of the process.
Figure 3 illustrates the longitudinal cross-sections of the single track after the laser influence obtained in the experiment and in the simulation for the regime with P = 375 W and v = 600 mm/s. Two distinctive features were observed in both morphologies. The first one was the formation of metallurgical pores by convective flows in the melt pool, and the second one was the appearance of significant fluctuations in the depth of the remelted material. The remelted domain of the simulated track is color-coded with a purple palette when the red line depicts the boundary for the experiment. This behavior in the melt pool is not conventional for most materials used for LPBF manufacturing and high-fidelity simulations. For instance, the simulations performed for Inconel 625 [39], stainless steel 316L [57], and Ti6Al4V [58] revealed a more stable track morphology. In the previous work [26], it was experimentally demonstrated that single beads deposited on a NiTi substrate with a single powder layer result in a stable remelted depth for a broad window of process parameters.
In the present study, the time dependency of the energy absorbed by the material was calculated as the ratio between the energy transferred to the material over the last 1000 time steps and the energy emitted by the laser over the same time frame. The dependencies of the absorption on the distance traversed by the laser at a power of P = 375 W for all scanning velocities (ranging from v = 300 to 1200 mm/s) are given in Figure 3. A number of important points should be noted. Firstly, the average total absorption changes significantly with the variations in the scanning speed. At a maximum velocity of 1200 mm/s, it is approximately 35%, while at a minimum velocity v = 300 mm/s, it increases to 77%. Secondly, along the track, the absorption does not remain constant but exhibits noticeable variations. The amplitude of these variations increases inversely to the scanning speed. The absorption coefficient for a flat surface of a liquid melt depends on temperature and ranges from 0.11 to 0.16 (see Table 2). The rapid growth in the total absorbed energy is the result of multiple reflections of radiation inside a narrow keyhole that forms directly beneath the laser. Effective absorption is highly sensitive to the shape of the keyhole and to the occasional closure of the drilled channel during the melting process. This phenomenon is described in [59]. Thus, the fluctuation of the remelting depth along the track which is observed in Figure 3 is explained by a significant variation in the total absorption energy. As the scanning speed decreases and the keyhole becomes narrower (Figure 2) and less stable, the total absorption increases, and its variations become more pronounced.
A comparison of the melt pool size between simulation and experimental measurements for the two types of substrates is given in Figure 4. The results on the depth and the width of the single tracks are presented as functions of the scanning speed for 325 W, 350 W, and 375 W. In the simulation, the depth was obtained as follows. The averaging range was defined by the two values x r 0 = 1.7 mm, x r 1 = 4.5 mm, that corresponds to the most stable part of a track. In this range, a x = x c r o s s = c o n s t cross-section was taken at every mesh step Δ r . The resulting geometry after simulation included two types of solid cells: namely, the pristine and the remelted after transition (solid–liquid–solid). The cells of the second type created a solidified domain that was studied further. At ( x , y ) = ( x c r o s s , 2 mm ) , the vertical distance between the deepest cell with the remelted material and the substrate level was considered as the depth of the track. The maximum distance over the z-axis between the cells that contain the remelted material with the lowest and the highest y coordinate was taken as the width of the track. The depth and the width were averaged over the x r 0 < x c r o s s < x r 1 range.
The experimental dependencies of the melt pool size show similar behavior for all values of the laser power. The absence of a characteristic slope change in the remelted depth indicates the appearance of the keyhole mode welding in the entire window of regimes. The difference in the melt pool sizes for the two types of substrates (LPBF and cast substrates, see description in Section 2.2) is 10 % on average. Importantly, for all cases, the LPBF substrate had a higher remelting depth and width. Hence, cast substrates could be used for the evaluation of the melt pool size and validation of the models; however, the substrate prepared directly via LPBF will provide higher accuracy. The reasons for the difference between the substrates will be explained below.
For velocities higher than V = 600 mm/s, a good agreement was obtained for depth values, especially with the plate manufactured by LPBF. The highest deviation between the calculated and experimentally obtained depth of the melt pool was observed for the lowest scanning speed ( V = 300 mm/s) for all levels of the laser power. This discrepancy is attributed to the unstable behavior of the liquid melt during the keyhole formation. As previously stated, the unstable keyhole with a drilling effect appeared for all simulations with a scanning speed of 300 mm/s. However, according to the experimentally obtained dependencies on the melt pool depth for cast/LPBF substrates, such a mode was not achieved in the utilized window of process parameters (Figure 4).
The considered regime is well known to exhibit intensive evaporation and the formation of the vapor plume [60]. In turn, the latter might result in significant laser scattering on condensed vapor particles [61], decreasing the resulting energy density input. These physical phenomena were not taken into account in the current model. In this regard, the absence of laser absorption in the gas atmosphere during the simulation procedure led to an overestimation of absorption in the keyholing regime (see Figure 3), which, in turn, could explain the increase in the simulated melt pool depth. It should be noted that the study of the relationship between laser energy density, flows in the melt pool, and the plume formation is a complex experimental problem related to in situ process monitoring; therefore, there are limited reliable results [62]. Further development of the simulation approach taking into account the vapor plume formation will be the subject of future work. This will allow describing the melt pool morphology in the keyholing regime more accurately and analyzing its influence on the melt pool flows.
In Figure 5, the transverse cross-sections of the single tracks obtained on the cast and LPBF substrates are compared with the simulated track morphology. The melt pool size on the LPBF substrate is larger despite both types of substrates being ground before laser processing. Supposedly, the difference is caused mainly by the microstructure peculiarities.
Figure 6 depicts typical the electron images of a single tracks’ cross-sections on LPBF and cast substrates. The morphology of the LPBF substrate is represented with track boundaries that became visible during etching. Chemical mapping revealed a homogeneous distribution of Al and Si after the process both in the substrate domain and in the remelted area after the experiment. On the contrary, the microstructure of the cast substrate is represented by the α -Al dendrites surrounded by the Al-Si eutectic. A significant amount of eutectic is observed due to the high Si content in the alloy. There are two main features that appeared after the laser influence. First, the chemical mapping of the melt pool revealed the composition alignment after solidification. The growth of dendrites and eutectic was suppressed by the rapid heating/cooling rates prescribed to the LPBF process. Second, a vortex pattern was observed in most images of the melt pool as a result of the melt redistribution during the Marangoni flows. Thus, the possible reasons for the change of the melt pool size due to the microstructure are related to the presence of fibrous Si particles in the cast substrate and the pronounced texture in the case of the LPBF substrate. The Si networks conduct heat worse compared to the aluminum matrix, while the texture is developed along the easy direction for heat conduction (<100> for the FCC lattice).
Figure 4 and Figure 5 show that the simulation produces a lower track width and a larger depth than can be seen in the experimental data. However, for scanning speeds of 600–1200 mm/s, the agreement was sufficient to continue the study with the chosen thermophysical properties. Moreover, the agreement improved with increasing speed, which aligns well with the aim of building rate optimization.

3.2. Powder Case Predictive Simulation

In this section, the influence of the thickness of the powder layer on the geometry of the scanned track was studied via simulations with the powder bed. Scanning of a powder layer and scanning of a bare substrate have important differences in the underlying physics. Heat transfer in the powder differs from that in a continuous material, and it depends greatly on the powder composition, density, and uniformity of the layer, and so does the laser energy absorption due to multiple reflections between the particles. Hence, high-fidelity simulation of the powder deposition is required to ensure physically accurate packing. In the current work, powder particles were directly resolved in LBM simulation with the mesh step Δ r D mean where D mean is a mean powder particle size, so the laser multiple reflections inside the powder, as well as heat transfer in powder layer, were taken into account naturally.
One of the most important aspects of the powder bed simulation for the LPBF process is the correct choice of the powder layer thickness. Most LPBF machines operate within a 20–40 µm step of the building plate. However, due to the significant shrinkage of the powder after consolidation, the layer thickness differs from the step of the building plate. In the present paper, we separately distinguished the base plate step which was used for the technological aspects and the layer thickness which was achieved during the powder deposition operation. It should be noted that manufacturers of the equipment, operators of the machines, and technology-based papers use these two terms interchangeably. However, for the physical simulation, the real height of the formed powder bed is of great interest. In this regard, the layer thickness is equal to the base plate step divided by the filling factor (when the number of layers is large), where the filling factor is the ratio between the densities of the powder and the solid. The mathematical derivation of this expression is given in Appendix A.
In the presented DEM simulation, a solid plane rake was used for the recoating of spherical particles. Figure 7 depicts PSDs calculated for different layer thicknesses of the powder bed. It should be noted that the experimental curve was obtained for a simulated thick powder bed without a recoating operation, which guarantees full compliance with the PSD obtained via laser diffraction method (Section 2.2). The simulated distributions were compared to the experimental one. For the layer thicknesses of 50 and 60 µm, PSDs were shifted to the lower sizes of particles. The 80 µm curve is close to the original distribution, when the case with a 230 µm layer thickness has a fully equivalent PSD to the experimental one. The filling factor (Figure 7) is a convenient indicator of packing density that can be used for comparative analysis of the powder layer thicknesses.
In Figure 8, the whole simulation domain ( 7 × 4 mm 2 ) is demonstrated before the laser scan. As expected, the knife movement made the powder layer irregular when the layer thickness was smaller than the size of some particles. As a result, larger particles were excluded from the simulation when the layer thickness H was small.
In the tracks on powder simulations, the size of the whole simulation domain was set to 7 × 4 × 3.5 mm 3 . The mesh size was Δ r = 6 µm and the time step was Δ t = 90 ns. The tracks started at x s t a r t = 1 mm, y s t a r t = 2 mm and ended at x e n d = 5 mm, y e n d = 2 mm. For H 190 µm, x s t a r t = 0.5 mm, x e n d = 6.5 mm.
One simulation took under 25 min of wall time. The output of the simulation was the volumetric data of the remelted material. The stored geometry in sparse VDB format was from 20 MB ( H = 50 µm) to 70 MB ( H = 170 µm). The size increased when there were more powder particles, since such a geometry required a higher level of detail.
Figure 9 shows some sample tracks ( P = 350 W, v = 0.9 m/s) from the simulation results rendered with Blender [63]. The change in the quality of the track is observed with an increase in the powder layer thickness. The track shape is even when there is almost no powder, and, with an increase in the amount of powder, the balling effect becomes prominent. The emerging balling effect is associated with a limited heat sink of the surrounding powder layer in comparison with a solid substrate. The average temperature in the melt pool increases since the heat conduction is suppressed. As a result, the speed of the melt pool’s spreading becomes higher than the speed of the solidification front. In this regard, the surface tension stabilizes the surface of the melt for a longer period of time during cooling. It should be noted that the solidification rate for aluminum alloys has a weak dependence on temperature [64].
We analyzed the track shape statistics at each cross-section with the step Δ r with a procedure described in Section 3.1. The result is plotted in Figure 10. Some useful information can be obtained from these graphs. One is that the track width increases slightly with the powder thickness, and the track is always wider than the beam spot size ( D 4 σ ) and wider than the 2 D 4 σ for a powder thickness of more than 80 µm.
Another evident fact is that the track becomes shallow as the powder layer thickness increases. The critical value of the powder thickness H crit at which the track depth becomes zero and the powder does not fuse to the substrate is found to be H crit = 270 µm for the scanning speed 0.9 m/s, H crit = 260 µm for 1.0 m/s and H crit = 230 µm for 1.2 m/s. The average track height becomes larger with the increase in powder thickness and the height variability increase as well.

4. Discussion

Based on the results of the previous section, three criteria were formulated to predict the pores-free solidification of the bulk material. Figure 11 illustrates the criteria derivation.
The first, depth-independent criterion of the lack of fusion appearance is based on the following equation:
H + P s h min = H + f f · H h min > H crit ,
where H is the powder thickness, P s is the platform step, f f is the powder-filling factor, h min is the minimal track height and H crit is the critical powder thickness (see Figure 10). This criterion is based on the following assumptions: after melting of the whole layer, the powder will be refilled up to the level of P s + H , and the lowest point of the new substrate will be placed at the level of h min . Therefore, in some regions, the powder thickness could reach the value of P s + H h min , and a powder layer with such thickness could not be fully remelted if it is greater than H c r i t .
The second lack of fusion criterion (sufficient condition) is
P s D max > h min
and the third necessary condition for lack of fusion is
P s D min > h min ,
where D max and D min are the maximum and minimum track depth, respectively. The sufficient condition is based on the idea that the next layer’s lowest depth coordinate cannot be higher than the previous layer’s minimum height coordinate. If this fails, then the lack of fusion will definitely appear. While the second criterion utilizes the maximum depth D max , the third necessary criterion implies that for the next layer, the whole depth profile should be higher than the previous layer’s minimum height coordinate. The third criterion is a superior version of the second criterion. In Figure 11, a situation is shown when the second criterion predicts the lack of fusion while the third does not.
The resulting lack of fusion criteria as functions of powder thickness are depicted in Figure 12.
It can be deduced that to produce a bulk material without a lack of fusion for the chosen parameters and scanning speed equal to v = 1.2 m/s, the maximal powder thickness that can be chosen is H = 170 µm, which is obtained by setting the platform step to P s = 100 µm. H = 145 µm ( P s = 80 µm) is sufficient but does not guarantee the best quality. In this case, the bulk material will not have the lack of fusion pores associated with insufficient layer thickness. However, porosity may still be present due to an incorrect hatch size, scanning strategies, spattering, and other phenomena.

5. Conclusions

In this work, it was demonstrated how numerical simulation at the mesoscale can be used to give various insights for the task of improving of LPBF building rate by increasing the powder layer thickness. High-fidelity 3D simulation with high resolution implemented in the KiSSAM software was used. Among other features, it includes accurate ray tracing, evaporation solver, powder spreading simulation and various diagnostics. One feature that was crucial for the current study is the physically accurate powder spreading and resolving the powder particles on a fine mesh. This was important for the current study since the geometry of the powder greatly affects the heat transfer around the processed material, which, in turn, can lead to significantly different shapes of the solidified melt. Furthermore, the high resolution allowed for a detailed examination of variations in track morphology. The high performance of GPU implementation of numerical methods in the KiSSAM software allows for simulating large domains with high resolution within a reasonable time frame and to collect data from a large number of simulations.
In the paper, the simulations were performed to validate the numerical model through a comprehensive comparison with experimental data (no powder case). Additionally, new data under conditions that are difficult to reproduce in the experiments (tracks on various thicknesses of powder layer) were obtained. Below, several important observations that were obtained in this study are summarized.
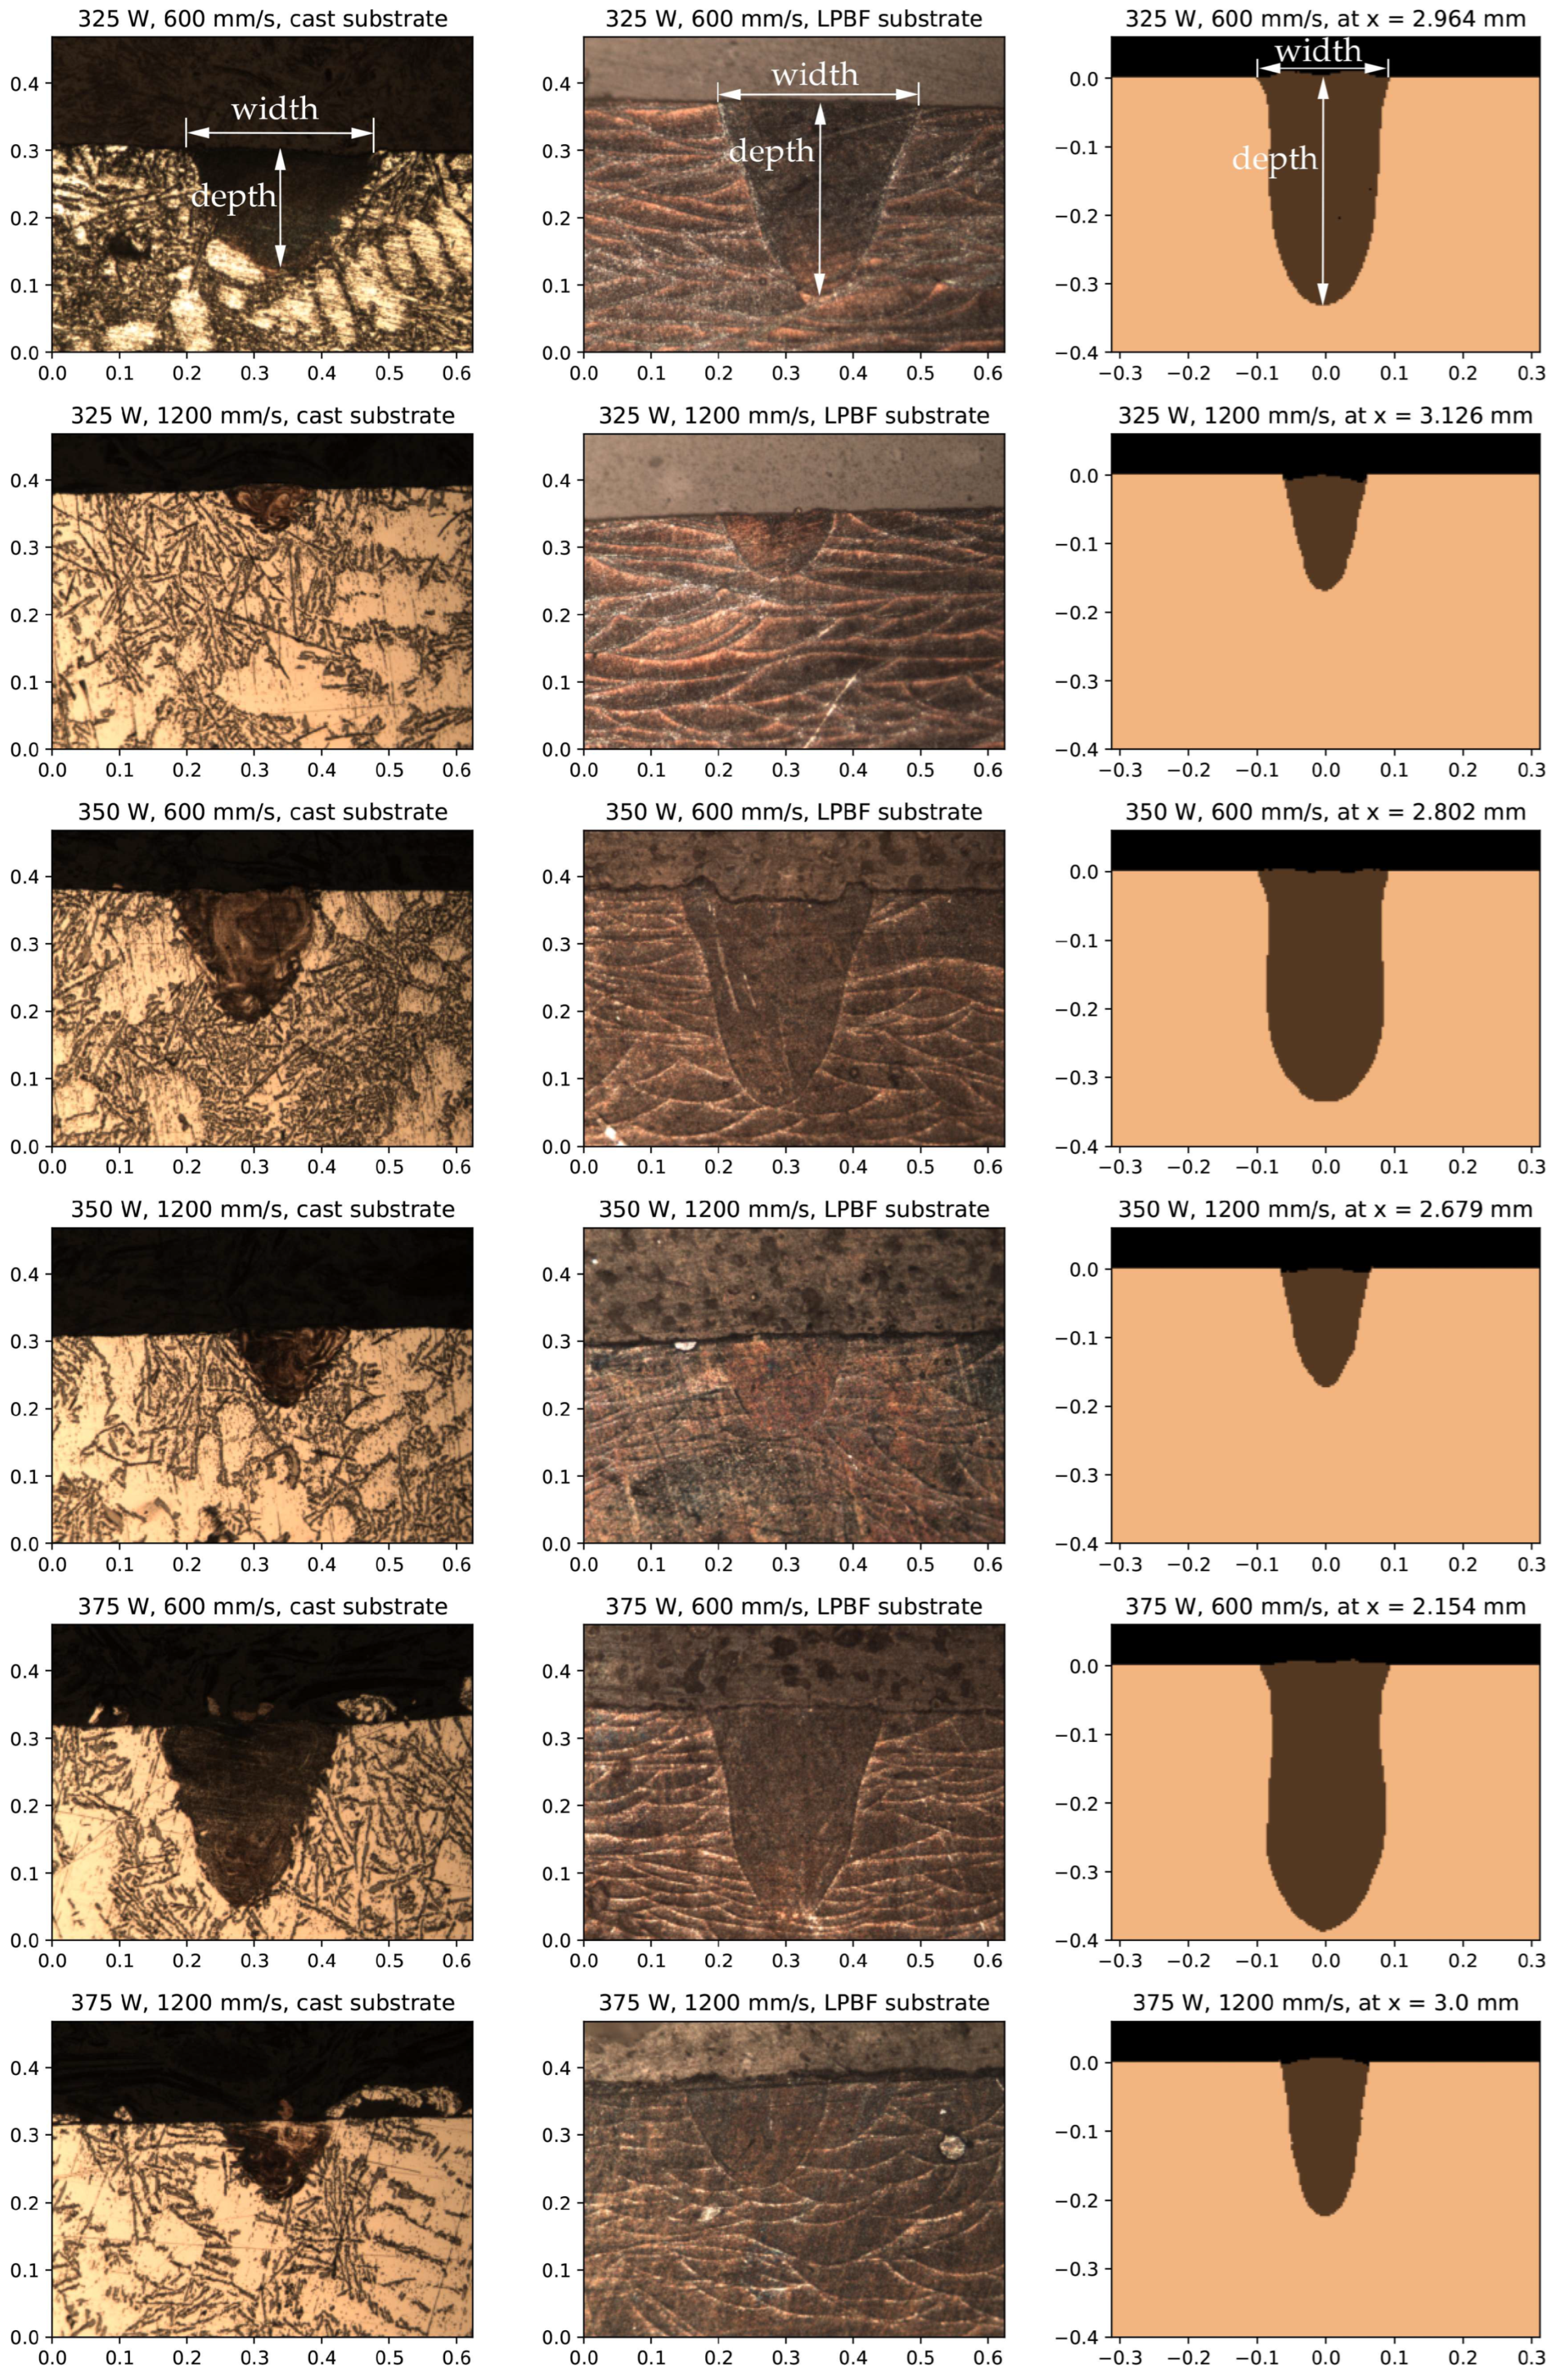
  • There is a satisfactory agreement between the experiments and the model for a single track’s width and depth. The compliance is better for a higher laser speed, which gives a higher building rate. The difference in the size of the melt pool between the simulation and the experiment is comparable to the difference observed for cast and LPBF substrates used in the experiment.
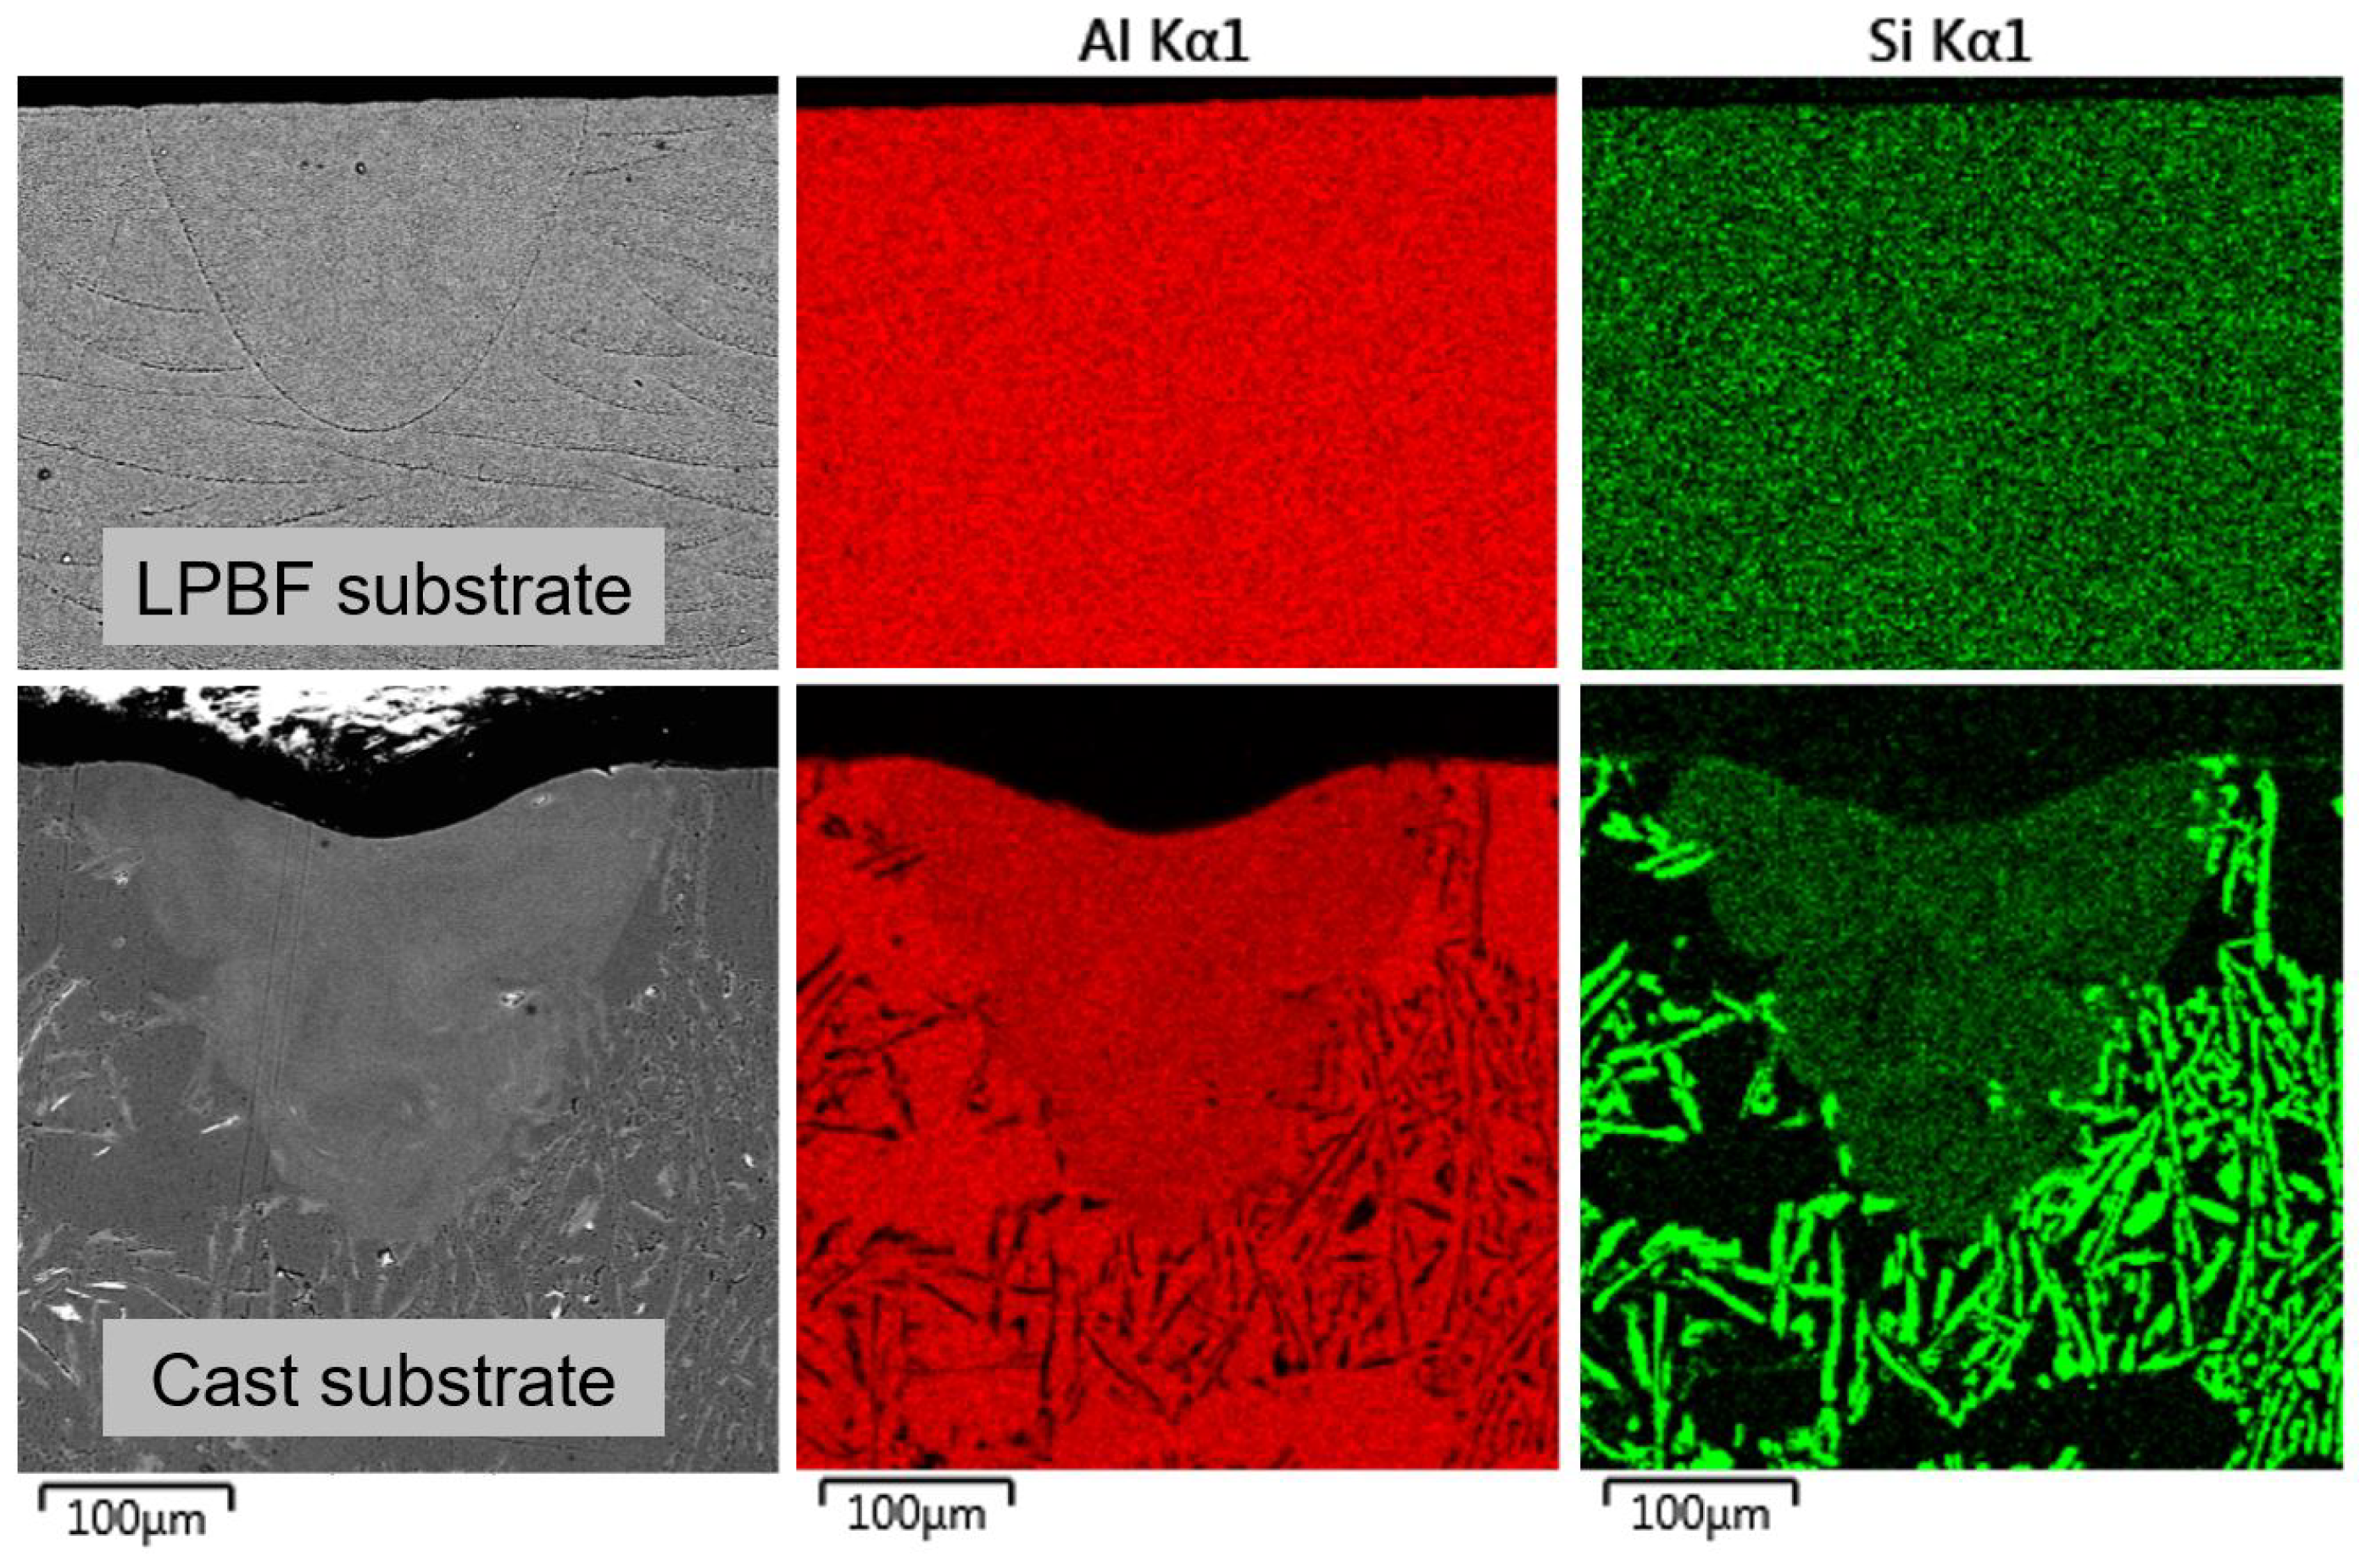
  • The size of the melt pool is different for the cast and LPBF substrates. The possible reasons are related with microstructure, namely the presence of fibrous Si particles in the cast substrate and the pronounced texture in the case of the LPBF substrate. Si networks conduct heat worse in comparison to the aluminum matrix, while the texture is developed along the direction with more efficient heat conduction (<100> for the FCC lattice).
  • Both in the experiments and in the simulations, significant fluctuations in the remelting depth along the track were observed. A possible reason is the variation in the amount of the laser energy absorbed in the material. The effective absorption is highly sensitive to the shape of the keyhole and to the occasional closure of the drilled channel during the melting process.
  • The data on the widths of the tracks scanned on powder layer can be used to estimate the optimal range for the hatch distance parameter. The data on the depth of the simulated tracks on the powder layer provides the estimation for the platform step in manufacturing process. Such examinations are cheaper to perform via computer modeling, since a thin powder layer can be fine tuned in the model, while the deposition of powder with the prescribed layer thickness is difficult to provide experimentally.
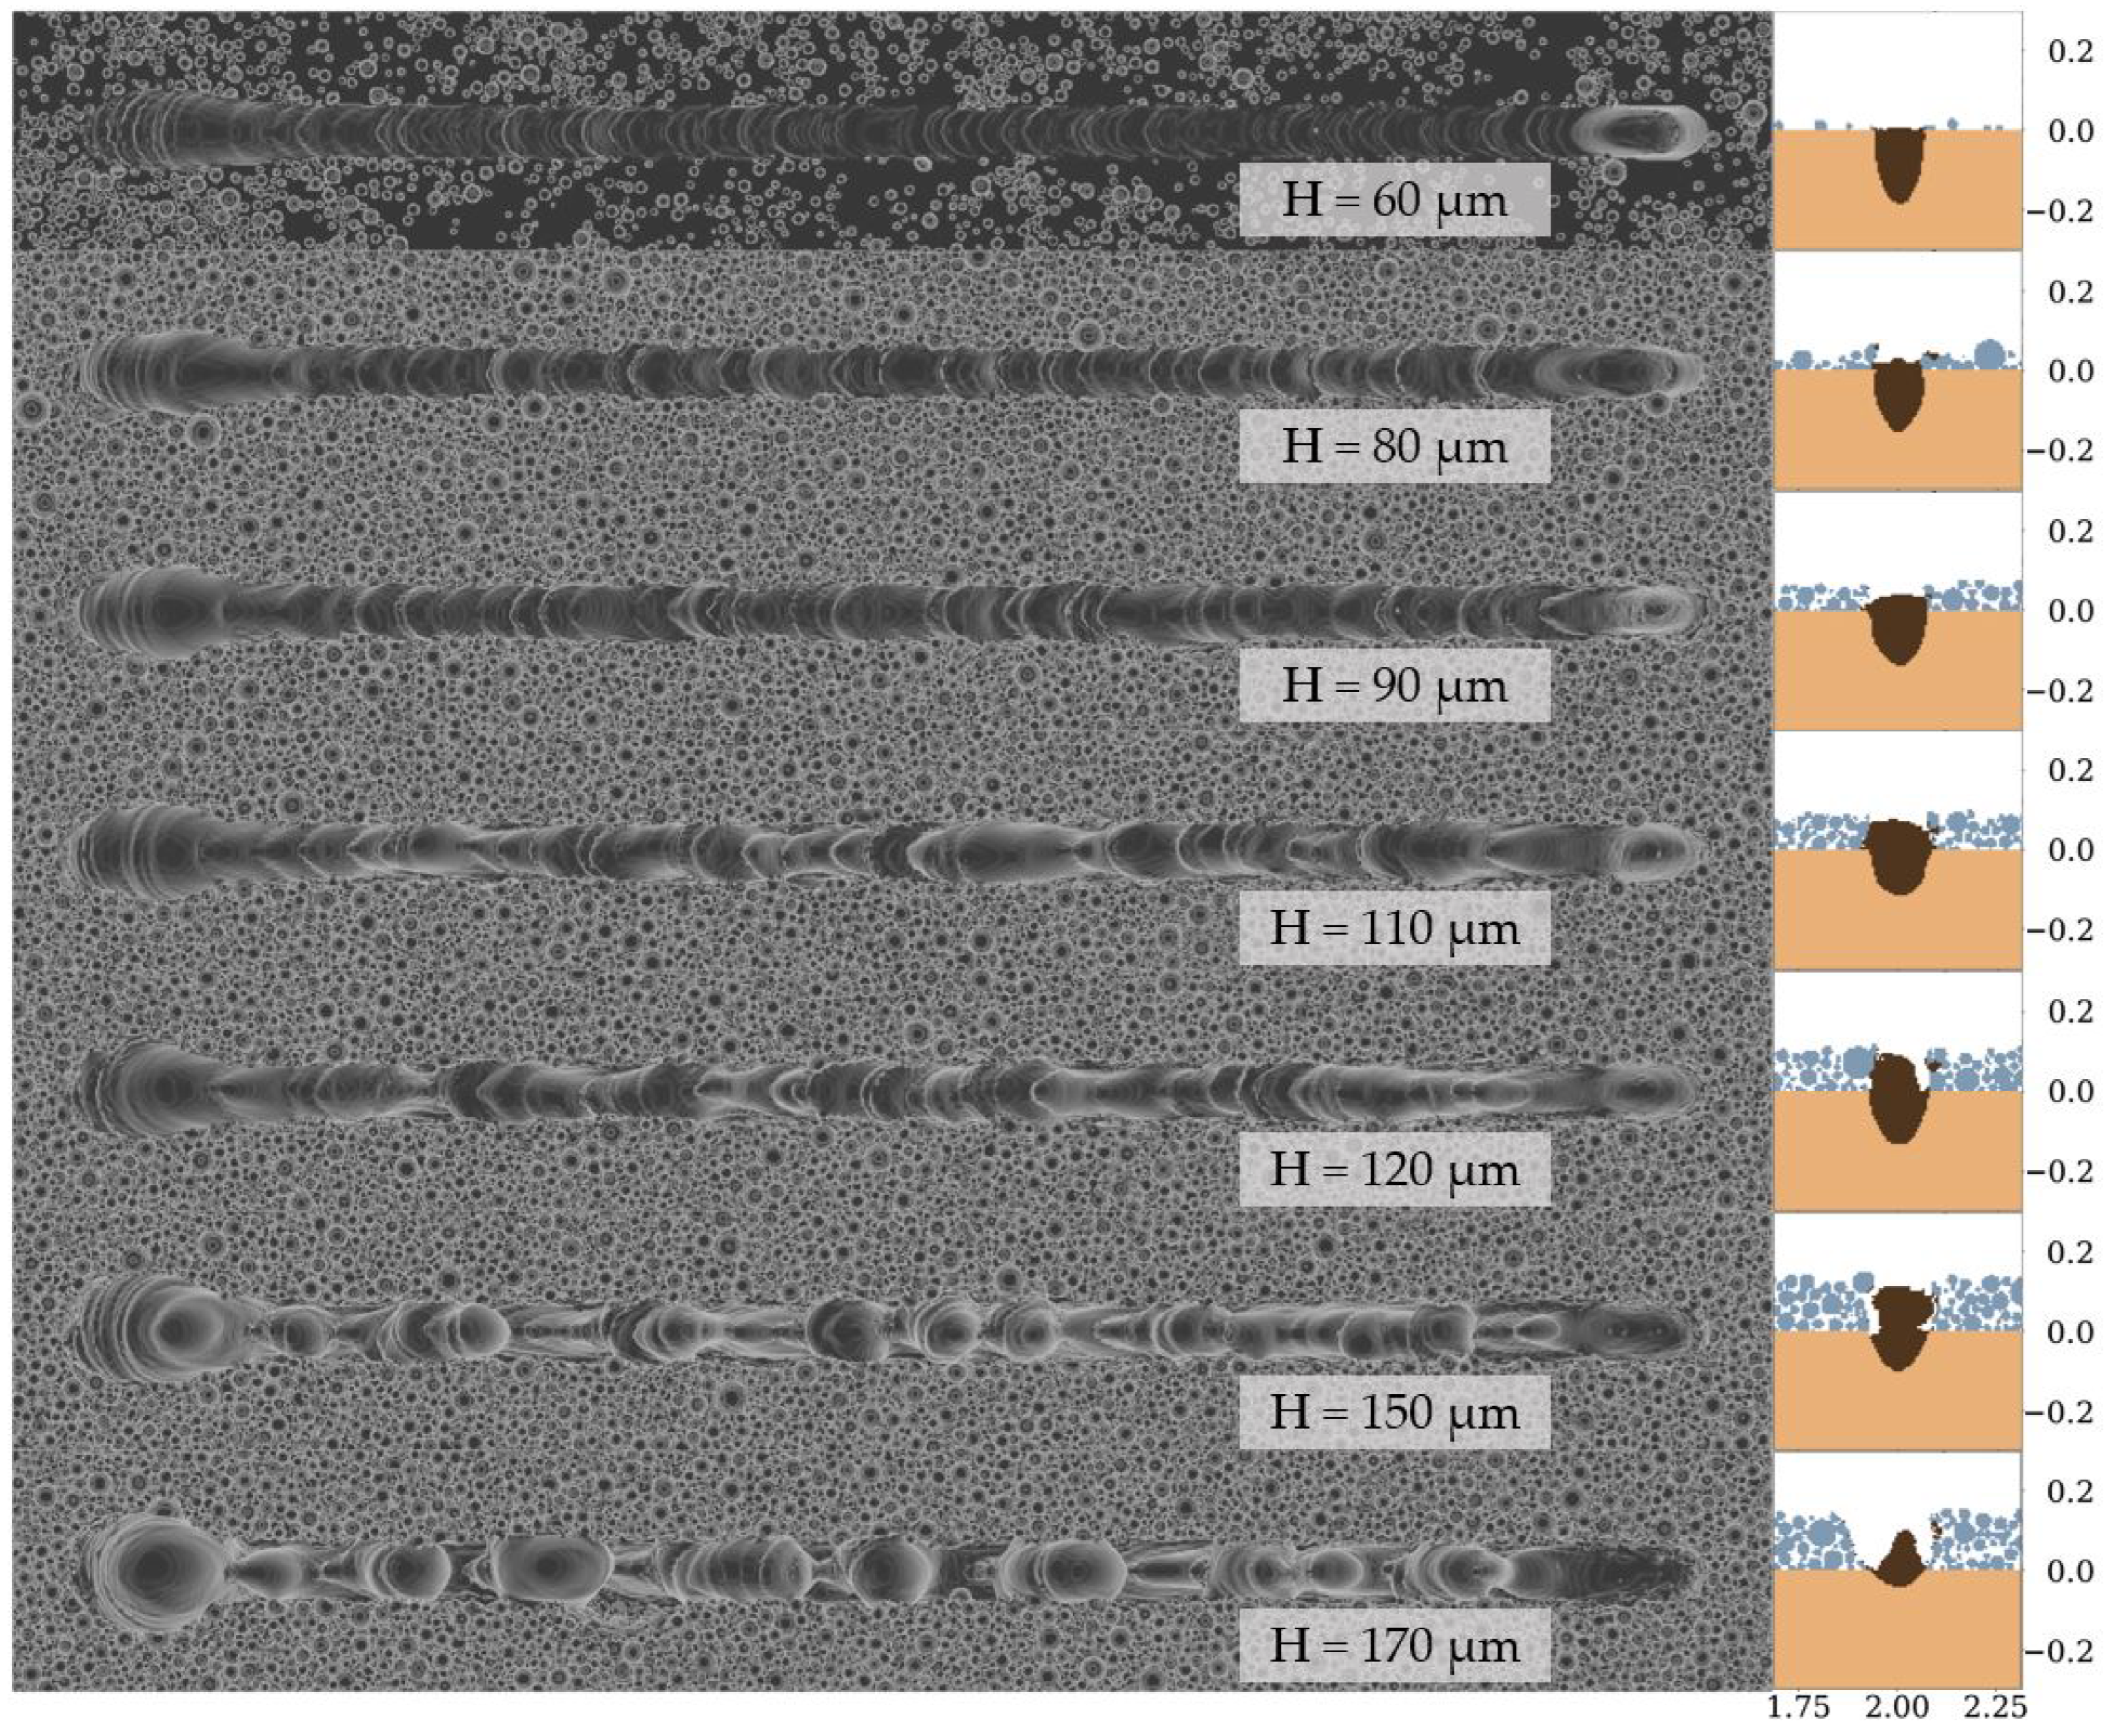
  • In the results of the simulations, it observed that the track shape is even for a thin powder layer, and, with an increase in the amount of powder, the balling effect becomes prominent. The supposed cause of this effect is the limited heat sink of the surrounding powder layer in comparison to a solid substrate. In a slower solidification of the liquid surface, the surface tension creates spherical shapes in the track geometry.
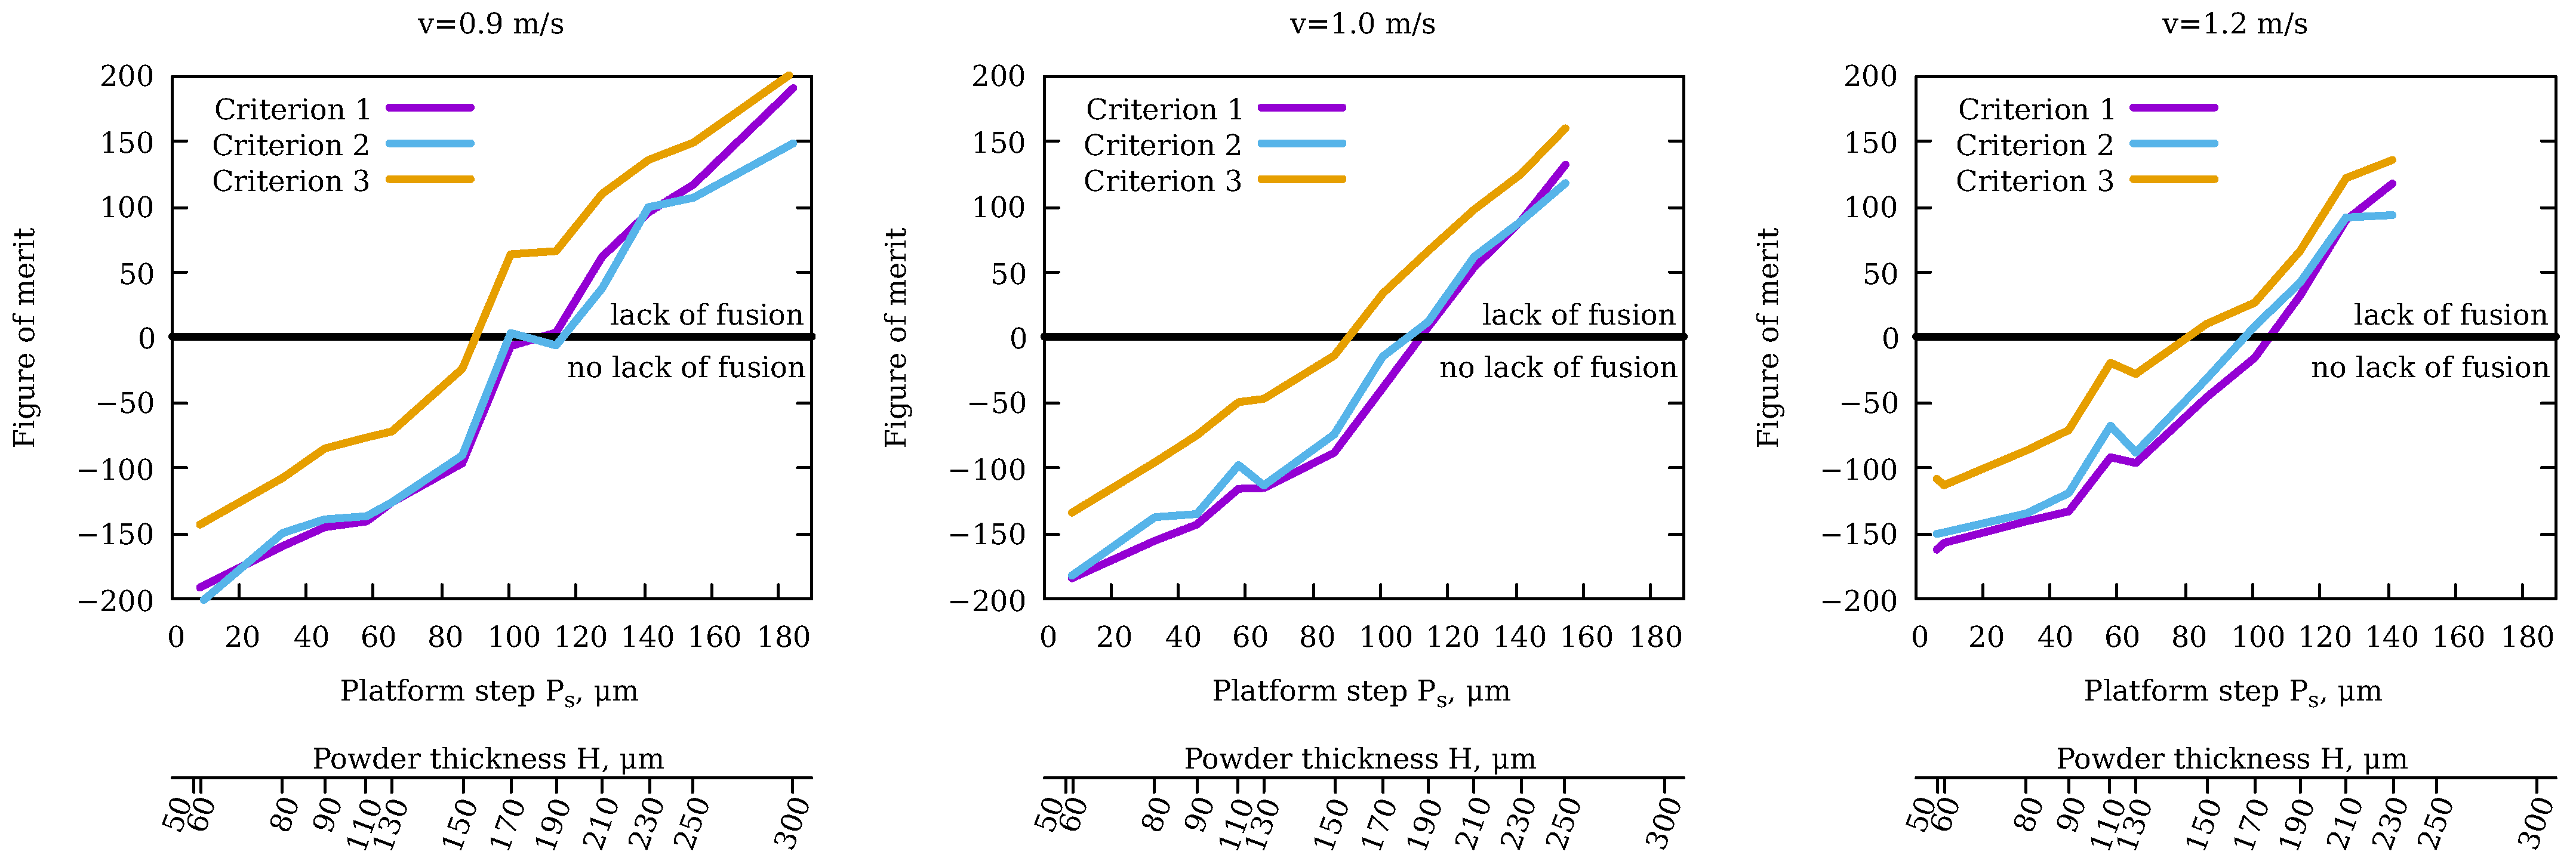
  • Three different criteria were formulated to predict the maximum remelting depth with an increased thickness of powder bed. By applying the described approach to the data collected in the simulations, it was found that the critical layer thickness is 160–190 µm (that corresponds to the platform step 90–110 µm) for the regime with P = 350 W and V = 900 1200 mm/s.
Additionally, we admit the discrepancies of the results obtained for the regimes with the lowest scanning speed of 300 mm/s. Supposedly that the issue can be resolved by an accurate simulation of the gas flow and vapor plume formation.
In the future study, multi-track and multi-layer simulations will be performed to analyze the lack of fusion defects and the keyhole porosity. This approach will allow a direct comparison of volumetric samples manufactured with an increased layer thickness and the simulated domain.

Author Contributions

Conceptualization, S.C., A.Z., B.K., B.P., A.G. and E.D.; methodology, M.B., S.B. and I.P.; software, A.Z., B.K. and S.B.; validation, B.Z., L.F. and S.C.; formal analysis, I.I., M.L. and M.B.; investigation, B.Z., M.L. and I.P.; data curation, M.L., B.Z., L.F. and I.I.; writing—original draft preparation, A.P., S.C., M.B., A.Z. and B.K.; writing—review and editing, I.P., A.P. and I.I.; visualization, L.F., S.B. and A.P.; supervision, B.P., A.G. and E.D.; project administration, B.P., A.G. and E.D. All authors have read and agreed to the published version of the manuscript.

Funding

The study was supported by the Russian Science Foundation (grant No. 19-79-30025) https://rscf.ru/en/project/19-79-30025/—accessed 21 December 2023.

Data Availability Statement

The data presented in this study are available on request from the corresponding author.

Conflicts of Interest

Authors Maria Bogdanova, Andrey Zakirov, Sergei Belousov, Anastasia Perepelkina, Inna Iskandarova and Boris Potapkin are employed by Kintech Lab. The remaining authors declare that the research was conducted in the absence of any commercial or financial relationships that could be construed as a potential conflict of interest.

Abbreviations

The following abbreviations are used in this manuscript:
LPBFLaser Powder Bed Fusion
AMAdditive Manufacturing
LBMLattice Boltzmann Method
VoFVolume of Fluid
KiSSAMKintech Simulation Software for Additive Manufacturing
DEMDiscrete Element Method
EIGAElectrode Inert Gas Atomization
SEMScanning Electron Microscopy
PSDParticles Size Distribution
EDSEnergy-Dispersive X-ray Spectroscopy
OMOptical Microscopy
EDMElectrical Discharge Machine
FoMFigure of Merit

Appendix A

Let the layer number in the LPBF process be denoted by i. Assume that the first layer will be made on a bare plane substrate. Therefore, after the first iteration of the recoating process ( i = 1 ), the layer thickness H ( 1 ) = H i = 1 is equal to the building platform step P s , which remains constant throughout the entire procedure:
H ( 1 ) = P s .
For the evaluation of the layer thickness after remelting, we assume that the whole powder layer turns into uniform solid layer with zero porosity and shrinks by a factor of f f = ρ powder / ρ solid . Therefore, the first layer will have thickness f f P s after remelting and will provide an additional thickness ( 1 f f ) P s for the second powder layer. Finally, for the second powder layer, we have
H ( 2 ) = P s + ( 1 f f ) P s .
In a similar way, we obtain H ( 3 ) = P s + ( 1 f f ) P s + ( 1 f f ) 2 P s . Repeating the same derivation again and again, for the i + 1 powder layer, the following expression will be obtained:
H ( i + 1 ) = m = 0 m = i P s ( 1 f f ) m
Equation (A3) represents itself as a partial sum of a geometric series with the coefficient P s and a common ratio 1 f f . For any metallic powder layer, we assume that 0 < f f < 1 , so the sum of the infinite series m = 0 P s ( 1 f f ) m exists. The limit value or the stationary layer thickness H during the LPBF process for i 1 is given by the following Equation (A4):
H = lim i H ( i ) = P s f f ,
as the sum of the converged geometric series holds true.

References

  1. Gibson, I.; Rosen, D.; Stucker, B. Additive Manufacturing Technologies: 3D Printing, Rapid Prototyping, and Direct Digital Manufacturing; Springer: Greer, SC, USA, 2015; pp. 43–49. [Google Scholar]
  2. Ngo, T.D.; Kashani, A.; Imbalzano, G.; Nguyen, K.T.; Hui, D. Additive manufacturing (3D printing): A review of materials, methods, applications and challenges. Compos. Part B Eng. 2018, 143, 172–196. [Google Scholar] [CrossRef]
  3. Kelbel, H.C.; Stoecker, L.; Frank, J.J.; Lukas, G.; Bergweiler, G.; Gries, T.; Greb, C.; Schuh, G. Applicability of Advanced Manufacturing Technologies for Agile Product Development in the Internet of Production: A Strategic Framework. J. Prod. Syst. Logist. 2022, 2, 1–19. [Google Scholar] [CrossRef]
  4. Colomo, A.G.; Wood, D.; Martina, F.; Williams, S.W. A comparison framework to support the selection of the best additive manufacturing process for specific aerospace applications. Int. J. Rapid Manuf. 2020, 9, 194. [Google Scholar] [CrossRef]
  5. Jalali, M.; Mohammadi, K.; Movahhedy, M.R.; Karimi, F.; Sadrnezhaad, S.K.; Chernyshikhin, S.V.; Shishkovsky, I.V. SLM Additive Manufacturing of NiTi Porous Implants: A Review of Constitutive Models, Finite Element Simulations, Manufacturing, Heat Treatment, Mechanical, and Biomedical Studies. Met. Mater. Int. 2023, 29, 2458–2491. [Google Scholar] [CrossRef]
  6. Bassoli, E.; Defanti, S.; Tognoli, E.; Vincenzi, N.; Degli Esposti, L. Design for Additive Manufacturing and for Machining in the Automotive Field. Appl. Sci. 2021, 11, 7559. [Google Scholar] [CrossRef]
  7. Chernyshikhin, S.V.; Pelevin, I.A.; Karimi, F.; Shishkovsky, I.V. The Study on Resolution Factors of LPBF Technology for Manufacturing Superelastic NiTi Endodontic Files. Materials 2022, 15, 6556. [Google Scholar] [CrossRef] [PubMed]
  8. Wang, P.; Robertson, G.; Gibson, B.T.; Fancher, C.M.; Reynolds, J.; Borish, M.; Cruz, J.R.; Chesser, P.; Stump, B.; Jackson, A.; et al. Improved Productivity with Multilaser Rotary Powder Bed Fusion Additive Manufacturing. 3D Print. Addit. Manuf. 2023, 1–11. [Google Scholar] [CrossRef]
  9. Liu, M.; Wei, K.; Yue, X.; Huang, G.; Deng, J.; Zeng, X. High power laser powder bed fusion of AlSi10Mg alloy: Effect of laser beam mode. J. Alloys Compd. 2022, 909, 164779. [Google Scholar] [CrossRef]
  10. De Souza, A.F.; Al-Rubaie, K.S.; Marques, S.; Zluhan, B.; Santos, E.C. Effect of laser speed, layer thickness, and part position on the mechanical properties of maraging 300 parts manufactured by selective laser melting. Mater. Sci. Eng. A 2019, 767, 138425. [Google Scholar] [CrossRef]
  11. Nguyen, Q.; Luu, D.; Nai, S.; Zhu, Z.; Chen, Z.; Wei, J. The role of powder layer thickness on the quality of SLM printed parts. Arch. Civ. Mech. Eng. 2018, 18, 948–955. [Google Scholar] [CrossRef]
  12. Gullane, A.; Murray, J.W.; Hyde, C.J.; Sankare, S.; Evirgen, A.; Clare, A.T. On the use of multiple layer thicknesses within laser powder bed fusion and the effect on mechanical properties. Mater. Des. 2021, 212, 110256. [Google Scholar] [CrossRef]
  13. Pelevin, I.A.; Ozherelkov, D.Y.; Nalivaiko, A.Y.; Bodyakova, A.I.; Chernyshikhin, S.V.; Zotov, B.O.; Korshunov, A.V.; Gromov, A.A. AlSi10Mg/AlN Interface Grain Structure after Laser Powder Bed Fusion. Metals 2022, 12, 2152. [Google Scholar] [CrossRef]
  14. Nalivaiko, A.Y.; Ozherelkov, D.Y.; Pelevin, I.A.; Chernyshikhin, S.V.; Medvedev, A.E.; Korshunov, A.V.; Arnautov, A.N.; Gromov, A.A. Comprehensive Study of the 3D Printing of Single Tracks and Cubic Samples by Selective Laser Melting of AlSi10MgCu Alloy. Met. Mater. Int. 2022, 28, 787–801. [Google Scholar] [CrossRef]
  15. de Leon Nope, G.; Perez-Andrade, L.; Corona-Castuera, J.; Espinosa-Arbelaez, D.; Muñoz-Saldaña, J.; Alvarado-Orozco, J. Study of volumetric energy density limitations on the IN718 mesostructure and microstructure in laser powder bed fusion process. J. Manuf. Process. 2021, 64, 1261–1272. [Google Scholar] [CrossRef]
  16. Ahmed, A.; Wahab, M.S.; Raus, A.A.; Kamarudin, K.; Bakhsh, Q.; Ali, D. Effects of Selective Laser Melting Parameters on Relative Density of AlSi10Mg. Int. J. Eng. Technol. 2016, 8, 2552–2557. [Google Scholar] [CrossRef]
  17. Ghio, E.; Cerri, E. Work hardening of heat-treated alsi10mg alloy manufactured by single and double laser selective laser melting: Effects of layer thickness and hatch spacing. Materials 2021, 14, 4901. [Google Scholar] [CrossRef] [PubMed]
  18. Liu, M.; Wei, K.; Zeng, X. High power laser powder bed fusion of AlSi10Mg alloy: Effect of layer thickness on defect, microstructure and mechanical property. Mater. Sci. Eng. A 2022, 842, 143107. [Google Scholar] [CrossRef]
  19. Paul, M.J.; Liu, Q.; Best, J.P.; Li, X.; Kruzic, J.J.; Ramamurty, U.; Gludovatz, B. Fracture resistance of AlSi10Mg fabricated by laser powder bed fusion. Acta Mater. 2021, 211, 116869. [Google Scholar] [CrossRef]
  20. Aboulkhair, N.T.; Maskery, I.; Tuck, C.; Ashcroft, I.; Everitt, N.M. On the formation of AlSi10Mg single tracks and layers in selective laser melting: Microstructure and nano-mechanical properties. J. Mater. Process. Technol. 2016, 230, 88–98. [Google Scholar] [CrossRef]
  21. Markl, M.; Körner, C. Multiscale Modeling of Powder Bed-Based Additive Manufacturing. Annu. Rev. Mater. Res. 2016, 46, 93–123. [Google Scholar] [CrossRef]
  22. Soundararajan, B.; Sofia, D.; Barletta, D.; Poletto, M. Review on modeling techniques for powder bed fusion processes based on physical principles. Addit. Manuf. 2021, 47, 102336. [Google Scholar] [CrossRef]
  23. Cook, P.S.; Murphy, A.B. Simulation of melt pool behaviour during additive manufacturing: Underlying physics and progress. Addit. Manuf. 2020, 31, 100909. [Google Scholar] [CrossRef]
  24. Körner, C.; Attar, E.; Heinl, P. Mesoscopic simulation of selective beam melting processes. J. Mater. Process. Technol. 2011, 211, 978–987. [Google Scholar] [CrossRef]
  25. King, W.; Anderson, A.; Ferencz, R.; Hodge, N.; Kamath, C.; Khairallah, S.; Rubenchik, A. Laser powder bed fusion additive manufacturing of metals; physics, computational, and materials challenges. Appl. Phys. Rev. 2015, 2, 041304. [Google Scholar] [CrossRef]
  26. Chernyshikhin, S.V.; Firsov, D.G.; Shishkovsky, I.V. Selective Laser Melting of Pre-Alloyed NiTi Powder: Single-Track Study and FE Modeling with Heat Source Calibration. Materials 2021, 14, 7486. [Google Scholar] [CrossRef] [PubMed]
  27. Khairallah, S.A.; Anderson, A. Mesoscopic simulation model of selective laser melting of stainless steel powder. J. Mater. Process. Technol. 2014, 214, 2627–2636. [Google Scholar] [CrossRef]
  28. Megahed, M.; Mindt, H.W.; Shula, B.; Peralta, A.; Neumann, J. Powder Bed Models—Numerical Assessment of As-Built Quality. In Proceedings of the 57th AIAA/ASCE/AHS/ASC Structures, Structural Dynamics, and Materials Conference, San Diego, CA, USA, 4–8 January 2016. [Google Scholar] [CrossRef]
  29. Lee, Y.; Zhang, W. Mesoscopic simulation of heat transfer and fluid flow in laser powder bed additive manufacturing. In Proceedings of the 2015 International Solid Freeform Fabrication Symposium, Austin, TX, USA, 10–12 August 2015; pp. 1154–1165. [Google Scholar]
  30. Jamshidinia, M.; Kong, F.; Kovacevic, R. The Coupled CFD-FEM Model of Electron Beam Melting® (EBM). In Proceedings of the ASME District F—Early Career Technical Conference, ECTC 2013, Birmingham, AL, USA, 2–3 November 2013. [Google Scholar] [CrossRef]
  31. Gürtler, F.J.; Karg, M.; Leitz, K.H.; Schmidt, M. Simulation of Laser Beam Melting of Steel Powders using the Three-Dimensional Volume of Fluid Method. Phys. Procedia 2013, 41, 881–886. [Google Scholar] [CrossRef]
  32. Yang, P.; Deibler, L.A.; Bradley, D.R.; Stefan, D.K.; Carroll, J.D. Microstructure evolution and thermal properties of an additively manufactured, solution treatable AlSi10Mg part. J. Mater. Res. 2018, 33, 4040–4052. [Google Scholar] [CrossRef]
  33. Krüger, T.; Kusumaatmaja, H.; Kuzmin, A.; Shardt, O.; Silva, G.; Viggen, E.M. The Lattice Boltzmann Method; Springer International Publishing: Berlin/Heidelberg, Germany, 2017; Volume 10, pp. 4–15. [Google Scholar]
  34. Thurey, N. Physically Based Animation of Free Surface Flows with the Lattice Boltzmann Method. Ph.D. Thesis, University of Erlangen, Erlangen, Germany, 2007. [Google Scholar]
  35. Janssen, C.; Krafczyk, M. A lattice Boltzmann approach for free-surface-flow simulations on non-uniform block-structured grids. Comput. Math. Appl. 2010, 59, 2215–2235. [Google Scholar] [CrossRef]
  36. Attar, E.; Körner, C. Lattice Boltzmann model for thermal free surface flows with liquid–solid phase transition. Int. J. Heat Fluid Flow 2011, 32, 156–163. [Google Scholar] [CrossRef]
  37. Thies, M. Lattice Boltzmann Modeling with Free Surfaces Applied to In-Situ Gas Generated Foam Formation. Ph.D. Thesis, University of Erlangen-Nuremberg, Erlangen, Germany, 2005. [Google Scholar]
  38. Markl, M.; Ammer, R.; Rüde, U.; Körner, C. Numerical investigations on hatching process strategies for powder-bed-based additive manufacturing using an electron beam. Int. J. Adv. Manuf. Technol. 2015, 78, 239–247. [Google Scholar] [CrossRef]
  39. Zakirov, A.; Belousov, S.; Bogdanova, M.; Korneev, B.; Stepanov, A.; Perepelkina, A.; Levchenko, V.; Meshkov, A.; Potapkin, B. Predictive modeling of laser and electron beam powder bed fusion additive manufacturing of metals at the mesoscale. Addit. Manuf. 2020, 35, 101236. [Google Scholar] [CrossRef]
  40. Knight, C.J. Theoretical modeling of rapid surface vaporization with back pressure. AIAA J. 1979, 17, 519–523. [Google Scholar] [CrossRef]
  41. Klassen, A. Simulation of Evaporation Phenomena in Selective Electron Beam Melting; FAU University Press: Boca Raton, FL, USA, 2018. [Google Scholar]
  42. Museth, K. VDB: High-resolution sparse volumes with dynamic topology. ACM Trans. Graph. (TOG) 2013, 32, 1–22. [Google Scholar] [CrossRef]
  43. Korneev, B.; Zakirov, A.; Bogdanova, M.; Belousov, S.; Perepelkina, A.; Iskandarova, I.; Potapkin, B. A numerical study of powder wetting influence on the morphology of laser powder bed fusion manufactured thin walls. Addit. Manuf. 2023, 74, 103705. [Google Scholar] [CrossRef]
  44. Bayat, M.; Mohanty, S.; Hattel, J.H. Multiphysics modelling of lack-of-fusion voids formation and evolution in IN718 made by multi-track/multi-layer L-PBF. Int. J. Heat Mass Transf. 2019, 139, 95–114. [Google Scholar] [CrossRef]
  45. Lee, Y.; Gurnon, A.K.; Bodner, D.; Simunovic, S. Effect of particle spreading dynamics on powder bed quality in metal additive manufacturing. Integr. Mater. Manuf. Innov. 2020, 9, 410–422. [Google Scholar] [CrossRef]
  46. Phua, A.; Doblin, C.; Owen, P.; Davies, C.H.; Delaney, G.W. The effect of recoater geometry and speed on granular convection and size segregation in powder bed fusion. Powder Technol. 2021, 394, 632–644. [Google Scholar] [CrossRef]
  47. Govender, N.; Wilke, D.N.; Kok, S. Blaze-DEMGPU: Modular high performance DEM framework for the GPU architecture. SoftwareX 2016, 5, 62–66. [Google Scholar] [CrossRef]
  48. KiSSAM Simulation Software for Additive Manufacturing Website. Available online: www.kissam.cloud (accessed on 28 November 2023).
  49. Nakapkin, D.S.; Zakirov, A.V.; Belousov, S.A.; Bogdanova, M.V.; Korneev, B.A.; Stepanov, A.E.; Perepelkina, A.Y.; Levchenko, V.D.; Potapkin, B.V.; Meshkov, A. Finding optimal parameter ranges for laser powder bed fusion with predictive modeling at mesoscale. In Proceedings of the Sim-AM 2019: II International Conference on Simulation for Additive Manufacturing, Pavia, Italy, 11–13 September 2019; pp. 297–308. [Google Scholar]
  50. Gliser Software by Additive Technology Software Solution. Available online: https://www.atssgroup.com/products/glicer (accessed on 28 November 2023).
  51. Mills, K. Recommended Values of Thermo-Physical Properties for Selected Commercial Alloys; Woodhead Publishing: Cambridge, UK, 2002. [Google Scholar]
  52. Wei, P.; Wei, Z.; Chen, Z.; He, Y.; Du, J. Thermal behavior in single track during selective laser melting of AlSi10Mg powder. Appl. Phys. A 2017, 123, 604. [Google Scholar] [CrossRef]
  53. Mukherjee, T.; Wei, H.; De, A.; DebRoy, T. Heat and fluid flow in additive manufacturing—Part II: Powder bed fusion of stainless steel, and titanium, nickel and aluminum base alloys. Comput. Mater. Sci. 2018, 150, 369–380. [Google Scholar] [CrossRef]
  54. Dou, L.; Yuan, Z.; Li, J.; Li, J.; Wang, X. Surface tension of molten Al-Si alloy at temperatures ranging from 923 to 1123 K. Chin. Sci. Bull. 2008, 53, 2593–2598. [Google Scholar] [CrossRef]
  55. Antoine, M.C. Nouvelle relation entre les tensions et les temperatures. C. R. Hebd. Seances Acad. Sci. Paris 1888, 107, 681–684. [Google Scholar]
  56. Huang, Y.; Fleming, T.G.; Clark, S.J.; Marussi, S.; Fezzaa, K.; Thiyagalingam, J.; Leung, C.L.A.; Lee, P.D. Keyhole fluctuation and pore formation mechanisms during laser powder bed fusion additive manufacturing. Nat. Commun. 2022, 13, 1170. [Google Scholar] [CrossRef] [PubMed]
  57. Cao, L. Workpiece-scale numerical simulations of SLM molten pool dynamic behavior of 316L stainless steel. Comput. Math. Appl. 2021, 96, 209–228. [Google Scholar] [CrossRef]
  58. Ur Rehman, A.; Mahmood, M.A.; Pitir, F.; Salamci, M.U.; Popescu, A.C.; Mihailescu, I.N. Keyhole Formation by Laser Drilling in Laser Powder Bed Fusion of Ti6Al4V Biomedical Alloy: Mesoscopic Computational Fluid Dynamics Simulation versus Mathematical Modelling Using Empirical Validation. Nanomaterials 2021, 11, 3284. [Google Scholar] [CrossRef] [PubMed]
  59. Khairallah, S.A.; Sun, T.; Simonds, B.J. Onset of periodic oscillations as a precursor of a transition to pore-generating turbulence in laser melting. Addit. Manuf. Lett. 2021, 1, 100002. [Google Scholar] [CrossRef]
  60. Stokes, M.A.; Khairallah, S.A.; Volkov, A.N.; Rubenchik, A.M. Fundamental physics effects of background gas species and pressure on vapor plume structure and spatter entrainment in laser melting. Addit. Manuf. 2022, 55, 102819. [Google Scholar] [CrossRef]
  61. Reijonen, J.; Revuelta, A.; Riipinen, T.; Ruusuvuori, K.; Puukko, P. On the effect of shielding gas flow on porosity and melt pool geometry in laser powder bed fusion additive manufacturing. Addit. Manuf. 2020, 32, 101030. [Google Scholar] [CrossRef]
  62. Wang, Y.; Guo, W.; Xie, Y.; Li, H.; Zeng, C.; Xu, M.; Zhang, H. In-situ monitoring plume, spattering behavior and revealing their relationship with melt flow in laser powder bed fusion of nickel-based superalloy. J. Mater. Sci. Technol. 2024, 177, 44–58. [Google Scholar] [CrossRef]
  63. Blender Online Community. Blender—A 3D Modelling and Rendering Package; Blender Foundation, Stichting Blender Foundation: Amsterdam, The Netherlands, 2018. [Google Scholar]
  64. Zhou, X.; Liu, X.; Zhang, D.; Shen, Z.; Liu, W. Balling phenomena in selective laser melted tungsten. J. Mater. Process. Technol. 2015, 222, 33–42. [Google Scholar] [CrossRef]
Figure 1. SEM image (left) and particles size distribution (right) of the AlSi10Mg powder.
Jmmp 08 00007 g001
Figure 2. Cross-sections of the melt pool along the laser movement at the time t. The distance between yellow tics is 0.1 mm.
Jmmp 08 00007 g002
Figure 3. Longitudinal cross-section of a single track obtained via experiment (top) and simulation (middle) for the P = 375 W and v = 600 mm/s. Numerically obtained absorption as a function of distance traversed by the laser spot for all scanning velocities at a laser power of P = 375 W (bottom).
Jmmp 08 00007 g003
Figure 4. Comparison of the track widths and depths obtained in the simulation and in the experiments.
Jmmp 08 00007 g004
Figure 5. Transverse cross-sections for cast and LPBF substrates compared to calculated morphology. The units of rulers are in mm.
Jmmp 08 00007 g005
Figure 6. Electron image of single track’s cross-section on the LPBF and cast substrates with EDS chemical mapping.
Jmmp 08 00007 g006
Figure 7. Powder distribution properties in simulation.
Jmmp 08 00007 g007
Figure 8. The 7 × 4 mm 2 simulation domain before the laser scan. (Left) H = 50 µm. (Right) H = 80 µm.
Jmmp 08 00007 g008
Figure 9. Rendered results: top view of the simulated tracks obtained on the powder bed with corresponding transverse cross-sections ( x = 2.3 mm) obtained for different layer thickness ( H ) . P = 350 W, v = 0.9 m/s.
Jmmp 08 00007 g009
Figure 10. Track geometry parameters dependency on the powder layer thickness for P = 350 W.
Jmmp 08 00007 g010
Figure 11. Illustration of the lack of fusion criteria formulation. The solid blue line represents the substrate level at the current (i-th) layer, the solid black line is the substrate level shifted up by P s , and the dashed black line denotes the powder height for the next ( i + 1 )-th layer which is used for the first criterion. The dotted blue line represents the height profile at the i-th layer. The red and the green lines denote the maximum and the minimum depth of the melt, respectively, which are used for criteria 2 and 3.
Jmmp 08 00007 g011
Figure 12. Lack of fusion figure of merit (FoM) based on the single track analysis for P = 350 W and the scan speeds 0.9 m/s, 1.0 m/s, and 1.2 m/s and different powder thicknesses. The FoM for criterion 1 is the value H + P s h min H crit , for the criterion 2: FoM = P s D max h min and for the criterion 3: FoM = P s D max h min . We expect the absence of the lack of fusion porosity if the FoM < 0.
Jmmp 08 00007 g012
Table 1. Processing parameters set for single tracks and substrate manufacturing.
AssignmentLPBF Process ParameterValues
LPBF substrate manufacturingLaser power, W350
Scanning speed, mm/s1200
Layer thickness, um30
Hatch distance, µm80
Scanning strategyMeander-off
Rotation of hatching angle, °67
Beam compensation, µm50
Contour distance, µm100
Number of contour scans1
Oxygen content, ppm<100
Single-tracks analysisLaser power, W325, 350, 375
Scanning speed, mm/s300, 600, 900, 1200
Table 2. The thermophysical properties of AlSi10Mg alloy. T is the temperature in K.
Density at T l i q , kg/m 3 2500
Viscosity, m 2 /s 10 6
Liquidus temperature, K867
Solidus temperature, K831
Surface tension, N/m 1.00 1.52 × 10 4 T
Wetting angle with substrate surface, °0
Wetting angle with powder particles, °120
Diffusivity at solid phase, m 2 /s 7.40 × 10 5 3.00 × 10 8 T
Diffusivity at liquid phase, m 2 /s 1.88 × 10 5 + 6.43 × 10 9 T
Isobaric volumetric heat capacity, J/m 3 /K 2.3 × 10 6 , if 0 < T 600   K 2.5 × 10 6 , if 600   K < T 800   K 2.75 × 10 6 , if 800   K < T 867   K 2.6 × 10 6 , if T > 867   K
Absorption coefficient for solid phase0.1
Absorption coefficient for liquid phase 8.86 × 10 2 + 2.38 × 10 5 T
Latent heat of melting, J/m 3 1.06 × 10 9
Evaporation coefficients in (1):
A10.917
B16,211.0
C0
Disclaimer/Publisher’s Note: The statements, opinions and data contained in all publications are solely those of the individual author(s) and contributor(s) and not of MDPI and/or the editor(s). MDPI and/or the editor(s) disclaim responsibility for any injury to people or property resulting from any ideas, methods, instructions or products referred to in the content.

