Article

Droplet Formation and Energy Input during Induction Wire Melting with Pulsed and Constant Generator Power

1
Institute for Machine Tools and Production Processes (IWP), Chemnitz University of Technology, Reichenhainer Straße 70, 09126 Chemnitz, Germany
2
Institute for Joining and Assembly (IFMT), Chemnitz University of Technology, Reichenhainer Straße 70, 09126 Chemnitz, Germany
*
Author to whom correspondence should be addressed.
J. Manuf. Mater. Process. 2024, 8(2), 80; https://doi.org/10.3390/jmmp8020080
Submission received: 1 March 2024 / Revised: 4 April 2024 / Accepted: 15 April 2024 / Published: 18 April 2024

Abstract

:
Induction heating is a fast, reproducible, and efficient heating method used in various manufacturing processes. However, there is no established additive manufacturing (AM) process based on induction heating using wire as feedstock. This study investigates a novel approach to AM based on inductive heating, where a steel wire is melted and droplets are detached periodically using a two-winding induction coil. The process parameters and energy input into the droplets are characterized. The induction generator exhibits a sluggish response to the excitation voltage, resulting in a lag in the coil current. The process is captured using a high-speed camera, revealing a regular droplet formation of 14 Hz and uniform shapes and sizes between 2.11 and 2.65 mm in diameter when operated within an appropriate process window. Larger drops and increased spatter formation occur outside this window. The proposed method allows for the production of droplets with almost spherical shapes. Further analysis and characterization of droplet formation and energy input provide insights into process optimization and indicate an overall efficiency of approximately 10%.

1. Introduction

Over the past few years, additive manufacturing (AM) technologies have seen significant advancements and are becoming established manufacturing methods in more and more industries [1,2]. Beside technical applications, systems based on the principle of fused filament fabrication (FFF) for polymer processing have now found their way into many private households [3]. However, the processing of metals is often of a higher interest for technical purposes due to their superior mechanical properties, thermal, and electrical conductivity and resistance to environmental factors. Laser powder bed fusion (LPBF) is particularly suitable for small-volume components with complex geometries and has been able to establish itself in recent years as a widely used manufacturing process for a wide variety of material groups, such as steel-, aluminum-, titanium-, magnesium- and nickel-based alloys [4,5,6,7]. However, the cost-effective production of large-volume components using LPBF or other powder-based processes still poses a challenge [8]. For this purpose, wire-based processes like wire arc additive manufacturing (WAAM) and laser metal deposition (LMD) are more suitable, as they have higher build-up rates, but achieve a lower geometric resolution than powder bed processes [9,10]. In addition to the energy sources arc and laser, induction heating is another heating method that is fast, reproducible, contactless, and efficient [11]. The unique advantages of this technology have already been utilized in many different manufacturing processes [12,13,14]. However, there is still no established AM process based on the principle of induction heating using wire as feedstock. Nevertheless, various approaches concerning that matter have already been investigated. Vega [15] and Fang [16] use low-melting materials that are melted inside a crucible. Using gas pressure, the melt is extruded through a nozzle and deposited onto the substrate. Vega showed that the extruded melt forms a jet with a diameter roughly corresponding to the diameter of the nozzle orifice. Shortly after the jet emerges, it breaks up into regular droplets due to axial symmetric wave formation. The droplet diameters achieved were approximately twice the jet diameter. Fang, on the other hand, used a small distance to the substrate similar to FFF. In this process, no droplets are formed, but the material emerges from the nozzle and directly touches the substrate, thus forming a structure similar to a cladding weld. This enables the production of single-walled components with multiple layers and a good surface finish [17]. Another approach is taken by Jayant [18], who also works with a low melting temperature material, holding it in a crucible and applying it drop-by-drop through a nozzle by means of a vibration motor operating at 130 Hz. Inside the structures created by this method, bonding defects occur between the individual drops, but these can be reduced by increasing the crucible temperature, allowing multilayer structures. In contrast to the previously mentioned processes using brazing alloys, the work of Sharma [19] used AlSi5 type aluminum welding wire. The process is very similar to FFF and utilizes a nozzle made of cast iron. By inductively heating this 55 mm long nozzle, the aluminum wire passing through is slowly brought into a liquid state and deposited onto a substrate. Finding a stable process window resulted in the generation of four-layer structures [20]. Englert [21] and colleagues used an approach to inductively heat an aluminum wire without using a nozzle to conduct thermal energy. In this process, the wire is directly heated, but not completely melted; rather, it is heated to a temperature within the melting interval by a single-winding inductor. The semi-solid material is then deposited onto a non-preheated build plate without any additional application of force. Similar to the FFF process, the material transition is continuous rather than drop-shaped. The printing of multilayered cubes was achieved by decreasing the generator power as the number of layers increased. Hascoët [22] and colleagues used a single-winding inductor to melt stainless steel wire 316 L on the one hand, and simultaneously preheated the substrate, thus achieving adhesion on the other. Due to the small coupling distance between the coil and the substrate, only single tracks are possible and not a planar deposition. By choosing suitable parameters, a continuous material transfer was achieved to generate a three-layer structure. Sun [23] used a laser to preheat a substrate of 316 L to deposit an Inconel 625 wire onto it using an induction coil. The laser, which was used only to heat the substrate, was focused to a spot diameter of 6 mm and operated at a power of 800 W. Using this procedure, multilayer walls could be built without obvious imperfections [24]. Table 1 provides an overview of the process approaches mentioned.
In a previous work, a different approach to additive manufacturing based on inductive heating was presented [31]. In this process, a steel wire is passed through a two-winding inductor and melted directly without a heat transfer contact element. Due to a periodic pulsation of the coil current, the Lorentz forces directed towards the center axis of the wire also oscillate. In the phase of lower base current, the wire is preheated to the liquid-melt state. When the current subsequently increases to a higher pulse current, the forming droplet is overheated and detached from the end of the wire. Using specific current pulsation, drops can be continuously detached from the free end of the wire in a similar way to pulsed gas metal arc welding (GMAW-P) [32]. Figure 1 shows the principle of the process approach.
Until now, only the heating of the wire and the generation of material deposition have been investigated. A challenge when using steel is the bonding of the material to the substrate. The majority of the cited studies did not include the preheating of the base material in their investigations [18,19,21]. However, they also did not examine steel materials, but rather alloys with lower melting temperatures. Studies involving higher-melting alloys utilized a local preheating through induction or laser [22,24]. The local preheating of the substrate by the same induction coil used for melting did not result in a complete bond between the material deposit and the base material [31]. Heating the entire substrate using a second inductor working at a lower frequency partially improved bonding but did not fully resolve this issue, which is why this aspect is the subject of current research [33]. However, other crucial characteristics of the process, such as droplet formation and dripping behavior, have not been examined in detail so far. To better understand the process of melting and material transfer, the focus of the present work is on the characterization of the droplet formation as well as the energy input into the generated droplets. The aim is to show how the droplets form at different generator powers, what their temperatures are, and what the overall efficiency can be assumed.

2. Materials and Methods

A conventional steel wire EN ISO 14341-A:G3Si1 (1.5125) with a diameter of 1.6 mm was used as feedstock material. It is a common type of welding wire for gas metal arc welding (GMAW) of mild and low-alloy steel. The chemical composition is shown in Table 2.
Figure 2 shows the main components of the technique studied in this work and the experimental equipment used for analysis. The wire was fed at a rate of 2.15 m/min by a TBi robot torch, including the wire feeder PP2R, and passed through a two-winding induction coil. The heating area of the wire needs to be locally confined so that it melts and drips at a defined location, as the process does not involve a nozzle or other susceptor. Previous studies indicated that the required power was significantly higher with a single winding, and with three windings, the heating area became too indefinite; therefore, two windings were chosen for the induction coil. The coil is made of a hollow copper profile with a cross-section of 4 × 2 mm2 and has an inner diameter of 5 mm. To achieve a smooth and constant wire feed rate, the wire feeder was controlled with a Joy-IT RD6006 laboratory power supply. The inductor was mounted on a Himmelwerk SINUS 102 high-frequency induction generator with a working frequency of 1–2 MHz and a total high-frequency power output of 10 kW. The resulting frequency of the generator with the matching capacitor configuration of 100 nF was 1.4 MHz. An oscillating voltage signal between 0 V (indicating 0%) and 10 V (indicating 100%) generated by a Rigol DG822 function generator was used to regulate the power of the SINUS 102. For this purpose, rectangular and sinusoidal waveforms were utilized for generator control in order to accurately manipulate the electrical output and ensure the reproducibility of experimental results. An active current probe was mounted on the induction coil for measurement of the current flowing through the inductor without disturbing it. The probe was connected to a Rohde & Schwarz RTB2002 oscilloscope, which captured and recorded the current waveform during the tests. Synchronously to this, the oscilloscope recorded the signal of the function generator in order to be able to derive conclusions about the response behavior of the induction generator later. This type of measurement can provide information about any signal distortion characteristics or sluggishness of the generator and help identify problems or limitations. With the aid of an intermediate measuring interface and a National Instruments USB-6001, the current and voltage characteristics of each of the three phases were measured and recorded. Thus, the power consumption of the induction generator system could be determined on the measurement computer. The droplets generated fell into a drop calorimeter filled with water. The calorimeter is equipped with two high-precision thermocouples of type Pt100 1/10 DIN agnetic stirrer is used to circulate the water in order to ensure rapid and uniform heat exchange within the fluid. A tray is integrated inside the calorimeter to capture the solidified droplets, which can be collected for further analysis after the experiments [35]. The total drop mass is derived after the tests by drying and then weighing with a precision scale. Using the measured temperature increase in the water volume inside the calorimeter, the amount of heat introduced and the average droplet temperature can then be determined, respectively. In addition to the water, the droplets also heat the tray, the magnetic stirrer, and part of the calorimeter vessel, which accounts for about 9 % of the total energy introduced [36]. Consequently, these specific heat quantities must be included in the calculation of the heat input Q c a l as follows:
Q c a l = 1 n ( c n · m n · Δ T )
where c is the specific heat capacity, m is the mass, and Δ T is the temperature rise of the system. The thermophysical properties of the wire were calculated using the material simulation software JMatPro v. 6.1 based on the chemical composition [37]. The average specific heat capacity of the unalloyed steel wire G3Si1 in the temperature range between 25 and 1550 °C is 0.685 J · ( g · K ) 1 . Consequently, this value is assumed for the generated droplets and their heat quantity can be approximately calculated as follows:
Q d = c d · m d · ( T d T 0 )
where m d is the mass of all droplets, T d is the droplet temperature, and T 0 is the initial temperature of the water inside the calorimeter system. The droplet temperature is finally calculated by equating the heat quantities of (1) and (2) and then rearranging for T d as follows:
T d = 1 n ( m n · c n · Δ T ) c d · m d + T 0
Subsequently, particle analysis was carried out using the open-source software ImageJ to obtain valuable information about the particles, such as their number and size [38]. For this purpose, the dried droplets were spread on a white background and captured using a DSLR camera Nikon D750 equipped with an AF-S NIKKOR 24–120 mm. Frontal flash photography was utilized to avoid any shadowing effects and associated distortion of the measurement data, and the resulting images were rectified using Adobe Camera Raw software to eliminate any lens-related aberrations. Subsequently, the corrected images were imported into ImageJ software, and a particle analysis function was employed. The data were processed and visualized with MATLAB to generate a size distribution histogram, study the uniformity of the drops and for further interpretation, and analysis [39]. The experiments were recorded with an Allied Vision Alvium-508c process camera that is equipped with a Sony IMX250 CMOS. By recording the process at a frame rate of 400 fps, it is possible to capture the subtle details of the droplet formation and obtain insights into its dynamics. No shielding gas was used during the trials. However, it can be assumed that the use of shielding gas in later stages will alter the surface tension of the melt and, consequently, its dynamic behavior, thus may differ from the findings presented here. The same applies particularly to the microstructure and mechanical properties, which, however, are not part of these investigations.

3. Results and Discussion

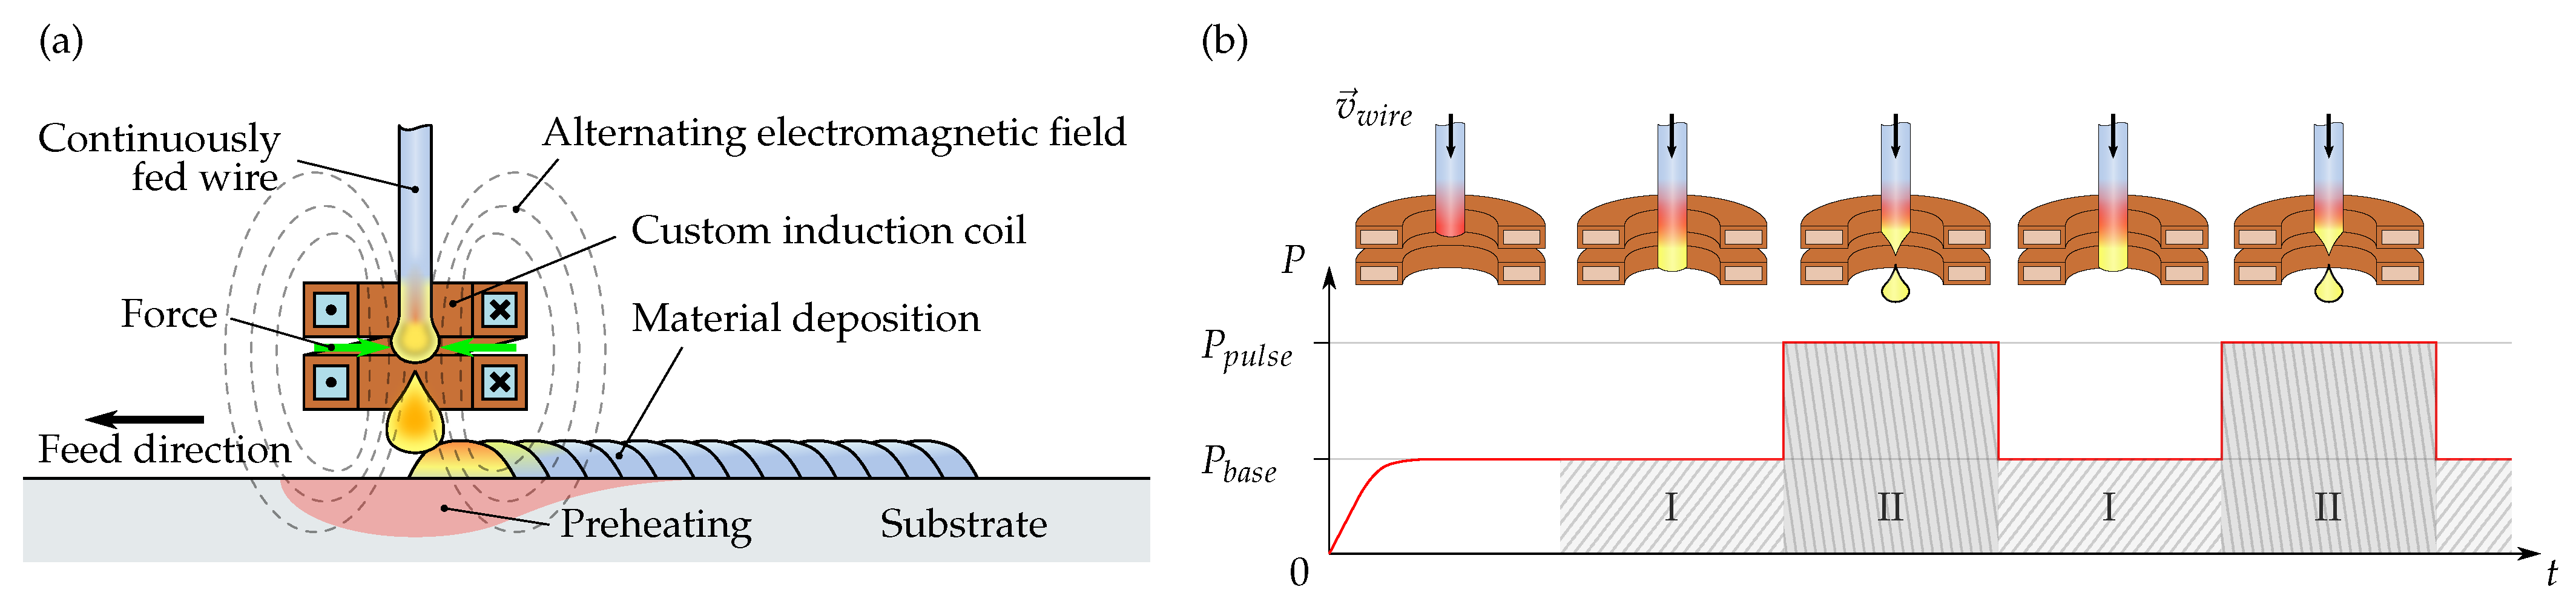
3.1. Generator Response Behavior

In comparing the excitation voltage of the function generator to the resulting coil current, it is evident that the system of the induction generator and the resonant circuit system exhibits a sluggish response at the chosen pulse frequencies of between 7 and 14 Hz, preventing it from reproducing the input signal even remotely. The damping present in the oscillating circuit of the induction generator, coupled with its internal circuit topology, causes the current measured in the induction coil to lag behind the input signal. This behavior is observed for both the rectangular and sinusoidal excitation voltages, as depicted in Figure 3 for a frequency of 7 Hz.
When comparing the two curves of a coil current, it is evident that a sinusoidal excitation voltage exhibits a smoother profile compared to a rectangular excitation voltage with steep edges. At the falling edge of the rectangular signal, the generator also manages to achieve a rapid decrease in output power. Conversely, during the rising edge, a very gradual increase in the output power is observed. This implies that the induction generator system is capable of reacting much faster to a decrease in power than to an increase. Furthermore, the measurement results suggest that at control frequencies above 10 Hz combined with larger amplitudes, the maximum specified power cannot be achieved by the generator before the excitation voltage starts to decrease again. Additionally, it becomes apparent that, on the one hand, a smaller difference between the high and low levels of the excitation signal, and on the other hand, a high frequency of the excitation oscillation leads to an increasingly indistinguishable base and pulse current. For both types of excitation voltage, the oscillation of the coil current is asymmetric, thus the negative amplitude is significantly higher than the positive amplitude. The response behavior of the induction generator could not be analyzed over the whole excitation voltage range from 0 to 10 V. The reason for this is that the change in current (RMS-value) over time exceeds the threshold of the current probe at an excitation voltage of 7 V (i.e., 70% of the generator power) or more at the given frequency.

3.2. Droplet Formation and Detachments

The use of a stopped-down lens during recording, combined with the short exposure time resulting from the high frame rate, limits the visible field to the glowing wire and reflections, rendering the surrounding environment black in the images. Despite the insights that can be derived from the data captured by the camera, the partial occlusion of the wire tip by the induction coil restricts the possibilities for detailed analysis. Thus, depending on the selected process parameters, the area of the wire where droplet detachment occurs may be obscured. Figure 4 illustrates the camera view and the resulting shot of the wire.
The recorded data demonstrate that the high frame rate of the camera is sufficient to capture the process in slow motion, including the wire feed movement, the melting of the wire, the droplet formation, and the detachment. When the technology is operated within an appropriate process window, the droplet formation is highly regular and the resulting droplets are uniform in size and shape. Outside the favorable process window, comparatively larger drops form in some cases and detach from the wire end at irregular intervals. In addition, the movement of the melt at the end of the wire increases and spatter formation becomes more intense. The formation and detachment of droplets entail a complex interplay of various mechanisms, such as Lorentz force, gravitational force, and surface tension of the melt, which can only be depicted phenomenologically based on the film recordings. Since the described factors are difficult to capture with measurement techniques, a better classification and investigation of these variables would be possible, for example, using a multiphysically coupled finite element model.
Figure 5 exemplifies a sequence of images corresponding to a favorable set of parameters (60–70% generator power, 7 Hz pulse frequency), wherein a regular and uniform droplet detachment is observed. The moments of droplet detachment exhibit temporal scattering of less than 10 ms. Furthermore, the observed droplet sizes appear consistent, although their assessment is somewhat limited due to the low dynamic range in the capture area and the reduced resolution resulting from the close focusing distance of the installed lens and the necessary cropping. The location at which the molten wire end is constricted and the droplets detach is approximately at the height of the lower coil winding. At this generator power level, the droplet detachment frequency is 14 Hz.
The experiments with a constant power, however, demonstrated that uniform droplet detachment can occur even without power pulsation. The detachment frequency increases with an increasing generator power P g e n up to a certain power level, denoted as P c r i t (approximately 65% in these experiments). For P g e n < P c r i t , lower droplet detachment frequencies are observed compared to P g e n = P c r i t . Beyond this critical point, increasing the generator power P g e n > P c r i t no longer leads to an increase in the detachment frequency. However, the detachment process becomes more turbulent, and the molten flow intensifies. Since the detachment frequency remains constant, the residence time of the droplets at the wire end is the same as at the lower power level P c r i t . Consequently, they experience increased heating, resulting in a comparatively higher temperature at the moment of detachment. This is recognizable by the brighter glow of the droplets. An exemplary droplet detachment for P g e n > P c r i t is depicted in Figure 6. The droplet size and the detachment process itself are comparable to those described earlier in Figure 5.
Figure 7 displays the sequence of images from an experiment with pulsed generator power where the average power P a v theoretically lies at P a v = P c r i t . However, due to the previously described inertia of the generator, it practically falls below P c r i t . As a result, a substantially lower droplet detachment frequency of approximately 2 Hz and an irregular melting behavior are observed. The temporal scattering of the detachments at around 300 ms is significantly higher than in the previously described case, indicating that the droplet formation is comparatively more stochastic. Due to the lower power level, the region where the wire constricts and the droplet detaches is located well below the induction coil, likely triggered primarily by the gravitational force of the droplet. The energy supplied to the continuously fed wire is not sufficient to fully melt and detach it within the induction coil. Furthermore, the comparatively weaker luminosity of the droplets suggests that a lower droplet temperature is present compared to those shown in Figure 5 and Figure 6. Overall, the detachment process is more random, with the free end of the wire pinching at two points, and the molten droplets exhibiting more movement. It is conceivable that in this case, the power pulsation may have a rather adverse effect on the regularity. Figure 8 shows a sequence of images depicting a slow droplet formation and detachment at P g e n < P c r i t . Although the material of the fed wire can be melted, the power is insufficient for rapid detachment. As a consequence, large-volume droplets form and detach from the wire end only at a late stage and below the induction coil. The droplet detachment frequency at this generator power level is 4.7 Hz. Compared to the droplets in Figure 7, it can be assumed that there is a higher temperature and thus a higher average power. There is only one point of constriction, and the temporal spread of detachments is less than 30 ms, thus significantly lower.
The analysis of the camera recordings shows that the frequencies of droplet detachment, both in a constant power and pulsed operation, exceed the practically achievable pulse frequency of the generator technology used. The power decreases rapidly on the falling edge, but the power increases too slowly on the rising edge. To beneficially influence the process of droplet detachment through pulsed induction coil current, the authors see the need for adjustments in the circuit topology of the induction generator. It is expected that a reliable power pulsation with a pulse frequency at least above the droplet detachment frequency is needed to have a positive influence on the process. Otherwise, the power pulsation may rather lead to negative effects and process instabilities, and a constant power supply might be the better option. This could also be validated using a multiphysics-coupled FE model.

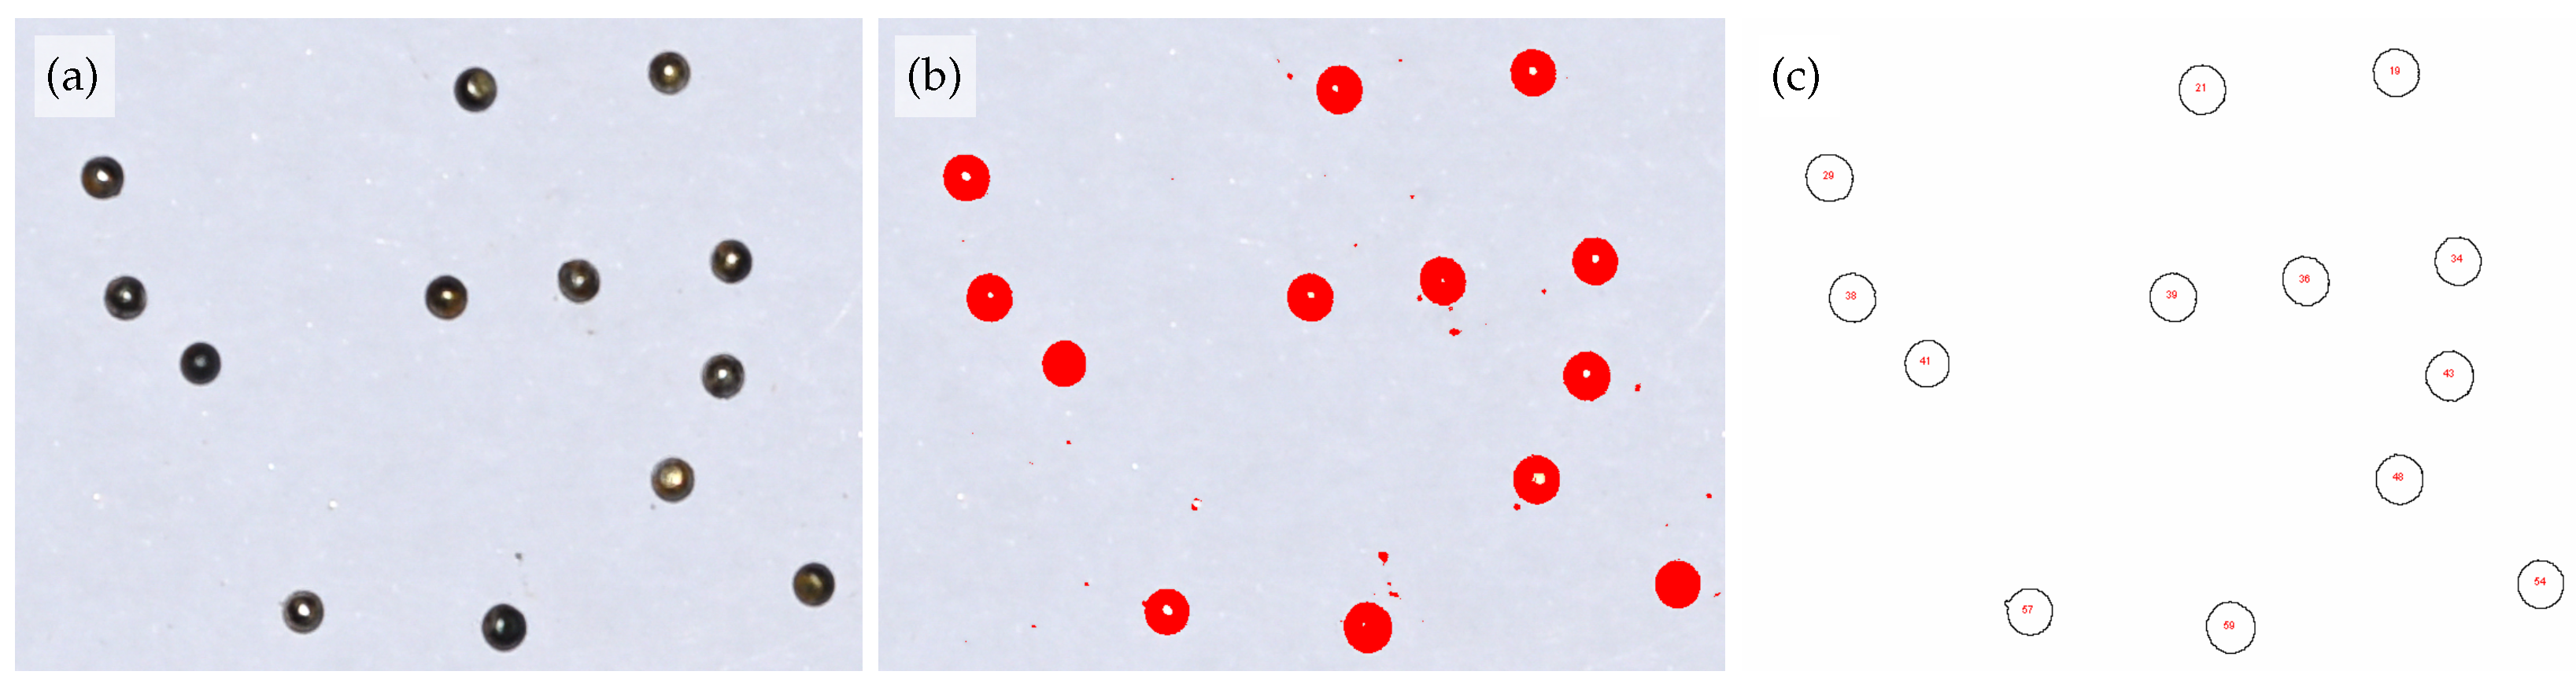
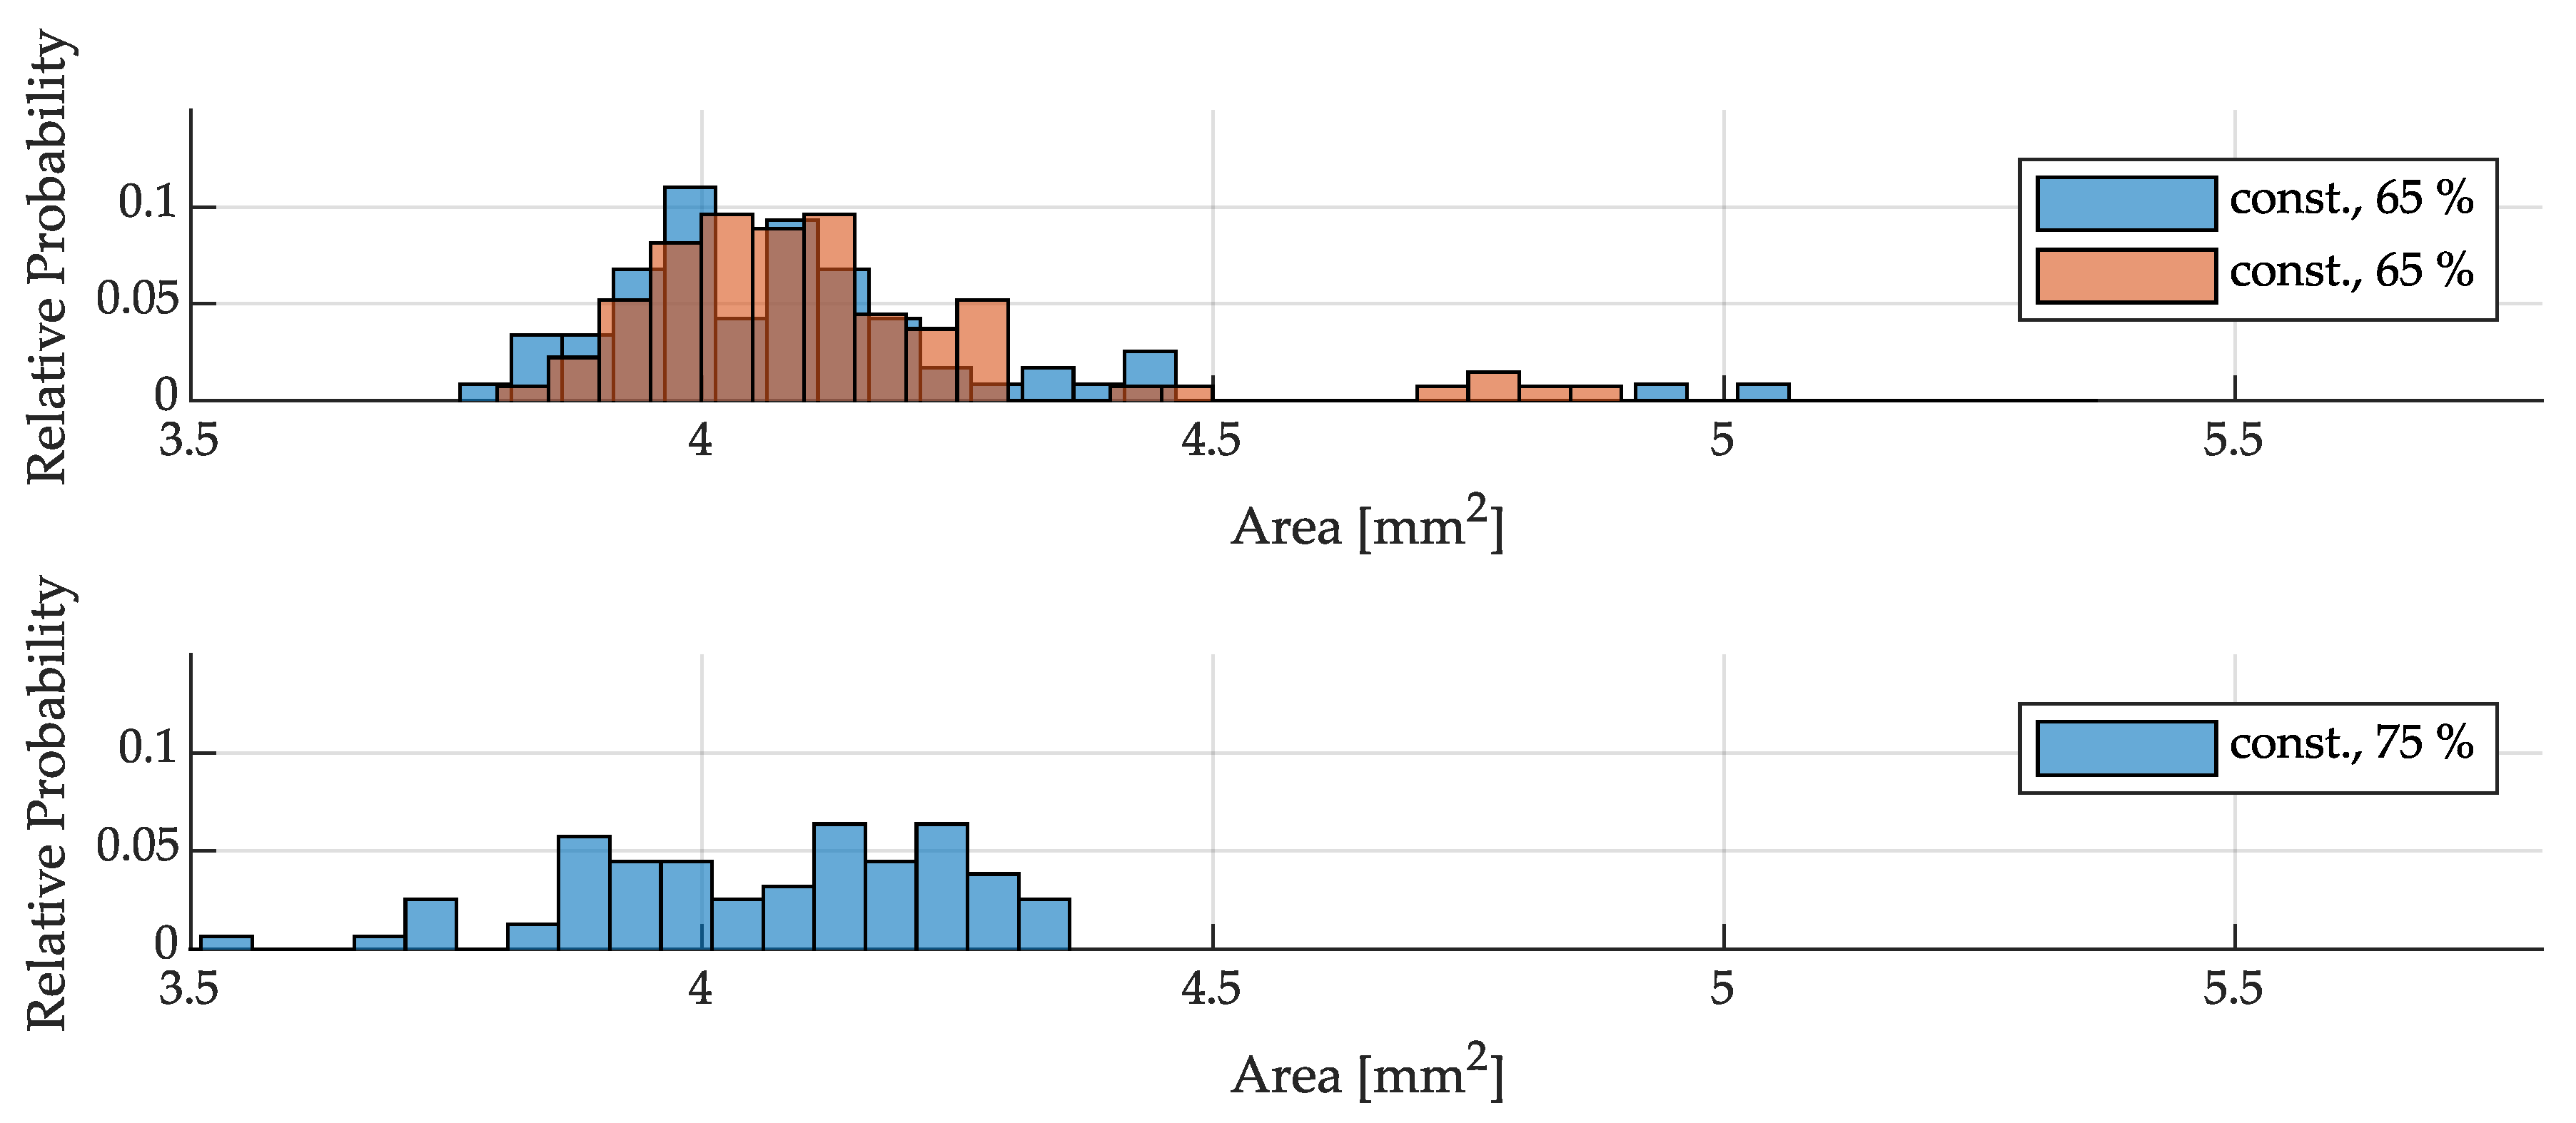
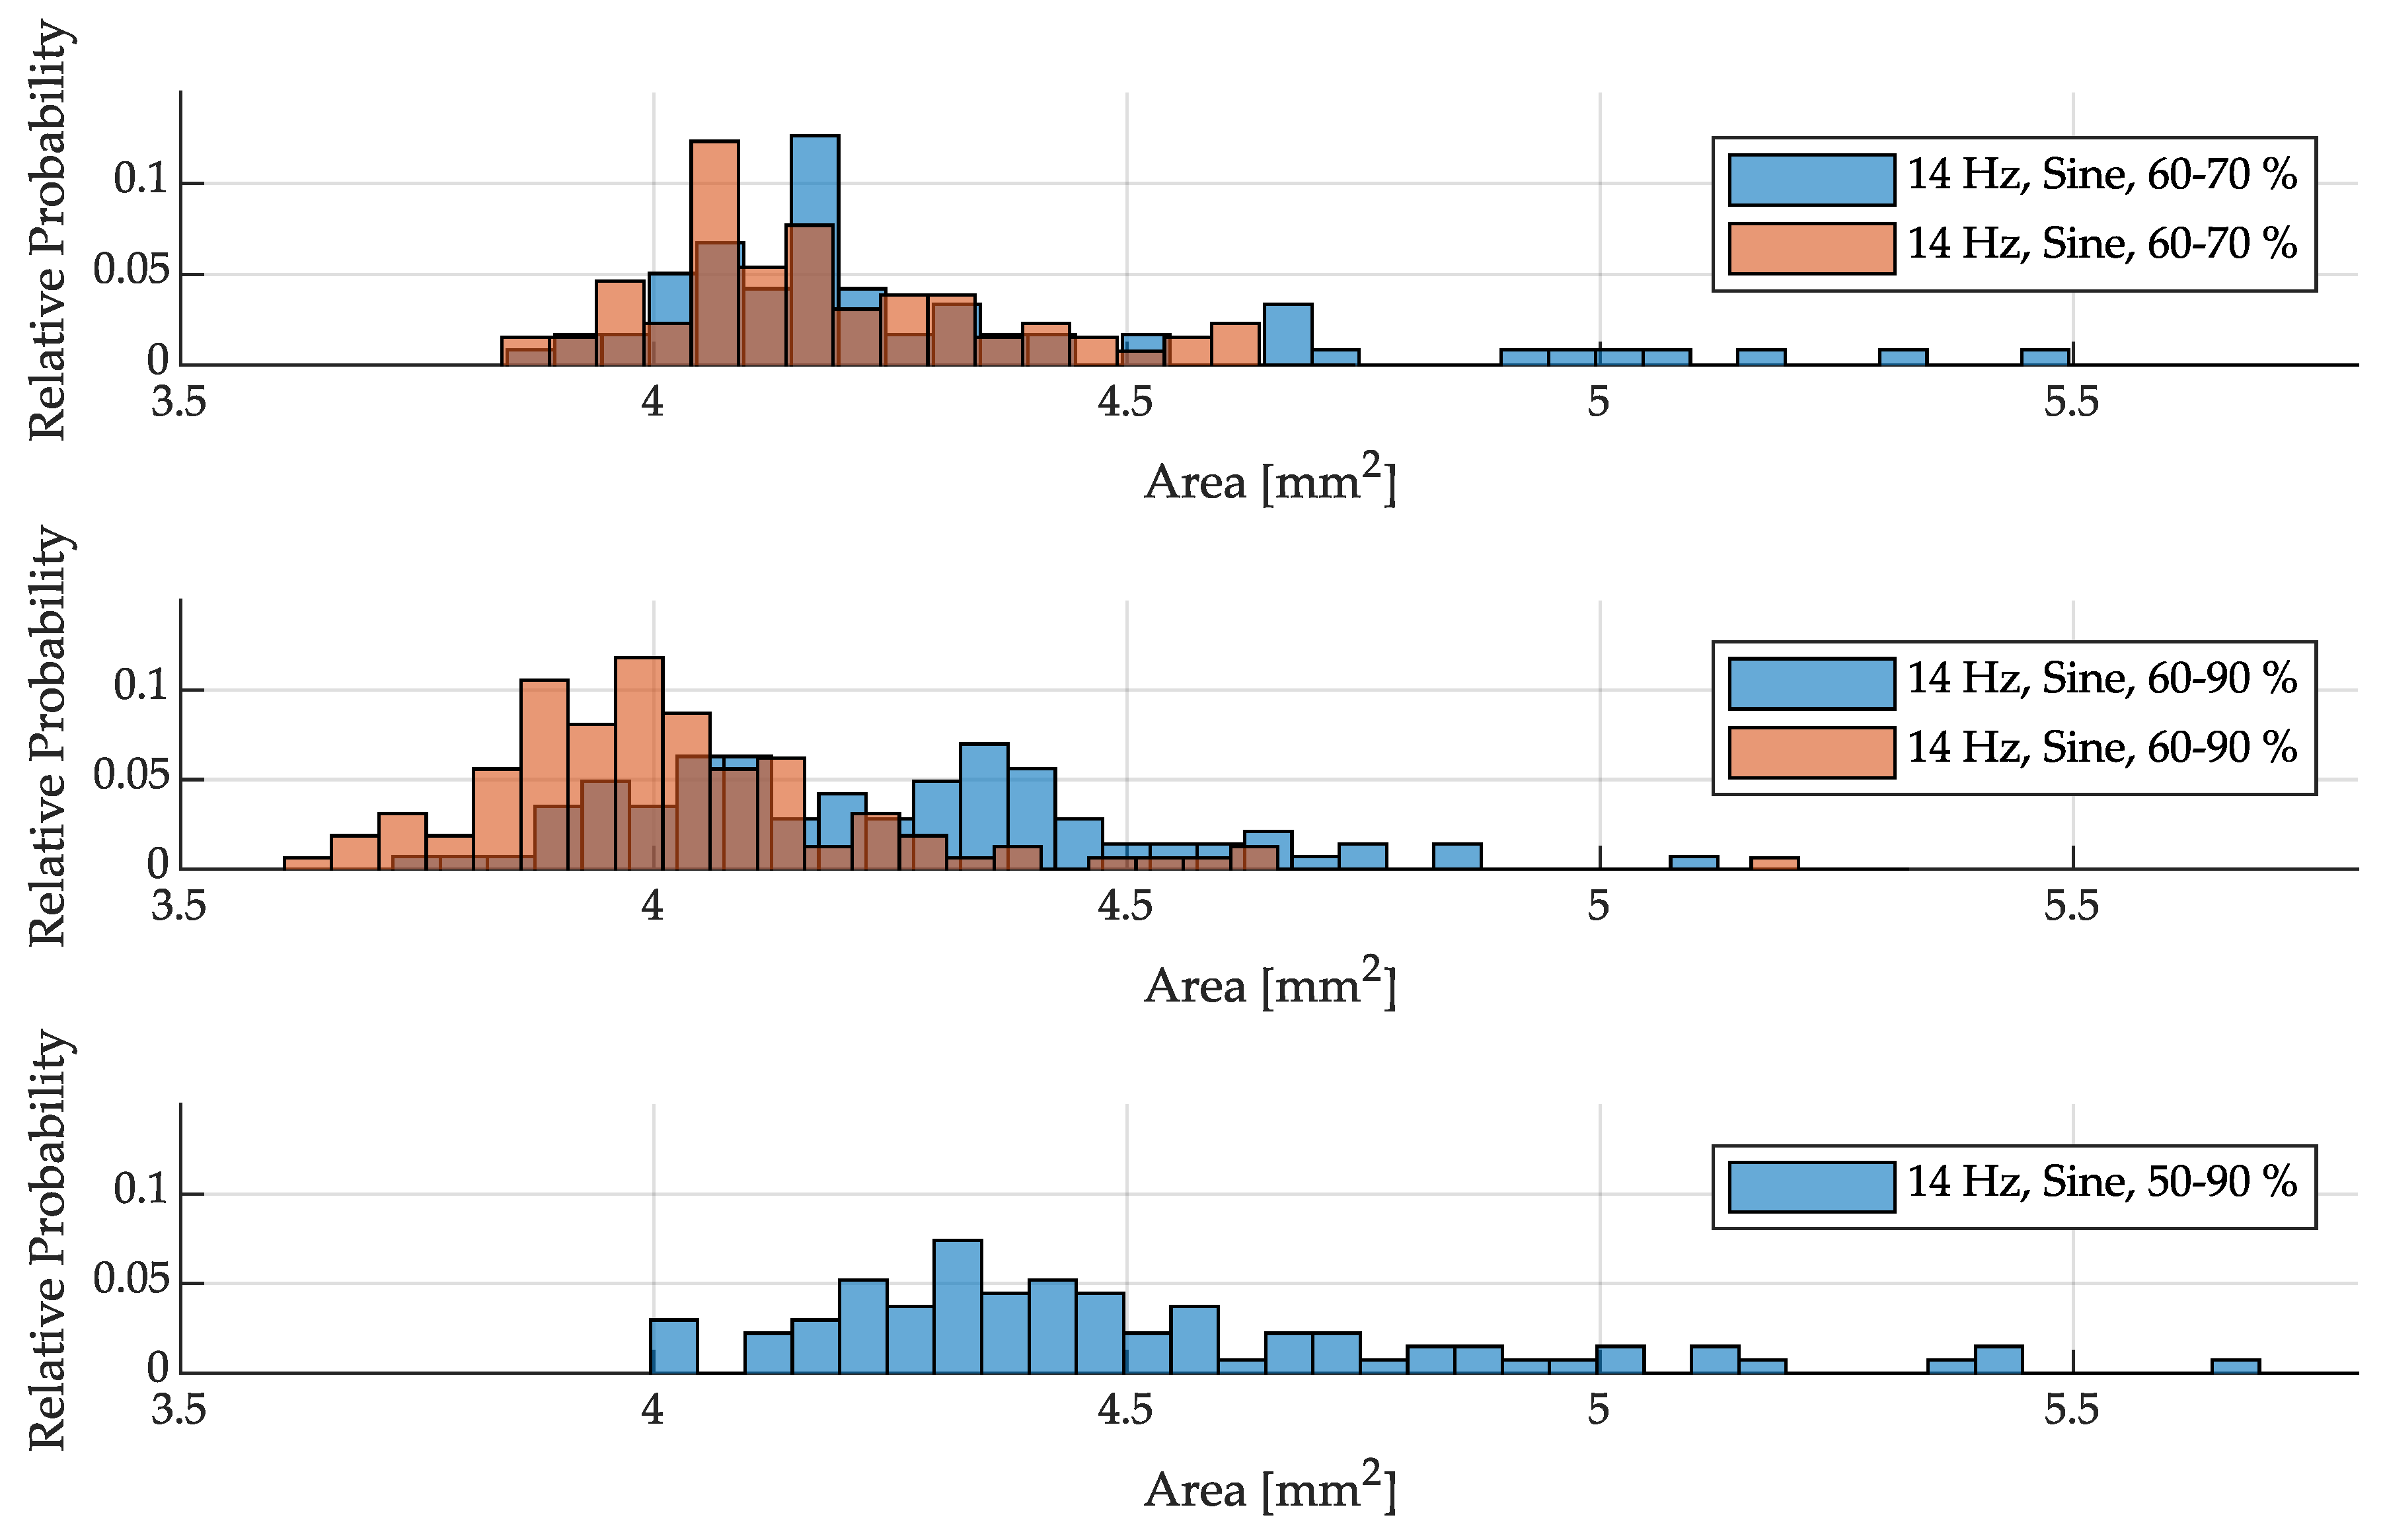
3.3. Size Distribution of Drops

Based on a visual analysis with the naked eye, it is evident that the detached droplets possess an almost spherical shape. Consequently, it can be inferred that the described method allows for the sufficient determination and comparability of droplet sizes and their volumes. Figure 9 exemplarily provides a comparison between the captured photograph and the evaluation performed using ImageJ for an experiment with generator power ranging from 60 to 70% and a pulse frequency of 7 Hz.
In the first step, the particles were colored red based on a threshold value derived from the grayscale of all particles, thus separating them from the white background. In the second step, the actual particle analysis was performed using a filter, which excluded smaller particles such as the spatter or chippings of oxide layers, thereby preventing them from distorting the analysis results.
In Figure 10, the size distribution during operation with constant power is depicted. In comparison, Figure 11 and Figure 12 illustrate the size distribution of droplets under pulsed power conditions between 7 and 14 Hz, respectively. The size analysis of the droplets shows that their projected area is generally between 3.5 and 5.5 mm2. Based on the assumption of spherical geometry, this corresponds to droplet diameters between 2.11 and 2.65 mm and indicates that the deviation of the actual absolute droplet size is relatively small. When comparing the experiments conducted at a constant power, it is evident that at 65% power as opposed to 75%, a greater number of outliers are observed in the histogram, resulting in a wider spread. These outliers predominantly consist of larger droplets exceeding the average size. With a higher power, the droplets tend to exhibit a slight reduction in size, which can be attributed to a marginally higher detachment frequency due to the constant wire feed rate. However, the data appear to display a relatively improved normal distribution at lower power settings.
By pulsing the power sinusoidally at a frequency of 7 Hz around 65% (62–68%), the droplet distribution shifts towards larger droplets and exhibits an increased spread compared to the constant power. This can be attributed, on the one hand, to the mismatch between the pulsing frequency and the actual droplet detachment frequency under a constant power, as the pulsing process tends to hinder rather than support the detachment process. On the other hand, as previously mentioned, pulsing results in the average power being slightly below the theoretical value of 65%. Furthermore, this effect is further amplified when the power amplitude increases (60–70%), resulting in a rightward shift of the distribution curve within the histogram. When the average power is increased in pulse operation (70–80%), the resulting droplets are detached at a faster rate, leading to smaller sizes. However, the pulsing frequency still opposes the actual droplet detachment frequency. As a consequence, the distribution in the histogram shifts to the left towards smaller droplets, while simultaneously exhibiting an increased spread.
This behavior changes when operating at a pulsing frequency of 14 Hz, which is closer to the actual droplet detachment frequency. Pulsing around the average power of 65% (60–70%) does not exhibit a significantly negative impact on the droplet size distribution and spread, while the power pulsing does not enhance droplet detachment, it no longer poses a notable disruption, as observed at 7 Hz. Increasing the average generator power to 75% (60–90%) further reduces droplet sizes, as they detach more rapidly from the wire end. However, the resulting spread is smaller compared to 7 Hz, as the pulsed power aligns closer to the actual detachment frequency. If the chosen power amplitude is too large (50–90%), the inertia of the induction generator becomes more pronounced, as it can no longer produce a smooth output signal. Consequently, the droplet formation process is significantly disrupted. As a result, the spread increases, and the distribution shifts overall to the right, indicating larger droplet sizes.

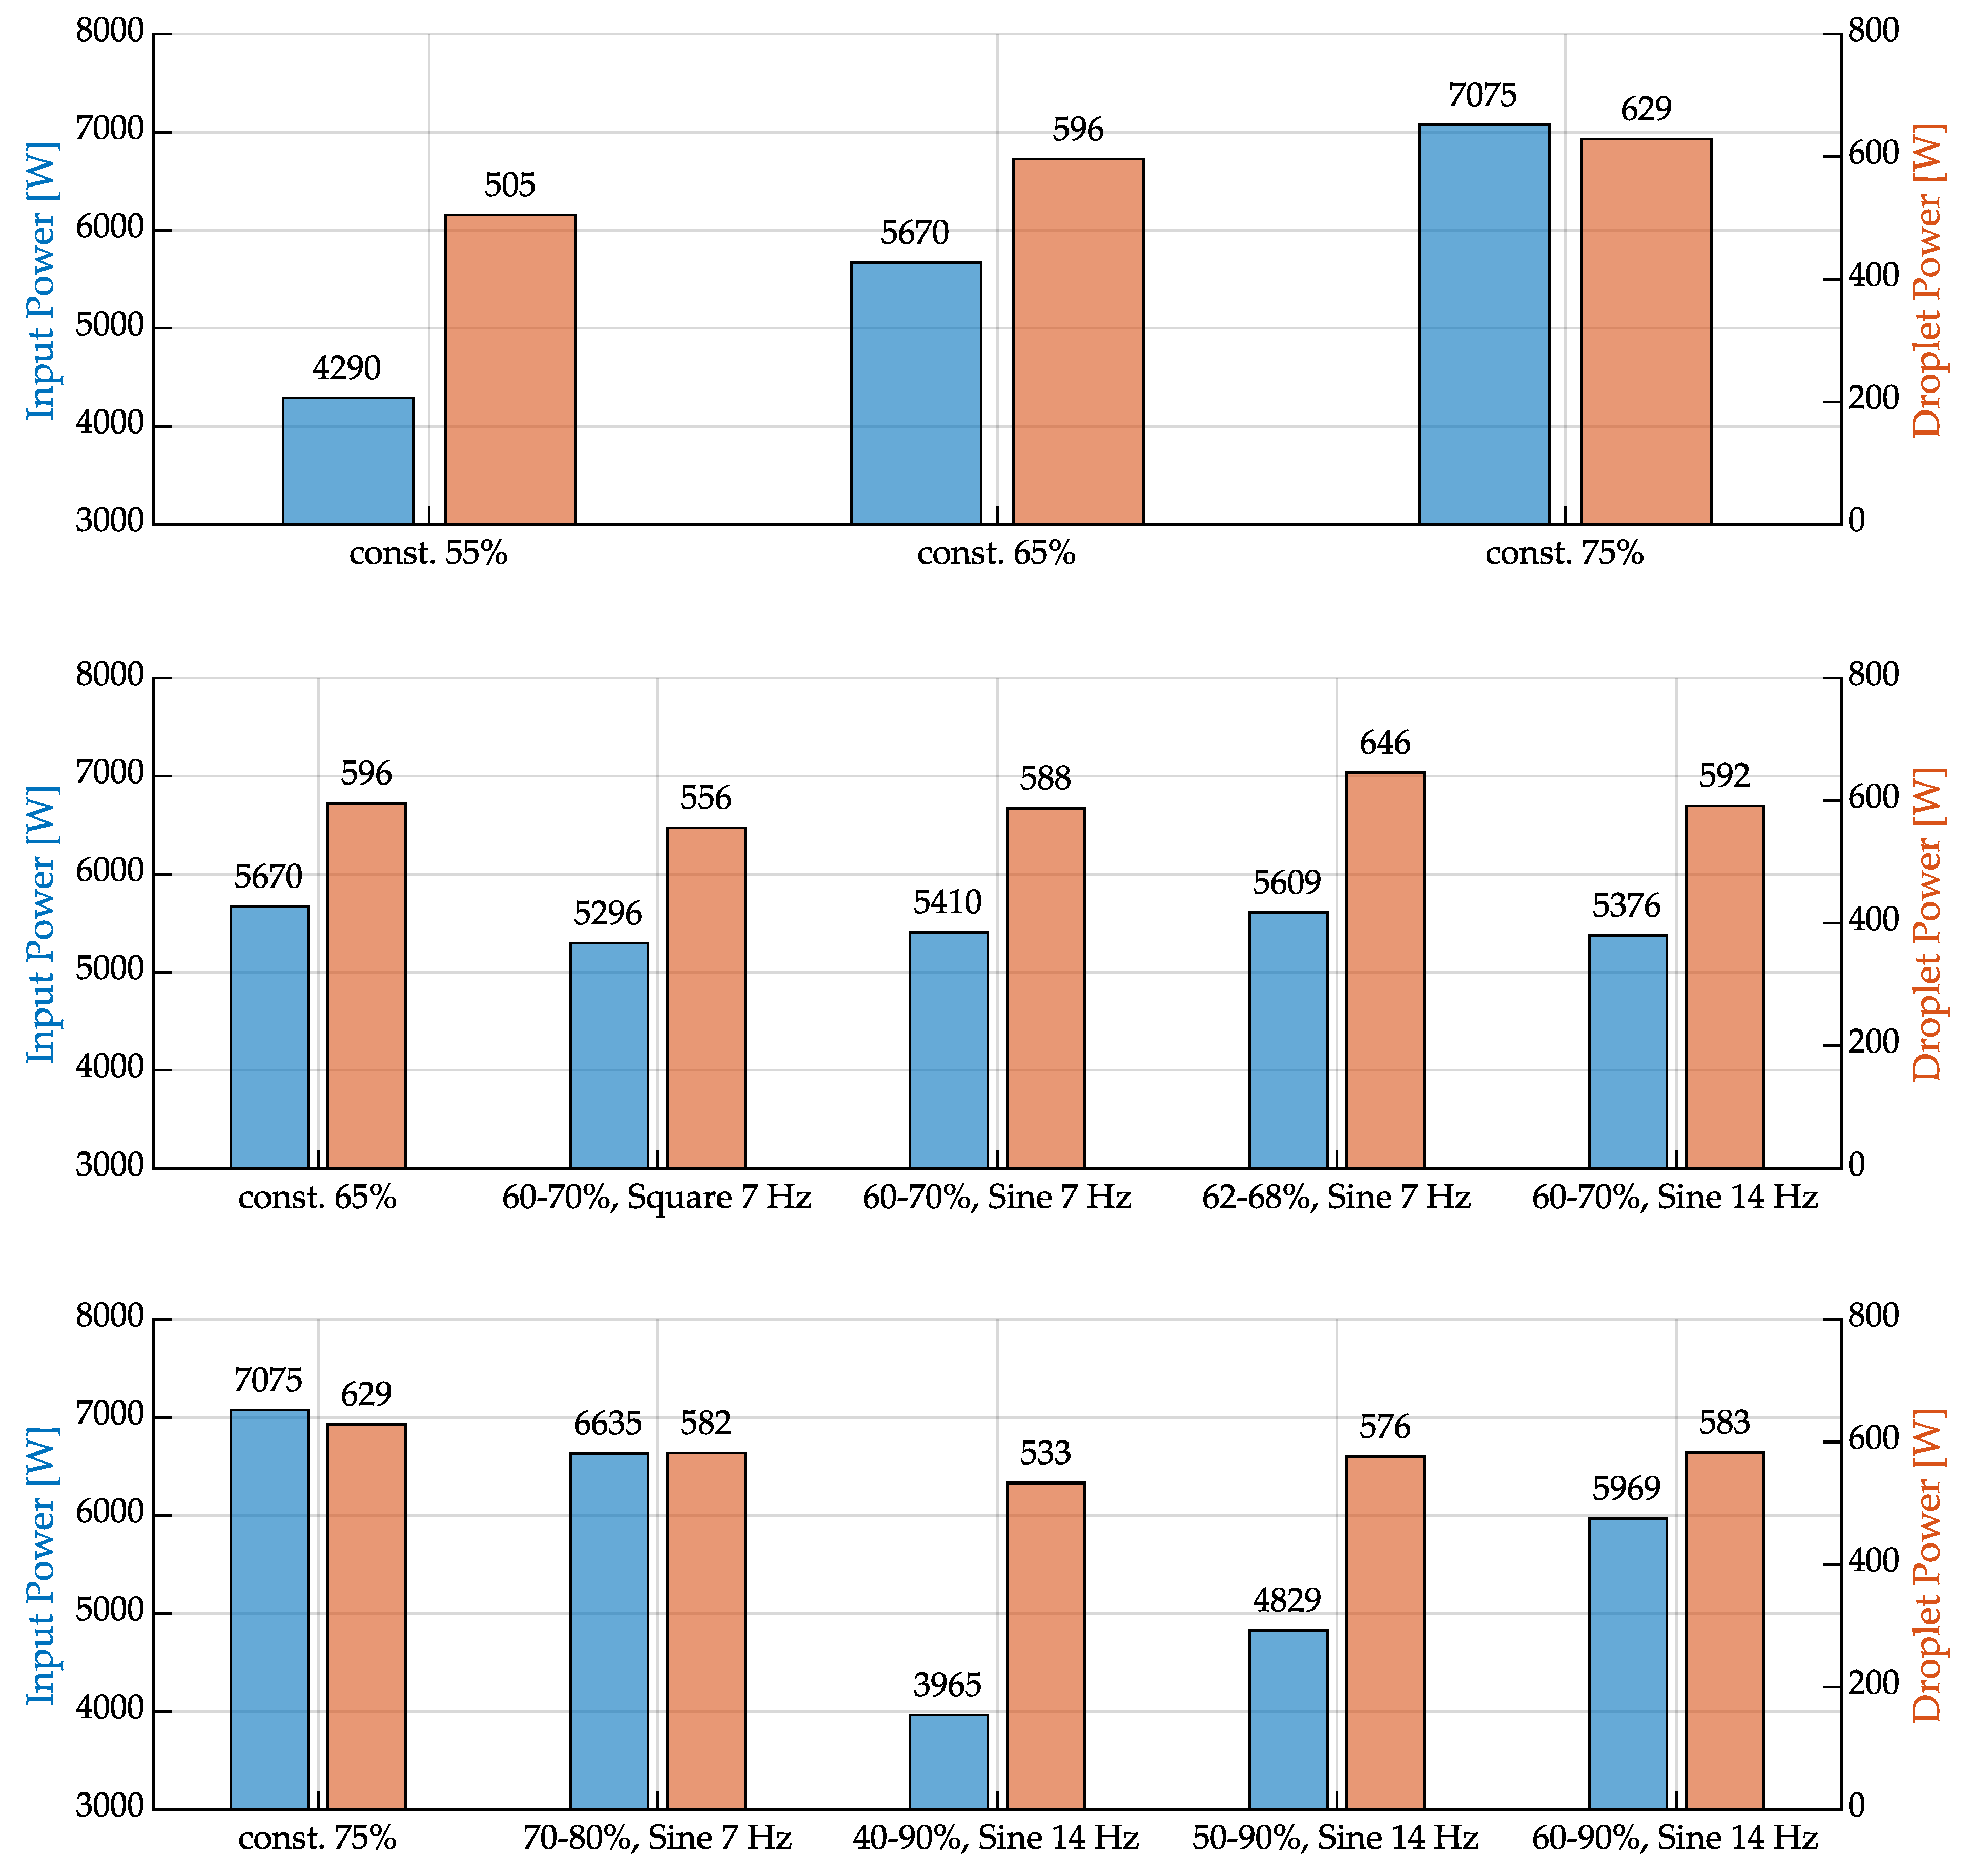
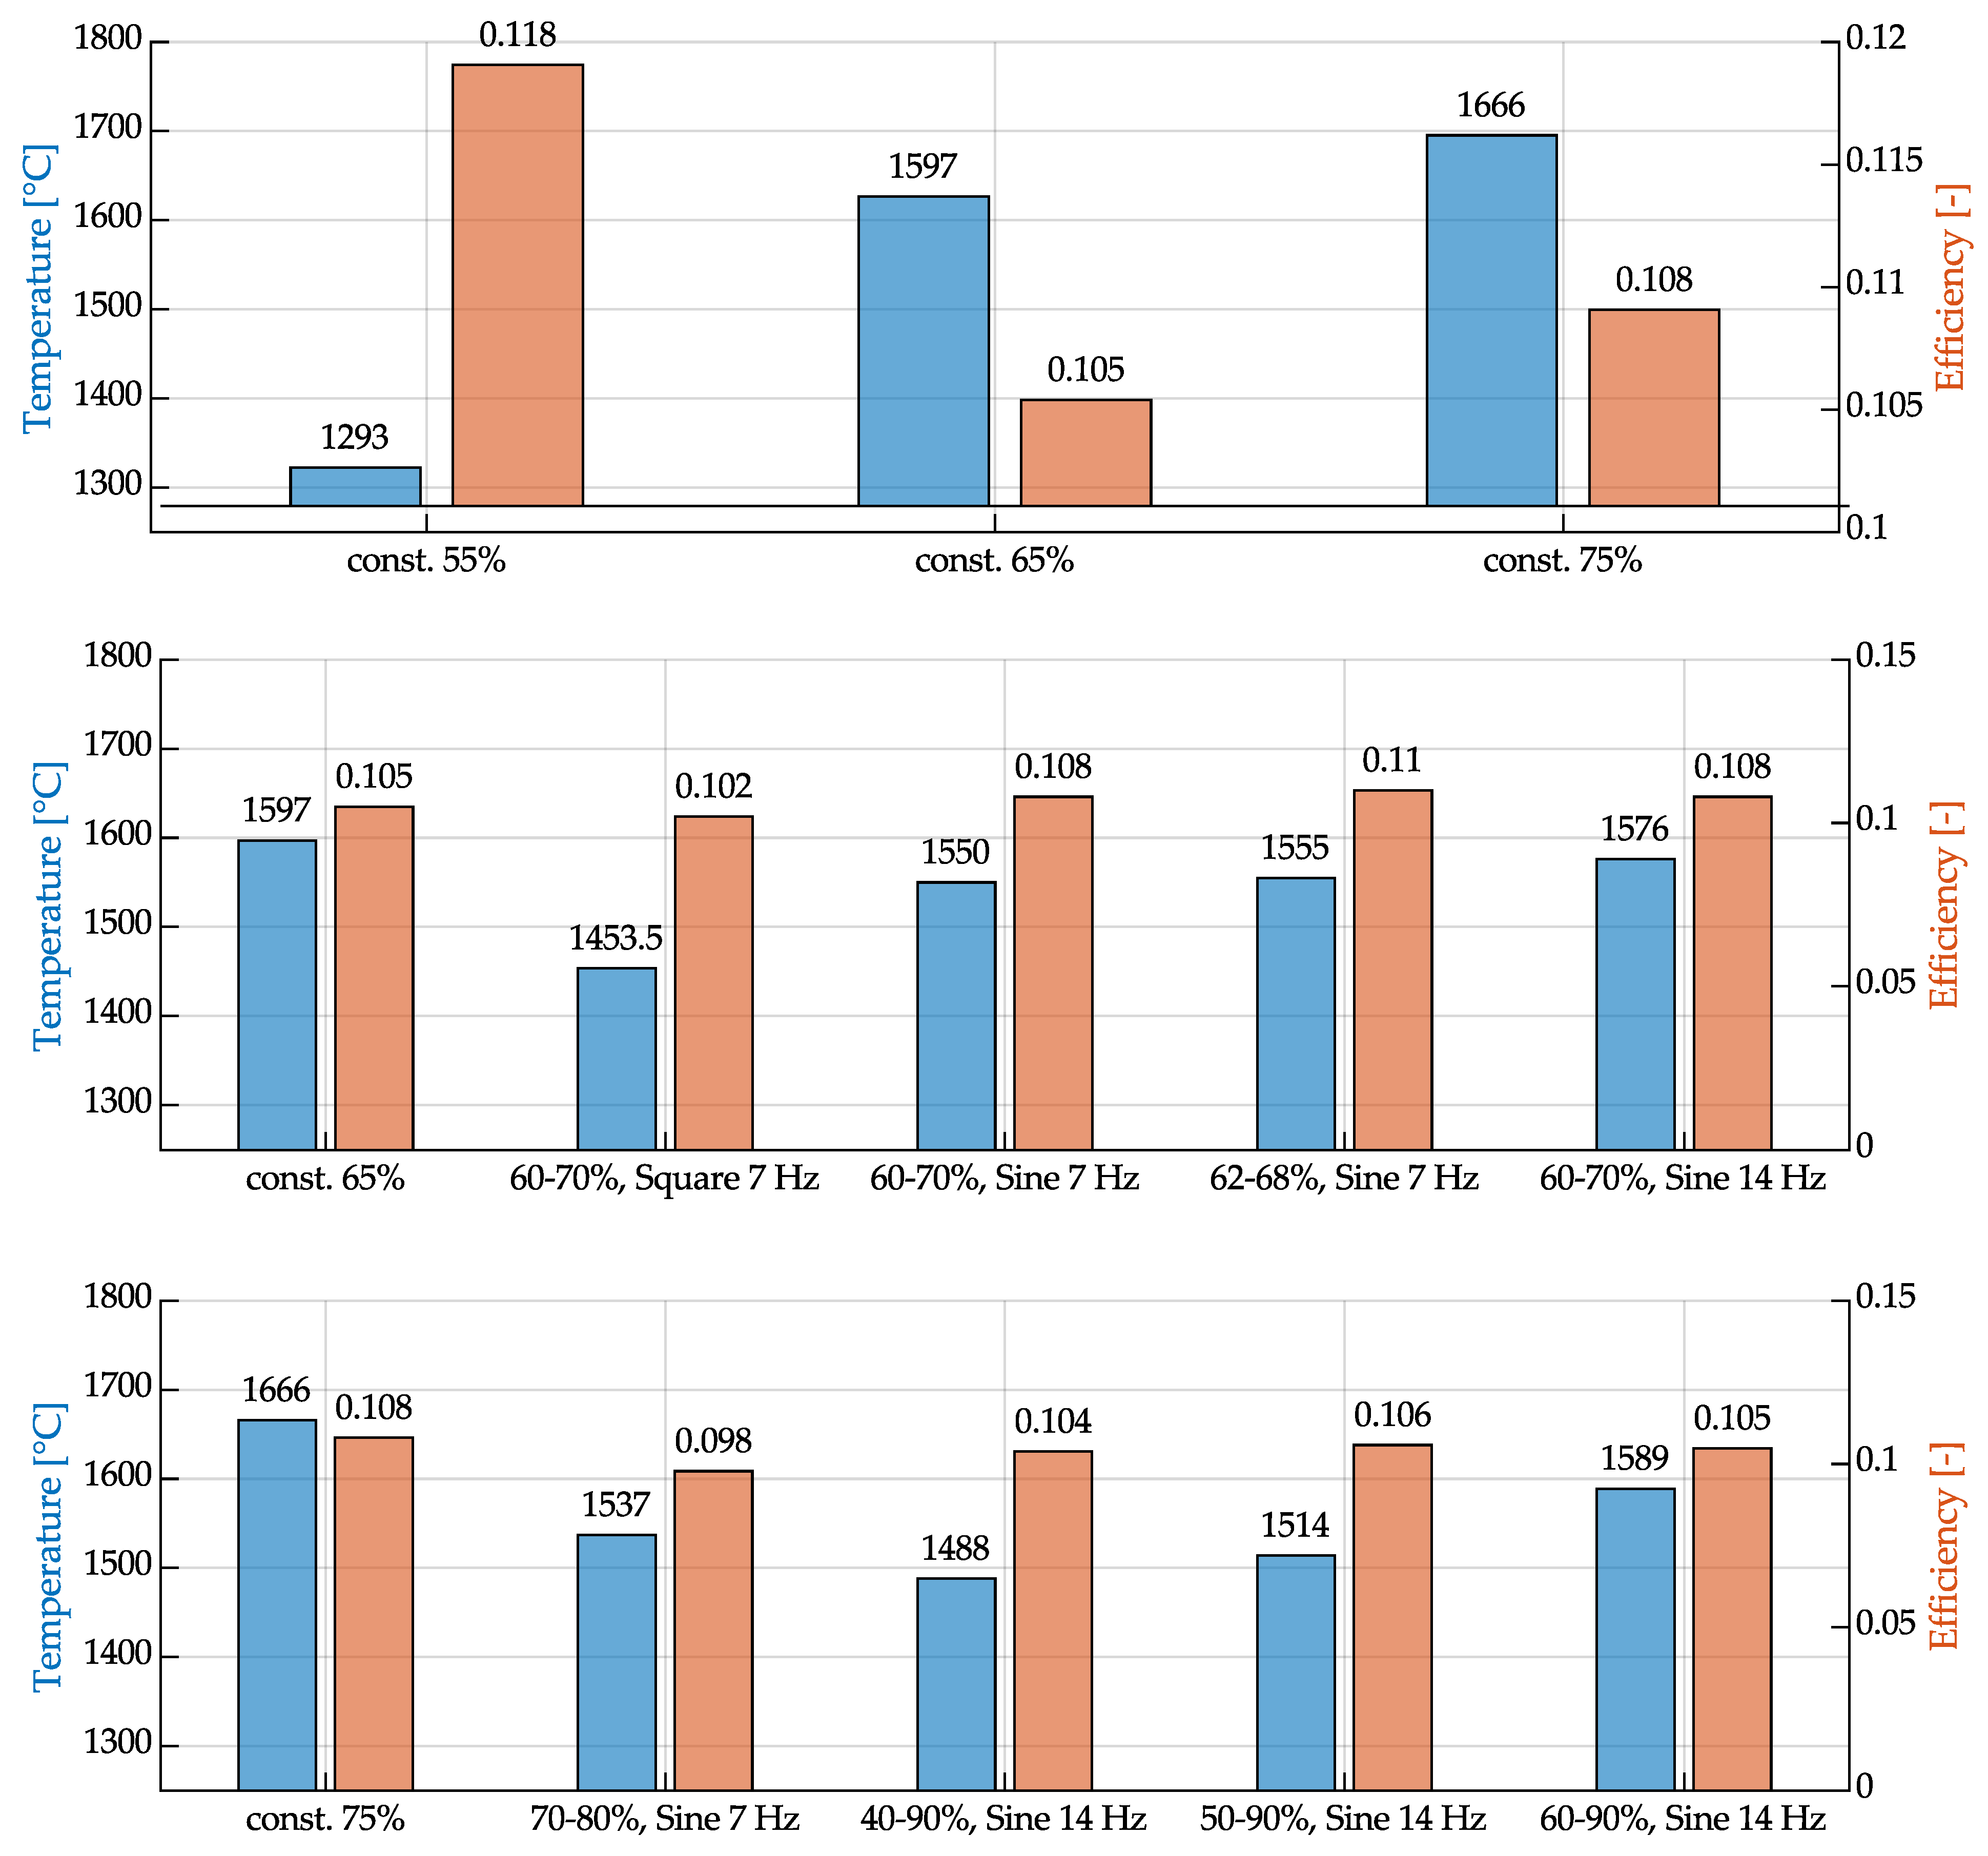
3.4. Droplet Temperature and Efficiency

Figure 13 presents the power of the system recorded by the power meter in comparison to the measured droplet power. Figure 14 depicts the average droplet temperatures and the calculated efficiency of each experiment. The measurements from the experiments with constant generator power demonstrate that the device’s power consumption exhibits a nearly linear relationship with the set power. It becomes evident that when operating in pulse mode with oscillation around a mean value, the power intake is lower compared to operating at a constant power level equivalent to that mean value. This can be attributed to the generator’s characteristic of quickly dropping to a lower power level but slowly rising back to a higher level, as discussed earlier. Consequently, the power consumption in the pulse mode remains slightly lower than in the constant mode, regardless of the pulse frequency. If the base power is increased while reducing the pulse power to the same extent, thereby keeping the average power constant, the power consumption of the system still increases due to the described behavior.
The material calculations using JMatPro revealed that the steel wire used has a solidus temperature of approximately 1460 °C and a liquidus temperature of 1517 °C. The calculated droplet temperatures indicate that they are mainly above these values, suggesting that the material collected by the calorimeter was completely melted. However, in the experiment with 55% constant power, the temperature of 1293 °C is below the solidus temperature, yet the generated droplets still exhibit a spherical geometry. This suggests that there is an offset in the measurements, and the actual droplet temperatures are higher than calculated. A significant reason for this behavior is the measurement inaccuracy of the used Seebeck calorimeter, as demonstrated by [36], which is approximately 9%. This is particularly attributable to the long measurement time compared to the relatively short time of energy input. Nevertheless, the determined values can be compared to each other. The droplet temperatures correlate with the power consumption in such a way that the droplet temperature is higher when the generator’s power consumption increases. Overheating of the droplets during detachment through increased pulse currents for improved detachment is only partially possible, and the effect is relatively weak. With a faster response of the generator to increasing power input, such behavior could potentially be enforced.
In terms of efficiency, the process seems to fall short of expectations, while the overall efficiency of induction heating is generally considered relatively high compared to other heating processes, even an induction coil, as used here, which heats in the inner field, has a better inductor efficiency than, for example, a surface inductor that acts through its outer field [11,40,41]. However, the calculated overall efficiency, considering the power consumption to thermal power in the droplets across all experiments, is only between 9 and 14%. As previously explicated, given that the ascertained droplet temperature is expected to be lower than the actual value, it follows that the derived efficiency is somewhat diminished compared to the real magnitude. A possible reason for the lower efficiency could be a hardware-related suboptimal matching of the resonant circuit to the load on the generator side. This would already reduce the efficiency within the induction generator and consequently worsen the overall efficiency of the system, despite a good coupling from coil to wire. Therefore, future investigations will include an additional power measurement directly at the induction coil to better contextualize these results.

4. Conclusions

In conclusion, this study focused on the characterization of droplet formation and energy input in an additive manufacturing process approach based on inductive heating using a steel wire feedstock. The results of the experiments and analyses provide valuable insights into the process dynamics and droplet properties. The induction generator exhibited a sluggish response to the excitation voltage, resulting in a lag between the input signal and the coil current. The response behavior was influenced by the shape and frequency of the excitation voltage. At frequencies above 10 Hz and larger amplitudes, the maximum power could not be achieved before the excitation voltage started to decrease again. The reason for this behavior is the resonant circuit consisting of the inverter circuit, capacitor configuration, and induction coil, whose systematically induced inertia does not allow for faster current rise and fall times. The asymmetry of the coil current oscillation was also observed, with the negative amplitude being significantly higher than the positive amplitude. The high-speed camera recordings captured the process details, including wire feed movement, wire melting, droplet formation, and detachment. Within the appropriate process window, regular droplet formation and uniform droplet size and shape were observed. However, outside of this window, larger droplets formed at irregular intervals, and increased movement of the melt and spatter formation occurred. The latter is particularly evident at higher power levels, which can be explained by the overheating of the molten wire end. At a too low power, the droplets grow disproportionately and detach from the wire very late and irregularly. The droplets exhibited an almost spherical shape, allowing for accurate determination and comparison of droplet sizes. The size analysis showed that the droplets had projected areas between 3.5 and 5.5 mm2, corresponding to droplet diameters between 2.11 and 2.65 mm. Overall, this study provides insights into the droplet formation process and the energy input into the droplets. The findings contribute to the advancement of AM technologies and suggest the need for generator technology capable of reliable pulse frequencies of at least 15 Hz to enhance process control and efficiency. Further research in this direction could lead to the development of more effective and cost-efficient manufacturing methods for large volume components.

Author Contributions

Conceptualization, J.K.; methodology, J.K., J.G. and A.H.; software, J.K. and J.G.; investigation, J.K., J.G. and A.H.; resources, J.K., J.G., A.H. and J.H.; writing—original draft preparation, J.K. and J.G.; writing—review and editing, A.H. and J.H.; visualization, J.K. and J.G.; supervision, J.H.; project administration, J.K.; funding acquisition, J.K. All authors have read and agreed to the published version of the manuscript.

Funding

This work was supported by the German Federal Ministry for Economic Affairs and Climate Action (BMWK) within the project “Add-In” under grant no. K5051302SUO based on a resolution of the German Bundestag.

Data Availability Statement

Data are contained within the article.

Acknowledgments

The authors would like to thank Kay Förster and Christian Kotzurek for their preparation and support during the experimental investigations.

Conflicts of Interest

The authors declare no conflicts of interest.

References

  1. Wohlers, T.T.; Campbell, I.; Diegel, O.; Huff, R.; Kowen, J. Wohlers Report 2022: 3D Printing and Additive Manufacturing Global State of the Industry; Technical Report; Wohlers Associates: Fort Collins, CO, USA, 2022. [Google Scholar]
  2. Vafadar, A.; Guzzomi, F.; Rassau, A.; Hayward, K. Advances in Metal Additive Manufacturing: A Review of Common Processes, Industrial Applications, and Current Challenges. Appl. Sci. 2021, 11, 1213. [Google Scholar] [CrossRef]
  3. Steenhuis, H.J.; Pretorius, L. Consumer additive manufacturing or 3D printing adoption: An exploratory study. J. Manuf. Technol. Manag. 2016, 27, 990–1012. [Google Scholar] [CrossRef]
  4. Bhavar, V.; Kattire, P.; Patil, V.; Khot, S.; Gujar, K.; Singh, R. A review on powder bed fusion technology of metal additive manufacturing. In Additive Manufacturing Handbook, 1st ed.; CRC Press: Boca Raton, FL, USA, 2017; pp. 251–253. [Google Scholar] [CrossRef]
  5. Abd-Elaziem, W.; Elkatatny, S.; Abd-Elaziem, A.E.; Khedr, M.; Abd El-baky, M.A.; Hassan, M.A.; Abu-Okail, M.; Mohammed, M.; Järvenpää, A.; Allam, T.; et al. On the current research progress of metallic materials fabricated by laser powder bed fusion process: A review. J. Mater. Res. Technol. 2022, 20, 681–707. [Google Scholar] [CrossRef]
  6. Sing, S.L.; Yeong, W.Y. Laser powder bed fusion for metal additive manufacturing: Perspectives on recent developments. Virtual Phys. Prototyp. 2020, 15, 359–370. [Google Scholar] [CrossRef]
  7. Chowdhury, S.; Yadaiah, N.; Prakash, C.; Ramakrishna, S.; Dixit, S.; Gupta, L.R.; Buddhi, D. Laser powder bed fusion: A state-of-the-art review of the technology, materials, properties & defects, and numerical modelling. J. Mater. Res. Technol. 2022, 20, 2109–2172. [Google Scholar] [CrossRef]
  8. Kumar, S. Additive Manufacturing Solutions; Springer International Publishing: Cham, Switzerland, 2022. [Google Scholar] [CrossRef]
  9. Ding, D.; Pan, Z.; Cuiuri, D.; Li, H. Wire-feed additive manufacturing of metal components: Technologies, developments and future interests. Int. J. Adv. Manuf. Technol. 2015, 81, 465–481. [Google Scholar] [CrossRef]
  10. Gisario, A.; Kazarian, M.; Martina, F.; Mehrpouya, M. Metal additive manufacturing in the commercial aviation industry: A review. J. Manuf. Syst. 2019, 53, 124–149. [Google Scholar] [CrossRef]
  11. Rudnev, V.; Loveless, D.; Cook, R.L. Handbook of Induction Heating, 2nd ed.; CRC Press: Boca Raton, FL, USA, 2017. [Google Scholar] [CrossRef]
  12. Hofmann, C.; Frohlich, A.; Kimme, J.; Wiemer, M.; Otto, T. A Novel Method for Mems Wafer-Level Packaging: Selective and Rapid Induction Heating for Copper-Tin Slid Bonding. In Proceedings of the 2019 20th International Conference on Solid-State Sensors, Actuators and Microsystems and Eurosensors XXXIII, TRANSDUCERS 2019 and EUROSENSORS XXXIII, Berlin, Germany, 23–27 June 2019. [Google Scholar] [CrossRef]
  13. Kräusel, V.; Fröhlich, A.; Kroll, M.; Rochala, P.; Kimme, J.; Wertheim, R. A highly efficient hybrid inductive joining technology for metals and composites. CIRP Ann. 2018, 67, 5–8. [Google Scholar] [CrossRef]
  14. Kimme, J.; Zeisig, J.; Fröhlich, A.; Kräusel, V. Technology Innovation for the Manual Laser Cladding of High-Alloy Tool Steels. Metals 2021, 11, 1820. [Google Scholar] [CrossRef]
  15. Vega, E.J.; Cabezas, M.G.; Muñoz-Sánchez, B.N.; Montanero, J.M.; Gañán-Calvo, A.M. A novel technique to produce metallic microdrops for additive manufacturing. Int. J. Adv. Manuf. Technol. 2014, 70, 1395–1402. [Google Scholar] [CrossRef]
  16. Fang, X.; Du, J.; Wei, Z.; Wang, X.; He, P.; Bai, H.; Wang, B.; Chen, J.; Geng, R.; Lu, B. Study on Metal Deposit in the Fused-coating Based Additive Manufacturing. Procedia CIRP 2016, 55, 115–121. [Google Scholar] [CrossRef]
  17. Du, J.; Wei, Z.; Wang, X.; Fang, X.; Zhao, G. A novel high-efficiency methodology for metal additive manufacturing. Appl. Phys. A 2016, 122, 945. [Google Scholar] [CrossRef]
  18. Jayant, H.; Arora, M. Induction Heating Based 3D Metal Printing of Eutectic Alloy Using Vibrating Nozzle. In Advances in Additive Manufacturing, Modeling Systems and 3D Prototyping, Proceedings of the AHFE 2019 International Conference on Additive Manufacturing, Modeling Systems and 3D Prototyping, Washington, DC, USA, 24–28 July 2019; Springer International Publishing: Cham, Switzerland, 2020; Volume 975, pp. 108–118. [Google Scholar] [CrossRef]
  19. Sharma, G.K.; Pant, P.; Jain, P.K.; Kankar, P.K.; Tandon, P. On the suitability of induction heating system for metal additive manufacturing. Proc. Inst. Mech. Eng. Part B J. Eng. Manuf. 2021, 235, 219–229. [Google Scholar] [CrossRef]
  20. Sharma, G.K.; Pant, P.; Jain, P.K.; Kankar, P.K.; Tandon, P. Analysis of novel induction heating extruder for additive manufacturing using aluminum filament. Proc. Inst. Mech. Eng. Part B J. Eng. Manuf. 2021, 235, 1961–1970. [Google Scholar] [CrossRef]
  21. Englert, L.; Klumpp, A.; Ausländer, A.; Schulze, V.; Dietrich, S. Semi-solid wire-feed additive manufacturing of AlSi7Mg by direct induction heating. Addit. Manuf. Lett. 2022, 3, 100067. [Google Scholar] [CrossRef]
  22. Hascoët, J.Y.; Parrot, J.; Mognol, P.; Willmann, E. Induction heating in a wire additive manufacturing approach. Weld. World 2018, 62, 249–257. [Google Scholar] [CrossRef]
  23. Sun, R.; Shi, Y.; Wang, X.; Guo, Y.; Zhou, X. Understanding the thermal process during laser assisted ultra-high frequency induction deposition with wire feeding. Int. J. Heat Mass Transf. 2020, 153, 119536. [Google Scholar] [CrossRef]
  24. Sun, R.; Shi, Y.; Yang, Y.; Wang, X.; Zhou, X. Microstructure, element segregation and performance of Inconel 625 metal layer deposited by laser assisted ultra-high frequency induction deposition. Surf. Coatings Technol. 2021, 405, 126715. [Google Scholar] [CrossRef]
  25. Fang, X.; Wei, Z.; Du, J.; Bingheng, L.; He, P.; Wang, B.; Chen, J.; Geng, R. Forming metal components through a novel fused-coating based additive manufacturing. Rapid Prototyp. J. 2017, 23, 893–903. [Google Scholar] [CrossRef]
  26. Jayant, H.K.; Arora, M. Influence of Workpiece Height on Induction Heating Process for Printing 3D Metal Structures. In Industry 4.0 and Advanced Manufacturing; Springer: Singapore, 2020; pp. 247–259. [Google Scholar] [CrossRef]
  27. Sharma, G.K.; Pant, P.; Jain, P.K.; Kankar, P.K.; Tandon, P. Numerical and experimental analysis of heat transfer in inductive conduction based wire metal deposition process. Proc. Inst. Mech. Eng. Part C J. Mech. Eng. Sci. 2022, 236, 2395–2407. [Google Scholar] [CrossRef]
  28. Choubey, R.K.; Patil, M.; Jain, P.K. Tailoring Coil Geometry for Achieving Uniform Heating Through Coil Shape Optimization for Induction Heating-Based Metal Wire Additive Manufacturing. SSRN Electron. J. 2023; in press. [Google Scholar] [CrossRef]
  29. Prasad, A.K.; Kapil, S.; Bag, S. Critical conditions for melting of metallic wire in induction heating system through numerical simulation and experiments. J. Manuf. Processes 2022, 77, 678–693. [Google Scholar] [CrossRef]
  30. Prasad, A.K.; Kapil, S.; Bag, S. Tailoring coil geometry for secondary heating of substrate towards the development of induction heating-based wire additive manufacturing. Sci. Technol. Weld. Join. 2023, 28, 209–217. [Google Scholar] [CrossRef]
  31. Kimme, J.; Fröhlich, A.; Kroll, M.; Kräusel, V. Novel Process Approach for Additive Manufacturing Using Inductive Wire Melting by Forced Droplet Detachment. BHM Berg Hüttenmännische Monatshefte 2023, 168, 226–232. [Google Scholar] [CrossRef]
  32. Praveen, P.; Yarlagadda, P.; Kang, M. Advancements in pulse gas metal arc welding. J. Mater. Process. Technol. 2005, 164–165, 1113–1119. [Google Scholar] [CrossRef]
  33. Kimme, J.; Gruner, J.; Fröhlich, A.; Kroll, M. Study of an additive manufacturing technology using pulsed inductive wire melting. Int. J. Appl. Electromagn. Mech. 2024, 1–12. [Google Scholar] [CrossRef]
  34. DIN EN ISO 14341:2020; Schweißzusätze—Drahtelektroden und Schweißgut zum Metall-Schutzgasschweißen von Unlegierten Stählen und Feinkornstählen. Beuth Verlag: Berlin, Germany, 2020.
  35. Haelsig, A.; Kusch, M.; Mayr, P. Calorimetric analyses of the comprehensive heat flow for gas metal arc welding. Weld. World 2015, 59, 191–199. [Google Scholar] [CrossRef]
  36. Malin, V.; Sciammarella, F. Controlling heat input by measuring net power. Weld. J. 2006, 85, 44–50. [Google Scholar]
  37. JMatPro; v. 6.1; Sente Software Ltd.: Guildford, UK, 2010.
  38. Rasband, W. ImageJ; v. 1.54f; NIH: Bethesda, MD, USA, 2023. [Google Scholar]
  39. Matlab; v. 2023b; MathWorks, Inc.: Natick, MA, USA, 2023.
  40. Benkowsky, G. Induktionserwärmung, 5th ed.; Verl. Technik: Berlin, Germany, 1990; p. 259. [Google Scholar]
  41. Nacke, B.; Baake, E. Induktives Erwärmen: Wärmen, Härten, Glühen, Löten, Schweißen, 1st ed.; Vulkan-Verlag GmbH: Essen, Germany, 2013; p. 276. [Google Scholar]
Figure 1. (a) Principle of the wire induction additive manufacturing process approach. (b) Pulsed generator power curve for forced droplet detachment with base power phase (I) and pulse power phase (II) [33].
Jmmp 08 00080 g001
Figure 2. Schematic diagram of the experimental setup and equipment used.
Jmmp 08 00080 g002
Figure 3. Generator response at 7 Hz pulse frequency with square-wave and sinusoidal excitation voltage.
Jmmp 08 00080 g003
Figure 4. Camera view: (a) Induction coil without wire. (b) Actual shot during running process. (c) View of the areas obstructed by the coil (montage).
Jmmp 08 00080 g004
Figure 5. Image sequence of consistent and regular droplet detachment (60–70% generator power, 7 Hz pulse frequency).
Jmmp 08 00080 g005
Figure 6. Image sequence of hot droplet detachment with intense melt movement (const., 75% generator power).
Jmmp 08 00080 g006
Figure 7. Image sequence of elongated droplet detachment with intense melt movement (40–90% generator power, 14 Hz pulse frequency).
Jmmp 08 00080 g007
Figure 8. Image sequence of slow and voluminous droplet detachment (const., 55% generator power).
Jmmp 08 00080 g008
Figure 9. (a) Cropped image of the photographed drops (60–70% generator power, 7 Hz pulse frequency). (b) Image adjusted with a threshold value. (c) Automated filtering, counting, and size measurement using ImageJ.
Jmmp 08 00080 g009
Figure 10. Histograms of droplet sizes with constant power; repetitions of the experiments with identical parameters are represented in orange.
Jmmp 08 00080 g010
Figure 11. Histograms of droplet sizes with power pulsing at 7 Hz (sine); repetitions of the experiments with identical parameters are represented in orange.
Jmmp 08 00080 g011
Figure 12. Histograms of droplet sizes with power pulsing at 14 Hz (sine) compared to constant power (repetitions of the experiments with identical parameters are represented in orange).
Jmmp 08 00080 g012
Figure 13. Energy consumed by the system and energy introduced into the droplets.
Jmmp 08 00080 g013
Figure 14. Average droplet temperatures and the efficiency of the experiments.
Jmmp 08 00080 g014
Table 1. Process approaches for additive manufacturing by inductive wire melting.
AuthorsYearMaterialMelting Temperature [°C]Wire Diameter [mm]Frequency [kHz]Power [kW]Wire Feed Rate [m/min]
Vega et al. [15]2014Sn95Ag4Cu12171.5750…11501.68…2.130.84…1.8
Fang et al. [16,25]2016Sn63Pb37183n.a.n.a.0.7n.a.
Hascoët et al. [22]2018316L1450n.a.n.a.4.50.1…0.12
Jayant et al. [18,26]2020Sn99Cu1227n.a.1660.15n.a.
Sun et al. [23,24]2020Inconel 62513502.0700…800n.a.0.72
Sharma et al. [19,27,28]2021AlSi56321.610010.12
Englert et al. [21]2022AlSi7Mg6251.2150010…120.9…1.4
Prasad et al. [29,30]2023mild steel13502.035310n.a.
Table 2. Tabular overview of chemical composition of G3Si1 (in wt %) * [34].
CSiMnPSNiCrMoVCuAlTi+Zr
0.06…0.140.7…1.01.3…1.60.0250.0250.150.150.150.030.350.020.15
* Single values are maximum values.
Disclaimer/Publisher’s Note: The statements, opinions and data contained in all publications are solely those of the individual author(s) and contributor(s) and not of MDPI and/or the editor(s). MDPI and/or the editor(s) disclaim responsibility for any injury to people or property resulting from any ideas, methods, instructions or products referred to in the content.

