1. Introduction
Phospholipid membranes provide a wide array of functions for cells in the form of cell membranes as they define their interface with their environment. Understanding this interface both in terms of structure and dynamics is therefore instrumental for the investigation of biological functions of cell walls. This becomes especially clear when we are considering transport mechanisms through or even along the membranes, such as diffusion along and through the them, endocytosis or function of surface proteins in the membrane. From the application side, two important examples are transport vectors for drug delivery or attack vectors for bacterial and viral pathogens.
In a previous publication, we identified a hitherto unobserved eigenmode of phospholipid membranes at physiological temperatures by means of GINSES [
1]. However, due to a limited available time for the experiments, we were unable to further explore the behavior of those eigenmodes we called dynamic modes. Furthermore, since the experimental time for a single spectrum was on the order of several days, this seemed unfeasible for further investigations when there was no a priori proof of the existence of such waves for a given sample or specific sample conditions. This manuscript is the first report of these modes being measured in a GISANS experiment.
Searching for a way to overcome this, we were inspired by the method of Constantin et al. [
2], where the shape of a Bragg peak scattered from lamellae was analyzed and a coherent contribution to the peak form was found. However, instead of focusing on the Bragg Peak and following through with the Caille theory [
3], we assumed a standing wave as postulated after the GINSES measurements would contribute on its own to the coherent scattering in the identified length scale and therefore
Q-regime.
We therefore set up a GISANS experiment where, instead of searching structural features, we optimized for resolution and signal-to-noise ratio in an area that previously was identified by the GINSES experiment. There we could indeed identify an additional scattering contribution not associated to the structure of the membrane [
4].
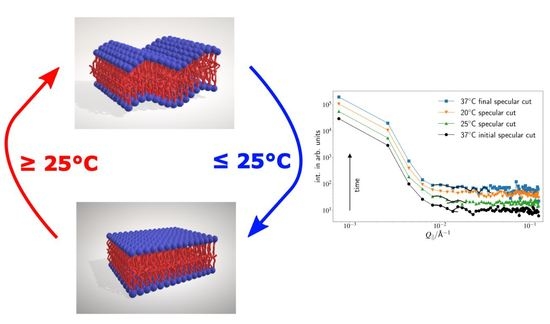
Since the GISANS measurements are considerably faster (several hours compared to days), we were also able to perform a temperature scan that revealed a temperature response of the eigenmode of the membrane. This temperature response also allowed us to rule out instrumental artifacts and proved the thermodynamic nature of the effect.
2. Results
The measurements presented here were performed on the MARIA [
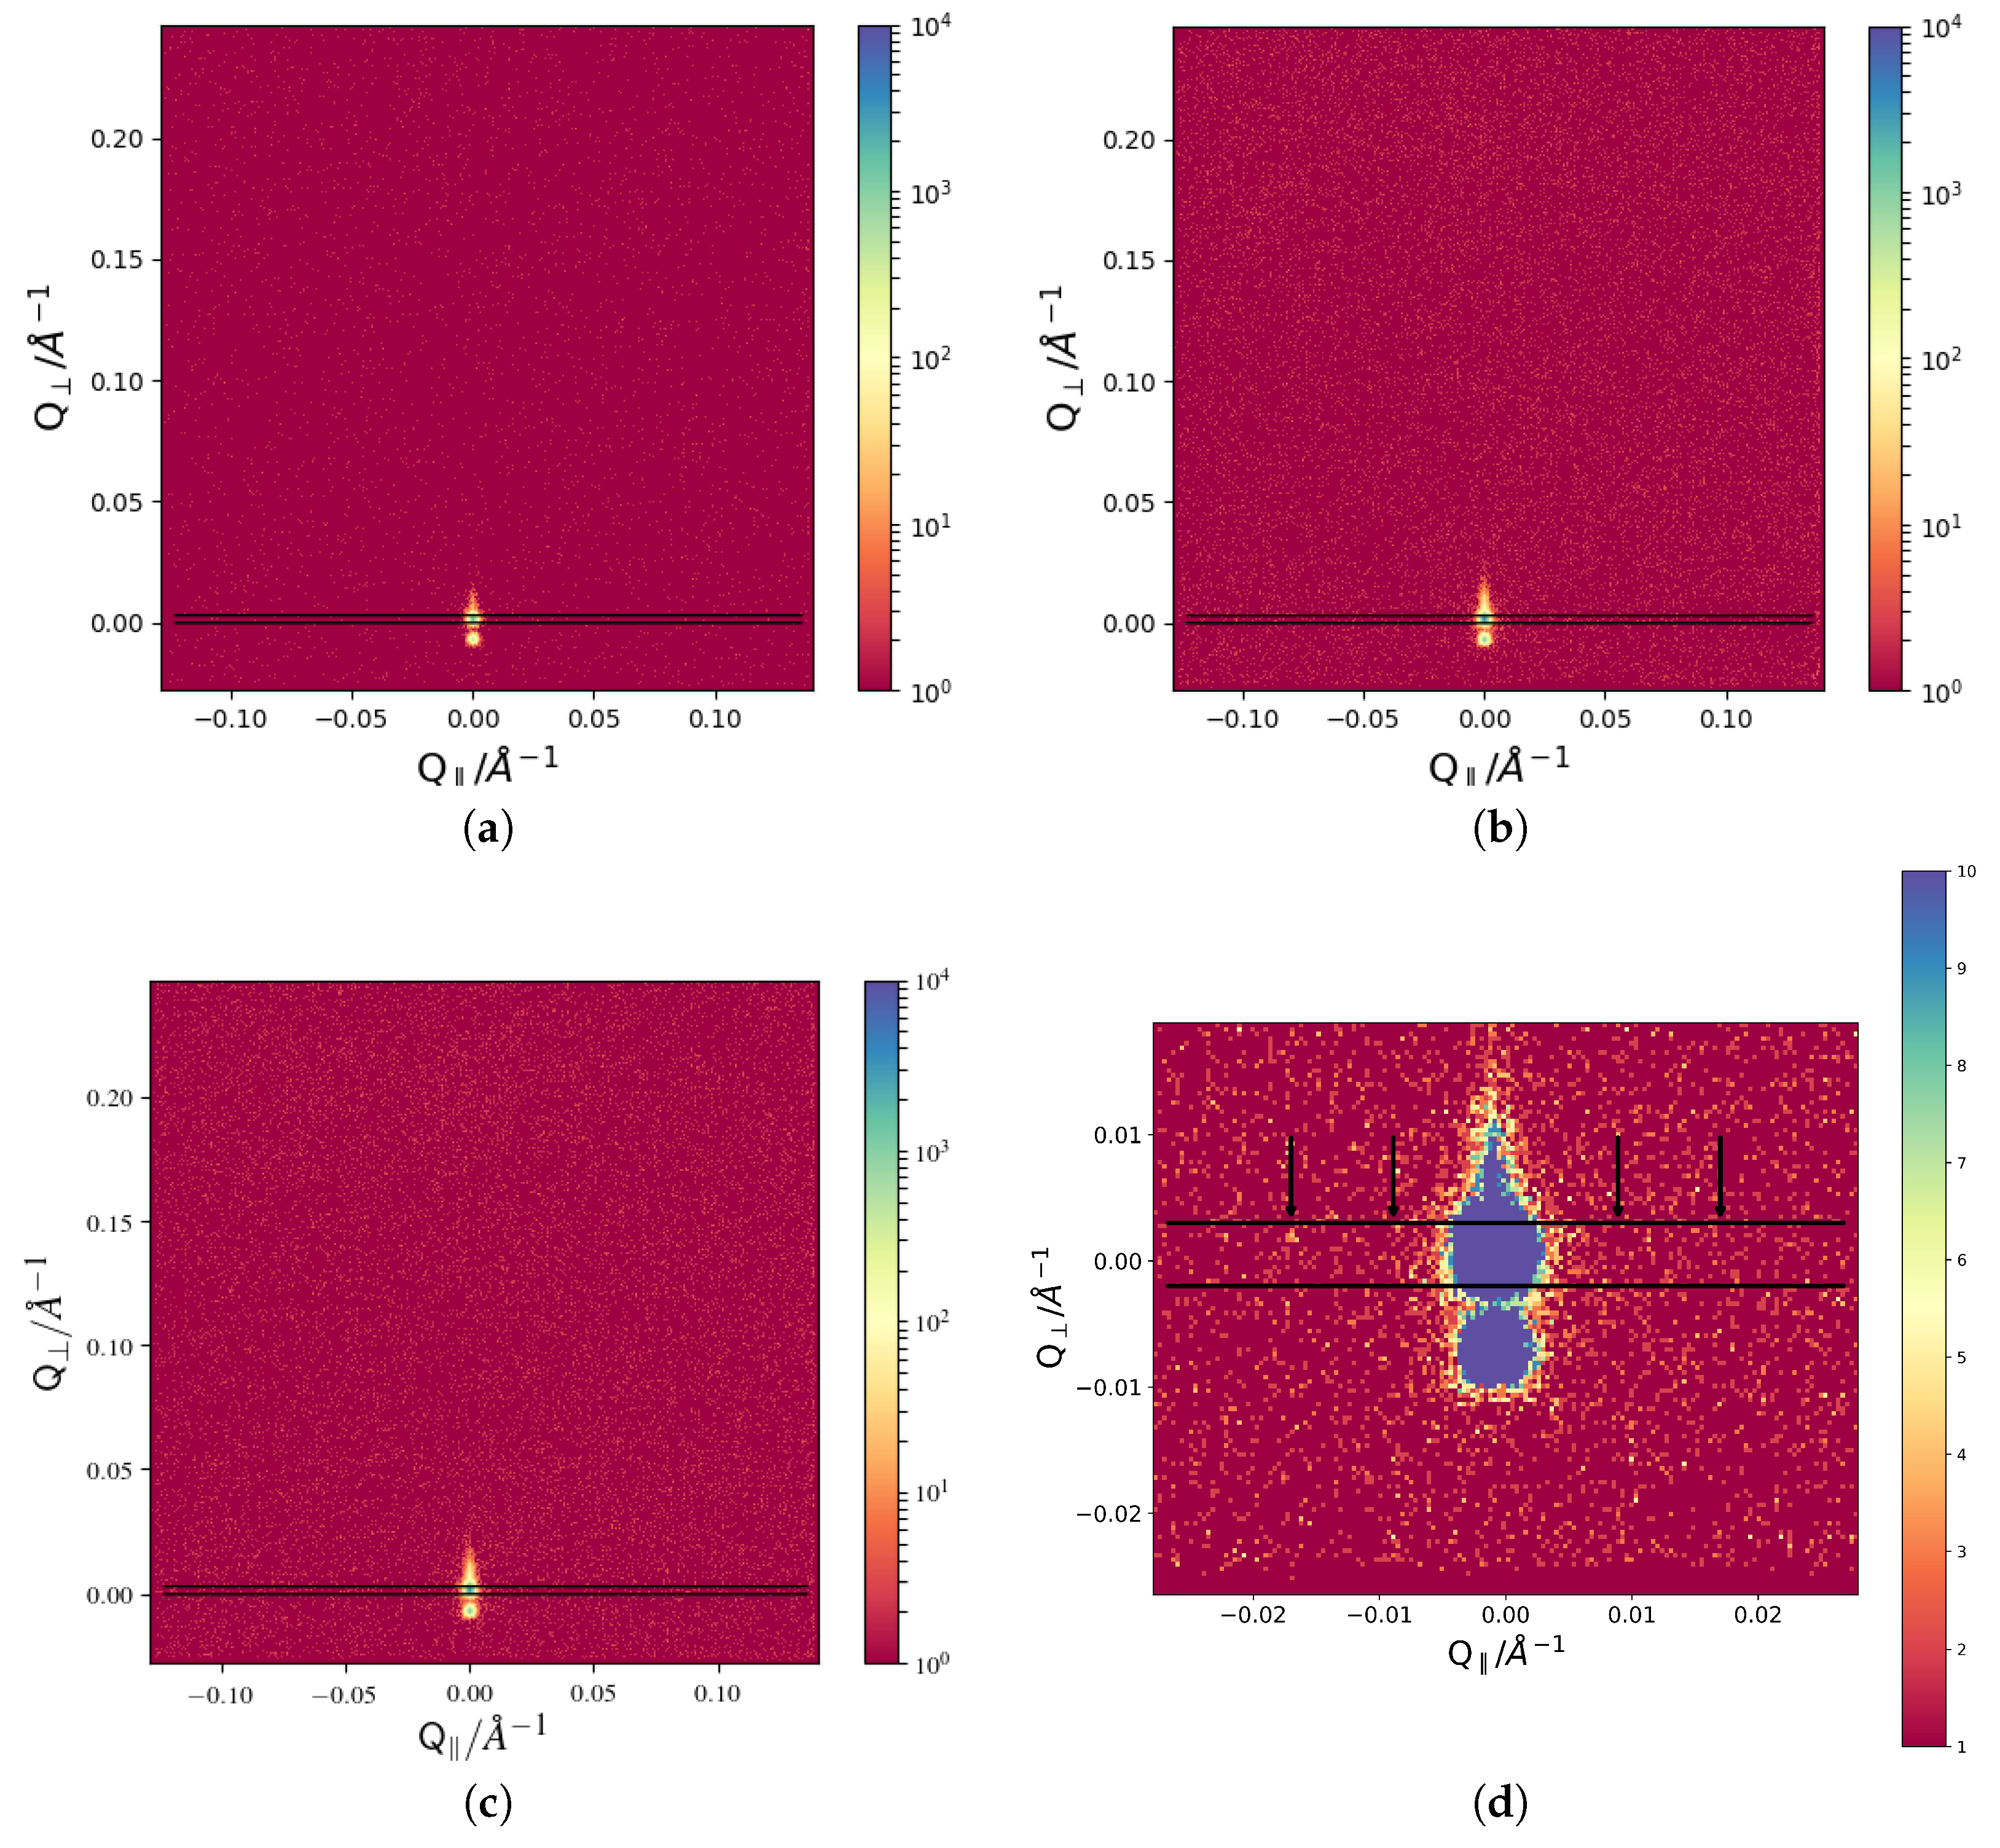
5] instrument at MLZ. The GISANS data is shown in
Figure 1 in addition to the direction of the in-plane cut used for later analyses.
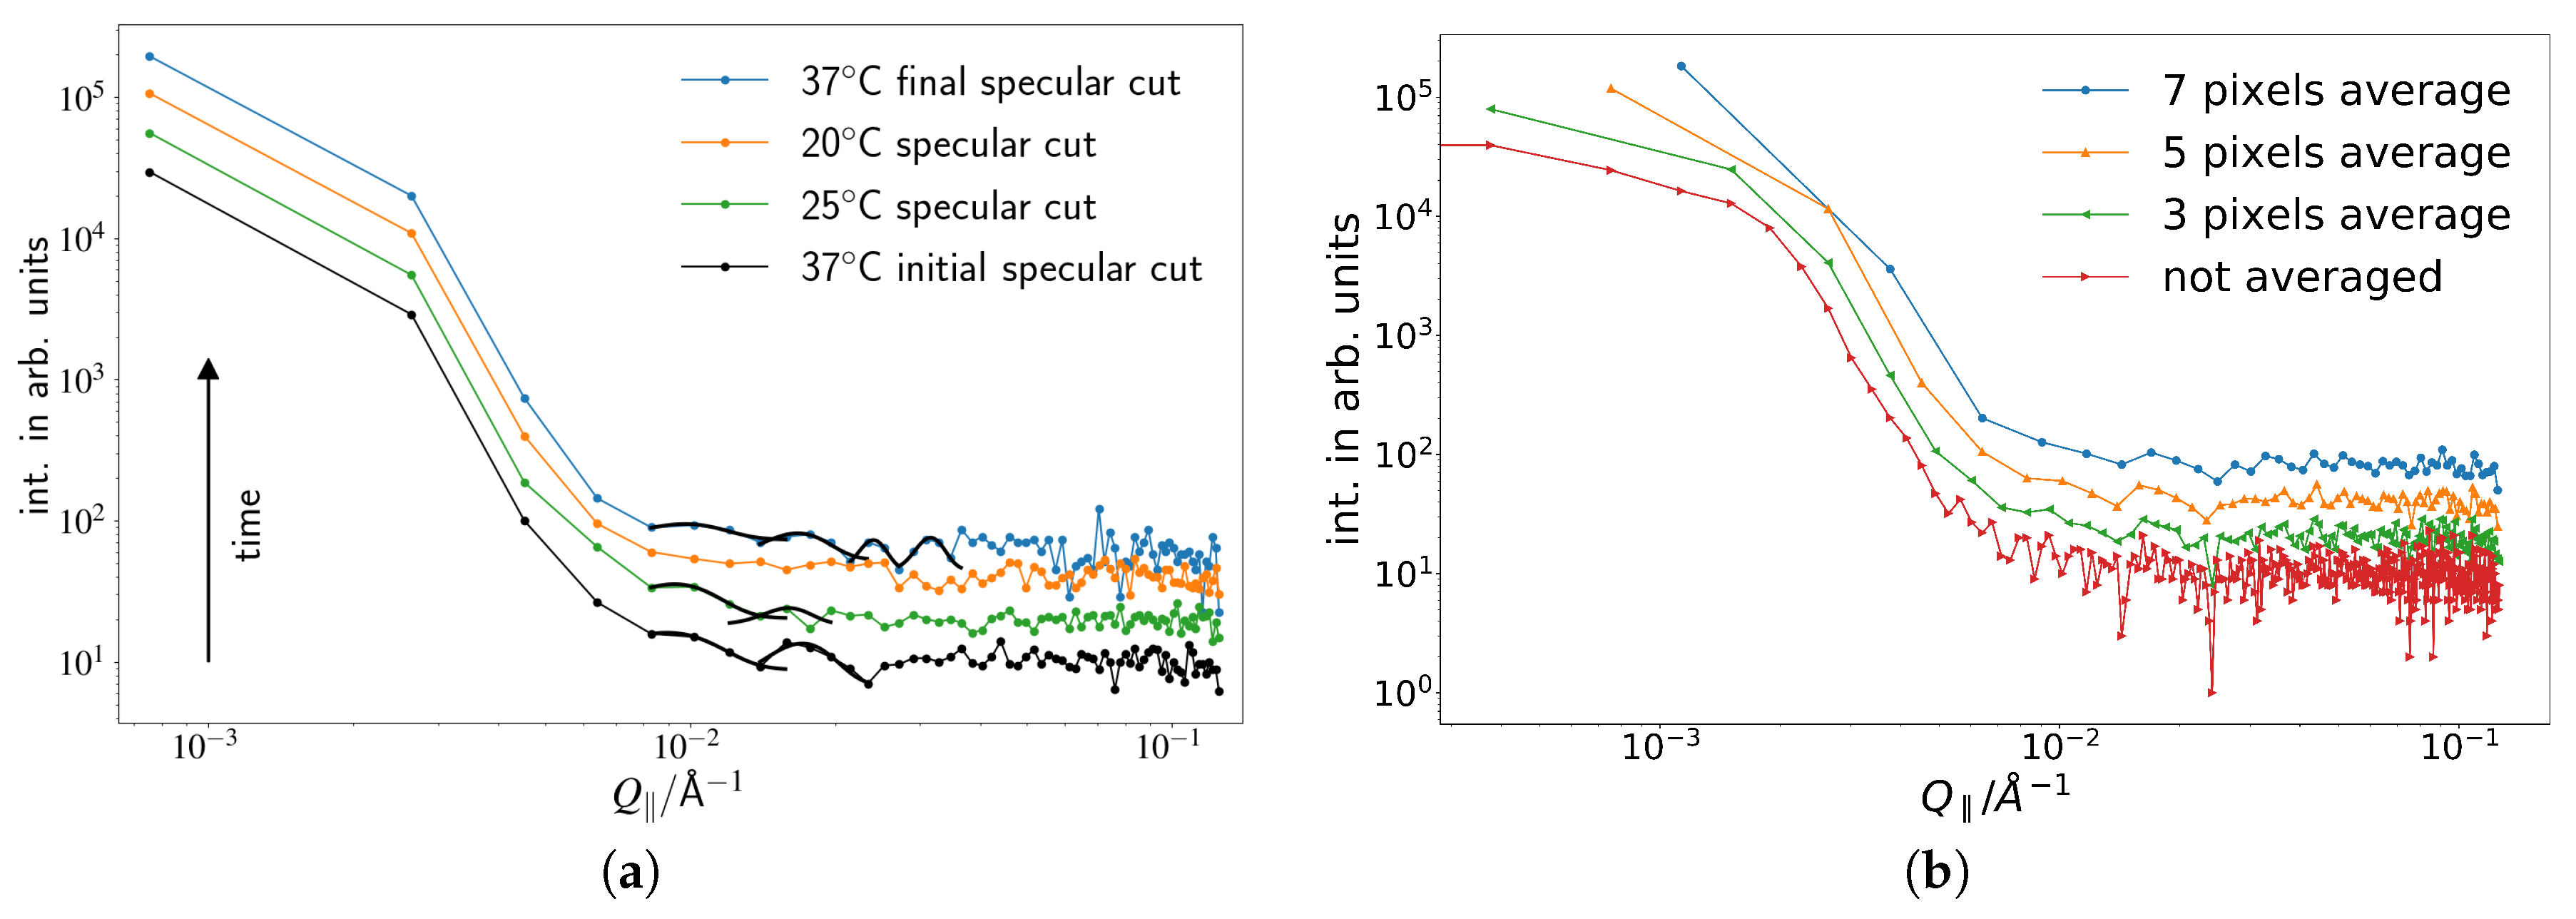
The vertical cuts as indicated are then analyzed by fitting Gaussians to the appearing peaks. The corresponding data is given in
Figure 2. In order to smooth the data, an average over five data points in in-plane direction is taken. This does not influence the occurrence of the described peaks, and several step width for averaging were tested in order to avoid data artifacts (see
Figure 2b).
By inspection of the data with the naked eye, the disappearance and reappearance of the peaks can be seen. The corresponding positions for the first peak, evaluated using a Gaussian Fit, are given in
Figure 3. The
-position of the first peak increases upon cooling down, corresponding to an increase in length scale, vanishes at 20
C and reappears when reheated to 37
C. Even though the original value cannot be reclaimed, a return of an identical peak can be claimed since the error bars are substantial. This is also supported by the fact that this curve was achieved after the peaks completely vanished during the 20
C measurement on the same sample. All other results of the Gaussian fits indicated in
Figure 2 are shown in
Table 1.
3. Discussion
The original assumption for the analysis in this manuscript was that the data presented in our previous manuscript [
1] produces a coherent wave package that could be measured by static coherent, elastic neutron scattering experiments. This assumption has been proven by the measurements shown here.
However, there is more to these measurements than just the test of an assumption, since these measurements also present an independent proof in terms of method for the phenomenon observed in our previous manuscript [
1]. In addition to that independent proof this also delivers a faster scanning method through other parameters, such as temperature or concentration for the existence of these wave modes, which then in turn can be used to prepare a GINSES measurement. Those measurements can then be used to extract additional data from phospholipid membrane systems, which have been hardly accessible up to now.
The length scale of the wave packages identified here is on the order of
Å. Compared to most dynamic or quasi-elastic measurements this is quite large [
6]. However, considering the usually overdamped nature of modes soft-matter systems, it is not surprising that, in membrane systems’ stable modes, if they occur have to occur at a long length scale. This could also have implications on protein function and macroscopic membrane behavior since those modes link areas together that are far apart if measured in units of phospholipids (several hundreds, depending on external parameters such as surface pressure).
The disappearance and reappearance of the data also preclude any instrumental bias or artifact.
Considering the possibilities for further evaluation of the data, there is little point in analyzing amplitudes or peak shape now, since the data is just visible above background. Thus, mainly the position of the maxima is of interest, in order to identify the length scales of the wave packages. Here, further improvement of the signal-to-noise ratio may render more insights into the behavior of the system.
Another fact worth mentioning is the apparent annealing effect after cycling the temperature, when higher order peaks appear.
4. Materials and Methods
A full report on the experiments discussed here was published earlier [
7]. Here, we describe sample preparation and instrument setup, both of which have proven to be crucial to gain reproducible data in previous experiments.
4.1. Sample
The sample consisted of SoyPC (l--phosphatidylcholine) prepared on a polished and hydrophilically treated silicon block. The sample was obtained from Avanti Polar Lipids, Alabaster, AL, USA. In preparation for the coating of the sample on the substrate, an RCA- cleaning of the surface was performed. After that, the silicon block was rinsed with copious amounts of millipor purified water and then blown dry with nitrogen. The block was placed into a frame to prevent oozing-off of the sample. The sample was then dissolved in isopropanol p.A. at room temperature and shaken for 20 min. The resulting solution was deposited on the silicon block in the horizontally aligned frame in an vacuum oven. Drying was performed over night at room temperature and 25 kPa. This ensured a slow drying that allowed for good self-assembly of the phospholipid membranes and was above the vapor pressure of the solution in order to prevent bubbling. The resulting fully dried sample (olfactory inspection) was then placed inside a closed aluminum block which was in turn filled with DO to achieve full hydration.
The sample was then temperature controlled by a water thermostat throughout the measurements.
4.2. Instrument Setup
In order to be able to resolve features close to the primary beam a sample aperture of 1 × 1 mm at MARIA was chosen. Under those conditions, Bragg scattering from the membranes is be negligible, due to the low intensity. However, we expected the features due to the standing wave to appear primarily around the specularly reflected beam in in-plane direction. The other collimation settings were adjusted accordingly to a 1 × 1 mm slit 4.1 m before the sample slit and the detector is positioned 3.6 m behind the sample. This setup should provide an optimum in signal-to-noise ratio for GISANS at MARIA. A wavelength of 10 Å and an incident angle of 0.2 was used for all measurements. Each measurement lasted for 6 h per temperature.
5. Conclusions
In this manuscript, we presented the measurement of a coherent signal from a dynamic mode by means of GISANS. This both independently proved the existence of the surface modes that caused that signal as shown in our previous manuscript [
1] as well as allows for a faster scanning for several parameters.
The surface modes have a structure size of approximately 700 Å and may contribute to membrane stability and membrane function, since they allow the dissipation of energy in the membrane and at the same time correlate areas of the membrane that are several hundred phospholid units apart. In addition to our previous measurements, a temperature dependence was also discovered, where the dynamic modes decrease at lower temperatures, and eventually vanish below 20 C. Here, it should be noted that the signal might simply be suppressed by background scattering.
Author Contributions
Conceptualization, S.J., O.H. and H.F.; Methodology, A.K. and S.J.; Software, S.J.; Analysis, S.J.; Writing—Original Draft Preparation, S.J.; Writing—Review and Editing, all authors.
Funding
This research received no external funding.
Acknowledgments
The authors gratefully acknowledge the granting of beam-time by the Heinz Maier-Leibnitz Centre (MLZ), Garching, Germany.
Conflicts of Interest
The authors declare no conflict of interest.
References
- Jaksch, S.; Holderer, O.; Gvaramia, M.; Ohl, M.; Monkenbusch, M.; Frielinghaus, H. Nanoscale rheology at solid-complex fluid interfaces. Sci. Rep. 2017, 7, 4417. [Google Scholar] [CrossRef] [PubMed]
- Constantin, D.; Brotons, G.; Salditt, T.; Freyssingeas, É.; Madsen, A. Dynamics of bulk fluctuations in a lamellar phase studied by coherent X-ray scattering. Phys. Rev. E 2006, 74, 031706. [Google Scholar] [CrossRef] [PubMed]
- Caille, A. Remarques sur la diffusion des rayons X dans les smectiques. CR Acad. Sci. Ser. B 1972, 274, 891–893. [Google Scholar]
- Jaksch, S.; Lipfert, F.; Koutsioubas, A.; Mattauch, S.; Holderer, O.; Ivanova, O.; Frielinghaus, H.; Hertrich, S.; Fischer, S.F.; Nickel, B. Influence of ibuprofen on phospholipid membranes. Phys. Rev. E 2015, 91, 022716. [Google Scholar] [CrossRef] [PubMed]
- Mattauch, S.; Koutsioubas, A.; Rücker, U.; Korolkov, D.; Fracassi, V.; Daemen, J.; Schmitz, R.; Bussmann, K.; Suxdorf, F.; Wagener, M.; et al. The high-intensity reflectometer of the Jülich Centre for Neutron Science: MARIA. J. Appl. Crystallogr. 2018, 51, 646–654. [Google Scholar] [CrossRef] [PubMed]
- Fragneto, G.; Rheinstädter, M. Structural and dynamical studies from bio-mimetic systems: An overview. C. R. Phys. 2007, 8, 865–883. [Google Scholar] [CrossRef]
- Jaksch, S.; Koutsioubas, A.; Mattauch, S.; Holderer, O.; Frielinghaus, H. Preliminary Report on Measurements of Dynamic Contributions to Coherent Neutron Scattering. arXiv, 2018; arXiv:1803.11041. [Google Scholar]
© 2018 by the authors. Licensee MDPI, Basel, Switzerland. This article is an open access article distributed under the terms and conditions of the Creative Commons Attribution (CC BY) license (http://creativecommons.org/licenses/by/4.0/).

 ,
, 


