Characterization of Multimodal Silicas Using TG/DTG/DTA, Q-TG, and DSC Methods
by
 , ,
, ,
Barbara Charmas
1,* ,
,
Karolina Kucio
1,
Volodymyr Sydorchuk
2,
Svitlana Khalameida
2,
Magdalena Zięzio
1 and
Aldona Nowicka
1 1
Faculty of Chemistry, Department of Chromatographic Methods, Maria Curie-Skłodowska University, Maria Curie-Skłodowska Sq.3, 20-031 Lublin, Poland
2
Institute for Sorption and Problems of Endoecology of NAS of Ukraine, 13 Naumov Str., 03164 Kyiv, Ukraine
*
Author to whom correspondence should be addressed.
Colloids Interfaces 2019, 3(1), 6; https://doi.org/10.3390/colloids3010006
Submission received: 10 December 2018
/
Revised: 21 December 2018
/
Accepted: 22 December 2018
/
Published: 28 December 2018
(This article belongs to the Special Issue Selected Papers from XVI Polish–Ukrainian Symposium on Theoretical and Experimental Studies of Interfacial Phenomena and their Technological Applications)
Abstract
:The formation of hierarchical, multimodal porosity materials with controlled shape and size of pores is the essential challenge in materials science. Properties of silica materials depend largely on different features: crystal structure, dispersity, surface composition, and porosity as well as the method of preparation and possible modification. In this paper, multimodal silicas obtained using different additives are presented. A-50 and A-380 aerosils and wide-porous SiO2 milled at 300 rpm were used as the additives in the sol stage at 20 °C, the sol–gel stage followed by hydrothermal modification (HTT) at 200 °C, or in the mechanochemical treatment (MChT) process. The characterizations were made by application of N2 adsorption/desorption, SEM imaging, quasi-isothermal thermogravimetry (Q-TG), dynamic thermogravimetry/derivative thermogravimetry/differential thermal analysis (TG/DTG/DTA), and cryoporometry differential scanning calorimetry (DSC) methods. Results showed that such a one-step preparation method is convenient and makes it possible to obtain multimodal silicas of differentiated porous structures and surface chemistry.
1. Introduction
Silica belongs to the oxide materials commonly used as efficient adsorbents, phases or phase carriers for gas or liquid chromatography, supports for active phases in catalysis, dispersion agents, and in numerous other applications [1,2]. With so many applications, a very important challenge for materials science is the development of a SiO2 preparation method with diverse porous structures and physicochemical properties. A special case is materials with an ordered structure and those characterized by multimodal porosity. Such materials are prepared using, for example, polystyrene latex spheres, a novel block of copolymers and templates (an ionic liquid surfactant) [3], or close-packed polystyrene beads, octadecyltrimethylammonium chloride (template), and tetraethoxysilane (TEOS) [4]. However, a new, attractive method of obtaining such silicas can be the use of SiO2 additive of various origins and structures in the selected stage of the traditional sol–gel procedure [5]. The second component can be added in the sol or gel stage using specific processes, e.g., hydrothermal treatment (HTT) or mechanochemical treatment (MChT).
Due to the specific structure of dry materials, it is necessary to characterize both the shape and size of the pores as well as surface chemistry with full particulars. The term ”silica” indicates a substance of stoichiometric composition, i.e., SiO2, but it also includes hydrated structures of SiO2·xH2O composition. This means that water is chemically bound with the SiO2 surface in a nonstoichiometric amount. Such –OH groups also determine some important properties [6,7]. Thus, it is necessary to elaborate a convenient method to characterize the porosity of multimodal silicas. Many modern research methods are used to assess the characteristics of silica materials. These include, among others, adsorption of different gases and liquids, thermal analysis under dynamic or quasi-isothermal conditions [8,9,10,11,12,13,14,15], FTIR and NMR spectroscopies [8,9,14,16,17,18], ESR [8], SEM or TEM imaging [8,9], and many other methods.
The aim of the paper was to study the structural and thermal properties of multimodal silicas of different origins. The silicas were obtained using the addition of the second component (SiO2 as well) in the sol stage at 20 °C, the sol–gel transition at 200 °C under hydrothermal conditions (HTT), or in the wet gel stage during MChT. Characterization was made by application of N2 adsorption/desorption as well as SEM. Moreover, three different methods of studying the interactions between the SiO2 surface and water were utilized: (1) quasi-isothermal desorption of water from the silica surface and the internal spaces (Q-TG), (2) thermogravimetry under dynamic conditions to characterize the amount and character of surface hydroxyl groups (thermogravimetry/derivative thermogravimetry/differential thermal analysis (TG/DTG/DTA)), and (3) differential scanning calorimetry (DSC) used as a cryoporometric method.
2. Materials and Methods
2.1. Preparation
The initial silica was prepared by means of the sol–gel procedure using acid hydrolysis–polycondensation of tetraethoxysilane (TEOS) [4]. The nonporous fumed silica aerosils A-50 and A-380 (specific surface area SBET = 50 and 370 m2 g−1, particle sizes: 44 and 6 nm, respectively) and the commercial wide-porous silica gel SiO2 (SBET = 270 m2 g−1) were used as additives (the second component). The porous silica was preliminarily subjected to milling at 300 rpm in water (SiO2-MChT) [8,9].
The introduction of additives into the reaction mixture was made in different ways: in the sol stage at 20 °C in air (samples 1, 2, and 3), the sol–gel transition at 200 °C in the autoclave (HTT, samples 4, 5, 6, and 7), or in the wet gel stage during MChT at 300 rpm (samples 8, 9, 10) or 500 rpm (sample 11). MChT was performed using the ball mill Pulverisette-7 (Fritsch, Germany).
2.2. Textural Characteristics
The low-temperature (−195 °C) isotherms of nitrogen adsorption/desorption were measured using an ASAP 2010 adsorption analyzer (Micromeritics). The specific surface areas (SBET) were calculated from the isotherms using the Brunauer–Emmett–Teller (BET) method. The total pore volume (Vp) was equal to that of liquid nitrogen adsorbed at p/po ≈ 0.98 (p and po denote the equilibrium and saturation pressure of nitrogen at −195.8 °C, respectively). Assuming the cylindrical shape of pores, the average pore radius was calculated as R = 2Vp/SBET [19]. The nitrogen desorption data were used to calculate the pore size distribution (PSD, differential fV(R)~dVp/dR and fS(R)~dS/dR) using the self-consistent regularization (SCR) procedure under non-negativity condition (fV(R) ≥ 0 at any pore radius R) at the fixed regularization parameter α = 0.01. A pore model was applied with cylindrical (C) pores and voids (V) between the spherical aggregates of primary nonporous nanoparticles, NPNP packed in random aggregates (self-consistent regularization (SCR) procedure applied to integral adsorption equations based on a complex model with slit-shaped and cylindrical pores and voids between spherical nonporous particles packed in random aggregates (SCV), SCV/SCR method) [20]. The differential fS(R) functions were recalculated to the incremental pore-size distribution (IPSDv, dV/dR = f(R)) using the procedure described in Reference [21]. The differential fS(R) functions were used to estimate the deviation (Δw) of the pore shape [21]. The fV(R) functions were also used to calculate the contribution of micropores (Vmicro, Smicro for Rp < 1 nm), mesopores (Vmeso, Smeso for 1 nm < Rp < 25 nm), and macropores (Vmacro, Smacro for Rp > 25 nm) [10,22,23]. The obtained results are summarized in Table 1.
2.3. Thermal Analysis
The thermal studies of the samples were carried out during heating in air using a derivatograph C (Paulik, Paulik & Erdey, MOM, Budapest). TG/DTG/DTA curves were registered. Ceramic crucibles were used.
Thermal analysis of tested silicas under dynamic conditions was performed in order to calculate the number of hydroxyl groups present on the surface. The initial water content in the samples depends on the modification method. Therefore, before the measurements, the samples were dried in oven at 200 °C to remove the physically bound water. Dry silicas (ms ~10 mg) were then heated up to 1200 °C (10 °C min−1). On the basis of mass losses in different temperature ranges, the contents of vicinal silanol groups (200–400 °C), germinal silanol groups (400–900 °C), and isolated silanol groups (900–1200 °C) on the surface of silicas were calculated. It should be noted that the former can form surface and structural hydrogen bonds, while the latter do not combine with each other by hydrogen bonds because the distances between them are too short. Simultaneously, internal (structural) –OH groups were removed when the temperature increased from 200 °C to 900 °C. As a result, only siloxane groups were present on the silica surface at a temperature higher than 1200 °C [24]. Moreover, the total water content was calculated on the basis of mass loss in the range of 20–1200 °C.
The concentration of hydroxyl groups in relation to the mass of silica υOH (mmole g−1) was calculated according to the following equation:
where 18 is the molar mass of water, and Δm denotes the sample mass loss (% w/w). It should be mentioned that two OH surface groups form one water molecule. However, the concentration of hydroxyl groups in relation to the specific surface area OH (σOH [OH nm−2]) was determined from the de Boer equation [25]:
where S denotes the specific surface area, and Δm denotes the sample mass loss (% w/w).
2.4. Quasi-Isothermal Desorption of Water
Water thermodesorption under the quasi-isothermal conditions was performed under the conditions of low coverage of the surface with adsorbed water. The water vapor was adsorbed on the silica surface at 20 °C. A portion (ca. 1 g) of adsorbent was placed in a desiccator containing bidistilled water for 72 h. Then, the weighed portions (ca. 25 mg) of the adsorbents were placed in a spherical spiral platinum crucible. Al2O3 was used as a reference material. The measurements were performed in the temperature range of 20–300 °C using a derivatograph C (Paulik, Paulik and Erdey, MOM, Hungary).
The experimental Q-TG data corresponded to the water mass loss with increasing temperature. When measurements are performed over a temperature range without sample mass changes, then the Δm = f(T) dependence reflects the changes in concentration of the water adsorbed on the adsorbent surface under equilibrium. The procedure has been previously described in detail [11,12,26,27,28].
The quasi-isothermal thermogravimetric analysis can be used to characterize energetic and structural heterogeneity of silica surfaces and allows to determine changes in the free energy of adsorbed water layer during their desorption as well as the dependence of the effective radius of a drop evaporated from the surface on the adsorbed water concentration. Additionally, during such investigations, the structure of water layers adsorbed on the silica surface was determined. The dependences dG/dMH2O = f(CH2O) were examined under the conditions of low coverage of the adsorbent surface with the adsorbed water. Such analysis can show the formation of various types of water clusters on the heterogeneous surfaces.
On the basis of the obtained data, the total concentrations of water adsorbed on the surface of studied adsorbents (mg g−1) were calculated. The number of statistical monolayers “n” of water was determined from the following formula [28]:
where TGmax is the maximum mass loss at 300 °C (mg g−1), N is the Avogadro number, ω is the surface occupied by one adsorbed water molecule (assumed 0.09 nm2), SBET is the specific surface area of the tested adsorbents (m2 g−1), and M is the molar mass of water (18 g mol−1).
2.5. DSC Investigations
DSC examination of interactions between the silica surface and water was performed using a differential scanning calorimeter (PYRIS Diamond, Perkin Elmer Instruments, USA) at the constant freezing/melting rate of 2 °C min−1. PYRIS Diamond DSC was calibrated using distilled water (melting temperature Tm = 0 °C) and the standard indium sample (Tm = 156.6 °C) using the standard calibration procedure.
Before the investigations, the samples were prepared according to the procedure used for Q-TG measurements. The saturated samples (about 5 mg) were sealed into aluminum pans. As a reference, an empty aluminum pan was used. Measurements were made in the helium atmosphere (inert gas). In order to prevent system defrosting, curtain gas (nitrogen) was used. The freezing/melting studies were carried out in the temperature range of +20 to −50 °C. The melting thermograms were used to determine the PSD curves and define the temperature of the maximum (Tmax) and the beginning (Tonset) of the peaks as well as the thermal (∆H) characteristics of the outgoing phase transformations.
In cryoporometry DSC, the fact of the depression of liquids’ freezing point because of confining effect in the pores can be observed. The degree of pore filling by media of different polarity depends on the surface nature of a tested material and is related to the porosity. In this study, it was assumed that the ice in the pores of Rmin size melts at Tonset, while the temperature Tmax corresponds to the melting of water in the pores of Rav. The correlation between the liquid freezing point depression and the cylindrical pore radius Rp [nm] is described by the Gibbs–Thomson equation (GT) [26,27,28,29,30]:
where Tm and Tm0 are the temperatures of melting of ice confined in the pores in the bound and bulk forms, respectively, and kGT is the constant (kGT = 32.33 K∙nm). The PSD dV/dR [cm3 nm−1 g−1] was determined from the ice melting thermogram:
where dq/dt, ρ, β, m, and ∆H(T) are the heat flow, the ice density, the rate of changes of temperature, the sample mass, and the ice melting enthalpy, respectively. The water density is expressed as follows:
The ΔH [J g−1] dependence on the temperature was calculated from the following equation:
2.6. Scanning Electron Microscopy
The morphology and structure of the silica aggregates were analyzed using SEM with a DualBeam Quanta 3D FEG FEI apparatus under low vacuum conditions at the accelerating voltage of 30 kV and magnification up to 100,000×. The samples were fixed to the aluminum tables with a diameter of 10 mm and covered with the adhesive carbon film.
3. Results and Discussion
3.1. Structural Analysis
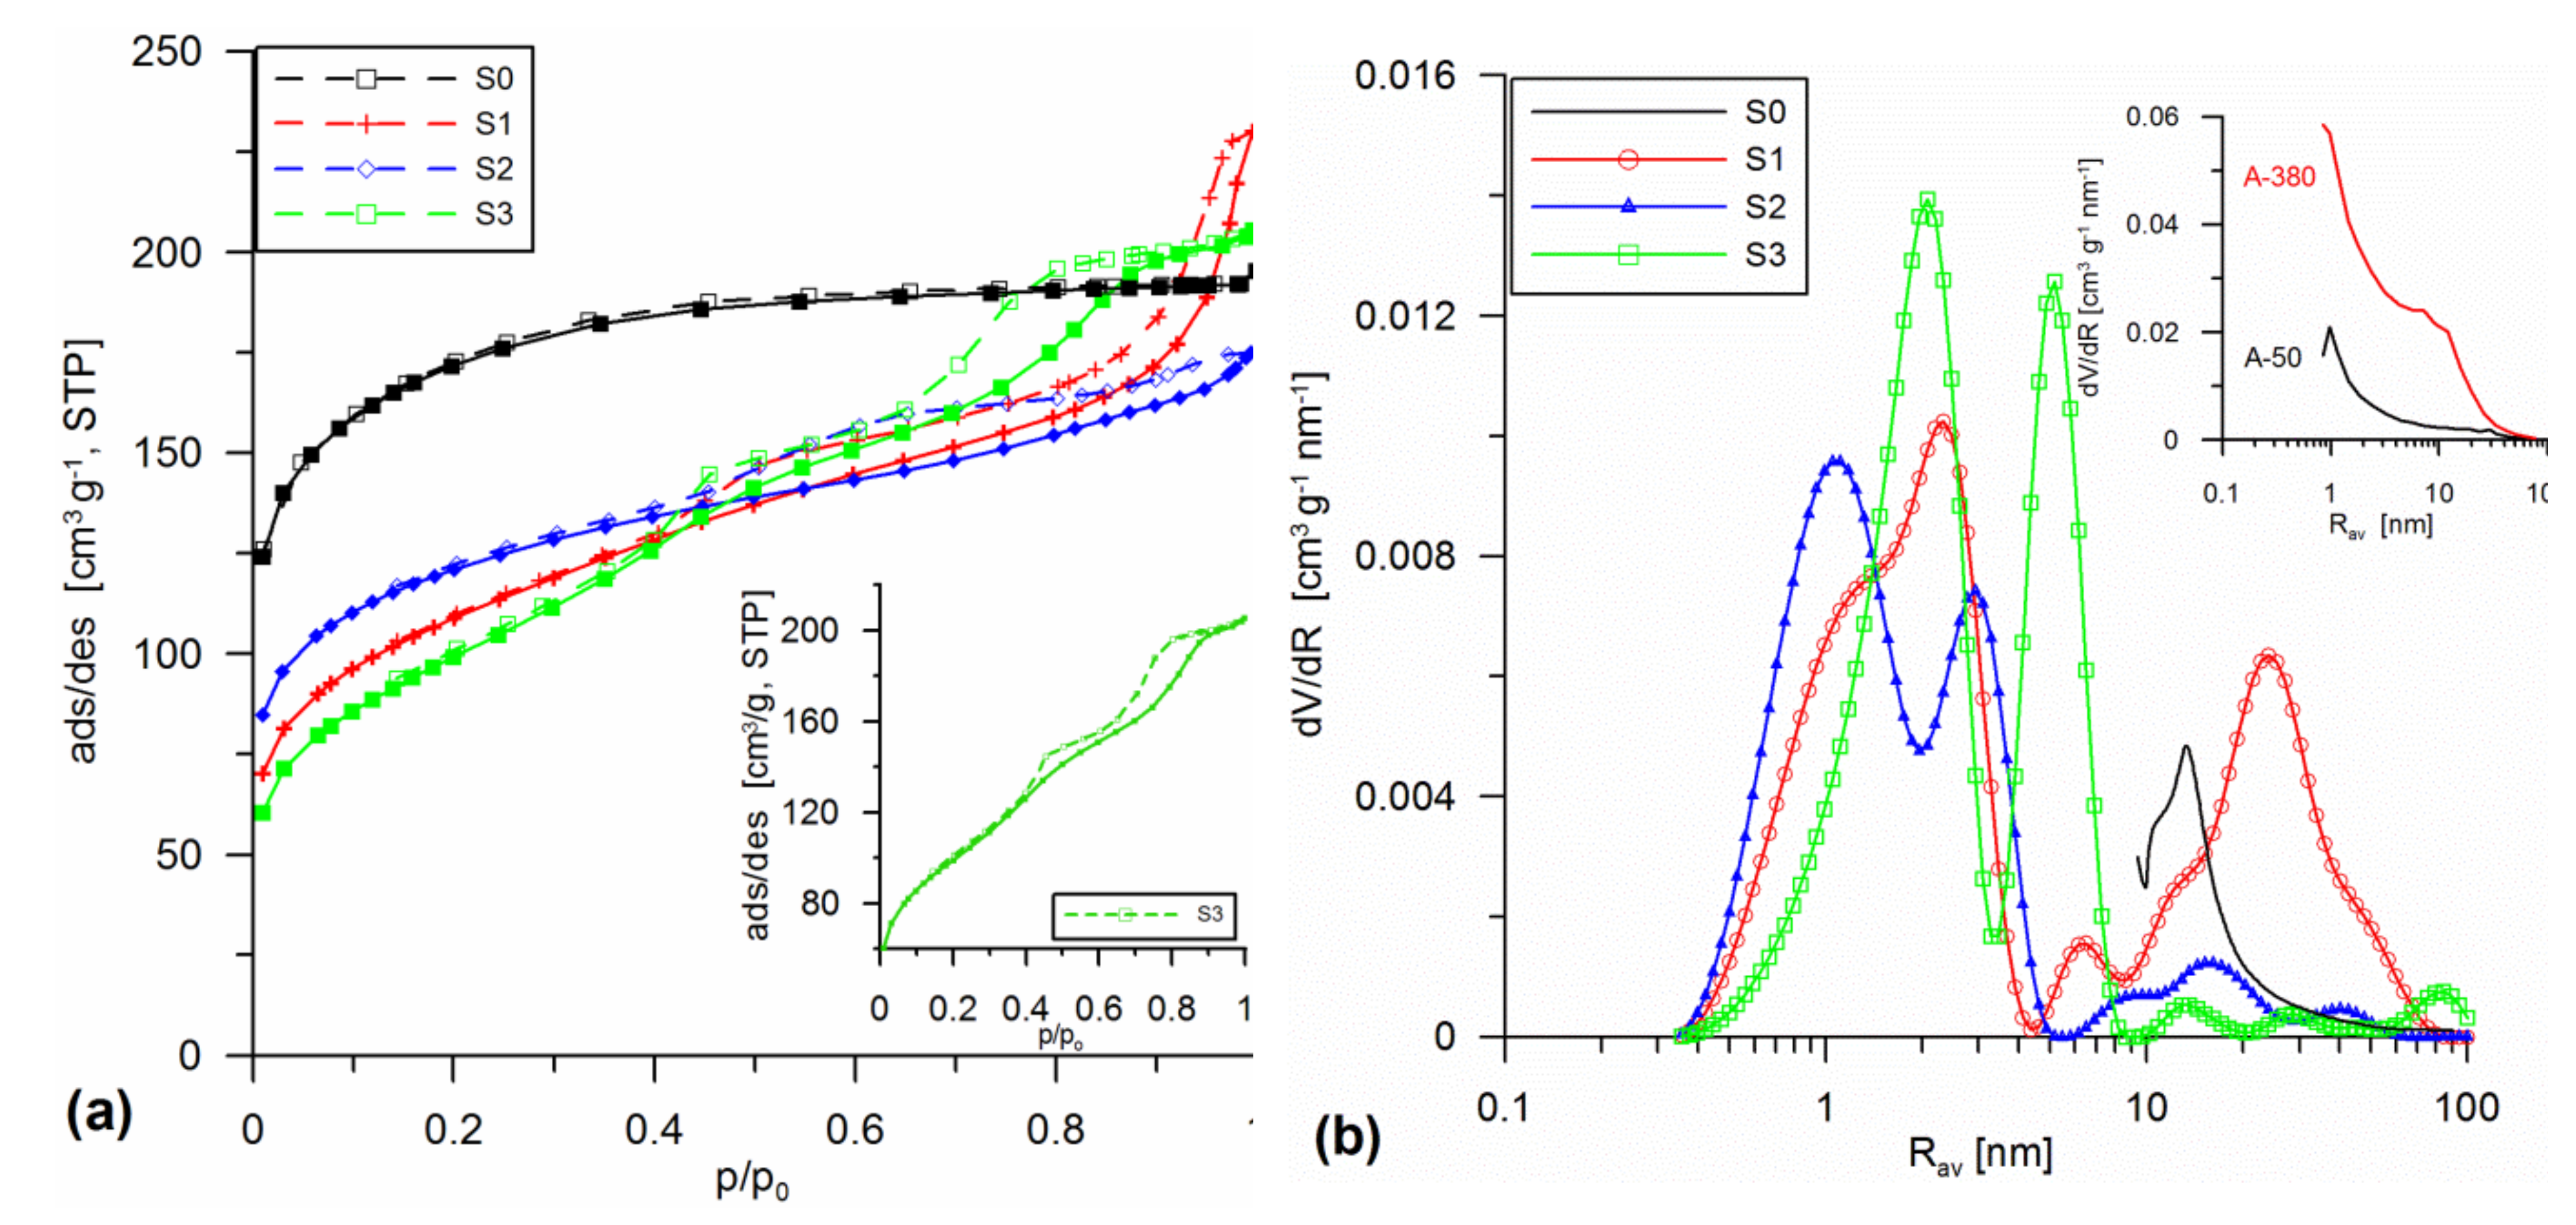
Figure 1, Figure 2 and Figure 3 present the low-temperature nitrogen adsorption/desorption isotherms as well as the PSD curves for the silicas that were prepared during the addition of various dispersed silicas (aerosils or milled silica gels) in the sol stage (Figure 1) or as a result of mechanochemical (Figure 2) or hydrothermal (Figure 3) modifications. Table 1 includes the designation and structural parameters of the obtained materials. The course of analyzed curves indicated that each of the modifications affected the porous structure parameters of the materials. The shape of the initial material isotherms (S0, type 1 according to the International Union of Pure and Applied Chemistry (IUPAC) classification [31], a lack of hysteresis loop) with the addition of A-50 (S1) and A-380 (S2) in the sol stage caused appearance of hysteresis loops (loop H1) on the isotherms of the modified samples (type IV, Figure 1a), indicating the creation of cylindrical pores of differentiated radii dominating Rdom. The addition of 30% fumed silica A-50 (S1) led to the formation of pores of Rav = 1.85 nm (Rdom ~2.3 nm and about 24 nm radii). However, the addition of 10% A-50 and 10% A-380 (S2) resulted in the formation of pores of Rav = 1.25 nm (Rdom ~1 and 3 nm (S2, Figure 1)). This differentiation was due to the differences in structure and porosity of the additive (A-50: SBET = 50 m2 g−1, particle diameter Dg = 44 nm; A-380: SBET = 370 m2 g−1, Dg = 6 nm). The addition of 20% SiO2-MChT to the structure of the initial material in the sol stage (S3) resulted in the formation of a type of hysteresis loop with a complex profile, indicating the presence of pores of different sizes (Figure 1a inset). This was also reflected in the PSD curves calculated by SCR. The PSD curves indicated the presence of pores of the radii Rdom ~2.1 and 5 nm (Figure 1b, Table 1). Intensive changes of the obtained silicas were clearly visible when comparing their structures with those of additives A-50 and A-380. This was particularly evident on the PSDV curves (Figure 1b inset).
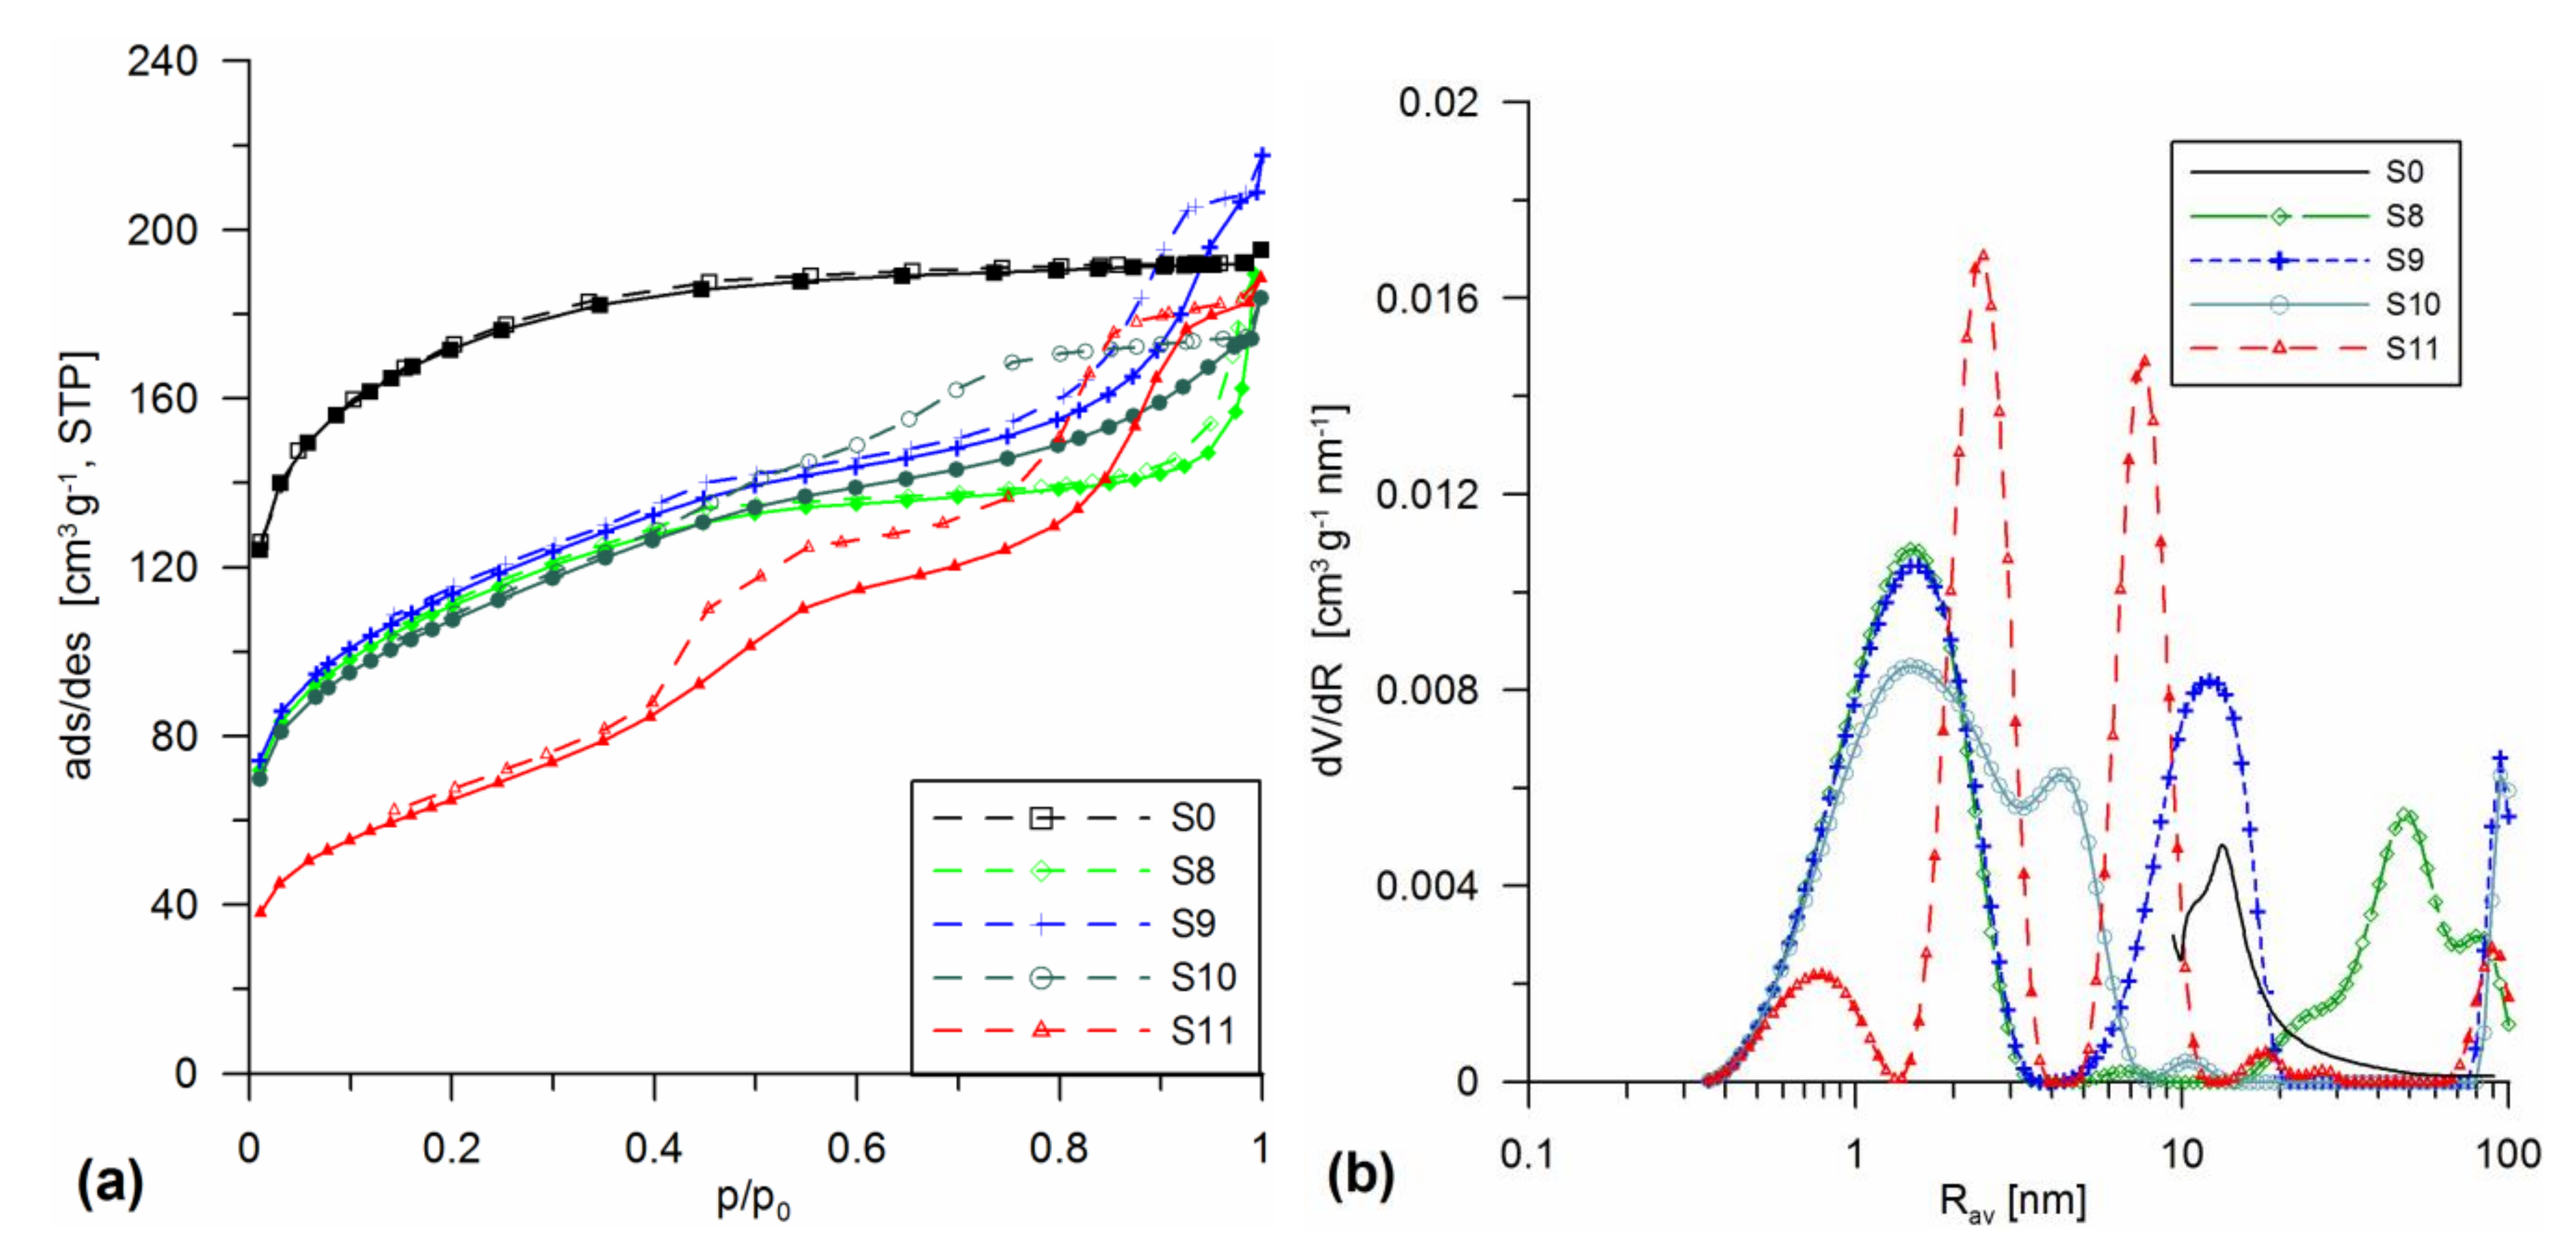
Figure 2 presents the nitrogen adsorption/desorption isotherms as well as the PSD curves for the materials obtained with the differentiated silica additives (A-50 (S8), A-380 (S9), A-50 + A-380 mixture (S10), and SiO2-MChT (S11)) in the gel stage followed by mechanochemical milling at 300 or 500 rpm. In all cases, intensive changes of the structure were observed compared to the initial material (S0) due to the dispersed silica addition. The addition of both A-50 (sample S8), A-380 (S9) and application of their mixture (A-50 + A-380, sample S10) caused the obtained materials to be characterized by type IV isotherms (Figure 2a) according to the IUPAC classification [31]. However, their hysteresis loops had a complex shape, indicating the differentiated shapes of the pores contained in these materials. These were mostly spherical pores with numerous narrowings and open bottle-shaped terminations. The reason for this was a kind of treatment during which the mechanical deformation of structure could take place. A faintly developed maximum at Rdom ~ 1.5 nm, 6 nm, and ~50 nm appeared on the PSD curve obtained for sample S8. The shapes of the other curves (S9 and S10) also indicated a complex, multimodal character of porous structure, with maxima at 1.5 and 12 nm (S9) and 1.5 and 4.2 nm (S10). The most differentiated silica material of multimodal structure was obtained during milling with the addition of SiO2-MChT at 500 rpm (S11). The increased mill rotation caused the obtained silica to be characterized by the complex hysteresis loop (Figure 2a), and the PSD curve possessed three distinct maxima, indicating the presence of pores with the radii Rdom ~0.8, 2.5, and 7.7 nm (Figure 2b, Table 1).
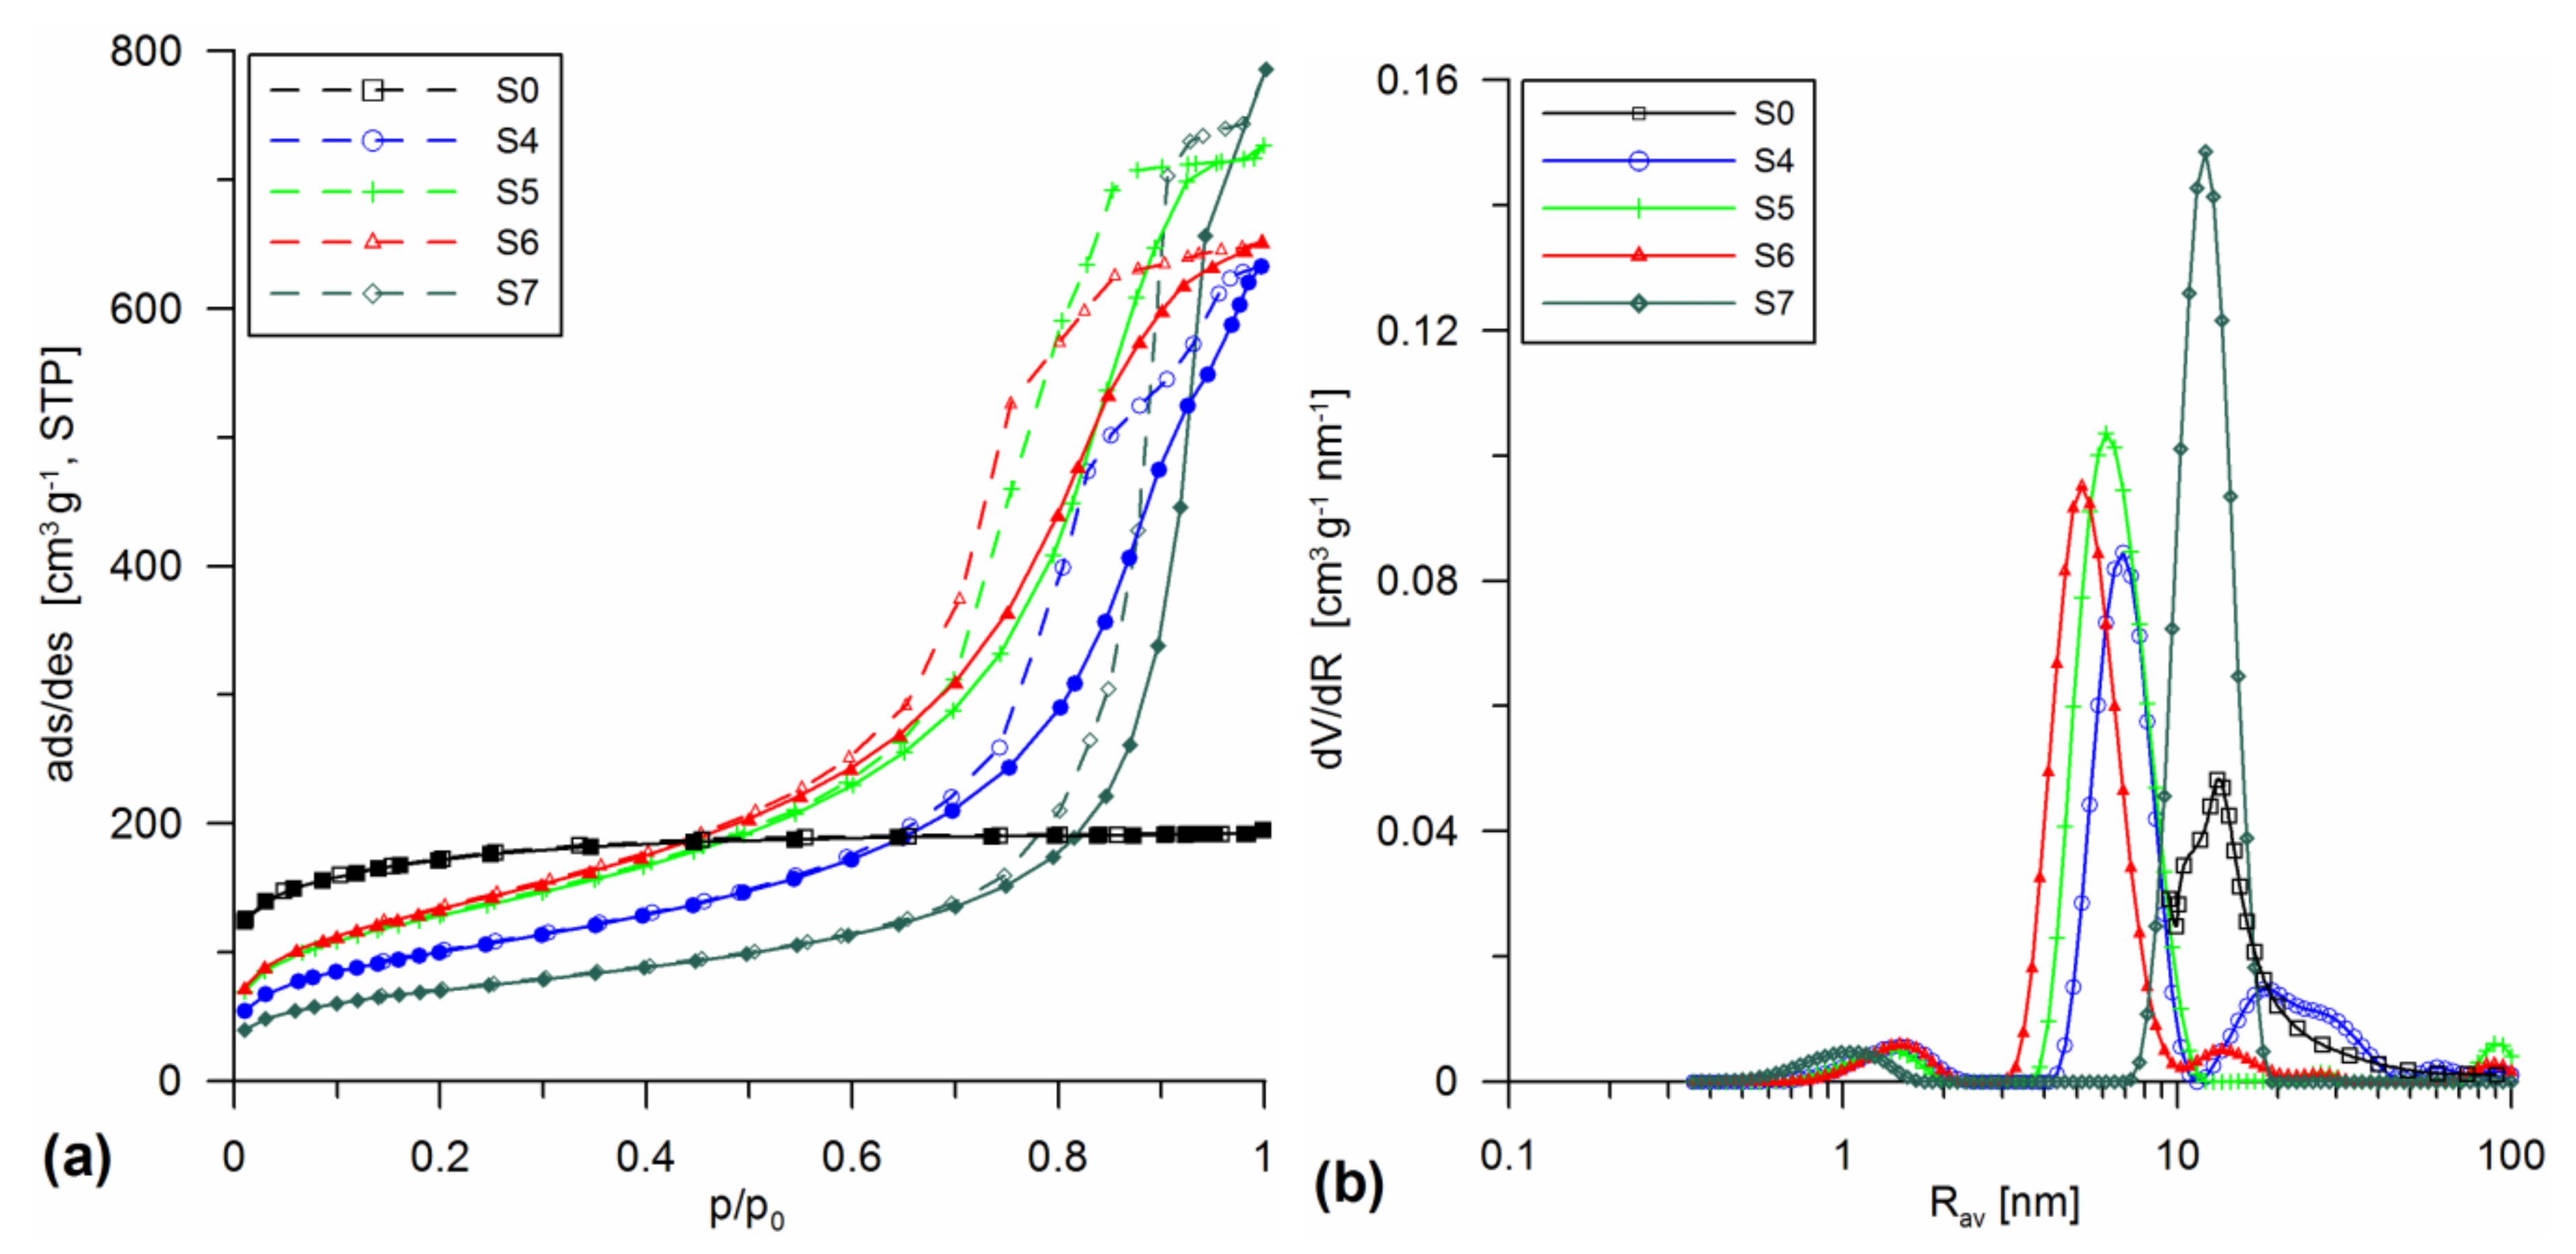
Figure 3 presents the isotherms and PSD curve obtained for the materials prepared using the differentiated silica additives (A-50 (S4), A-380 (S5), A-50 + A-380 mixture (S6), and SiO2-MChT (S7)) in the sol stage followed by hydrothermal treatment at 200 °C. The shape of the analyzed isotherms indicated that this kind of modification had the most significant effect on the redevelopment of the silica surface structure. The obtained type IV isotherms (Figure 3a) were characterized by well-developed hysteresis loops, indicating the creation of mesoporous structure. The obtained materials possessed the pores of unified sizes about ~1 to ~6 nm. Only sample S7 possessed pores of Rdom ~12 nm (Figure 3b). As can be seen from the analysis of the data in Table 1, all materials had a slightly developed structure of macropores. Although the maxima can be seen in the region Rav > 50 nm on the PSDv curves (Figure 1b, Figure 2b, and Figure 3b), they are slightly developed.
The parameters included in Table 1 indicate that the kind of additives (A-50, S-380, SiO2-MChT) significantly affected the development of specific surface area SBET. The materials obtained with the addition of A-380 were characterized by the largest surface areas with SBET quantities ranging from ~380 to ~487 m2 g−1, whereas the lowest SBET values were observed for the silicas with the addition of wide-porous, ground SiO2-MChT. However, the kind of modification also significantly affected the surface development and porous structure. The addition of the second component (A-50 or A-380) in the sol stage or using the mechanochemical modification enabled the preparation of micro/mesoporous structure materials. The contribution of both types of pores (S1 and S2) was ~50% (%S and %V). Using SiO2-MChT as the additive led to preparation of materials with significant dominance of mesopores (76.8% − %Smeso, 88.6% − %Vmeso, Table 1), regardless of the modification method.
Hydrothermal modification proved to be the most effective. The obtained materials (S4, S5, S6, and S7) were mainly mesoporous (%Smeso ~72.4–96.6%, %Vmeso ~90.6–97.7%, Table 1) of radii (Rp) and total pore volume (Vp) larger than for the materials prepared by other methods (addition in the gel or MChT stage). This was due to the essence of hydrothermal modification during which dissolution of small silica molecules and their deposition on larger molecules take place. Such mass transport results in significant redevelopment of the structure [10,32,33].
Modifications of porous structure resulting in differentiation of pore shapes and sizes, as evidenced in broad bands on the PSD curves (Figure 1b, Figure 2b, Figure 3b), caused some deviation in the applied CV/SCR model. This was clearly seen as the values Δw (Table 1) indicated a wide range of deviation from the assumed (cylindrical) model of pores.
3.2. Thermoporometry DSC
The analysis of thermograms of ice melting in the pores of studied materials pointed out the multistage course of this process. The characteristic temperatures of water freezing and ice melting in sample S1 determined from the thermograms DSC are presented in Table 2.
As can be seen from the data in Table 2, the water in the S1 material froze up to −37.93 °C, although the freezing point of volumetric water is 0 °C. Such reduction in Tonset was observed for all samples. The reduction in ice freezing temperature in relation to the standard temperature (0 °C) was the result of strong interactions of water with the surface of narrow pores of the studied materials. The multistage phase transformations indicated differentiated porosity of silica materials, which was also confirmed by the PSDV curves determined by cryoporometry DSC (PSDV-DSC; Figure 4) obtained from the ice melting thermograms.
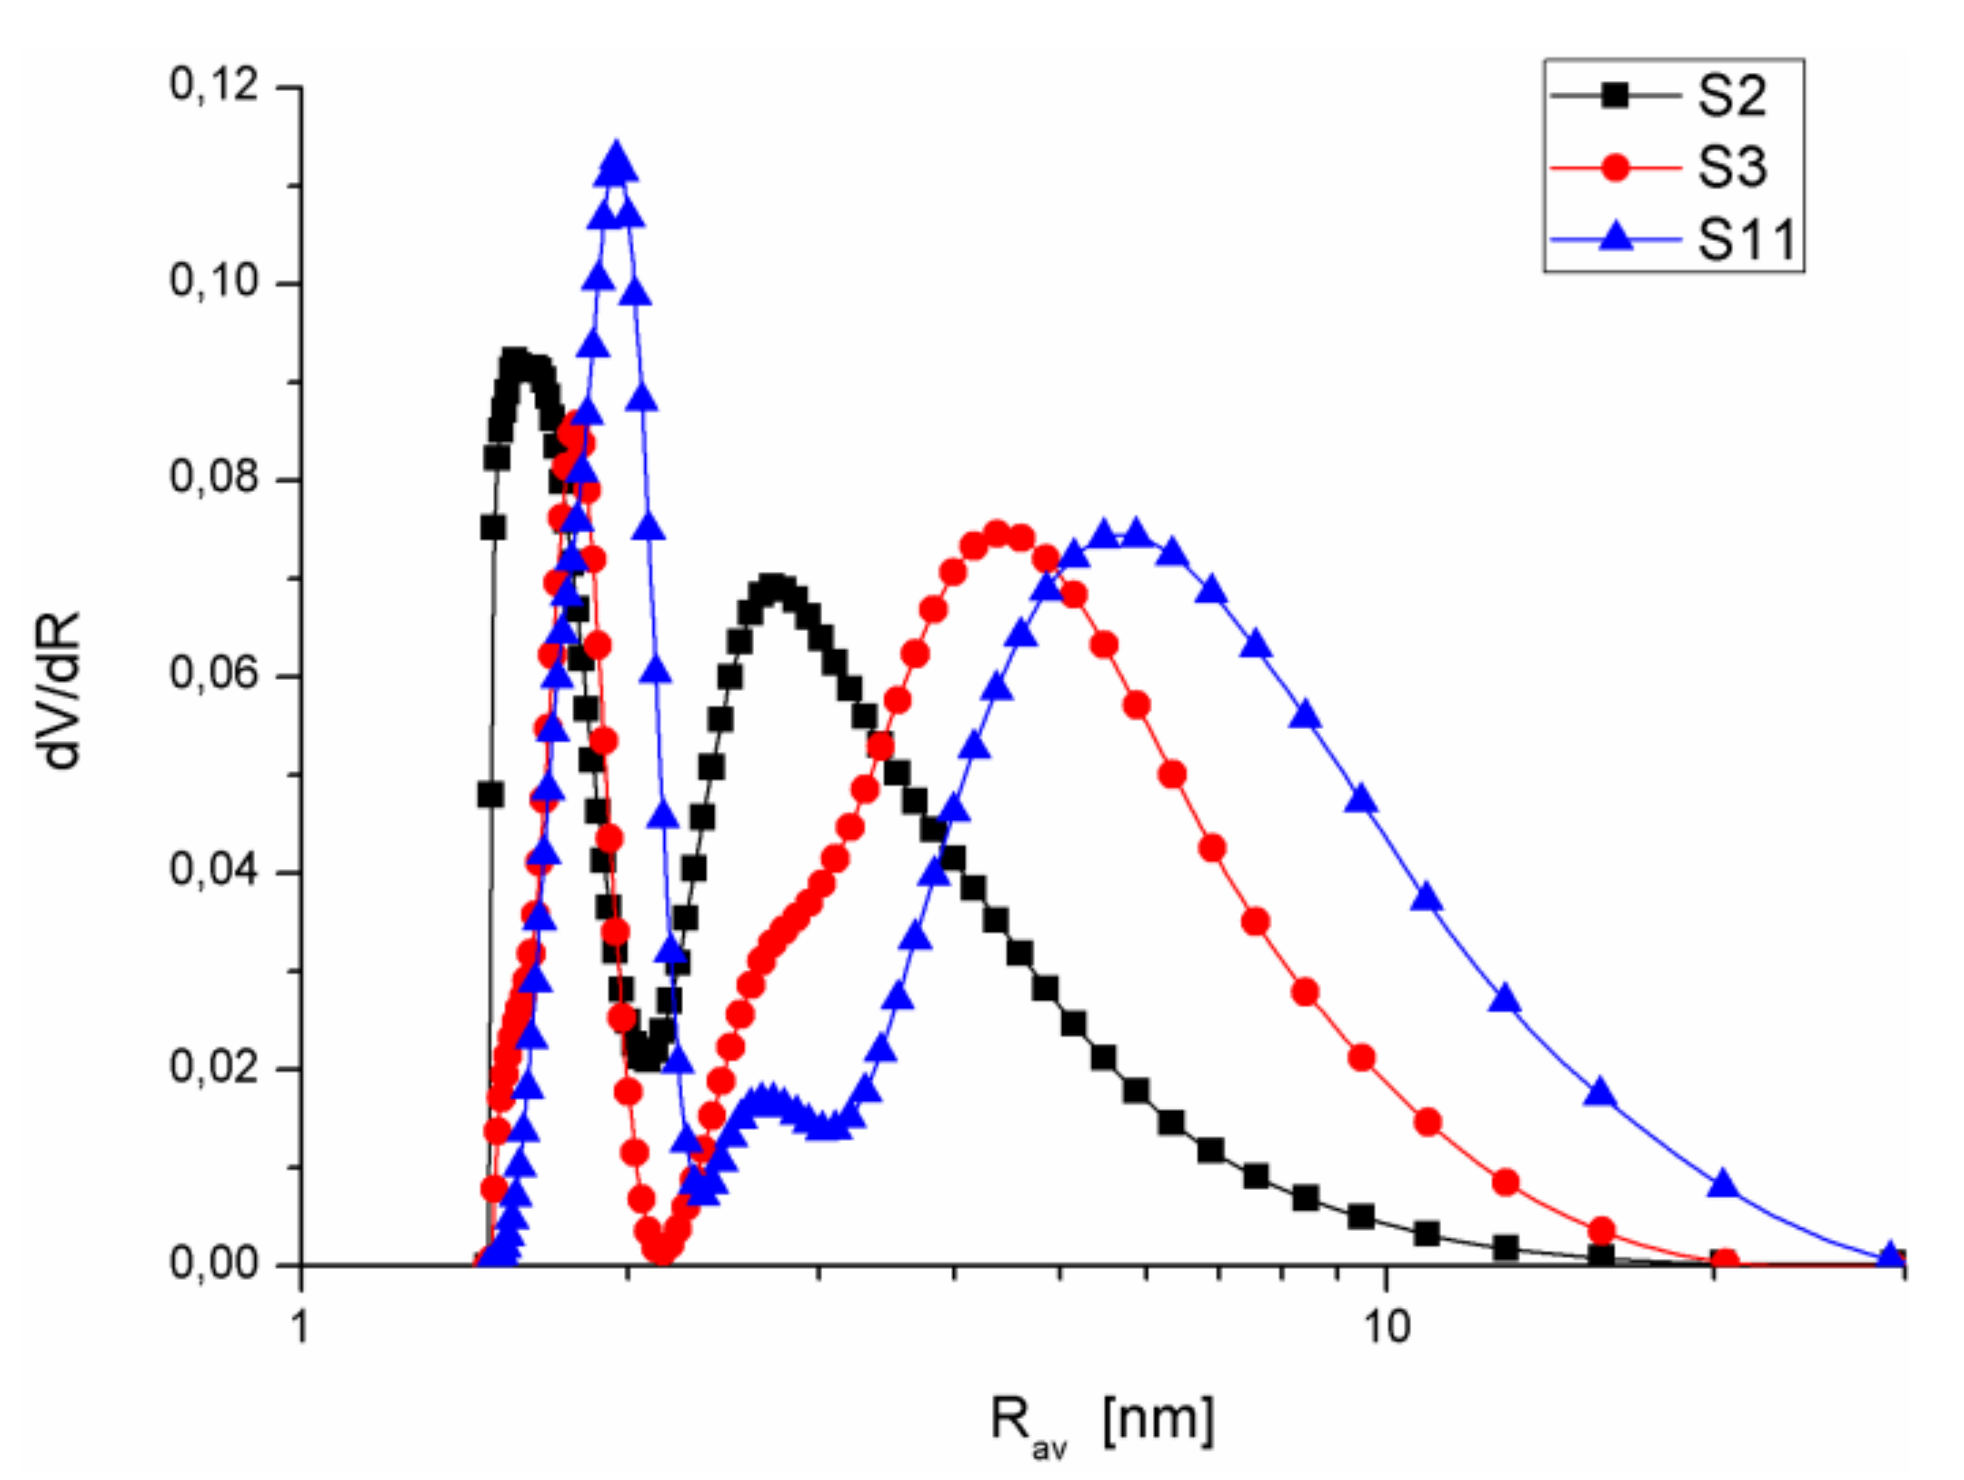
Figure 4 presents the PSDV–DSC curves for the exemplary samples S2, S3, and S11. The clearly seen maxima on the observed curves were used for the determination of Rdom-DSC (Table 1). The analysis of the obtained parameters proved the multimodal character of the obtained silica, and the values were in good agreement with those obtained from the N2 adsorption data, particularly in the area of mesopores (Figure 1b, Figure 2b, Figure 3b). However, water freezing in the macropores (R > 50 nm) formed monolayers at a distance from the silica surface, which belonged to the clusters filling the pores in bulk water. Therefore, there were no peaks in the range R > 50 nm on the PSDV-DSC curves, which could be observed for the chosen PSDV curves for some materials (Figure 1b, Figure 2b, Figure 3b).
Table 3 presents the values of changes in water freezing and ice melting enthalpies in the studied materials. One can observe that the obtained values were much lower than the standard value of ice melting (333.7 J g−1). This was the result of strong interactions of water with the surface of silicas containing numerous hydroxyl groups. As can be seen, the highest values ΔHf (the closest to the standard value ΔH°) were determined for the sample characterized by the pores of largest Rav (S11). This confirmed the earlier observations about weak interactions of water molecules in wide pores owing to which they preserve properties of volumetric water to some extent.
3.3. Thermal Analysis
The investigated samples were subjected to thermogravimetric investigations under dynamic conditions to determine the content of physically adsorbed water and the amount of surface hydroxyl groups. In Figure 5, the exemplary thermograms of water desorption for the materials after HTT modification are presented. As one can see, the water desorption from the surface occurred in two main stages. The first step, up to 200 °C, was caused by dehydration (removal of the physically bound water). The second step, from 200 to 1200 °C, resulted from condensation of different types of silanols. The hydroxyl groups could be present on the surface (vicinal, germinal, or isolated hydroxyl ones) or inside the silica skeleton (intraglobular, structural hydroxyl groups). In the temperature range of 200–900 °C, intraglobular water was removed from the silica structure.
As can be seen from Figure 5a, the kind of additive affected the content of bound physical water (Δm in the temperature range of 20–200 °C). The smallest mass loss in this range was observed for the material with the addition of milled silica gel that was subjected to hydrothermal treatment (S7). This was associated with the smallest specific surface area with the simultaneous contribution of micropores (%Smicro = 27.6%, Table 1) in which a strong retention of water molecules was observed. In the further range, the mass loss rate was comparable.
Moreover, differentiation of preparation methods had a significant effect on the water content in the prepared materials. Figure 5b presents the dependence of water mass loss (TG%) on the way of modification using A-50 as the second component. Of all tested materials, the smallest amount of physically bound water was observed in the HTT-modified material.
Table 4 presents the quantitative results of determination of hydroxyl surface groups for the studied materials. As one can see, the materials obtained after the hydrothermal treatment were characterized by a relatively high content of isolated hydroxyl groups removed from the silica surface in the temperature range of 900–1200 °C (Table 4, S4, S5 and S6). From the analysis of the data, the total content of hydroxyl groups (σOH OH nm−2) was close to the value for completely hydrated silica (σOH = 4.6 − 4.9 OH nm−2) only for the hydrothermally modified silica [7,24,25]. The values of the materials prepared in the sol stage and MChT processes were larger than 4.6 OH nm−2, which was due to the fact that silica contains not only OH surface groups (geminal, vicinal, isolated) but also intraglobular water bound inside the skeleton. Its content depends on the way of modification. However, it is not considered as the form of hydroxyl surface groups.
3.4. Quasi-Isothermal Analysis
The prepared silicas were also subjected to thermal analysis under quasi-isothermal (Q-TG) conditions. In Figure 6, the Q-TG curves are presented for the exemplary samples. As one can see, the desorption of water from the surface of the studied materials proceeded in a wide temperature range in three stages, which is illustrated in detail in Figure 7. This figure represents the exemplary curve of surface free energy ΔG(CH2O) changes in the whole range of tested water surface concentrations. At a large extent of hydration (Figure 7, Ctotal), evaporation of the water physically bound with the surface took place with the increasing temperature. Evacuation of water from the pores was not observed in this stage. Here the mass loss was small, being ~5–15% (Figure 6) of the initial concentration of absorbed water.
The area confined with the curve ΔG(CH2O) between the points Ctotal and Cp determined the energy needed for evaporation of physically bound water. With further temperature increase (from the point Cp, Figure 7), water desorption from the pores started. Removal of such type of water occurred over a relatively wide temperature range (from ~80 to ~160 °C, Figure 6). This was due to the fact that the boiling temperature of water in the pores increases with the decreasing pore diameter. Further increase in temperature was the result of the beginning of thermodesorption of a thin monolayer of water molecules bound directly with the adsorbent surface (Figure 7, A).
Based on the data obtained by means of Q-TG, the dependences of the size of effective radius of the evaporating drop on the adsorbed water concentration (Figure 8a,b) and of dG/dMH2O=f(CH2O) obtained for the low coverage of water for the tested adsorbents (Figure 8b) were determined. As proved earlier, all studied materials were characterized by the multimodal structure of pores, which was also reflected on the Q-TG curves.
The shapes of exemplary curves (S1, Figure 8a and S9, Figure 8b) indicate that in the initial stage of water thermodesorption (low temperature, large CH2O), the effective radius of the evaporating drop was small. However, with the increase in temperature, it increased to the value determining the radius of the pores dominating Rdom. A further increase in temperature resulted in reduction of the adsorbed water concentration and the size of effective radius of the evaporating drop until the next maximum was reached, which was the evidence that the materials possessed pores of differentiated sizes. The shape of the observed profiles depended on the Rdom value. Such courses of curves were observed for all studied materials.
Figure 8c,d presents the chosen dG/dM dependences in a function of statistical monolayers of water (n) under the conditions of low coverage with water, where dG/dM indicates the change of system free energy during water evaporation from the surface for S1 (Figure 8c) and S9 (Figure 8d) samples. It shows that on the curves obtained for the investigated silicas (also those not shown here) for which the degree of surface coverage was below 0.12 nm, there were multiple maxima. These maxima showed the formation of various types of numerous water clusters on the heterogeneous surfaces of silicas.
3.5. SEM
The SEM images confirmed the properties of the silicas under investigation. Figure 9 shows the changes in the surface morphology of the samples after the mechanochemical modification and the addition of A-50 (S8), A-380 (S9), A-50 + A-380 mixture (S10), and SiO2-MChT (S11). In Figure 9a, one can see single globules of A-50 concentrated into bigger structures due to the mechanochemical treatment. They are packed quite loosely. However, the addition of A-380 (Figure 9b) resulted in the obtained materials being more compact, and the individual globules were hardly visible. The differences were seen well because the preparation was made in the gel stage, and the additives (A-50 and A-380) were characterized by great differences in the globule diameter (particle sizes: 44 and 6 nm, respectively). The morphology of the S10 (Figure 9c) sample was different. Between the smooth patches (just like in S5, after the A-380 addition), there were clusters of tiny A-50 globules (as for S8, after the addition of A-50). The structure of this material was heterogeneous. The surface of the S11 (Figure 9d) sample seemed to be the most uniform. It was obvious that the MChT caused the particle size of the ground material to be unified.
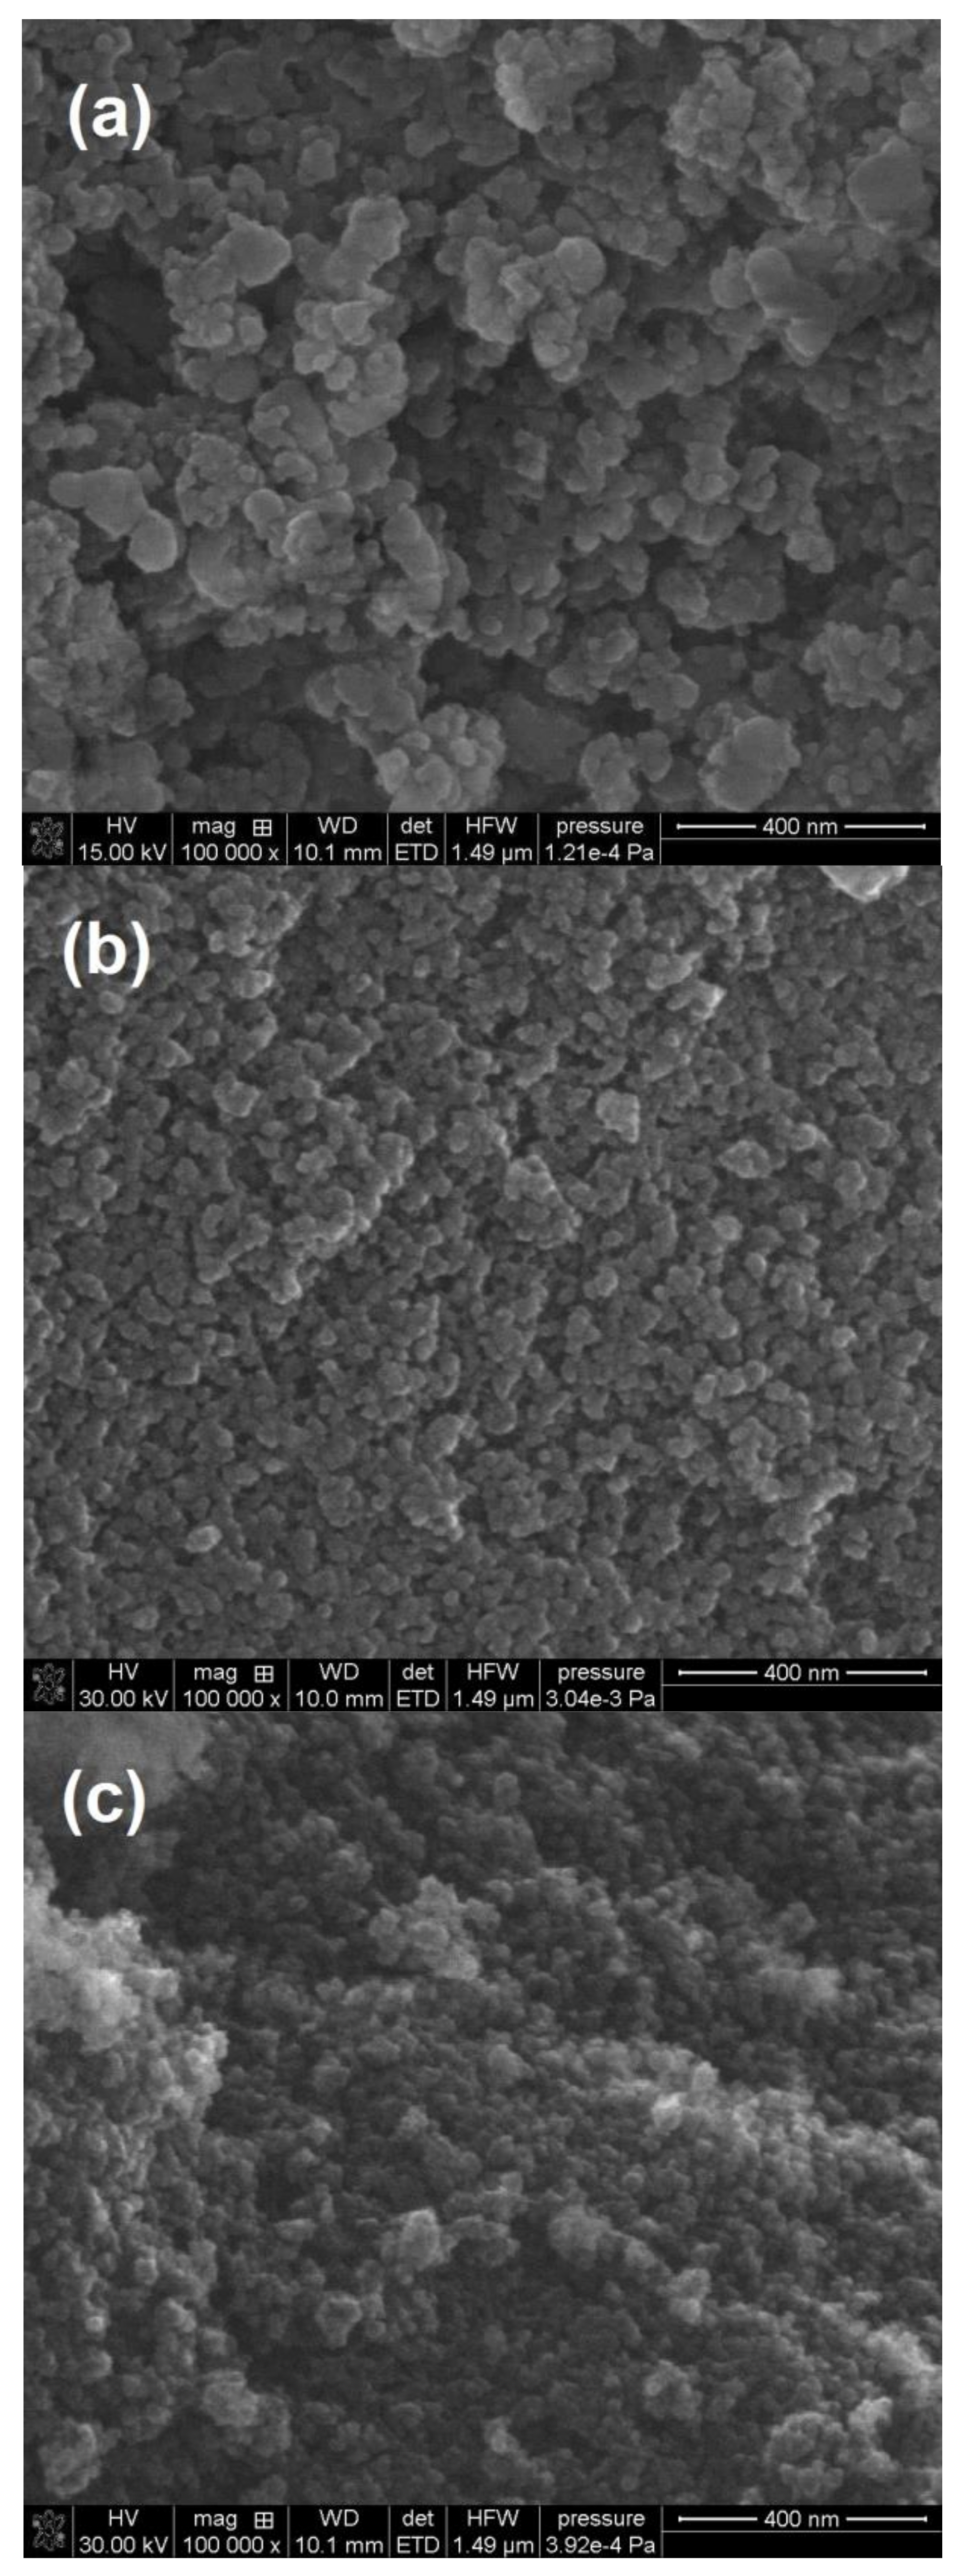
Figure 10 presents the images of sample surfaces after hydrothermal treatment. It is known that HTT causes dissolution of silica small globules and their deposition on the surface of greater ones, which can also be seen in Figure 10. After the A-50 addition (Figure 9a, particle size Dg = 44 nm), the silica particles were larger than in the case of the A-380 addition (Figure 10b, particle size Dg = 6 nm). Moreover, the particles were combined and had irregular shapes. However, the addition of initially milled silica (SiO2-MChT) caused the structure of the obtained silica to be relatively homogeneous.
4. Conclusions
In this study, it was shown that the addition of silica powder of different origins and dispersities (A-50, A-380, or SiO2-MChT) into silica in the sol or gel stage using different preparation procedures (HTT, MChT) promoted the formation of multimodal porous structure. Such procedures, especially the one-step and free-template methods, can be a simple method for the preparation of multimodal silicas making them environmentally acceptable.
All prepared silicas were mainly microporous and mesoporous materials. Changing the preparation conditions (stage of additives introduction, HTT, MChT) allowed us to obtain samples of several types of mesopores with different volumes and sizes. However, the hydrothermal treatment enabled the creation of strongly mesoporous materials with a very small content of micropores.
Significant similarity between the course of PSD curves obtained using the N2 adsorption data and the DSC cryoporometry as well as thermogravimetry under the quasi-isothermal conditions was shown. Based on the Q-TG analysis, it was determined that the dependence of the evaporating drop size on the concentration of adsorbed water had a complex, bell-shaped form. This suggested the existence of pores of different sizes. Water created various types of clusters on the heterogeneous silica surfaces. The contents of surface hydroxyl groups (geminal, vicinal, and isolated) were also determined. It was found that the materials obtained after HTT were characterized by a relatively high content of isolated hydroxyl groups, close to the value for completely hydrated silica. It was found that, with the exception of the HTT-modified materials, the remaining ones contained significant amounts of intraglobular water.
SEM imaging showed a significant impact of the applied procedure on the structure of the obtained materials. It was shown that HTT caused dissolution of silica small globules and their deposition on the larger surfaces.
Author Contributions
All the authors took part in formulating the ideas and objectives of research, solving issues related to the implementation of research, performing calculations, elaborating discussion and research results, and in preparing a draft of the manuscript.
Funding
There were no sources of finance.
Acknowledgments
The research was partly carried out under an Agreement between the Government of the Republic of Poland and the Government of Ukraine for cooperation in the field of science and technology signed in Kiev on January 12, 1993 (grant agreement No M / 118-2018). The authors would like to thank MSc. Halina Waniak-Nowicka (Maria Curie-Sklodowska University in Lublin) for his help with N2 adsorption/desorption measurements of the samples.
Conflicts of Interest
The authors declare no conflict of interest.
References
- Unger, K.K. Porous Silica; Elsevier: Amsterdam, The Netherlands, 1979. [Google Scholar]
- Bergna, H.E. The Colloid Chemistry of Silica; Advances in Chemistry, American Chemical Society: Washington, DC, USA, 1994. [Google Scholar]
- Kuang, D.; Brezesinski, T.; Smarsly, B. Hierarchical Porous Silica Materials with a Trimodal Pore System Using Surfactant Templates. J. Am. Chem. Soc. 2004, 126, 10534–10535. [Google Scholar] [CrossRef] [PubMed]
- Fujita, S.; Nakano, H.; Ishii, M.; Nakamura, H.; Inagaki, S. Preparation of hierarchical porous silica and its optical property. Microporous Microporous Mater. 2006, 96, 205–209. [Google Scholar] [CrossRef]
- Khalameida, S.V.; Sydorchuk, V.V.; Skubiszewska-Zięba, J. One-step free-template preparation of silica with hierarchical; porous structure. In Proceedings of the IEEE 7th International Conference on Nanomaterials: Applications and Properties, Odessa, Ukraine, 10–15 September 2017; pp. 1–4, ISBN 978-1-5386-2810-2. [Google Scholar]
- Snyder, L.R.; Ward, J.W. The surface structure of porous silica. J. Phys. Chem. 1966, 70, 3941–3952. [Google Scholar] [CrossRef]
- Zhuravlev, L.T. Structurally bound water and surface characterization of amorphous silica. Pure Appl. Chem. 1989, 61, 1969–1976. [Google Scholar] [CrossRef]
- Sydorchuk, V.; Khalameida, S.; Zazhigalov, V.; Skubiszewska-Zięba, J.; Leboda, R.; Wieczorek-Ciurowa, K. Influence of mechanochemical activation in various media on structure of porous and non-porous silicas. Appl. Surf. Sci. 2010, 257, 446–450. [Google Scholar] [CrossRef]
- Skubiszewska-Zięba, J.; Khalameida, S.; Sydorchuk, V. Comparison of surface properties of silica xero- and hydrogels hydrothermally modified using mechanochemical, microwave and classical methods. Colloids Surf. A 2016, 504, 139–153. [Google Scholar] [CrossRef]
- Charmas, B.; Skubiszewska-Zięba, J. Application of differential scanning calorimetry to study porous structure of hydrothermally modified silicas. J. Therm. Anal. Calorim. 2017, 129, 23–32. [Google Scholar] [CrossRef] [Green Version]
- Turov, V.V.; Leboda, R.; Skubiszewska-Zięba, J.; Charmas, B. Application of quasi-isothermal thermogravimetry for estimation of some properties of hydration layers in mesoporous adsorbents. Colloids Surf. A 2001, 181, 1–9. [Google Scholar] [CrossRef]
- Skubiszewska-Zięba, J.; Charmas, B.; Leboda, R.; Tertykh, V.A.; Yanishpolskii, V.V. Complex investigations of structural and thermal properties of silica-titania adsorbents. J. Therm. Anal. Calorim. 2012, 108, 1085–1092. [Google Scholar] [CrossRef]
- Farias, R.F.; Airoldi, C. Thermogravimetry as a reliable tool to estimate the density of silanols on a silica gel surface. J. Therm. Anal. 1998, 53, 751–756. [Google Scholar] [CrossRef]
- Burneau, A.; Lepage, J.; Maurice, G. Porous silica—Water interactions. I. Structural and dimensional changes induced by water adsorption. J. Non-Cryst. Solids 1997, 217, 1–10. [Google Scholar] [CrossRef]
- Skubiszewska-Zięba, J. The impact of microwave energy on the results of silica gel hydrothermal modification. Adsorption 2010, 16, 485–493. [Google Scholar] [CrossRef]
- Nawrocki, J. The silanol group and its role in liquid chromatography. J. Chromatogr. A 1997, 779, 29–71. [Google Scholar] [CrossRef]
- Dugas, V.; Checalier, Y. Surface hydroxylation and silane grafting on fumes and thermal silica. J. Colloid Interface Sci. 2003, 264, 354–361. [Google Scholar] [CrossRef]
- Alessi, A.; Agnello, S.; Buscarino, G.; Gelardi, F.M. Raman and IR investigation of silica nanoparticles structure. J. Non-Cryst. Solids 2013, 362, 20–24. [Google Scholar] [CrossRef]
- Gregg, S.J.; Sing, K.S.W. Adsorption, Surface Area and Porosity, 2nd ed.; Academic Press: London, UK, 1982. [Google Scholar]
- Gun’ko, V.M. Composite materials: Textural characteristics. Appl. Surf. Sci. 2014, 307, 444–454. [Google Scholar] [CrossRef]
- Gun’ko, V.M.; Mikhalovsky, S.V. Evaluation of slitlike porosity of carbon adsorbents. Carbon 2004, 42, 843–849. [Google Scholar] [CrossRef]
- Charmas, B.; Skubiszewska-Zięba, J.; Waniak-Nowicka, H. Thermal and calorimetric investigations of titania–silica composites. Adsorpt. Sci. Technol. 2017, 35, 706–713. [Google Scholar] [CrossRef] [Green Version]
- Gun’ko, V.M.; Do, D.D. Pore structure of carbon adsorbents was characterized using the regularization procedure. Colloids Surf. A 2001, 19, 71–83. [Google Scholar] [CrossRef]
- Zhuravlev, L.T. The surface chemistry of amorphous silica. Zhuravlev model. Colloids Surf. A. 2000, 173, 1–38. [Google Scholar] [CrossRef] [Green Version]
- Linsen, B.G. Physical and Chemical Aspects of Adsorbents and Catalysis; Academic Press: London, UK, 1970. [Google Scholar]
- Charmas, B. TG and DSC studies of bone tissue. Effects of osteoporosis. Thermochim. Acta 2013, 573, 73–81. [Google Scholar] [CrossRef]
- Charmas, B. Adsorption and Calorimetric Studies of Properties of Hydrothermally Modified Carbosils. J. Therm. Anal. Calorim. 2014, 115, 1395–1405. [Google Scholar] [CrossRef]
- Gunko, V.M.; Turov, V.V. Nuclear Magnetic Resonance Studies of Interfacial Phenomena; Taylor & Francis: San Diego, CA, USA, 2013. [Google Scholar]
- Brun, M.; Lallemand, A.; Quinson, J.; Eyraud, C. A new method for the simultaneous determination of the size and the shape of pores. Thermochim. Acta 1977, 21, 59–88. [Google Scholar] [CrossRef]
- Landry, M.R. Thermoporometry by differential scanning calorimetry: Experimental considerations and applications. Thermochim. Acta 2005, 433, 27–50. [Google Scholar] [CrossRef]
- Rouquerol, J.; Baron, G.; Denoyel, R.; Giesche, H.; Groen, J.; Klobes, P.; Levitz, P.; Neimark, A.V.; Rigby, S.; Skudas, R.; et al. Recommendations for the Characterization of Porous Solids. Pure Appl. Chem. 1994, 66, 1739–1758. [Google Scholar] [CrossRef]
- Leboda, R.; Charmas, B.; Sidorchuk, V.V. Physico-Chemical and Technological Aspects of Hydrothermal Modification of Complex Sorbents and Catalysts. I. Modification of Porous and Crystalline Structures. Adsorpt. Sci. Technol. 1997, 15, 189–214. [Google Scholar] [CrossRef]
- Khalameida, S.; Sydorchuk, V.; Zazhigalov, V.; Wieczorek-Ciurowa, K.; Skubiszewska-Zięba, J.; Charmas, B. The Interaction between Barium and Titanium Oxides under Mechanochemical, Hydrothermal and Microwave Treatments and Properties of Prepared Products. Adv. Sci. Eng. Med. 2017, 9, 235–246. [Google Scholar] [CrossRef]
Figure 1.
Low-temperature nitrogen adsorption/desorption isotherms (with inset for S3 sample) (a) and pore size distribution (PSD) curves (with inset for A-50 and A-380) (b) for the silicas obtained using differentiated silica additives (A-50, A-50 + A-380 mixture, and SiO2-MChT) in the sol stage.
Figure 1.
Low-temperature nitrogen adsorption/desorption isotherms (with inset for S3 sample) (a) and pore size distribution (PSD) curves (with inset for A-50 and A-380) (b) for the silicas obtained using differentiated silica additives (A-50, A-50 + A-380 mixture, and SiO2-MChT) in the sol stage.

Figure 2.
Low-temperature nitrogen adsorption/desorption isotherms (a) and PSD curves (b) for the silicas obtained using differentiated silica additives (A-50, A-380, A-50 + A-380 mixture, and SiO2-MChT) in the gel stage followed by mechanochemical milling at 300 or 500 rpm.
Figure 2.
Low-temperature nitrogen adsorption/desorption isotherms (a) and PSD curves (b) for the silicas obtained using differentiated silica additives (A-50, A-380, A-50 + A-380 mixture, and SiO2-MChT) in the gel stage followed by mechanochemical milling at 300 or 500 rpm.

Figure 3.
Low-temperature nitrogen adsorption/desorption isotherms (a) and PSD curves (b) for the silicas obtained using the differentiated silica additives (A-50, A-380, A-50 + A-380 mixture, and SiO2-MChT) in the sol stage followed by hydrothermal treatment at 200 °C.
Figure 3.
Low-temperature nitrogen adsorption/desorption isotherms (a) and PSD curves (b) for the silicas obtained using the differentiated silica additives (A-50, A-380, A-50 + A-380 mixture, and SiO2-MChT) in the sol stage followed by hydrothermal treatment at 200 °C.

Figure 4.
PSDV curves determined by cryoporometry DSC for the exemplary silica samples.

Figure 5.
Thermograms of water desorption under quasi-isothermal thermogravimetry (Q-TG) conditions for samples with different additives modified by hydrothermal modification (HTT) (a) and using A-50 (as the second component) prepared in different ways (b).
Figure 5.
Thermograms of water desorption under quasi-isothermal thermogravimetry (Q-TG) conditions for samples with different additives modified by hydrothermal modification (HTT) (a) and using A-50 (as the second component) prepared in different ways (b).

Figure 6.
The course of mass changes based on the Q-TG analysis for the chosen samples.

Figure 7.
The dependence of ΔG value changes on the concentration of water adsorbed on the S1 sample.
Figure 7.
The dependence of ΔG value changes on the concentration of water adsorbed on the S1 sample.

Figure 8.
Dependences of the effective radius of the evaporating drop on the concentration of adsorbed water for (a,b) as well as the dG/dM dependences under the conditions of small filling of the surface with adsorbed water for the silicas S1 (a,c) and S9 (b,d).
Figure 8.
Dependences of the effective radius of the evaporating drop on the concentration of adsorbed water for (a,b) as well as the dG/dM dependences under the conditions of small filling of the surface with adsorbed water for the silicas S1 (a,c) and S9 (b,d).

Figure 9.
SEM images of the silicas obtained after the MChT process using different additives: (a) A-50 (S8), (b) A-380 (S9), (c) A-50 + A-380 mixture (S10), and (d) SiO2-MChT (S11), (a) 10 kV, 100,000×, (b–d) 30 kV, 100,000×.
Figure 9.
SEM images of the silicas obtained after the MChT process using different additives: (a) A-50 (S8), (b) A-380 (S9), (c) A-50 + A-380 mixture (S10), and (d) SiO2-MChT (S11), (a) 10 kV, 100,000×, (b–d) 30 kV, 100,000×.
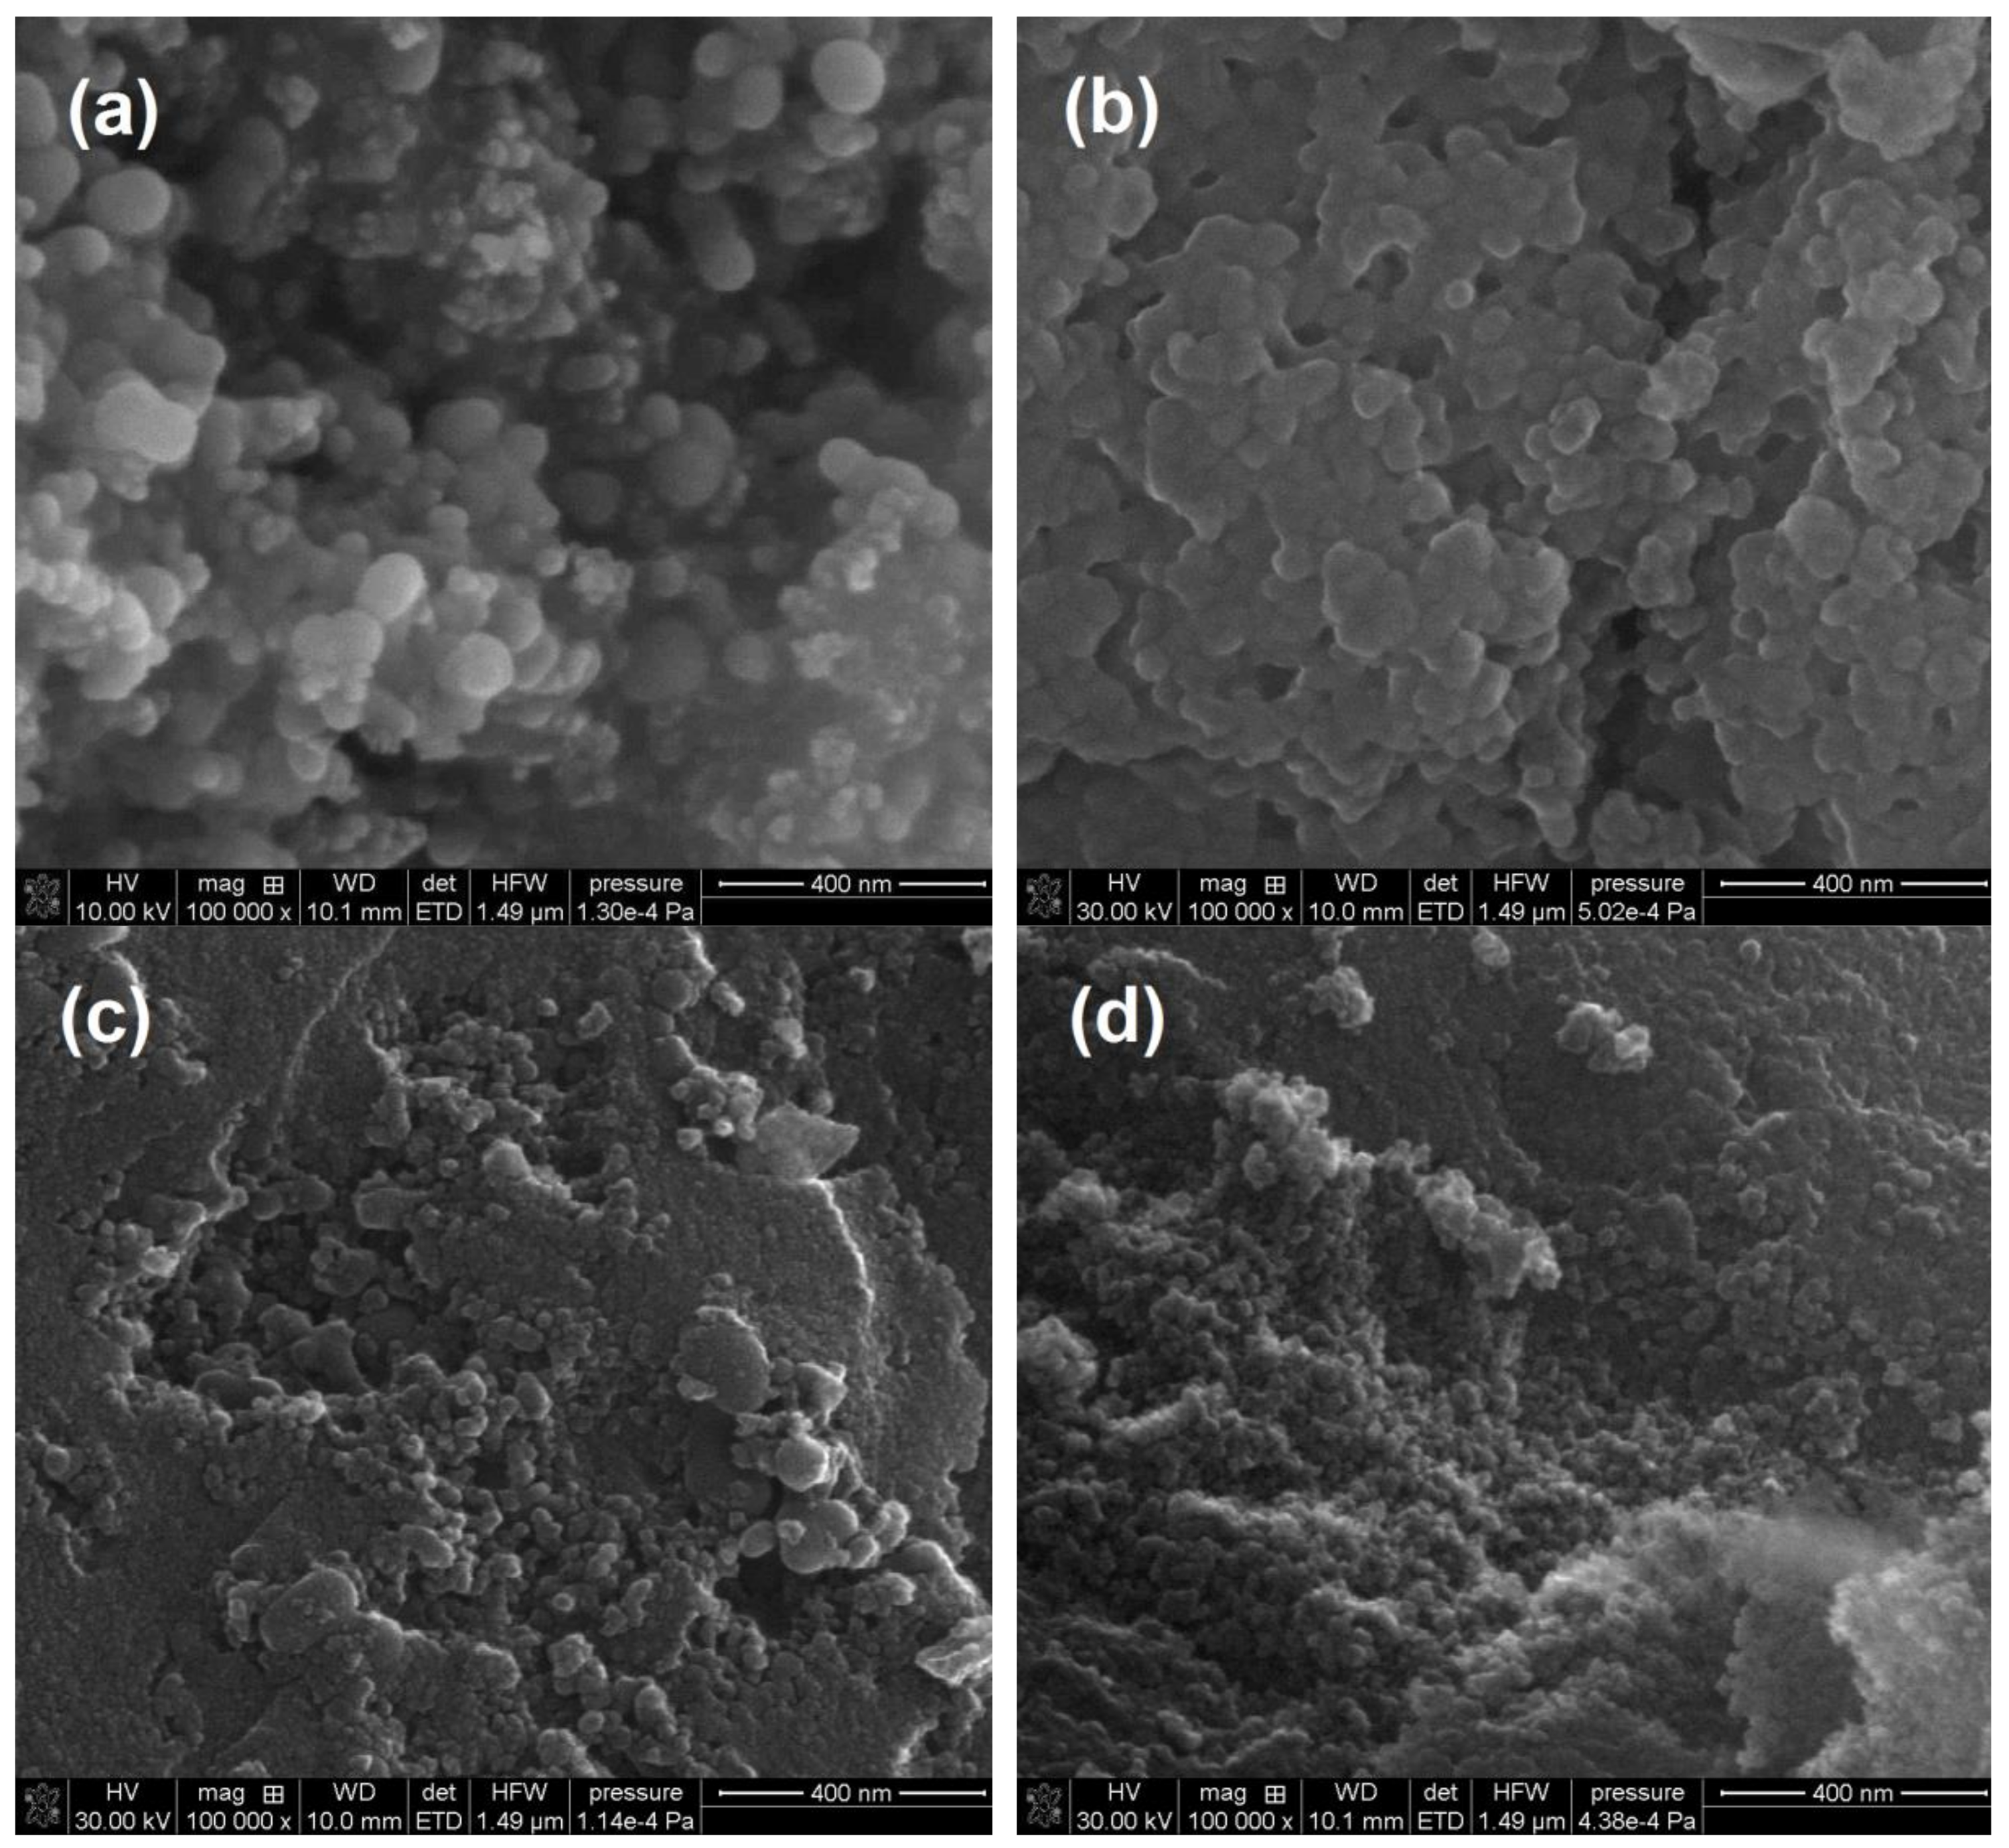
Figure 10.
SEM images of the silicas obtained after HTT modification in the sol stage using different additives: (a) A-50 (S4), (b) A-380 (S5), (c) SiO2-MChT (S7). (a) 15 kV, 100,000×, (b,c) 30 kV, 100,000×.
Figure 10.
SEM images of the silicas obtained after HTT modification in the sol stage using different additives: (a) A-50 (S4), (b) A-380 (S5), (c) SiO2-MChT (S7). (a) 15 kV, 100,000×, (b,c) 30 kV, 100,000×.


Table 1.
The designation and structural parameters of silicas.
| Sample | Procedure | SBET | Smicro/%Smicro | Smeso/%Smeso | Smacro/%Smacro | Vmicro/%Vmicro | Vmeso/%Vmeso | Vmacro/%Vmacro | Vp | Rav | Rdom (N2) | Rdom (DSC) | Δw |
|---|---|---|---|---|---|---|---|---|---|---|---|---|---|
| S0 | SiO2 initial, sol gel 20 °C | 607 | - | - | - | 0.13 | - | - | 0.31 | - | 13.2 | - | - |
| addition in the sol stage 20 °C | |||||||||||||
| S1 | SiO2 + 30% A-50 sol 20 | 385.1 | 170.3 44.2 | 211.9 55 | 2.9 0.7 | 0.06 16.8 | 0.249 70 | 0.047 13.2 | 0.356 | 1.85 | 2.3; 6.3; 24.3 | 1.7;2.6; 6 | 0.11 |
| S2 | SiO2 + 10% A-50 + 10% A-380 sol 20 | 431.6 | 253.2 58.7 | 178.2 41.3 | 0.3 0.1 | 0.092 34 | 0.174 64.4 | 0.005 1.7 | 0.271 | 1.25 | 1.1; 3 | 1.5; 2.9 | 0.07 |
| S3 | SiO2 + 20% SiO2-MChT sol 20 | 355.0 | 82.2 23.1 | 272.5 76.8 | 0.4 0.1 | 0.028 8.9 | 0.282 88.6 | 0.008 2.5 | 0.318 | 1.8 | 2.1; 5.2 | 1.8; 4.6 | 0.17 |
| Addition in the Sol/Gel Stage at 200 °C under HTT | |||||||||||||
| S4 | SiO2 + 30% A-50 sol HTT 200 | 363.9 | 25.9 7.0 | 332.8 91.4 | 5.2 1.4 | 0.011 1.1 | 0.887 90.6 | 0.082 8.4 | 0.98 | 5.4 | 1.5; 7; 18 | - | 0.15 |
| S5 | SiO2 + 20% A-380 sol HTT 200 | 466.8 | 30.5 6.5 | 435.4 93.3 | 0.9 0.2 | 0.012 1.1 | 1.083 96.3 | 0.029 2.6 | 1.124 | 4.8 | 1.5; 6 | - | 0.14 |
| S6 | SiO2 + 10% A-50 + 10% A-380 sol HTT 200 | 486.7 | 15.7 3.2 | 470.4 96.6 | 0.6 0.1 | 0.007 0.7 | 0.986 97.7 | 0.017 1.7 | 1.01 | 4.15 | 1.5; 5 | - | 0.15 |
| S7 | SiO2 + 20% SiO2-MChT sol HTT 200 | 255.2 | 70.6 27.6 | 184.6 72.4 | 0 0 | 0.036 2.9 | 1.18 97.1 | 0 0 | 1.216 | 10 | 1; 12 | - | -0.02 |
| Milling at 300 or 500 rpm, Addition on the Wet Gel Stage | |||||||||||||
| S8 | SiO2 gel + 30% A-50 MChT 300 | 395.4 | 187.2 43.7 | 204.7 51.8 | 3.5 0.9 | 0.065 22.2 | 0.151 51.7 | 0.076 26.1 | 0.292 | 1.55 | 1.5; 6; 50 | 1.2;2.6; 5.7 | 0.14 |
| S9 | SiO2 gel + 20% A-380 MChT 300 | 405.0 | 182 44.9 | 222.5 54.9 | 0.5 0.1 | 0.064 19 | 0.252 74.9 | 0.021 6.1 | 0.337 | 1.65 | 1.5; 12 | 1.5;1.8; 4.7 | 0.13 |
| S10 | SiO2 gel + 10% A-50 + 20% A-380 MChT 300 | 383.0 | 166.7 43.5 | 216 56.4 | 0.4 0.1 | 0.059 20.7 | 0.209 73.4 | 0.017 6.0 | 0.285 | 1.5 | 1.5; 4.2 | - | 0.14 |
| S11 | SiO2 gel + 20% SiO2-MChT MChT 500 | 234.2 | 76.9 32.8 | 157 67 | 0.3 0.1 | 0.026 8.9 | 0.253 86.8 | 0.013 4.4 | 0.292 | 2.5 | 0.8; 2.5; 7.7 | 2; 2.7; 6 | 0.06 |
Sol 20—the addition in the sol stage at 20 °C; sol HTT 200—The addition in the sol/gel stage at 200 °C under hydrothermal conditions (HTT); mechanochemical treatment (MChT )300/500—The milling at 300/500 rpm, the addition in the wet gel stage; SiO2-MChT—The wide-porous silica gel SiO2 used as additives after preliminarily milling at 300 rpm in water; SBET [m² g−1]; Smicro [m² g−1]; %Smicro = (Smicro/SBET)*100%; Smeso [m² g−1]; %Smeso = (Smeso/SBET)*100%; Smacro [m² g−1]; %Smacro = (Smacro/SBET)*100%; Vmicro [cm3 g−1]; %Vmicro = (Vmicro/Vp)*100%; Vmeso [cm3 g−1]; %Vmeso = (Vmeso/Vp)*100%; Vmacro [cm3 g−1]; %Vmacro = (Vmacro/Vp)*100%; Vp [cm³ g−1]; Rav [nm]; Rdom (N2) [nm]; Rdom (differential scanning calorimetry (DSC)) [nm]; Δw—The deviation of the pore shape.
Table 2.
Characteristic temperatures of the stages of DSC cooling and heating of water registered for S1 sample.
Table 2.
Characteristic temperatures of the stages of DSC cooling and heating of water registered for S1 sample.
| Cooling Stage | |||
|---|---|---|---|
| Tonset | Tend | Tmin | ΔH |
| 4.31 | 2.9 | 3.9 | −171.99 |
| −7.50 | −8.2 | −7.8 | −172.02 |
| −31.11 | −34.8 | −33.2 | −171.91 |
| −37.93 | −41.2 | −39.7 | −172.04 |
| Heating Stage | |||
| Tonset | Tend | Tmax | ΔH |
| −29.24 | −24.2 | −26.8 | 130.75 |
| 4.82 | 5.6 | 5.2 | 131.28 |
| 0.10 | 4.4 | 3.3 | 131.2 |
Tonset, Tend—Temperatures at the beginning and the end of the phase transition in °C, respectively; Tmax/Tmin—Temperature at which the transformation occurs fastest, °C; ΔH—Changes of free enthalpy of phase transition in the cooling or heating stage, J g−1.
Table 3.
Changes of free enthalpy of the phase transition during freezing and melting of the ice in the tested materials.
Table 3.
Changes of free enthalpy of the phase transition during freezing and melting of the ice in the tested materials.
| Sample | ΔHcooling J g−1 | ΔHheating J g−1 |
|---|---|---|
| S1 | 172.1 | 130.7 |
| S2 | 145.1 | 73.4 |
| S3 | 301 | 183.2 |
| S8 | 270.5 | 253.2 |
| S9 | 224.3 | 147.3 |
| S11 | 305.5 | 198.1 |
Table 4.
Quantitative results of thermal analysis of the samples under investigation.
| Sample | Temperature Range of Mass Loss, °C | ||||
|---|---|---|---|---|---|
| 200–400 | 400–600 | 600–900 | 900–1200 | 200–1200 | |
| OH Groups Content, υOH mmol g−1 σOH OH nm−2 | |||||
| Vicinal + Intraglobular | Geminal + Intraglobular | Geminal + Intraglobular | Isolated | Total | |
| S1 | 1.41(2.19) | 1.68(2.61) | 1.31(2.04) | 0.45(0.70) | 4.84(7.54) |
| S2 | 2.05(2.85) | 1.85(2.58) | 0.73(1.02) | 0.01(0.01) | 4.64(6.45) |
| S3 | 0.25(0.42) | 0.85(1.44) | 0.52(0.88) | 0.20(0.33) | 1.82(3.08) |
| S4 | 1.04(1.72) | 1.24(2.04) | 0.67(1.11) | 0.40(0.65) | 3.35(5.52) |
| S5 | 0.89(1.15) | 1.71(2.20) | 0.63(0.81) | 0.47(0.60) | 3.70(4.76) |
| S6 | 0.94(1.16) | 1.65(2.03) | 0.72(0.89) | 0.57(0.70) | 3.88(4.78) |
| S7 | 0.25(0.60) | 0.88(2.07) | 0.54(1.26) | 0.20(0.48) | 1.87(4.41) |
| S8 | 1.74(2.64) | 1.45(2.19) | 0.60(0.91) | 0.06(0.09) | 3.84(5.83) |
| S9 | 2.15(3.18) | 1.63(2.41) | 0.66(0.98) | 0.24(0.36) | 4.68(6.93) |
| S10 | 1.23(1.93) | 1.76(2.76) | 0.87(1.36) | 0.16(0.24) | 4.02(6.29) |
| S11 | 1.55(3.98) | 1.39(3.56) | 0.70(1.80) | 0.17(0.44) | 3.82(9.78) |
© 2018 by the authors. Licensee MDPI, Basel, Switzerland. This article is an open access article distributed under the terms and conditions of the Creative Commons Attribution (CC BY) license (http://creativecommons.org/licenses/by/4.0/).
Share and Cite
MDPI and ACS Style
Charmas, B.; Kucio, K.; Sydorchuk, V.; Khalameida, S.; Zięzio, M.; Nowicka, A. Characterization of Multimodal Silicas Using TG/DTG/DTA, Q-TG, and DSC Methods. Colloids Interfaces 2019, 3, 6. https://doi.org/10.3390/colloids3010006
AMA Style
Charmas B, Kucio K, Sydorchuk V, Khalameida S, Zięzio M, Nowicka A. Characterization of Multimodal Silicas Using TG/DTG/DTA, Q-TG, and DSC Methods. Colloids and Interfaces. 2019; 3(1):6. https://doi.org/10.3390/colloids3010006
Chicago/Turabian StyleCharmas, Barbara, Karolina Kucio, Volodymyr Sydorchuk, Svitlana Khalameida, Magdalena Zięzio, and Aldona Nowicka. 2019. "Characterization of Multimodal Silicas Using TG/DTG/DTA, Q-TG, and DSC Methods" Colloids and Interfaces 3, no. 1: 6. https://doi.org/10.3390/colloids3010006