Oil-In-Water Microemulsions for Thymol Solubilization
by
 , and
, and
Laura Fernández-Peña
1, 
Sonia Gutiérrez-Muro
1,
Eduardo Guzmán
1,2,*,
Alejandro Lucia
3,4,
Francisco Ortega
1,2 and
and
Ramón G. Rubio
1,2,* 1
Departamento de Química Física, Facultad de Ciencias Químicas, Universidad Complutense de Madrid. Ciudad Universitaria s/n, 28040 Madrid, Spain
2
Instituto Pluridisciplinar, Universidad Complutense de Madrid. Paseo Juan XXIII, 1, 28040 Madrid, Spain
3
Instituto de Ecología y Desarrollo Sustentable (INEDES, CONICET-UNLu), Ruta 5 y Avenida Constitución—Luján (6700), Buenos Aires, Argentina
4
Centro de Investigación en Sanidad Vegetal (CISaV), Facultad de Ciencias Agrarias y Forestales, UNLP, Calles 60 y 119, La Plata 1900, Argentina
*
Authors to whom correspondence should be addressed.
Colloids Interfaces 2019, 3(4), 64; https://doi.org/10.3390/colloids3040064
Submission received: 29 October 2019
/
Revised: 27 November 2019
/
Accepted: 30 November 2019
/
Published: 2 December 2019
(This article belongs to the Special Issue Emulsion Applications)
Abstract
:Essential oil compounds (EOCs) are molecules with well-known antimicrobial and antipest activity. However, such molecules possess limited solubility in water, making their handling difficult. This work aimed to enhance the distribution of a solid essential oil compound, thymol, using oil-in-water (o/w) microemulsions for its solubilization. The use of mixtures formed by an alkyl polyglucoside (APG) and soybean lecithin (SL) allowed for stabilization of the o/w microemulsions in a broad range of compositions, with the total concentration of the mixture of the two surfactants (APG+SL) and the APG:SL ratio both being essential for controlling the nature of the obtained dispersions. The microemulsions obtained using oleic acid as the oil phase and with compositions far from those corresponding to the onset of the emulsion region showed a good efficiency for thymol solubilization. This is an advantage from a stability point of view, as well as for ease of thymol preparation. The present work opens new alternatives for designing eco-sustainable formulations for EOC solubilization, with the possibility of preparing the formulations at the place of use, thereby saving transport costs and reducing the emission of pollutants.
1. Introduction
The pursuit for new formulations that increase the availability of hardly soluble molecules in water is a challenge for different scientific and technological fields, ranging from cosmetics to food science, and from drug delivery to pest control [1]. This has driven extensive research that aims to overcome the main limitations associated with dispersion of such molecules, and includes designing well-sketched platforms which enable their solubilization [2,3,4,5]. Importantly, it necessary to find a strategy that increases the availability of the solubilized compounds without compromising their activity. The latter is particularly significant because solubilization of active compounds should ensure the protection of the solubilized molecules against degradation processes, including those of a chemical, enzymatic or physical nature.
Among the different colloidal systems with potential application for solubilization of hydrophobic compounds, such as essential oil compounds (EOCs), oil-in-water emulsions (o/w) may be one of the most promising alternatives for such a purpose [6]. Different types of emulsions can be distinguished: macroemulsions, nanoemulsions and microemulsions [7]. These classifications are not based on the size of the dispersed phase, as might be expected from their names, with the thermodynamic stability being the main difference between the different types of emulsions. Also, the mechanical energy necessary for dispersing an oil phase in water is very different in o/w emulsions and o/w microemulsions. Thus, it is important to take care when selecting an emulsion type when fabrication of solubilization platforms is concerned. As a result, the use of thermodynamically stable emulsions—the so-called microemulsions—seems to be preferred, which is mainly associated with their thermodynamic stability and the low mechanical energy needed for preparation of their dispersions. The transparency of microemulsions, associated with a mean droplet size in the range 4 to 200 nm, minimizes their potential effects on the organoleptic properties of consumer products. Further, their high specific surface area, which facilitates the availability of the solubilized molecules, makes microemulsions a suitable alternative in the design of solubilization platforms [8,9]. In addition, some studies have shown that the use of microemulsions as a delivery platform improves the targeted therapeutic action, reducing the drug toxicity for humans [10,11,12]. Therefore, the use of o/w microemulsions is of particular interest because they provide a protected environment for solubilizing EOCs within oil droplets, favoring the distribution of the solubilized material in an aqueous environment [8,13,14]. Successful EOC solubilization impacts a number of different technological and industrial areas due to the recognized activity of this type of molecule as neurotoxic for a variety of insects and antimicrobial against multi-resistant bacteria or preservatives [15,16,17,18]. Among the application fields of EOCs, one can mention the cosmetic industry (ingredients of fragrances, decorative cosmetics, fine fragrances and flavoring), food industry (aromas and flavors), pharmaceutical industry (active components of medicines and antibacterials/antimicrobials) and aromatherapy. Currently, EOCs are also used as intermediaries in fine chemistry reactions [19]. It is worth noting that EOCs’ poor solubility in water and chemical instability make their handling difficult, reducing the effective application of EOC-based formulations. Therefore, it is necessary to design procedures for enhancing their availability without compromising their properties. Previous studies have reported that nanoemulsions and microemulsions are promising options for the preparation of eco-sustainable platforms that enable EOC solubilization, enhancing, in most of cases, their biological activity [20,21]. Furthermore, other alternatives, such as gel-like and solid lipid particles, liposomes or cyclodextrins, have also been explored for encapsulation of EOCs. It has previously been demonstrated that encapsulation of EOCs enhances their stability and activity, enabling sustained release of the loaded molecules [6,22].
In recent years, there has been a growing interest in the use of microemulsions for fabrication of solubilization platforms for different drugs, with application through different delivery paths: transdermal, dermal, topical, oral, nasal, ocular, and parenteral [12,23,24,25]. It is worth noting that, despite the fact o/w microemulsions offer important advantages for their use as solubilization platforms, these types of dispersions can only be obtained within a narrow composition and temperature range. Therefore, it may be suggested that their stability would be compromised upon inclusion of a solubilized compound, a consequence of the change in composition. This means it is necessary to make a careful selection of the microemulsions used for solubilization to avoid the undesirable destabilization phenomena.
This work focused on the design of microemulsions of oleic acid in water for their use as platforms for EOC solubilization; in this particular case for thymol solubilization. It is worth mentioning that the use of vegetable oils as the oil phase for dispersions may be convenient from an economic point of view. Even though oleic acid may influence the conformation of surfactant films at the water/droplet interface, this fatty acid can facilitate penetration of solubilized compounds through biological membranes, which can be an advantage for future application of this type of colloidal dispersion in drug delivery, pest control or cosmetics [26]. Furthermore, the use of dispersions with the same amount of oleic acid (3 wt%) makes it possible to consider that the effect of the oleic acid will be analogous in the different dispersions studied in terms of physicochemical properties. The use of oleic acid as the oil phase was required because thymol is a solid below 50 ºC, making it necessary to create an adequate environment for its correct dispersion in practical applications. The microemulsions employed in this study were stabilized using a pair of surfactants: alkyl polyglucoside (APG) and soybean lecithin (SL). This study explored the optimal preparation conditions for obtaining stable microemulsions which were not destabilized even after inclusion of thymol. It is expected that the microemulsions developed in this work will help in the design of a new generation of eco-sustainable solubilization platforms for EOCs, thereby enhancing EOC distribution and availability when needed.
2. Materials and Methods
2.1. Materials
Oleic acid (purity > 99%) supplied from Sigma-Aldrich (St. Louis, United States of America) was used as the oil phase for the preparation of the microemulsions and as the medium for dispersion of the solubilized molecule. Mixtures of two surfactants were used for stabilizing the microemulsion. These mixtures were formed by different weight fractions of alkyl polyglucoside (APG), with commercial name Oramix GC-110 (a 50:50 mixture of caprylylglucoside and caprylglucoside) purchased from Safic-Alcan (Barcelona, Spain), and soybean lecithin (SL, 2-linoleoyl-1-palmitoyl-sn-glycero-3-phosphocholine, purity 90%) purchased from Alfa Aesar (Haverhill, United States of America). Thymol (purity ≥ 98.5%, 2-isopropyl-5-methylphenol) was obtained from Sigma-Aldrich (St. Louis, United States of America).
Ultrapure deionized water, used for cleaning and dispersion preparation, was obtained by a multicartridge purification system, AquaMAXTM-Ultra 370 Series (Young Lin Instrument Co., Ltd., Gyeonggi-do, South Korea), presenting a resistivity higher than 18 MΩ∙cm and a total organic content lower than 6 ppm.
2.2. Microemulsion Preparation
The microemulsion preparation process involved successive addition of the weighed amount (precision ± 0.1 mg) of the different compounds to a vial (10 mL). The final mixture always contained a fixed amount of the oil phase (3 wt%), with the composition of the other three components (water and two surfactants) being modified. For the sake of simplicity, dispersions containing fixed amounts of the surfactant mixture (APG and SL), where the ratio between both components (APG:SL ratio) was varied, were considered. It is worth mentioning that microemulsions were obtained for APG concentrations well above its critical micelle concentration, cmc (about 0.18 wt%). This meant information could be obtained about the ternary pseudo-phase diagram (water/alkyl polyglucoside/soybean lecithin).
The protocol for emulsion preparation can be summarized as follows: first, a fixed amount of oleic acid (450 mg) was weighed and poured into a vial to obtain final mixtures with an oil phase corresponding to 3 wt% of the final composition. Afterwards, the required amounts of the two surfactants (SL and APG) were weighed and added to the oil; first the SL and then the APG. The obtained mixture was homogenized overnight using a magnetic stirrer (1000 rpm). Finally, water was added to dilute, until the final composition was reached. The final mixture was homogenized over 5 h at 50 °C using a magnetic stirrer (1000 rpm). After cooling down, this procedure produced transparent microemulsions for a region of the phase diagram. It is worth noting that the heating and stirring used for the preparation of the dispersions is not required for obtaining microemulsions. However, this procedure favors solubilization and dispersion of SL, thereby ensuring the homogeneity of the obtained dispersions. When thymol solubilization is considered, it must be pre-solubilized in the oil phase before starting with mixture preparation.
2.3. Determination of the Microemulsion Region
Determination of the boundary of the microemulsion region was evaluated at a temperature of 25 °C from a ternary pseudo-phase diagram. This diagram corresponded to a cut of the whole phase, consistent with the water/alkyl polyglucoside/soybean lecithin/oleic acid system, with the composition of the oil phase (oleic acid) being constant at 3 wt%. The microemulsions were identified as those dispersions that were transparent and stable during at least six months.
2.4. Dynamic Light Scattering
Dynamic light scattering (DLS) measurements were performed using a Zetasizer Nano ZS (Malvern Instruments Ltd., United Kingdom) at 25 °C in a quasi-backscattering configuration (scattering angle, θ = 173°) using a He–Ne laser (wavelength, λ = 632 nm). DLS experiments allow one to obtain the time dependence of the normalized intensity auto-correlation function, g(2)(q,t), that, for a dispersion of monodisperse scatterers possessing Brownian motion, can be described in terms of a single exponential decay [27]:
where t and τ are the time and mean relaxation time, respectively, and q = (4πn/λ)sin (θ/2) is the wave vector, with n being the continuous phase refractive index (n = 1.33). In Equation (1), β is an optical coherence factor which is generally found to be close to 1. Analysis of the intensity auto-correlation functions allows one to estimate the apparent diffusion coefficient, Dapp = 1/τq2. For spherical scatterers diffusing in a continuous Newtonian medium, the apparent diffusion coefficient allows one to estimate the size of the droplets in terms of the apparent hydrodynamic diameter dHapp by the Stokes–Einstein relationship:
where kB and T refer to the Boltzmann constant and the absolute temperature, respectively, and η is the viscosity of the continuous phase.
g(2)(q,t) − 1 = βe−2t/τ
dHapp = kBT/(3πηDapp)
2.5. Fluorescence Spectroscopy
Studies on the solubilization of thymol within o/w microemulsions were carried out by fluorescence spectroscopy using a fluorescence spectrophotometer FP-6500 from (Jasco Inc., Easton, United States of America). For the fluorescence spectroscopy studies, a fixed excitation wavelength of 280 nm was chosen [28].
3. Results and Discussion
3.1. Determination of Oil-In-Water Microemulsion Region
A preliminary step for the use of microemulsions as platforms for EOC solubilization is determination of the composition range in which the microemulsions appear. This may be easily performed on the basis of a ternary pseudo-phase diagram, corresponding to a cut of the whole phase diagram in which the content of the oil phase remains constant at 3 wt% and the temperature is fixed at 25 °C. Figure 1 shows the compositional region in which microemulsions with a fixed amount of oil phase (3 wt%) were obtained. For evaluation of the cut of the real phase diagrams, different mixtures containing total surfactant concentration (considering both APG and SL) cs between 0 and 48 wt% were studied. For cs beyond 48 wt%, the mixture of APG and SL becomes the main component of the mixtures, thus avoiding the use of the term o/w microemulsion for defining the mixtures appearing from such compositions. It is worth mentioning that, for the explored concentration range, different APG:SL ratios were explored for obtaining microemulsions.
The ternary pseudo-phase diagram presented in Figure 1 shows that the microemulsion region extends from compositions with a total surfactant (APG+SL) concentration, cs, ranging between 20 and 48 wt%. The decrease of cs below the threshold value of 20 wt% led to the formation of emulsions, which was also the case when the content of APG in the stabilizing mixture was decreased. In those cases where the content of SL was higher than that of APG, gel-like systems appeared, with a clear phase separation developing when SL was the only surfactant used. Despite different phases appearing for the system considered in this work, our interest lies in the study of those compositions in which stable o/w microemulsions were obtained. It is worth noting that the ability to stabilize microemulsions is related to an increase of the APG:SL ratio; i.e., an increase of the amount of APG in the emulsifying mixtures. Thus, considering dispersions with a fixed concentration of the surfactant mixture, an increase of the APG:SL ratio decreases the cs value required for obtaining microemulsions (see Figure 2).
The set of samples shown in Figure 2 suggest that an increase of the amount of surfactant for a fixed concentration of the mixture APG:SL led to a transition from turbid emulsions to transparent ones, pointing out the important role of APG concentration in the nature of the obtained dispersions. This may be explained considering the effect of the molecular structure of APG and SL on the packing of the interfacial film at the water/droplet interface. It would be expected that the saturated hydrocarbon tail of the APG favors the formation of films in the water/droplet interface, with a higher packing than when the content of SL—which possesses non-saturated hydrocarbon tails—is high. Therefore, the APG:SL ratio allows one to control the rigidity of the interfacial layers, providing a basis for reducing the destabilization mechanism, mainly via Ostwald ripening and coalescence, thus enabling acquisition of microemulsions. It is worth mentioning that SL is not essential for obtaining microemulsions, while APG plays a central role in their formation. The absence of APG results in multiphasic systems. Note that, even though microemulsions can be obtained using only APG as a stabilizer, the introduction of SL enables a decrease in the minimum value of cs needed for obtaining stable microemulsions. Further, SL may favor permeation of solubilized actives through biological membranes in future applications of prepared emulsions [29]. For the highest concentrations of the surfactant mixtures (above 40 wt% of the total mixture), a strong increase of the dispersion viscosity was found, leading to gel-like microemulsions.
3.2. Characterization of the Droplet Size
Figure 3 shows two sets of intensity auto-correlation functions obtained for different microemulsions. The influence on the dynamics behavior of microemulsions of the APG:SL ratio for a fixed cs value (30 wt%) (Figure 3a) and of the cs value for a fixed APG:SL (8:1) ratio (Figure 3b) is clearly demonstrated. The results found for other cs values or APG:SL ratios are similar for dispersions within the microemulsion region.
The results clearly indicate that both an increase of cs for a fixed APG:SL ratio and a decrease of this ratio for a fixed value of cs lead to a similar qualitative effect on the dynamic behavior of the microemulsions. In both cases, the optical coherence decreases, i.e., the value of β decreases as cs increases or the APG:SL ratio decreases. This is a result of the transition from microemulsions to gel-like microemulsions, which is associated with a significant increase of the viscosity of the obtained dispersions as cs overcomes 40 wt% of the total composition of the sample. Therefore, the dynamic behavior observed from the auto-correlation functions of the gel-like microemulsions shows a slowdown of the Brownian fluctuations, together with a loss of coherence due to the arrested movement of the microemulsion droplets, which prevent estimation of the dHapp for the gel-like microemulsions. Thus, in the following, discussion related to the size of the droplets will only be related to microemulsions with cs up to 40 wt%.
Analysis of the intensity auto-correlation functions indicated that, below the threshold for the appearance of gel-like microemulsions, a single-exponential decay with time (see Equation (1)) can describe the dependences found for the microemulsions. Furthermore, the auto-correlation functions show that the mean relaxation time decreases with the increase of both the APG:SL ratio and cs. This may be explained as a result of a decrease of the size of the droplets in the microemulsions. This is clearer from the results shown in Figure 4, where the mean average hydrodynamic diameters obtained are plotted for different microemulsions.
The average dHapp values of the microemulsion droplets appeared in the range 10 to 15 nm, independent of their compositions, showing strong dependencies with both cs and the APG:SL ratio. Thus, independent of the APG:SL ratio, dHapp decreases with the increase of cs. This may be explained by assuming that the increase of cs is associated with an enhanced reduction of the surface tension, which favors the formation of smaller droplets [30], and therefore favoring microemulsion stability. Analyzing the dependence of the dHapp values on the APG:SL ratio, it is clear that the increase of the content of APG favors a decrease of the size of the droplets. This may be rationalized considering that the increase of the APG content for a fixed value of cs leads to the formation of more packed films at the droplet/water interface.
3.3. Microemulsions for Thymol Solubilization
The above results indicated that the combination of APG and SL may stabilize microemulsions with a broad composition range. These microemulsions are potential options for the solubilization of highly hydrophobic compounds, such as thymol. It is worth stressing that the use of microemulsions containing oil for thymol solubilization, and no surfactant micelles, is required due to the solid character of thymol below 50 ºC. Furthermore, it is expected that oleic acid can provide a good environment for thymol solubilization due to the lower affinity of such EOCs for water, with the oleic acid–water partition coefficient being about 600 [31]. The choice of the most suitable system for solubilization purposes was carried out by taking into consideration the fact that the microemulsions chosen possess a composition far from the onset of the emulsion region. This avoids compositional changes associated with the inclusion of the solubilized compound, which may have otherwise driven the dispersion out of the microemulsion region. Considering the above discussion, three different microemulsions with different values of cs (in the range 18 to 30 wt%) and a fixed value of the APG:SL ratio (8:1) were analyzed as platforms for thymol solubilization. Such compositions were chosen in such a way that it was possible to analyze the result of the solubilization within a broad compositional range. Table 1 summarizes the maximum amounts of thymol that microemulsions with different compositions can solubilize without any evidence of phase separation (ϕ); i.e., the highest concentration of lipophilic compound that could be incorporated within the microemulsion without affecting the nature of the dispersion. The criteria for determining the maximal amount of thymol that could be solubilized within the microemulsion was the appearance of phase separation, resulting from (i) precipitation of thymol, (ii) phase separation of the liquid phases, or (iii) significant increase of the turbidity of the dispersion.
The results suggest that the microemulsions with compositions close to the onset of the emulsion region (cs = 18 wt%) are not good candidates for thymol solubilization, with a loss of stability upon the inclusion of small amounts of thymol. However, as the composition moved closer to the center of the microemulsion region, a higher thymol solubilization yield was obtained without any significant effect on the microemulsion stability, at least considering a similar time scale to that considered for the bare microemulsions. Thymol inclusion within the microemulsions led to a slight increase in the average dHapp, as evidenced in the results shown in Figure 5.
The results can be understood assuming that the incorporation of thymol takes place through its solubilization in the oil phase, consequently decreasing the ratio between the surfactant concentration and the amount of oil phase, which leads to an increase of the effective volume of the dispersed phase. Therefore, a larger amount of surfactant would be required to keep constant the apparent hydrodynamic diameter. However, the introduction of thymol at fixed surfactant concentration increases the average size of the droplets because the solubilization process drives the dispersion to a new composition which is closer to the limit of the microemulsion region. Hence, the addition of thymol leads to a loss of stability of the microemulsions.
3.4. Understanding the Solubilization Process of Thymol
The use of fluorescence spectroscopy allows one to understand changes that occur in the emission spectrum of molecules as result of solubilization processes. This is possible because fluorescence spectroscopy has a high sensitivity to the chemical environment in which the fluorescent molecule is included [32]. Here, the fluorescent emission of thymol after excitation at 280 nm was an advantage in our study [28]. Figure 6 shows the emission spectra (fluorescence intensity, IF, versus wavelength) obtained for a solution of thymol in oleic acid and for thymol included in one of the microemulsions.
The emission spectrum obtained for thymol solutions in Figure 6b shows a broad band of fluorescent emission, with a maximum centered around 379 nm. The intensity of this band increases with the concentration of fluorescent molecules (thymol), as expected for solutions of compounds in which quenching phenomena are absent (data not shown). A detailed analysis of this band provides evidence of the presence of a shoulder at a higher value of wavelength than that corresponding to the maximum. This is explained considering the existence of a second transition. The two bands can clearly be resolved through a deconvolution procedure, assuming the existence of two bands with a Gaussian profile. Thus, thymol dissolved in oleic acid presents two bands centered at 379 and 435 nm. The appearance of two emission bands may be ascribed to the formation of thymol clusters, in agreement with results found for other aromatic alcohols [33].
The situation is strongly modified for thymol solubilized within the microemulsions (see Figure 6c). The incorporation of thymol within the oil phase (oleic acid) of the microemulsion leads to splitting of the emission spectrum in three different bands, centered at 325, 437 and 530 nm. This shows that, whereas the band appearing around 435 nm (437 nm for solubilized thymol) is not significantly shifted after solubilization, the emission band at 379 nm is split into two different bands. The first band appears at a lower wavelength (326 nm, hypsochromic shift) than that corresponding to thymol solutions in oleic acid, with the second one shifted to higher values of the wavelength (530 nm, bathochromic shift). The splitting phenomenon of the emission band may be ascribed to the fact that the solubilization process leads to the appearance of chemically different microenvironments than those existing for free thymol in a solution of oleic acid. This effect arises from the confinement of thymol molecules, which may suggest that the three bands correspond to: (i) thymol solubilized close to the interfacial region of the droplets (band centered at 326 nm), (ii) thymol clusters solubilized within the bulk of the droplets (band centered at 530 nm), and (iii) single thymol molecules solubilized within the bulk of the droplets (band centered at 437 nm). Figure 7 shows the changes on the emission spectrum as a function of the amount of thymol solubilized within the emulsion.
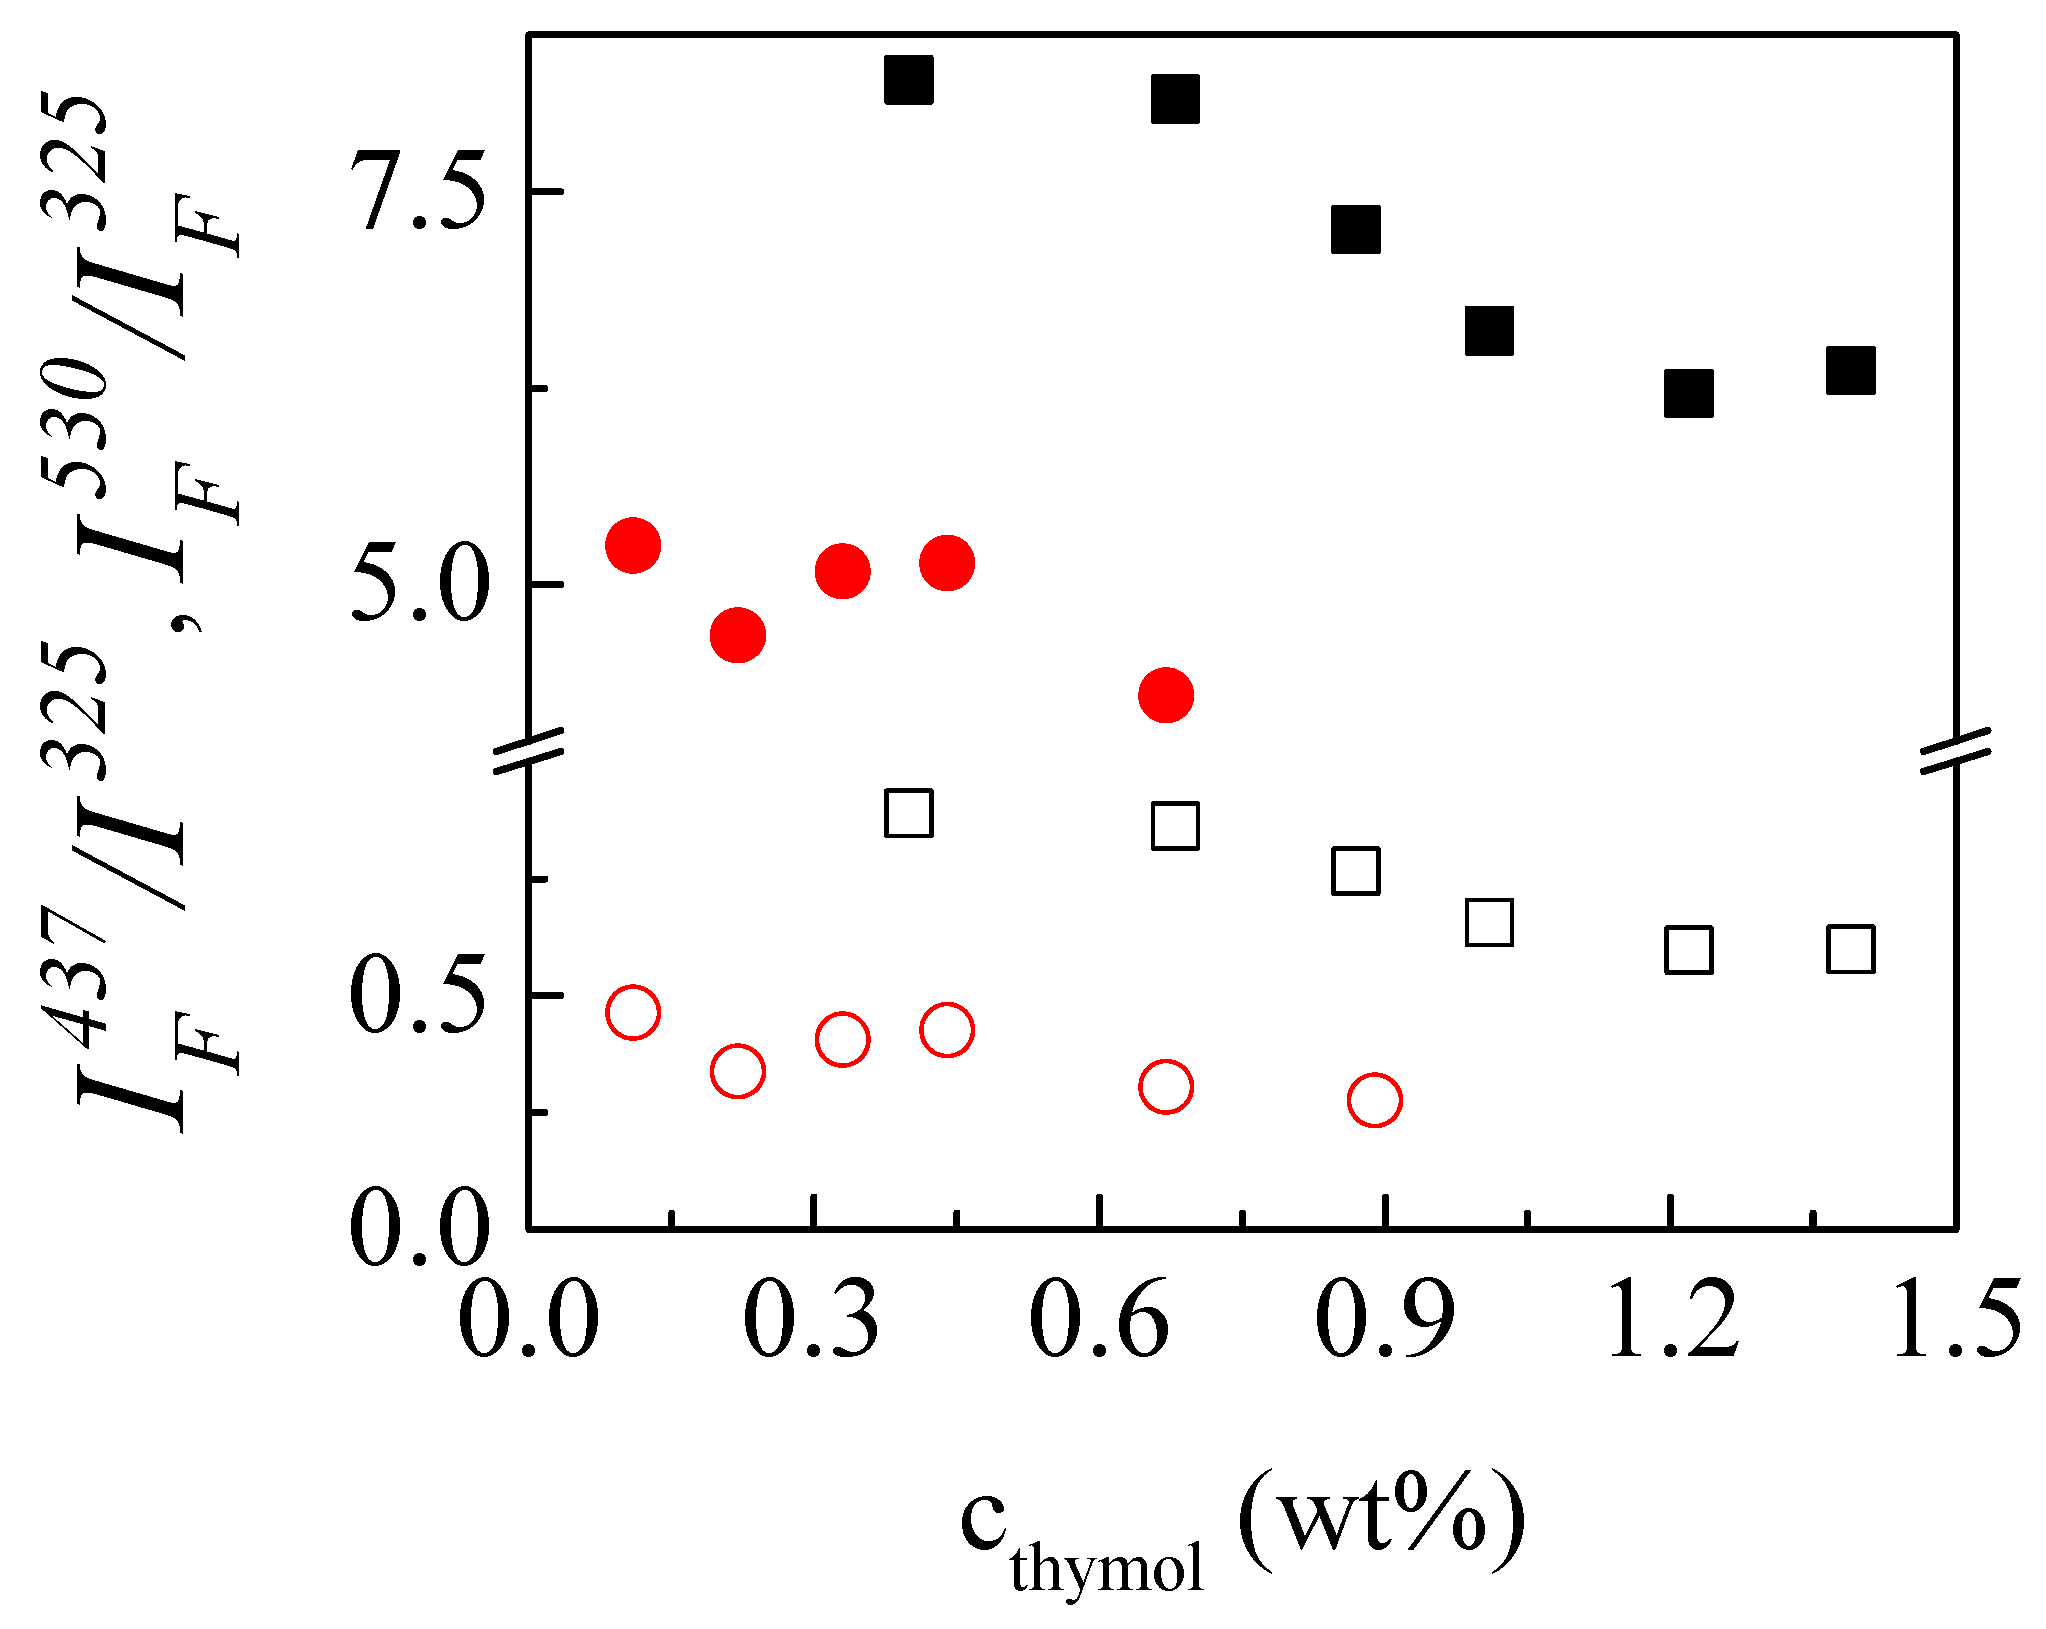
The absence of any significant modification in the intensity of the band appearing at the lowest wavelength with the increase of the thymol solubilized within the microemulsion is a signature of the solubilization in a region of the microemulsion which is not significantly modified with the increase of the total oil volume (oleic acid volume + thymol volume). This seems to confirm that such a band corresponds to the thymol close to the droplet interface, probably incorporated within the APG–SL layer. Furthermore, the position of such a band is in agreement with previous studies, in which thymol was solubilized in a similar chemical microenvironment to that expected for the interfacial region of the microemulsion [34,35]. On the other side, the other two bands present a noticeable decrease of intensity with the amount of solubilized thymol. This is especially true for the one appearing around 437 nm. This may be the result of an increase in the number of solubilized molecules in the bulk of the droplets, which leads to a self-quenching phenomenon of the thymol emission. The appearance of two bands (437 and 530 nm) may again be the result of finding thymol as single molecules and the formation of clusters involving more than one thymol molecule. It is probably expected that the confinement may lead to an enhancement of cluster formation, as was shown previously for other aromatic compounds [36]. Thus, the appearance of the band at 437 nm may be assigned to thymol clusters, with that appearing around 530 nm being assigned to thymol molecules solubilized within the bulk of the droplet. The effect of the confinement and, in particular, of the self-quenching on the concentration is clearer in the representation of the ratio of the intensities of the emission maxima, corresponding to the bands at 437 and 530 nm in relation to the intensity of the band at 325 nm, IF437/IF325 and IF530/IF325, which is shown Figure 8.
The results in Figure 8 show clearly the importance of the band centered at 437 nm, which increases in importance as cs increases. The importance of this band may be understood by considering the existence of higher relative concentrations of thymol in the internal region of the emulsion, as a result of its poor ability to be incorporated in a close-packed interfacial region (high values of IF437/IF325 ratio). Furthermore, the increase in the total surfactant concentration increases the importance of such a band, which may be explained by considering the decrease of the average droplet size (see Figure 4) and, hence, with the increase of the confinement effect. It is worth mentioning that the importance of the band corresponding to the thymol solubilized as single molecules (band at 530 nm) was strongly reduced with the decrease of droplet size.
4. Conclusions
This work was focused on the design of eco-sustainable platforms for the solubilization of an EOC: thymol. These solubilization platforms were based in the use of o/w microemulsions, stabilized by a pair of surfactant formed by an alkyl polyglucoside (APG) and soybean lecithin (SL), with the oil being oleic acid. The results indicate that it is possible to obtain microemulsions in a broad range of compositions, with APG:SL ratios and total surfactant concentrations (APG+SL) enabling control of the properties of the microemulsions obtained, especially the size of the droplets. The optimal choice of the dispersion composition allowed for solubilization of thymol, as was proven by fluorescence spectroscopy, with microemulsions presenting compositions far from those corresponding to the onset of the emulsion region, being potential candidates as solubilization platforms. The fluorescence spectroscopy experiments provided evidence for heterogeneous distribution of thymol within the droplets, with up to three different chemical environments in which thymol can be distributed. It is expected that this preliminary study may open new routes focused on the design of effective platforms for enhancing the availability of poorly soluble molecules with biological interest.
Author Contributions
Conceptualization, E.G., and L.F.-P.; Methodology, S.G.-M., A.L., E.G., and L.F.-P.; Software, E.G.; Validation, E.G., F.O. and R.G.R.; Formal Analysis, E.G., and L.F.-P.; Investigation, S.G.-M., A.L.., E.G., L.F.-P., F.O., and R.G.R.; Resources, R.G.R. and F.O.; Data Curation, E.G.; Writing—Original Draft Preparation, E.G.; Writing—Review and Editing, E.G., F.O. and R.G.R.; Visualization, E.G.; Supervision, E.G., F.O. and R.G.R.; Project Administration, R.G.R.; Funding Acquisition, R.G.R. and F.O.
Funding
This work was funded by MINECO under grant CTQ2016-78895-R.
Acknowledgments
The C.A.I. of Espectroscopia y Correlación of the Universidad Complutense de Madrid is acknowledged for its availability in the use of its facilities.
Conflicts of Interest
The authors declare no conflict of interest. The funders had no role in the design of the study; in the collection, analyses, or interpretation of data; in the writing of the manuscript, or in the decision to publish the results.
References
- Breuer, E.; Chorghadez, M.S.; Fischer, J.; Golomb, G. Glossary of Terms related to Pharmaceutics. Pure Appl. Chem. 2009, 81, 971–999. [Google Scholar] [CrossRef]
- Tran, T.T.D.; Tran, P.H.L. Nanoconjugation and Encapsulation Strategies for Improving Drug Delivery and Therapeutic Efficacy of Poorly Water-Soluble Drugs. Pharmaceutics 2019, 11, 325. [Google Scholar] [CrossRef] [PubMed]
- Wais, U.; Jackson, A.W.; He, T.; Zhang, H. Nanoformulation and encapsulation approaches for poorly water-soluble drug nanoparticles. Nanoscale 2016, 8, 1746–1769. [Google Scholar] [CrossRef] [PubMed]
- Guzmán, E.; Mateos-Maroto, A.; Ruano, M.; Ortega, F.; Rubio, R.G. Layer-by-Layer polyelectrolyte assemblies for encapsulation and release of active compounds. Adv. Colloid Interface Sci. 2017, 249, 290–307. [Google Scholar] [CrossRef]
- Argudo, P.G.; Guzmán, E.; Lucia, A.; Rubio, R.G.; Ortega, F. Preparation and Application in Drug Storage and Delivery of Agarose Nanoparticles. Int. J. Polym. Sci. 2018, 2018, 7823587. [Google Scholar] [CrossRef]
- Asbahani, A.E.; Miladi, K.; Badri, W.; Sala, M.; Addi, E.H.A.; Casabianca, H.; Mousadik, A.E.; Hartmann, D.; Jilale, A.; Renaud, F.N.R.; et al. Essential oils: From extraction to encapsulation. Int. J. Pharm. 2015, 483, 220–243. [Google Scholar] [CrossRef]
- Tadros, T.F. (Ed.) Emulsion Science and Technology; Wiley-VCH Verlag GmbH & Co.: Weinheim, Germanuy, 2009. [Google Scholar]
- Donsì, F.; Ferrari, G. Essential oil nanoemulsions as antimicrobial agents in food. J. Biotech. 2016, 233, 106–120. [Google Scholar] [CrossRef]
- Mishra, M. (Ed.) Handbook of Encapsulation and Controlled Release; CRC Press: Boca Raton, FL, USA, 2015. [Google Scholar] [CrossRef]
- Fanun, M. Colloids in Drug Delivery; Taylor and Francis: New York, NY, USA, 2010. [Google Scholar]
- Fanun, M. Microemulsions Properties and Applications; Taylor and Francis: New York, NY, USA, 2009. [Google Scholar]
- Fanun, M. Microemulsions as delivery systems. Curr. Opin. Colloid Interface Sci. 2012, 17, 306–313. [Google Scholar] [CrossRef]
- Jiménez, M.; Domínguez, J.A.; Pascual-Pineda, L.A.; Azuara, E.; Beristain, C.I. Elaboration and characterization of O/W cinnamon (Cinnamomum zeylanicum) and black pepper (Piper nigrum) emulsions. Food Hydrocoll. 2018, 77, 902–910. [Google Scholar] [CrossRef]
- Chatzidaki, M.D.; Balkiza, F.; Gad, E.; Alexandraki, V.; Avramiotis, S.; Georgalaki, M.; Papadimitriou, V.; Tsakalidou, E.; Papadimitriou, K.; Xenakis, A. Reverse micelles as nano-carriers of nisin against foodborne pathogens. Part II: The case of essential oils. Food Chem. 2019, 278, 415–423. [Google Scholar] [CrossRef]
- Mayaud, L.; Carricajo, A.; Zhiri, A.; Aubert, G. Comparison of bacteriostatic and bactericidal activity of 13 essential oils against strains with varying sensitivity to antibiotics. Lett. Appl. Microbiol. 2008, 47, 167–173. [Google Scholar] [CrossRef] [PubMed]
- Burt, S. Essential oils: Their antibacterial properties and potential applications in foods—A review. Int. J. Food Microbiol. 2004, 94, 223–253. [Google Scholar] [CrossRef] [PubMed]
- Lucia, A.; Toloza, A.C.; Guzmán, E.; Ortega, F.; Rubio, R.G. Novel polymeric micelles for insect pest control: Encapsulation of essential oil monoterpenes inside a triblock copolymer shell for head lice control. Peer J. 2017, 5, e3171. [Google Scholar] [CrossRef] [PubMed]
- Dima, C.; Dima, S. Essential oils in foods: Extraction, stabilization, and toxicity. Curr. Opin. Food Sci. 2015, 5, 29–35. [Google Scholar] [CrossRef]
- Lingan, K. A Review on Major Constituents of Various Essential Oils and its Application. Transl. Med. 2018, 8, 1000201. [Google Scholar] [CrossRef]
- Aziz, Z.A.A.; Nasir, H.M.; Ahmad, A.; Setapar, S.H.M.; Ahmad, H.; Noor, M.H.M.; Rafatullah, M.; Khatoon, A.; Kausar, M.A.; Ahmad, I.; et al. Enrichment of Eucalyptus oil nanoemulsion by micellar nanotechnology: Transdermal analgesic activity using hot plate test in rats’ assay. Sci. Rep. 2019, 9, 13678. [Google Scholar] [CrossRef]
- De Godoi, S.N.; Quatrin, P.M.; Sagrillo, M.R.; Nascimento, K.; Wagner, R.; Klein, B.; Santos, R.C.V.; Ourique, A.F. Evaluation of Stability and In Vitro Security of Nanoemulsions Containing Eucalyptus globulus Oil. Biomed. Res. Int. 2017, 2017, 2723418. [Google Scholar] [CrossRef]
- Hammoud, Z.; Gharib, R.; Fourmentin, S.; Elaissari, A.; Greige-Gerges, H. New findings on the incorporation of essential oil components into liposomes composed of lipoid S100 and cholesterol. Int. J. Pharm. 2019, 561, 161–170. [Google Scholar] [CrossRef]
- Suppasansatorn, P.; Nimmannit, U.; Conway, B.R.; Du, L.; Wang, Y. Microemulsions as topical delivery vehicles for the anti-melanoma prodrug, temozolomide hexyl ester (TMZA-HE). J. Pharm. Pharmacol. 2007, 59, 787–794. [Google Scholar] [CrossRef]
- Hathout, R.M.; Woodman, T.J.; Mansour, S.; Mortada, N.D.; Geneidi, A.S.; Guy, R.H. Microemulsion formulations for the transdermal delivery of testosterone. Eur. J. Pharm. Sci. 2010, 40, 188–196. [Google Scholar] [CrossRef]
- Zhu, W.; Yu, A.; Wang, W.; Dong, R.; Wu, J.; Zhai, G. Formulation design of microemulsion for dermal delivery of penciclovir. Int. J. Pharm. 2008, 360, 184–190. [Google Scholar] [CrossRef]
- Ruiz, M.A.; Arias, J.L.; Gallardo, V. Skin Creams Made with Olive Oil. In Olives and Olive Oil in Health and Disease Prevention; Preedy, V.R., Watson, R.R., Eds.; Academic Press: San Diego, CA, USA, 2010; pp. 1133–1141. [Google Scholar] [CrossRef]
- Berne, B.J.; Pecora, R. Dynamic Light Scattering: With Applications to Chemistry, Biology, and Physics; Dover Publications Inc.: Mineola, NY, USA, 2003. [Google Scholar]
- Wang, H.B.; Zhang, Y.J.; Xiao, X.; Jin, D.; Zhao, N.J.; Yin, G.F.; Guo, L.Q.; Liu, W.Q.. Excitation-emission fluorescence characterization study of the three phenolic compounds. Spectrosc. Spect. Anal 2010, 30, 1271–1274. [Google Scholar] [CrossRef]
- Isailović, T.M.; Todosijević, M.N.; Đorđević, a.M.; Savić, S.D. Natural Surfactants-Based Micro/Nanoemulsion Systems for NSAIDs—Practical Formulation Approach, Physicochemical and Biopharmaceutical Characteristics/Performances. In Microsized and Nanosized Carriers for Nonsteroidal Anti-Inflammatory Drugs: Formulation Challenges and Potential Benefits; Čalija, B., Ed.; Academic Press: London, UK, 2017; pp. 179–217. [Google Scholar] [CrossRef]
- Tolman, R.C. The Effect of Droplet Size on Surface Tension. J. Chem. Phys. 1949, 17, 333. [Google Scholar] [CrossRef]
- Meeran, M.F.N.; Javed, H.; Taee, H.A.; Azimullah, S.; Ojha, S.K. Pharmacological Properties and Molecular Mechanisms of Thymol: Prospects for Its Therapeutic Potential and Pharmaceutical Development. Front. Pharm. 2017, 8, 380. [Google Scholar] [CrossRef]
- Sauer, M.; Hofkens, J.; Enderlein, J. Handbook of Fluorescence Spectroscopy and Imaging; Wiley VCH Verlag GmbH & Co. KGaA: Weinheim, Germany, 2011. [Google Scholar]
- Tchaikovskaya, O.N.; Sokolova, I.V.; Kuznetsova, R.T.; Swetlitchnyi, V.A.; Kopylova, T.N.; Mayer, G.V. Fluorescence Investigations of Phenol Phototransformation in Aqueous Solutions. J. Fluoresc. 2000, 10, 403–408. [Google Scholar] [CrossRef]
- Pan, K.; Chen, H.; Davidson, P.M.; Zhong, Q. Thymol Nanoencapsulated by Sodium Caseinate: Physical and Antilisterial Properties. J. Agric. Food Chem. 2014, 62, 1649–1657. [Google Scholar] [CrossRef]
- Bose, A.; Sengupta, P.; Pal, U.; Senapati, S.; Ahsan, M.; Roy, S.; Das, U.; Sen, K. Encapsulation of Thymol in cyclodextrin nano-cavities: A multispectroscopic and theoretical study. Spectrochim. Acta A 2019, 208, 339–348. [Google Scholar] [CrossRef]
- Hollamby, M.J.; Danks, A.E.; Schnepp, Z.; Rogers, S.E.; Hart, S.R.; Nakanishi, T. Fluorescent liquid pyrene derivative-in-water microemulsions. Chem. Commun. 2016, 52, 7344–7347. [Google Scholar] [CrossRef] [Green Version]
Figure 1.
Ternary pseudo-phase diagram representing a cut of the whole phase diagram obtained at 25 °C for the dispersion obtained (content of oil phase constant at 3 wt%), with the microemulsion region corresponding to oil-in-water (o/w) microemulsions (MEs), evidenced in gray. The phase change of the dispersions to emulsions (E) and gels (G) is evidenced with an arrow in the phase diagram. The enlarged figure shows the different samples studied within this work. In such a plot, the different nature of the dispersions obtained are evidenced with different symbols: o/w microemulsion (ME, ●), emulsion (E, ■) and gel (G, ♦). Notice that axes represent the weight fraction of the components, with the composition of the ternary mixture, water/alkyl polyglucoside (APG)/soybean lecithin (SL), referred to as 1.
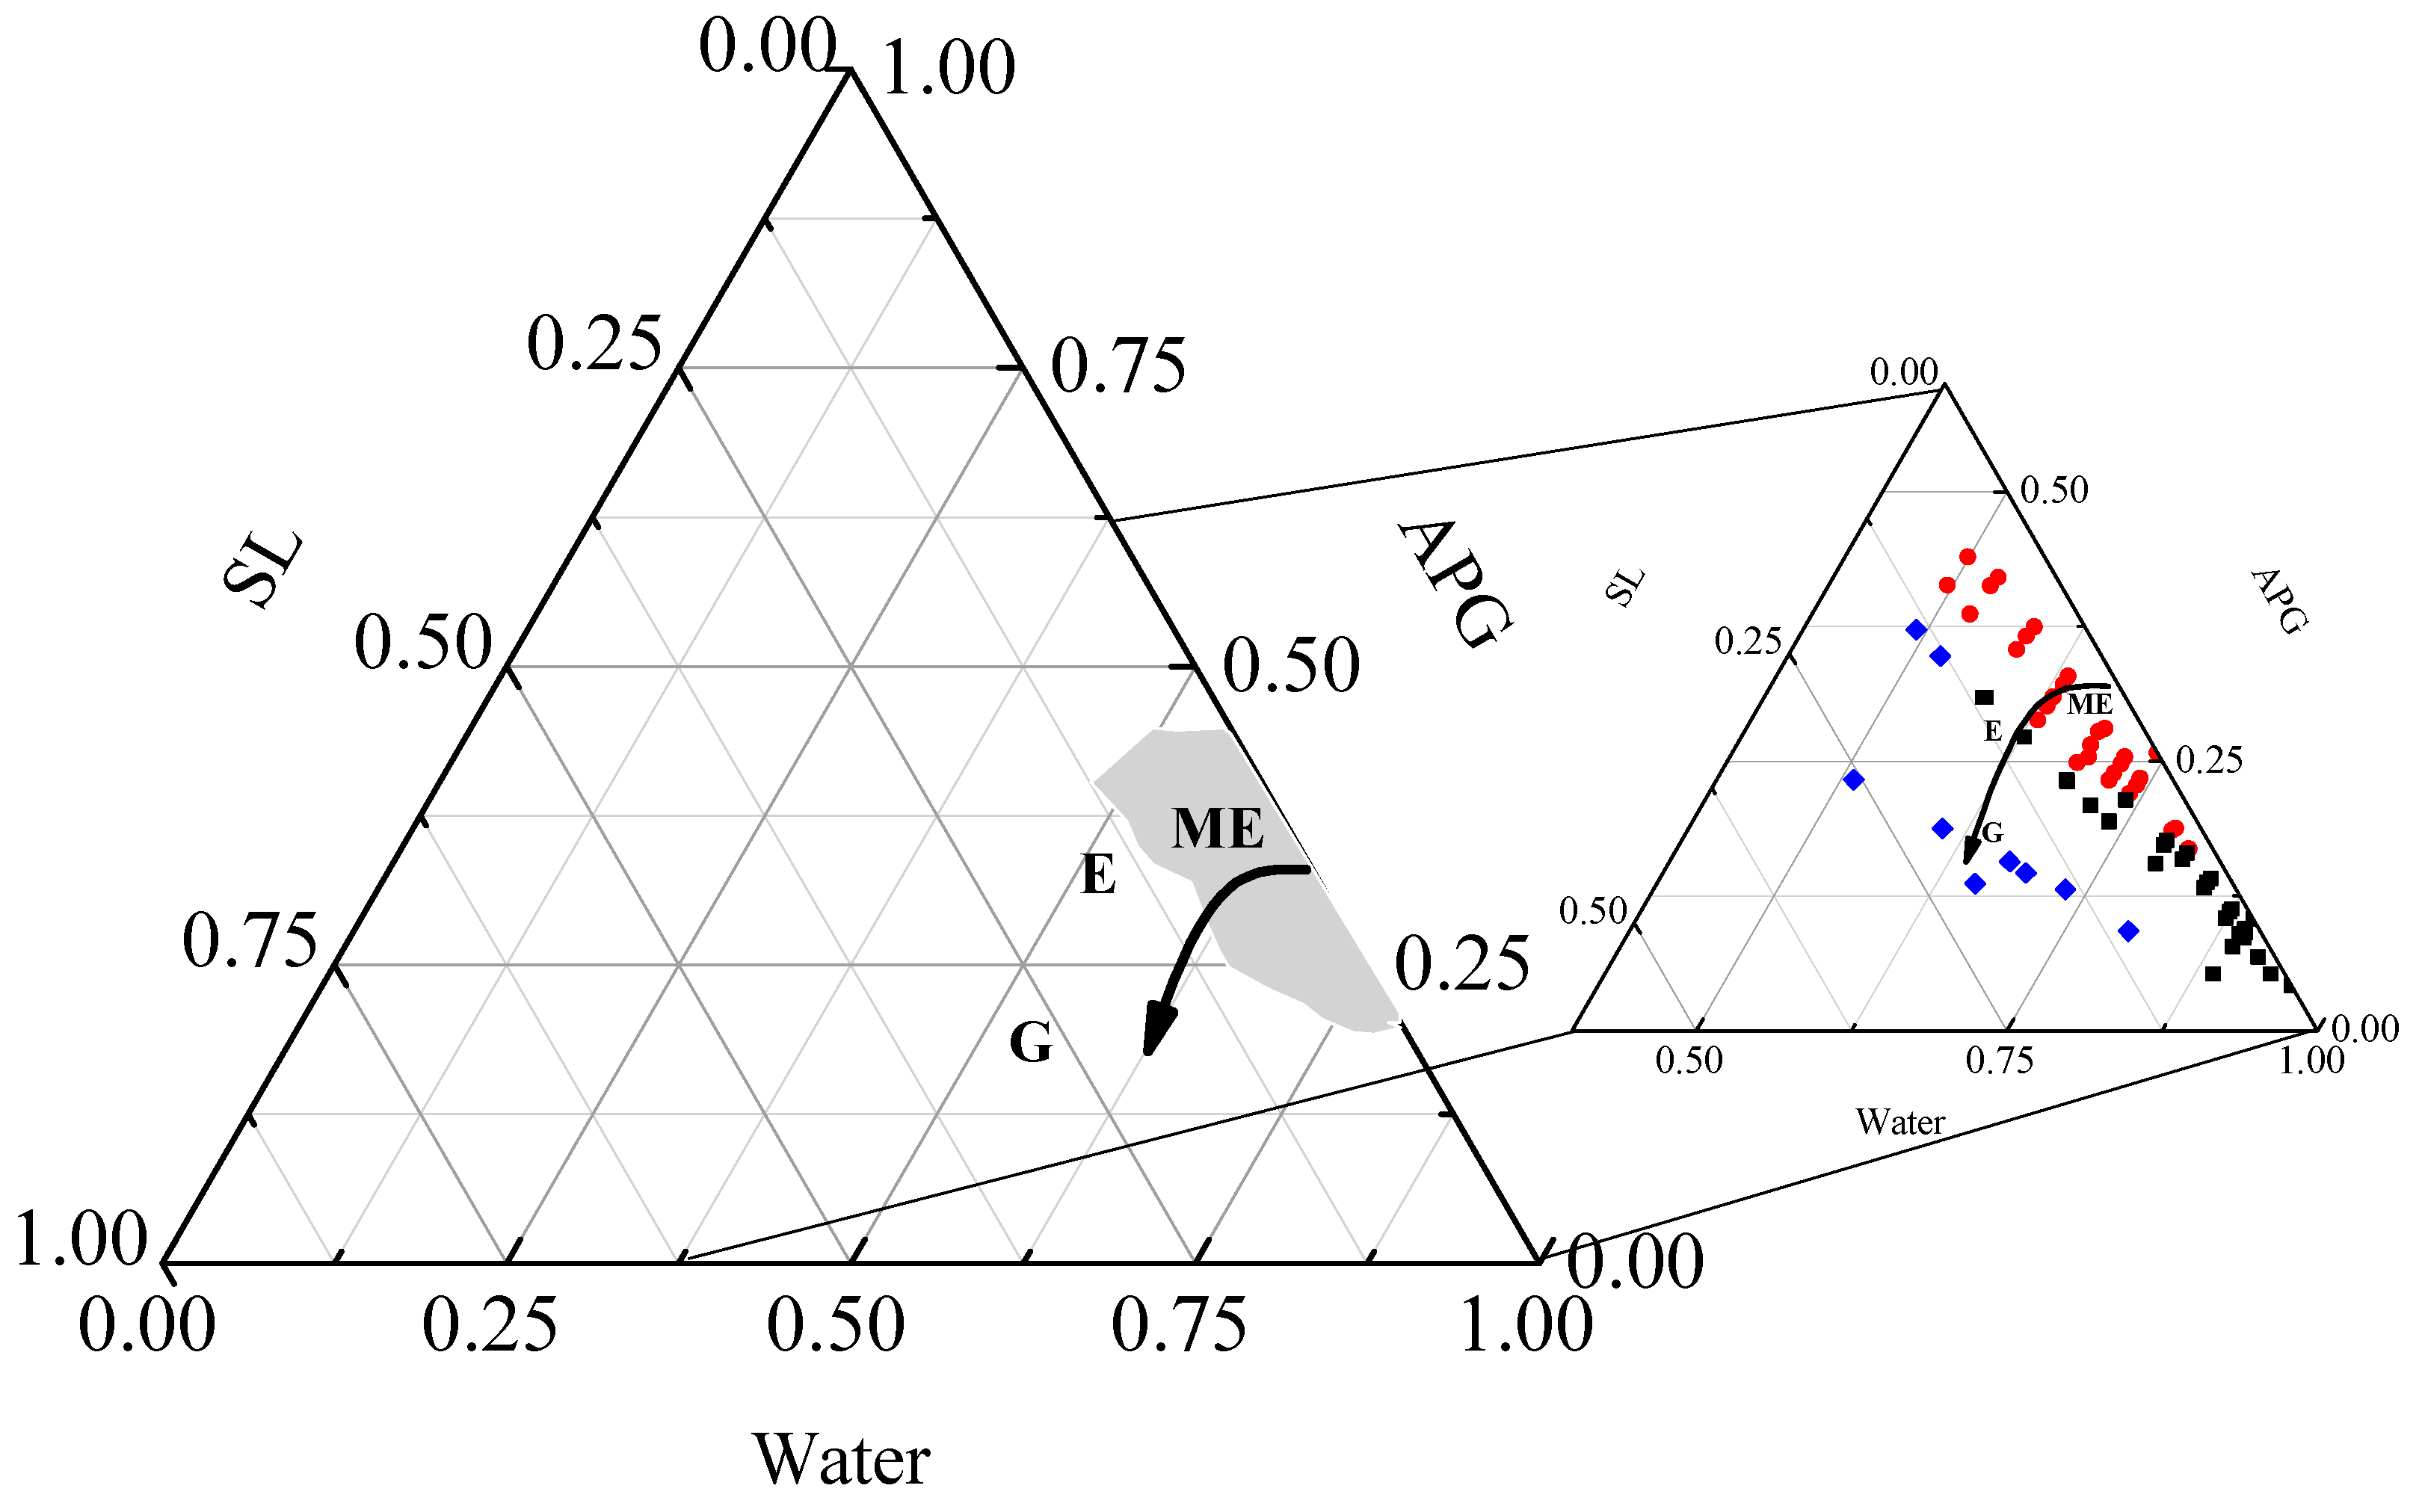
Figure 2.
Photos of the dispersions of oleic acid (3 wt%) in water, stabilized by a total concentration of surfactant mixture of 27 wt%, with the APG:SL ratio increasing from left to right. The arrow indicates the direction in which the concentration of APG is increasing in the surfactant mixture.
Figure 2.
Photos of the dispersions of oleic acid (3 wt%) in water, stabilized by a total concentration of surfactant mixture of 27 wt%, with the APG:SL ratio increasing from left to right. The arrow indicates the direction in which the concentration of APG is increasing in the surfactant mixture.
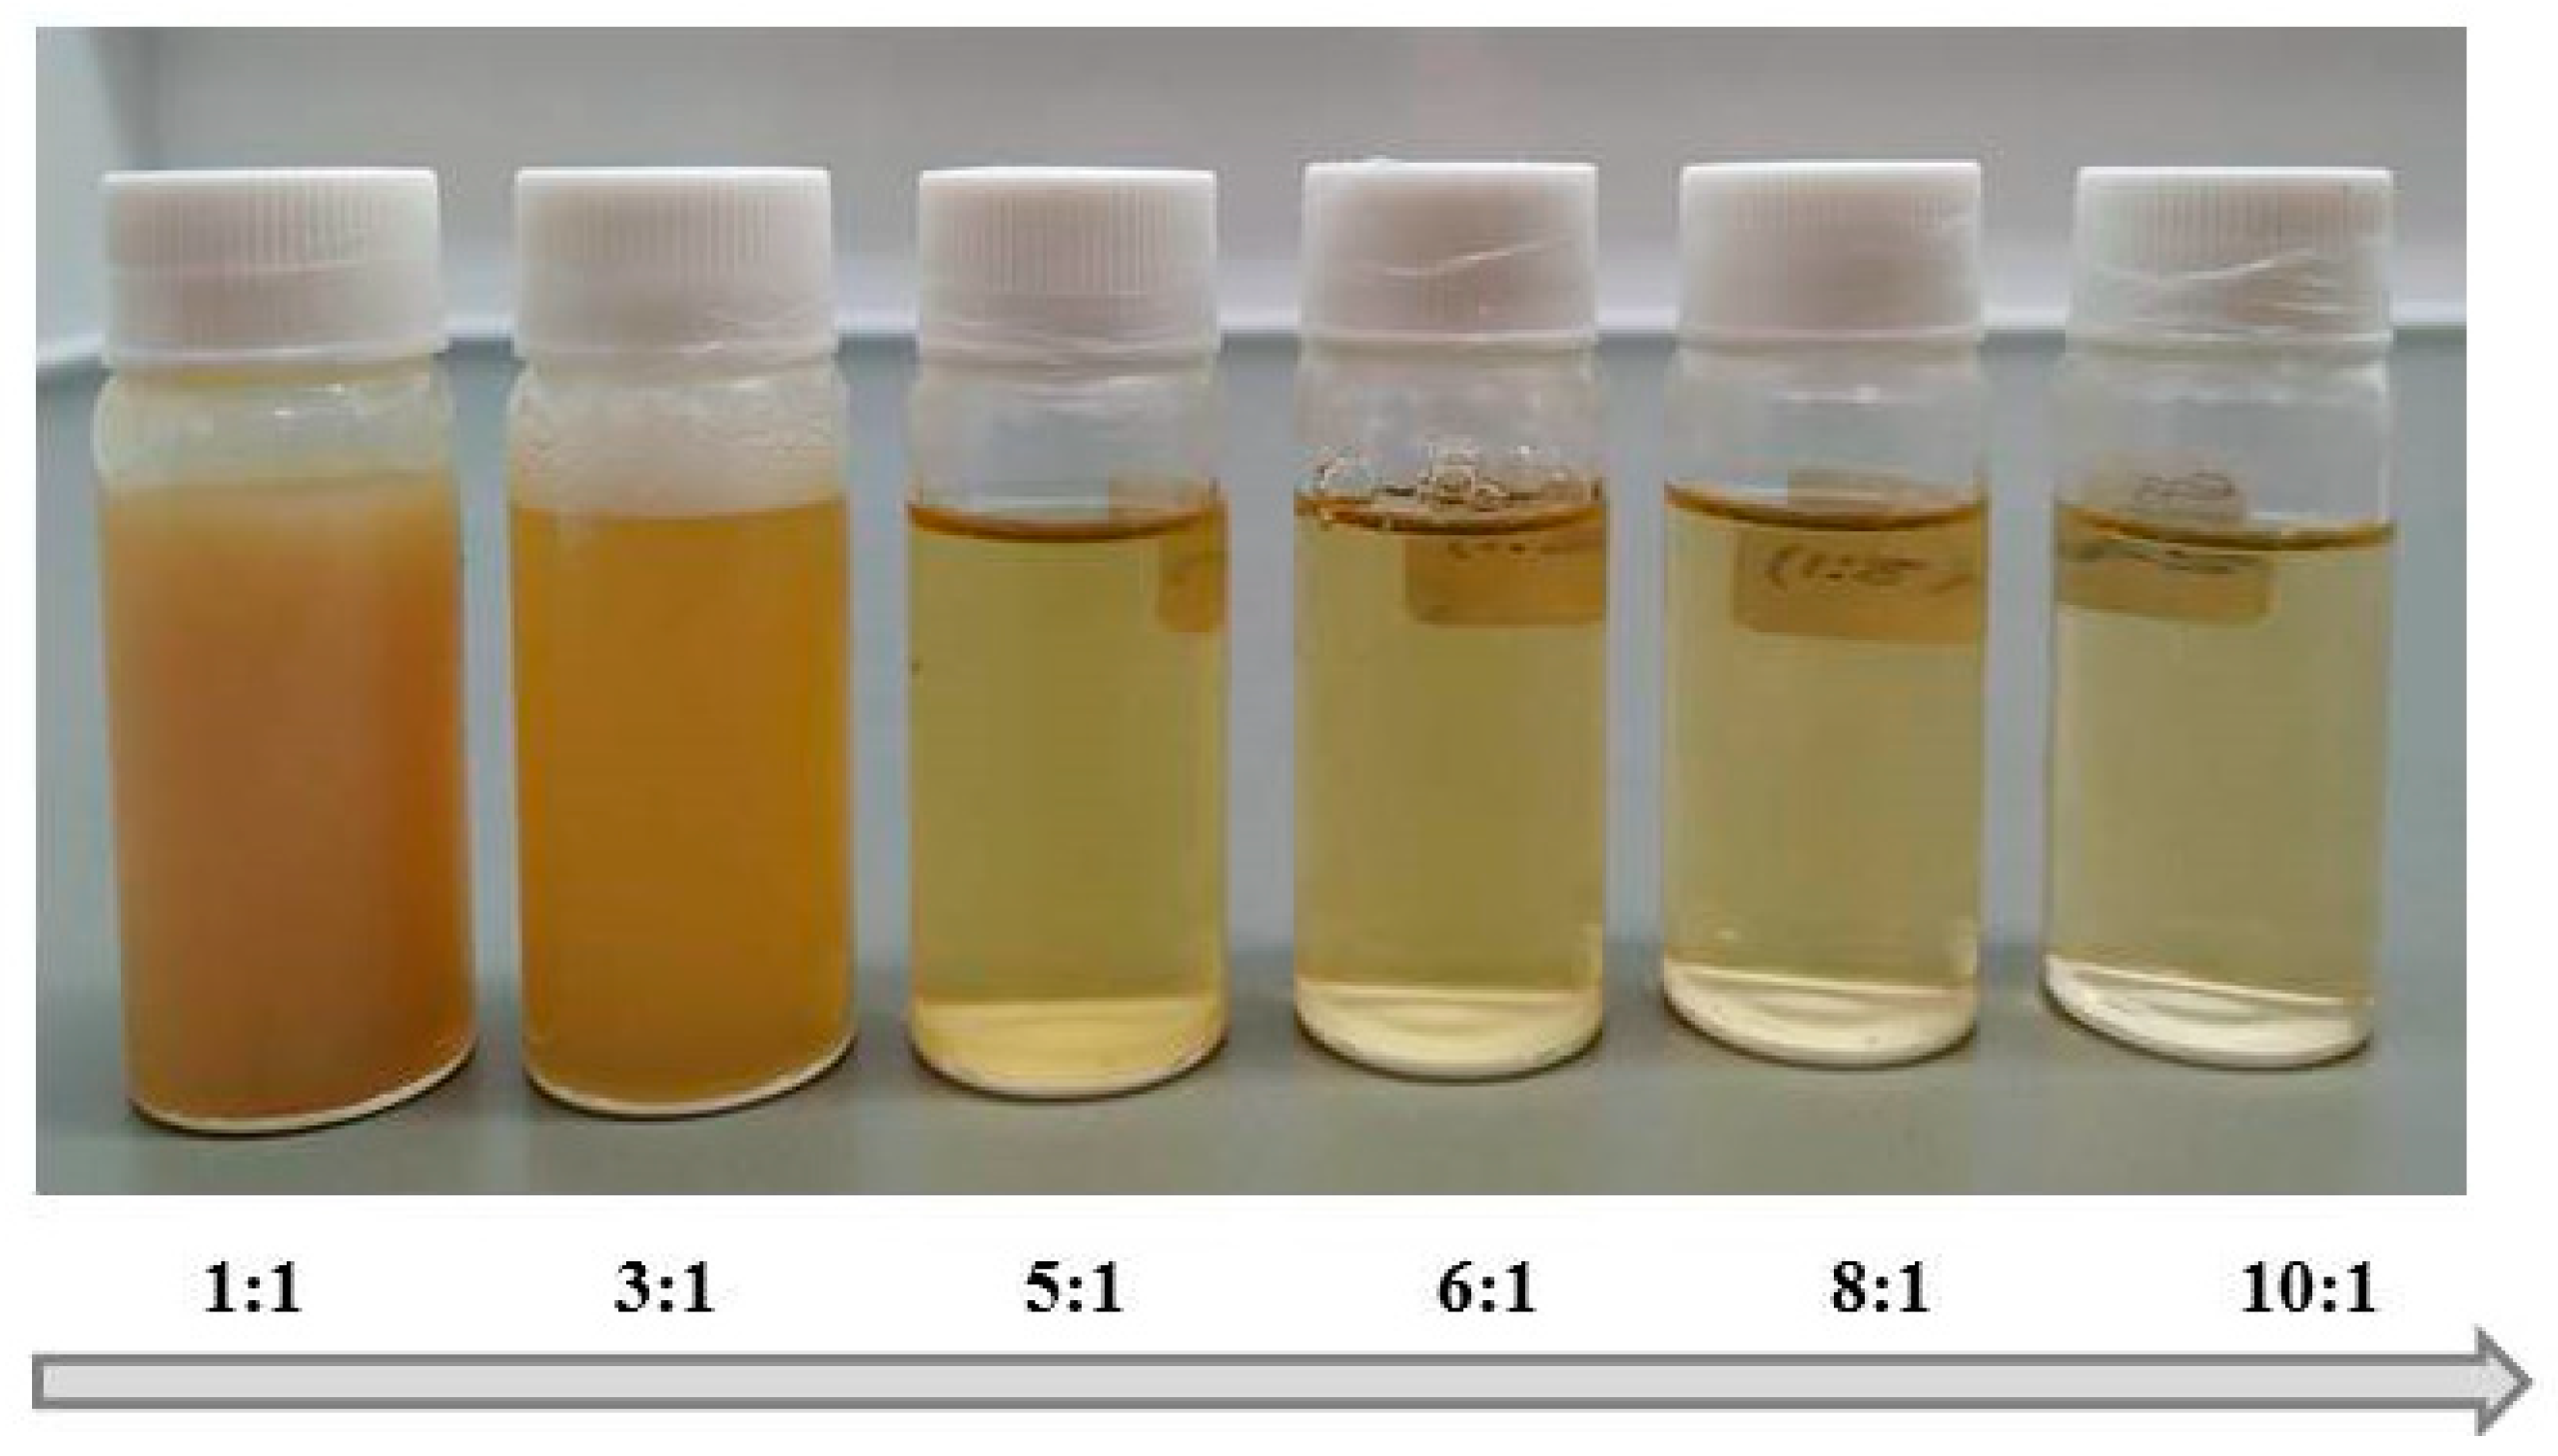
Figure 3.
Intensity auto-correlation functions for microemulsions: effect of the APG:SL ratio for microemulsions containing a fixed total surfactant concentration (cs) value of 30 wt% (a) and of the cs value for microemulsions with a fixed APG:SL ratio of 8:1 (b). Results correspond to microemulsions with a fixed oil content (3 wt%).
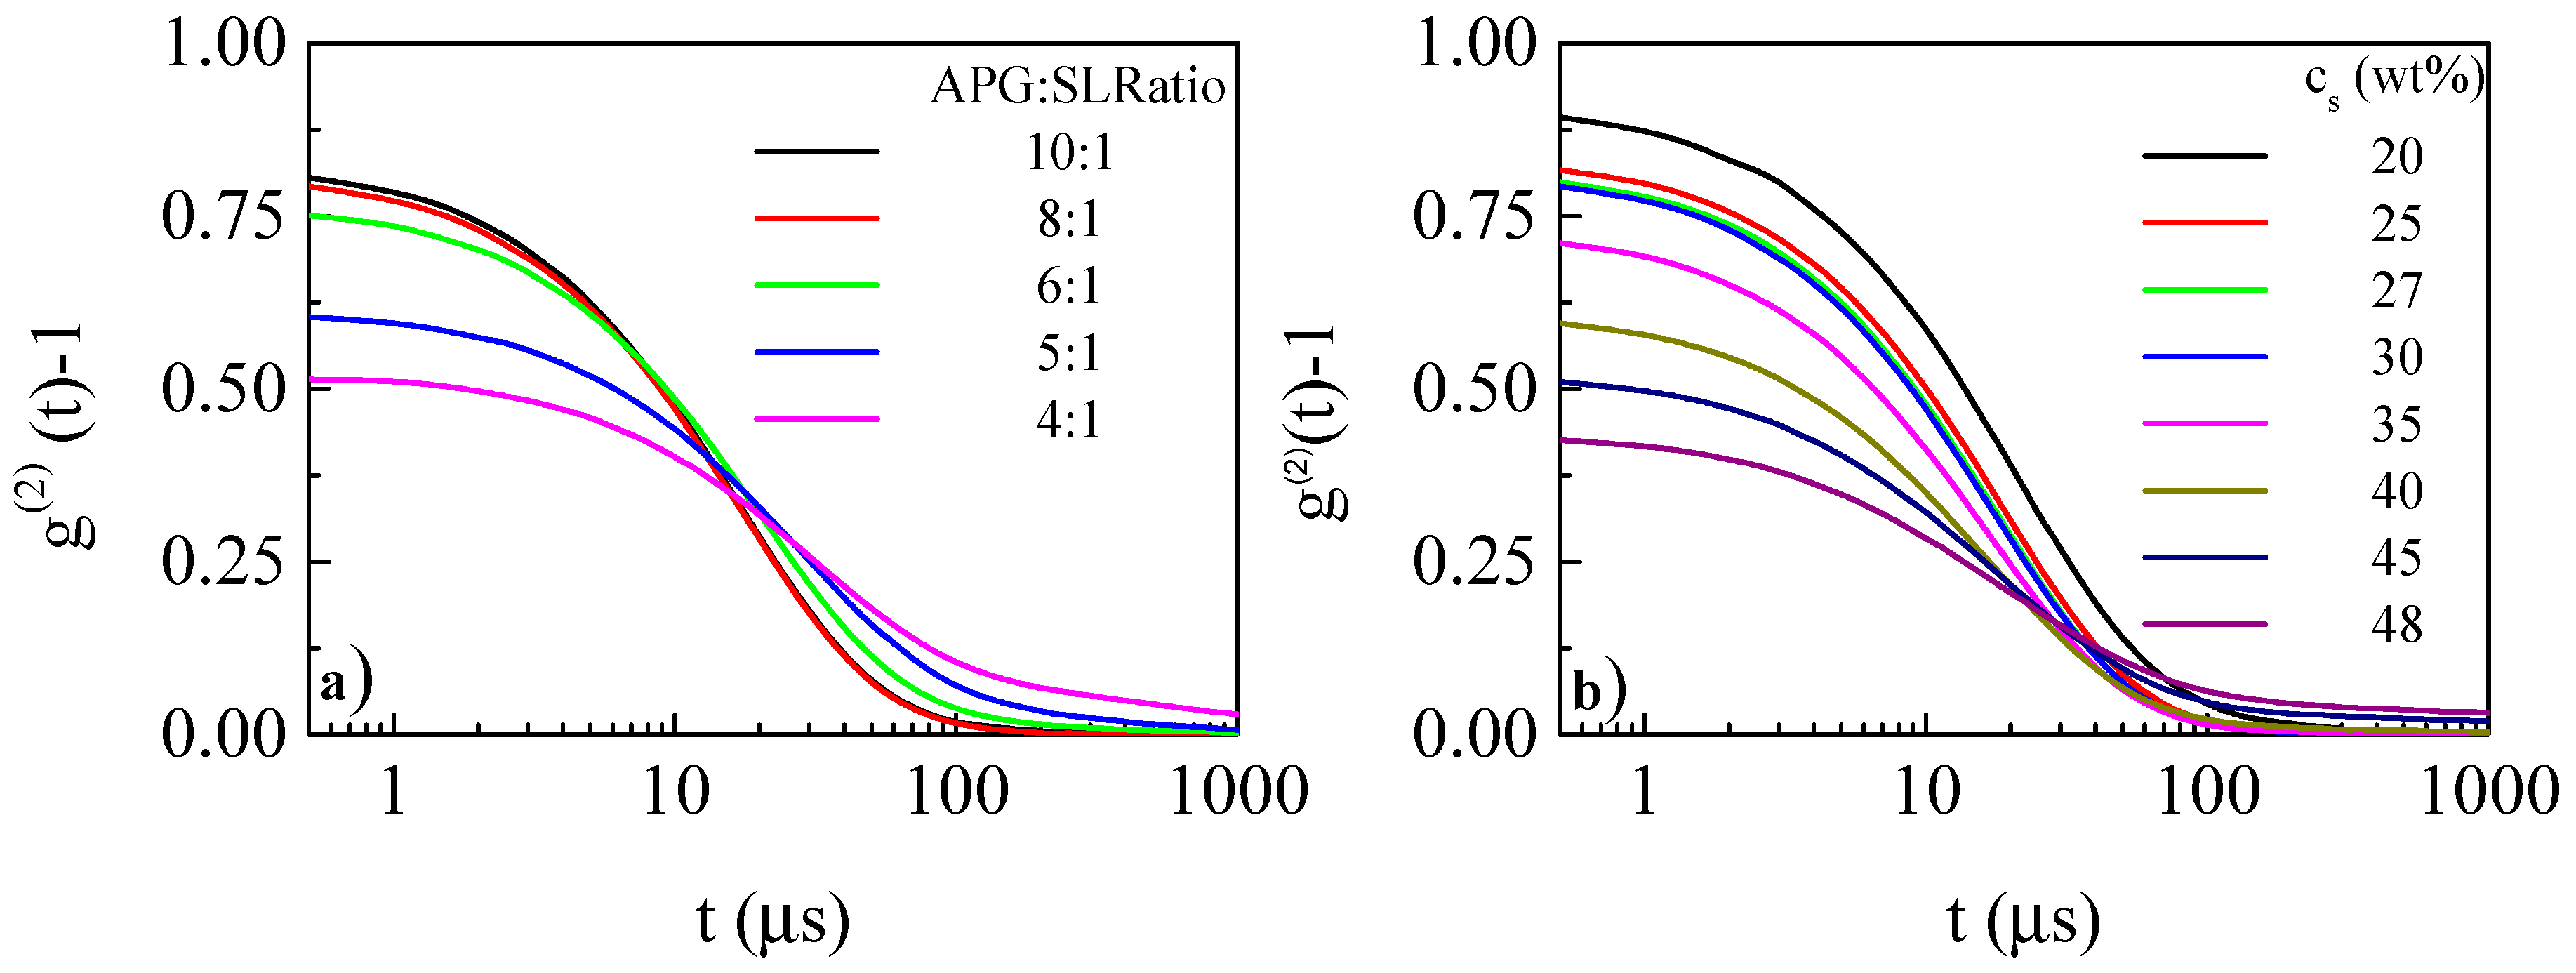
Figure 4.
Dependence of the average apparent hydrodynamic diameter (dHapp) on cs for microemulsions containing a different APG:SL ratio: 10:1 (■); 8:1 (●); 6:1 (▲) y 5:1 (♦). Results correspond to microemulsions with a fixed oil content (3 wt%). Lines are guides for the eyes. Notice that the width of the dHapp distributions is around 5 nm in all cases.
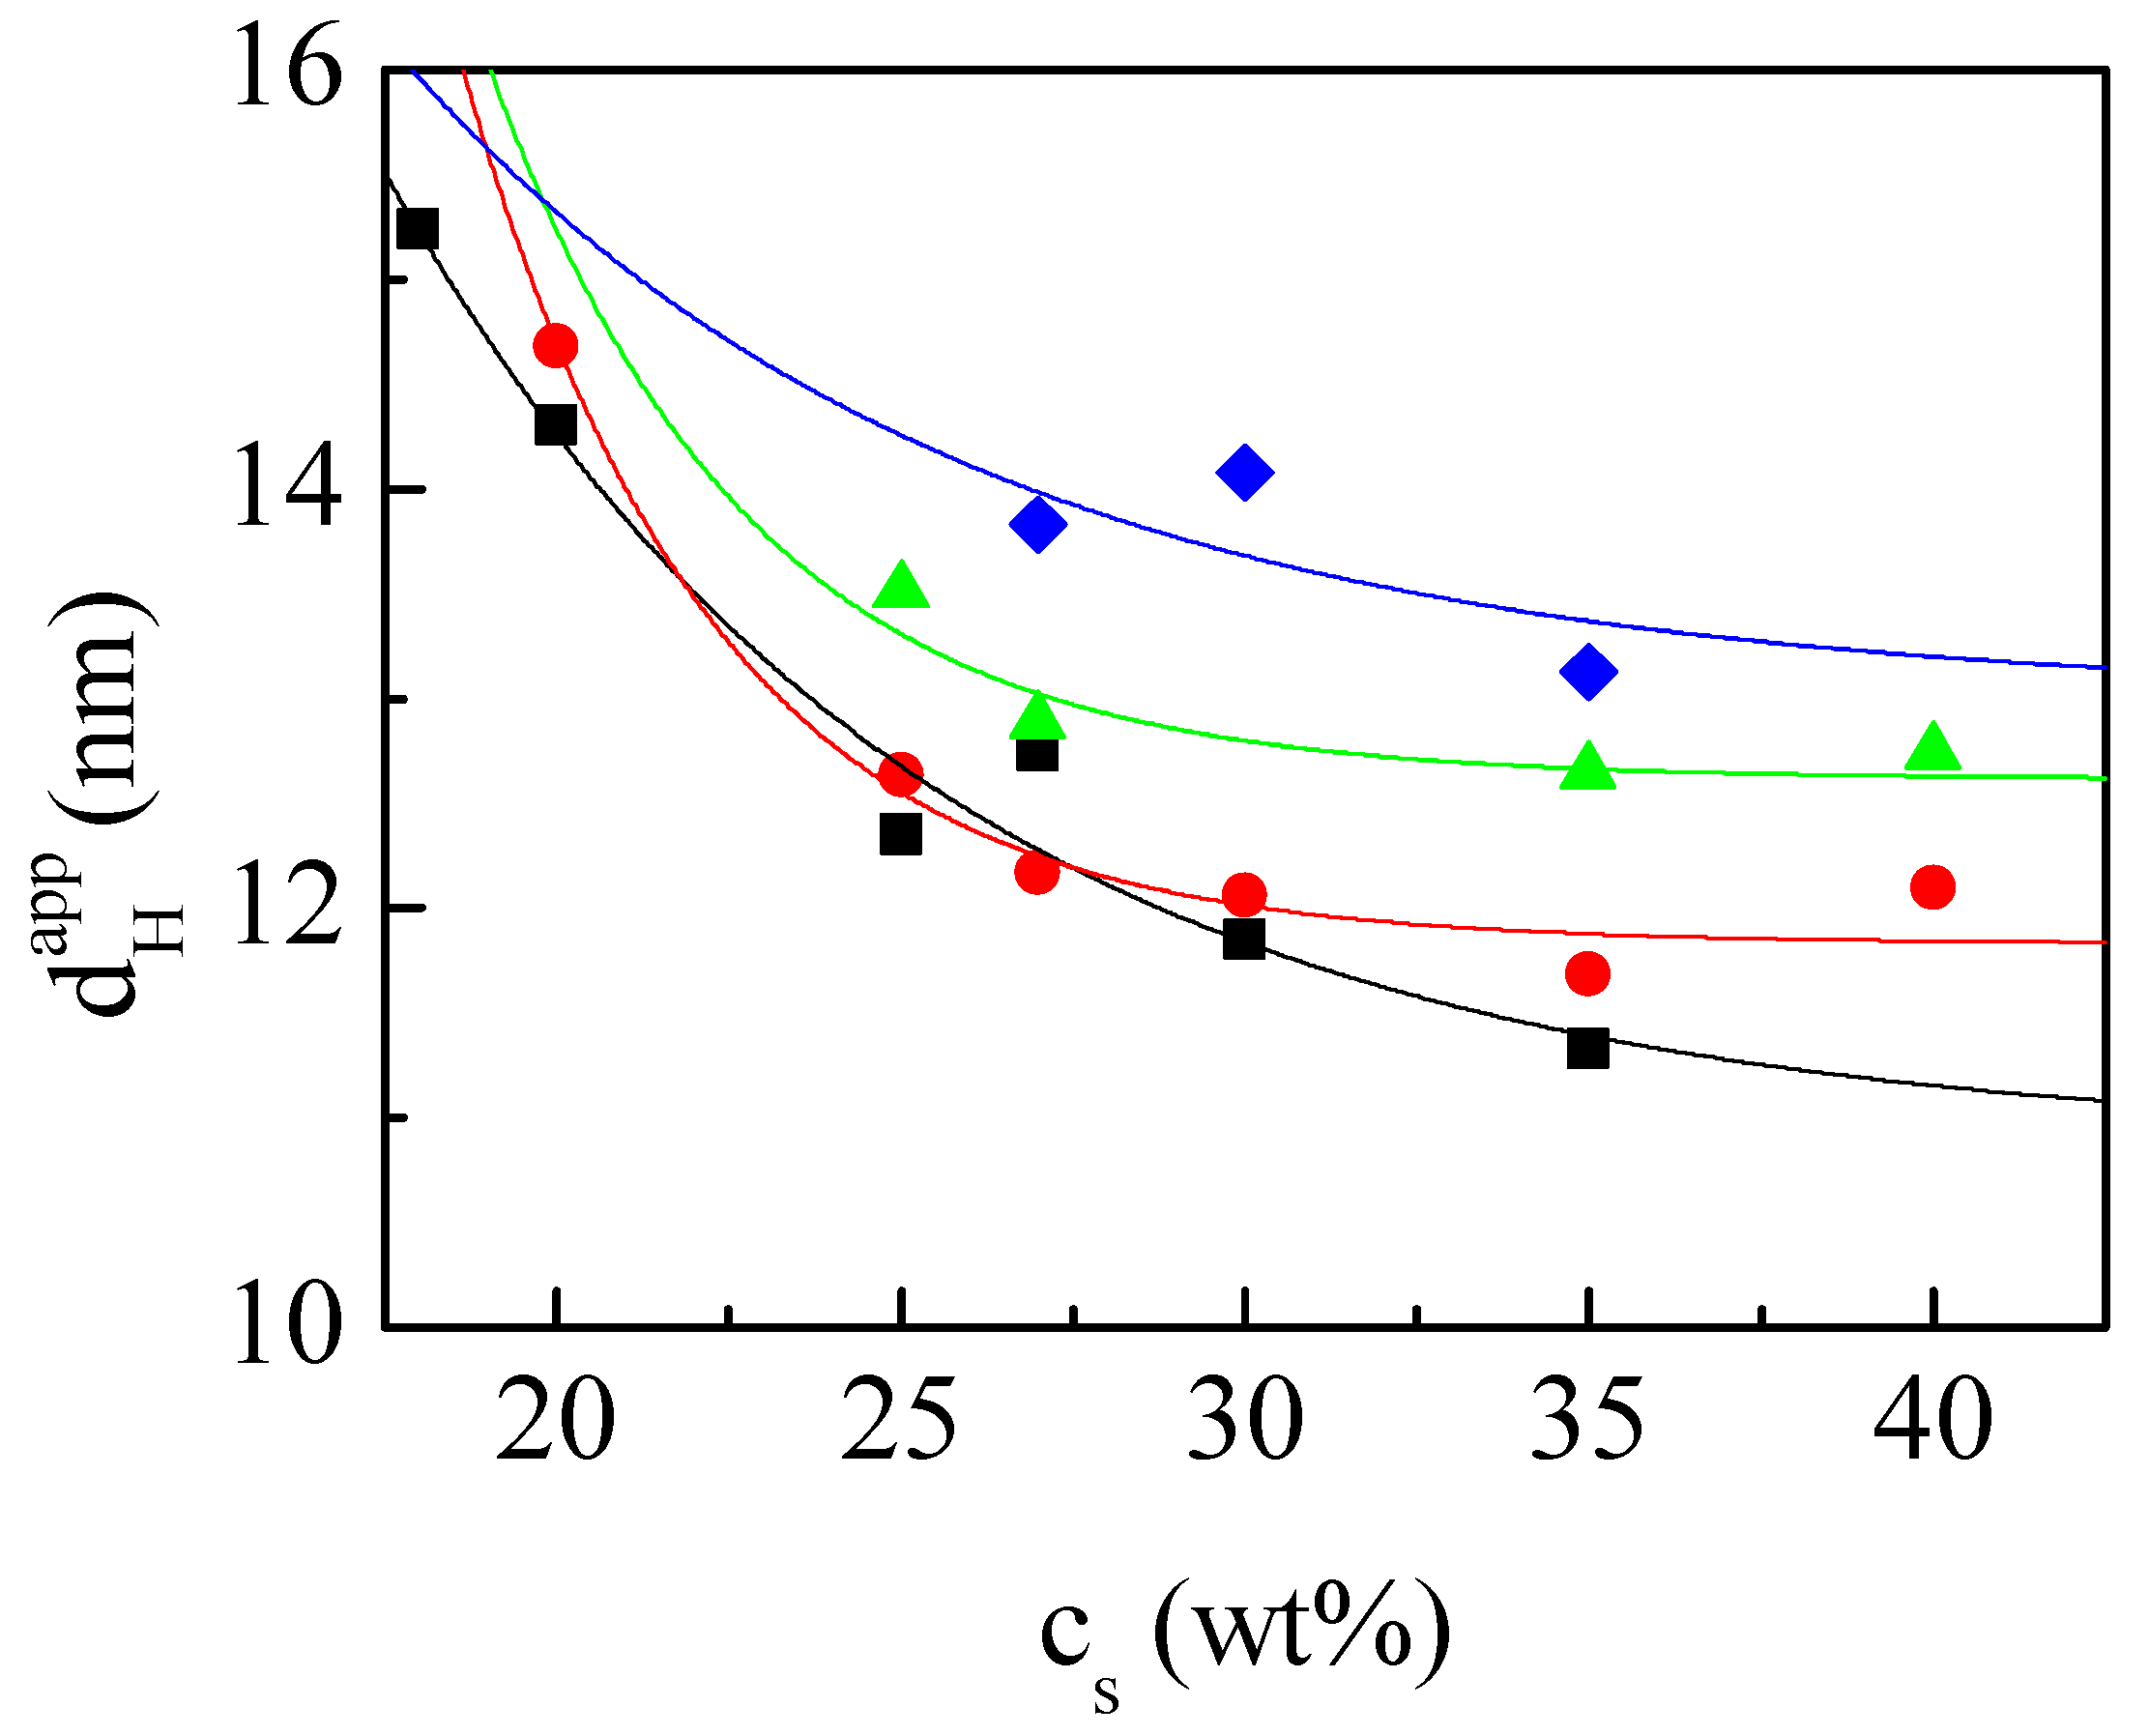
Figure 5.
Dependence of the average dHapp on the amount of solubilized thymol for microemulsions with 8:1 APG:SL ratio and different cs: 25 wt% (●) and 30 wt% (■). Results correspond to microemulsions with a fixed oil content (3 wt%). Notice that the width of the dHapp distributions is around 5 nm in all cases. Lines are guides for the eyes.
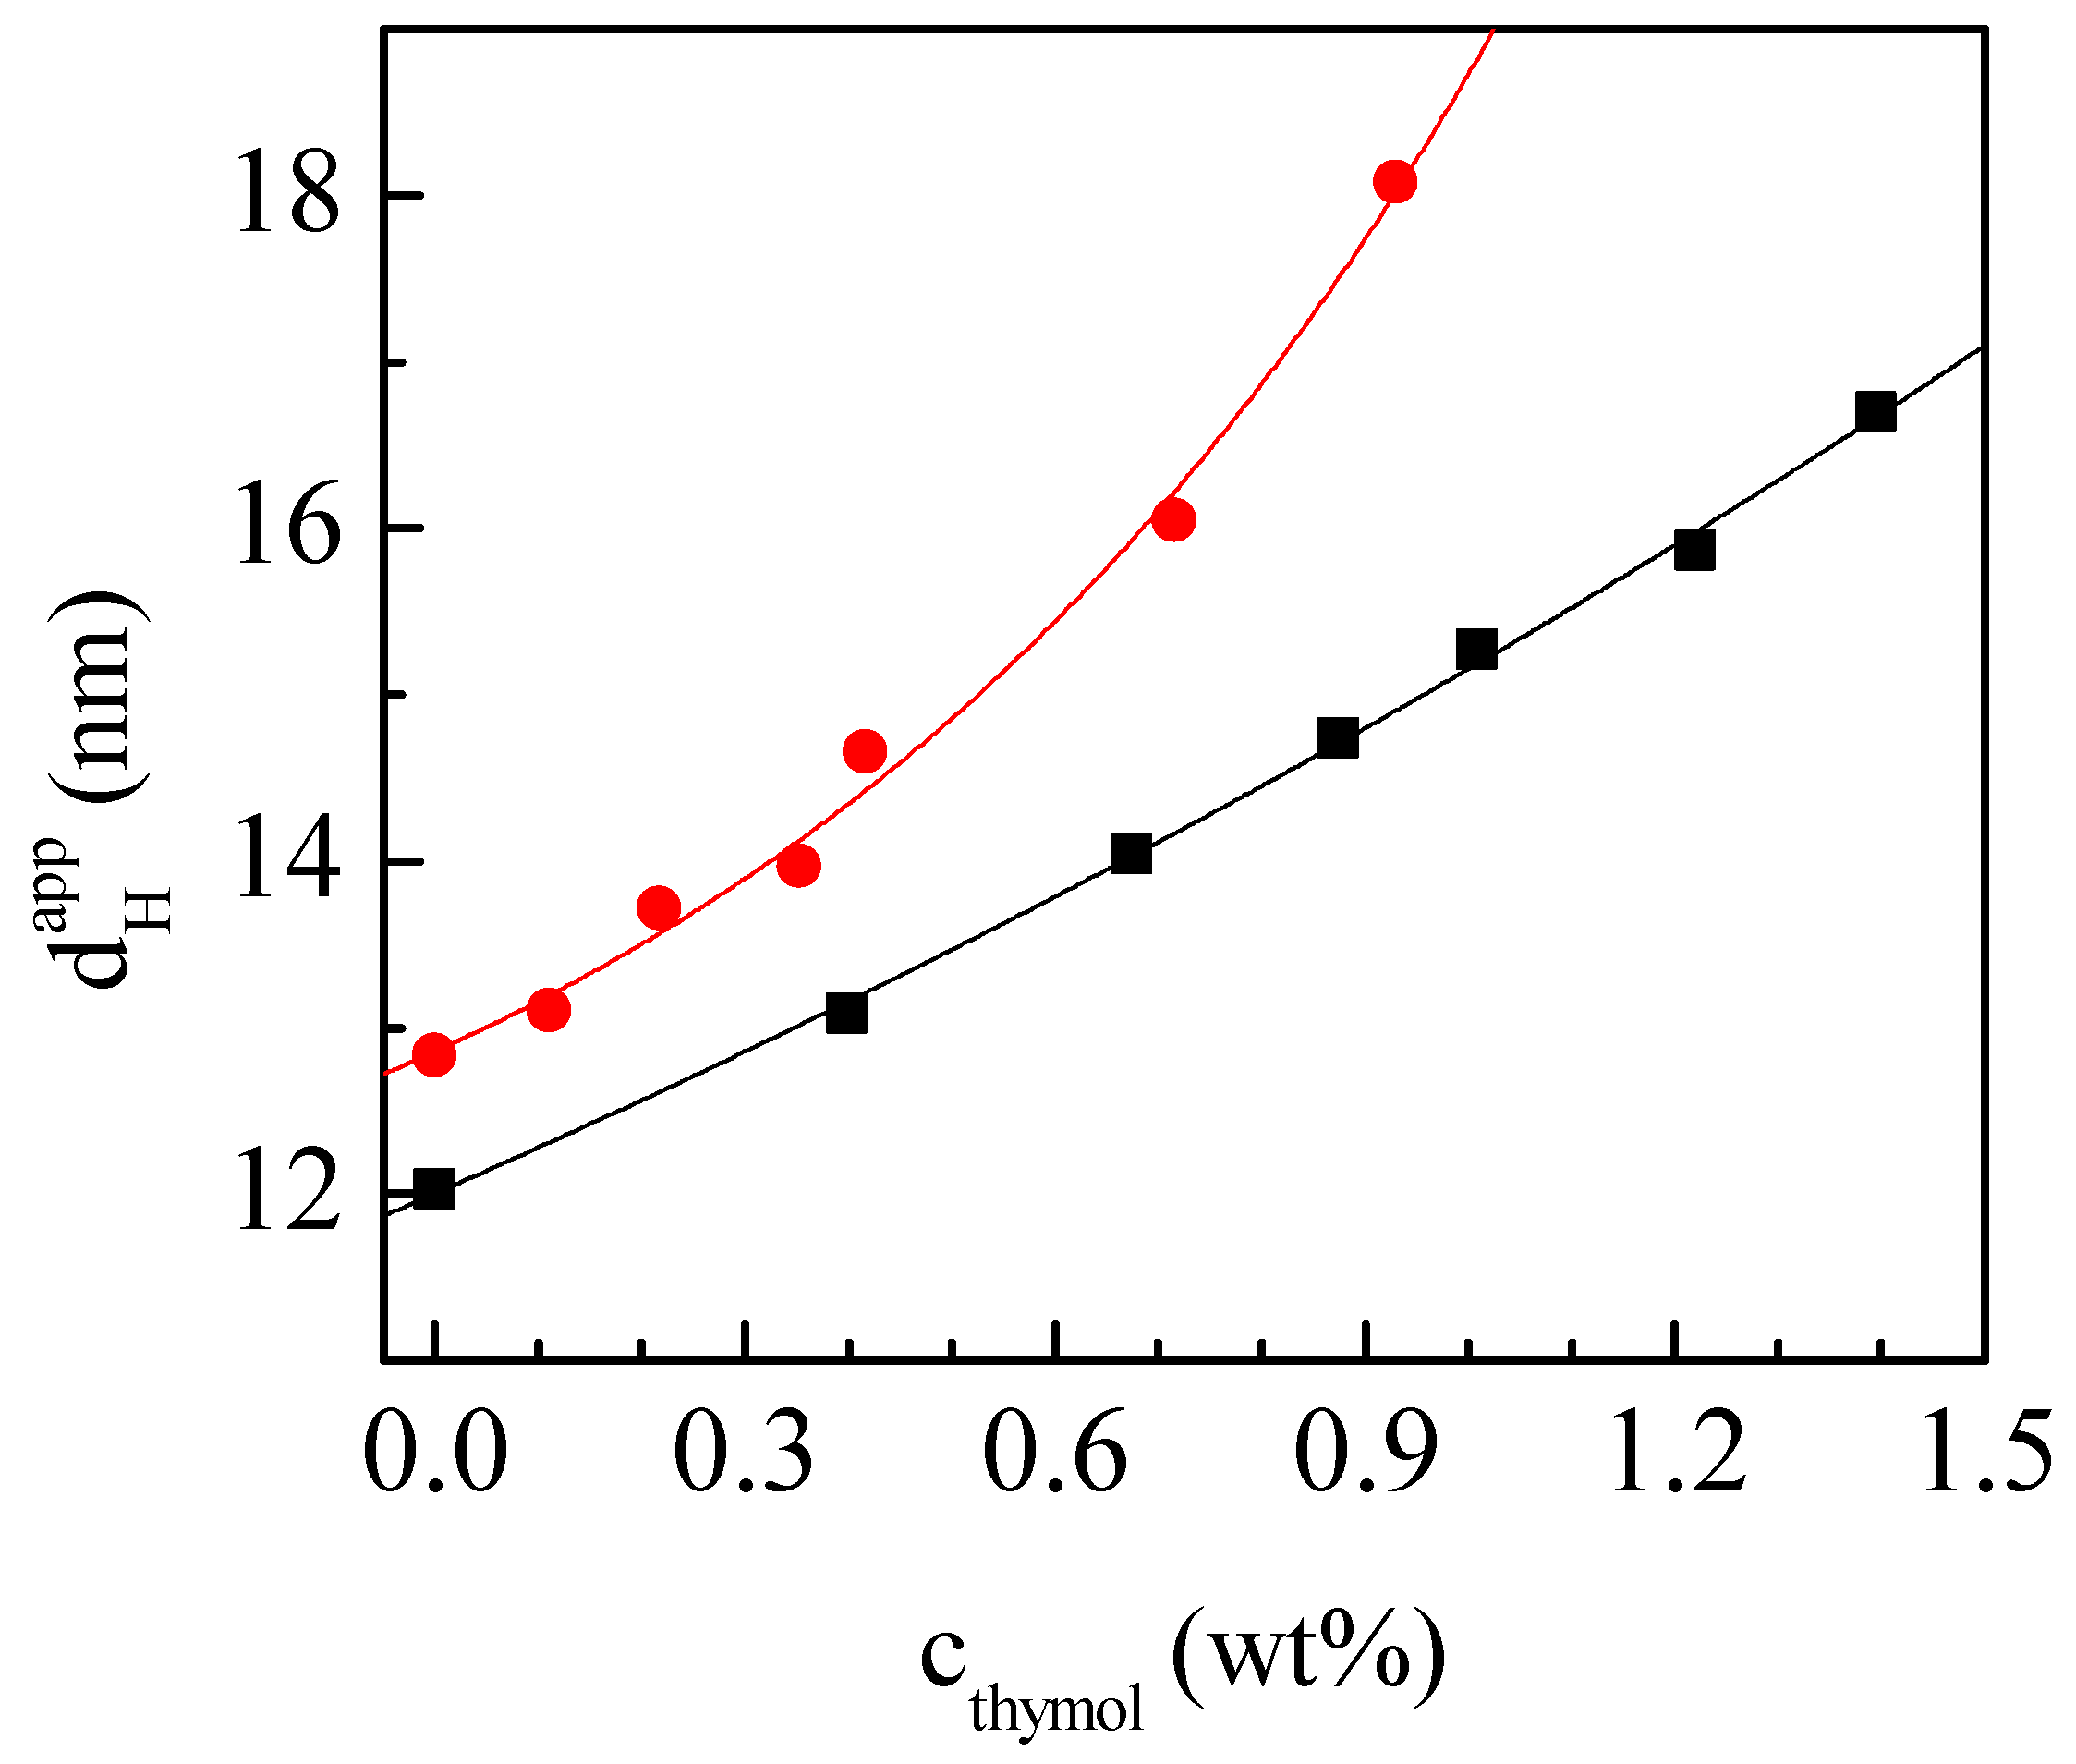
Figure 6.
(a) Emission spectra after excitation at 280 nm of a solution of thymol in oleic acid (black spectrum) and of thymol solubilized in an o/w microemulsion (red spectrum) with a fixed oil content (3 wt%), a cs = 30 wt% and an APG:SL ratio of 8:1. The thymol concentration in both cases is 0.68 wt%. (b) Deconvoluted emission spectrum for the solution of thymol shown in panel a. The profiles of the band obtained from the deconvolution of the spectrum are shown in red, and the profile corresponding to the calculated spectrum from the deconvolution is shown in blue. (c) Deconvoluted emission spectrum for the microemulsion with solubilized thymol of panel a. The profiles of the band obtained from the deconvolution of the spectrum are shown in red, and the profile corresponding to the calculated spectrum from the deconvolution is shown in blue.
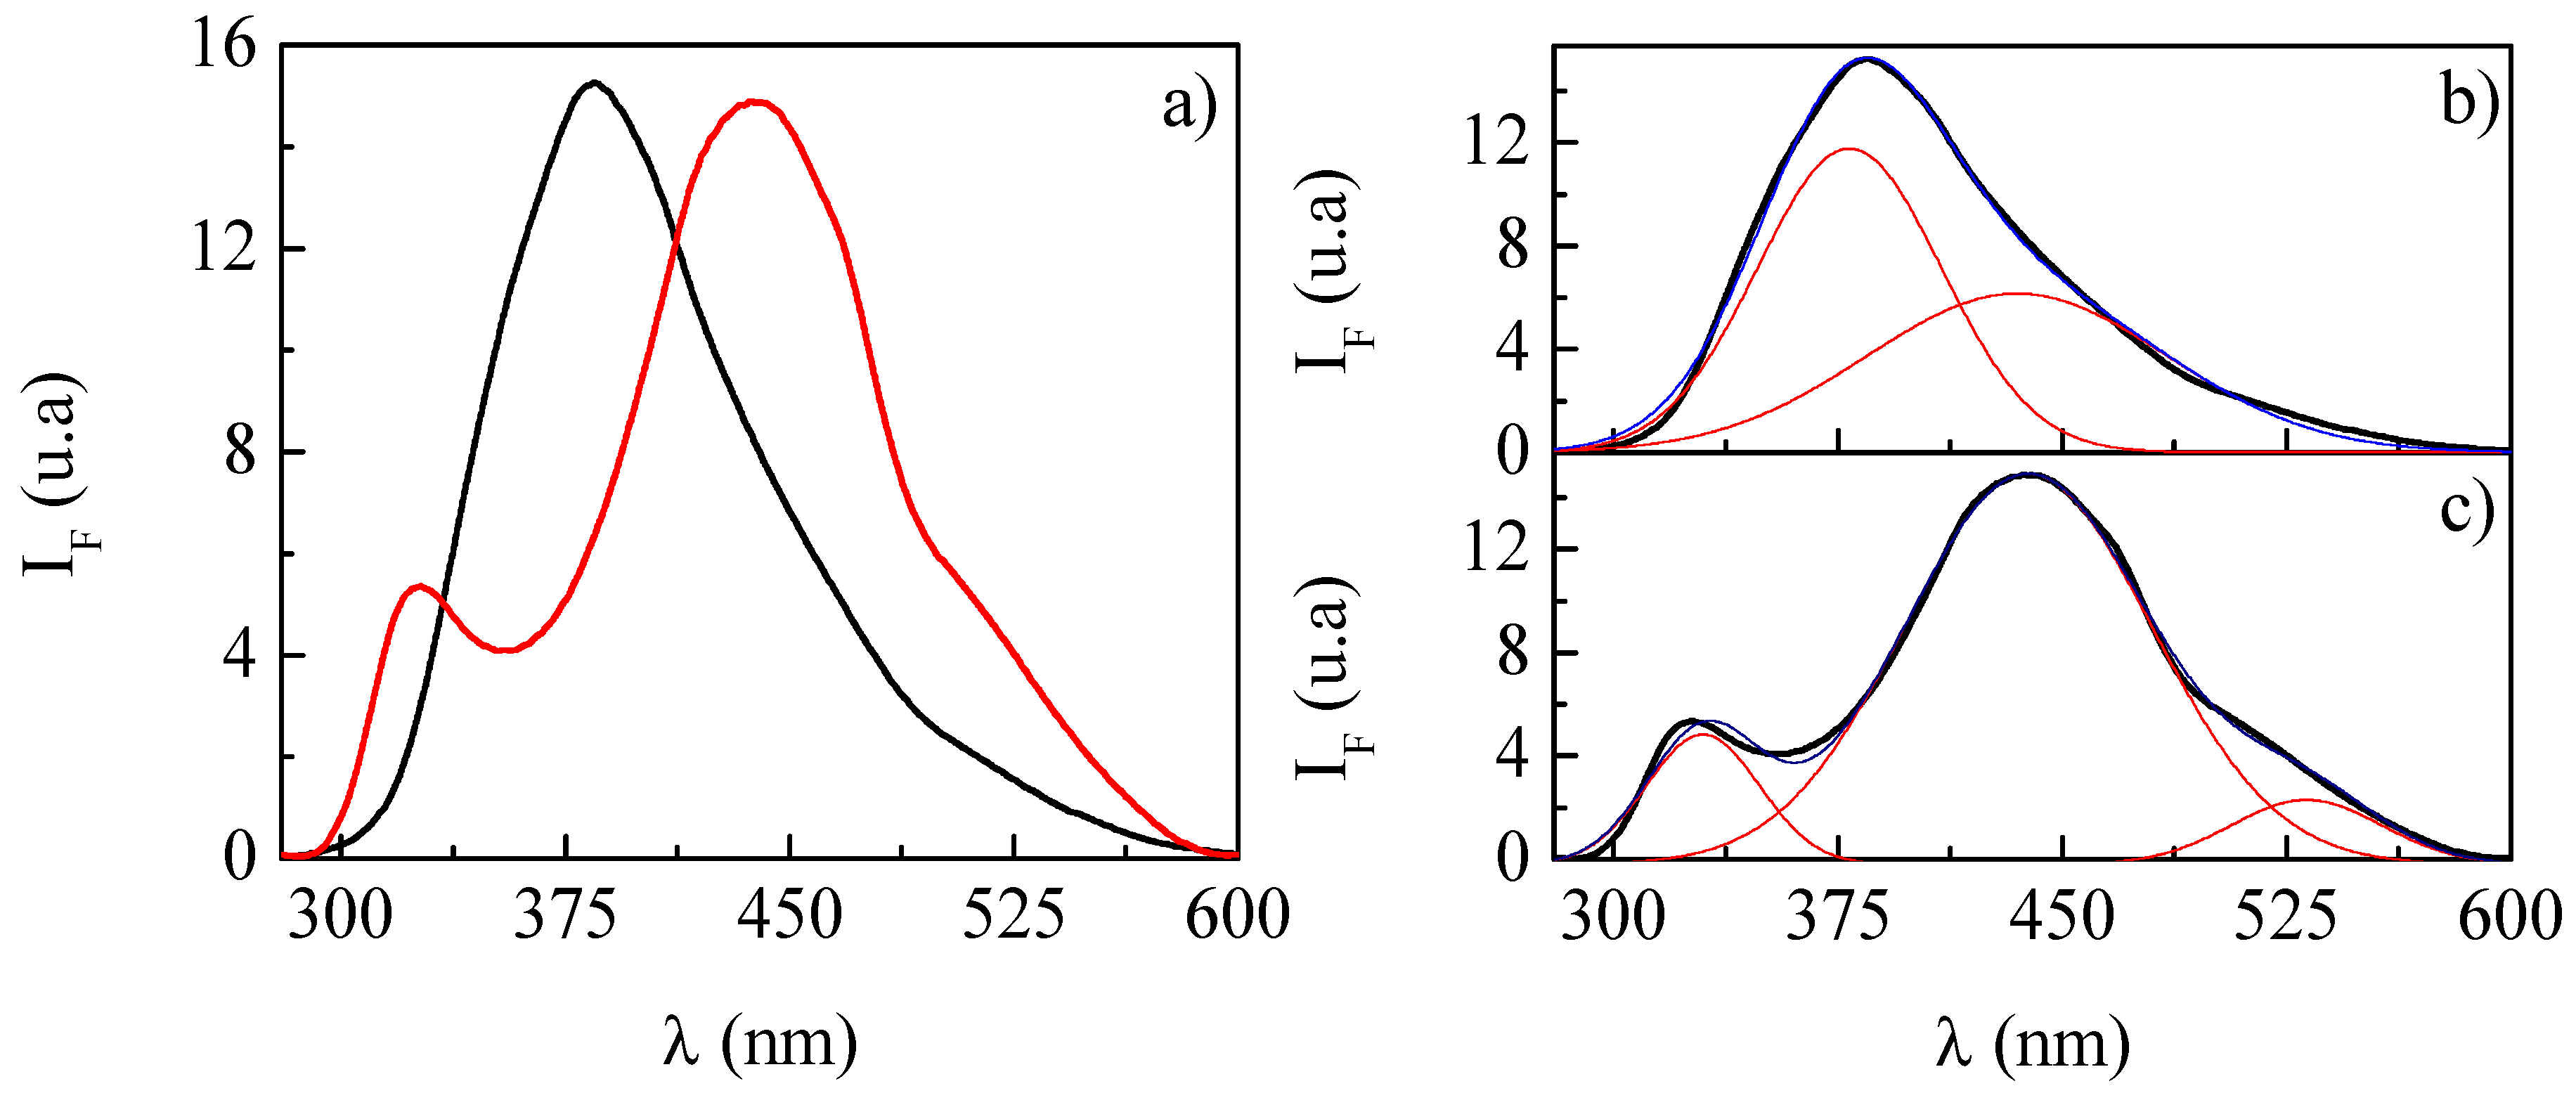
Figure 7.
Emission spectra after excitation at 280 nm for o/w microemulsions with different amounts of solubilized thymol and fixed oil content (3 wt%), cs (30 wt%) and APG:SL ratio (8:1).
Figure 7.
Emission spectra after excitation at 280 nm for o/w microemulsions with different amounts of solubilized thymol and fixed oil content (3 wt%), cs (30 wt%) and APG:SL ratio (8:1).
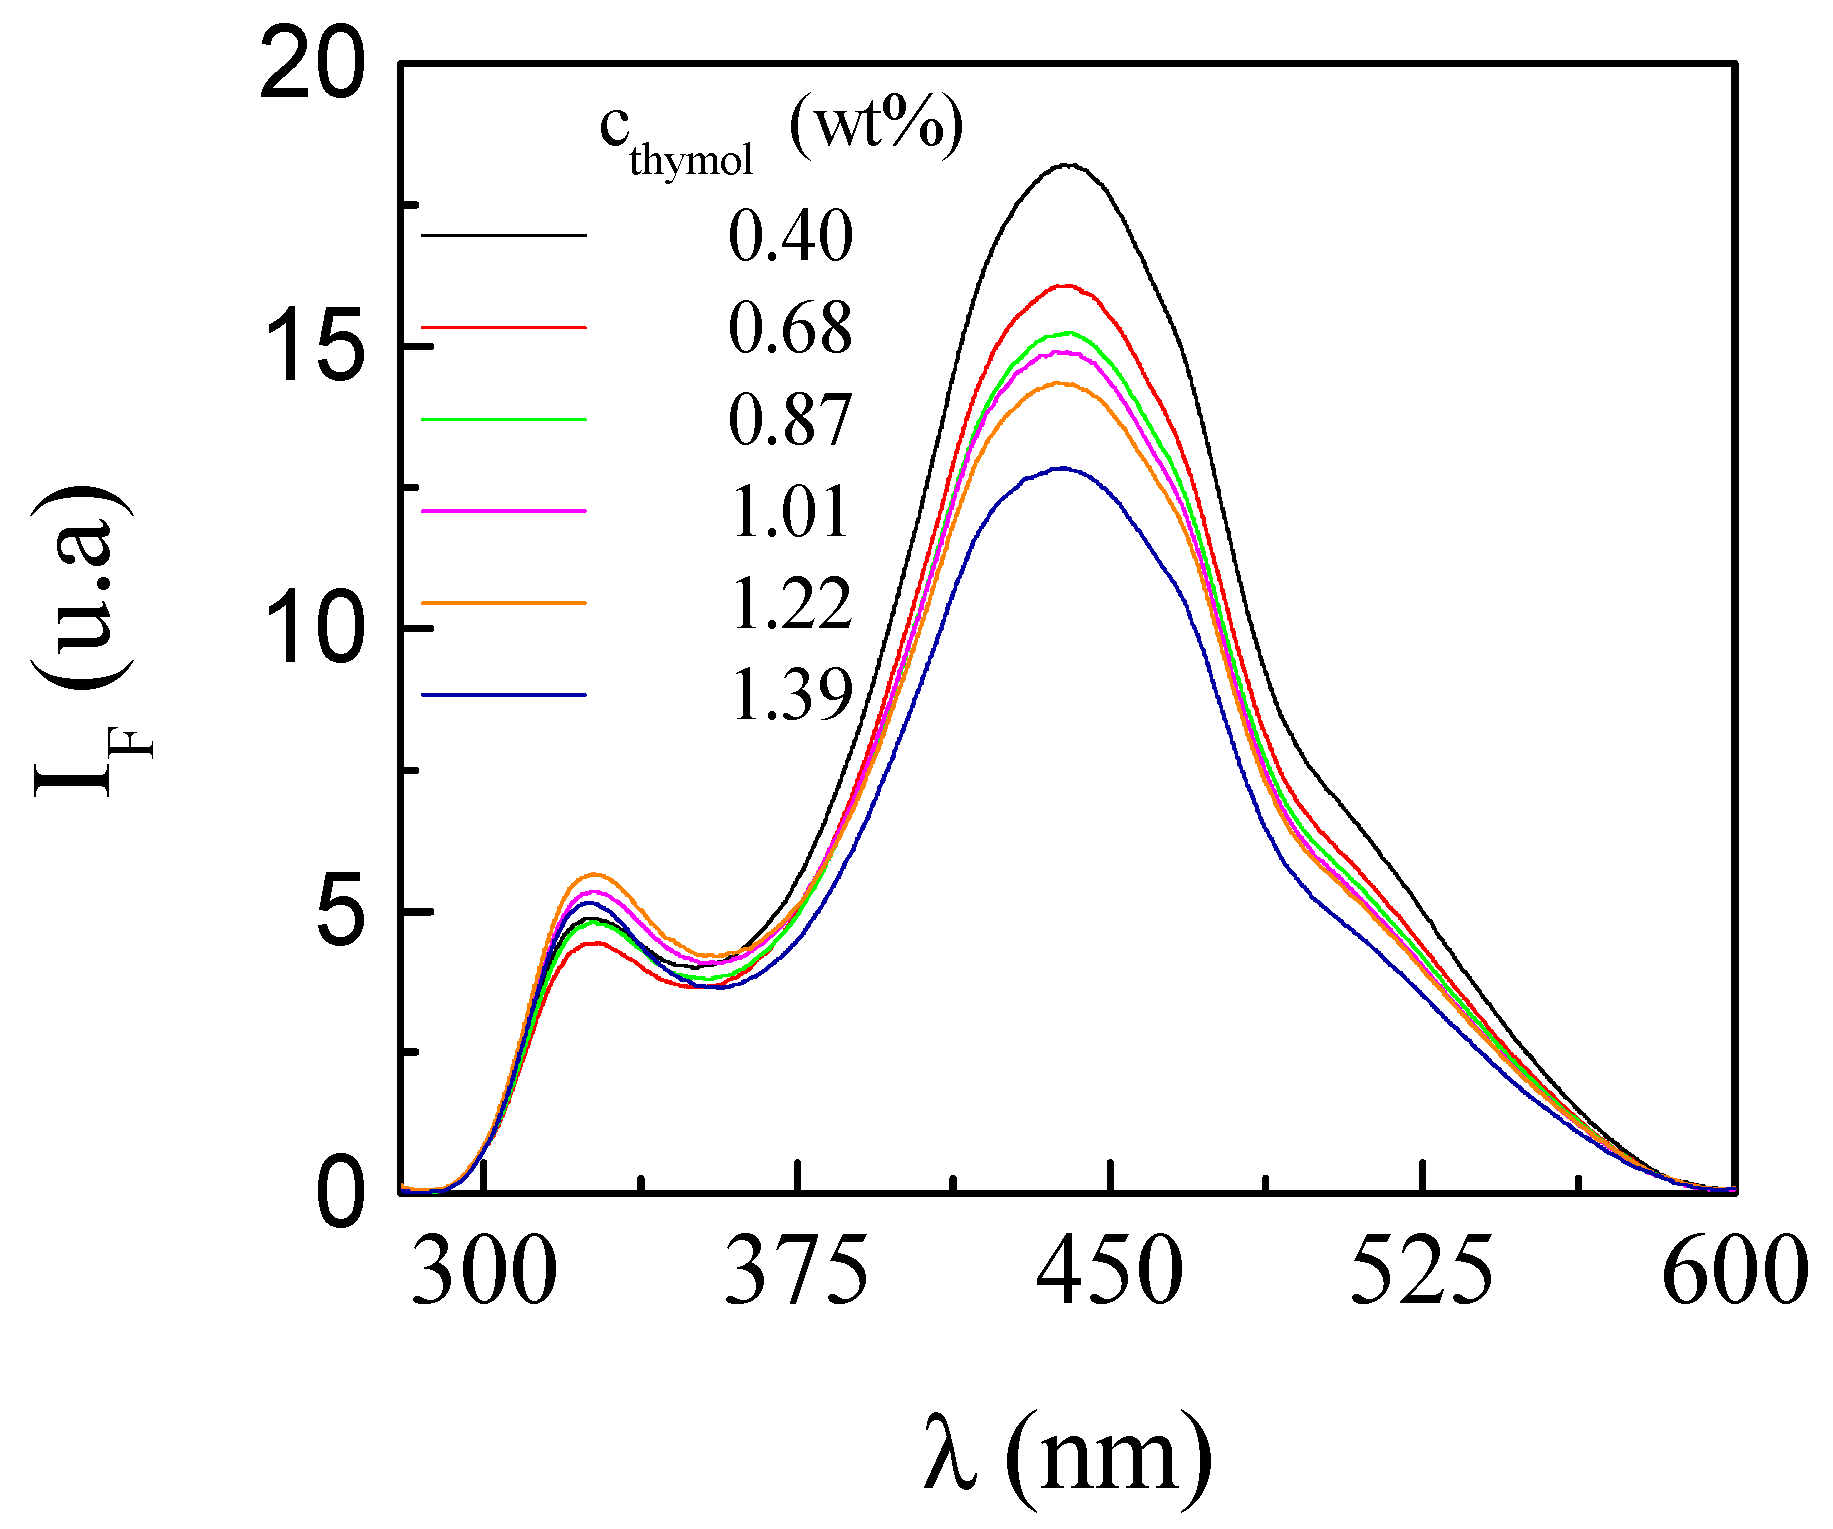
Figure 8.
Dependence on the amount of solubilized thymol of the ratio of the intensities corresponding to the emission maxima of the bands at 437 and 530 nm in relation to the intensity of the band at 325 nm, IF437/IF325 and IF530/IF325 for microemulsions with an 8:1 APG:SL ratio and different cs: 25 wt% (● and o) and 30 wt% (■ and □). Solid symbols represent the values of IF437/IF325 and open symbols represents the values of IF530/IF325. Results correspond to microemulsions with a fixed oil content (3 wt%).

Table 1.
Maximal amount of solubilized thymol (ϕ) as a function of the cs for microemulsions with 8:1 APG:SL ratio used as a solubilization platform. Notice that the results correspond to microemulsions with a fixed oil content (3 wt%).
Table 1.
Maximal amount of solubilized thymol (ϕ) as a function of the cs for microemulsions with 8:1 APG:SL ratio used as a solubilization platform. Notice that the results correspond to microemulsions with a fixed oil content (3 wt%).
| cs/wt% | APG:SL Ratio | ϕ/wt% |
|---|---|---|
| 18 | 8:1 | 0.0 |
| 25 | 8:1 | 0.9 |
| 30 | 8:1 | 1.4 |
© 2019 by the authors. Licensee MDPI, Basel, Switzerland. This article is an open access article distributed under the terms and conditions of the Creative Commons Attribution (CC BY) license (http://creativecommons.org/licenses/by/4.0/).
Share and Cite
MDPI and ACS Style
Fernández-Peña, L.; Gutiérrez-Muro, S.; Guzmán, E.; Lucia, A.; Ortega, F.; G. Rubio, R. Oil-In-Water Microemulsions for Thymol Solubilization. Colloids Interfaces 2019, 3, 64. https://doi.org/10.3390/colloids3040064
AMA Style
Fernández-Peña L, Gutiérrez-Muro S, Guzmán E, Lucia A, Ortega F, G. Rubio R. Oil-In-Water Microemulsions for Thymol Solubilization. Colloids and Interfaces. 2019; 3(4):64. https://doi.org/10.3390/colloids3040064
Chicago/Turabian StyleFernández-Peña, Laura, Sonia Gutiérrez-Muro, Eduardo Guzmán, Alejandro Lucia, Francisco Ortega, and Ramón G. Rubio. 2019. "Oil-In-Water Microemulsions for Thymol Solubilization" Colloids and Interfaces 3, no. 4: 64. https://doi.org/10.3390/colloids3040064