Article

Investigation of Stability of CO2 Microbubbles—Colloidal Gas Aphrons for Enhanced Oil Recovery Using Definitive Screening Design

1
Department of Earth Resources Engineering, Faculty of Engineering, Kyushu University, Fukuoka 819-0395, Japan
2
Faculty of Geology and Petroleum Engineering, Ho Chi Minh City University of Technology, VNU-HCMC, Ho Chi Minh City 70000, Vietnam
*
Author to whom correspondence should be addressed.
Colloids Interfaces 2020, 4(2), 26; https://doi.org/10.3390/colloids4020026
Submission received: 14 May 2020 / Revised: 17 June 2020 / Accepted: 18 June 2020 / Published: 22 June 2020

Abstract

:
CO2 microbubbles have recently been used in enhanced oil recovery for blocking the high permeability zone in heterogeneous reservoirs. Microbubbles are colloidal gas aphrons stabilized by thick shells of polymer and surfactant. The stability of CO2 microbubbles plays an important role in improving the performance of enhanced oil recovery. In this study, a new class of design of experiment (DOE)—definitive screening design (DSD) was employed to investigate the effect of five quantitative parameters: xanthan gum polymer concentration, sodium dodecyl sulfate surfactant concentration, salinity, stirring time, and stirring rate. This is a three-level design that required only 11 experimental runs. The results suggest that DSD successfully evaluated how various parameters contribute to CO2 microbubble stability. The definitive screening design revealed a polynomial regression model has ability to estimate the main effect factor, two-factor interactions and pure-quadratic effect of factors with high determination coefficients for its smaller number of experiments compared to traditional design of experiment approach. The experimental results showed that the stability depend primarily on xanthan gum polymer concentration. It was also found that the stability of CO2 microbubbles increases at a higher sodium dodecyl sulfate surfactant concentration and stirring rate, but decreases with increasing salinity. In addition, several interactions are presented to be significant including the polymer–salinity interaction, surfactant–salinity interaction and stirring rate–salinity interaction.

1. Introduction

Carbon dioxide (CO2)-enhanced oil recovery (EOR) is widely considered to be a useful method in the oil and gas industry because it could increase oil production and slow down greenhouse gas emissions [1]. Numerous studies have recognized the advantages of CO2 injection for EOR and geological sequestration [2,3]. Typically, the dissolution of CO2 into the remaining oil can improve the oil recovery from the reservoir because of either oil viscosity reduction or interfacial reduction. The substance of CO2 dissolution led to experimental and numerical analyses of this mechanism [4,5,6]. Nevertheless, the sweep efficiency of CO2 injection could be declined due to reservoir heterogeneity, gravity segregation and high gas mobility [7]. To enhance the function of CO2, injection of water alternating gas, surfactant alternating gas and CO2 foam have been reported as promising methods in the CO2 EOR application [8,9,10,11]. Recently, CO2 microbubbles utilization is found as a potential method for EOR. The unique characteristic of microbubble will be able to be useful in temporary plugging the high-permeability zone, which causes an increase of fluid flow into low-permeability regions during EOR injection. The microbubbles are known as colloidal gas aphrons (CGAs) [12]. They are small bubbles about 10–100 μm in diameter, which are composed of a spherical gaseous core surrounded by stable multi-layer film. The protective film consists of a viscous water layer that overlays and separates the inner surfactant layer from outer surfactant layer. Figure 1 depicts the microbubbles structure and microscopic images. A stable microbubbles structure offers unique properties, such as lower gas diffusivity of gaseous core transfer to bulk fluid, higher stability than conventional foam. There is a considerable amount of literature on successful CGAs employment in oil well drilling operation. Microbubbles have been demonstrated to be able to seal the wall of a bore hole to prevent loss circulation problems [13,14,15,16,17].
Many attempts have been made [18,19,20,21,22] to facilitate a better understanding of microbubble CGA generation and performance. Amiri and Woodburn proposed that increasing viscosity improves the stability of generated colloidal gas aphron. In the experimental investigation into the stability of CGAs, Save and Pangakar [23] show that higher viscosity of fluid is able to reduce the rate of drainage, which leads to enhanced half-life time of CGAs. Jauregi and co-workers [24] reported on the effect of controlling parameters on the CGAs stability and concluded that stability is proportional with surfactant concentration while inversely proportional to salinity. In [13] the authors proposed that xanthan gum (XG) polymer is the most effective stabilizer of CGAs. Tabzaer [25] reported on analyzing the stability of CGAs under different types of surfactant and polymer, and concluded that a mixture of XG polymer and SDS surfactant greatly enhanced the stability of CGAs. Seyed and co-workers [26] investigated the stability, bubble size distribution, rheological and filtration properties of CGAs fluids. The results show that the type of polymer is the most effective parameter while the type of surfactant has a minor effect on the stability of CGA drilling fluid and increasing salinity in fluid causes a reduction in the stability. Several studies, for example [27,28], have been carried out modeling works on aphrons. Ali Alizadeh and Ehsan Khamehchi [29] developed a mathematical model for transportation of aphrons in porous medium using the filtration theory. Bjorndalen [30] reported on blocking ability of microbubbles when they were injected into porous media.
Furthermore, an increasing number of studies have found that CGA microbubbles improve oil recovery. Shi [31] highlighted an increase of 26.8% oil recovery by microbubble injection in tertiary conditions. Experiments on microbubbles under secondary recovery core flooding in 2015 by Akai [32] proposed an increase of 13% of oil recovery compared with normal CO2 injection. In [33], the authors studied the blocking ability of CO2 microbubble CGAs in heterogeneous porous media. The results show an addition of 74.65% of oil recovery from low-permeability during the CO2 microbubble injection. There were also studies on characterizations and flow behavior of CO2 microbubble. In his analysis, Telmadarreie [34] shows that microbubbles had favorable infectivity in heterogeneous reservoirs to enhance heavy oil recovery. Ghosh [35] reported on stability and viscosity of CO2 microbubble and concluded that a mixture of 0.29 wt.% Surfonic N-85 surfactant and 0.55 wt.% of XG polymer had formed a proper base fluid for microbubble generation.
In the past, researchers employed the one-variable-at-a-time method, where one variable was varied at a time, and all other variables in the experiment were fixed. This approach not only requires larger quantities of resources and more time but also neglected the effect of interaction between variables. Design of experiment (DOE) is a statistical method that evaluates simultaneously the effect of multiple variables with a reduction in the number of tests. The experimental design approach is attracting widespread interest in the petroleum field. Many studies in recent years have focused on applying experimental design to either experimental or numerical study on operational parameters affecting EOR process. Despite this interest, there is still limited research using DOE to study CGAs’ properties. In previous work, Jauregi and co-workers [24] developed a statistical experimental design to investigate the effect of different factors on the stability and gas hold-up of CGAs. In [26], the authors employed Taguchi DOE approach to analyze the influence of salinity, polymer and surfactant types and concentration on the stability of water-based CGA fluid.
Recently, a new class of three-level DOE, definitive screening design (DSD), was proposed by Jones and Nachtsheim (2011) [36]. This approach produces the experimental design, which not only evaluates the main effects, two-factor interactions and pure-quadratic effects but also significantly reduces the number of trial experiments needed compare to conventional DOE methods [37,38].
In this work, the influences of xanthan gum polymer concentration, sodium dodecylsulfate surfactant concentration, salinity, stirring time and stirring rate on stability of CO2 microbubble CGAs were investigated statistically using DSD experimental design approach. After statistical analysis of the observation data, a half-life time of CO2 microbubble dispersion was used as a response for the mathematical model of experimental design. This paper is organized as follows into four sections. The first section gives a brief overview of CO2 microbubble CGAs and DSD approach. The second section describes the materials and methods. In the third section, the results are presented and discussed. Our conclusions are drawn in the final section.

2. Materials and Methods

2.1. Materials

In this work, xanthan gum (XG) biopolymer, sodium dodecyl sulfate (SDS) anionic surfactant and sodium chloride (NaCl) were supplied by Junsei Chemical Co. Ltd., Tokyo, Japan. XG polymer was utilized as stabilizer and viscosifier for CO2 microbubble. The SDS surfactant was used to reduce the interfacial tension of gas/liquid. The percentage of purity of CO2 was 99.9%. Tap water was used for preparation of base fluid.

2.2. Definitive Screening Design

According to the general principle of CGAs generation along with previous studies, five continuous factors including polymer concentration, surfactant concentration, salinity, stirring time and stirring rate were selected as the key factors affecting the stability of CO2 microbubble dispersion [24,26,39]. In a definitive screening design, a minimum of 11 experiments are required for 5 investigated factors and their respective three levels (low, center and high being coded as −1, 0, 1, respectively) to discover a nonlinear effect [36]. According to present experiments, the range and levels (coded and uncoded) of independent factors are shown in Table 1. To detect a nonlinear effect of these five independent variables on CO2 microbubble dispersion stability, a second-order polynomial model is proposed:
Y = β 0 + i = 1 5 β i X i i = 1 5 β i i X i 2 + 1 i j 5 β i j X i X j
where Y represents the predicted response, β 0 is the model intercept, β i is the linear effect coefficient, β i i is the quadratic effect coefficient and β i j is the first-order interaction coefficient. DSD possibly estimates active main effects, two-factor interaction and quadratic effects [38,40,41]. The design and analysis of experiments were performed with R statistical software by daewr package [42]. Table 1 shows the factors and levels (coded and uncoded) of independent factors in this study. The experimental array for DSD is shown in Table 2.

2.3. Preparation of Fluid

The base fluids were prepared by mixing XG polymer and SDS surfactant at different concentrations in 250 mL water. To evaluate the effect of salinity, salt solutions were prepared by mixing NaCl with considered concentrations in 250 mL water then polymer and surfactant were added. The GF-300 digital scale (A&D company Ltd., Tokyo, Japan) was used to weigh these chemical powders. All solutions were mixed by using a magnetic stirrer (MS-H280-Pro Model, Dlab Scientific Inc., Riverside, CA, USA) under magnetic stirring speed of 1000 rpm for 1 h.
After that, the mixture was put into 300 mL beaker and CO2 gas was injected into polymer and surfactant solution via a stainless-steel pipe at beaker bottom with a constant flow rate of 10 mL/min. The experiments were carried out at atmospheric pressure and room temperature (25 ± 2 °C). The solution and CO2 gas were mixed by using high-speed homogenizer (HG-200 Hsiangtai Model, As One Corporation, Osaka, Japan) (see Figure 2).

2.4. Stability of CO2 Microbubbles

In order to estimate the effect of different parameters on the stability of CO2 microbubbles, 100 mL of CO2 microbubbles dispersion was poured in a 100 mL graduated cylinder immediately following CO2 microbubbles generation. A stability index of half-life time (t1/2) could be used for evaluating the performance of microbubbles dispersion. Hence, t1/2 is defined as the time required until fifty percent of final drained liquid height was reached [43].

2.5. Visualization of CO2 Microbubbles

An EVOS Core Imaging System Digital Microscope (Life Technology Corp., Carlsbad, CA, USA) was used to record images of CO2 microbubbles. After generation, a CO2 microbubbles sample was collected and placed in a microscopic slide in order to capture images immediately. A microscope setup for visualization of CO2 microbubbles is shown in Figure 3.

3. Results and Discussion

3.1. Characterization of CO2 Microbubbles

The images of CO2 microbubbles were analyzed using ImageJ ver 1.52a (National Institutes of Health, Bethesda, MD, USA) to obtain the size distribution of bubbles. About 200–300 bubbles were chosen randomly for each sample. To analyze the diameter size of CO2 microbubbles, the captured microscopic photographs were stored in digital format. Figure 4a shows a typical image of CO2 microbubbles generated in this study and Figure 4b the edge of microbubble detected by the image analysis software JmageJ ver 1.52a.
These observations are similar to the results reported by Natawijaya, Sugai, and Anggara (2020) [33]. In EOR process, the size of CGAs is highly important to block the high permeability layer [44]; Figure 5 illustrates the diameter distribution of CO2 microbubbles in Experiment No.1. In general, the size of bubbles ranges from about 20 to 260 micron. There is a dominant size of 60–140 micron in this dispersion. Larger aphrons are useful in blocking as well as diverting fluid to the remained oil zone. It causes increased sweep efficiency of the EOR. The average diameters and standard deviation of diameters in 11 experiments are shown in Table 3. All observations exhibit typical bubbles size distributions which are consistent with the findings by [34].

3.2. Data obtained from Stability Test

The generated microbubbles dispersion in the graduated cylinder tends to separate into bubbles cream at the top and the liquid drainage in the bottom of the measuring column after a period of time. The resistance ability of CGAs fluid against liquid drained from CGAs is proposed as the mechanism of stability in CGAs dispersion [45,46]. In this study, we carried out a static stability test to observe the volume of drained liquid until all bubbles drained entirely in the cylinder. Table 4 summarizes the final liquid volumes and the following half-life time t1/2 from 11 experiments.

3.3. Statistical Analysis

Statistical analysis showed the quadratic model for the empirical relationship between the independent variables in coded units and the natural logarithm of stability index (t1/2). The transformation to natural logarithm of the stability index was used for the fitting model. It is difficult to fit untransformed data, but the qualitative relationship between variables and response is the same as for untransformed data [47]. The logarithmic transformation of the experimental data involves a certain amount of variation. The resulting model equation was as follows:
ln(t1/2) = 3.44414 + 1.78542A + 0.53791B − 0.01799C + 0.70282E − 0.62486AC + 0.36633BC + 0.21995CE − 0.27234C2
where A, B, C, and E are the coded factors of polymer concentration, surfactant concentration, salinity concentration and speed of stirring, respectively. In this model, D factor was not included because of a negligible influence on the stability index. This may be due to the stirring time range selected being set in a favorable region with respect to CO2 microbubbles stability. The sign of each coefficient indicated how the factor influences the response. Thus, the negative sign confirms the synergistic effect while the positive sign shows antagonistic effect [48]. Table 5 highlights the estimates of model coefficients and their corresponding statistics such as R2 = 0.9998, adj-R2 = 0.9991, F-value = 1462, p-value = 0.0006837. These results demonstrated that the model was significant due to high F-value and low p-value [49]. The value of R2 determines how many percent of total variance could be explained by the regression model. The R2 and adjusted R2 were close to 1; this indicated a great fit between experimental and predicted values [50]. Figure 6 depicts the scatterplots of experimental versus predicted values to confirm the validation of the model. The high coefficient of correlation (R = 0.99) demonstrates an excellent correlation between observed response and predicted response [51].

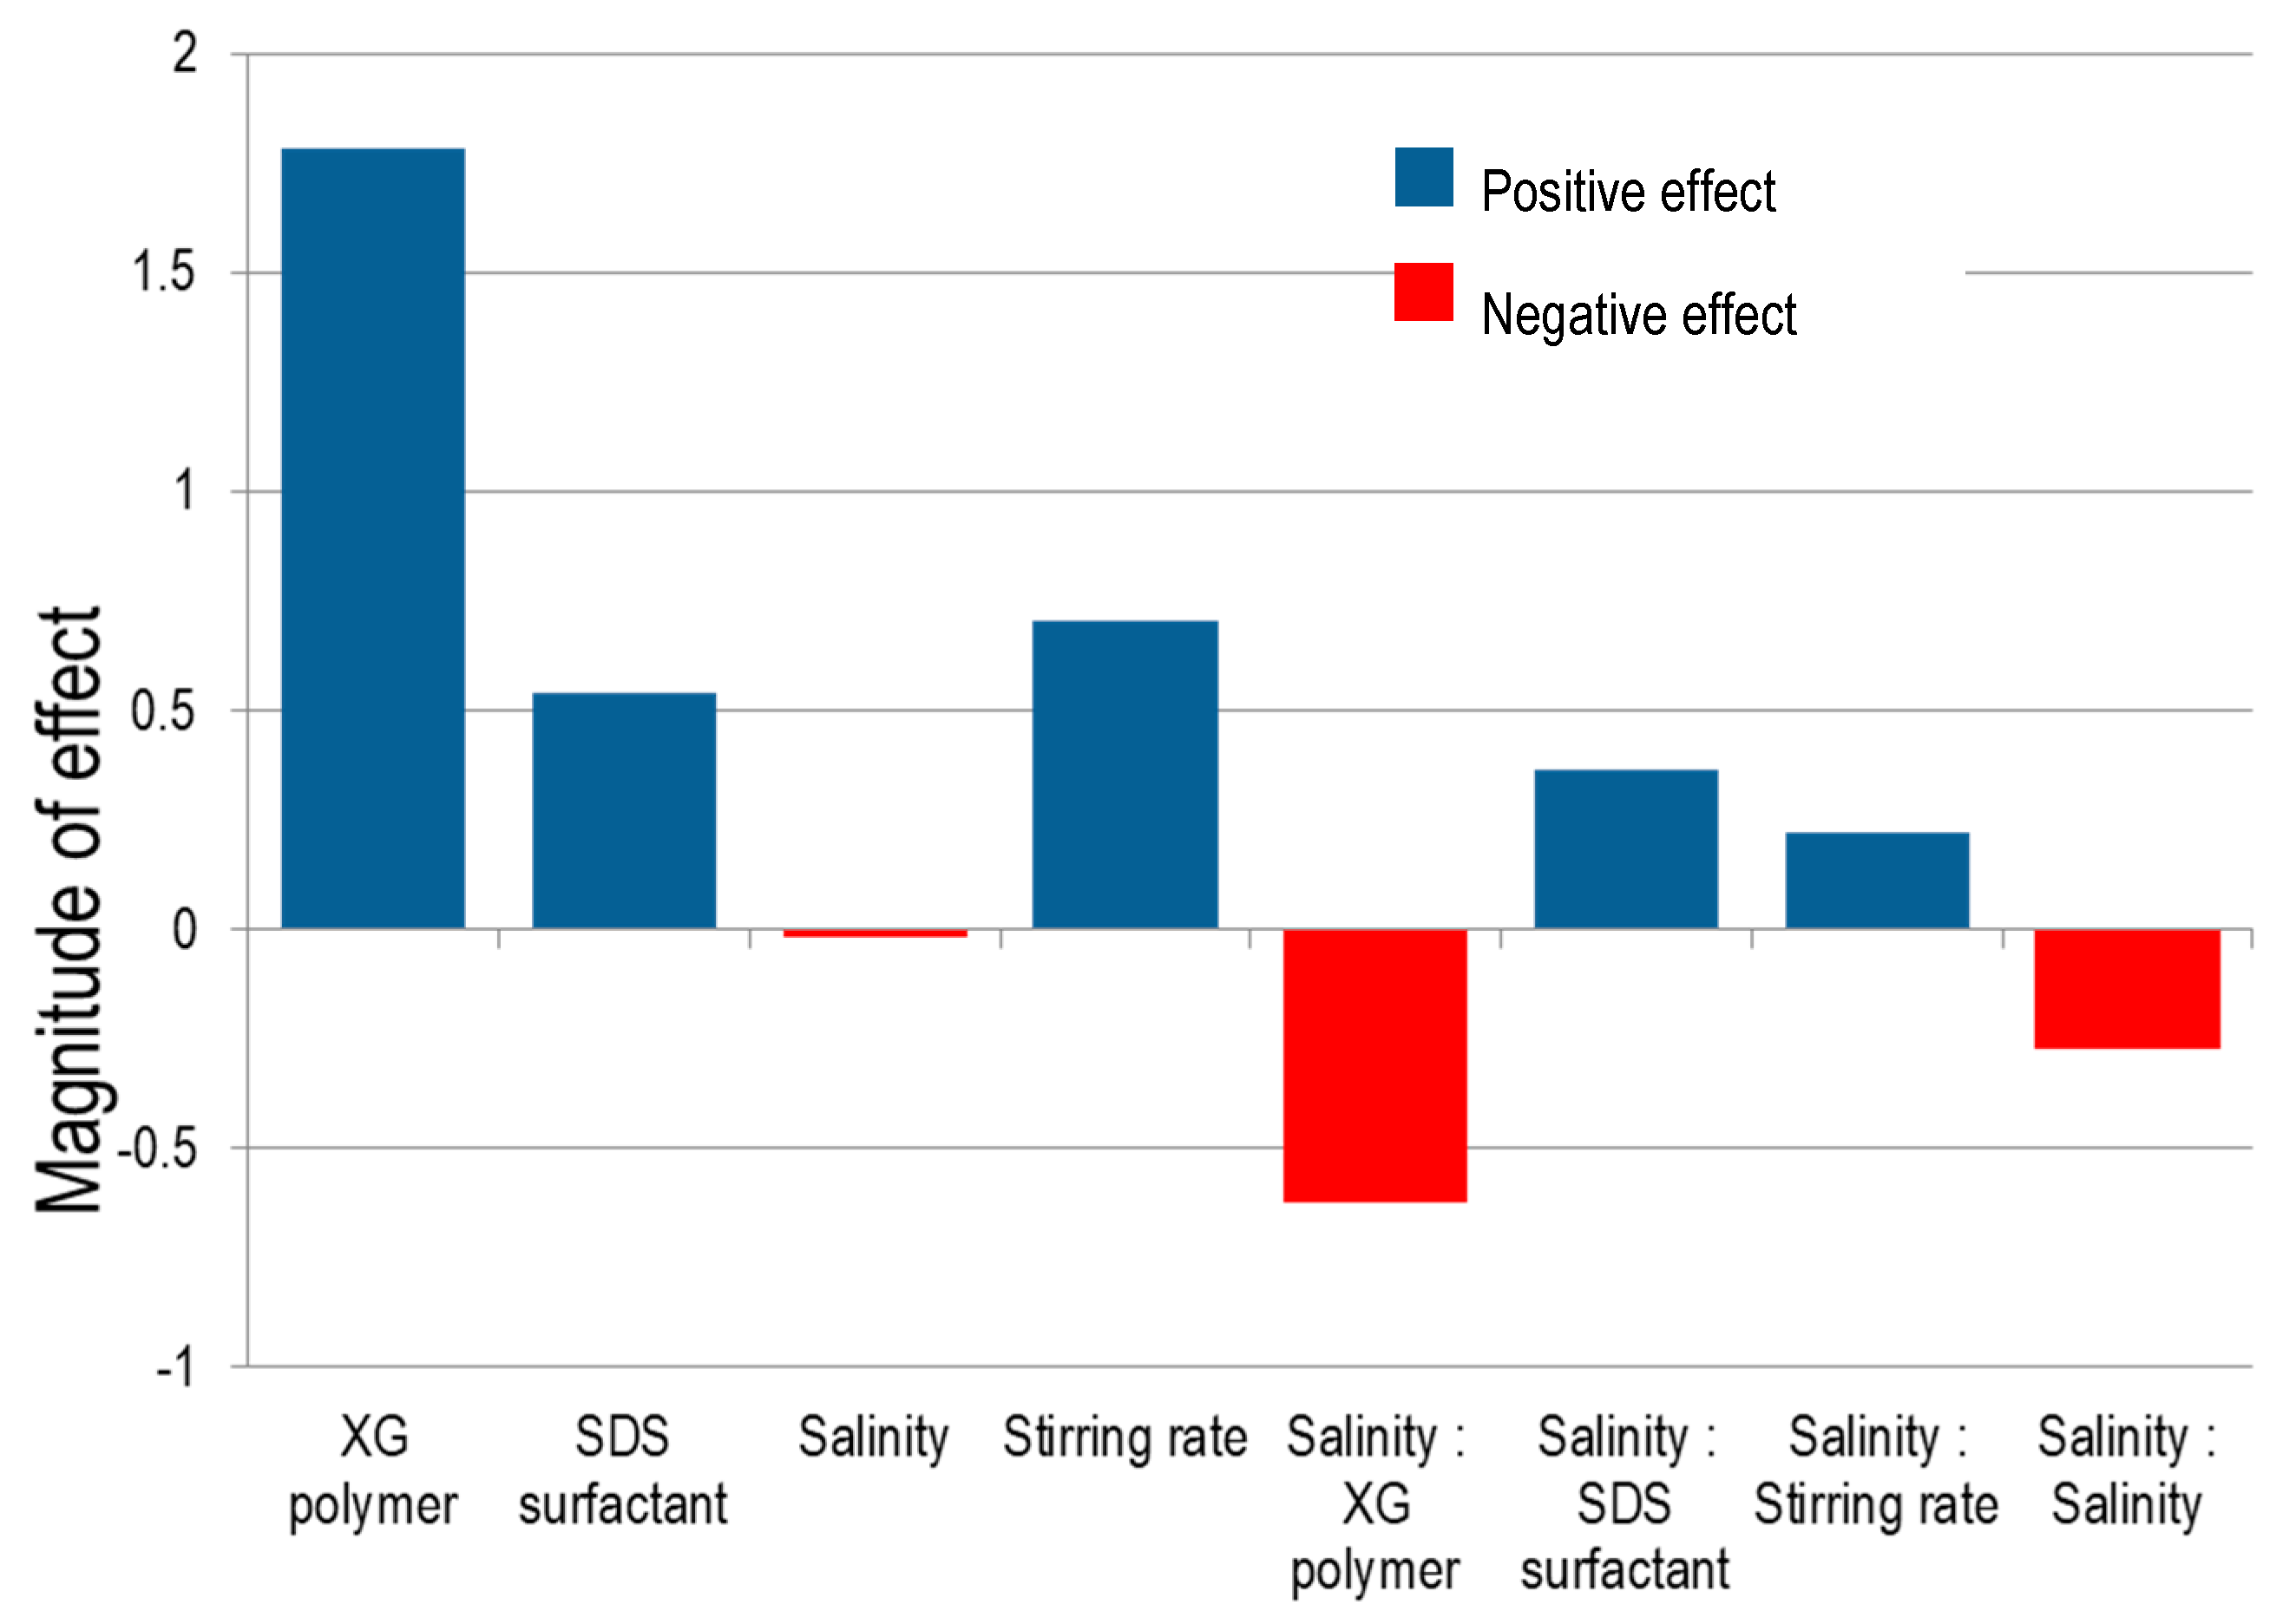
3.4. Effect of Factors on CO2 Microbubbles Dispersion Stability

Figure 7 shows the effect magnitude of factors on response. As can be seen, XG polymer is the dominant contributor to the stability of the dispersion. Since the coefficient of XG polymer concentration has a positive value, an increase in XG polymer concentration from the (−1) level to the (+1) level causes a significant improvement in the stability index. Thus, the stability improvement of XG polymer could be explained by viscosity increase with more polymer molecules in the base fluid. The higher viscosity of base fluid could make the CGA structure more stable. As a result, the ability to prevent gas diffusion from the gaseous core to the bulk fluid is enhanced by a higher viscous layer [44]. In addition, higher viscosity base fluid could delay liquid drainage in CGAs dispersion due to gravity effect [46]. It is apparent that CO2 microbubbles generated with higher XG polymer concentration have greater stability. The experimental results in this study indicated that stirring rate has a positive effect on the stability of CO2 microbubbles dispersion. Thus, in the CGAs generation process, the homogenizer is a vital part forming the aphrons in micron size with a high speed of rotation. It means the microbubbles’ dispersions generated by the high stirring rate were more stable than others that were generated by a low stirring rate. This result is supported by Jauregi, Gilmour, and Varley (1997) [24].
In this study, we conducted the experiments with different concentrations of SDS surfactant varying from 2000 to 3000 ppm. As shown in Figure 6, SDS surfactant was determined to have a significant influence on improving CO2 microbubbles dispersion stability. Thus, increasing the concentration of SDS surfactant led to stabilizing microbubbles because there were more surfactant molecules at microbubble surfaces. Previous studies proposed that the higher concentration of surfactant molecules in solution increases surface viscosity and elasticity [45], consequently improving the mechanical strength of lamellar walls [43].
On the other hand, the salinity was found to be a significant factor that negatively affected the stability index. Generally, increasing NaCl concentration decreases dispersion stability. However, the influence of salinity on CGAs was different depending on other factors. Here, considering both the interactions in the SDS surfactant concentration—salinity and stirring rate—salinity was significant and had a positive value. This means that the function of SDS surfactant and stirring rate could be enhanced in presence of salt in the system. The interaction between XG polymer concentration and salinity produced a significant reduction of the stability index.

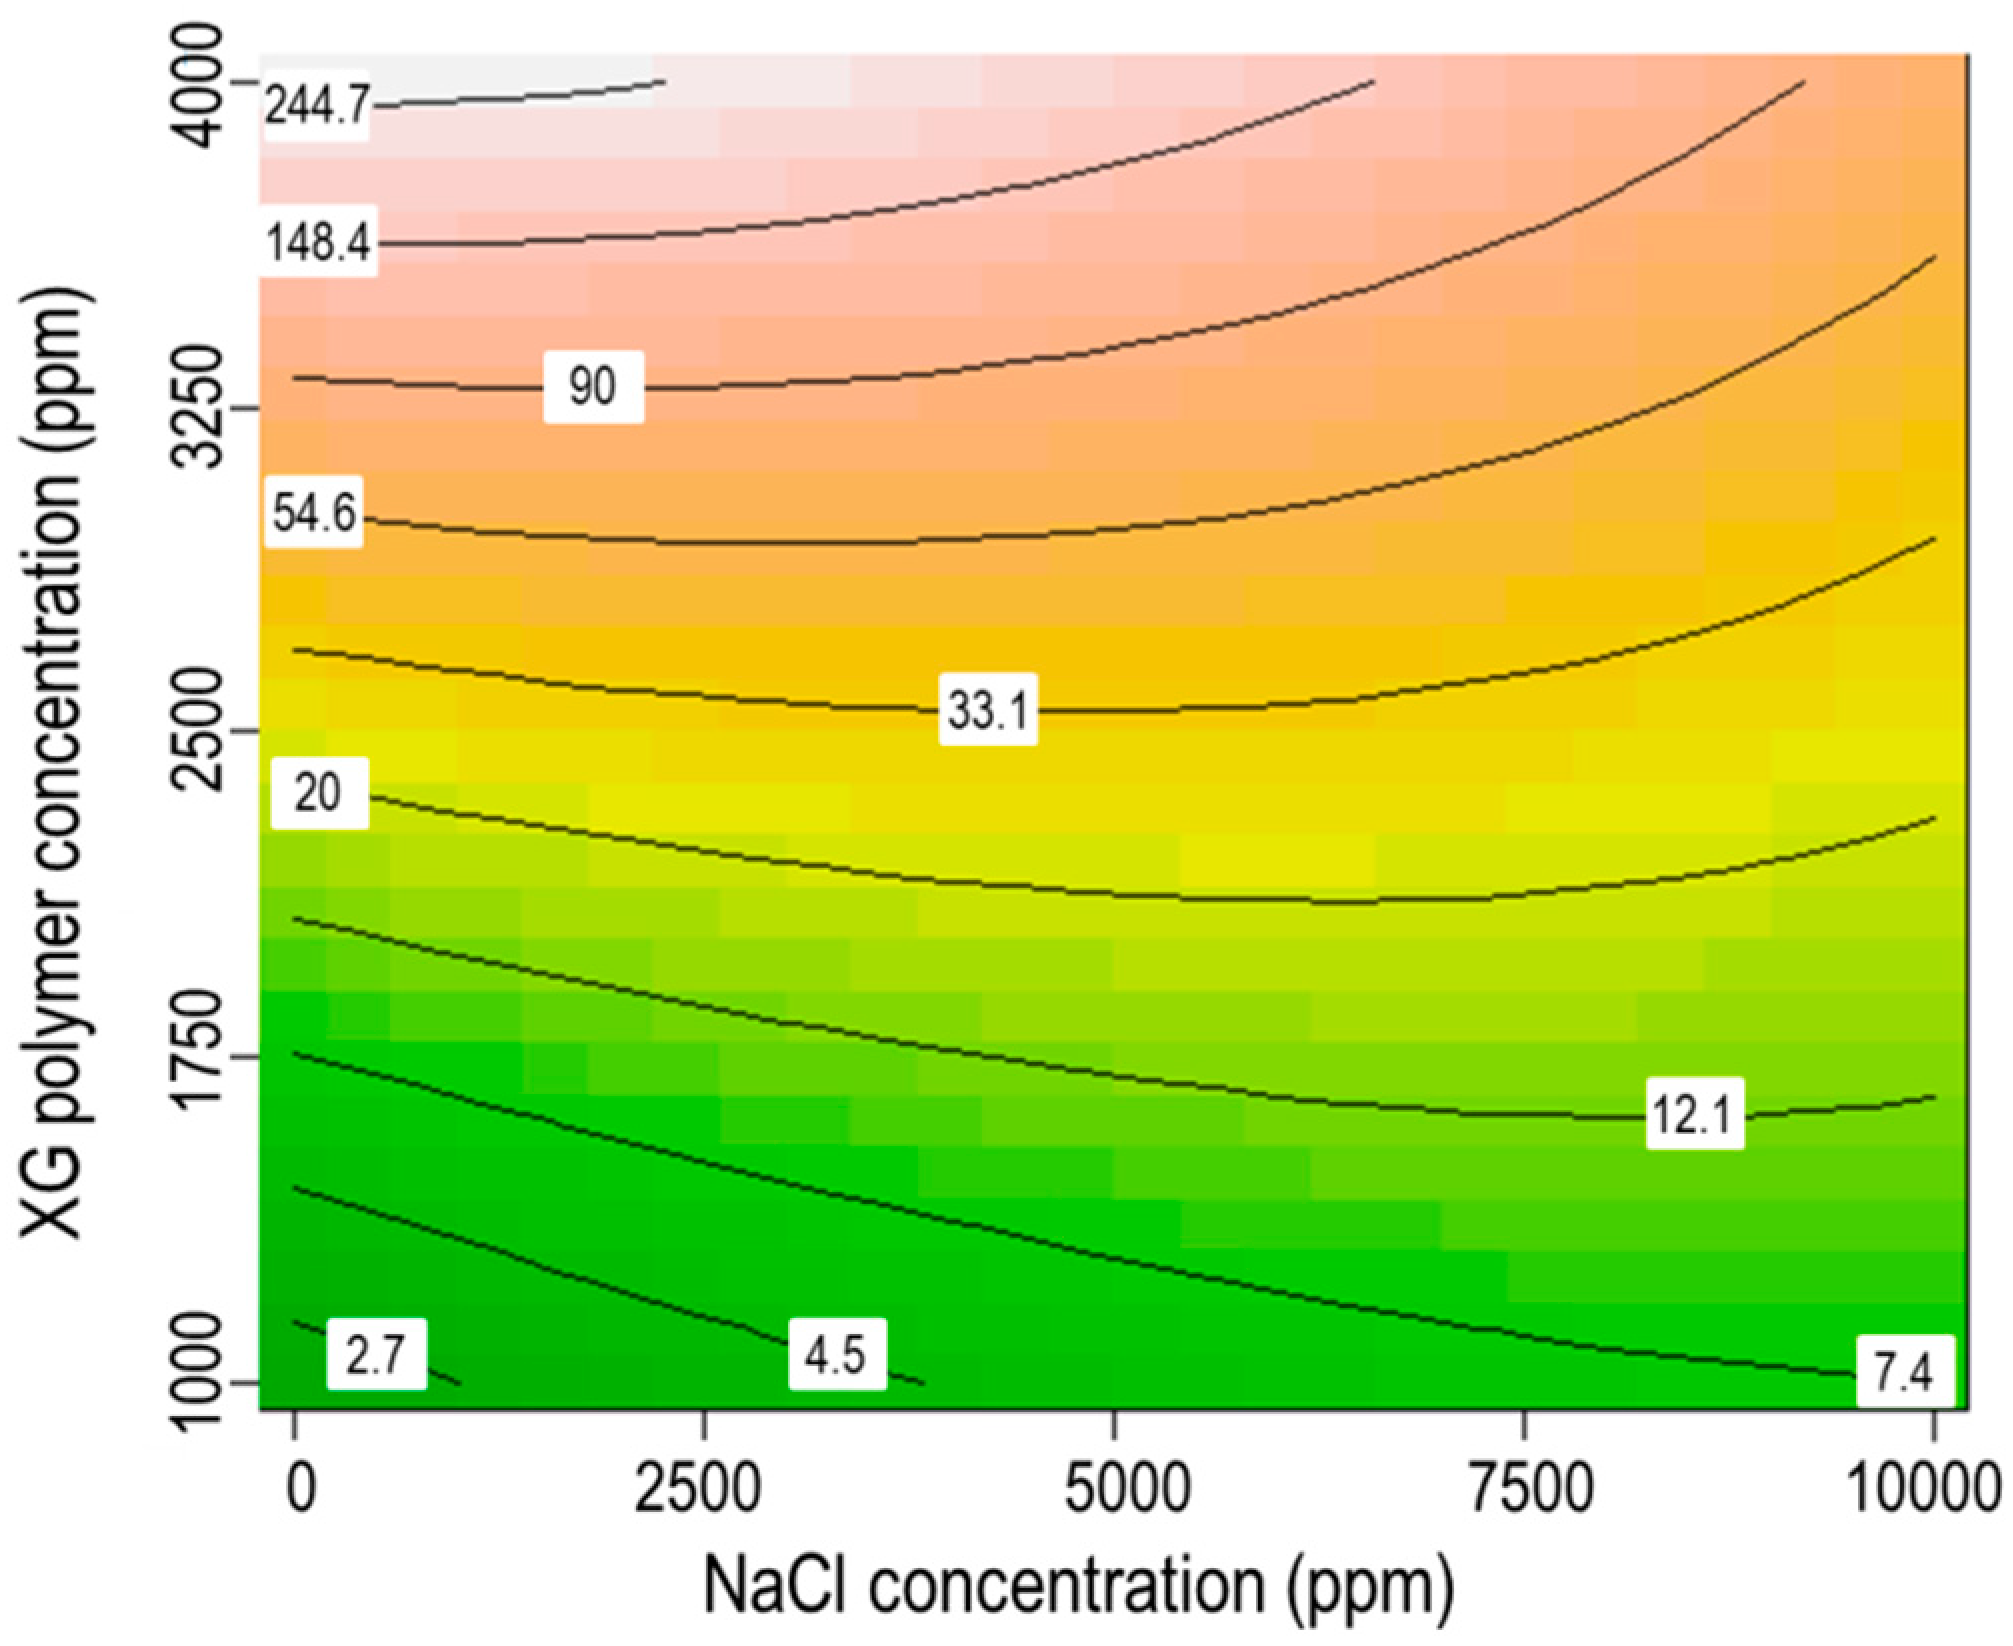
3.5. Interaction between XG Polymer Concentration and Salinity

Figure 8 highlights the relationship between XG polymer concentration and salinity influencing the stability of microbubble dispersion when the SDS surfactant concentration and the stirring rate are kept at their constant neutral values. At the low concentration of XG polymer concentration, salinity has little effect on the stability of CO2 microbubbles, but as XG polymer concentration increases, the impact of salinity also increases. Hence, the highest stability is obtained at XG polymer concentration = 4000 ppm and NaCl concentration = 0 ppm. Regarding the NaCl added in solution, there is a reduction in the half-life time of CO2 microbubbles dispersions. It could be explained by at least two main reasons: reduction in viscous shell thickness of microbubbles since electrical double layers are compressed in the presence of NaCl [26]; and also increasing NaCl concentration leads to a decreased ability of the XG polymer to build up the viscosity [52].

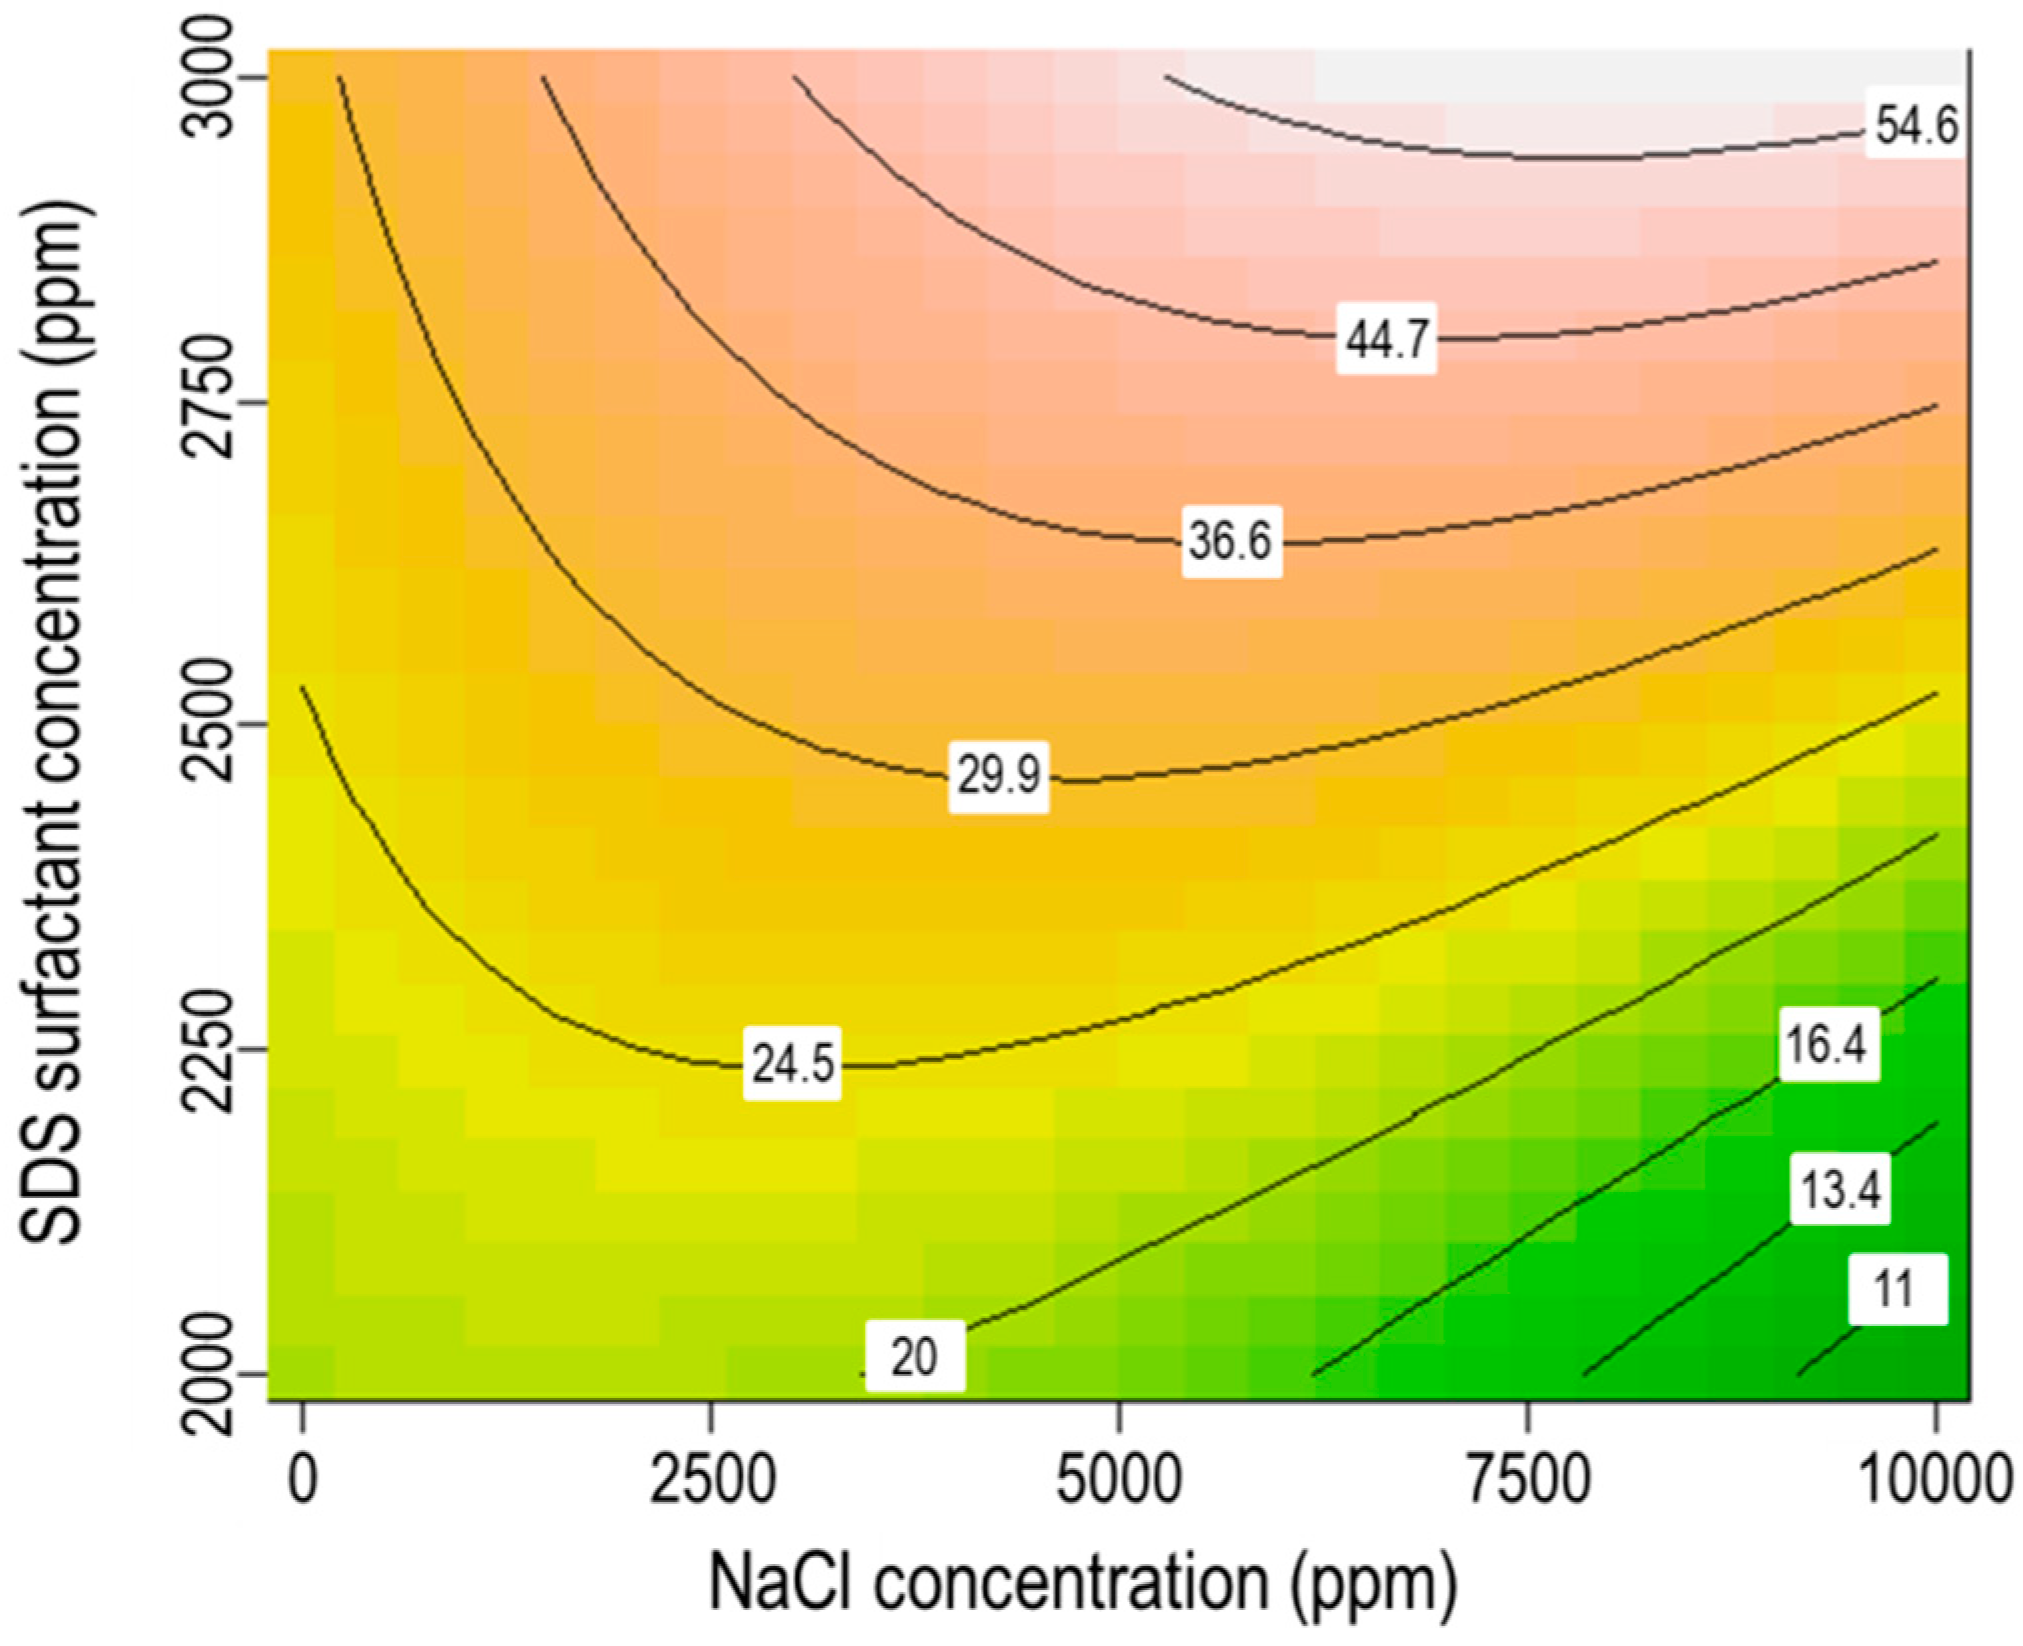
3.6. Interaction between SDS Surfactant Concentration and Salinity

Figure 9 presents the contour plot for half-life time (t1/2) at varying SDS surfactant and NaCl concentrations, while the XG polymer concentration = 2500 ppm and stirring rate = 7000 rpm. SDS surfactant concentration interacts with salinity, so with a high concentration of NaCl, stability increases when SDS surfactant concentration increases. In this case, the phenomena can be explained as follows: the surface tension plays an important role in bubble formation and surface tension reduction is proportional to the amount of surfactant molecules adsorbed at the surface [53]. The reduction in surface tension is greater when adding more NaCl to solution due to the sodium counter-ions binding to sulfate head groups of ionic SDS surfactant; this leads to a reduction in the electrostatic repulsion between the surfactant’s adjacent sulfate ions [54]. Therefore, more SDS surfactant adsorbed at the gas/liquid interface in the presence of NaCl could improve the stability of the bubble.

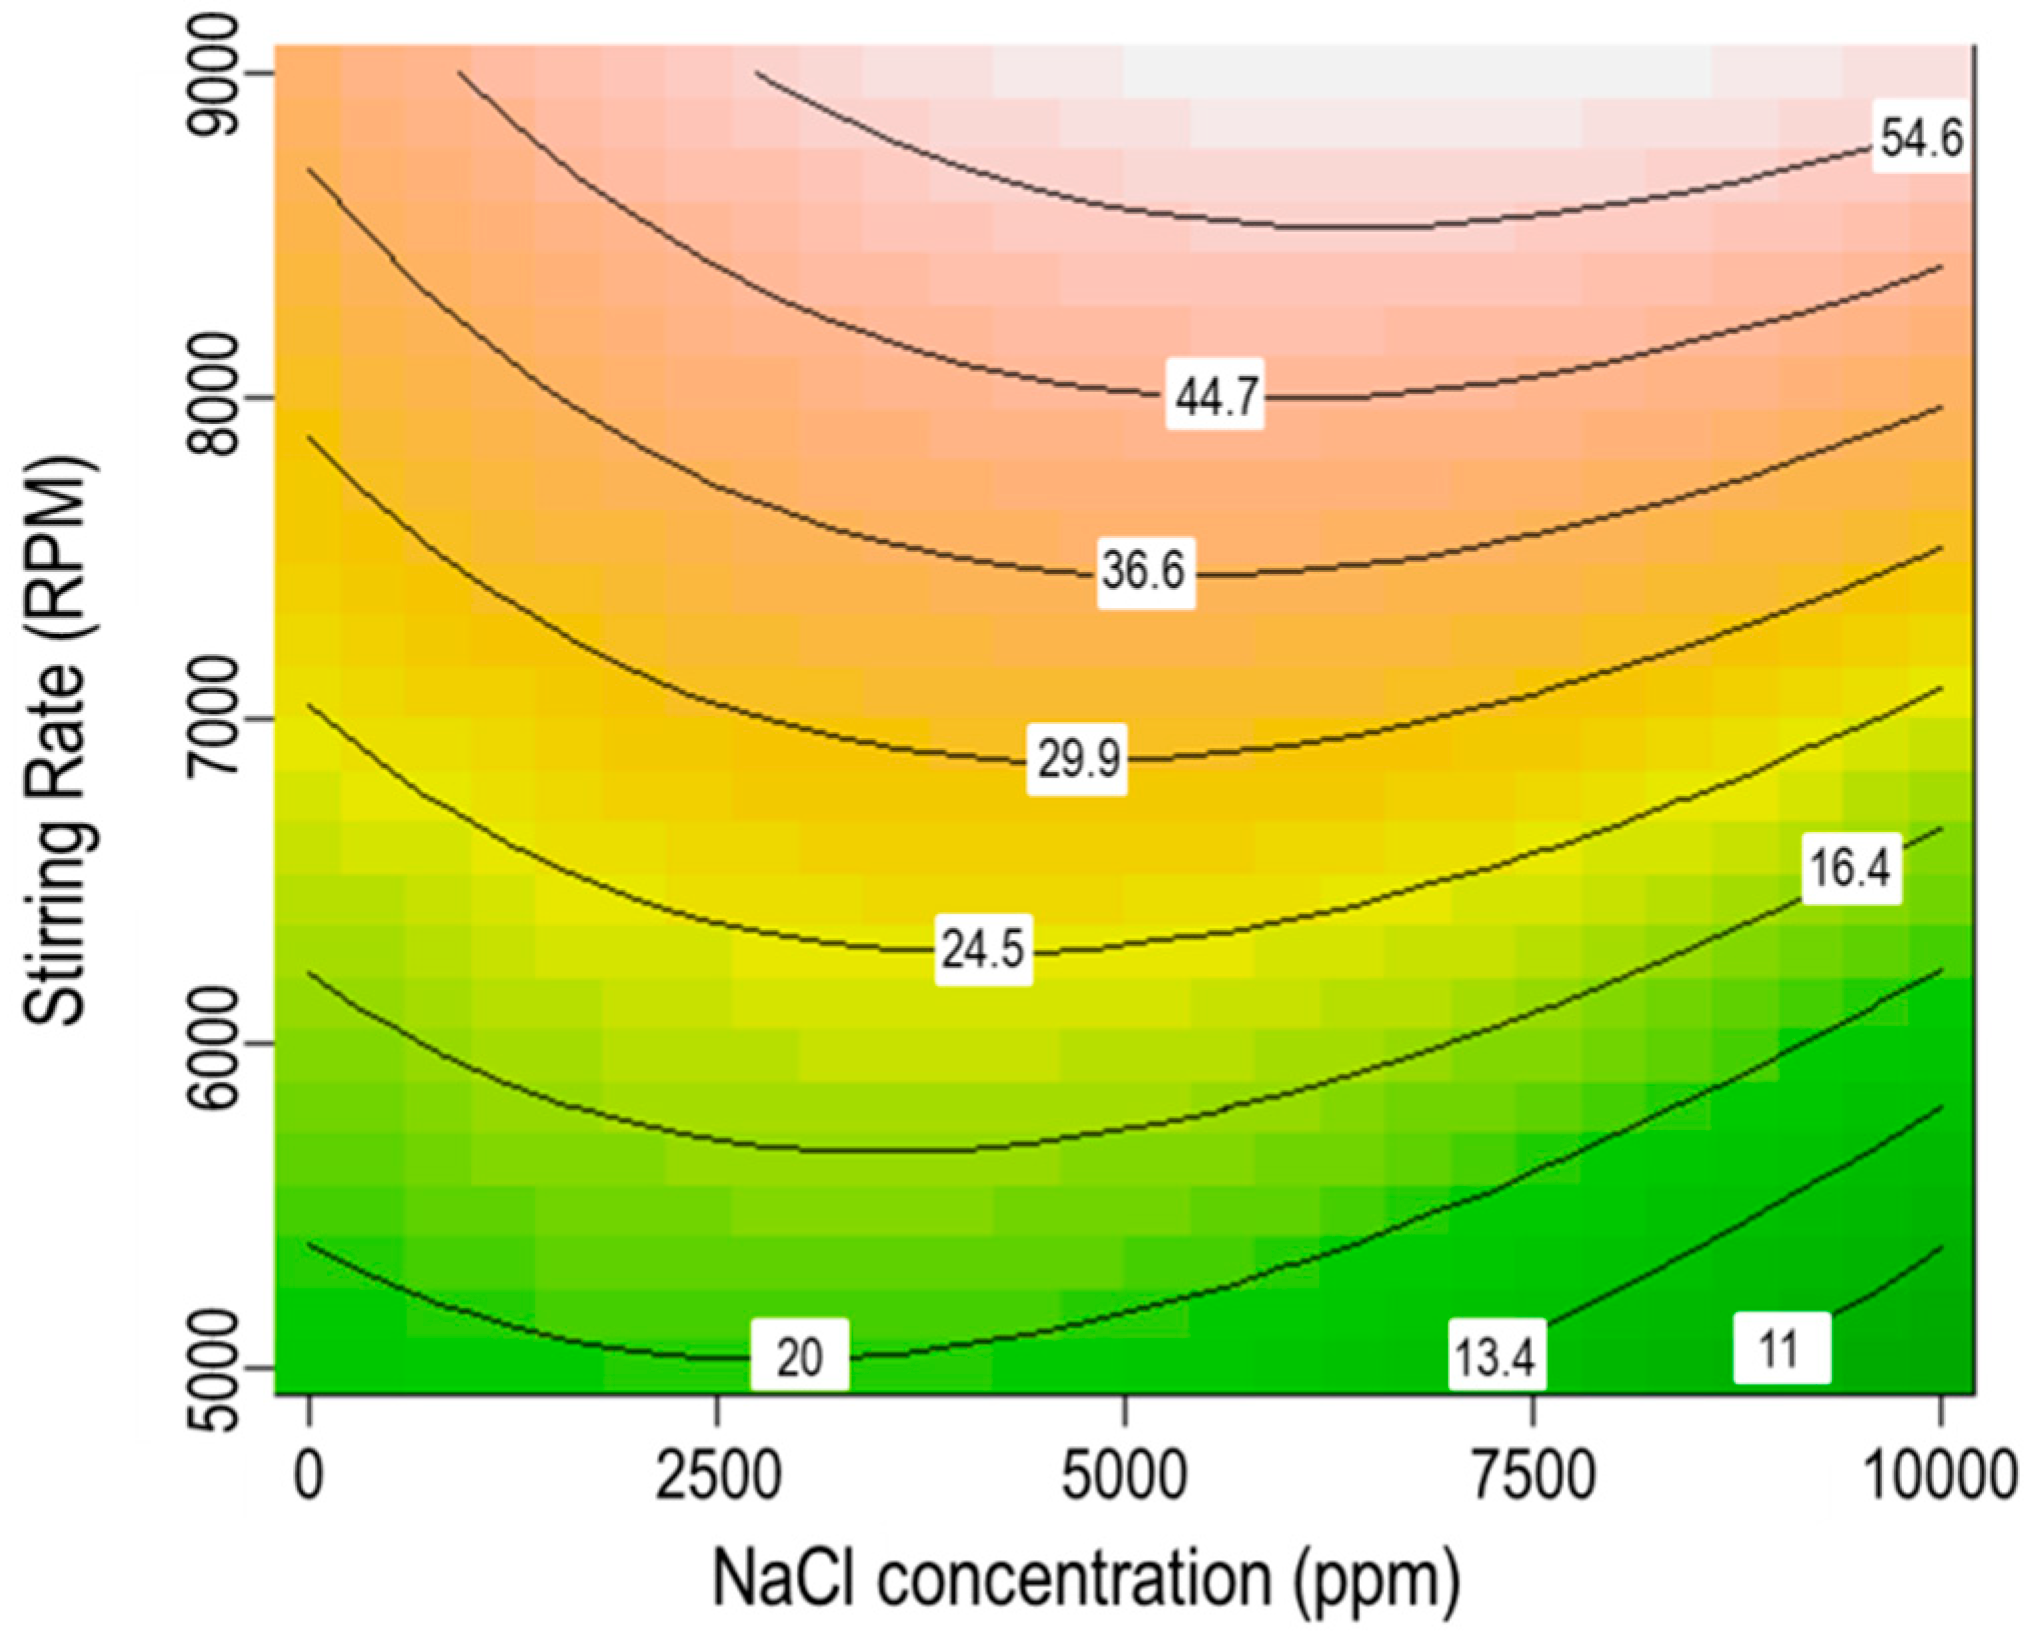
3.7. Interaction between Stirring Rate and Salinity

Figure 10 shows the effect of stirring rate and NaCl concentration on half-life time (t1/2) of CO2 microbubbles dispersion; the other parameters are held at their constant middle level. There is a significant interactive effect of stirring rate and salinity on stability of CO2 microbubbles. It was observed that the rate of stirring rate was greater for high concentration of NaCl. To generate new surfaces between gas and liquid (as microbubbles), stirring operation must supply enough energy to the system [55]. As discussed above, added NaCl could reduce the surface tension. It leads to microbubbles generated with more efficiency with lower required energy. Meanwhile, the general behavior of the response states that the stability of microbubble dispersion is more sensitive to the stirring rate change as compared with NaCl concentration.

3.8. Limitation of This Work

Since the focus of this study was on the stability of CO2 microbubbles dispersion at atmospheric pressure and ambient temperature, there is a possibility that dissimilar evaluations would have arisen if the impact of high pressure and high temperature had been taken to account. Thus, Longe [56] reported on the effect of temperature on CGAs and concluded that CGAs became unstable at temperatures above 65 °C. In their investigation into the stability of CGA-based drilling fluids, Bjorndalen and Kuru [17] showed that CGAs are more sensitive to temperature change of 25 to 50 °C. Growork [57] proposed that CGAs could be relatively stable under pressurization of 20.7 MPa. Telmadarreie [34] observed that CO2 microbubbles can survive pressure as high as 13.8 MPa and temperatures of 50 °C. Telmadarreie [34] also concluded that with temperature above 50 °C, the stability of microbubbles was decreased.

4. Conclusions

In conclusion, our study has employed a DSD approach to produce an experimental array design for investigating the influence of process parameters (XG polymer concentration, SDS surfactant concentration, salinity, stirring time and stirring rate) on stability of CO2 microbubbles dispersion. An empirical statistical model for dependence of stability on these parameters is presented. The analysis results obtained from DSD suggest that:
  • XG Polymer concentration is the most significant factor to improve the stability of CO2 microbubbles dispersion.
  • CO2 microbubbles stability increases for higher SDS surfactant concentrations and stirring rates but decreases with increasing salinity.
  • The interaction of XG polymer concentration and salinity was more considerable than the interactions of SDS surfactant concentration and salinity or stirring rate and salinity on the stability of CO2 microbubbles.
  • Increasing NaCl concentration in solution can enhance the function of SDS surfactant and stirring rate to form microbubbles, whereas, it can also reduce the efficiency of polymers in stabilizing microbubbles.
This DSD approach has been potentially used as an effective tool for the CO2 microbubble investigation and other EOR methods. Further work should concentrate on enhancing the quality of CO2 microbubbles under reservoir conditions, especially related to oil and salinity.

Author Contributions

Conceptualization, N.N.H.L., Y.S. and K.S.; methodology, N.N.H.L. and Y.S.; analysis, N.N.H.L.; investigation, N.N.H.L. and Y.S.; resources, Y.S. and K.S.; writing—original draft preparation, N.N.H.L.; writing—review and editing, N.N.H.L., Y.S. and K.S.; visualization, N.N.H.L. and Y.S.; supervision, Y.S. and K.S. All authors have read and agreed to the published version of the manuscript.

Funding

This research received no external funding.

Acknowledgments

The authors are grateful to Japan International Cooperation Agency (JICA). We also thank Hung Vo Thanh for his comments and discussion.

Conflicts of Interest

The authors declare no conflict of interest.

References

  1. Azzolina, N.A.; Nakles, D.V.; Gorecki, C.D.; Peck, W.D.; Ayash, S.C.; Melzer, L.S.; Chatterjee, S. CO2 storage associated with CO2 enhanced oil recovery: A statistical analysis of historical operations. Int. J. Greenh. Gas Control 2015, 37, 384–397. [Google Scholar] [CrossRef] [Green Version]
  2. Bachu, S. Identification of oil reservoirs suitable for CO2-EOR and CO2 storage (CCUS) using reserves databases, with application to Alberta, Canada. Int. J. Greenh. Gas Control 2016, 44, 152–165. [Google Scholar] [CrossRef]
  3. Vo Thanh, H.; Sugai, Y.; Nguele, R.; Sasaki, K. Integrated workflow in 3D geological model construction for evaluation of CO2 storage capacity of a fractured basement reservoir in Cuu Long Basin, Vietnam. Int. J. Greenh. Gas Control 2019, 90, 102826. [Google Scholar] [CrossRef]
  4. Czarnota, R.; Janiga, D.; Stopa, J.; Wojnarowski, P. Determination of minimum miscibility pressure for CO2 and oil system using acoustically monitored separator. J. CO2 Util. 2017, 17, 32–36. [Google Scholar] [CrossRef]
  5. Janiga, D.; Czarnota, R.; Kuk, E.; Stopa, J.; Wojnarowski, P. Measurement of Oil-CO2 diffusion coefficient using pulse-echo method for pressure-volume decay approach under reservoir conditions. J. Pet. Sci. Eng. 2020, 185, 106636. [Google Scholar] [CrossRef]
  6. Rezk, M.G.; Foroozesh, J. Effect of CO2 mass transfer on rate of oil properties changes: Application to CO2-EOR projects. J. Pet. Sci. Eng. 2019, 180, 298–309. [Google Scholar] [CrossRef]
  7. Lake, L.W. Enhanced Oil Recovery; Prentice Hall: Old Tappan, NJ, USA, 1989; ISBN1 0132816016. ISBN2 9780132816014. [Google Scholar]
  8. Ghedan, S. Global laboratory experience of CO2-EOR flooding. In Proceedings of the SPE/EAGE Reservoir Characterization & Simulation Conference, Abu Dabi, UAE, 19–21 October 2009; pp. 883–897. [Google Scholar] [CrossRef]
  9. Dang, C.; Nghiem, L.; Nguyen, N.; Chen, Z.; Nguyen, Q. Evaluation of CO2 Low Salinity Water-Alternating-Gas for enhanced oil recovery. J. Nat. Gas Sci. Eng. 2016, 35, 237–258. [Google Scholar] [CrossRef]
  10. Telmadarreie, A.; Trivedi, J.J. Evaluating the Performance of CO2 Foam and CO2 Polymer Enhanced Foam for Heavy Oil Recovery: Laboratory Experiments in Unconsolidated and Consolidated Porous Media. In Proceedings of the SPE International Heavy Oil Conference and Exhibition, Kuwait City, Kuwait, 10–12 December 2018. [Google Scholar] [CrossRef]
  11. Telmadarreie, A.; Trivedi, J. Static and Dynamic Performance of Wet Foam and Polymer-Enhanced Foam in the Presence of Heavy Oil. Colloids Interfaces 2018, 2, 38. [Google Scholar] [CrossRef] [Green Version]
  12. Sebba, F. Foams and Biliquid Foams-Aphrons; Wiley: Chichester, UK, 1987. [Google Scholar]
  13. Brookey, T. “Micro-bubbles”: New aphron drill-in fluid technique reduces formation damage in horizontal wells. In Proceedings of the SPE Formation Damage Control Conference, Lafayette, LA, USA, 18–19 February 1998; pp. 645–656. [Google Scholar]
  14. Ivan, C.D.; Quintana, J.L.; Blake, L.D. Aphron-Base Drilling Fluid: Evolving Technologies for Lost Circulation Control. In Proceedings of the SPE Annual Technical Conference and Exhibition, New Orleans, LA, USA, 30 September–3 October 2001; pp. 553–558. [Google Scholar] [CrossRef]
  15. White, C.C.; Chesters, A.P.; Ivan, C.D.; Maikranz, S.; Nouris, R. Aphron-based drilling fluid: Novel technology for drilling depleted formations. World Oil 2003, 224, 37–43. [Google Scholar]
  16. Ramirez, F.; Greaves, R.; Montilva, J. Experience using microbubbles-aphron drilling fluid in mature reservoirs of Lake Maracaibo. In Proceedings of the International Symposium and Exhibition on Formation Damage Control, Lafayette, LA, USA, 20–21 February 2002. [Google Scholar]
  17. Bjorndalen, N.; Kuru, E. Stability of microbubble-based drilling fluids under downhole conditions. J. Can. Pet. Technol. 2008, 47, 40–47. [Google Scholar] [CrossRef]
  18. Bjorndalen, N.; Kuru, E. Physico-chemical characterization of aphron based drilling fluids. In Proceedings of the Canadian International Petroleum Conference, Calgary, AB, Canada, 7–9 June 2005. [Google Scholar] [CrossRef]
  19. Ahmadi, M.A.; Galedarzadeh, M.; Shadizadeh, S.R. Colloidal gas aphron drilling fluid properties generated by natural surfactants: Experimental investigation. J. Nat. Gas Sci. Eng. 2015, 27, 1109–1117. [Google Scholar] [CrossRef]
  20. Samuel, S.R. A Laboratory Study of Aqueous Colloidal Gas Aphrons for Enhanced Oil Recovery Applications. Master’s Thesis, University of Alberta, Edmonton, AB, Canada, 2012. [Google Scholar]
  21. Khamehchi, E.; Tabibzadeh, S.; Alizadeh, A. Rheological properties of Aphron based drilling fluids. Pet. Explor. Dev. 2016, 43, 1076–1081. [Google Scholar] [CrossRef]
  22. Alizadeh, A.; Khamehchi, E. Experimental investigation of the oil based Aphron drilling fluid for determining the most stable fluid formulation. J. Pet. Sci. Eng. 2019, 174, 525–532. [Google Scholar] [CrossRef]
  23. Save, S.V.; Pangarkar, V.G. Characterisation of colloidal gas aphrons. Carbohydr. Polym. 1994, 127, 35–54. [Google Scholar] [CrossRef]
  24. Jauregi, P.; Gilmour, S.; Varley, J. Characterisation of colloidal gas aphrons for subsequent use for protein recovery. Chem. Eng. J. 1997, 65, 1–11. [Google Scholar] [CrossRef]
  25. Tabzar, A.; Arabloo, M.; Ghazanfari, M.H. Rheology, stability and filtration characteristics of Colloidal Gas Aphron fluids: Role of surfactant and polymer type. J. Nat. Gas Sci. Eng. 2015, 26, 895–906. [Google Scholar] [CrossRef]
  26. Hosseini-Kaldozakh, S.; Khamehchi, E.; Dabir, B.; Alizadeh, A.; Mansoori, Z. Experimental Investigation of Water Based Colloidal Gas Aphron Fluid Stability. Colloids Interfaces 2019, 3, 31. [Google Scholar] [CrossRef] [Green Version]
  27. Alizadeh, A.; Khamehchi, E. Modeling of micro-bubble surfactant multi-layer drilling fluid stability based on single bubble behavior under pressure and temperature in a deviated gas well. J. Nat. Gas Sci. Eng. 2015, 26, 42–50. [Google Scholar] [CrossRef]
  28. Alizadeh, A.; Khamehchi, E. A model for predicting size distribution and liquid drainage from micro-bubble surfactant multi-layer fluids using population balance. Colloid Polym. Sci. 2015, 293, 3419–3427. [Google Scholar] [CrossRef]
  29. Alizadeh, A.; Khamehchi, E. Mathematical modeling of the Colloidal Gas Aphron transport through porous medium using the filtration theory. J. Nat. Gas Sci. Eng. 2017, 44, 37–53. [Google Scholar] [CrossRef] [Green Version]
  30. Bjorndalen, N.; Alvarez, J.; Jossy, E.; Kuru, E. An Experimental Study of the Pore-Blocking Mechanisms of Aphron Drilling Fluids Using Micromodels. In Proceedings of the SPE International Symposium on Oilfield Chemistry, The Woodlands, TX, USA, 20–22 April 2009. [Google Scholar] [CrossRef]
  31. Shi, S.; Wang, Y.; Li, Z.; Chen, Q.; Zhao, Z. Laboratory investigation of the factors impact on bubble size, pore blocking and enhanced oil recovery with aqueous Colloidal Gas Aphron. J. Pet. Explor. Prod. Technol. 2016, 6, 409–417. [Google Scholar] [CrossRef] [PubMed] [Green Version]
  32. Akai, T.; Xue, Z.; Yamashita, Y.; Yoshizawa, M. Application of CO2 micro bubble for the innovative CO2-EOR. In Proceedings of the Abu Dhabi International Petroleum Exhibition and Conference, Abu Dhabi, UAE, 9–12 November 2015. [Google Scholar]
  33. Natawijaya, M.A.; Sugai, Y.; Anggara, F. CO2 microbubble colloidal gas aphrons for EOR application: The generation using porous filter, diameter size analysis and gas blocking impact on sweep efficiency. J. Pet. Explor. Prod. Technol. 2020, 10, 103–113. [Google Scholar] [CrossRef] [Green Version]
  34. Telmadarreie, A.; Doda, A.; Trivedi, J.J.; Kuru, E.; Choi, P. CO2 microbubbles—A potential fluid for enhanced oil recovery: Bulk and porous media studies. J. Pet. Sci. Eng. 2016, 138, 160–173. [Google Scholar] [CrossRef]
  35. Ghosh, M. Laboratory Study on the Generation and Characterisation of CO2 Colloidal Gas Aphrons. Master’s Thesis, University of Alberta, Edmonton, AB, Canada, 2013. [Google Scholar]
  36. Jones, B.; Nachtsheim, C.J. A class of three-level designs for definitive screening in the presence of second-order effects. J. Qual. Technol. 2011, 43, 1–15. [Google Scholar] [CrossRef]
  37. Weese, M.L.; Ramsey, P.J.; Montgomery, D.C. Analysis of definitive screening designs: Screening vs prediction. Appl. Stoch. Model. Bus. Ind. 2018, 34, 244–255. [Google Scholar] [CrossRef]
  38. Erler, A.; de Mas, N.; Ramsey, P.; Henderson, G. Efficient biological process characterization by definitive-screening designs: The formaldehyde treatment of a therapeutic protein as a case study. Biotechnol. Lett. 2013, 35, 323–329. [Google Scholar] [CrossRef]
  39. Parmar, R.; Majumder, S.K. Chemical Engineering and Processing: Process Intensification Microbubble generation and microbubble-aided transport process intensification—A state-of-the-art report. Chem. Eng. Process. 2013, 64, 79–97. [Google Scholar] [CrossRef]
  40. Libbrecht, W.; Deruyck, F.; Poelman, H.; Verberckmoes, A.; Thybaut, J.; De Clercq, J.; Van Der Voort, P. Optimization of soft templated mesoporous carbon synthesis using Definitive Screening Design. Chem. Eng. J. 2015, 259, 126–134. [Google Scholar] [CrossRef]
  41. Zhao, J.; Li, W.; Qu, H.; Tian, G.; Wei, Y. Application of definitive screening design to quantify the effects of process parameters on key granule characteristics and optimize operating parameters in pulsed-spray fluid-bed granulation. Particuology 2019, 43, 56–65. [Google Scholar] [CrossRef]
  42. John, A. Package ‘Daewr.’, Version 1.2-2; John Lawson: Provo, UT, USA, 2020. [Google Scholar]
  43. Feng, W.; Singhal, N.; Swift, S. Drainage mechanism of microbubble dispersion and factors influencing its stability. J. Colloid Interface Sci. 2009, 337, 548–554. [Google Scholar] [CrossRef]
  44. Pasdar, M.; Kazemzadeh, E.; Kamari, E.; Ghazanfari, M.H.; Soleymani, M. Monitoring the role of polymer and surfactant concentrations on bubble size distribution in colloidal gas aphron based fluids. Colloids Surf. A Phys. Eng. Asp. 2018, 556, 93–98. [Google Scholar] [CrossRef]
  45. Yan, Y.L.; Qu, C.T.; Zhang, N.S.; Yang, Z.G.; Liu, L. A study on the kinetics of liquid drainage from colloidal gas aphrons (CGAs). Colloids Surf. A Phys. Eng. Asp. 2005, 259, 167–172. [Google Scholar] [CrossRef]
  46. Arabloo, M.; Pordel Shahri, M. Experimental studies on stability and viscoplastic modeling of colloidal gas aphron (CGA) based drilling fluids. J. Pet. Sci. Eng. 2014, 113, 8–22. [Google Scholar] [CrossRef]
  47. Wassenius, H.; Nydén, M.; Holmberg, K. Dispersion stability evaluated by experimental design. J. Dispers. Sci. Technol. 2001, 22, 297–309. [Google Scholar] [CrossRef]
  48. Sahu, U.K.; Mahapatra, S.S.; Patel, R.K. Application of Box–Behnken Design in response surface methodology for adsorptive removal of arsenic from aqueous solution using CeO2/Fe2O3/graphene nanocomposite. Mater. Chem. Phys. 2018, 207, 233–242. [Google Scholar] [CrossRef]
  49. Dahmoune, F.; Spigno, G.; Moussi, K.; Remini, H.; Cherbal, A.; Madani, K. Pistacia lentiscus leaves as a source of phenolic compounds: Microwave-assisted extraction optimized and compared with ultrasound-assisted and conventional solvent extraction. Ind. Crop. Prod. 2014, 61, 31–40. [Google Scholar] [CrossRef]
  50. Ekren, B.Y.; Heragu, S.S. Simulation-based regression analysis for the rack configuration of an autonomous vehicle storage and retrieval system. Int. J. Prod. Res. 2010, 48, 6257–6274. [Google Scholar] [CrossRef]
  51. Sadoun, O.; Rezgui, F.; G’Sell, C. Optimization of valsartan encapsulation in biodegradables polyesters using Box-Behnken design. Mater. Sci. Eng. C 2018, 90, 189–197. [Google Scholar] [CrossRef]
  52. Keshavarzi, B.; Mahmoudvand, M.; Javadi, A.; Bahramian, A.; Miller, R.; Eckert, K. Salt Effects on Formation and Stability of Colloidal Gas Aphrons Produced by Anionic and Zwitterionic Surfactants in Xanthan Gum Solution. Colloids Interfaces 2020, 4, 9. [Google Scholar] [CrossRef] [Green Version]
  53. Pandey, S.; Bagwe, R.P.; Shah, D.O. Effect of counterions on surface and foaming properties of dodecyl sulfate. J. Colloid Interface Sci. 2003, 267, 160–166. [Google Scholar] [CrossRef]
  54. Xu, Q.; Nakajima, M.; Ichikawa, S.; Nakamura, N.; Roy, P.; Okadome, H.; Shiina, T. Effects of surfactant and electrolyte concentrations on bubble formation and stabilization. J. Colloid Interface Sci. 2009, 332, 208–214. [Google Scholar] [CrossRef] [PubMed]
  55. Sadeghialiabadi, H.; Amiri, M.C. A new stability index for characterizing the colloidal gas aphrons dispersion. Colloids Surf. A Phys. Eng. Asp. 2015, 471, 170–177. [Google Scholar] [CrossRef]
  56. Longe, T.A. Colloidal Gas Aphrons: Generation, Flow Characterization and Application in Soil and Groundwater Decontamination. Ph.D. Thesis, Virginia Polytechnic Institute and State University, Blacksburg, VA, USA, 1989. [Google Scholar]
  57. Popov, P.; Growcock, F. R&D validates effectiveness of aphron drilling fluids. Drill. Contract. 2005, 61, 55–58. [Google Scholar]
Figure 1. (a) CO2 microbubbles structure and (b) microscopic image in this study.
Colloids 04 00026 g001
Figure 2. Schematic of CO2 microbubbles generator setup.
Colloids 04 00026 g002
Figure 3. Schematic view of EVOS Core Imaging System Digital Microscope.
Colloids 04 00026 g003
Figure 4. (a) A typical micrograph and (b) its detected edge by the image analysis software.
Colloids 04 00026 g004
Figure 5. Size distribution of CO2 microbubbles in Experiment No.1.
Colloids 04 00026 g005
Figure 6. Comparative plot between experimental and predicted values.
Colloids 04 00026 g006
Figure 7. Magnitude of effects in regression model Equation (2).
Colloids 04 00026 g007
Figure 8. Interaction between xanthan gum (XG) polymer concentration and salinity at sodium dodecyl sulfate (SDS) surfactant concentration = 2500 (ppm) and stirring rate = 7000 (rpm).
Colloids 04 00026 g008
Figure 9. Interaction between SDS surfactant concentration and salinity at XG polymer concentration = 2500 (ppm) and stirring rate = 7000 (rpm).
Colloids 04 00026 g009
Figure 10. Interaction between stirring rate and salinity at XG polymer concentration = 2500 (ppm) and SDS surfactant concentration = 2500 (ppm).
Colloids 04 00026 g010
Table 1. Independent factors and their levels in definitive screening design (DSD).
Factors CodeFactors NameLevel of Factor
−101
AXG Polymer Concentration (ppm)100025004000
BSDS Surfactant Concentration (ppm)200025003000
CSalinity (ppm)0500010000
DStirring Time (min)479
EStirring Rate (rpm)500070009000
Table 2. DSD array design.
Exp.Coded ValuesActual Values
ABCDEXG Polymer Conc. (ppm)SDS Surfactant Conc. (ppm)Salinity (ppm)Stirring Time (min)Stirring Rate (rpm)
1011112500300010,000109000
20−1−1−1−125002000045000
31011−14000250010,000105000
4−10−1−1110002500049000
51−1011400020005000109000
6−110−1−110003000500045000
71−1−10140002000079000
8−1110−11000300010,00075000
911−1−1040003000047000
10−1−11101000200010,000107000
110000025002500500047000
Table 3. Average bubble size and standard deviation of CO2 microbubbles dispersions.
ExperimentMean Diameter (μm)Standard Deviation (μm)
1107.441.8
2140.164.5
3138.844.2
486.636.5
5150.160.0
6119.636.8
7115.159.6
8129.350.7
991.633.9
1094.330.7
11162.757.3
Table 4. Experimental design and observed responses.
Exp.Final Liquid Volume (mL)t1/2 (min)
142147.0
26612.5
35730.0
4833.5
540210.0
6954.0
745380.0
8457.0
985318.0
10853.0
113332.5
Table 5. Estimates of the regression coefficients of the model described by Equation (2).
CoefficientCoded TermEstimateStandard Errort-Valuep-Value
β0Intercept3.444140.03146109.4738.34 × 10−5
β1A1.785420.0206086.6870.000133
β2B0.537910.0206026.1170.001463
β3C−0.017990.02060−0.8730.474559
β5E0.702820.0206034.1240.000858
β13CA−0.624860.02345−26.6470.019436
β23CB0.366330.0234515.6220.001405
β35CE0.219950.023459.3800.004073
β33C2−0.272340.03853−7.0680.011176
R2 = 0.9998, Adjusted R2 = 0.9991, F-value = 1462, p-value = 0.0006837

