
Rheological Behaviors and Fractional Viscoelastic Modeling of Glucopone (APG)/Water/Hydrocarbons Solutions

1
Department of Physics, Faculty of Science, Al-Baha University, Al-Baha 65799, Saudi Arabia
2
Department of Physics, Faculty of Science and Technology, Al-Neelain University, Khartoum 11121, Sudan
Colloids Interfaces 2024, 8(3), 27; https://doi.org/10.3390/colloids8030027
Submission received: 24 February 2024
/
Revised: 11 April 2024
/
Accepted: 19 April 2024
/
Published: 24 April 2024
(This article belongs to the Special Issue Rheology of Complex Fluids and Interfaces)
Abstract
:The aims of this work are to study the rheological behaviors of a microemulsion of Glucopone–water–hydrocarbon systems and to use a fractional model to describe several experimental results of these systems. Four different types of hydrocarbons were considered. The frequency dependent storage, G′, and loss modulus, G″, were investigated below the critical strain. The critical strain was found to decrease as the alkane chain lengths increased, while the opposite behavior was observed for zero shear viscosity, η0. Most of the microemulsions exhibited stable elastic fluid behavior (G′ > G″) below 10 rad s−1 angular frequency. For all systems, elastic modulus values were found to be greater than loss modulus in the frequency range studied, indicating more elastic behaviors. Shear-thinning behaviors were observed, and the complex viscosity decreased with an increase in hydrocarbon chain lengths. The effects of hydrocarbon types on the rheological behaviors were more profound in the dodecane systems which showed maximum values of G′ and η0. The Friedrich–Braun model was introduced and was used to describe several experimental results on Alkyl polyglocoside solutions. Fractional rheology successfully described the viscoelastic phenomena in Glucopone surfactant solutions and the comparisons between the experimental results and the theoretical predictions were found to be satisfactory.
1. Introduction
Emulsions and microemulsions gained great interest in recent years [1,2]. Plus, emulsions are widely used in industry [3], enhance oil recovery [4], and are also used for biological applications [5,6]. Many surfactants, particularly commercially produced detergents, dissolve readily in water and form solutions up to high concentrations. The self-assembling behavior of the surfactant molecules at the water/oil interface offers a stable microenvironment for the chemical reaction to occur when desirable reactants collide with each other [3,7]. Among this interesting class of surfactants that form emulsions and microemulsions are Alkyl polyglucosides (APG). APG are a class of nonionic and nontoxic surfactants that are developed from renewable resources such as sugar and the vegetable oil of raw vegetable materials [8,9]. Despite their interesting properties, investigations regarding their characteristics in solution are relatively limited [10,11].
Viscoelastic materials exhibit elastic and viscous behavior and their mechanisms can be modeled through a combination of springs and dashpots. This class of material is used in many applications and its behavior appears in many materials such as acrylics, rubber, and glass. Earlier, viscoelastic materials have been described by the Kelvin–Voigt model for constitutive relationship [12] and these materials allegedly have memory because of these phenomena [13].
The conventional models using ordinary differential equations do not allow an accurate fit of experimental data of viscoelastic solutions. In order to obtain a better fit for the viscoelastic behaviors, several fractional models were developed using differential fractional equations [14,15,16,17]. Bagely and Torvik [18] prove that fractional calculus models were reliable with molecular theory, while Schiessel and Blumen [19] used fractional calculus models to describe the rheological behavior.
The aim of the current work is to study the effect of surfactant concentration and different hydrocarbon types on the rheology of solutions. Alkyl polyglucoside (Glucopone 215 CSUP) surfactants with different concentrations and four different types of hydrocarbons are used to prepare the solutions. Rheological experiments are performed for these solutions and the related elastic and viscous modulus are measured. The Friedrich–Braun model is introduced and is used to describe the experimental data. The comparison between the experimental data and the theoretical predictions, based on the fractional model, is presented.
2. Materials and Methods
2.1. Materials
The alkyl polyglucoside (APG) that is known as Glucopone 215 CSUP and was used in the current study was supplied as a 65 wt% solution in water and was purchased from Fluka, Dorset, UK. The hydrocarbons were obtained from Ajax Chemicals, Sydney, NSW, Australia. The surfactant was used as received. Twice distilled water was used in the preparation of samples. The desired amounts of surfactant, water, and hydrocarbon were mixed at room temperature (~25 °C) in glass bottles to prepare solutions.
The micellar solution in the ternary systems of this work formed at very low oil concentration but at higher water concentration [8]. Hence, in this work, we will study two compositions for each system with fixed oil contents. Composition 2 has higher surfactant concentration and lower water content. We report here results from two representative samples for each type of oil whose composition is given in Table 1.
2.2. Rheometer
The rheological experiments were performed using VOR BOHLIN rheometric (Malvern, Worcestershire, UK) apparatus with cone-plate sensor of diameter of 30 mm and cone angle of 2.50. The frequency was fixed at 1 Hz for strain measurements. The measurements of the storage modulus G′(ω) and the loss modulus G″(ω) were carried out as function of frequency at room temperature (25 °C). Each rheology test was repeated twice after 10 min waiting time which was required to transmit rheological history to the whole system.
3. Results and Discussions
3.1. Phase Diagram
The boundaries of single-phase water in oil microemulsion regions of a ternary system Glucopone/water/hydrocarbons and the complete phase diagrams were determined and reported by Siddig et al. [8]. The microemulsion is an isotropic phase which gives a dark view under an optical polarized microscope unlike the birefringence patterns of lamellar and hexagonal structures [20]. Scomoroscenco, C. et al. [21] prepared and characterized microemulsion at low oil concentration using a similar class of surfactant (Alkyl polyglucoside). The study on the effect of oil phase on microemulsions with a similar composition was performed by Sisak et al. [22]. The packing parameter can be determined by P = v/al, where v is effective hydrocarbon chain volume, a, is the area per polar head and l is the surfactant alkyl chain length. In all cases studied, spherical micelles were formed.
3.2. Strain Sweep
Different types of oil were used to investigate their effect on the rheological behaviors of the viscoelastic solutions. Measurements with an oscillation rheometer provided the storage modulus, G′(ω) and loss modulus, G″(ω) dependent on the strain. These measurements must be run in the linear viscoelastic range of the solutions. In order to determine the region of the linear viscoelasticity, the strain ramp at fixed frequency was performed. The samples were in diluted form and were prepared with different types of oil, which have different alkane chain lengths. The strain sweep was performed for each sample to define the critical strain. Figure 1 shows the elastic modulus as a function of strain for the samples of composition 1. Generally, it was observed that the critical strain decreased as the alkane chain lengths increased. This increase in length of the hydrocarbon chain may form a more viscous solution and thus the liquid-like fluid behaviors will be more obvious. Similar behaviors were observed for samples of composition 2; the critical strain decreased as the alkane chain lengths increased. Figure 2 shows the elastic modulus as a function of strain for the samples of composition 2.
3.3. Frequency Sweep
The interaction between particles in solutions determines whether the system is elastic or flowing. The interaction can be measured by the dynamic moduli as the function of the frequency at constant strain. If there is no association between the particles, the losses in modulus and viscosity are close to Newtonian. If the particles are strongly associated, the storage modulus, G′(ω) becomes the dominant modulus and the viscosity will decrease with increasing oscillation frequency.
Figure 3a shows the elastic modulus G′(ω) and the loss modulus G″(ω) as functions of frequency for heptane system of composition 1. The applied strain was 0.0001 and the value of the elastic modulus was found to be around 700. The elastic modulus, G′ is higher than the loss modulus and the crossover between G′ and G″ was observed at low frequency range. Figure 3b–d show the elastic modulus for other systems of composition 1 of different oils type, namely octane, dodecane and tetradecane. Like the heptane system, the elastic modulus is always higher than the loss modulus in the frequency range studied. For all systems, the storage modulus, G′(ω), was found to increase with frequency. The discrepancy between the elastic and loss moduli in the tetradecane system was found to be the least compared to the discrepancies that correspond to other systems (see Figure 3d). The microemulsions show elastic-like fluid behaviors at a low frequency (below 10 rad s−1), where the value of G′ > G″. According to Torres et al. [23] th microemulsion will be highly stable if the G′ value is higher than that of G″.
Figure 4a shows the elastic modulus, G′(ω) and the viscous modulus, G″(ω) as a function of frequency for the heptane system of composition 2. Similar to the heptane system of composition 1, the elastic modulus was found to be around 700 pa and the G′ value is higher than in the loss modulus. The crossover between G′ and G″ was not observed for sample of heptane system of composition 2. Figure 4b–d show the elastic and loss modulus for octane, dodecane and tetradecane systems of composition 2, respectively. The values of the elastic modulus are greater than those of the loss modulus for all samples and the discrepancy between the elastic and loss moduli in heptane, octane, and dodecane systems is higher than that which corresponds to the tetradecane systems. Similar to composition 1 samples, the crossover between G′ and G″ at a low frequency was observed in the systems. From the reciprocal frequency where the crossover occurs, one can estimate the relaxation time [20]. The zero shear viscosity, η0, can be calculated from the following equation [8]:
The results of relaxation time and zero shear viscosity for composition 1 are summarized in Table 2. It can be observed from Table 2 that the dodecane system shows the largest value of η0. The oscillator measurements were performed on the samples of composition 2 and similar behaviors were observed with the dodecane system showing the largest value of η0. The viscosity of a liquid is related to the ease with which the molecules can move with respect to one another. Figure 5a,b show the variation of zero shear viscosity as a function of length of hydrocarbon for the two considered compositions. For composition 1, increasing the shear rate tends to decrease zero shear viscosity and the octane sample showed the lowest value. However, the decrease was more profound in the sample of composition 2 of the tetradecane system which showed the least zero shear viscosity.
It can be noticed that the further increase in Glucopone concertation leads to an increase in zero shear viscosity for the samples with the exception of the sample of the tetradecane system which showed the opposite behavior. Figure 5c,d show the variation of relaxation time as a function of length of hydrocarbon. The estimated values of relaxation time vary in a range from 1.6 to 5 s and were found to decrease as hydrocarbon length increased in composition 1. On the other hand, with the exception of the tetradecane system, the opposite behavior could be observed for the samples of composition 2.
The comparison of the storage moduli, G′(ω), for all systems of composition 1 is shown in Figure 6. The influence of oil types was profound in the systems studied. The increase in the chain length of hydrocarbon resulted in an increase in the values of G′(ω), which was found to be maximum for the dodecane system. The increase in the value of G’ may be due to the inter-particle interactions that form bonds between particles in the oil–water interface [24]. The further increase in chain length resulted in the value dropping to be the minimum for the sample of the tetradecane system. Figure 7 shows the elastic modulus versus frequency for samples of composition 2. In a similar manner to composition 1, the increase in chain length resulted in an increase in the elastic modulus of samples of composition 2. Moreover, it can be observed that the increase in Glucopone concentration did not significantly affect the values of the elastic modulus G′(ω) of the systems, except in case of the dodecane system where the effect was profound, which was indicated by the values of G′(ω), which are quite different (4000 Pa vs. 1000 Pa).
3.4. Complex Viscosity
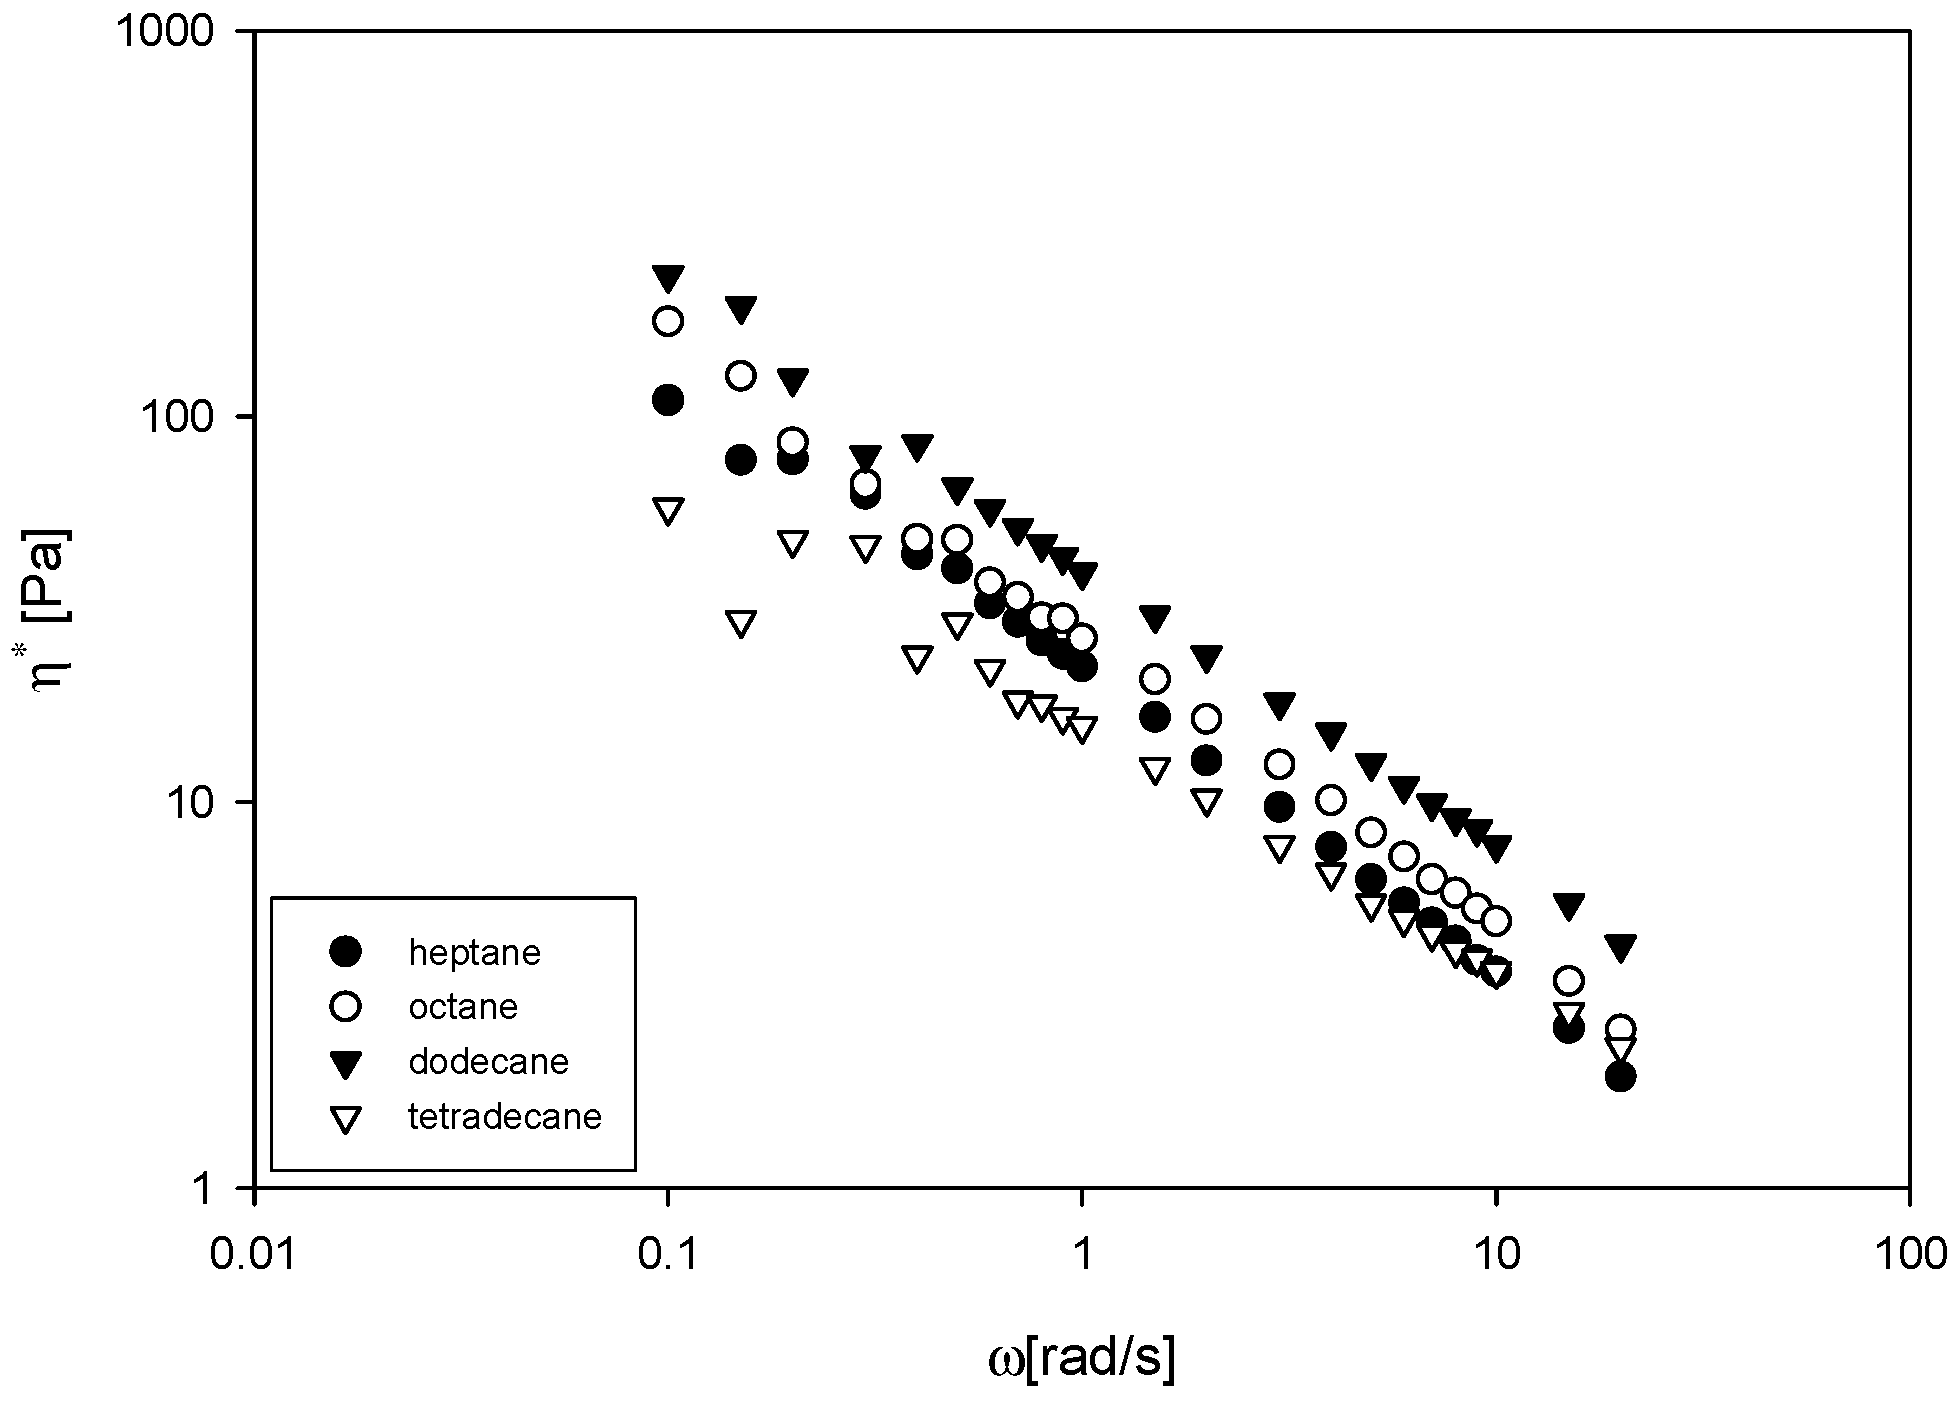
Figure 8 shows the change in complex viscosity η* as a function of angular frequency for the samples of composition 1. For all samples, the complex viscosity is strongly frequency dependent. The complex viscosity decreased with increasing frequency. From Figure 7, it can be observed that as alkane chain lengths of the hydrocarbon increased, the values of complex viscosity were slightly increased. The increase in hydrocarbon chain length may result in more adsorption of the thickening agent through the oil–water interface, thus producing an apparent higher microemulsion viscosity. Furthermore, it can be observed that the variations of the slopes were not constant. They were the maximum in the heptane system, intermediate in the octane system, and the least in the dodecane system, and this agreed with the rheological results of the elastic modulus.
Figure 9 shows the complex viscosity η* for the samples of composition 2. The complex viscosity decreased with increasing frequency. Similar to composition 1, it can be observed that the complex viscosity increased as the alkane chain lengths of the hydrocarbon increase, and the variations of the slopes are not constant. If we make an exception for the tetradecane system, it is at maximum in the heptane system, intermediate in the octane system, and is least in the dodecane system. These results indicated that the shorter the alkane chain length systems are, the smaller the values of the complex viscosity.
4. Fractional Modeling
4.1. Friedrich–Braun Model
The fractional calculus was used to successfully describe the rheological behavior of materials. The fractional viscoelastic mode would help to understand and analyze the rheological data of soft and biological materials [25].
The first fractional viscoelastic models by Bagely can be reduced to the form [26]
where the first term represents a characteristic of solid and the second term containing fractional derivative is introduced to describe the viscoelastic behaviors. The differential form of the model, proposed by Friedrich and Braun [27,28] to describe the rheological parameters, is given by
where τ is the stress, γ is deformation tensors, λ is t the characteristic time, D is the fractional operator and Ge is the equilibrium modulus. The derivative orders are q and µ and ΔG quantifies the differences between Ge and the plateau modulus G∞ (ω → ∞). The relevant expressions for G′(ω) and G″(ω) are
and
For q = 0, the model reduces to Equation (2).
4.2. Modeling the Viscoelastic Solutions
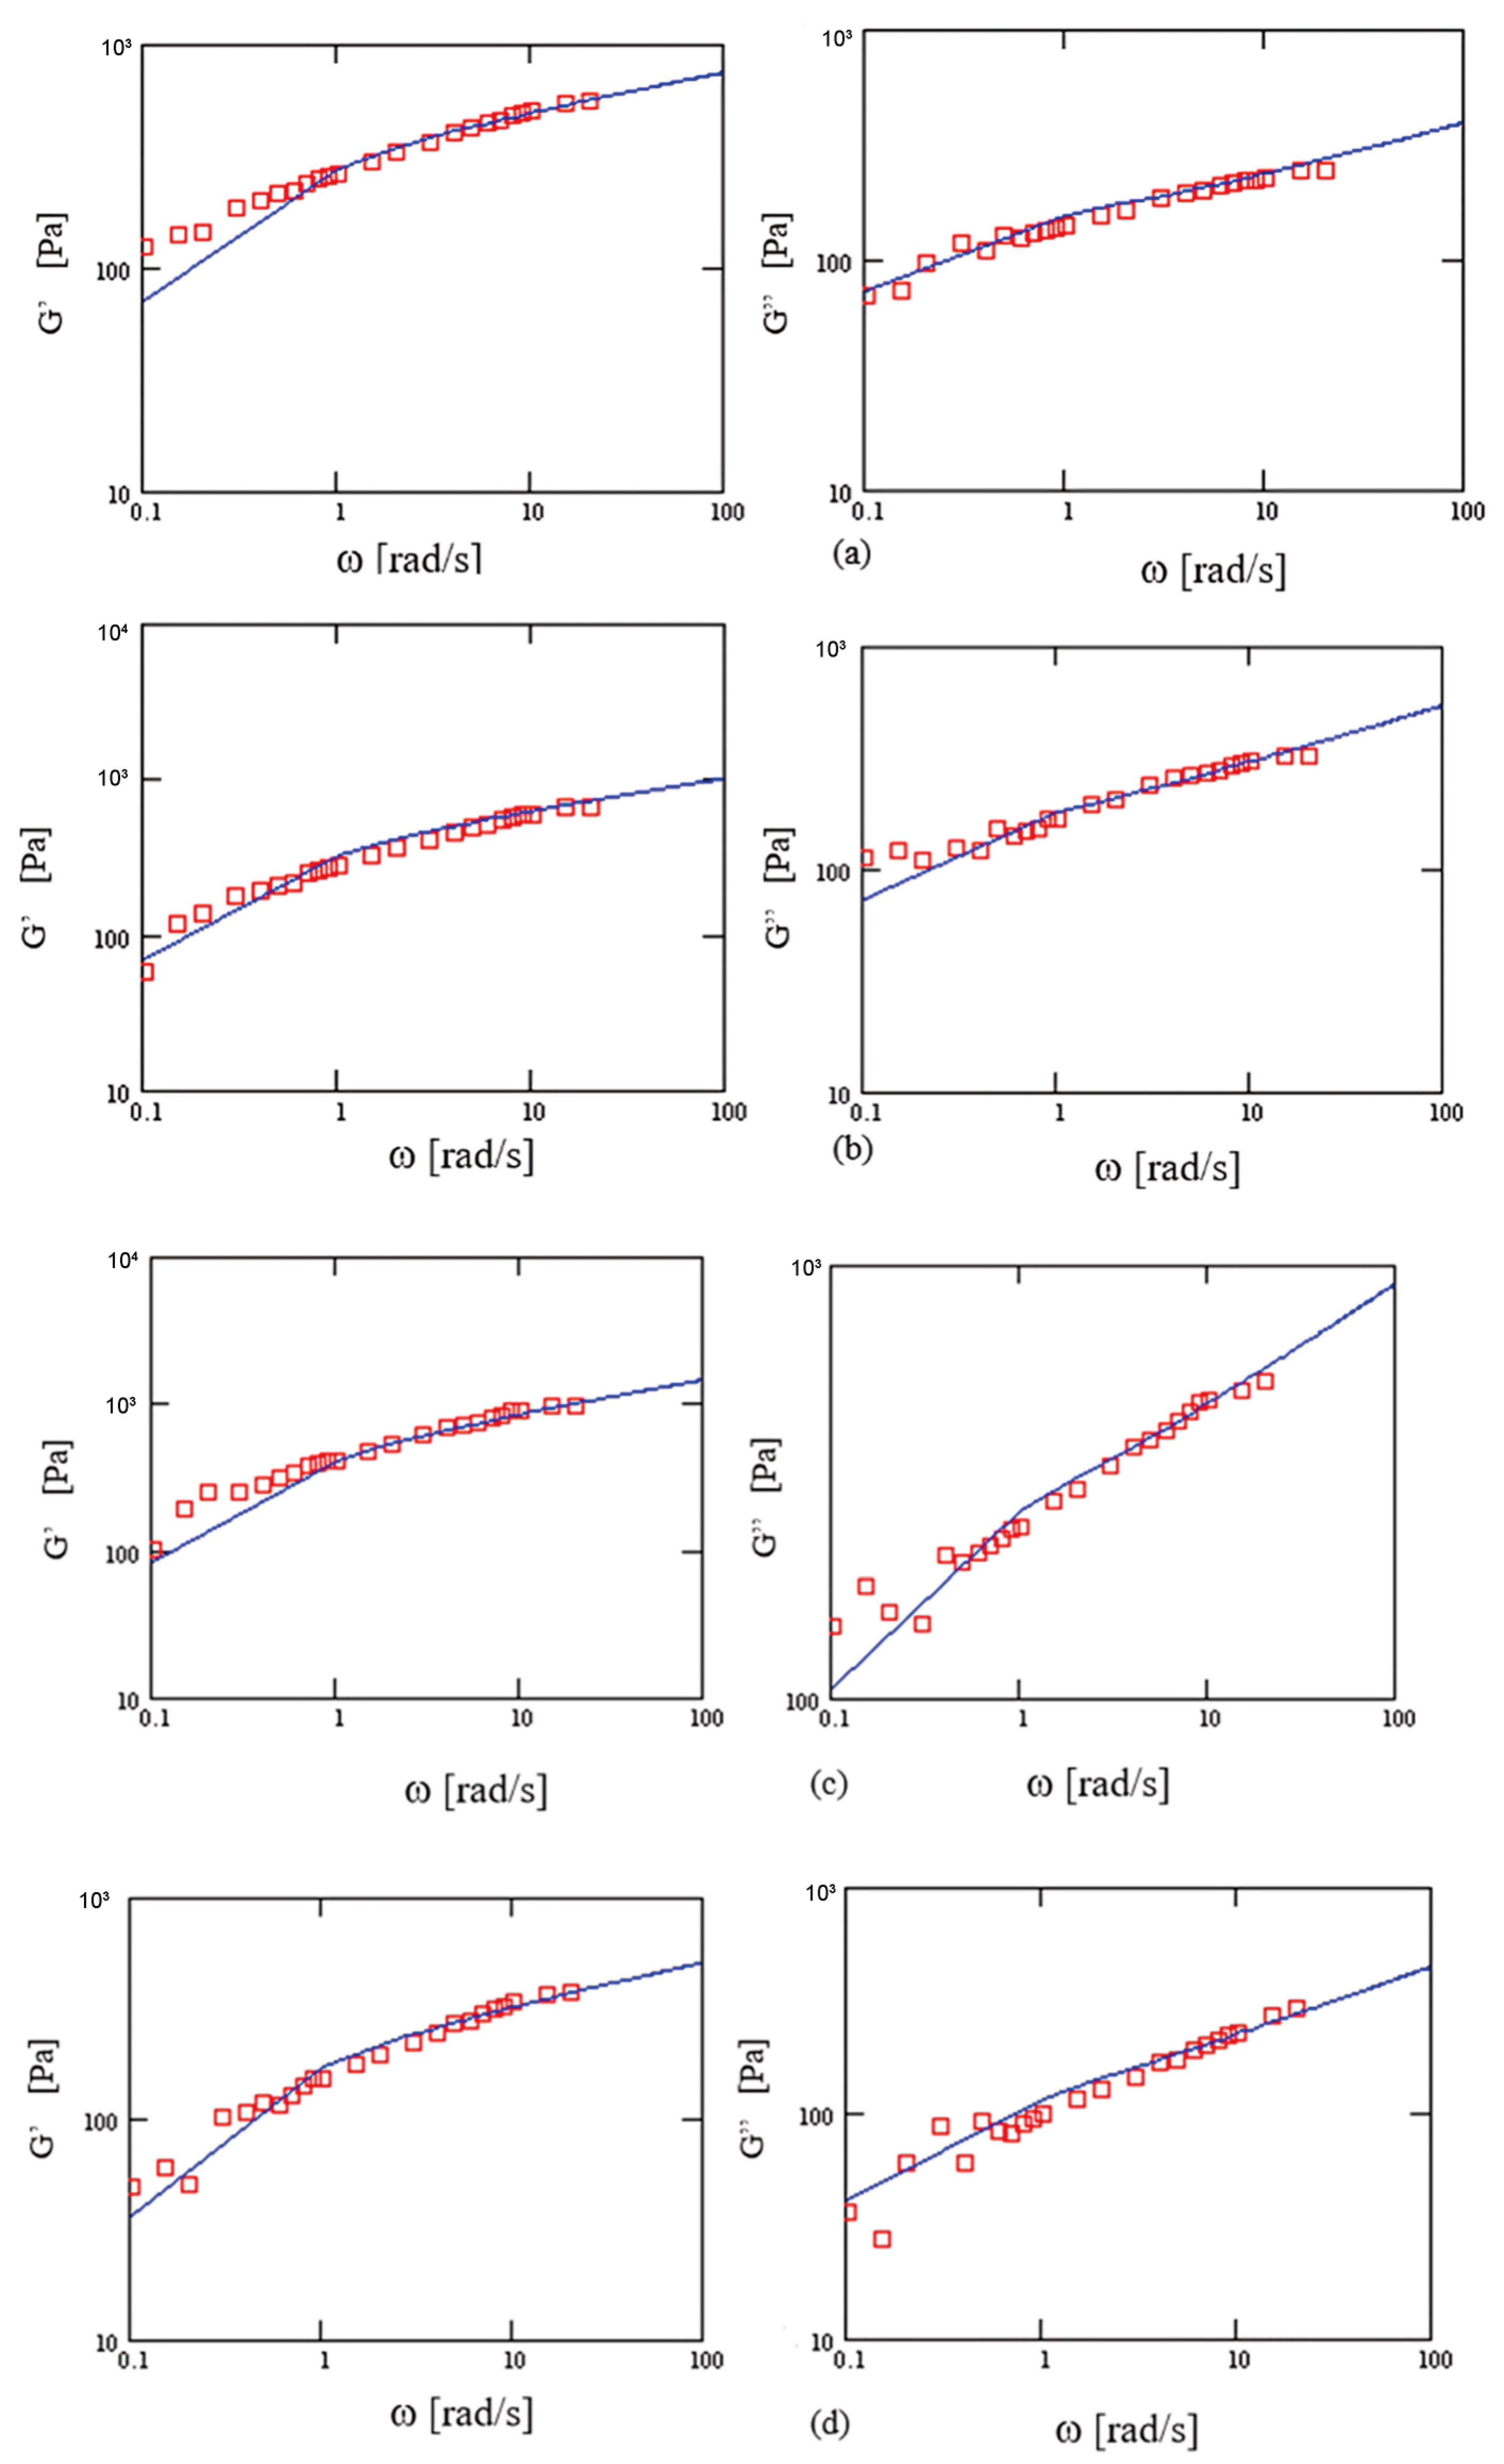
The viscoelastic materials are usually known to have infinite memory, meaning that their actual mechanical response is influenced by past material histories. Fractional calculus provides a natural framework for the description of the memory and hereditary properties of various materials and processes [16]. All fractional derivative models possess memory kernels of the form t−q, where 0 < q < 1. This is the main advantage of fractional derivatives in comparison with the classical integer-order models, where such effects are, in fact, neglected. In this work, the Friedrich–Braun model is used to describe the results of viscoelastic solutions of the Glucopone surfactant which was studied experimentally in the previous section. The compositions of the samples studied are given in Table 1. Figure 10a shows the dynamic moduli fitted in fractional term by using Equations (4) and (5) for storage and loss modulus of heptane system, respectively. It can be observed that the fractional model can closely match the experimental data for heptane sample of composition 1 using parameters ΔG = 260, λ = 5.38, q = 0.72, μ = 0.89. Many previous researchers have drawn the same conclusions; for example, Carrera et al. [29], Ramirez-Brewer et al. [30], and Rathinaraj et al. [31]. These authors also present graphical data showing that fractional models can accurately capture experimental data for viscoelastic solutions. Figure 10b–d show the fitting for using fractional model for experimental data of storage and loss modulus for octane, dodecane, and tetradecane systems, respectively. The fitting parameters for samples of composition 1 for the four systems of different types of hydrocarbons were reported in Table 3. As mentioned earlier, the basic fractional model parameters are q and μ, which are restricted to the range 0 < q, μ ≤ 1, and q < μ. There are good agreements between the theoretical predictions (solid lines) and experimental data (squares).
Similarly, Equations (4) and (5) were used to describe the experimental result of the sample of heptane system of composition 2. Figure 11a shows the dynamic moduli fitted in fractional term by using Equations (4) and (5) for storage and loss modulus of heptane system, respectively. It can be observed that the fractional model can closely match the experimental data for heptane sample of composition 2 using parameters ΔG = 100, λ = 7.53, q = 0.73, μ = 0.88. Figure 11b–d show the samples of octane, dodecane, and tetradecane systems of composition 2.
It can be said that fractional rheology successfully described the viscoelastic phenomena in Glucopone surfactant solutions. The model accurately describes the elastic modulus, G′(ω) and the viscous modulus, G″(ω) and good agreements between the experimental and theoretical results were achieved. The fitting parameters for samples of composition 2 are given in Table 4.
The results show that fractional viscoelastic models can accurately describe the rheological response of viscoelastic solutions of composition 1. It can be observed from Table 3 that ΔG, which quantifies the differences between the equilibrium modulus, Ge, and the plateau modulus, G∞, is increased with hydrocarbon chain length to be maximum for dodecane system (380 Pa). As hydrocarbon chain length further increased, the value of ΔG dropped to 160 Pa. In case of composition 2, similarly, ΔG is increased with hydrocarbon chain length up to maximum value for the dodecane sample (640 Pa) and then dropped for the tetradecane system (190 Pa). These results are in agreement with Figure 6 and Figure 7 where similar behavior can be observed for the elastic modulus, G′, of the samples of different types of hydrocarbons in the two systems considered. The characteristic time, λ which represents the time required for stress to restore to its original value, was found to decrease with the hydrocarbon chain length of the samples of both compositions. The fitted values of λ are comparable to the values of relaxation times, τ in Table 2.
5. Conclusions
In this work, it was possible to deduce the influence of the hydrocarbon types in the properties and rheological behaviors of the solutions of Glucopone surfactant. Generally, nthe critical strain decreased as the alkane chain lengths increased. The values of elastic modulus, G′, and the zero shear viscosity, η0, were maximum in case of the dodecane system. On the other hand, the tetradecane system showed the least values of G′ and η0. The dynamic properties of microemulsions solutions were characterized by the structural relaxation time, τ which ranged from 1.66 to 5 S. The relaxation times decreased as the alkane chain lengths of hydrocarbon increased. However, the opposite behavior of relaxation time was observed as the Glucopone concentration increased. According to Hoffman and Ebert [32], in systems with obvious viscoelastic behavior, the relaxation times can be as long as 10 s.
The fractional calculus approach in the constitutive relationship model of generalized Friedrich–Braun was introduced. The model accurately described the elastic modulus, G′(ω) and the viscous modulus, G″(ω) of the materials when the first-order derivatives were replaced by the fractional-order derivatives. The fractional Friedrich–Braun model was able to adequately describe the behaviors of viscoelastic solutions prepared using Glucopone surfactant for different hydrocarbons and different concentration as well. The advantage of fractional derivatives has become apparent in the description of rheological properties of materials as well as in modeling the mechanical and electrical properties of materials, and in many other fields.
Funding
This research received no external funding.
Institutional Review Board Statement
Not applicable.
Informed Consent Statement
Not applicable.
Data Availability Statement
All data are available upon request from the author.
Acknowledgments
The author would like to thank the School of Applied Physics, National University of Malaysia (UKM) for allowing the rheological measurements. The author also thanks Fakher Oueslati, Department of Physics, Al-Baha University for helping to improve graphs.
Conflicts of Interest
The author declares no conflicts of interest.
References
- Mahboob, A.; Kalam, S.; Kamal, M.S.; Hussain, S.S.; Solling, T. EOR Perspective of microemulsions: A review. J. Petrol. Sci. Eng. 2022, 208, 109312. [Google Scholar] [CrossRef]
- Ramos, D.M.; Sadtler, V.; Marchal, P.; Lemaitre, C.; Niepceron, F.; Benyahia, L.; Roques-Carmes, T. Particles’ Organization in Direct Oil-in-Water and Reverse Water-in-Oil Pickering Emulsions. Nanomaterials 2023, 13, 371. [Google Scholar] [CrossRef] [PubMed]
- Qu, J.; Wan, Y.; Tian, M.; Lv, W. Microemulsions Based on Diverse Surfactant Molecular Structure: Comparative Analysis and Mechanistic Study. Processes 2023, 11, 3409. [Google Scholar] [CrossRef]
- Hua, G. Review of the Microemulsion Flooding to Enhanced Oil Recovery. Shandong Chem. Ind. 2016, 9, 63–65. [Google Scholar]
- Wu, B.; Yang, C.; Xin, Q.; Kong, L.; Eggersdorfer, M.; Ruan, J.; Zhao, P.; Shan, J.; Liu, K.; Chen, D.; et al. Attractive Pickering Emulsion Gels. Adv. Mater. 2021, 33, 2102362. [Google Scholar] [CrossRef] [PubMed]
- Dai, X.; Zhang, J.; Bao, X.; Guo, Y.; Jin, Y.; Yang, C.; Zhang, H.; Liu, L.; Gao, Y.; Ye, C.; et al. Induction of Tumor Ferroptosis-Dependent Immunity via an Injectable Attractive Pickering Emulsion Gel. Adv. Mater. 2023, 35, e2303542. [Google Scholar] [CrossRef] [PubMed]
- Hematpur, H.; Abdollahi, R.; Safari-Beidokhti, M.; Esfandyari, H.; Yazdi, M. Experimental Microemulsion Flooding Study to Increase Low Viscosity Oil Recovery Using Glass Micromodel. Math. Probl. Eng. 2021, 2021, 5021868. [Google Scholar] [CrossRef]
- Siddig, M.A.; Radiman, S.; Jan, L.S.; Muniandy, S.V. Structure of cubic phases in ternary systems Glucopone/water/hydrocarbon. Colloids Surf. A Physicochem. Eng. Asp. 2004, 236, 57. [Google Scholar] [CrossRef]
- Veronico, L.; Colafemmina, G.; Gentile, L. Enhancing Oil-Uptake Efficiency with an Alkyl Polyglycoside–Dodecanol Formulation. Colloids Interfaces 2024, 8, 6. [Google Scholar] [CrossRef]
- Larry, D.R.; Kaler, E.W. Alkyl polyglucoside microemulsion phase behavior. Colloids Surf. A Physicochem. Eng. Asp. 2001, 176, 69. [Google Scholar]
- Ferrer, M.; Comelles, F.; Plou, F.J. Comparative surface activities of di-and trisaccharide fatty acid esters. Langmuir 2002, 18, 667. [Google Scholar] [CrossRef]
- Meral, F.C.; Royston, T.J.; Magin, R. Fractional calculus in viscoelasticity: An experimental study. Commun. Nonlinear Sci. Numer. Simul. 2010, 15, 939. [Google Scholar] [CrossRef]
- Caputo, M. Vibrations of an infinite viscoelastic layer with a dissipative memory. J. Acoust. Soc. Am. 1974, 56, 897–904. [Google Scholar] [CrossRef]
- Mathai, A.M.; Haubold, H.J. Fractional and Multivariable Calculus, Model Building and Optimization Problems; Springer International Publishing AG: Cham, Switzerland, 2017. [Google Scholar]
- Dalir, M.; Bashour, M. Applications of fractional calculus. Appl. Math. Sci. 2010, 4, 1021. [Google Scholar]
- Hilton, H.H. Generalized fractional derivative anisotropic viscoelastic characterization. Materials 2012, 5, 169. [Google Scholar] [CrossRef]
- Baleanu, D.; Diethelm, K.; Scalas, E.; Trujillo, J.J. Fractional Calculus: Models and Numerical Methods, 2nd ed.; World Scientific Publishing: London, UK, 2017. [Google Scholar]
- Bagley, R.L.; Torvik, P.J. A theoretical basis for the application of fractional calculus to viscoelasticity. J. Rheol. 1983, 27, 201. [Google Scholar] [CrossRef]
- Schiessel, H.; Blumen, A. Hierarchical analogues to fractional relaxation equations. J. Phys. A Math. Gen. 1993, 26, 5057. [Google Scholar] [CrossRef]
- Siddig, M.A.; Radiman, S.; Jan, L.S.; Muniandy, S.V. Rheological behaviours of the hexagonal and lamellar phases of glucopone (APG) surfactant. Colloids Surf. A Physicochem. Eng. Asp. 2006, 276, 15. [Google Scholar] [CrossRef]
- Scomoroscenco, C.; Teodorescu, M.; Nistor, C.L.; Gifu, I.C.; Petcu, C.; Banciu, D.D.; Banciu, A.; Cinteza, L.O. Preparation and In Vitro Characterization of Alkyl Polyglucoside-Based Microemulsion for Topical Administration of Curcumin. Pharmaceutics 2023, 15, 1420. [Google Scholar] [CrossRef]
- Abd Sisak, M.A.; Daik, R.; Ramli, S. Study on the effect of oil phase and co-surfactant on microemulsion systems. Malays. J. Anal. Sci. 2017, 21, 1409–1416. [Google Scholar]
- Torres, L.G.; Iturbe, R.; Snowden, M.J.; Chowdhry, B.Z.; Leharne, S.A. Preparation of o/w emulsions stabilized by solid particles and their characterization by oscillatory rheology. Colloids Surf. A Physicochem. Eng. Asp. 2007, 302, 439–448. [Google Scholar] [CrossRef]
- Numin, M.S.; Jumbri, K.; Ramli, A.; Borhan, N. Microemulsion Rheological Analysis of Alkaline, Surfactant, and Polymer in Oil-Water Interface. Processes 2020, 8, 762. [Google Scholar] [CrossRef]
- Bonfanti, A.; Kaplan, J.L.; Charras, G.; Kabla, A. Fractional viscoelastic models for power-law Materials. Soft Matter 2020, 16, 6002–6020. [Google Scholar] [CrossRef] [PubMed]
- Bagley, R.L. Power law and fractional calculus model of viscoelasticity. AIAA J. 1989, 27, 1412. [Google Scholar] [CrossRef]
- Friedrich, C. Rheological material functions for associating comb-shaped or H-shaped polymers A fractional calculus approach. Phil. Mag. Lett. 1992, 66, 287. [Google Scholar] [CrossRef]
- Friedrich, C.; Braun, H.; Weese, J. Determination of relaxation time spectra by analytical inversion using a linear viscoelastic model with fractional derivatives. J. Polym. Eng. Sci. 1995, 35, 1661. [Google Scholar] [CrossRef]
- Carrera, Y.; Avila-de la Rosa, G.; Vernon-Carter, E.J.; Alvarez-Ramirez, J. A fractional-order Maxwell model for non-Newtonian fluids. Phys. A 2017, 482, 276–285. [Google Scholar] [CrossRef]
- Ramirez-Brewer, D.; Danilo Montoya, O.; Useche Vivero, J.; García-Zapateiro, L. Characterization and Modeling of the Viscoelastic Behavior of Hydrocolloid-Based Films Using Classical and Fractional Rheological Models. Fluids 2021, 6, 418. [Google Scholar] [CrossRef]
- Rathinaraj, J.D.J.; McKinley, G.H.; Keshavarz, B. Incorporating Rheological Nonlinearity into Fractional Calculus Descriptions of Fractal Matter and Multi-Scale Complex Fluids. Fractal Fract. 2021, 5, 174. [Google Scholar] [CrossRef]
- Hoffman, H.; Ebert, G. Surfactants, micelles and fascinating phenomena. Angew. Chem. Int. Ed. Engl. 1988, 27, 902. [Google Scholar] [CrossRef]
Figure 1.
The elastic modulus, G′ as a function of strain for the sample of composition 1, (a) heptane, (b) octane, (c) dodecane, (d) tetradecane.
Figure 1.
The elastic modulus, G′ as a function of strain for the sample of composition 1, (a) heptane, (b) octane, (c) dodecane, (d) tetradecane.

Figure 2.
The elastic modulus, G′ as a function of strain for the sample of composition 2, (a) heptane, (b) octane, (c) dodecane, (d) tetradecane.
Figure 2.
The elastic modulus, G′ as a function of strain for the sample of composition 2, (a) heptane, (b) octane, (c) dodecane, (d) tetradecane.

Figure 3.
The elastic modulus, G′ and loss modulus, G″ as a function of angular frequency for the sample of composition 1, (a) heptane, (b) octane, (c) dodecane, (d) tetradecane.
Figure 3.
The elastic modulus, G′ and loss modulus, G″ as a function of angular frequency for the sample of composition 1, (a) heptane, (b) octane, (c) dodecane, (d) tetradecane.

Figure 4.
The elastic modulus, G′ and loss modulus, G″ as a function of angular frequency for the sample of composition 2, (a) heptane, (b) octane, (c) dodecane, (d) tetradecane.
Figure 4.
The elastic modulus, G′ and loss modulus, G″ as a function of angular frequency for the sample of composition 2, (a) heptane, (b) octane, (c) dodecane, (d) tetradecane.

Figure 5.
Zero shear viscosity, η0 and relaxation time, τ as a function of hydrocarbon for the two considered compositions: (a) η0 for composition 1; (b) η0 for composition 2; (c) τ for composition 1; (d) τ for composition 2.
Figure 5.
Zero shear viscosity, η0 and relaxation time, τ as a function of hydrocarbon for the two considered compositions: (a) η0 for composition 1; (b) η0 for composition 2; (c) τ for composition 1; (d) τ for composition 2.


Figure 6.
The elastic modulus, G′, as a function of angular frequency of composition 1 for different types of hydrocarbons.
Figure 6.
The elastic modulus, G′, as a function of angular frequency of composition 1 for different types of hydrocarbons.

Figure 7.
The elastic modulus, G′, as a function of angular frequency of composition 2 for different types of hydrocarbons.
Figure 7.
The elastic modulus, G′, as a function of angular frequency of composition 2 for different types of hydrocarbons.

Figure 8.
The complex viscosity, η* as a function of angular frequency of sample of composition 1 for different types of hydrocarbons.
Figure 8.
The complex viscosity, η* as a function of angular frequency of sample of composition 1 for different types of hydrocarbons.

Figure 9.
The complex viscosity, η* as a function of angular frequency of a sample of composition 2 for different types of hydrocarbons.
Figure 9.
The complex viscosity, η* as a function of angular frequency of a sample of composition 2 for different types of hydrocarbons.

Figure 10.
The storage modulus G′ and the loss modulus G″ as a function of frequency of composition 1 for (a) heptane, (b) octane, (c) dodecane, (d) tetradecane. The squares represent the experimental values for G′ and G″, respectively. The solid lines represent the fitted fractional viscoelastic model.

Figure 11.
The storage modulus G′ and the loss modulus G″ as a function of frequency of composition 2 for (a) heptane, (b) octane, (c) dodecane, (d) tetradecane. The squares represent the experimental values for G′ and G″, respectively. The solid lines represent the fitted fractional viscoelastic model.


Table 1.
Composition (by weight%) of the samples used in the rheological measurements.
| Composition | Glucopone % | Hydrocarbon % | Water % |
|---|---|---|---|
| 1 | 45.00 | 4.60 | 50.40 |
| 2 | 55.00 | 4.60 | 40.40 |
Table 2.
Relaxation time and viscosity of the samples of composition 1 and 2.
| Composition 1 | Composition 2 | |||
|---|---|---|---|---|
| Oil Type | Relaxation Time, τ/s | Viscosity, η0 Pa | Relaxation Time, τ/s | Viscosity, η0 Pa |
| Heptane | 5.00 | 300.00 ± 3.6 | 1.26 | 780.00 ± 8.4 |
| Octane | 2.50 | 250.00 ± 2.7 | 3.33 | 366.30 ± 6.3 |
| Dodecane | 2.00 | 1000.00 ± 8.3 | 5.00 | 1000.00 ± 11.8 |
| Tetradecane | 1.71 | 342.00 ± 3.8 | 1.66 | 149.40 ± 2.4 |
Table 3.
The fitting parameters of the Friedrich–Braun model for systems of composition 1.
| Heptane | Octane | Dodecane | Tetradecane | |||||
|---|---|---|---|---|---|---|---|---|
| Parameter | G′ | G″ | G′ | G″ | G′ | G″ | G′ | G″ |
| ΔG [Pa] | 260 | 260 | 300 | 300 | 380 | 380 | 160 | 160 |
| λ [s] | 5.38 | 5.38 | 2.81 | 2.81 | 2.89 | 2.89 | 1.71 | 1.71 |
| q | 0.72 | 0.66 | 0.72 | 0.64 | 0.71 | 0.68 | 0.74 | 0.64 |
| μ | 0.89 | 0.91 | 0.93 | 0.98 | 0.93 | 0.98 | 0.93 | 0.96 |
Table 4.
The fitting parameters of the Friedrich–Braun model for systems of composition 2.
| Heptane | Octane | Dodecane | Tetradecane | |||||
|---|---|---|---|---|---|---|---|---|
| Parameter | G′ | G″ | G′ | G″ | G′ | G″ | G′ | G″ |
| ΔG [Pa] | 100 | 100 | 280 | 280 | 640 | 640 | 190 | 190 |
| λ [s] | 7.53 | 7.53 | 4.64 | 4.64 | 5.53 | 5.53 | 2.2 | 2.2 |
| q | 0.73 | 0.72 | 0.66 | 0.64 | 0.67 | 0.66 | 0.65 | 0.63 |
| μ | 0.88 | 0.98 | 0.94 | 0.97 | 0.95 | 0.91 | 0.86 | 0.98 |
Disclaimer/Publisher’s Note: The statements, opinions and data contained in all publications are solely those of the individual author(s) and contributor(s) and not of MDPI and/or the editor(s). MDPI and/or the editor(s) disclaim responsibility for any injury to people or property resulting from any ideas, methods, instructions or products referred to in the content. |
© 2024 by the author. Licensee MDPI, Basel, Switzerland. This article is an open access article distributed under the terms and conditions of the Creative Commons Attribution (CC BY) license (https://creativecommons.org/licenses/by/4.0/).
Share and Cite
MDPI and ACS Style
Siddig, M.A. Rheological Behaviors and Fractional Viscoelastic Modeling of Glucopone (APG)/Water/Hydrocarbons Solutions. Colloids Interfaces 2024, 8, 27. https://doi.org/10.3390/colloids8030027
AMA Style
Siddig MA. Rheological Behaviors and Fractional Viscoelastic Modeling of Glucopone (APG)/Water/Hydrocarbons Solutions. Colloids and Interfaces. 2024; 8(3):27. https://doi.org/10.3390/colloids8030027
Chicago/Turabian StyleSiddig, Mohamed A. 2024. "Rheological Behaviors and Fractional Viscoelastic Modeling of Glucopone (APG)/Water/Hydrocarbons Solutions" Colloids and Interfaces 8, no. 3: 27. https://doi.org/10.3390/colloids8030027