
Update on the Scientific Status of the Plasma Focus

 , , ,
, , ,  , ,
, ,
Abstract
:1. Introduction
- The idea of the International Center for Dense Magnetized Plasmas (ICDMP) appeared in 1990 (Appendix B shows group photographs of the first meeting at Moscow).
- The ICDMP Project (including ICDMP basic concept, organization structure, financial requirements, and scientific program) was elaborated by the working group in the period 1991–1995.
- Proposals for locating the Center in various countries were considered: Italy (Ferrara University), Poland (INS and IPPLM), China, Romania, Argentina.
- The 28th UNESCO General Conference (on 7 November 1995) took note of the Draft Resolution 28 C/DR 291 on the creation of ICDMP, drafted by the ICDMP Steering Committee, which consisted of 16 members including authorized representatives of 8 governments (Argentina, Czech Republic, Singapore, South Korea, South Africa, Russia, Poland, and Spain).
- In 1997, members of the steering committee decided that the best place for locating ICDMP was IPPLM in Warsaw, because of the availability of the large PF-1000 device and modern diagnostic apparatus along with buildings, infrastructure and manpower.
- UNESCO Director General, Dr. Federico Mayor, visited plasma laboratories at IPPLM in Warsaw in 1998 and accepted the proposal of locating the ICDMP at IPPLM.
- On 24 August 1999, an official agreement was signed in Warsaw between the UNESCO Director General and President of the Polish Atomic Energy Agency. This document was the starting point for ICDMP activities at IPPLM in Warsaw. Director of IPPLM organized a separate group of workers assigned to the ICDMP (ICDMP research team) and according to the UNESCO recommendations created a foundation for financial support of the ICDMP, together with its council and board.
- The International Steering Committee, recognizing that it had successfully fulfilled its major task of selecting a site for the ICDMP, decided to end its mission as of 19 November 1999. The International Steering Committee also decided to form a new International Scientific Committee for Dense Magnetized Plasmas (ISC DMP), constituted by the former members of the International Steering Committee.
- The actual establishment of the International Center for Dense Magnetized Plasmas was formalized in the AGREEMENT between the International Scientific Committee for Dense Magnetized Plasmas and the Institute of Plasma Physics and Laser Microfusion “On the Establishment and Operation of the International Center for Dense Magnetised Plasmas” that was signed on October 17, 2000, by the Chairman of the ISCDMP and the Director of IPPLM.
- The stated aims of the ICDMP are:
- ○
- To carry out advanced fundamental investigations in the domain of a dense magnetized plasma.
- ○
- To realize research programs aimed at application of plasma technologies and utilization of soft- and hard X-ray, ions and neutrons emitted by a plasma in industry, medicine, biology, etc.
- ○
- To teach and train young scientific workers in performing experimental investigations with the use of modern and complex apparatus under the supervision of experienced scientists from various countries.
- -
- New facilities have come up.
- -
- New diagnostics have been deployed in a novel manner.
- -
- New experimental results have been reported.
- -
- New models have been developed.
- -
- New insights have been revealed.
- -
- New directions have been proposed in the utilization of plasma focus.
2. Summary of Scientific Status of PF as of 1994
2.1. Summary of Major Trends of Research 1961–1994
- At the beginning of CFR, three methods of generating fusion reactions were known: (1) bombardment of a target with a beam of accelerated ions, as in a Cockcroft–Walton machine. (2) generation and confinement of a hot, fusion-reactive plasma, as in the stars. (3) explosive release of fusion energy as in a hydrogen bomb. The first was dismissed with the following argument: an accelerated linear beam of ions bombarding a solid target would spend most of its energy in heating the target and too few fusion reactions would occur before eventual disassembly of the target, resulting in a net loss rather than gain of energy. Later in this review (see Section 8.5), this shall be referred to as the Fundamental Premise of Controlled Fusion Research and shall have significant implications. The second appeared to be promising provided the role of gravity in confining the hot, fusion-reactive plasma of the star could be played by magnetic field. The third could be considered as a viable CFR option only after the advent of high power lasers and particle beams and sophisticated computational resources for radiation hydrodynamics.
- The idea of confinement of a stream of ions and electrons by their own magnetic field was suggested by Bennett in 1934 [19] (the word “plasma”, although introduced by Langmuir in 1927, was not in common scientific use at that time). This was the only conceptual candidate for confining a hot plasma available to the scientific community at the beginning of CFR research in early 1950s. The only theoretical tools to deal with this concept were based on the theory of magneto hydro dynamics (MHD), developed primarily in the context of astrophysics (17,18). This theory dealt with charged particles moving in adiabatic orbits in the magnetic field generated by their own motion. MHD analysis revealed that the CFR goals of heating and confinement faced fundamental obstacles in the form of poor stability of the pressure equilibrium between the magnetic field and the plasma and loss of plasma through open ends [17,18]. MHD analysis also later guided the CFR community towards inventing workarounds in the form of complex magnetic field and plasma configurations with toroidal topology—an effort that continues to this date. The goal of this MHD-inspired-and-guided effort remains confinement of a thermal, sufficiently hot, fusion-reactive plasma for a sufficiently long time to achieve net energy gain.
- The observation of high fusion neutron yields ~1010 neutrons/pulse in the Filippov and Mather type devices and the poor neutron yield from linear z-pinches and its MHD-inspired derivatives were the main cause for the surge of interest in the PF in the 1960s and 1970s. Discovery of scaling of neutron yield, with the fourth power of current already mentioned by Mather in his much cited first review paper [2], was a major driver of this optimism. This interest was dampened by the conclusion that much of the neutron yield appeared to be produced by a linear beam along the axis, which went against the then prevailing consensus that only a confined thermal plasma could achieve breakeven. Coupled with the fact that the plasma focus effect could not be adequately explained in terms of a theory, the plasma focus lost its place in the list of viable candidates for CFR and got labeled as “a high intensity neutron source” [16].
- The only point still in favor of plasma focus was the scaling of neutron yield as 4th power of current over three decades of current that saw a record yield of more than 1012 neutrons per shot in 1973 [20]. When the Frascati 1 MJ focus failed to scale up, it was game over. This facility lost funding, its leadership migrated to the emerging consensus in favor of tokamak research and the facility was eventually dismantled, making way for another experiment, ending the era of optimism.
- Theoretical work, beginning in 1972, suggesting the possibility of miniaturizing the hydrogen bomb using temporally profiled shock waves [21,22] served as a major attraction to the fusion community. Theoretical work related to understanding magnetic confinement devices became a major undertaking in the 1970s and 1980s in contrast to plasma focus research, which had a bewildering variety of experimental results, none of which fitted any theoretical narrative that could be used to scale it up to a fusion reactor. This absence of a theoretical basis for PF physics, in contrast to a huge army of theoreticians working on inertial and magnetic confinement schemes, had a severe negative impact on the prospects of subsequent funding for large PF projects.
- The invention of lasers in the 1960s complemented efforts to understand the real phenomenology of plasma focus with some hopes of augmenting the plasma focus reaction rate by laser heating. It inspired Sylwester Kaliski, a prominent Polish scientist, member of Polish Academy of Sciences, of the military General Staff, and the Council of Ministers, to establish a scientific institute and a facility, known today as the Institute for Plasma Physics and Laser Microfusion (IPPLM) and PF-1000, respectively, where he hoped to enhance the fusion reaction rate of the plasma focus by injecting a powerful laser pulse. It also led to the deployment of advanced time-resolved imaging diagnostics (Schlieren, shadography, and interferometry), Faraday rotation diagnostics, and Thomson scattering. Development of gated micro-channel plate detectors also allowed for time resolved images using soft X-ray pinhole cameras. Significant insights into the complex phenomenology of PF were obtained by correlating these with neutron spectroscopy and ion measurements. However, constraints arising from the pressure of reporting progress to funding agencies probably prevented sustained follow up investigations. Instead of leading to well-researched scientific conclusions, this resulted in a few conference papers that merely reported ‘first impressions’ which were not followed up with detailed investigations and did not have much impact on later research. This will be further commented upon again in a later section (see Section 9.3).
- Smaller plasma focus groups concentrated efforts on developing skills in diagnostics and fundamental investigations, rather than building large facilities. Notable examples are:
- ○
- The group at Hoboken, USA, which did significant work on high spatial resolution fast image convertor photography and X-ray imaging, as well as reaction product analysis.
- ○
- Groups in Argentina and Germany, which did fundamental work on sheath formation, structure, and propagation.
- ○
- The group in Heidelberg, Germany, which carried out neutron pinhole imaging and light scattering experiments on multiple DPF installations.
- Large and small PF groups reacted to the decline in the popularity of PF research by suggesting and investigating probable causes of failure of neutron yield scaling and demonstrating applications of PF in various areas.
- The resurgence of interest in plasma focus after the 1990s can be seen as the direct result of the initiative by Sing Lee to design a simple low cost plasma fusion facility that could be operated by a small university group on a low budget and the financial support for this initiative from the International Center for Theoretical Physics, Trieste. This is described in detail in Section 3.3.1.1.
- There was a notable absence of any research program that was mandated to answer the fundamental questions related to plasma focus physics, in particular the question: why was the neutron yield 2–3 orders of magnitude more than the thermonuclear yield corresponding to experimentally determined plasma parameters?
2.2. The “Standard Narrative” about the Dense Plasma Focus
- A plasma sheath is initially formed as a surface discharge over the insulator.
- The initial plasma sheath gets detached from the insulator and gets accelerated by magnetic pressure, turns around the anode corner and moves towards the axis in a characteristic curved shape.
- The current flows behind the dense plasma sheath until it approaches the axis. The moving current layer acts as a time-varying inductance that increases as the plasma approaches the axis. A characteristic sharp dip in the current derivative signal and a spike in the voltage across the electrodes occur as the plasma reaches the axis.
- The sheath stagnates at the axis in a funnel-shaped formation whose stem gets compressed and heated.
- The compressed and heated plasma is a z-pinch equilibrium where the thermal pressure of the plasma trying to push it away from the axis is resisted by the magnetic pressure because of the plasma current flowing axially through the plasma stem that tends to push it towards the axis.
- The z-pinch equilibrium undergoes instability that suddenly decreases the plasma current which creates intense electric fields which accelerate ions which produce neutrons by a beam-target interaction.
- Until the stagnation, the radial and axial movement of the plasma has good azimuthal symmetry: a given coordinate is reached by the plasma at the same time, irrespective of the associated azimuthal coordinate .
2.3. Known Phenomenological Deviations from (or Additions to) the Standard Narrative
2.3.1. Ion Emission from the Plasma Focus
- Many experiments proved that PF facilities are powerful generators of pulsed ion streams. To estimate the total deuteron emission from PF discharges performed with a pure deuterium filling different diagnostic techniques were applied. Using deuteron reactions with a lithium target and a time-of-flight (ToF) method in a hybrid Filippov–Mather experiment, it was estimated that the total yield of fast deuterons with an average energy of about 1 MeV was about 1015 [23]. Using nuclear emulsions it was found that in the Filippov experiment [24] the yield was about 1013 deuterons per shot. In order to analyze the fast deuterons (>100 keV) the use was made of a magnetic analyzer and ToF method. It was shown that the energy spectrum of the emitted deuterons extended from about 70 keV to above 400 keV, and it could be described by an exponential function exp(-kEd). The total deuteron yield from a small 1-kJ PF device was estimated to reach even 1014. Using activation measurements of carbon foils it was found that a 76-kJ discharge [26] produced about 1015 deuterons of energy > 330 keV. Based on the foil-stack technique, it was shown that a larger 250-kJ PF device [28] was able to emit the fast deuterons of energy ranging above 6 MeV.
- Numerous PF experiments showed that the highest ion emission was recorded at pressures lower than that corresponding to the maximum fusion-neutron yield. This ion emission was usually peaked at the z-axis, but in many cases it showed a strong asymmetry [1,30]. The total deuteron yield depended on experimental conditions, i.e., energy delivered from the condenser bank, the initial pressure, etc. [25,36,43]. It was deduced that the fast neutrons from d-d fusion reactions in PF discharges were produced mainly by deuterons of energy (20–100) keV [32,42].
- Measurements performed with pinhole cameras equipped with nuclear track detectors proved that the fast deuterons are emitted in the form of numerous micro-beams originated from many micro-sources (probably of sub-millimeter dimensions) located inside and at the surface of the pinch column [30,31,36]. Ion pinhole images showed, usually, the central spot (containing numerous beam tracks) and a few ring-shaped images produced by many micro-beams [1,31]. The central spot was evidently formed by the deuterons emitted along the z-axis, while the ring-shaped images could be produced by the deuteron beams emitted at different angles to the z-axis and deflected by local magnetic fields. It was observed that the deuteron beams had durations of (2–8) ns [29,31] and could form intense bunches of the total power ranging from 1011 to 1012 W [1,29]. Some examples of the ion pinhole images and angular distributions of the fast deuterons are shown in Figure 1.
- It was also proved experimentally that heavy impurity and admixture ions could be accelerated to higher energies ranging between 10 and 15 MeV [34,36]. Such ions were recorded with pinhole cameras and filtered track detectors, as well as with a Thomson-type analyzer [34]. For highly ionized (Z > 4) impurity-ions the maximum Ei/Z ratio was about 1.8 MeV, while for lower-ionized (Z < 4) species this ratio amounted to (2–2.8) MeV. Mechanisms of the ion acceleration were not identified, but taking into account that the considered ions were emitted from sub-millimeter sources, it was estimated that they were accelerated by strong local electrical fields ranging even up to 50 MV/cm.
- In Filippov geometry, it was shown that evaporated anode material could be transported to the acceleration zone of the pinch and subjected to an intense electric field. Thus, with an aluminium insert at the center of the anode, Al ions with ionization multiplicity 5 to 9 and energy of several MeV were detected with an ion time-of-flight method [44]. With tantalum, multicharged Ta ions accelerated to ~100 MeV were detected [45].
- Many new data about the emission of fast ions from PF discharges have been collected in different experiments of energy ranging up to 1 MJ, and some characteristics concerning this emission have been verified, e.g., information about ion micro-beams and their bunches, information about a dependence of ion energy spectra on the operational conditions, the range of ion energies, etc.
- Contrary to statements in some early papers, it has been shown that plasma-current filaments (and their magnetic fields), which probably exist in each PF discharge, can strongly influence trajectories of the emitted ions (and electrons).
- Completely new results have been obtained from measurements of fast fusion-produced protons. It has been shown that such protons are emitted not only along the z-axis, but also at different angles, and their azimuthal distribution has usually a periodical character which can be explained by an influence of magnetic fields generated by the main current filaments. Energies of these protons, which extend from 3.2 MeV to above 4.0 MeV, have confirmed that the d-d fusion reactions are produced by energetic deuteron beams.
- Valuable results have also been obtained from studies of interactions of pulsed plasma-ion streams with different solid targets, e.g., materials of interest for fusion technology. An erosion caused by energetic ion beams and intense plasma streams has been investigated in various PF facilities, and at different conditions. In such studies, the chosen fast ions can reach the target first, and the main portion of energy is usually delivered later by a plasma stream, which does not penetrate the irradiated material very deeply (<10 nm), but can produce strong thermal effects (melting, evaporation) and form a shock wave penetrating through the sample volume.
- Time-resolved measurements of the ion emission have shown that the most energetic ions (e.g., deuterons of energy >1.3 MeV) can be emitted even above 10 ns before the current peculiarity (dI/dt dip), while lower energy ions (e.g., deuterons of energy about 600 keV) can be emitted even above 40 ns after that instant.
- Ion measurements performed behind the main collector plate of the PF-1000 facility (through an axial channel in the anode) have provided the first experimental evidence that some ion beams can be emitted also in the upstream direction (although their population is about two orders of magnitude smaller).
- A microscopic irreproducibility of the ion emission, as observed in many PF experiments, has confirmed a stochastic character of the formation of the fast ion (and electron) sources. It has also been confirmed that the most energetic ions (e.g., deuterons of energy exceeding 700 keV) are emitted from the pinch column (probably from individual plasmoids) and on the pinhole images they produce the central spot of tracks, while lower-energy ions are emitted from many local sources (probably from plasma lobules) formed in a plasma layer surrounding the pinch, and produce ring-shaped regions of tracks
2.3.2. Filaments and Hot Spots in the Plasma Focus
- (1)
- Existence and role of filaments
- (a)
- Filaments are stable structures embedded within the plasma current sheath, running mostly perpendicular to the azimuthal background magnetic field, but sometimes also in a spider-web fashion with azimuthal ribs connecting the radial spokes.
- (b)
- (c)
- (d)
- Based on the supposition that they are vortex structures containing mass flow and magnetic flux in opposite directions, their mutual annihilation is postulated to be responsible for the generation of micro-beams of energetic ions, which are recorded as clusters of tracks on solid-state nuclear track detectors (see Section 2.3.1). The main supporting evidences for this postulate are optical image convertor photographs (see Figure 14 and Figure 15), and their correlation with the fusion neutron emission.
- (2)
- Theoretical models of filaments
- (a)
- H. Alfven [131] assumed a force-free magnetic field and then concluded that it had to be confined to a finite radius. In this model the total current carried by a filament varies as cube-root of the axial electric field.
- (b)
- Furth, Killeen, and Rosenbluth [132] showed that in magnetized plasma regions where magnetic field changes direction (“current sheets with magnetic shear”), finite resistivity can lead to “bunching” of a current element leading to current filamentation.
- (c)
- V. Nardi [133] constructed a solution of the Vlasov equation, treating energy and components of the canonical momentum along the filament as constants of motion, and got explicit expressions for the electric and magnetic potentials. He also estimated a magnetic field along the filament axis and a flow approximately collinear with the magnetic field lines.
- (d)
- G. Marklund [134] described a model for filamentary plasma structures associated with force-free magnetic fields. In this model, a homogenous electric field parallel to the symmetry axis of the magnetic field creates a radially directed electric drift velocity . Recombination loss prevents accumulation of plasma in the central region, with the resulting neutrals streaming out across the magnetic field lines.
- (e)
- Auluck [135] suggested a model of the filament formation specifically for plasma focus discharges. In this model, a plasma sheath undergoes gravitational instability in the rundown phase with a wave-vector parallel to the ambient azimuthal magnetic field, creating an azimuthal modulation of density (visible in Figure 14). Efficient electron thermal conduction parallel to the azimuthal magnetic field would ensure that azimuthal gradients of the temperature would be smoothed out. The pressure gradients along the direction of propagation of a sheath and density modulation in the azimuthal direction create the source term for a magnetic field, as well as a fluid vorticity with alternating signs in the azimuthal direction.
- (f)
- Ferro-Fontan and Sicardi-Schifino [136] demonstrated the generation of kilogauss radial magnetic fields using the source term, but invoked an electro-thermal instability that creates azimuthal modulation of temperature, but not of density.
- (g)
- Haines and Marsh [137] showed that the Ohmic heating of electrons by a current parallel to a magnetic field leads to spatial oscillations in the electron temperature, number density, and current, with a scale length of ~c/ωpe (microscopic filamentation).
- (h)
- Trubnikov [138] described the formation of current filaments of an electron beam within plasma, and also discussed other mechanisms.
- (i)
- Di Vita [139] formulated a variational principle, which generalized several well-known results, e.g., Ginzburg-Landau superconductor theory, as well as Taylor’s and Turner’s plasma relaxation theories. He derived qualitative conclusions concerning filaments based on conjectures concerning the radiative collapse.
- (j)
- E.J. Lerner [140] suggested the minimum energy dissipation principle to explain filamentation phenomena. According to his opinion “A heated plasma moves into a cool plasma or neutral gas in a way that minimizes the total dissipation of energy. The two principal ways how energy is dissipated from the current sheath in a plasma focus device are through electrical resistance of the current moving through the sheath, and through hydrodynamic friction of the sheath moving through the background medium. Electrical resistance is minimized by an even distribution of current, but hydrodynamic friction is minimized by filamentation—the balance between the two processes determines if filamentation will occur.”.
- (k)
- Role of ionization processes in formation of filaments has been suggested in [123].
- (l)
- A model based on London current of superconductivity has been proposed in [141].
- demonstrate the existence of filaments in the axial, radial, and pinch phases using luminosity of the visible radiation and soft X-rays (many reports).
- show that the filaments are associated with density modulations recorded with Schlieren and shadowgraphy techniques and laser interferometry (4 reports).
- demonstrate that there exists a magnetic field component along the filament axis (1 report).
- show that their radial size is of the order of (1 report).
- demonstrate that they are spatially located within azimuthal corrugations of the plasma sheath (1 report).
- show some time correlation between neutron emission signals and image convertor pictures of the explosive destruction of filaments (1 report).
- Filaments in plasma focus are local concentrations of currents. Azimuthally distributed discrete erosion marks upon the anode faces [125] strongly suggest the formation of local current concentrations, but are not a direct evidence of current filaments (for example, they could be formed by arcing in the plasma afterglow).
- Filaments in plasma focus are local z-pinch Bennett equilibria. This apparently has its origin in a Russian language theory paper published in 1965 [142].
- Filaments in plasma focus undergo MHD instability and form virtual plasma diodes.
- (3)
- Existence and properties of hot-spots observed in soft X-ray images
- (a)
- Mather [143] suggested that the multiple hot-spots observed in filtered time-integrated X-ray pinhole pictures “resemble the m = 0 sausage-type instability of a pinched discharge”.
- (b)
- The neutron yield is not changed by argon doping of deuterium less than 3% (by pressure). The size and sharpness of the boundary of sub-millimeter features, as well as the texture of the softer X-ray emitting region surrounding them, is not changed by the addition of 0.5% Ar, but it increases the X-ray intensity by a factor ~3. This observation is interpreted as an indicator that the mechanism responsible for the generation of the hot spots remains the same with and without Ar doping [144].
- Fast X-ray scintillation detectors recorded as many peaks (of a temporal width ~10 ns) as the number of hot-spots [110].
- X-ray pinhole pictures showing a double column of hot-spots and multiple off-axis hot-spots at the same axial position are not consistent with the adiabatic compression and re-pinching scenario. This is taken to indicate that a single-channel description of the pinch column may not be a correct one, and that the plasma column may consist of multiple parallel filamentary channels of current flow [144].
- Increasing the thickness of beryllium filters on pinholes decreased the linear dimensions of the recorded hot-spots, but their shapes remained substantially unchanged [110].
- With pinhole diameters equal to (13–25) μm, the spatial fine structure of the recorded hot spots reached (50–100) μm (i.e., 20 times the grain size of the applied emulsion).
- (c)
- K.H. Schönbach and his co-workers from Aachen [145] demonstrated some correlation between time-integrated pinhole pictures and signals from plastic scintillation detectors (both having identical filters). Since the number of spots and number of pulses is identical, and the width of the X-ray pulse is 5–10 ns (as expected for the lifetime of the m = 0 neck), they assert that “The observed spot structures are m = 0 instabilities...”
- (d)
- A research report from Russia [146] mentions “sufficiently reproducible” observation of micropinches with pure deuterium filling (6 torr) with a special geometry where the insulator diameter was 55 mm and the anode diameter was 110 mm (see Section 7 (5)). This geometry produced “a number of successive pinches at intervals of fractions of microseconds”. The authors explain, “At the time of the first pinching, as a result of contact with the hot and dense plasma, the central part of the anode surface explodes and the partially ionized copper plasma spreads along the pinch axis with a velocity of 2–3 cm-μs−1. During the second (and subsequent) pinching a part of the discharge current flows through the region occupied by the metal plasma, which undergoes compression under radiative cooling conditions.” The smallest dimension of the dark spots on the film was determined to be ~10 μm. Spectral measurements with a mica spectrograph showed that the radiation from the recorded structures corresponded to Cu XX lines.
- (e)
- Koshelev et al. [147,148] were the first to report deliberate addition of heavy impurities in a plasma focus for producing few micron sized micropinches. The best results were obtained with a 2% addition of xenon to deuterium. Using a pinhole camera, a sequence of bright “hot spots” (up to 10 or more) was detected, grouped mainly along the axis of the system. A 0.5 mm, Be filter which cuts off the relatively soft component of radiation, showed that the “points” had a very sharp border and, most importantly, the size of all the “points” was the same and equal to twice the image of the pinhole aperture (0.6 mm). This indicated that the size of the radiating points was less than the pinhole. Since production of micron-sized holes with smooth edges is a rather complex technological procedure, and small diaphragms can also lead to a strong attenuation of the radiation flux, they designed a new kind of imaging camera with square pinholes having polished edges of size 0.5 mm × 0.5 mm in Ta plates of 0.1 mm thickness. Using the penumbral imaging method that measures the blurring of the image of a sharp edge, they could determine micropinch sizes down to 10 μm. Figure 21 shows an example.
- (f)
- Antsiferov et al. [150] determined density of micropinches from Ne—like ArXVII dielectronic satellites working with a mixture of D2, Ar and Xe. Electron density values for a 50-micron micropinch were estimated as ne~6 × 1022 cm−3, corresponding to the ion density ni~3 × 1021 cm−3 along with electron temperature of 0.7–1 keV. Assuming the average ion mass of the plasma to be close to deuterium, the scale length .
- (g)
- P Antsiferov and the Stuttgart team [151] have also investigated the formation of hot-spots and emission characteristics of plasma focus discharges at various gas conditions.
- (h)
- P. Choi and colleagues [152] reported studies on the dynamics of the hot spot formation in a 28 kJ, 60 kV, DPF78 plasma focus device at the Stuttgart University. The highlights of their report are as follows:
- They cited references indicating that reproducibility of hot-spots is improved by doping the H2 or D2 working gas with high-Z noble gases, but not with low-Z gases (N2 or Ne).
- The following diagnostic techniques were applied:
- -
- Single- and double-frame bright-field Schlieren photography with a nitrogen laser pumped Rhodamine 6G dye laser, which generated about 1-ns pulses with 8-ns delay between the two frames.
- -
- Silicon PIN diodes with collimators and a selection of X-ray absorption filters.
- -
- The axial and radial optical streak photography to look at the implosion dynamics.
- -
- A set of nine scintillator-photomultiplier detectors to observe the neutron emission.
- -
- A soft X-ray streak camera, using two pinholes covered with different spectral filters and forming images on an NE102A thin plastic scintillator, which was viewed by an optical streak camera equipped with an image intensifier.
- -
- An axially displaced radially resolved multi-pinhole (ADRRM) streak technique, which gave 2D image data with a continuous time evolution.
- -
- A large slit axially displaced radially resolved multi-pinhole (LSADRRM) streak technique, which provided 2D image data with a continuous time evolution (with added redundancy for the detection of hot-spots).
- -
- A simultaneous introduction of controlled amounts of Ne, Ar, and Kr, to study hot-spot evolution in different spectral bands, using composite multi-material X-ray filters.
- -
- All diagnostics had time markers providing a few ns accuracy in time-correlations.
- Their findings related to hotspots were as follows:
- -
- The first hot-spot occurs usually within 5 ns after the maximum compression and is followed by many others with few-ns intervals and at different axial locations.
- -
- All hot-spots are embedded within a 3-mm-diameter grossly stable pinch column that lasts usually for 30 ns.
- -
- The positions of the observed hot-spots are determined with ±1 mm accuracy, and their lifetimes are below 1 ns.
- -
- With the Ar doping, the recorded hotspots are about 1.5 mm in diameter and several mm in length.
- -
- The size and shape of a hot-spot depends almost entirely on the spectral region, in which it is observed.
- -
- Hot-spots are rarely recorded in Ne-doped discharges, although some Schlieren photographs show the necking and other local instabilities.
- -
- The number of observable hot-spots usually increases slightly with Z and with the impurity fraction.
- -
- There are no correlations between the number of hot-spots and the neutron yields.
- (i)
- H. Schmidt and co-workers [153] used two curved crystal spectrometers positioned side-on and end-on to study space-resolved X-ray spectra of hydrogen- and helium-like argon plasma from micro-pinches in the DPF78 device (28 kJ, 60 kV, 0.9 MA). Supporting diagnostics included a time-integrated filtered pinhole camera with an X-ray film, and a time-resolving filtered pinhole camera with a 10-channel PIN-diode array in its detection plane. A penumbral imaging technique was used to obtain the spatial dimensions of the hot-spots. Their main findings were as follows:
- Micro-pinches occur earlier near the anode, than at more distant positions.
- Usually two to four micro-pinches appear in a discharge during a time up to 50 ns.
- Hot-spot durations of 200–400 ps were measured using an X-ray streak camera.
- A comparison of the observed and simulated spectral line profiles indicated a good fit for a temperature of ~900 eV and density ~9 × 1021 cm−3.
- A penumbral imaging method applied to space-resolved spectra indicated hot-spots dimensions ranging from 150 to 370 μm.
- The measured Doppler shifts between lines of the adjacent micro-pinches ranged up to 8 mÅ and corresponded to axial velocities of about 6 × 10⁵ m/s.
- The Doppler shifts (up to 4 mÅ) from the radially observed spectra were always in a direction which corresponded to radially-outward moving micro-pinches.
- (j)
- The Düsseldorf group [119,154,155] investigated spatial-, temporal-, and spectral-features of micro-pinches in the SPEED-II facility with a 4-frame gated MCP camera and curved crystal spectrometer with a deuterium plasma focus collapsing on an argon cloud. They reported:
- “...necking is a necessary condition for micropinches to be actuated, but not a sufficient one for them to occur”, “...only the brightest neckings result in micropinches, whereas diffuse ones often fail to produce them” [119].
- “There is no correlation between electron, ion (neutron) and X-ray production” [119].
- A comparison between the measured and simulated spectra indicated in the micro-pinches a density of ~1029 m−3 and a temperature of about 1–1.5 keV [154].
- (k)
- Hotspot formation was studied in a small 3.8 kJ plasma focus device operating in hydrogen–argon mixtures (5%, 10%, 20% Ar), at pressures from below 0.2 torr upward at the Pontifical Catholic University of Chile [156]. A combination of multi-pinhole and slit-wire X-ray photography was used to measure the size and temperature of the hotspots, over a range of pressure and gas mixing ratios. Filtered p-i-n diodes and a scintillator detector were used to investigate the time evolution of the hotspots. Typical size for the hottest emitting region, at temperatures between 200 and 400 eV, was found to be around 150 μm, with a typical duration of the order of 10 ns. The temperature in the final phase of the time evolution of the hotspots reached values nearly twice those of the plasma column where they were formed. Calculations using three different complementary codes (XRAYFIL, RATION, and FLY) to analyze the X-ray emission, assuming full ionization of a 20% argon content plasma, indicated that a significant fraction of the radiation is emitted in the 3.2 keV to 3.88 keV region, corresponding to Kα emission from highly ionized argon [157]. In addition, the particle inventory in a column of the same diameter as the anode results in a maximum plasma line density of 9.5 × 1016 cm−1. This value further supports the estimation of a plasma line density at maximum compression of around 1016 cm−1, i.e., of the order of one-tenth of the maximum attainable from the initial particle inventory in the cylindrical volume above the anode. With the lower estimated value of the plasma line density, the mean electron density in a 115 µm diameter hotspot is estimated at ∼1.3 × 1020 cm−3, if the dominant ionization state for the argon ions is taken to be H-like, as suggested by a calculation with FLY, for a 300 eV, 1020 cm−3 argon–hydrogen plasma [157].
- (4)
- Existence and properties of super-dense plasma domains
- (a)
- In a 7 kJ, 17 kV plasma focus at Stevens Institute of Technology, Hoboken, USA, 15 thin walled Geiger–Muller (GM) counters were arranged inside the vacuum chamber in the space above the anode [158]. Their output was recorded with a computer. The radioactive decay curves were fitted to identify various half-lives, and hence the radioactive nuclides. The counters were covered with a metal foil (Al of 0.254 mm in thickness or Cu of 0.127 mm in thickness). The plasma focus was operated with a pure D2 and a mixture D2(90%) + O2(10%) or D2 (50%) + 3He(50%). The following nuclear reactions produced radioactivity:
- 27Al(d,p)28Al (Ethresh~1.8 MeV), T1/2~2.4 min (by D+ beams from plasma with E > Ethresh).
- 65Cu(d,p)66Cu (Ethresh~2 MeV), T1/2~5.1 min (by D+ beams from plasma with E > Ethresh).
- 16O(d,n)17F (Ethresh~2 MeV), T1/2~1.1 min (when 17F is implanted in a Cu foil).
- 63Cu(p,n)63Zn (Ethresh~5 MeV), T1/2~38.1 min. This reaction would be caused by 14.7 MeV protons from the 3He(d,p)4He fusion reaction with a 3He admixture.
- The observed azimuthal asymmetry in the production of radioactivity was consistent with localized PDERs displaced by (3–5) cm from the axis of symmetry.
- A comparison of radioactivity produced by D+ beams in 16O(d,n)17F reactions to the total radioactivity from the same PDER enabled estimation of a lower bound on the density of the PDER, which was ~7 × 1021 cm−3.
- (b)
- A re-analysis of the neutron activation and nuclear emulsion data from Frascati [159] has led to an estimation of the triton burnup fraction R from pure deuterium discharges. This fraction was defined as the ratio of space and time integrated yields of 14.1-MeV and 2.45-MeV neutrons. The 14-MeV neutrons arise from D(t,n)4He fusion reactions between 1-MeV tritons produced in the D(d,p)T reaction and deuterium plasma. The cross-section for the D(t,n)4He fusion reaction has a resonance peak at 160 keV, which is 13 times higher than that at the initial energy (1.1 MeV) of the triton. The plasma density and temperature in the immediate vicinity of the point of origin of the triton play a crucial role in defining the slowing down environment of the triton and directly affect the triton burnup ratio R. A detailed description of the definition, measurement, error analysis, computer simulation, and theoretical modeling of the triton burnup ratio led to the following conclusions:
- For the Frascati Plasma Focus working at 500 kJ the space and time integrated neutron yield ratio R for 14.1- and 2.45-MeV neutrons was in the range 1 × 10⁻³ < R < 4 × 10⁻³.
- This value of R could consistently be explained only if the tritons were generated and trapped within plasma domains of a high density in the range of 1021 to 1022 cm−3, a temperature in the range of 1 keV to 5 keV, and trapping time amounting to 5–20 ns.
- (5)
- Other miscellaneous indications of plasma micro-structures
- (6)
- Significance of plasma filaments and micro-structures
2.4. Experimental Findings That Were Ignored but Are Found Relevant in Hindsight
2.4.1. Existence of a Spontaneous Axial Magnetic Field Component
2.4.2. Aspects of Neutron Emission Not Conforming to the Standard Narrative
- In POSEIDON plasma focus, the neutron emission routinely began ~80 ns before maximum compression. A similar phenomenon was observed in SPEED-II plasma focus at Düsseldorf [177] with neutron emission beginning 30 ns before maximum compression. Figure 9 of [118] shows that, even in Frascati, the neutron emission began before the maximum compression.
- Bernstein and Comisar [178] mention having measured neutrons having energy as high as 3 MeV in the backward direction in 1967. This was a clear hint that the instability induced axial ion acceleration idea was flawed. However, this was confirmed by other authors only after the turn of the century, as discussed later.
- Neutron time-of-flight spectra were measured in 1975 in the Limeil plasma focus [179] using a flight path of 120 m and large volume plastic scintillator detectors were used at 0° and 90°, simultaneously, to attain better than 0.1 MeV energy resolution. It was shown that the side-on neutron spectrum had much higher width than the end-on spectrum and both were centered at 2.45 MeV. This indicated that most of the neutron emission was by deuterons streaming perpendicular to the axis.
- Side-on neutron time-of-flight measurements in 1978 by Milanese and Pouzo on the 1 MJ Frascati facility with 128 m flight path, revealed [180] two lateral sub-peaks on either side of a central peak in the neutron energy spectrum which could only be explained in terms of loops of 100-keV deuterons in the plane determined by the device axis and the direction of observation.
- Time resolved neutron emission anisotropy measurements on POSEIDON in 1983 showed [183] that anisotropy of neutron emission was less than and greater than 1 before and after the instability, respectively, particularly in high neutron yield shots.
2.4.3. Aspects of Plasma Dynamics Not Conforming to the Standard Narrative
3. Major Developments around the World between 1994 and 2020
3.1. Facilities
3.1.1. The UNU ICTP Plasma Fusion Facility (PFF)
3.1.2. PF-1000
- -
- The charging voltage—U0 = 20–40 kV.
- -
- The condenser bank capacitance—C0 = 1.332 mF (12 modules each with 24 units of 4.625 μF).
- -
- The stored capacitor bank energy—E0 = 266–1064 kJ.
- -
- The nominal inductance—L0 = 8.9 nH.
- -
- The quarter discharge time—T1/4 = 5.4 μs.
- -
- The short-circuit current—ISC = 15 MA.
- -
- The characteristic impedance—Z0 = 2.6 mΩ.
- -
- Anode: copper tube of 230 mm in diameter.
- -
- Cathode: 12 stainless-steel tubes, each 82 mm diameter, on 400 mm diameter.
- -
- Insulator: Alumina.
- -
- Stainless steel vacuum chamber 1.4 m diameter × 2.5 m length with neoprene seals.
- -
- Oil diffusion vacuum pump with anti-creep liquid N2 traps.
- This is the only mega Joule level plasma focus facility with a horizontal axis with a 85 m clear distance behind the anode (where Sylwester Kaliski wanted to place his laser to interact with the plasma focus). This allowed high resolution measurements of neutron time of flight spectra in upstream (~84 m), downstream (~84 m), and radial (~7 m) directions [86].
- Large dimensions of coaxial electrodes ensure the formation of a big plasma column about 10 cm in length and 1 cm diameter. Electron density ~1024–1025 m−3, transparent for interferometry in the visible radiation and plasma characteristic velocity ~(1–2) × 105 m/s, facilitate refractivity diagnostic measurements with ns-temporal and mm-spatial resolutions.
- In the year 2000, this facility was placed at the disposal of the International Center for Dense Magnetized Plasma, with an explicit mandate “to carry out the advanced fundamental investigations in the domain of a dense magnetized plasma” making it the only MJ level plasma focus facility in the world to be explicitly linked with open-ended fundamental investigations.
3.1.3. PF-24
3.1.4. Gemini and other NSTec PF Facilities
3.1.5. Programs and Facilities at Lawrenceville Plasma Physics Inc.
3.1.6. PF-3 Facility
- ✓
- Dynamics of plasma focus discharge in heavy gases at high level of power input.
- ✓
- X-ray radiation of high-current neon pinch and its interaction with matter.
- ✓
- Acceleration of heavy ions.
- ✓
- Axial plasma jet studies. Experimental simulation of collisionless shock waves.
- ✓
- Usage of PF as a driver for magnetic compression of liners.
- ✓
- Experiments with dust plasma.
- ✓
- New approaches to nanofilm production.
- ✓
- Experimental simulation of astrophysical processes.
3.2. Diagnostics
3.2.1. 16-Frame Interferometry
3.2.2. Magnetic and Magneto-Optical Probes
3.2.3. Dynamic Inductance Measurement
3.2.4. Double Wollaston Prism Laser Differential Interferometer
3.2.5. Coded Aperture Imaging of Fusion Protons
3.2.6. Quasi-Average Neutron Energy Measurement Using Zirconium and Beryllium Pair Activation Detectors
3.2.7. Digital Interferometry
3.2.8. Low Neutron Yield Detection
3.2.9. Plasma Sheath Dynamics Using Non-Invasive Optical Sensors
3.2.10. UHF Radiation
3.2.11. Hard X-ray Characterization for Radiographic Applications
3.3. Simple Models, Numerical Simulations, and Empirical and Analytical Insights
3.3.1. Simple Models
3.3.1.1. Lee Model
3.3.1.2. Resistive Gratton-Vargas (RGV) Model
- Assumptions and inputs:
- ○
- Plasma shape: The Lee model assumes the plasma to be a thin annular disc in the axial phase and a straight circular cylinder in the radial phase, although, the curved shape of the sheath is well known. The RGV model calculates an imaginary 3D surface of rotation that bears a resemblance to the curved shape of the sheath in both the axial and radial phases [315].
- ○
- Plasma thickness: The Lee model utilizes the slug model of Potter [249] to calculate the thickness of the plasma cylinder in the radial phase as a function of time. The RGV model deals with a 3D surface of revolution co-located with the plasma sheath and has no plasma (so there is no question of a ‘thickness’).
- ○
- Device geometry: The Lee model does not include the insulator length and takes into account an effective length of the anode. In the RGV model, the insulator length, insulator outer radius, and anode length (all normalized to the anode radius) enter the formula for the dimensionless dynamic inductance explicitly.
- ○
- Operating parameters: The Lee model works with the experimental values of gas fill pressure (along with atomic number and atomic weight of the gaseous species) and “measured” static inductance and resistance, usually determined from the current waveform of a high-fill-pressure discharge, where the plasma is expected to remain at the insulator for the duration of the discharge. These values may however be tweaked slightly in practice on account of possible errors of measurement. The RGV model treats the operating pressure, static inductance and resistance as adjustable parameters on the ground that (1) the actual mass density of plasma during discharge may be different from that corresponding to the fill gas pressure because of release of surface-adsorbed gas during the discharge, and (2) the definitions of static inductance and resistance used in the model correspond to that calculated from a discharge in which a metallic sleeve snug-fitted over the insulator shorts the anode and the cathode, which is never actually performed.
- ○
- Snowplow hypothesis: The Lee model invokes the snowplow hypothesis that the sheath carries the mass of gas encountered during propagation but modifies it by introducing ‘mass fraction’ and ‘current fraction’ that participate in the snowplow process that are adjustable parameters chosen by an iterative procedure. These fractions are different for the axial and radial phases. The RGV model formulates the snowplow hypothesis as an equality between magnetic pressure and “wind pressure” of the gas that sticks to the sheath without bouncing away or sliding off.
- Physics and Philosophy:
- ○
- The Lee model invokes physical laws, phenomena and models such as Newton’s second law, first law of thermodynamics, shock dynamics, slug model [249], pinch effect, thermodynamics including radiation loss, anomalous resistivity, and circuit theory to set up a system of coupled ordinary differential equations. It thus has a reasonable expectation that its results should correspond to the experimental reality. The RGV model has no in-built physics other than an assumption of equality between the magnetic pressure of azimuthal magnetic field driving the plasma and the “wind pressure” resisting its motion that operates at an imaginary surface that plays a role similar to the imaginary center of mass in mechanics. This assumption superficially looks like the planar steady strong shock jump condition with an infinite number of degrees of freedom but must be treated as an independent assumption in view of the fact that it is being applied to a non-planar, non-steady plasma flow for which curvature effects on momentum transport and shock wavelet merging effects are known to play a significant role. It must, therefore, be treated as a postulate. It also uses the circuit equation. There is no á priori basis to expect the results of RGV model to agree with experiments.
- ○
- The Lee model uses the hypothesis of a virtual-plasma-diode beam-target mechanism [10] to calculate the neutron yield and calibrates the calculated numbers against experimental data. In a similar manner, it calculates soft X-ray, ion, and electron emission from devices operating with various gases. The RGV model, on the other hand, strongly emphasizes absence of any physics other than the snowplow hypothesis. Its ability to fit experimental current is conjectured to imply insensitivity of current waveforms to details of plasma phenomena, such as atomic physics of ionization and recombination, anisotropic transport of heat and electricity, interaction with electrodes, etc., which are well-represented in MHD codes (see Section 3.3.2.1). It specifically refuses to predict any plasma properties because its structure does not include a plasma. It can, however, be used to provide a mathematical framework for constructing a first-principles theory of plasma focus sheath propagation based on conservation of mass, momentum, and energy, and perhaps other physical principles [171,316]. It can also be used for construction of algorithms that optimize energy transfer efficiency as a function of device parameters [317,318].
- Mathematical tools:
- ○
- The Lee model is formulated in terms of a system of ordinary differential equations that couple the circuit equation and the equation of motion, whose solution is obtained as a table of numbers. The inductance of the moving plasma is calculated at each step during the calculation, which uses geometrical as well as operational parameters. The RGV model is formulated as a two-dimensional partial differential equation of Jacobi type describing the shape and position of a 3D surface of rotation co-located with the plasma sheath (the GV surface) as a function of . Its solution, obtained in an algebraic form, depends only on the scaled geometry of the device and has no relation with operational parameters, such as voltage, inductance, capacitance, resistance, gas fill pressure, and gas species or of the geometrical scale represented by the anode radius. The dimensionless inductanceas a function of is calculated from a formula and is the same for all devices that have the same scaled geometry. The current waveform can be obtained as a closed-form algebraic expression to the zeroth order of a small parameter representing ratio of resistance to impedance of the circuit. Fractions of energy remaining in the capacitor and converted into magnetic energy can also be expressed as algebraic expressions.
3.3.1.3. PLADEMA Model
3.3.1.4. Finite-Elements Numerical Model of the Current-Sheet Movement
3.3.2. Numerical Simulations
3.3.2.1. Fluid Simulations
- Dychenko and Imshennik (1969) [322] considered only the hydrodynamic aspect of the two-dimensional flow of plasma in the radial phase by assuming infinite conductivity which excludes magnetic field from the plasma. The dimensionless current is fitted to the experimental waveform in the radial phase as a linear expression in time. Although the numerical simulation is inconclusive with respect to neutron emission, it emphasizes the role of axial mass outflow in heating the plasma.
- Potter (1971) [323] formulated the first self-consistent 2D MHD code based on the explicit time step Lax–Wendroff method for the plasma focus including the Hall effect, finite ion Larmor radius effects, thermal and electrical conductivity, that coupled the plasma propagation with an external LC circuit. The characteristic shape of the plasma during the axial and radial phases was reproduced along with its density and temperature structure. Agreement between calculated sheath velocity with the expression for sheath velocity given by the snowplow model of Rosenbluth and Garwin [2] proportional to square root of applied electric field and inversely proportional to fourth root of mass density of gas was used as the test of correctness of the numerical procedure. The calculation finds that in the pinch zone ion–ion collision times ~20 ns are of the same order as the hydrodynamic time scale and ion Larmor radius is of the same order as the plasma scale length ~1 mm so that applicability of the fluid model is doubtful.
- Maxon and Eddleman (1977) [324] also report on 2D MHD calculations based on Eulerian mesh. They have run Potter’s problem and find significantly different results. In particular, they find that the sheath velocity agrees very well with the snowplow hypothesis that equates the wind pressure with the magnetic pressure (see Section 3.3.1.2). Current waveform is underestimated by about 10%. They also note non-applicability of the fluid model at the rear of the plasma sheath where gradients are large, mean free paths are large and magnetic field varies rapidly.
- Behler and Bruhns (1987) [325] report on a variation of Potter’s 2D MHD code by including the neutral gas as the third species. Joule heating, energy exchange between ions, electrons and neutrals, losses by bremsstrahlung, ionization and recombination kinetics, heating by viscosity of individual species are taken into account. Molecular and atomic physics processes are restricted to impact ionization from the ground state, radiative recombination, three-body Auger recombination, and charge exchange. The main focus of their investigation is the residual neutral gas remaining near the insulator in the inverse pinch and lift-off stages.
- Stepniewski (2004) [326] reports a gridless, fully dissipative MHD code with Braginskii transport coefficients, that accounts for kinetics of ionization. Only qualitative agreement with experiments is reported.
- Garanin and Mamyshev (2008) [327] report a 2D MHD code with implicit difference scheme. In this scheme, “...the ion-velocity components are calculated using a scheme that is implicit with respect to terms comprising the magnetic field. Such a scheme makes it possible to eliminate the constraint imposed by the magnetic sound speed on the computational time step and to significantly reduce the effect of the fictitious “vacuum” density on the plasma dynamics”. This allows the code “... to perform simulations at plasma densities of about six orders of magnitude lower than the initial density, while keeping the computational time step at a reasonable level”. Their code calculates (1) standard hydrodynamic quantities (ion velocity, ion density, magnetic field, ion and electron energies), and the degrees of ionization, (2) electron and ion thermal conductivities, energy exchange between electrons and ions, heat transport, (3) Hall effect, (4) neutron generation rate, and (5) radiation losses. They demonstrate good agreement between calculated and measured current derivative and voltage waveforms for one Filippov type PF, one Mather type PF, and one spherical PF on both sides of the dip for “... some operating regimes”. They also present a novel ion acceleration model that they use to compute neutron emission rate, which is within a factor 2 of the measured neutron yield.
- Kueny, Flicker, and Rose (2009) [328] present simulations of 3 PF devices using the ALEGRA-HEDP code. The following quote from this report describes the capabilities “ALEGRA-HEDP is a 2D/3D ALE (Arbitrary Eulerian-Lagrangian) code featuring coupled, operator-split models for hydrodynamics, magnetics, thermal conduction, and radiation physics. multi-material, multiphase equation-of-state (EOS) models. material strength and fracture models. MHD including advanced thermal/electrical conductivity and lumped circuit models. two-temperature physics (separate ion and electron temperatures). emission, multi-group diffusion and implicit Monte-Carlo for radiation modeling. neutron yield and time-of-flight diagnostics. and a very full complement of output diagnostics. The ALEGRA code family runs both in serial and massively parallel mode on a wide variety of platforms, and has been successfully used to model a wide variety of experiments with high fidelity in both two and three dimensions”. They report current waveforms and neutron emission until the code stops because of convergence failure. The calculated peak currents were in good agreement with experiments. However, the circuit inductance and resistance values were conveniently chosen, not measured.
- Meehan and Niederhaus (2014) [329] report on “Fully Three-dimensional Simulation and Modeling of a Dense Plasma Focus”. The report compares 2D and 3D calculations of current waveforms with experimental waveforms and finds that they do not match with respect to the rundown time and the peak current. Tweaking the 2D calculation by increasing the series inductance from 25 nH to 28.2 nH gave a better match with rundown time but not with peak current.
- Liu et al. (2016) describe plasma focus simulation with a particle-in-cell code LSP, where “[t]he discharge is simulated in two phases: an MHD fluid phase followed by a fully kinetic phase”. “The plasma is initiated as a MHD fluid to reduce computational time. When the plasma has reached sufficient proximity to the axis, then the code is switched into a fully kinetic simulation to capture the relevant physics during the pinch, including beam formation”. The code is used to look at the effect of the radius of a cavity in the anode on the development of the m = 0 instability. The motivation is to deliberately induce the instability in the hope that it would enhance the beam-target neutron yield. The report compares the LSP calculations with a snowplow model: “The trajectories of the slugs predicted by the snowplow model match well with those of the LSP model, differing in their times to reach the axis only by several ns or less. Additionally, the temporal evolution of the sheath densities is well-recreated by the snowplow model...”. The calculations reveal the existence of an optimized value of the radius of the inner cavity for enhancing the neutron yield caused by a linear ion beam formed during the m = 0 instability.
- Li et al. (2017) [331] from Los Alamos National Laboratory report on “high-fidelity 2D and 3D numerical magnetohydrodynamic (MHD) simulations using the LA-COMPASS code to study the pinch formation dynamics in a DPF and the associated instabilities and neutron production”. Kelvin-Helmholtz instability is observed in the radial phase, as well as in the pinch phase. Although 2D calculations show m = 0 instability only, 3D calculations show m = 1 kink instability after imposing an azimuthal perturbation. They observe: “instabilities affect the magnitude and time and energy shape of the neutron pulses at about the 20% level”. They have calculated and measured neutron spectra along the axial direction. No information is given about neutron spectrum along the radial direction. Investigation of the effect of an axially placed obstacle (called “re-entrant tube”) on the neutron emission leads to the conclusion that multiple neutron pulses are emitted in the absence of the obstacle from pinches that occur at different heights, while placing it at an optimum distance produces just one neutron pulse of a smaller duration.
3.3.2.2. Kinetic Simulations
- (a)
- Schmidt, Tang, and Welch (2012) [332] report “Fully Kinetic Simulations of Dense Plasma Focus Z-Pinch Devices”. Their 2D calculation in (r,z) coordinates is initialized at the end of the rundown phase with a 1 mm width plasma sheath of uniform mass density travelling at the speed (governed by the equality between the wind pressure and magnetic pressure). Some of the important new results from fully kinetic computations are: (1) impedance approaching 1 Ω in the pinch phase. (2) localized sub-millimeter size regions of high (~5 GV/cm) axial electric field which are positive in some places and negative in other places, with positive regions dominating in intensity and number. (3) High frequency oscillations in axial electric field with a frequency ~4 GHz. (4) High energy ions up to several MeV. From the text, it is not clear whether the localized domains are snapshots of either propagating or stationary high frequency waves.
- (b)
- A follow-up paper from the same group [333] compares fully kinetic simulations with experimental measurements. Notable experimental results are: (1) High frequency electromagnetic fields in the 3–4 GHz range are more intense in good quality discharges than in poor quality discharges. (2) Ion spectrum measured by ion time of flight is well reproduced by computations. (3) Neutron yields are within a factor 2 of the experimental yields.
- (c)
- Fully kinetic simulations of a Mega Joule class plasma focus similar to Gemini [334] in cylindrical (r,z) geometry with cell sizes 0.1 mm radially and 0.2 mm axially show beam-target fusion occurring within the 2.5 mm pinch radius with energies from 1.8 to 5.5 MeV with a peak at 2.45 MeV and thermonuclear neutrons outside the pinch with 11 keV spectral width. This apparently refers to axially observed neutron spectrum, although the text does not explicitly mention this.
3.3.2.3. Particle in Cell Simulations of the Initial Phase
- In the “Particle Movement” module equations of motion of charged particles are solved. If a particle leaves the volume, a collision with a boundary (either a dielectric or a metallic cathode) is generated. The dielectric absorbs the incident electrons and forms a surface charge. The electrons are reflected by the cathode while the ions hitting the cathode eject electrons with a ratio γ~0.15.
- The “Collisions procedure” generates collision events by Monte Carlo method using the cross sections of each scattering process, included in the code.
- The densities of the charged particles are obtained by the PIC scheme in the “Weighting” module. It is optimized for faster weighting while sub-cycling for mesh refinement [338].
- The “Field” module calculates the electric field by solving the Poisson equation. More accurate treatment [342] would be to solve Maxwell equations and to take into account induced magnetic field also. In fact, the induced magnetic field is not negligible, because of the very fast rising electric field (anode potential increases linearly with a rate of 2.1011 V/s). Probably the effect of magnetic field would be a decrease in the mobility of the charged particles and a corresponding decrease in the breakdown pressure.
- Modeling in H2 showed development of the cylindrical ionization wave sliding along the insulator in the PF as observed in the real device at a pressure of 3 Torr. The model results in Ar could be compared with experiments. The development of the ionization wave was observed both in the model and in the experiment. The experiment showed that breakdown starts later in time than in the model. To have quantitative agreement for the time lag between the experiment and the simulation, a correct model for transport of radiation must be taken into account.
- EMPIC simulations carry the PF modeling further into the breakdown and the axial acceleration phase. They help uncover many interesting physics and phenomena during the early PF development and allow one to characterize the PF physical parameters. These localized physical phenomena happen on short timescales and pose serious diagnostic challenges to experiments. Without the proper diagnostic tool to carry out measurements, simulations using the coupled Monte Carlo PIC present the most viable computation tools to study the rich plasma phenomena manifesting in the breakdown and the early axial acceleration phases. Since the formation and propagation of the CS is determined in this early phase, the performance of a PF device may eventually be traced to the kinetics and structural formation and evolution of the CS in this development stage.
3.3.2.4. Numerical Simulation of Ion Acceleration
- Although the electric field in the frame moving with a current sheath is practically zero (as the plasma conductivity is very high), it can have significant value in the laboratory frame. Some ions can be accelerated in the electric field, extracted from the collisional plasma and start to behave as a collisionless beam. [178,354].
- There is one new idea namely acceleration of ions during coalescence of magnetic loops in current carrying plasma by the so called “surfatron mechanism” proposed in the context of astrophysics.
3.3.3. Empirical and Analytical Insights
3.3.3.1. Lee and Serban
3.3.3.2. Soto
- (1)
- The magnetic field at pinch radius is nearly the same ~30–40 T.
- (2)
- Ion density of the pinch is nearly the same ~5 × 1024 m−3.
- (3)
- Mean Alfven speed is nearly the same ~1–2 × 10⁵ m/sec.
- (4)
- The Bennett temperature varies as the square of the drive parameter and thus should be nearly the same over 8 decades in stored energy.
3.3.3.3. Klir and Soto
3.3.3.4. Turner Relaxation Model for Current Sheath
3.3.3.5. Turner Relaxation Model for Ion Trapping Structures
3.3.3.6. Upper and Lower Bounds on Snowplow Velocity
3.3.3.7. Plasma Focus as a Circuit Element
4. Experimental Results: Standard PF Operation with Deuterium
4.1. Initial Phase: Sheath Formation
- (1)
- Is there an optimum length for the insulator or initial plasma?
- The Singapore group [366] finds “that for a neon filled plasma focus device the change in insulator sleeve length changes the current sheath curvature angle and thus the length of the focused plasma column”. “The pinhole images and laser shadowgraphy are used to explain the observed variation in the average soft X-ray yield (measured using a diode X-ray spectrometer) with variation of the insulator sleeve length”. They conclude that X-ray yield is maximum for an optimized insulator length.
- The QAU group from Pakistan [367] finds an optimum insulator length that maximizes neutron yield. “When sleeve length deviates from the optimum value, spokes are observed on the sleeve surface”. The spokes are more prominent on the surface of shorter length.
- Iranian group at Amir Kabir University [368] finds smaller pinch radius for an optimum insulator length.
- Darmstadt group in Germany [369] finds that “…the discharge tends to shorten its path with increasing pressure. Hence by increasing or decreasing the insulator length, the pressure range of the gliding discharge is shifted towards lower or higher pressure values, respectively”.
- According to the RGV model [311], variation of insulator length of a given device, keeping all other parameters constant, is also expected to vary the fraction of energy converted into magnetic energy, work done, remaining in the capacitor and dissipated resistively. Decrease in X-ray and neutron yield could be explained on the basis of less energy coupled to the pinch phase.
- The breakdown electric field in deuterium is proportional to the fill gas density [363], so that if voltage is kept constant, a longer insulator will create uniform discharge at lower pressure. The plasma will then move faster, so the pinch occurs at a time before the quarter cycle period of the capacitor bank so that a significant amount of energy remains outside the device.
- (2)
- Is there a preferred material for the insulator? Which property of the material makes it the preferred material?
- The occurrence of an intense sliding discharge for PTFE, PVC, Al2O3, Pyrex has been studied [369] and it is found that the corresponding pressure range is material dependent.
- It is found [370] that “…considerable increase in neutron yield has been achieved in POSEIDON by replacing the Pyrex insulator by a ceramic tube”.
- Beg et al. [371] find that a higher dielectric constant insulator sleeve material produces better neutron yield.
- Hussain [372] et al. have studied electron temperature from a device operated with argon-hydrogen mixture with Pyrex glass, fused silica, alumina, nylon, Perspex, and Teflon, and find that Pyrex and fused silica produce highest electron temperature and speculate that high surface resistivity of these materials is probably involved.
- (3)
- What is the role of the polarity in sheath formation and pinch formation?
- Decker and coworkers [373] explain that with positive polarity, the radial electric field attracts to the insulator free electrons from the gas and those created by field emission from the sharp edges of anode or knife edge structures nearby. This helps in rapid buildup of surface charge density on the insulator leading to breakdown. When the polarity of applied voltage is negative, electrons are repelled from the insulator and the buildup of surface charge density is retarded.
- Mathuthu, et al. [374] find that for negative polarity, the optimum anode length is shorter than for positive polarity.
- The above two observations appear to be mutually supporting in the following manner: With negative polarity, plasma formation is delayed by electron repulsion, so less portion of quarter cycle time is available for plasma to reach axis, hence shorter anode works better.
- This question can potentially be addressed by simulations reported in Section 3.3.2.3 but does not appear to have been attempted so far.
- (4)
- Can the initial plasma be formed by any means other than surface electrical discharge on insulator?
- Comment by H. Bruzzone: “It has been shown [378] that the initial plasma does not always form on the insulator. A single CS is formed on the insulator just in a restricted range of pressure values, which must be determined for any device. No rationale has been found for this fact.”.
- At high pressures, a filamentary sheath is formed at the end of the insulator [378].
- Plasma focus action indicated by current derivatve singularity has been demonstrated using an inside-out washer gun configuration [382] (see Section 9.2.3).
4.2. Sheath Structure and Propagation
4.2.1. Electron Density Profile
- (1)
- Bruzzone and Fischfeld [383] have evaluated the density profile of the sheath in the Frascati plasma focus at 250 kJ, 3 torr D2. The following Figure 68 shows the radial density profile at various z coordinates. The peak density calculated by them is (1.6–1.8) × 1018 electrons/cm3 while the atomic filling density corresponding to 3 torr of deuterium is 2.1 × 1017 cm−3—a ratio of 8.57. Some other features of the density profile commented by them are:
- In the leading portion of the sheath, the electron density starts rising to a value of 1–2 × 1017 cm−3 (similar to filling density) within about 3 mm, after which it rises rapidly to 1.6–1.8 x1018 cm−3 in next 3–4 mm.
- The decrease in density from peak to below detection limit towards the rear side of the sheath occurs over a scale of less than 1 mm, which is well resolved.
- The scale length of density rise agrees well with the slowing down distance of deuterons as they enter the moving sheath.
- The scale of the slower initial rise of density agrees with atomic photoionization mean free path.
- (2)
- Electron density profiles for the radial phase have also been published for the PF-1000 device (see Section 4.3.1.1 A(4)). However, a detailed analysis of density profile similar to that of [383] is not available as yet.
4.2.2. Current Density Profile
- (1)
- Magnetic probes (of a different design from that described in Section 3.2.2) were used at the Lebedev Institute [385] in 2010 on a Filippov type plasma focus operated with pure deuterium (see Figure 69).
- The current derivative singularity occurs after the current maximum showing that the PF discharge is not properly matched with the capacitor bank.
- The probe signals have multiple peaks which are interpreted as multiple sheaths formed by secondary breakdowns in the residual gas behind an initial sheath that does not efficiently sweep all the gas. The neutron signals also show similar double peaks (see Figure 70).
- The probe measurements indicate that only about 50% of the current entering the device is transported up to the axis.
- (2)
- Magnetic and magneto-optical probes of the type described in Section 3.2.2 were deployed on KPF-4 Phoenix facility [210] through the cathode, as shown in Figure 71. The results for operation between 18–24 kV with deuterium at 6 to 8 mbar are summarized below:
- Relative position between the luminous shock front and the current carrying magnetic piston layer was studied from the optical and magnetic channels of magneto-optical probes (see Figure 72) at a radius of 2.2 cm and height 3 cm above the anode. The shaded area in Figure 72 indicates the portion of the current carrying layer that overlapped with the dense plasma layer, showing current exclusion from the dense plasma layer.
- However, in an uncontrolled spontaneous firing of the capacitor bank, the optical signal and the magnetic probe signal were detected with no delay between them, showing that current had penetrated fully into the luminous dense plasma sheath (see Figure 73).
- Most of the current was seen to flow in the magnetic piston layer in good shots, which was 65% of the total discharge current. However in the spontaneous self-fired shot referred above, this portion was 42%. Although the operating voltage, pressure and total current were nearly the same, the neutron yield was one order less.
- The probes were introduced from the top and placed at a height of 3 cm above the anode. Because of sheath curvature, the sheath reached the axis on the anode surface before it encountered the magnetic probe at 22 mm radius.
- The average radial speed of the sheath was estimated from the time difference between peak of the magnetic probe signal and current derivative minimum to be ~2 × 107 cm/sec. This velocity estimate was used to construct a spatial profile of the optical and magnetic probe signals. The thickness of the luminous dense plasma layer was found to be ~6 mm (see Figure 74). The width of the current layer is ~0.9 cm at 5.6 cm radius. At 2.2 cm radius, the current distribution is seen to have two peaks.
- Assuming the thickness of the current layer to be given by the skin depth at the characteristic frequency corresponding to the current rise time and the resistivity to be given by the Spitzer formula, its temperature is estimated to be ~20 eV.
- The neutron yield scaled with measured pinch current Ip(MA) as Yn~1–3 × 10¹⁰ Ip4.
- (3)
- Magnetic probe measurements on PF-1000 [207] were performed with the probes placed through the anode and the measurement system floated to the anode voltage (See Figure 75).
- The first series of experiments was performed in a well-reproducible mode, with deuterium pressure 3 torr, operating voltage 27 kV, stored energy 485 kJ. Before each shot with magnetic probe, a series of training discharges under standard conditions were performed until the neutron yield became more than 1010. The working gas was refreshed before each shot because the probes got damaged in almost every shot. Major findings of the study are summarized below:
- High neutron yield ~1.24 × 10¹¹ showed that presence of the probe at 40 mm radius and 10 mm above anode surface did not adversely affect the normal operation of plasma focus.
- The probe signal typically had two peaks with FWHM 35–40 ns and a precursor pulse of smaller amplitude and opposite polarity to the main pulse. The precursor carried 5%–7% of the total current of the sheath. Its origin and role, if any, is unclear. See Figure 76 below.
- Total current inferred from the integration of magnetic probe signal over its ~100 ns duration assuming azimuthal symmetry is ~1.7 MA, which equals the total device current measured from the Rogowski coil or the current derivative monitor within experimental errors. The discharge current is transported almost completely past the 40 mm radius on the anode surface without suffering any leakage as found on KPF-4 Phoenix.
- With two magnetic probes at 40 mm and 12 mm, the average radial velocity was found to be 2.1 × 107 cm/sec.
- Using magneto-optical probes, the arrival of a luminous plasma front ~30 ns before the current front was clearly seen (Figure 77).
- The average radial velocity in the final stage of implosion was estimated from the delay between the peak of the probe signal at 40 mm radius and the minimum of current derivative signal. This was found to be in the interval (1.5–2.2) × 107 cm/sec.
- Since the variation of total current over the duration of the probe signal was negligible, the form of the probe signal was determined mainly by the spatial distribution of linear current density. The full spatial width of the current distribution was ~1 cm at 1.8 mbar pressure and nearly double that at 2.1 mbar and 2.8 mbar, while the total current was nearly the same and there was no significant change in the neutron yield.
- Neutron yield showed a good correlation with the scaling law Yn~1.5 × 10¹⁰ I4 when I was taken to be the current estimated from integration of probe signal at 40 mm radius, but not when it was the total device current measured at the collector. The efficiency of current transport up to the axis varied from shot to shot and was a significant factor in the variation of the neutron yield.
- (4)
- Existence of an axial magnetic field associated with the radial phase was demonstrated in 2012 [212], confirming the observation of Gribkov et al. [169] from 1979. The main points of investigations at operating parameters 1.8 torr D2, 24 kV, 384 kJ are summarized below:
- The signal from the Bz channels appears first, followed by the signal from the optical channel and then followed by the signal from the Bφ channel.
- The Bz probe used in panels (b) in Figure 78 and Figure 79 had a relatively low sensitivity to the Bφ channel and is, thus, expected to yield the more credible data. However, after applying corrections for the influence of the Bφ channel, the reconstructed Bz signals from both panels (a) and (b) in Figure 79 have a similar behavior which is typical for all shots with probes at 40 mm radius.
- Bz field appears ∼60–65 ns before the arrival of the PCS and increases to ∼0.4 kG. According to the calibration results, the Bz field in front of the PCS is directed away from the anode. After the arrival of the PCS, the Bz field changes its sign and reaches a value of ∼4 kGs. The polarity of the Bz field remains unchanged from shot to shot.
- The integration of Bz signals implicitly assumes that the value of Bz at the probe position was zero before the arrival of the sheath to the probe. This is an arbitrary assumption. The authors observe “If we assume that the initial Bz field is nonzero and is directed positively (from the anode), then the negative signal from the Bz channel can be caused by expulsion of the magnetic field by the PCS plasma”. Turner Relaxed State model [362] has been suggested as a possible source of such initial axial magnetic field.
4.2.3. Inductance of the Moving Sheath
- The initial values are approximately constant and practically coincident.
- The first change of the growth rate also occurs approximately at the same time and at the same inductance level in all of the 23 discharges studied.
- The initial value of plasma inductance is in agreement with the geometrical estimation of the fixed inductance due to connections at the base of the gun.
- The change in inductance until the first change of slope is about 30 nH, which is consistent with the total inductance of the gun.
- “The timing of the inductance-growth-rate changes and the magnitude of the inductance jumps fluctuate from shot to shot.”.
- The voltage drop across the plasma column, formed at time , is estimated by the formula
4.2.4. Instability of the Imploding Sheath
4.3. Plasma Dynamics Related to Stagnation, Pinch, and Instability Phases
4.3.1. PF-1000
4.3.1.1. Optical Diagnostics
- A.
- Interferometry
- In early reports [126,391,392,393,394], the interferometer was set up to cover the field of view with uniformly spaced sharp fringes in the absence of plasma whose deviation in a plasma shot was related to plasma density. Subsequently, the interferometer was set up [395] with parallel mirrors which gave widely spaced fringes in the absence of plasma. The fringes obtained in the presence of plasma were, therefore, contours of equal areal electron density (integral of electron density along the path of the collimated laser beam). Closed contours indicated presence of 3D bounded plasma structures. Densely grouped fringes indicated high plasma density gradient and widely spaced fringes indicated low density region. The uncertainty in the estimation of electron density from wide-spaced fringes outside the dense plasma was estimated [107] as ~1 × 10²³ m−3.
- Three types of structures were observed: plasmoidal, toroidal, and lobule-like. Helical perturbations of the plasma boundary were also observed. Plasmoidal structures are marked by a single set of nested fringes indicating that the density peaks at the innermost region of a topological sphere. Toroidal structures are marked with a double set of nested fringes enclosed within another system of nested fringes that indicate density peaking in the innermost region of a topological torus. Lobules were marked by a sharp radial deviation of the boundary of the fringe pattern in a narrow axial region either to one side or to both sides of the plasma boundary region in the interferogram.
- Although the fringe patterns were generally not symmetric about the axis, Abel inversion could be used across those cross-sections where the asymmetry was minimal. Although not strictly accurate, this gave useful average estimates of radial electron density distribution.
- Movement of the fringe pattern in successive frames gave an estimate of plasma motion. The growth of lobules indicated outflow of plasma from the dense pinch into surrounding low density plasma. X-regions were formed at the separatrix of neighboring systems of closed fringes. Their displacement in successive frames indicated presence of axial flow into these structures from these X-regions.
- In all investigations, time t = 0 is assigned to the minimum of the current derivative, except where explicitly mentioned. This requires some discussion. On the one hand, this is a signal that is measured in all the shots and can thus be used as a cross-reference across many series of experiments which may not field some of the diagnostics. It is difficult to conceive of an alternative time reference on this point alone. On the other hand, there are certain problems with this time reference. In a large plasma focus like the PF-1000, the current derivative is measured at a distance of 2 m from the pinch. Interpretation of the instant of the current derivative minimum in terms of physical phenomena occurring at the anode surface near the axis implicitly assumes that there is no signal delay across this 2 m distance. In fact, Mather does mention such delay [2] (p.214) that corresponds to a wave speed of 109 cm/sec and uses it to estimate the residual density left behind the snowplow (see Section 8.4.1.4). The minimum of the current derivative is not sharply defined—it has a flat region of a few ns width, whose center may be taken as the time mark. In many shots, the current derivative has multiple minima of which the deepest one is used as a time mark. Reflections (oscillations related to impedance mismatch in the current collector assembly following current derivative singularity) can affect the amplitude of the minimum and can cause errors in locating the minimum. The multiple turns of the Rogowski coil can cause a delay between the true current derivative and the detected signal. A constant error due to propagation delay or the identification of minimum would not affect interpretations within a single shot based on time differences. However, as a matter of abundant caution, the time reference information needs to be associated with an error estimate ~10 ns at the time of interpretation of results across multiple shots.
- (1)
- First interferometry experiments [126] were deliberately carried out in a non-optimized parameter regime: charging voltage of 20 kV (120 kJ energy) and initial deuterium pressure of 200 Pa as compared to 30 kV and 400 Pa standard operating regime. The neutron yield was ~109 at a current of ~1 MA. In this parameter regime, the plasma compression was weaker, the plasma column had a larger diameter, with worse cylindrical symmetry and lower symmetry of stagnation. However, the advantage was a high contrast fringe pattern with distinct fringes that facilitated its first ever evaluation. This advantage was not available at the standard operating conditions.
- The study looked at the stagnation phase from −100 ns to +120 ns in 10 ns intervals.
- Linear electron density as a function of z coordinate for different interferograms revealed a dense plasma structure that moves along the axis beginning at the anode.
- During the implosion of the current sheath, a dense structure with a radius of ~2 cm is formed with central peak density ~2–4 × 1018 cm−3 which decreases with time.
- No evidence of filaments or sub-millimeter structures was found.
- (2)
- The second report of interferometric investigations [391] dealt with interferometric investigations during neutron emission in the parameter regime 20 kV and 100 Pa deuterium pressure producing ~7 × 10¹⁰ neutrons at ~1.2 MA current. A region of decreased density was formed on the axis at the time of maximum neutron production both during the first pulse before column disruption and the second pulse following column disruption. In the latter case, the low density structure was below the detection threshold. The computed contours of plasma density show signatures of toroidal structures. They were not identified as such in that paper but were pointed out later [362,392] (see Section 3.3.3.5).
- The paper mentions dominant deuteron energy estimate ~100–350 keV.
- (3)
- The third report [392], operating at 1.6–1.9 MA and 250–300 Pa D2, explicitly identifies toroidal, helical, and lobular structures within the plasma in the implosion phase (before stagnation) because of their higher density than surrounding plasma. The lobules get absorbed in the sheath within few tens of nanoseconds. A low density plasma region of 1–2 cm thickness is seen in front of the well-marked dense imploding sheath.
- The period of first neutron and HXR emission usually begins at −20 ns, reaches a maximum at 15–20 ns and ends around 40–50 ns. This period coincides with the formation of the first plasmoid embedded within a less dense plasma column of about 12–14 mm diameter and 30–50 mm length. The plasmoid moves axially starting from the anode during the radial collapse of the sheath with a velocity of 2–4 × 107 cm/sec. During the declining portion of the HXR pulse, the diameter of the plasma stem between the anode and the moving plasmoid increases and its density decreases (see Figure 86). The radial and axial density profiles of the plasmoid have a Gaussian shape.
- The period of second neutron and HXR emission usually coincides with the continuation of the stagnation process. In the example presented, it began at 49 ns and ended at 69 ns. It coincided with the growth of a low density region between the anode and the plasmoid. During this period, the dense plasmoid moved away from the anode, interacted with the upper lobule and the column surface expanded in a quasi-spherical shape.
- Third HXR pulse began at 106 ns. Before this, sudden constriction of plasma column occurred near the anode at 96 ns. The interferogram at this time indicated that about half the plasma in the constricted zone was injected into the non-collapsed part of the plasma column, where a dense plasmoid was formed. At 116 ns, which marked the peak of HXR, the constricted region underwent a sudden increase in diameter accompanied with reduction in density, similar to an explosion. At 126 ns, there was a rapid decrease in density. Multiple plasmoids of diameter less than 5 mm and peak density ~3 × 1018 cm−3 were observed in the constricted region.
- The paper reports a delay of 10–30 ns between the maximum of neutron signal with respect to HXR signal.
- (4)
- The 4th report [393] explores correlation between magnetic probe and neutron signals and interferometry in an operating regime of 24 kV (384 kJ energy) and 240 Pa deuterium pressure producing about 1011 neutrons. Magnetic probes looking at time derivative of azimuthal magnetic field (designated dBφ) were fielded at 4, 1.3, and 0 cm from the axis on a line perpendicular to the path of laser beam. Their integration was related to current flowing in the sheath under the assumption of symmetric flow of current. In later campaigns, probes looking at time derivative of axial magnetic field (designated dBz) were fielded at 4 and 0 cm. The details of the probe construction, calibration, etc., are discussed in Section 3.2.2.
- In a series of 8 shots looking at dBφ at 4 cm radius, the signal started at −200 ns, reached its peak at −160 ns and reached its zero (maximum of Bφ) at −110 ns with a standard deviation of just 10 ns shot to shot. Up to (80 ± 20)% of discharge current flowed past the 4 cm radius.
- The current carrying layer had a full width of 1.6–2.6 cm and was located behind the dense plasma layer (see Figure 3 of [393]).
- In a series of 3 shots, combined dBφ and dBz probes placed at 4 cm position revealed a small Bz prepulse preceding the current sheath by 70–90 ns and oriented away from the anode (see Section 4.2.2 (3)). The sign of the main Bz pulse was opposite to that of the prepulse, i.e., directed towards the anode and was 2–8 times smaller in magnitude as compared with the Bφ field. The prepulse corresponded with a 5 mm wide low-density (less than 1024 m−3) region moving ahead of the dense plasma layer in which toroidal and helical structures were observed to form (see Figure 84 for illustration).
- In a series of 5 shots with combined magnetic probes placed at 4 cm and 1.3 cm, the dBφ signal at 1.3 cm started at −55 ns and reached its maximum at 16 ns. The shot to shot fluctuation was 5 ns. The current sheath took 90 ns to cross the probe at 4 cm and 70 ns for the probe at 1.3 cm. Three interferograms at −68 ns, −38 ns, and 22 ns (Figure 6 of [393], adapted as Figure 84, Figure 85 and Figure 86 below) show the position of the plasma at the start, maximum, and zero of the dBφ signal. The leading edge of current density front at −68 ns lies ahead of the leading edge of the dense plasma. The plasma re-expansion had already started at 22 ns. This indicated that the current layer continued to move towards axis even after the plasma stopped imploding. Completion of current penetration into the dense plasma and end of the first neutron pulse coincided with the start of plasma column re-expansion. The value of Bφ at the plasma boundary at 22 ns was 21 ± 4 T. The Bz channel was not used.
- In a series of 4 shots with combined magnetic probes placed at r = 0, the dBφ signal was smaller than dBz signal, as it registered azimuthal and radial components of magnetic field produced by asymmetry in current distribution. The dBz signal varied considerably from shot to shot. Interestingly, one of the discussed shots had a good azimuthal symmetry of the plasma enabling Abel inversion of the interferogram and also had a strong Bz signal (~6 T) in the radial collapse phase detected at r = 0. This core of the investigations has been described in considerable detail in the paper [393] and a condensed summary would not do proper justice.
- The investigation demonstrates that the neutron pulses are correlated in time with evolution and decay of plasmoidal and toroidal structures which probably are locations of azimuthal currents that create the axial magnetic field.
- (5)
- The 5th report [394] extracts a phenomenological narrative from correlated experimental results on interferometry, magnetic probe and neutron measurements. The main departure from the standard narrative takes into account the helical nature of magnetic field in view of simultaneous presence of azimuthal and axial components of magnetic field and their source currents in the current sheath.
- Toroidal structures spontaneously occur ahead of the dense plasma layer, as indicated by the Bz prepulse, at various axial positions well before stagnation (see Figure 84 for illustration). They offer more resistance to the implosive force than the neighboring plasma. Therefore, the implosion slows down at their axial locations but proceeds unimpeded in the gap between them. This leads to a plasma structure with alternating large and small diameter regions. The higher pinching force on the smaller diameter regions forces the plasma to move axially into the toroids at the core of the large diameter regions, evolving them into plasmoidal structures. The peak of neutron and HXR emission coincides with the maximum of plasmoid density and of the Bz signal from the probe at r = 0.
- The minimum of current derivative 20 ns after the peak of SXR emission corresponds to the penetration of discharge current into the plasma column and peak value of discharge inductance.
- Axially approximately uniform density of the plasma column indicated by axially oriented open fringes before the m = 0 instability becomes non-uniform by axial flow. The regions of decreasing density implode and form necks or constrictions. In the toroidal structures between necks, plasma density increases and forms toroidal discs in a manner similar to the implosion phase.
- The plasmoid formed at the time of the first neutron pulse persists and continues to evolve during the process of constriction. It decays during the breakup of the plasma. Formation and destruction of other plasmoids during the constriction process is tracked and found to correlate with neutron emission.
- The boundary of constricted zone near the anode shows modulation of radius with sub-millimeter wavelength. These are correlated with formation of small and dense plasmoids.
- In some regions of the constricted zone of plasma, the fringe pattern becomes blurred while it continues to show high contrast fringes in neighboring areas. This indicates localized turbulent fluctuations of density on a time scale shorter than the pulse width of the laser.
- The dominant neutron pulse is correlated with decrease in magnetic field (both Bz and Bϕ components) leading to induced electric field that accelerates ions.
- (6)
- Interferometric images of lobules [395] were interpreted in terms of existence of poloidal current loops and return path for the radially escaping plasma. These conclusions have been further elaborated in a later paper (see (9) below).
- (7)
- Evolution of the plasmoidal structure was more closely studied [396] in 2016. However, this was not in a normal PF-1000 operation regime. Instead, annular nozzle of diameter 2.4 cm and 3.6 cm placed 2.3 cm inside the anode were used to inject a gas puff on the anode axis while a plasma focus sheath launched at 23 kV charging voltage (350 kJ bank energy) and 200 Pa pressure of deuterium in chamber compressed it. Conclusions of this report are, therefore, summarized in a different section (see Section 5.1).
- (8)
- Important differences in the evolution of internal structures were reported [397] between the first and subsequent neutron pulses in an operational regime with 16 kV charging voltage (300 kJ energy) and 120 Pa deuterium pressure. The paper also reports observations on plasma sheath launched in hydrogen gas filling collapsing on a deuterium gas puff. The discussion is intimately related to evolution of features of the fringe pattern and is difficult to summarize. Interested reader needs to refer to the original paper. Interpretation of results depends on XUV spectroscopy and neutron time-of-flight and HXR diagnostics and is discussed separately.
- (9)
- Results of comparison between XUV images and interferometry from a series of 29 shots were reported [107] for a higher than optimal pressure of 170 Pa. This regime had a higher radiation in extreme ultraviolet but had a decreased neutron yield of ~109. It also had a slower evolution of plasma allowing assumption of quasi-stationary conditions which played an important role in interpretation. The uncertainty in the calculation of plasma density in the low density plasma region outside the dense plasma column was estimated to be less than 1 × 10²³ m−3. For comparison, the molecular number density of an ideal gas at 1 hPa and 273 K is 2.7 × 10²² m−3. The significant new results were detailed studies of the lobule structure on the outer boundary of the dense plasma.
- The evolution of the plasma column from −40 ns to +50 ns was recorded by both XUV frames and interferometry, which covers the period with formation of the first plasmoid and the first neutron and SXR pulses. The images show development of a lobule structure at the junction of the umbrella-like top and the approximately cylindrical plasma column that extends towards the anode, creating an inverted-U shaped dense and hot plasma profile that is not symmetric in the pictures. The arms of the inverted U then appear to link up enclosing a toroidal region that appears “empty” in both the XUV and interferometry images.
- This kind of low density toroidal structure external to the dense plasma column was observed also at the time of plasma constriction and in correlation with the second neutron pulse.
- Interpretation of this data is discussed in Section 4.3.1.3.
- (10)
- (11)
- A clearer image of plasma column break-up is shown [105] in Figure 88 below, (D2 at 80–100 Pa, 16 kV, conical tips at the anode and anti-anode). However, caution must be exercised when comparing results of an experiment with anode inserts with the standard electrode geometry of PF-1000 which has a cavity in the anode [44,45] (see Section 2.3.1).
- B.
- XUV spectroscopy and imaging
- (1)
- Time and space integrated XUV spectrum of H and He like ions of O, C, and N (present as impurities) was interpreted [397] as indicating an average temperature of ~70 eV “at the final phase of the stagnation”.
- (2)
- A 4-frame micro-channel-plate (MCP) camera equipped with 4 pinholes without any filters was used to obtain XUV images [107]. The lower limit of photon energy ~30 eV was set by absorption in the working gas and the upper energy was a few keV set by the MCP spectral response. The XUV frames compared with interferometry pictures show details of a lobule structure that forms an inverted U profile pointing towards the anode (Section 4.3.1.1 A(8)).
- (3)
- A segmented 4-frame gated MCP camera with 5.2 μm polyester (C8H8) filter, 2 ns gating time and inter-frame separation of 10–50 ns was used [398] to obtain XUV images in a window 200–300 eV and above 600 eV. Its response to radiation below 10 eV was negligible as compared to XUV response. A p-i-n silicon diode with 3 μm thick aluminized mylar, having spectral response similar to the MCP camera was used to obtain temporal variation of XUV radiation. The origin of time was defined not with respect to the current derivative minimum as in later publications but with respect to the maximum of the p-i-n diode signal. (See Section 4.3.1.1 C below for signal waveforms).
- The p-i-n diode records a peak 0 to 50 ns before the minimum of the current derivative. It usually has two peaks. The first peak has a rise time of 20 to 30 ns and FWHM of 30–60 ns. The second peak of considerably lower intensity has its maximum 120 to 170 ns after the first peak with FWHM 50–100 ns. In later publications with interferograms, this peak corresponds with the compression of the constriction.
- During the rise of the p-i-n diode signal, which occurs during the onset of sheath stagnation but before maximum compression, an intensely radiating region is seen in the XUV framing pictures at −20 and −10 ns with a corresponding region in the visible framing pictures, which indicates its position with respect to the umbrella shape.
- XUV frames coinciding with the two neutron peaks also show intensely radiating regions in the plasma column coinciding with 1–2 cm diameter spherical structures seen in visible frames (See Section 4.3.1.1 C below).
- (4)
- C.
- Visible framing and Streak
- (1)
- Visible radiation in a 10 nm spectral band centered on 589 nm (spectral region free of intense line radiation) was imaged [398] with a 4-frame camera with a gating time of 1 ns and inter-frame separation of 10–20 ns. A visible streak camera looking perpendicular to the axis of the plasma with a slit imaged at 3 cm above anode recorded the radial motion of the plasma. A sequence of 16 frames from 4 shots covering the time interval −60 to 170 ns was shown. The origin of time was defined not with respect to the current derivative minimum as in later publications but with respect to the maximum of the p-i-n diode signal.
- The minimum radius of the visible column occurs at the t = 0. The minimum of current derivative occurs 0 to 50 ns after the first XUV peak.
- At −30 ns, an intensely radiating region is seen in the middle of the imploding plasma stem, that is also seen in XUV pictures. The p-i-n diode records a pulse that peaks at this time.
- Frames coinciding with the two neutron emission peaks show a spherical structure of 1–2 cm diameter located on the axis at 6–8 cm from the anode at the junction of the umbrella-like shape and the top of the plasma column. Streak picture showed evidence of a second pinching which is also seen in visible framing pictures.
- (2)
- Streak pictures of PF-1000 discharges [399] for low and high neutron shots show significant differences in the implosion velocity.
4.3.1.2. Emissions of Various Kinds and Their Inter-Correlation
- Neutrons and Hard X-rays (HXR)
- (1)
- First results [400] of neutron emission on PF-1000 were obtained from a configuration different from that described in Section 3.1.2—anode diameter 244 mm, anode length 447 mm, insulator 113 mm long of 244 mm diameter, inner diameter of cathode 368 mm.
- Two groups of X-ray and neutron pulses separated by ~2 μs were observed. Neutron signals measured at 15 m downstream (along the direction of current flow) and at 40 m and 85 m upstream indicated maximum neutron energy of first pulse to be 2.70 MeV upstream and 2.68 MeV downstream whereas the second pulse showed 2.49 MeV upstream and 2.77 MeV downstream. The fact that the maximum downstream neutron energy exceeded the 2.45 MeV d-d reaction energy in the second pulse suggested that an appreciable number of deuterons moved away from the anode with a high velocity during the second pulse.
- Upstream maximum neutron energy in the range 2.95 ± 0.15 MeV was reported.
- (2)
- In order to reconstruct the energy spectrum of neutrons by the time of flight method, fast scintillator-photomultiplier detectors were set up [398] along the axis both in upstream and downstream directions in two configurations: a) 7.0 and 16.3 m downstream from the center of the neutron source (assumed to be 6 cm in front of the anode) and 7.0, 17.0, 30.3, 44.3, and 58.3 m upstream. b) 7.0,16.3 and 58.3 m downstream and 7.0, 17.0, and 58.3 m upstream. Two HXR and neutron peaks were obtained in most shots, with the second neutron peak dominating. The report was compiled from data from 200 shots. Temporal uncertainty in each shot was 5 ns. “The presented values of time, full-width at half maximum (FWHM) of pulses, and energies of neutrons are mean values taken from all the recorded shots. The shot-to-shot variability of time increases with the value of this time, and it could be estimated as 10% to 15%. The variability of the FWHM values of pulses is higher. in average, it is 20%. The inaccuracy of the determination of the neutron-energy values is estimated to be 0.1 to 0.2 MeV”.
- Energy of neutrons corresponding to the first and second peaks (corresponding to the dominant portion of deuteron velocity distribution) was 2.7 MeV and 3.0 MeV in the downstream direction and 2.3 MeV and 2.0 MeV in the upstream direction. (The numbers mentioned in Section 4.3.1.2 A(1)a refer to the beginning of the neutron signal, the maximum neutron energy).
- “A sharp onset of the pulses downstream and a sharp decrease of those upstream have been observed. On the contrary, the decrease in the pulses observed downstream is slower, and the increase is slower in the upstream ones”. This asymmetric feature has been “... explained with a production of a smaller portion of neutrons with energies between 2.2 and 2.4 MeV in the downstream directions”. Such neutrons, with energy less than the reaction energy of 2.45 MeV, would be produced by deuterons moving in the upstream direction.
- HXR emission (recorded with upstream detector at 30.3 m) has two peaks and usually, the second peak is more intense than the first in contrast to the soft X-rays whose first peak is the more intense one. The first HXR peak begins 40 ns before the peak of the p-i-n diode XUV signal, has FWHM of 45 ns and reaches a peak shortly after the peak of the XUV signal (see Section 4.3.1.2 D). The second peak occurs 170 ns after the first peak and has an FWHM of 70 ns.
- For the first neutron pulse, the FWHM is 50–70 ns. In its initial portion, the downstream neutron energy is 2.6 MeV to 3.0 MeV. Towards its end, it becomes 2.2 MeV to 2.4 MeV. This conclusion was a result of a Monte Carlo simulation.
- For the second neutron pulse, the FWHM is 70–100 ns. In its initial part, the downstream neutron energy is 3.0 to 3.2 MeV. Towards its end, it becomes 2.2 to 2.4 MeV.
- The second pulse has 3 to 10 times the number of neutrons as the first pulse.
- (3)
- Neutron time of flight spectroscopy was used [86] to determine the energy distribution of neutron-producing deuterons in the operating parameter regime 27 kV charging voltage (500 kJ stored energy), 470 Pa deuterium pressure, 2 MA maximum current. Fast scintillator-photomultiplier probes with 5 cm thick BC408 scintillators were placed at 7.0, 16.3, 58.3, and 84 m downstream, 7.0, 16.3, 30.3, 44.2, 58.3, and 84 m upstream and 7 m in the radial direction.
- Energy distribution of neutrons detected downstream ranged from 2.2 MeV to 3.2 MeV with a peak at 2.75 MeV, which is 0.3 MeV above the 2.45 MeV reaction energy of d-d neutrons in the center of mass frame of reference. This indicates that the dominant population of neutron-producing deuterons is moving downstream. The downstream neutrons of energy less than 2.45 MeV are produced by deuterons moving upstream. The scattered neutrons were excluded using the intersection of signals from detectors placed in the same distance in opposite directions. Energy distribution for deuterons moving axially was calculated for both upstream and downstream directions (see Figure 2 of [86] reproduced as Figure 9 in Section 2.3.1).
- Signals from detectors placed at 7 m in downstream, upstream, and radial directions have practically the same FWHM. This suggests that the energy distribution of reacting deuterons is approximately isotropic.
- (4)
- Correlations between neutron and HXR emission and interferometry images [397] show that the first neutron pulse begins before the current derivative minimum when the front portion of dense plasma sheath has just reached the axis on the surface of the anode (see Figure 90a). The beginning of a closed fringe system at this time indicated the start of formation of the first plasmoid in coincidence with the start of first neutron pulse 30 ns before the current derivative minimum. This plasmoid continued to evolve during the 200 ns duration of the neutron pulse.
- The first neutron pulse had similar profiles in the downstream, upstream, and side-on detectors indicating that energy anisotropy is very small.
- The side-on neutron spectrum had dominant energy of 2.8 MeV (determined from the time difference between the first HXR and neutron pulse peaks) indicating a deuteron side-on motion with kinetic energy ~70 keV (velocity ~2.6 × 10⁶ m/sec). The transit time of a deuteron with this velocity across 1 cm is 3.86 ns. The duration of the neutron pulse was 200 ns. This indicates that the deuterons that produced neutrons were radially confined. Continued radial outflow of deuterons would have depleted the plasma fast enough to be noticed in interferograms.
- The second neutron pulse was correlated in time with the disruption of the plasma column. Figure 91 shows a sequence of interferograms overlapping with the second neutron pulse.
- (5)
- B.
- Fusion protons
- (1)
- Fusion protons from PF-1000 were imaged [401] using ion pinhole cameras using calibrated CR-39 and PM 351 solid state nuclear track detectors (SSNTD), along with aluminium foil filters which discriminated against fast deuterons and provided protection against plasma damage.
- Preliminary experiments were conducted on PF-1000 configuration with 230 mm diameter anode, 28 kV charging voltage, and 4 hPa deuterium pressure with a single 0.5 mm diameter pinhole camera using a CR-39 detector covered with 80 μm Al foil placed at 68° to the axis with 3 to 4 shots superimposed for getting sufficient number of tracks.
- More detailed experiments were performed with anode of 244 mm diameter and 447 mm length, insulator of 244 mm diameter, and 114 mm length and 20 to 40 kV charging voltage. Three pinhole cameras placed at 0°, 68°, and 90° to the axis were deployed at distances of 500, 610, and 1000 mm from the center of the inner electrode. PM 355 detectors covered with 80 μm Al foil were used and exposed to 5 shots. The developed foils at 90° show 5 to 9 mm diameter spots (or clusters of tracks). The images were also shifted from the geometric center of the detector. Histograms of number of proton tracks versus track diameter along with previous calibration revealed 3 energy groups of fusion protons at 3.01 MeV, 3.30 MeV and 3.83 MeV with different intensity at the three detectors. Highest track density was observed at 0°.
- (2)
- Comparison of a time-integrated fusion proton image with time resolved images from interferometry and a 4-frame filtered gated MCP camera [402] show a spherical structure in all three images at the same axial location. The fusion proton image appears to be larger in size than the X-ray image.
- (3)
- Fusion protons were recorded with 7 ion pinhole cameras having 3 mm diameter pinholes with SSNTDs covered with 80 μm Al foil. The PF operating parameters were 31 kV charging voltage, 5.32 hPa D2 producing 6.7 × 10¹¹ neutrons/shot. In order to improve statistics, the SSNTDs were exposed to 5 consecutive shots.
- Fusion protons were found to be emitted anisotropically.
- They had energy ranging from 3.2 MeV to 4.5 MeV, with a peak at 3.5 MeV.
- C.
- Soft X-rays (SXR)
- (1)
- Temporal evolution of soft X-rays with photon energy below 1 keV was studied [398] using a thin NE102 scintillator-photomultiplier detector covered with 10 μm Al foil. Soft X-ray emission had 3 peaks of decreasing amplitude (see Figure 94 below). First emission started before maximum compression and reached a peak before the current derivative minimum. Comparison with other signals is discussed in Section 4.3.1.1 B(3), Section 4.3.1.2 A(2), and Section 4.3.1.2 D. Note the absence of a strong SXR pulse corresponding to the second HXR and neutron pulses in Figure 94.
- (2)
- An MCP camera divided into 4 quadrants shielded with 5 μm C8H8, 3 μm Al, and 10 μm Be foils was used [402] to compare regions emitting above and below 1500 eV. Two silicon p-i-n diodes with 3 μm Al and 10 μm Be filters also looked at temporal revolution. A dense spherical region located 7 cm along the axis in the interferogram was also shown to have an electron temperature of roughly 750 eV. (There is a possibility that this might be incorrectly evaluated: 750 eV may be the average photon energy and temperature may be ~4 times less in line with other measurements).
- (3)
- Time integrated soft X-ray pinhole camera images [127] with the PF-1000 facility were compared for two modes of operation: normal mode and with gas puffing. The helical deviation of the boundary was discernible.
- D.
- Electrons
- E.
- Ions
- (1)
- In the first of these [101], one pinhole camera with 500 μm pinhole was at polar angle −60° with the axis placed at 77 cm from anode center. It had a magnification of 0.091 with a blur of 3 mm. A similar camera was placed at 0° at a distance of 160 cm from the anode. That had a magnification of 0.044 with a blur of 5 mm. Both had 3 μm Al filters so they detected deuterons above 360 keV. For comparison, the dominant energy for deuterons deduced from neutron time of flight was 130–150 keV during the first neutron pulse and 300 keV in the second pulse. Estimates of deuteron trajectories using a model for magnetic field based on interferometer images indicated that the deuteron trajectories would be deflected by not more than 1–2 mm.
- In one of the reported shots, the 0° camera recorded an ion image composed of two patterns: first a nearly circular image of 2 cm diameter with a lower intensity central spot of 8 mm diameter and second a circular arc of 3–5 cm radius. The 60° detector had no signal. In another shot, the 0° camera recorded “a small central spot of 8 mm in diameter and two ring-shaped regions of diameters equal to about 6–8 and 11–13 cm, respectively”. The larger ring diameter was larger than the field of view of the interferometer and could not be ascribed to any particular plasma region. The smaller ring could be associated with a 3 cm diameter lobule seen in the interferometer images. The smaller central spot could be ascribed to a plasmoid formed on the axis.
- Six cameras with 200 μm pinholes were placed on an arc of 32 cm radius centered on the anode center at polar angles −42°, −23°, −4°, +4°, +23°, and +42° in addition to the ones at 0°and −60°. The SSNTDs were placed 4 cm behind the pinholes, i.e., on an arc of 36 cm radius looking at the anode center. Three cameras were unfiltered, recording deuterons above 30 keV, and others had 3 μm Al filters. The results showed that there were two sources of fast deuterons. The one within the central pinch region was recorded in all detectors. The other had a radius of about 3 cm and produced images in the shape of circular arcs only in the detectors near the axis. Their probable location was in the vicinity of the extreme edges of the lobule structures.
- (2)
- The second paper [105] interpreted earlier ion pinhole camera images obtained in [79] in terms of deflection of ions by magnetic field created by local closed-loop currents inferred from interferometric pictures, and possibly filaments which were not directly observed in this experiment. Additional data were obtained with a modified geometry having a conical tip on the anode and another 6 cm away on the axis connected to an “anti-anode” connected to the cathode rods with 12 metallic radial ribbons. The ion pinhole images detected at 0° beyond the anti-anode structure exhibited a number of azimuthally distributed spots.
4.3.1.3. Interpretation of Results
- A.
- Internal currents and magnetic fields
- Magnetic probe data and correlated interferometry pictures (Section 4.3.1.1 A) demonstrate that axial magnetic field Bz and associated azimuthal currents exist in close vicinity of toroidal structures formed ahead of the imploding dense plasma sheath. In a few frames after stagnation and before breakup, the movement of fringes is negligible suggesting that a quasi-stationary state exists. Estimates of rotational drift velocity lead to associated kinetic energy density an order of magnitude less than the estimated pressure. This allows local dynamics to be approximated by the relation . The average temperature of the plasma has been estimated to lie in the rather broad interval 50–150 eV from intensities of spectral lines of H- and He-like ions of ambient impurities (O, N, and C) using VUV emission spectroscopy. This is assumed to be spatially uniform. This allows density gradients to be associated with pressure gradients and, hence, with magnetic force density within the limitations imposed by the assumptions and approximations.
- Regions of low density surrounded by high density have some boundaries with positive radial pressure gradient and hence positive radial (directed away from the axis) magnetic force density . These regions are, therefore, identified as locations of internal closed currents with both toroidal and poloidal components. Positive force density can result either from from toroidal currents dominating the negative force density from poloidal currents moving downstream or from poloidal currents directed towards the anode in a returning current loop.
- Using simultaneous XUV and interferometry images (Section 4.3.1.1 B(2)), such regions are found on the external surface of the dense plasma column where the radial lobule structures bend towards the anode forming an inverted-U profile, with the arms of the U at higher density than the space enclosed by them (see Figure 89 and Figure 95). Similarly, negative pressure gradients on the outside boundary of these structures correspond to the negative force density (directed towards the axis) associated with external currents. This implies that the discharge current and the dense plasma column are separated by a “plasma cushion” that contains both toroidal and poloidal currents and associated magnetic fields.
- During the radial implosion phase, axial magnetic field has been detected by magnetic probes on the downstream side of the plasma shell (Section 4.3.1.1 A(4)c). A toroidal structure has also been detected by interferometry in the low density plasma region on the downstream side of the dense plasma sheath (Section 4.3.1.1 A(4)c). Since the shock is yet to reach this structure, the kinetic energy can be neglected allowing interpretation of positive pressure gradient with positive magnetic force density that is associated with toroidal currents . This region is, therefore, identified as the location of a toroidal current distribution (see Figure 84).
- Specific plasmoidal structures, with a single density peak, observed within the dense plasma column, have been associated with numerical estimates of toroidal and poloidal magnetic field distributions using density profiles obtained by Abel inversion assuming cylindrical symmetry [397]. They are interpreted as being similar to spheromaks in magnetic topology.
- Helical perturbations of the dense plasma column boundary are seen in soft X-ray, XUV and interferometry images [107,127,392]. They are potentially helical current flow paths that have both axial and azimuthal current components. They can generate the axial flux occupying the entire dense plasma column. This axial flux is an essential component of magnetic helicity and is necessary for operation of dynamo mechanisms that alter topology of the magneto-plasma.
- The hypothesis of formation of the plasma cushion spatially separating the main discharge current from the dense plasma column explains the observed delay between the voltage peak and the current derivative minimum measured at the base of the plasma focus seen in Figure 80 that results in the double peaked voltage across the plasma column seen in Figure 82. The current derivative minimum occurs when the current reaches the axis, causing a sharp increase in inductance. Figure 89 shows a short circuit occurring across the dense column before this time. This prevents the voltage spike associated with the sharply increasing inductance from being detected by the voltage probe. The occurrence of this short circuit is reflected in the valley between the two voltage peaks in Figure 82.
- B.
- Evolution of structure
- The toroidal current density in the toroidal structures formed in front of the imploding dense plasma sheath (Section 4.3.1.1 A(4)c) is amplified by a dynamo mechanism involving radial transport of the axial magnetic field by the imploding sheath, resulting in toroidal discs at one or more axial locations.
- The toroidal discs are harder to compress than the adjacent plasma column (see Figure 84) because of their internal magnetic stresses. The pinching force compresses this adjacent plasma region to a lower radius than the toroidal discs, forming a shape with one or more lobular structures of larger radius distributed axially along a plasma column of lesser radius.
- The magnetic pressure is much larger at the lower radius of the plasma column than at the radius of the toroidal discs. This leads to continuous decrease in the radius of the plasma column creating constrictions. The plasma contained in the constricted zone is pushed axially into the higher radius toroidal discs, eventually leading to plasma erosion in the constricted parts of the plasma column and transformation of the toroidal discs into plasmoids.
- This cross-field axial plasma transport drives a magnetic dynamo that creates and amplifies both toroidal and poloidal current distributions by converting plasma kinetic energy into magnetic energy, that results in a spheromak-like plasmoidal magneto-plasma structure.
- The toroidal discs increase in diameter, creating a lobular structure that bends towards the anode enclosing a part of the azimuthal flux creating a magnetic bubble. The poloidal current inside this bubble is directed towards the anode near its exterior boundary and away from the anode near the interior boundary (see Figure 89 above and Figure 2 of [106]).
- The resulting phenomenology differs from the traditional description of m = 0 MHD instability, which does not take into account any poloidal flux and, thus, does not include dynamo mechanisms powered by 3D cross-field plasma flows. Note that no interpretation has been associated with the origin of the axial magnetic field detected in the radial collapse phase. This is just taken as an experimental observation. Subsequent interpretation is based on the validity of this experimental observation. Possible mechanisms for the origin of this axial magnetic field are discussed in a subsequent section (Section 8.2.1).
- C.
- Generation of fusion neutrons, fast electrons, XUV, and X-rays
- I.
- Energy dissipation mechanism before maximum compression/current derivative minimum:
- II.
- Neutron emission mechanism associated with the first pulse:
- It begins before plasma stagnation and ends when the plasma column re-expands before becoming unstable.
- The neutron time-of-flight spectra observed along downstream, upstream, and side-on directions indicate energy distribution for the first neutron pulse is more isotropic than the second pulse (Section 4.3.1.2 A(1)a), Section 4.3.1.2 A(3)b, Section 4.3.1.2 A(4)a). Deuterons that produce neutrons have a side-on kinetic energy ~70 keV (Section 4.3.1.2 A(4)a). Their transit time across 1 cm is ~3.86 ns while the duration of the first neutron pulse is 200 ns. A continuous radial outflow of 70 keV ions for 200 ns is ruled out as that would have been detected in a rapid depletion of particle content in interferometric pictures. This indicates that the deuterons that produced neutrons were radially confined.
- For the first neutron pulse, the FWHM is 50–70 ns. In its initial portion, the downstream neutron energy is 2.6 MeV to 3.0 MeV and towards its end, it becomes 2.2 to 2.4 MeV according to a Monte Carlo simulation of the experimental results (Section 4.3.1.2 A(2)d).
- The neutron energy corresponding to the first peak is 2.7 MeV in the downstream direction and 2.3 MeV in the upstream direction (Section 4.3.1.2 A(2)a).
- According to Section 4.3.1.2 A(3(a): “Energy distribution of neutrons detected downstream ranged from 2.2 MeV to 3.2 MeV with a peak at 2.75 MeV, which is 0.3 MeV above the 2.45 MeV reaction energy of d-d neutrons in the center of mass frame of reference”
- III.
- Neutron emission mechanism associated with the second pulse:
- The neutron energy corresponding to the second peak is 3.0 MeV in the downstream direction and 2.0 MeV in the upstream direction (Section 4.3.1.2 A(2)a).
- The strong second HXR and neutron pulses are not accompanied with strong SXR and fast electron signals as in the first pulse (see Fix 63, Section 4.3.1.2 C, Section 4.3.1.2 D).
- For the second pulse, the FWHM is 70–100 ns. In its initial portion, the downstream neutron energy is 3.0 MeV to 3.2 MeV. Towards its end, it becomes 2.2 to 2.4 MeV (Section 4.3.1.2 A(2)e) according to a Monte Carlo simulation of the experimental results.
4.3.2. Other PF Devices
- (1)
- Roshan et al. [408] used activation of a graphite target of 20 mm diameter inserted into the anode tip of the NX2 plasma focus working at 8 mbar deuterium and 12 kV charging voltage to demonstrate presence of accelerated deuterons in the upstream direction (towards the anode). The relevant reaction 12C(d,n)13N has a deuteron threshold energy of 328 keV. The reaction product 13N decays with a half-life of 9.96 min producing a positron. This is supporting evidence for the inference of an electric field directed towards the anode (see Section 4.3.1.3 C(1)) from PF-1000 data.
- (2)
- Lerner et al. [95,140] have used neutron time of flight method to obtain the average ion energy Ei of a plasma undergoing fusion using the following formula:where t is the time required for a neutron of energy E (2.45 MeV for d-d fusion) to travel to the detector, W is the FWHM of the pulse at the detector, and τ is the duration of the neutron pulse at the origin of the pulse. This formula assumes a Maxwellian velocity distribution for ions. Using two scintillator-photomultiplier detectors with 25 mm thick BC404 scintillator (rise time ~2 ns) kept at 11 m and 17 m at 90° to the axis, this relation was used to solve for Ei and τ for each of 44 shots. In another series of 23 shots, an additional detector was placed at 1.2 m from the axis at a polar angle of 4° with the axis. Using the time difference between the neutron peaks at 11 m and 17 m detectors, an average perpendicular neutron energy Ep was estimated. This was used to estimate the time of generation of neutrons (see Section 4.3.2 (4)d below). From this and the signal from the axial detector at 1.2 m, the average axial neutron energy was calculated. The report mentions that the detector at 17 m is larger than the one at 11 m. However, there is no mention of correction for possible photomultiplier electron transit time differences between the two detectors. Neutron fluence anisotropy was measured using bubble detectors at 0, 4, 12.5, and 90 degrees with the axis. Ion beams were measured using Rogowski coils placed at 31 cm from the end of the anode inside a drift tube. A gated intensified charge-coupled device camera with exposure time ~0.2 ns was used to take visible and near UV framing pictures.The following major conclusions were reported:
- There were 4 shots with Ei > 150 keV in the first series. A table showing frequency distribution of Ei has been reported. In another series of experiments [140], the maximum Ei is reported as 240 keV.
- In the second series, mean values and have been reported. This has been interpreted as having no statistically significant anisotropy. According to the authors, the difference in mean Ep and the reaction energy of 2.45 MeV “...implies a mean bulk velocity of the neutron source of only 0.087 cm/ns. This would give the deuterons only 8 keV of energy, which is small compared to the up to 160 keV energy inferred from the TOF data”.
- The deuteron beam energy was estimated from ion time of flight. Mean deuteron kinetic energy of ~320 keV and maximum ~500 keV were reported.
- The fluence anisotropy data were interpreted to imply that “...at most 30% of the neutrons observed could have come from an unconfined beam and that thus at least 70% of the neutrons come from confined high-energy ions”.
- ICCD image taken within 2 ns of the X-ray emission “...appears to show the plasmoid core consisting of a coil of plasma filaments. The bright filament is ~60 μm in diameter and is wrapped in a coil that is 400 μm in diameter and 1.5 mm long. There is also a 500 μm radius halo of less dense filaments surrounding the inner core”. Assuming that this visible light image shows the volume from which the neutrons are emitted, the authors conclude that the density of this structure is ~3 × 1019 cm−3.
- The above data have been interpreted by the authors as follows: “...our results show that >70% of the neutrons observed in these shots originate in a plasmoid with n in the range of 3–4 × 1019 cm−3, with radii of about 500 μm and lengths of about 1.5 mm, confined ion average Ei up to 160 keV and lifetimes of 30–60 ns”.
- (3)
- Experiments on the PACO device in Argentina [409] used a Bicron BC 400 scintillator of diameter 180 mm coupled with the high current photomultilier Philips 150 AVP kept at a distance of 2.3 m perpendicular to the axis. Out of the neutron yield of 2 × 10⁸ neutrons measured using a silver activation detector, 7.6 × 10⁴ neutrons were expected to reach the scintillator. The investigations report the following conclusions:
- “The time differences between the maximum neutron emission and that of X-ray emission... puts into evidence that both events are related but not simultaneous”.
- “The time correlation between voltage peaks and X-ray peaks ... is in reasonable agreement with the X-rays being generated by an electron beam produced in turn by a voltage drop on the forming plasma column...”.
- “The fact that the neutrons are emitted on average ≈20 ns before the formation of an electron beam is hardly compatible with a beam-target model for the neutron production in this device [a similar conclusion arises from the essential lack of correlation between the amplitude of the X pulse and the neutron yield...]”.
- “The correlation between the dip in dI/dt and voltage divider signals shows that both events are closely time related but not simultaneous”.
- (4)
- Experiments on a plasma focus operated at 320 J energy at 27 kV, 9 mbar D2, 12 mm anode radius [410] are described below in some detail in view of some unexpected conclusions. Apart from current and voltage monitors, the diagnostics consisted of two moderated 3He counters, calibrated with an AmBe neutron source, kept radially and axially and 6 scintillator-photomultiplier detectors based on BC-408 BICRON scintillator optically coupled to a 51 mm diameter R1828–01 Hamamatsu photomultiplier tubes (PMT). Two spatial configurations of detectors were utilized. In the first, all 6 detectors were placed radially, separated by 50 cm, the closest 1 m from the PF, which allowed placement of the 3He counters for total yield measurements. In the second case, 3 detectors were placed radially at 1.5 m, 2 m, and 3.05 m and axially at 2 m, 2.46 m, and 3.05 m. At a distance of 1 m, the PMT receives a fraction 1.56 × 10⁻⁴ of all neutrons emitted in 4π. With a total neutron yield of ~5 × 10⁵ neutrons, the farthest detector at 3 m would, thus, receive ~26 neutrons. The detector signals were recorded on 500 MHz oscilloscope channels. The initial rise of X-ray and neutron signals were taken as time references. Differences in PMT delay times were eliminated by adjusting them such that the leading edge of X-ray pulse arrived at each PMT at the expected X-ray flight time. Linear regression on the detector position and rise of the X-ray and neutron signals led to determination of the time of origin of the X-ray (tx) and neutron pulses (tN) at the plasma focus, as well as “the mean energy of the fastest neutrons” in each shot for axial and radial directions separately. The data show the following:
- Times of production of X-rays and neutrons can be different showing that they are produced by independent mechanisms.
- Correlation exists between the mean energy of the fastest neutrons and the neutron emission delay with respect to X-ray emission.
- This correlation is different along the axial and radial directions.
- The time of production of neutrons can be different in axial and radial directions in the same shot (see Section 4.3.2 (2)). In the authors’ words “...the neutron pulse detected radially does not necessarily correspond to the same neutron pulse detected axially since (tN_axial—tN_radial) is not always zero”.
- “...the neutron emission on the different directions (radial or axial) present differences in their energy and yield, showing a clear anisotropy with higher values and broader statistical distributions in the axial direction. Furthermore, the results of the observed neutron energies on the different directions and the temporal differences of the radiation emission suggest the existence of two temporally separated neutron pulses, which agrees with observations made in larger energy devices.”.
- (5)
- Experiments on a 400 J plasma focus [411] using a time history analysis technique show that in some shots the neutrons are emitted before the hard X-rays and the pinch. The experiment used 2 PMTs axially and 2 PMTs radially separated by 20 cm distance kept at 1.57 m and 1.77 m from the center of the anode. The PMTs could intercept a fraction 5 × 10⁻⁵ of neutrons emitted by the PF in 4π. The current derivative signal from a Rogowski coil was split and recorded on two fast oscilloscopes, both as time marker and trigger. Signals from two axial PMTs and two radial PMTs were recorded along with the current derivative signal. The time of appearance of the neutron (X-ray) signal on the oscilloscope was determined as the sum of the time of origin of neutrons (X-rays), time of flight from the source to the PMT, electron transit time of the PMT and the cable transit time from the PMT to the oscilloscope. This analysis enabled determination of the time difference in the time of origin of neutrons and X-rays. Making the assumptions that: (1) X-rays are produced at the time of the pinch and (2) the pinch duration was given by the scaling law of Lee and Serban (Section 3.3.3.1) to be 12 ns, the report concluded that:
- In many shots some neutrons are produced with (before the pinch phase). Similar observations are reported from larger installations (see Section 2.4.2, Section 4.3.1.1 A(3)a, Section 4.3.1.2 A(3), Section 4.3.1.3 C(1)). This is more marked in the axial direction than in the radial direction.
- Some neutrons are produced with (post-pinch phase). This is more marked in the radial direction than in axial direction.
- Mean energy of fastest neutrons, determined from the time difference between the start of the neutron signals in the detectors (see Figure 4 of [411]), increases monotonically over the range from 1 MeV to 6 MeV with but the variation is markedly different in the axial and radial directions.
- Neutrons were produced 40 ns before X-rays in the axial direction and 20 ns in the radial direction.
- (6)
- Zakaullah et al. [412] used a 0.5 mm diameter pinhole to image the reaction zone of a 2.5 kJ plasma focus on a CR-39 SSNTD using emission of fast charged particles. The pinhole camera had a magnification of 1 and the distance between the pinhole and the source was 8 cm. Ion pinhole images (see Figure 97) showed significant variation over the pressure range 0.25 to 3.0 mbar D2 pressure. At each pressure, 3–5 images were recorded and good reproducibility was observed.
- (7)
- The time-integrated spatial distribution of fusion reactions for pure D2 gas, and D2-Kr gas admixture, was studied by using the proton-CAI technique to image individual NX2 plasma focus shots [219,221,222] as described in Section 3.2.5. CAI permits a high proton throughput to be obtained, counterbalancing the NX2′s modest proton yield per shot. For a typical NX2 shot with neutron yield, the number of recognized and processed proton tracks on the CR-39 detector was about . In addition, sub-millimeter image resolution was obtained.
- (8)
- The time-integrated quasi-average energy of fusion neutrons emitted at 0° and 90° in each shot of NX3 plasma focus at Singapore was measured by using the Zirconium Beryllium Pair detector technique described in Section 3.2.6.
- (9)
- The UNU/ICTP PFF at the University of Malaya was optimized for neutron yield at about 4 mbar of deuterium, producing ~108 neutrons [188]. Using a deuterated titanium target and a plain copper obstacle at the different distances in front of the anode, it could be shown that less than 15% of the neutrons were produced within the pinch, and the remaining 85% of the neutrons arose from the neutral deuterium gas 20–60 mm ahead of the anode end [248].
- (10)
- Using a Maxwellian curve fitting technique [413], it was shown that the neutron signals in the UNU/ICTP PFF at the University of Malaya could be fitted to two pulses that possibly correspond with two phases of neutron emission found in POSEIDON [173] and PF-1000 (see Section 4.3.1). The neutron detectors were “...cylindrical NE102A scintillator (diameter 5 cm, length 10 cm) wrapped with a fluorescent fibre and optically coupled to a normal plastic optical fibre”. The optical signals were carried by this optical fiber to the photomultiplier tube, which was placed inside a screened room to diminish electrical interference, as well as spurious signals from the photoelectrons ejected by hard-X-rays from photomultiplier dynodes [414]. Four detectors were placed as follows: at distances of 50 cm and 80 cm at 0° and at 50 cm and 100 cm at 90°. The energies of the two phases of neutrons were estimated from the time of flight using the peaks of the corresponding curves. These fitted curves were also integrated to give the magnitudes of the neutron yields and for the calculation of the end-on to side-on anisotropy.
4.3.3. Convergence between Results from Various Laboratories
4.3.3.1. Existence of Axial Component of Magnetic Field in the Radial Implosion Phase
4.3.3.2. Existence of Accelerated Deuterons Moving towards the Anode
4.3.3.3. Fusion Proton Images Larger Than X-ray Pinhole Images
4.3.3.4. Observation of Lobular Protrusion Reaching the Anode
4.3.3.5. Non-Simultaneity of Current Derivative and Voltage Extrema
4.3.3.6. Near-Isotropy of Neutron Emission Spectrum in the First Pulse
4.3.3.7. Deuteron Acceleration, Electron Acceleration, and Hard X-ray Emission Are Separate Phenomena
- “The fact that the neutrons are emitted on average ≈20 ns before the formation of an electron beam is hardly compatible with a beam-target model for the neutron production in this device” [409].
- “...the neutron emission on the different directions (radial or axial) present differences in their energy and yield, showing a clear anisotropy with higher values and broader statistical distributions in the axial direction. Furthermore, the results of the observed neutron energies on the different directions and the temporal differences of the radiation emission suggest the existence of two temporally separated neutron pulses, which agrees with observations made in larger energy devices.” [410].
- “In most of the discharges, it was found that neutrons are originated before HXRs in the axial direction and after HXRs in the radial direction” [411].
5. Experimental Results: Special Modes of PF Operation—Wires, Gas Puffing, and Other Gases
- Formation and propagation of the plasma sheath both depend on material properties of the gas such as various atomic cross-sections and specific ionization energy (Section 3.3.2.3, Section 3.3.3.6). Admixtures of gases with differences in these properties can affect both these aspects.
- High atomic number gases added to deuterium or used as fill gases by themselves have higher resistivity as compared to a pure deuterium discharge. This can contribute to faster development of resistive “tearing mode” instability [132] that causes a uniform current distribution to break up into a non-uniform one that may become manifested as current filaments.
- Higher effective atomic number also implies higher rates of radiation loss that could cause radiative collapse [164] of local magnetic equilibria that might be the mechanism responsible for micropinches.
- Higher average mass of the gaseous species can affect characteristic timescales associated with macroscopic motion of the plasma and the growth rates of some instabilities. They might lead to apparently higher lifetime of structures as compared to those in a pure deuterium plasma.
- In an annular gas puff pinch experiment, a mixture of 90% deuterium and 10% argon was found to physically separate into distinct concentric cylinders [365]. This kind of mass separation may be present to some extent in plasma focus experiments with heavy gas admixtures with deuterium.
- Gas puffs are likely to introduce turbulent eddies into the initial state of the gas which is different from the stationary uniform density of the standard mode of operation. This turbulence could get amplified while interacting with a supersonic plasma shock.
- Gas puffs may involve condensation of trace amounts of moisture (inevitably present in gases or adsorbed on the surface of the gas puffing apparatus) into water droplets resulting from rapid expansion, causing an unwitting fine scale non-uniformity that might trigger gradient driven instabilities or droplet micro-explosions when the supersonic plasma sheath diffuses through it.
- Electrode modifications, such as conical tips placed on the anode or “anti-anode” structures erected above the cathode, influence boundary conditions of the radial collapse phase and the stagnation phase. They are likely to modify the details of axial shock wave propagation during stagnation. Cross-field axial plasma flows are suspected to be involved in evolution of plasmoidal and toroidal structures and associated dynamo processes. Consequences of modifications of axial flows for emergence and growth of self-organized structures are not fully understood.
- Electrode material from the bare anode [68,69,146] or from conical or other inserts placed at the anode center may enter into the high electric field zone of the pinch phase. This is already demonstrated [44,45] by detection of multiply-ionized electrode material ions of MeV-level kinetic energy in a Filippov device. Influence of high atomic number impurities on the fine structure of plasma focus pinch phase has been demonstrated (Section 2.3.2). Extrapolation of conclusions from experiments with solid anode centers to those with cavities at the anode centers may not always be correct.
5.1. PF-1000
5.1.1. Deuterium and Neon Gas Puffs Impacted by Deuterium and Neon Plasma Focus Sheaths
- (1)
- Inter-comparison of measured parameters of (A) 13 shots with pure deuterium, (B) 8 shots with deuterium plasma focus on deuterium gas puff, (C) 18 shots with pure neon, and (D) 27 shots of neon plasma focus on deuterium gas puff revealed the following notable observations [416] where the uncertainties refer to shot to shot variations in the series.
- Neutron emission in (A), (B), and (D) was nearly the same (4.5 ± 3, 5.9 ± 3, 4.0 ± 3) × 1010. Average energy of neutrons measured downstream was nearly the same ~2.85 MeV.
- The implosion velocity was (A) (1.7 ± 0.4) × 105 m/sec, (B) (1.5 ± 0.2) × 105 m/sec, (C) (2.1 ± 0.2) × 105 m/sec, (D) (1.7 ± 0.4) × 105 m/sec. The corresponding ion energy works out to (A) 0.3 ± 0.1 keV, (B) 0.25 ± 0.1 keV, (C) 4.6 ± 0.1 keV, and (D) 3.6 ± 0.1 keV.
- There was a marked difference in:
- pinch length (A) 6–8 cm, (B) 6–8 cm, (C) 1–2 cm, (D) 1.5–2 cm.
- voltage peak (A) 28 ± 5 kV (B) 28 ± 5 kV (C) 32 ± 6 kV (D) 35 ± 6 kV.
- minimum pinch diameter (A) 1.4 ± 0.2 cm, (B) 1.5 ± 0.2 cm, (C) 0.5 ± 0.1 cm, (D) 0.7 ± 0.1 cm.
- SXR FWHM (A) 44 ± 10 ns, (B) 65 ± 10 ns, (C) 40 ± 20 ns, (D) 55 ± 20 ns.
- SXR total emission (A) 2.3 ± 0.3 V-ns, (B) 4.6 ± 1.0 V-ns, (C) 22 ± 5 V-ns, (D) 1.0 ± 0.3 V-ns.
- d.
- The neon plasma focus shot described in the paper has an interesting feature (see Figure 104).
- (2)
- Observations of filamentation and other structures in the deuterium gas puff impacted by deuterium or neon plasma sheath are reported in [100,416]. The principal diagnostics was a 4-quadrant micro-channel plate (MCP) camera, with 80 μm pinholes covered with 5 μm of polystyrene, which imaged photons above 10 eV with a 2 ns exposure time, 10 ns inter-frame separation, and 800 μm spatial resolution. One of the four quadrants had much higher sensitivity compared to the other three. Supporting diagnostics was interferometry and soft X-ray PIN diode signals filtered by 10 μm Be foils sensitive to photons in the 0.7 keV to 1.5 keV range.
- The following pictures in Figure 105 show the XUV frames recorded in different shots at different times with deuterium gas puff impacted with deuterium sheath. Origin of time t = 0 corresponds to the current derivative minimum and timing errors are mentioned as 2–3 ns. Four kinds of structures are seen in the reported pictures.” (i) short filaments with the width about 1 mm and length up to 1 cm, (ii) spots with the dimension of about 1 mm, [(iii)] two sorts of the long filaments in pictures (g) and (h) with the length up to (2–3) cm and 1 mm diameter, and (iv) small balls of a few mm diameter with a regular spherical shape existing usually outside the dense region of the dense column”.In Figure 105, the image at −66 ns shows “…traces of the short filaments passing through the imploding dense plasma sheath, mainly in the direction perpendicular to the column surface... “. The image at 6 ns was recorded at the “... the maximum of the first SXR, HXR, and neutron pulse…“for a good shot with neutron yield (11.1 ± 0.3) × 1010. The image at 29 ns was also recorded at the peak of X-ray and neutron pulses but for a bad shot with neutron yield (1.9 ± 0.3) × 1010. This image shows an asymmetric compression, with a larger diameter of column, higher XUV emission and larger number of short filaments. The authors particularly mention:” (In general, we observe higher energetic SXR pulses in shots with the lower neutron yield.)”
- (1)
- The filaments penetrate the external, probably colder, imploding layer of the pinch, and they can connect the external low-density region with the denser internal region of the pinch.
- (2)
- The short filaments accompany the transformation of internal plasmoidal structures and their number varies proportionally with the magnitude of SXR and neutron production.
- (3)
- The direction of the short filaments has radial (dominant near the anode) and axial (dominant in the region of the first plasmoid) components.
- (4)
- The fine radiated structure is registered only in shots with deuterium puffing, probably at the lower temperature of the plasma in the external layers of the column. It is absent in shots without deuterium puffing.
- (5)
- The higher intensity of the radiated fine structures can be caused by their higher plasma density and/or temperature in comparison with the surrounding plasma.”
- b.
- With neon sheath collapsing on deuterium puff, a much smaller number of fainter filaments or spots were observed, at the time of neutron production.
- c.
- The report mentions “In some shots with deuterium puffing, one or more small symmetrical and spherical balls a few mm in diameter are observed in the interferometry and XUV pictures with both deuterium and neon filling and with deuterium puffing”. An interesting example of the evolution of these ball-like structures is shown in Figure 106.
- (3)
- Addition of nitrogen to the deuterium gas puff impacted by a deuterium sheath revealed [403] axial and radial filaments in the XUV images and sometimes, also in interferometry images (see Figure 107).
- (4)
- An apparently surprising result was observed when the experimental configuration consisted of neon in the gas puff compressed by a deuterium plasma focus sheath [417]—it produced almost the same level of neutron yield as a pure deuterium plasma focus. This is explained by the authors as a result of penetration of the deuterium into the neon gas puff. The report contains many details of the interaction between the deuterium sheath and the neon gas puff, of which, Figure 108 provides a good example.
5.1.2. Wire Placed on the Axis
5.2. PF-3
- (1)
- Analysis of signals from magnetic probes shows that the current growth rate increases from ≈1012 A/s at r = 46 cm (anode radius) to ≈3 × 10¹² A/s at r = 16 cm and to ≈1.5 × 10¹³ A/s at r = 2 cm. The rate of rise of current in the final stages of the radial collapse is nearly 75 times what the power source is capable of providing. This circumstance makes it possible to consider the plasma focus as a driver for novel condensed plasma loads discussed in Section 6. The rise time of the front of the current pulse decreases from ≈5.5 μs at r = 46 cm to ≈1.5 μs at r = 16 cm and to ≈120 ns near the facility axis. The radial component of the sheath velocity increases from (1–3) × 106 cm/s at r = 46 cm to ~107 cm/s in the final stage of the discharge.
- (2)
- The signals from the magnetic and optical channels overlap during the initial stages of radial collapse phase indicating absence of a plasma shock layer distinct from a magnetic piston layer. As the sheath approaches the axis, the dense plasma layer moves ahead of the current carrying layer forming a distinct shock wave followed by a well-separated magnetic piston [211] which carries the major portion of the current.
- (3)
- Estimates show that the thickness of the current carrying layer decreases from 6 ± 1 cm at 46 cm to 3 ± 1 cm inside the region of radius 16 cm. In the final stage of implosion inside the region of radius r = 2 cm, this can be less than 1 cm.
- (4)
- The thickness of the current carrying layer in the near-axis region is numerically equal to the width of the radial distribution of the plasma electron density obtained by laser interferometry in the final stage of implosion (Figure 110) [420,421].
- (5)
- The measurements lead to two important conclusions:
- At currents of up to ~2 MA, almost the entire discharge current can be transferred to the near-axis region of the system (see Figure 111). Within measurement errors, the signals from the probes 1, 2, and 3 coincide with the total current at the corresponding instants. i.e., the current is efficiently transported toward the axis: as the PCS passes near the probes, the current measured by each probe is equal to the total discharge current. The current amplitude at R = 2 cm (probe 4) is only 0.75 MA, which amounts to ~30% of the maximum current. It should be noted that both the amplitude of this signal and the character of its subsequent decay agree well with the signal from the probe located at the radius 160 mm. Due to its axially diverging shape, the PCS reaches the probe located at a height of 10–20 mm above the anode plane after the formation of the pinch in the cavity of the conical anode (the signal of the probe 4 reaches the maximum after the peak in the total current derivative). At this instant, the current begins to be switched to the insulator region. As a result, after pinching, the signals from all the probes are less than the total current.
- Taking into account the similarity of the shapes and amplitudes of the decaying signals from the probes installed at the radii 2 cm and 16 cm, the current at the instant of pinch formation can be estimated with high reliability from the current value provided by the probe installed at 16 cm. The significance of this conclusion lies in its role in estimating the prospects and capabilities of future high-current PF facilities. This result is not trivial, because the efficiency of current transfer depends strongly on the operating mode of the discharge. An increase in the voltage across the discharge gap due to an increase in the load impedance and a sharp increase in the pinch resistance at the instant of maximum compression, as well as other factors, can cause a shunting breakdown of the discharge gap near the insulator after the singularity or even earlier, as was observed in the example presented in Figure 112.
5.3. Other Devices
- POSEIDON at Stuttgart, Germany
- Schlieren pictures showed that “the puffing of the Ar gas target in front of the inner electrode plate induces a distinct rise of microturbulence within the collapsing plasma sheath”.
- “For shots with D2 filling and Ar puffing considerable changes in the radial, compression phase were observed. Argon streams, as injected by the valve, form a turbulent gas target, which can hardly be compressed by the current sheath. Framing pictures taken with the pulsed planar diode prove, however, that the pinch column can be formed above the gas cloud...”.
- “...schlieren pictures show that the puffing of an Ar admixture induces stronger turbulence and changes the pinch formation. With a relatively short discharge delay time (td< 450 μs) the Ar target is formed only in the close proximity of the inner electrode front plate...Even in that case the radial compression of the heavy gas target is not very efficient, and the pinch column exhibits strong MHD instabilities.”.
- “...by appropriate gas puffing one can obtain PF discharges with numerous ‘hot spots’ inside the pinch column, ...”.
- Using D2 puffing, with optimized valve pressure and delay, “...the neutron yield could be increased by about 30% in comparison with operation without gas puffing. For non-optimum gas target properties the neutron yield was usually reduced, whereas its reproducibility from shot to shot was generally increased”.
- Schlieren pictures taken during the radial compression phase show “distinct streams of the gas injected” and the resulting turbulence.
- “...soft X-ray observations have also confirmed the turbulent character of the current sheath collapse in the cases when a relatively dense gas target was introduced...”.
- 2.
- SPEED-II at Düsseldorf, Germany:
- 3.
- PACO device in Tandil, Argentina
- 4.
- DPF-78 in Stuttgart, Germany
- In pure deuterium discharges, “[t]he classical formation of the dense pinch column, some 3 mm in diameter, at the end of the radial collapse, is observed to begin first near the anode and then extending to a length of about 12 mm in front of the anode. After the compression stage, the expanded plasma maintains the cylindrical structure whose border is detected in the Schlieren photographs. At late time, the expanded plasma column appears to be disrupted and no longer confined. However, with the smaller aperture in the Schlieren system, the photographs clearly show that a large plasma column, some 15 to 20 mm in diameter, still remains at this time.”
- “In most discharges with pure deuterium, the electron density gradient, and hence the refractive index gradient is much stronger on the outside of the sheath compared with that from the inner surface, closer to the pinch axis.”
- “In admixtures of deuterium doped with neon up to 60% by mass, it is found that the stable plasma column extended to about 15 mm in length, longer than in discharges with pure deuterium at an equivalent mass. The sheath structure is clearly defined on both sides of the collapsing plasma shell, with a thickness similar to that observed in pure discharges. There is a smaller variation in thickness along the length of the collapsing column. In general, the plasma column remains grossly stable for over 30 ns, ... This is longer than that in discharges with pure deuterium.”.
- “The rapid expansion observed in pure discharges is absent at high doping level, but strong surface perturbations can be found throughout the evolution of the pinch. These surface perturbations could be traced back to that appearing early on in the sheath during the radial compression. Measurements from the double frame system indicate that they are formed as the plasma sheath emerges from the axial run down phase and turns around the edge of the anode. These perturbation remains more or less frozen in until pinch time and tends not to destroy the integrity of the collapsing column. The upper part of the column appears to be less sensitive to disturbances and hence more stable. These perturbations either have a ring like shape around the surface of the plasma column... or are helical around the plasma column...”.
- “...for low Z doping (neon) the plasma column is grossly stable for more than 30 ns but multiple necking begins to occur some 15–20 ns after first pinch formation in high Z doping (krypton). The plasma column is observed to expand after first compression at low level of low Z doping, with a larger expansion for pure discharges. Rayleigh Taylor type instabilities are observed to grow in the expanding plasma column. With pure discharge, a re-pinching is often observed at high z position and is correlated to the onset of a second period of neutron emission. In the case of high Z doping, no global expansion of the plasma column is observed...”.
- For each admixture studied, the shot-averaged total neutron yield decreased monotonically with the mass fraction of the high Z dopant.
- Time resolved polar distribution of neutron emission shows that the 90° neutron signal in pure D2 has FWHM of 146 ns, while at 0° it is 170 ns. With admixtures, the FWHM at 0° increases and progressively displays evidence of a double pulse structure, while that at 90° decreases.
- “...the polar pattern of the neutron emission becomes more and more peaked in the forward direction in the second period with increasing Z.”.
- “...in the forward direction (end-on) the width of the neutron pulse does not change substantially, but the amplitude increases by a factor of two for the krypton doped discharge compared with the argon doped. On the other hand, in the side-on direction, the neutron pulse is much narrower in the krypton-doped discharge.”.
- The neutron and HXR emission begins before the tight pinch formation in the final stages of stagnation.
- “... there is no direct correlation between the neutron yield and the appearance of the hard X-ray emission.”.
- “The results obtained in this experiment indicate that there is no correlation between the presence or the number of hot spots and the total neutron yield”.
- 5.
- “FMPF-1” in Singapore
- 6.
- UNU/ICTP PFF (15 kV, 3.3 kJ) at the University of Malaya
- 7.
- 500 J PF at Alameda Applied Sciences Corporation, San Leandro, USA
- 8.
- Gemini device at Las Vegas, USA
- There is a 1.7 times increase in neutron yield operating at 2.66 MA peak current, 11 torr deuterium with a rundown time of 6.56 μs caused by addition of 0.1% Kr by volume. A similarly high level of yield enhancement was not observed when operating at 2.26 MA.
- Both side-on and end-on neutron time of flight signals show two pulses for pure deuterium but “... addition of krypton at both 0.1% and 1% alters the double peak structure to a predominately single peak”.
- Addition of krypton reduces the neutron signal FWHM. “Increasing the voltage/current also reduces the FWHM, for example, from 240 ns at 0.1% Kr for 35 kV to 160 ns at 0.1% Kr at 40 kV”.
- “The observed flux asymmetry (end/side) for most shots is less than 1”.
- The end-on neutron time of flight signal begins earlier than the side-on signal, indicating a higher neutron energy end-on.
- 9.
- Sahand Filippov type facility at Tabriz, Iran
- 10.
- DENA Filippov type facility at Teheran, Iran
6. Plasma Focus as Driver for Condensed Targets
7. Exploration of Un-Conventional Plasma Focus Geometries
- (1)
- Two-guns PF—In this geometry, pioneered by Mather [143], two similar PF devices are placed in the same vacuum chamber in a counter-facing position so that the two imploding plasma sheaths are brought into collision.
- (2)
- Hypocycloidal PF—The structure of this kind of PF is a sandwich with two metallic discs electrically connected (cathode) and a third metallic disc (anode) placed between and isolated from the cathode discs by two circular insulators placed at the external radius of the discs. The discs have the same radius and have an hole in the central zone (see Figure 125).
- (3)
- Staged PF—The configuration of this PF is a combination of the two-gun and hypocycloidal PF. In a two-gun configuration a metallic disc with a central hole is placed in the mid-plane between the two facing central electrodes. The two plasma sheets of the opposite two-gun sides, after the run-down along the cylindrical zone, reach opposite surfaces of the conducting disc and implode like in the hypocycloidal configuration forming two focus points along the axis, just as in the hypocycloidal PF. The outputs of the staged PF are more or less the same as in the hypocycloidal apparatus. Additionally, in this configuration the very positive point is the long duration of the soft X-ray and EUV radiations [453], limited only by the half period of the current. The neutron production lasts about 100 ns as in a normal PF. The neutron emission is in perfect agreement with the production of a two-gun device and with the square of the bank energy dependence (for instance 5 × 10⁸ for 17 kJ bank versus 2.2 × 10⁸ for a two-gun bank of 11.25 kJ). The fields of possible applications are clearly the same of the hypocycloidal PF.
- (4)
- Spherical PF—This is part of a truck-transportable high intensity DT-neutron source, producing ~1013 DT neutrons per burst—apparently, the most intense publicly reported transportable high intensity neutron source. In this PF, the cylindrical configuration of the standard PF is changed into a spherical configuration. Two metallic spheres of different diameter, placed one inside the other, are the anode and the cathode of the PF, (Figure 126), with the outer stainless steel sphere also acting as a hermetically sealed, UHV compatible vacuum chamber.
- (5)
- “Mushroom” plasma focus: Ivanov et al. [146] mention a plasma focus referred as the LV2 device (180 μF, 25 kV) whose copper anode resembles a mushroom shape with a top portion that is 110 mm in diameter and a stem that is inserted into the chamber via a ceramic insulator of 55 mm diameter (see Figure 127). This has two interesting properties. One is the increased reproducibility of micropinches in deuterium filling at pressures of 1 to 6 mbar. The second is the occurrence of several pinches “at intervals of fractions of a microsecond”. The authors state “At the time of the first pinching, as a result of contact with the hot and dense plasma, the central part of the anode surface explodes and the partially ionized copper plasma spreads along the pinch axis with a velocity of .
- (6)
- “Interrupted” plasma focus as an ion beam generator.
- -
- Longer electrodes and lower pressures of deuterium produced more energetic ions [456].
- -
- Faraday cups were used to determine deuteron-beam energy and deuteron-beam fluence per shot while CR-39 solid-state nuclear track detectors were employed in studying the angular distribution of deuteron emission [457]. In the most optimum deuterium filling of 0.2 mbar, the ion beam measured was 52 ± 7 keV, with fluence of 1015 ions/m2. The ion beam emission was anisotropic and predominately in a forward cone of 60°.
- -
- The time profile of the ion beam emission was simultaneously measured with soft and hard X-ray signals using BPX 65 silicon PIN diode and a set of scintillator-photomultiplier detectors [458]. Two components of the ion beam were identified. The first component is of lower energy but higher intensity compared to the later. The emission of the first component of the ion beam and the hard X-ray due to electron beam bombardment of the anode are correlated. It is believed they are emitted by the induced electric field in the pinch.
- -
- The X-ray line spectra correspond to Cu-Kβ1 at 8.80 keV [459] were measured using the XR100CR spectrometer.
- (2)
- Nanofocus “NF” at the Chilean Nuclear Energy Commission
8. Outlines of the “Emerging Narrative”, Open Questions, and Potential Implications
8.1. “What has Changed?”—A Brief Overview
- (a)
- Improved visualization of plasma phenomena using interferometry and imaging with visible, SXR, XUV, and reaction proton emissions and their correlation with time resolved measurements of neutron, electron, ion, SXR, and HXR emissions indicates that the formation, and decay of bounded 3D plasma structures appears to be correlated with neutron emission. Some aspects of SXR, HXR, electron, ion, and XUV emission support that view (see Section 4.3.1.3 and Section 4.3.3). Internal pressure gradients associated with these bounded structures can be sustained over the observation time windows only if they are accompanied with internal current distributions that can provide requisite counter-balancing magnetic force density. This is possible only if the current density and associated magnetic field have all the three components. Quite difficult and sophisticated magnetic probe measurements (Section 3.2.2 and Section 4.2.2) provide crucial support for such interpretation.
- (b)
- There is a better appreciation of the topology of 3D magnetic fields. Most researchers still believe that a current carrying straight cylindrical conductor produces an azimuthal magnetic field symmetric about the conductor. This is clearly an impossibility anywhere in the universe which is permeated by a small but non-zero magnetic field that may be locally uniform and unidirectional in the vicinity of the conductor. The magnetic field of the current carrying conductor will clearly have all three components in the cylindrical frame of reference with z-axis along the conductor: the azimuthal component given by Ampere’s Law and partly by the ambient magnetic field, and the axial and radial components related to the ambient magnetic field and its inclination with respect to the conductor. The resulting magnetic lines of force are helical rather than circular with their axis of symmetry shifted. The difference in physics in the two topologies can be significant. A charged particle gyrating around the magnetic field lines can drift over larger and different regions of space in a helical magnetic field than in a purely azimuthal magnetic field. The simple motional dynamo process described by the electric field acts on all three components, allowing the directed plasma motion to amplify all three magnetic field components, and increasing magnetic energy at the expense of plasma kinetic energy. Since the plasma motion is itself driven by the magnetic force density , initially unidirectional plasma motion can transform into a 3D plasma flow after a sufficiently long time (see Section 8.1 (c)). This can, in turn, affect the dynamo process. The observation of 3D plasma structures and axial magnetic field by multiple techniques thus exposes the error in making the simplifying assumption [166] that axial and radial magnetic fields are initially zero and remain zero throughout the plasma evolution under the assumption of strict azimuthal symmetry and, thus, can be safely omitted from plasma focus research. There is a profound physical difference between the mathematical number zero and a very small number “tending to zero”. This is explained below.
- (c)
- The origin of this error, and of the general neglect of geomagnetic field in plasma focus research literature, lies in non-appreciation of the mathematics of multiple-scale analysis of non-linear systems of equations (Chapter 6 of [461]). A small perturbation of any system of dynamical equations is wrongly neglected by putting it identically equal to zero. The proper mathematical procedure would be to define a small parameter proportional to the perturbation for the non-dimensionalized system of equations, define the solution as a power series in the small parameter and obtain each term in the power series by a successive approximation procedure. A crucial step in this process is defining a hierarchy of timescales [461] which are related to the real time by inverse powers of the small parameter. The small term is then seen to influence the dynamics at longer times—the smaller the term, the longer it takes to manifest its effect. By putting this term identically equal to zero, one is forever dismissing the possibility that its effect may be manifested as an unexplained phenomenon at late times within the observational time window. In the plasma focus example, the dynamics of the rundown phase would be relatively unaffected by the small but non-zero geomagnetic field but that could provide the seed for the nonlinear dynamo processes that can create spontaneously self-organized structures much later in the discharge, lasting well after the apparent breakup of the plasma column. This is manifested in the experimental observations of monotonic increase in plasma inductance (see Section 3.2.3) that continues well past the current derivative singularity. Observations of the current derivative singularity and HXR emission 200 ns after the formation of the pinch in neon (Section 5.1.1 (1)d) and formation of dense structures well after the pinch break up observed using CO2 laser scattering [163] also indicate occurrence of significant plasma evolution after the so-called breakup of the plasma column. These could very well correspond to the higher order terms in the perturbation series solution of plasma dynamical equations with the ambient geomagnetic field defining a small parameter.
- (d)
- A related conceptual error has been analyzed by Boozer [406]. This refers to the process of acceleration of charged particles in a magnetic field whose topology is changing in time. Although Boozer’ analysis is mathematically quite complex, its physical essence can be heuristically described in the context of the plasma focus in the following manner. In textbook examples, a changing magnetic field is expected to create an electric field that is perpendicular to the magnetic field. So the expectation would be that charged particles would be accelerated perpendicular to the magnetic field. By tracking the particle energy perpendicular and parallel to the magnetic field whose local direction and magnitude are both changing in time, Boozer shows that it is the parallel kinetic energy that increases. The charged particle motion is effectively resolved into a gyration around the particle’s guiding center that lies on the magnetic field line and acceleration of the guiding center along the magnetic field line. The transfer of kinetic energy into the gyration merely increases its local instantaneous gyroradius until it approaches a scale length of the magnetic field distribution, after which the perpendicular motion is effectively decoupled from the influence of the local electric field. The increase in the kinetic energy associated with the motion of the guiding center along the magnetic field has no such constraint. Boozer’s analysis leads to an expression for the effective parallel electric field that would accelerate the guiding center along the magnetic field lines, that is much larger than the Maxwellian parallel electric field, and which contains a term proportional to the rate of change of the unit vector along the magnetic field multiplied by the mass-to-charge ratio of the charged particle. In other words, the effective accelerating electric field is much larger for ions than for electrons. It is also different in different directions. This challenges one of the common assumptions in plasma focus research—that ions and electrons are accelerated at the same time by the same local electric field. This assumption is used to calculate the neutron energy in time of flight experiments taking the HXR signal for a time marker for the start of neutron emission. Experiments discussed in Section 4.3.2 (3)–(5) indicate that HXR and neutrons may not be generated at the same time. They also show that neutron emission has measurably different characteristics in the axial and radial directions.
- (e)
- Convergence of certain experimentally validated conclusions across multiple plasma focus installations (discussed in Section 4.3.3) provides a set of phenomena that must form part of any narrative concerning plasma focus physics, which are listed below.
- -
- Existence of axial component of magnetic field in the radial implosion phase.
- -
- Existence of accelerated deuterons moving towards the anode.
- -
- Fusion proton images larger than X-ray pinhole images.
- -
- Observation of lobular protrusion reaching the anode.
- -
- Non-simultaneity of current derivative and voltage extrema.
- -
- Near-isotropy of neutron emission spectrum in the first pulse.
- -
- Deuteron acceleration, electron acceleration, and hard X-ray emission are separate but related phenomena.
8.2. Limitations of the “Standard Narrative”
8.2.1. Ab Initio Neglect of the Ambient (Geomagnetic) Field
8.2.2. Is the Pinch Phase a Pressure Equilibrium State (the So-Called “Bennett Pinch”)?
8.2.3. The Beam-Target Mechanism of Neutron Emission
- Ions whose velocity distribution including directionality is inferred from reaction product (neutrons and protons) data or is proposed to interpret such data would be collectively referred as ION BEAM, or BEAM in short. As a matter of convention, such interpretation would assume the other participant in the reaction, to be referred as TARGET, to be stationary with respect to the plasma. Ions whose physical parameters are determined in any other manner would be collectively referred as ‘ion beam’.
- A different BEAM could be invoked for dealing with data pertaining to different times in the plasma evolution.
- In the NX2 plasma focus, the shot-averaged peak neutron energy (corresponding to the peak of neutron signal) at 0°, 90°, and 180° found by time of flight method [465] was reported as 2.89 ± 0.25, 2.49 ± 0.20, 2.11 ± 0.12 MeV, respectively, while the shot-averaged maximum neutron energy (corresponding to the start of the neutron signal) was 3.39 ± 0.28, 3.12 ± 0.24, and 2.73 ± 0.14 MeV, respectively. These results were arrived at by determining the time of flight from the time between the peaks or the beginnings of the X-ray and neutron pulses, under the implicit assumption that the X-rays and neutrons are produced at the same time. The conclusion of the investigation was that the neutrons were produced predominantly by a BEAM TARGET mechanism where 100 keV deuterons produced by the m = 0 instability traveled along the axis.
- In the experiment discussed in Section 4.3.2 (4), the time of flight and the instants of origin of the X-ray and neutron pulses were independently determined using a pair of detectors placed at different known distances. The start of the X-ray and neutron pulses were taken as time markers so that the “neutron energy” was the energy of the fastest neutrons and not of the majority of neutrons. The conclusion was that the neurons and X-rays were NOT produced at the same time. In fact, in some shots neutrons were produced as much as 20 ns before the X-rays. Similar conclusions were reported from experiments discussed in Section 4.3.2 (3) and Section 4.3.2 (5). The energy of fastest neutrons estimated from the time-of-flight in Section 4.3.2 (5) varied over the range 1 MeV to 6 MeV in both the axial and radial directions as a function of the measured time difference between X-rays and neutrons. These results are interpreted as evidence that sometimes, the (fastest) neutrons are produced before the pinch, while the plasma is still imploding.
- The comparison of neutron yield with and without an obstacle plate placed 6 cm above the axis in NX3 plasma focus showed [225] that up to 75% of estimated neutron yield appeared to be produced (with some caveats of interpretation) in the neutral gas above the pinch, by a conical fast deuteron beam. Earlier results on the UNU/ICTP PFF [248] using copper and deuterated obstacles had reached similar conclusions.
- Data on imaging of the reaction zone using charged particle emission (Section 4.3.2 (6)) as a function of deuterium pressure have been interpreted as suggesting operation of various mechanisms, such as “... beam-target mechanism at low pressure, trapped gyrating particles in some anomalous magnetic field at optimum pressure, and a jet-like moving boiler at high pressure”.
- TARGET is a 3D bounded plasma structure kept together by 3D distributions of current and magnetic field that evolve by dynamo processes.
- BEAM is a collection of ion guiding centers that are accelerated by the effective parallel electric field proposed by Boozer [406] that follow the magnetic field lines that have a 3D structure.
- The magnetic field lines that guide the BEAM could be either (1) spanning a toroidal flux surface [407] partially or fully embedded within the dense plasma TARGET or (2) could have a helical geometry that takes the ions outside the dense plasma into the neutral gas region.
- -
- -
- In the toroidal flux surface case, if the BEAM has a partial overlap with the dense plasma, it would resemble an axially directed beam on the inner part of the toroidal flux surface, producing appropriate signatures in energy spectrum and fluence anisotropy, as observed in NX2 [465] and other devices which describe their neutron emission in terms of an axial BEAM-TARGET mechanism.
- -
- In such devices, the reaction zone imaged with reaction protons would appear to be radially larger than the dense plasma X-ray image because the part of the BEAM that lies outside the dense plasma would still produce neutrons in the low density exterior region of the plasma as observed in Section 2.4.2, Section 4.3.1.2 B(2) and Section 4.3.2 (7).
- -
- The ions in this external part of the BEAM would be directed towards the anode as they follow magnetic field lines which return outside the dense plasma [407], as discussed in Section 4.3.2 (1). Section 4.3.1.2 A(1)b, Section 4.3.1.2 A(2)b.
- The production of neutrons before the pinch while the plasma is still imploding, discussed in Section 2.4.2, Section 4.3.1.1 A(3)a, Section 4.3.1.2 A(3), Section 4.3.1.3 C(1), Section 4.3.2 (5), is included in this conceptualization by the recognition that the process that generates the axial magnetic field during the implosion phase would also generate an azimuthal electric field (related to the time derivative of the azimuthal magnetic vector potential associated with the poloidal magnetic field) that would accelerate ions in the azimuthal direction. The azimuthal velocity of ions would be approximately related to the change in azimuthal magnetic vector potential by the conservation of canonical angular momentum [407] aswhere the loss of energy by collisions is neglected. This would also explain the observation of higher FWHM of neutron spectrum in the radial direction as compared to axial direction in the Limeil device, the evidence of azimuthal motion of reacting deuterons in Frascati and POSEIDON and anisotropy less than unity in the first neutron pulse of POSEIDON discussed in Section 2.4.2 and in the Gemini plasma focus [436] discussed in Section 5.3 (8)d.
- The difference in the time of production of X-rays and neutrons in Section 4.3.2 (3), (4), and (5) could be accounted for in this conceptualization of BEAM-TARGET process by the term in Equation (19) of Boozer’s paper [406] for the effective parallel electric field that is proportional to mass-to-charge ratio, which is 3 orders of magnitude larger for deuterons than for electrons which generate X-rays. It may also result from a low particle count reaching the detector in experiments discussed in Section 4.3.2 (4) and (5), which could lead to an X-ray photon, even if produced in coincidence with the neutron, missing the detector. However, in Section 4.3.2 (3), the same conclusion is reached but the particle count on the detector is not so low.
- The observed differences in the “energy of the fastest neutrons versus time difference between X-rays and neutrons” plots in the axial and radial detectors described in Section 4.3.2 (4) and (5) would follow from the projection of ION BEAM trajectory along the magnetic field lines on to the respective direction of observation. It could also be accounted for by the fact that the start of the neutron and X-ray signals would be defined by a rather small fraction of neutrons and x-ray photons out of the already small fraction ~10−4 of the total neutron yield (~5 × 10⁵) and X-ray emission that does reach the detector. If the individual neutron that defines the start of the neutron signal happens to be produced by a deuteron that is moving away from the detector, its energy would be less than Q. Because of low particle numbers reaching the detector, the probability that the X-ray photon that results from a simultaneously generated fast electron misses the detector would be quite high.
- The energy source that powers the ion acceleration would be the same as the one that drives the changing topology of the magnetic field, i.e., a dynamo process that converts plasma kinetic energy into magnetic energy and partly into particle kinetic energy by the process described by Boozer [406]. Phenomenological evidence from PF-1000 indicates the role played by cross-field axial flow during the first neutron pulse (see Section 4.3.1.3 C II) and the resulting growth and decay of a plasmoid. The ICDMP BEAM-TARGET mechanism suggested by the evidence for the first pulse (see Section 4.3.1.3 C II) can be concisely described as “hot ions circulating inside plasmoid (HICIP)”. For the second pulse, the PF-1000 evidence suggests (see Section 4.3.1.3 C III) involvement of a plasma-filled virtual diode formed by plasma erosion in the neck formed by the m = 0 instability just below a plasmoid situated at the top end of the plasma column that can be concisely described by the phrase “rotating-fountain-beam, plasmoid-target fusion (RFBPTF)” mechanism.
- This mechanism is also seen to explain certain features of other experiments discussed in Section 4.3.2.
- -
- It resolves an apparent contradiction between two obsevations on the University of Malaya, UNU/ICTP FF device: (1) Almost 85% of neutron emission arose from the neutral gas outside the pinch zone [188]. (2) Almost 65%of the neutron emission which had anisotropy factor ~1, was produced [413] near the time of the voltage maximum and had energy 2.6 MeV both at 0° and at 90°. The remaining 35% had anisotropy factor 1.5, was produced nearer the m = 0 instability and had energy 3.6 ± 0.5 MeV at 0° and 2.6 ± 0.3 MeV at 90°. The first observation suggests a beam escaping the pinch. The second suggests confined ions in the first phase. The HICIP mechanism would have the ions trapped in a plasmoid that surrounds the dense plasma [407], which would be intercepted by a solid obstacle. The RFBPTF mechanism would be a good fit to the second part of the neutron emission.
- -
- It explains the size difference in the reaction proton images and soft X-ray images in the NX2 plasma focus and the position of the maximum of the reaction proton density coinciding with the far end of the soft x-ray pinch image (see Section 4.3.2 (7), Figure 98). The RFBPTF mechanism provides a good match to this observation.
- -
- It explains the lumpy appearance of the ion pinhole images reported by Zakaullah et al. [412] (see Section 4.3.2 (6), Figure 97). The RFBPTF mechanism again provides a good match to this observation. It is interesting to note the observation of Zakaullah et al. [412] in 1999: “One may explain the observed data by considering the notion of some anomalous magnetic field in the pinch region”—an astute anticipation of future developments indeed!
- -
- Two plasma foci facing each other (see Section 7 (1)) should have produced more neutrons than the sum expected from the two acting individually at half the current because each would have acted as a target for an ion beam produced by the other one. That it fails in that respect is an indirect refutation of the single-pass axial beam + plasma-target model, which cannot account for any of these features and must, therefore, be treated as a conjecture not supported by experiments.
8.2.4. Plasma Focus as a Circuit Element
8.3. Contours of the “Emerging Narrative”
- is not a pure z-pinch with zero poloidal magnetic field;
- cannot be represented as a Bennett z-pinch equilibrium;
- cannot be represented as a manifestation of a fusion process involving a single-pass, axial beam interacting with a combined plasma + neutral-gas target with the beam generated by the m = 0 instability and
- cannot be consistently described as a time-varying inductance in a circuit element representation.
- (a)
- A plasma sheath is initially formed as a surface discharge over the insulator, where the just-liberated electrons interact with the magnetic field that results from (1) their own drift in the electric field that builds up in the breakdown process and (2) the drift that results from their interaction with the ambient magnetic field. The result is an initial distribution of current that is not purely axial but has a helical character.
- (b)
- The initial plasma sheath gets detached from the insulator and gets accelerated by magnetic pressure. The magnetic field associated with the current flowing through the plasma sheath has all three components, with the dominant component being the azimuthal component.
- (c)
- The accelerated plasma turns around the anode shoulder and moves towards the axis in a characteristic curved shape, while retaining and amplifying a 3D magnetic field structure associated with its current carrying layer. In particular, it is associated with a poloidal magnetic field that is present also in the neutral gas between its dense plasma front and the axis.
- (d)
- The current flows behind the dense plasma sheath until it approaches the axis. A characteristic sharp dip in the current derivative signal and a spike in the voltage across the electrodes occur as the plasma reaches the axis. The moving current layer partially mimics a time-varying inductance that increases as the plasma approaches the axis and keeps increasing even after the apparent disassembly of the plasma column.
- (e)
- One or more bounded toroidal plasma structures are spontaneously formed during the radial implosion phase of the plasma sheath in the region between the dense plasma and the axis, near the interface between the neutral gas and the dense plasma, at different elevations above the anode. These structures carry all three components of current density.
- (f)
- The sheath stagnates at the axis in a funnel-shaped formation. The bounded toroidal structures are embedded in this funnel shaped formation at different axial locations. The stem of the funnel-shaped formation is compressed by the magnetic pressure of the discharge current. The axial regions of the stem between the axially separated embedded toroidal structures are compressed more than those at the axial locations of the toroids. The resulting axially non-uniform radial compression leads to a poloidal plasma flow that removes plasma from the region between the toroidal structures, leading to decrease in their radius, and adds it into the region associated with the toroidal structures. This leads to formation of one or more constrictions in the plasma column whose density gradually decreases below the detection limit of existing diagnostics.
- (g)
- The part of the stem near the axial locations of the toroidal structures bulges out into a lobular structure because of plasma that flows in. These structures bend towards the anode, creating a low density magnetized plasma bubble bounded by 3D surface currents that maintain its density gradients. This magnetized plasma bubble acts as a pressure transmitting medium that transfers the compressive magnetic pressure from the discharge current that flows at larger radial distances to the magneto-plasma formations that arise within the plasma stem. It also electrically shorts the pinch column so that the pinch voltage spike detected outside the chamber is not exactly coincident with the current derivative minimum.
- (h)
- The poloidal plasma flow pattern drives a dynamo process amplifying all the 3 components of magnetic field associated with the toroidal structures resulting in conversion of plasma kinetic energy into magnetic energy. The toroidal structures evolve into one or more plasmoidal structures with a single centrally-located density maximum. The plasmoidal and toroidal structures have internal magnetic fields which can be described as magnetic flux surfaces. Since electron motion and thermal conduction are faster along the magnetic field rather than normal to the magnetic field, the magnetic flux surfaces are also surfaces of equal electron density and electron temperature. They are, therefore, visible in soft X-ray, schlieren, and interferometry pictures (see Section 2.4.3).
- (i)
- The 3D boundaries of the magneto-plasma structures are maintained by the magnetic force density involving internal current distributions driven by the dynamo processes.
- (j)
- The evolution of magneto-plasma structures is accompanied by ion acceleration into trajectories, which can be resolved into motion perpendicular and parallel to the instantaneous local magnetic field. The perpendicular motion is a gyration about a guiding center that lies on a local magnetic field line and the parallel motion is the motion of the guiding center along that magnetic field line. The energy associated with the perpendicular motion can increase only until the local instantaneous Larmor radius becomes comparable with the scale length of the magneto-plasma, after which it is not affected by the local electric field. The energy associated with parallel motion increases without this restriction.
- (k)
- When the magnetic field line is fully embedded inside a magnetic flux surface, that also serves as a surface of constant electron density and temperature, the guiding centers of accelerated ions also appear to be moving on the flux surface. The resulting fusion reaction products have a kinetic energy different from the reaction energy in the center of mass frame. If these ions are collectively referred as a BEAM, their directionality reflects the toroidal directionality of the magnetic field lines which span a flux surface.
- (l)
- When the magnetic field lines do not span a magnetic flux surface but rather have an open helical character, the guiding centers of accelerated ions can escape outside the dense plasma. They can cause fusion reactions in the neutral gas and be detected by ion diagnostics.
- (m)
- The constricted regions of the plasma column have too few electrons to carry the existing current leading to an increase in the impedance of a virtual plasma-filled diode [10] and an increase in the local electric field. Ions accelerated in this virtual diode region move along the axis through the remains of the plasma stem, encounter a bounded magneto-plasma structure having all 3 components of embedded magnetic field, are magnetically deflected radially outward and axially towards the anode with an azimuthal displacement, and radially inward again. In this manner the ions pass through the virtual diode region repeatedly, gaining energy in each cycle. The fusion reactions between these ions and the bounded plasma structure at the far end of the plasma column have the spectral character of reactions produced by an axial ion beam interacting with a stationary target when viewed axially. The fusion neutrons or protons have the character of an azimuthally circulating ion beam when viewed perpendicular to the axis if there is a spatially resolved spectrum measurement. An enhanced spectral width is observed when they are viewed perpendicular to the axis without spatial resolution.
8.4. Open Questions of Plasma Focus Research
8.4.1. Classical Open Questions
8.4.1.1. Why Does the Neutron Yield Scale as the Fourth Power of Current?
8.4.1.2. “Optimization” of PF Devices
8.4.1.3. Why Does the Neutron Yield Scaling Fail at High Bank Energies?
- (1)
- A larger capacitor bank does not lead to a larger pinch current because of progressively more imperfect matching between the plasma load and its power source.
- (2)
- A pinch is formed and is driven at a high current but fails to produce expected neutron yield.
- (3)
- A larger capacitor bank or operation at a higher voltage fails to form a pinch—no current derivative singularity or voltage spike results anywhere during the discharge.
8.4.1.4. What Is the Efficiency with Which the Sheath Snowplows the Gas Ahead of It? How Can It Be Measured? How Does It Affect Plasma Focus Operation? What Factors Govern It?
8.4.1.5. To What Extent Is the Plasma Focus Neutron Yield Determined by the Micro-Structure of the Plasma Such as Filaments and Hot Spots?
- -
- “Hot spots are not a primary source of neutron emission” [470].
- -
- “The results obtained in this experiment indicate that there is no correlation between the presence or the number of hot spots and the total neutron yield.” [431].
- -
- There are no correlations between the number of hot-spots and the neutron yields [152].
8.4.1.6. Why Does the Addition of High z Gases Increase the Neutron Yield in Some but Not All Devices?
8.4.2. Open Questions Related to the Emerging Narrative
8.4.2.1. Does There Exist an Axial Magnetic Field in Every Plasma Focus?
8.4.2.2. Does the ICDMP BEAM-TARGET Model Explain the Neutron Yield from Every Plasma Focus?
8.4.2.3. Are Hard X-rays and Neutrons Generated at the Same Time in All PF Devices?
8.4.2.4. Does Neutron Emission Begin before the Current Derivative Singularity in All PF Devices?
8.4.2.5. Are plasmoids Generated in All PF Devices?
8.5. Implications: Question Mark over the Fundamental Premise of Controlled Fusion Research
9. Future Course of Action
9.1. Short Term (0–3 Years) Activities
9.1.1. Voluntary Adoption of Certain Reporting Standards
9.1.2. Replication of Unusual Observations
- (a)
- Non-simultaneity of characteristic voltage and current-derivative extrema.
- (b)
- Monotonic growth of inductance calculated from current and voltage waveforms.
- (c)
- Different times of origin of X-ray and neutron pulses.
- (d)
- In heavy gases, time of emission of SXR and HXR in relation with current derivative waveform.
- (e)
- Ion time of flight measurements in different angular directions.
9.1.3. Detection of Azimuthal Electric Field outside the Plasma
9.2. Medium Term (1–7 Years) Activities
9.2.1. Digital Interferometry on kJ Level Plasma Focus Devices with Nanosecond Laser
9.2.2. Neutron and HXR Source Imaging with Sub-Millimeter Spatial Resolution
9.2.3. Pilot Projects for Exploration of Alternate Plasma Initiation Methods
9.3. Longer Term Activities (2–10 Years)
10. Tribute to Vladimir Gribkov
 | Prof. Vladimir Alekseevich Gribkov |
11. Summary and Conclusions
- -
- A coherent presentation of major experimental results and their interpretations.
- -
- Demonstration that certain commonly held beliefs about the plasma focus phenomenon are not supported by experimental data.
- -
- Delineation of the outlines of an emerging narrative concerning the plasma focus phenomenon that is supported by experimental data but does require more validation.
- -
- An appreciation of several open questions, some known for many decades and yet to be satisfactorily resolved and some new ones that could be answers by newly suggested experiments.
- -
- A recommendation for a future course of action for the plasma focus community.
Funding
Data Availability Statement
Acknowledgments
Conflicts of Interest
Appendix A
A Brief Summary of Activities of ICDMP over Its 20 Year Span
- (1)
- AGREEMENT between the United Nations Educational, Scientific and Cultural Organizaion and the National Atomic Energy Agency of the Republic of Poland concerning establishment and operation of the International Center for Dense Magnetized Plasmas dated 24 August 1999 (http://www.icdmp.pl/2012-07-03-16-49-16/unesco-agreement, accessed on 15 July 2021).
- (2)
- AGREEMENT between the International Scientific Committee for Dense Magnetized Plasmas and the Institute of Plasma Physics and Laser Microfusion on the establishment and operation of the “International Centre for Dense Magnetised Plasmas” dated 17 October 2000 (http://www.icdmp.pl/icdmp-charter, accessed on 15 July 2021).
- The main tasks of the centre are:
- Contribution—through research, training and education—to the progress of knowledge in dense magnetized plasma physics, as well as related technology fields.
- Promotion and implementation of research findings into practical applications.
- Support and maintenance of international scientific co-operation, exchange, and communication.
- Dissemination of information on scientific achievements.
- To this effect, the centre will carry out the following activities:
- Experimental and theoretical research.
- Education activity and specialized training.
- Provision of a platform for contacts and exchange of information among scientists from all the countries.
- Co-operation with industrial enterprises and institutions in order to implement scientific findings into practical use.
- Dissemination of the knowledge, mainly through publications and organization of scientific meetings.
- The centre will arrange agreements on bilateral or multilateral collaboration with other laboratories and institutions. The agreements have to be accepted by partners according to their national rules. Joint research programmes of the centre and the partners will be approved by the International Scientific Committee for Dense Magnetized Plasmas on a regular basis.
- The centre shall not be considered as constituting a part of, and agent for, UNESCO, and shall not carry out any activities contrary to the principles of UNESCO.
Appendix B


References
- Bernard, A.; Bruzzone, H.; Choi, P.; Chuaqui, H.; Gribkov, V.; Herrera, J.; Hirano, K.; Lee, S.; Luo, C.; Mezzetti, F.; et al. Scientific status of the dense plasma focus. J. Mosc. Phys. Soc. 1998, 8, 93–170. [Google Scholar]
- Mather, J.W. Dense Plasma Focus. Methods Exp. Phys. 1971, 9, 187–249. [Google Scholar]
- Bernard, A. Plasma Focus at Applications, LE VIDE. Soc. Fr. Vide 2002, 306, 836. [Google Scholar]
- Gribkov, V.A.; Banaszak, A.; Jakubowski, L.; Sadowski, M.J.; Szydlowski, A.; Bienkowska, B.; Borowiecki, M.; Ivanova-Stanik, I.; Karpinski, L.; Miklaszewski, R.A.; et al. Transient Phenomena in the Final Implosion Stage at the PF-1000 Facility; Preprint IC/2006/United Nations: 2006; Abdus Salam International Center for Theoretical Physics: Trieste, Italy, 2006; Available online: https://inis.iaea.org/collection/NCLCollectionStore/_Public/39/016/39016690.pdf (accessed on 15 July 2021).
- Brzosko, J.S.; Degnan, J.H.; Filippov, N.V.; Freeman, B.L.; Kiutlu, G.F.; Mather, J.W. Comments on the Feasibility of Achieving Scientific Break-Even with a Plasma Focus Machine. In Current Trends in International Fusion Research; Springer Science and Business Media LLC: Berlin/Heidelberg, Germany, 1997; pp. 11–32. [Google Scholar]
- Soto, L. New trends and future perspectives on plasma focus research. Plasma Phys. Control Fusion 2005, 47, A361–A381. [Google Scholar] [CrossRef] [Green Version]
- Krauz, V. Progress in plasma focus research and applications. Plasma Phys. Control Fusion 2006, 48, B221–B229. [Google Scholar] [CrossRef]
- Vikhrev, V.V.; Korolev, V.D. Neutron generation from Z-pinches. Plasma Phys. Rep. 2007, 33, 356–380. [Google Scholar] [CrossRef]
- Gribkov, V.; Bienkowska, B.; Borowiecki, M.; Dubrovsky, A.V.; Ivanova-Stanik, I.; Karpinski, L.; Miklaszewski, R.; Paduch, M.; Scholz, M.; Tomaszewski, K. Plasma dynamics in PF-1000 device under full-scale energy storage: I. Pinch dynamics, shock-wave diffraction, and inertial electrode. J. Phys. D Appl. Phys. 2007, 40, 1977–1989. [Google Scholar] [CrossRef]
- Gribkov, V.; Banaszak, A.; Bienkowska, B.; Dubrovsky, A.V.; Ivanova-Stanik, I.; Jakubowski, L.; Karpinski, L.; Miklaszewski, R.; Paduch, M.; Sadowski, M.J.; et al. Plasma dynamics in the PF-1000 device under full-scale energy storage: II. Fast electron and ion characteristics versus neutron emission parameters and gun optimization perspectives. J. Phys. D Appl. Phys. 2007, 40, 3592–3607. [Google Scholar] [CrossRef] [Green Version]
- Krishnan, M. The Dense Plasma Focus: A Versatile Dense Pinch for Diverse Applications. IEEE Trans. Plasma Sci. 2012, 40, 3189–3221. [Google Scholar] [CrossRef]
- Rawat, R.S. Dense Plasma Focus—From Alternative Fusion Source to Versatile High Energy Density Plasma Source for Plasma Nanotechnology. J. Phys. Conf. Ser. 2015, 591, 012021. [Google Scholar] [CrossRef]
- Dubinov, A.E.; Fomicheva, E.I.; Senilov, L.A. Research with plasma foci in countries of Asia, Africa, and Latin America. Rev. Mod. Plasma Phys. 2020, 4, 1–173. [Google Scholar] [CrossRef]
- Filipov, N.V.; Filipova, T.I.; Vinogradov, V.P. Dense high temperature plasma in a non-cylindrical Z-pinch compression (in Russian). Nucl. Fusion Suppl. 1962, 2, 577–587. [Google Scholar]
- Mather, J.W. Investigation of the High-Energy Acceleration Mode in the Coaxial Gun. Phys. Fluids 1964, 7, S28. [Google Scholar] [CrossRef]
- Zucker, O.; Bostick, W.; Long, J.; Luce, J.; Sahlin, H. The plasma focus as a large fluence neutron source. Nucl. Instrum. Methods 1977, 145, 185–190. [Google Scholar] [CrossRef]
- Post, R.F. Controlled Fusion Research—An Application of the Physics of High Temperature Plasmas. Rev. Mod. Phys. 1956, 28, 338–362. [Google Scholar] [CrossRef]
- Bostick, W.H. The pinch effect revisited. Int. J. Fus. Energy 1977, 1, 1–55. [Google Scholar]
- Bennett, W.H. Magnetically Self-Focussing Streams. Phys. Rev. 1934, 45, 890–897. [Google Scholar] [CrossRef]
- Ware, K.D.; Williams, A.H.; Clark, R.W. Operation of a 720 kJ, 60 kV, Dense Plasma Focus. Bull. Amer. Phys. Soc. 1973, 18, 1363. [Google Scholar]
- Nuckolls, J.; Wood, L.; Thiessen, A.; Zimmermann, G. Laser Compression of Matter to super high densities: Thermonuclear (CTR) applications. Nature 1972, 239, 139–142. [Google Scholar] [CrossRef]
- Brueckner, K.A.; Jorna, S. Laser-driven fusion. Rev. Mod. Phys. 1974, 46, 325–367. [Google Scholar] [CrossRef]
- Conrads, H.; Cloth, P.; Demmeler, M.; Hecker, R. Velocity distribution of the ions producing neutrons in a plasma focus. Phys. Fluids 1972, 15, 209–210. [Google Scholar] [CrossRef]
- Belyaeva, I.; Filippov, N. Location of fast deuterons in a plasma focus. Nucl. Fusion 1973, 13, 881–882. [Google Scholar] [CrossRef]
- Krompholz, H.; Michel, L.; Schönbach, K.H.; Fischer, H. Neutron-, ion-, and electron-energy spectra in a 1 kJ plasma focus. Appl. Phys. A 1977, 13, 29–35. [Google Scholar] [CrossRef]
- Gullikson, R.L.; Sahlin, H.L. Measurements of high-energy deuterons in the plasma-focus device. J. Appl. Phys. 1978, 49, 1099–1105. [Google Scholar] [CrossRef]
- Bernard, A.; Garçonnet, J.P.; Jolas, A.; Le Breton, J.P.; De Mascureau, J.; Romary, P. Plasma focus research at the Centre d’Etudes de Limeil (Invited paper). In Proceedings of the Plasma Sci. Montreal, Vancouver, BC, Canada, 7–9 June 1993. [Google Scholar]
- Maisonnier, C.; Rager, J.P. Associazione Euratom-CNEN Sulla Fusione Report 79.31/cc June; Associazione Euratom-CNEN Sulla Fusione: Frascati, Italy, 1979. [Google Scholar]
- Filippov, N.V.; Filippova, T.I. Subterrawatt ion beams in a plasma focus. Sov. JETP Lett. 1979, 29, 689–692. [Google Scholar]
- Bertalot, L.; Herold, H.; Jäger, U.; Mozer, A.; Oppenländer, T.; Sadowski, M.J.; Schmidt, H. Mass and energy analysis and space-resolved measurements of ions from plasma focus devices. Phys. Lett. A 1980, 79, 389–392. [Google Scholar] [CrossRef]
- Sadowski, M.; Schmidt, H.; Herold, H. Time-resolved studies of deuteron beams emitted from a plasma focus. Phys. Lett. 1981, 83, 435–439. [Google Scholar] [CrossRef]
- Cebanu, A.; Chera, T.; Dinu, L.; Ionescu, G.; Ionescu-Bujor, T.; Iordanescu, A.; Mandache, N.; Tsois, N.; Vlad, M.; Zaharescu, M.; et al. Generation and diagnostics of energetic particles and plasmas in focus devices. In Proceedings of the 8th International Conference Plasma Physics & Controlled Nuclear Fusion Research, Brussels, Belgium, 1–10 July 1980; IAEA: Vienna, Austria, 1981; Volume II, p. 197. Available online: http://www-naweb.iaea.org/napc/physics/FEC/old_fus_en_conf.htm (accessed on 15 July 2021).
- Stygar, W.; Gerdin, G.; Venneri, F.; Mandrekas, J. Particle beams generated by a 6–12.5 kJ dense plasma focus. Nucl. Fusion 1982, 22, 1161–1172. [Google Scholar] [CrossRef]
- Mozer, A.; Sadowski, M.J.; Herold, H.; Schmidt, H. Experimental studies of fast deuterons, impurity- and admixture-ions emitted from a plasma focus. J. Appl. Phys. 1982, 53, 2959–2964. [Google Scholar] [CrossRef]
- Bocancea, A.; Mandache, N. Analyzer system of the plasma-focus ionic component. Rev. Roum. Phys. 1983, 28, 413. [Google Scholar]
- Sadowski, M.; Chyrczakowski, S.; Komar, W.; Rydygier, W.; Żebrowski, J. Studies on ion beams pro-duced in a plasma focus, Part II. In Proceedings of the 3rd International Workshop on Plasma Focus Research, Stuttgart, Germany, 12–13 September 1983; Report IPF-83-6. pp. 39–42. [Google Scholar]
- Khautiev, E.Y.; Krauz, V.I.; Salukvadze, R.G. Some features of ion beam formation in a plasma focus. In Proceedings of the 11th Europ. Conf. Controlled Fusion & Plasma Physics, Aachen, Germany, 5–9 September 1983; ECA 7D, Part I. p. 505. [Google Scholar]
- Sadowski, M.J.; Zebrowski, J.; Rydygier, E.; Herold, H.; Jager, U.; Schmidt, H. Multi-spike structure of ion pulses generated by plasma focus discharges. Phys. Lett. A 1985, 113, 25–31. [Google Scholar] [CrossRef]
- Schneider, R.F.; Rhee, M.J. Proceedings of the 4th International Workshop on Plasma Focus and Z-Pinch Research, Warsaw, Poland, 9–11 September 1985; p. 108.
- Yamamoto, T.; Shimoda, K.; Hirano, K. Neutrons, X-rays and Charged Particle Beams Emission in a 65 kV Plasma Focus. Jpn. J. Appl. Phys. 1985, 24, 324–327. [Google Scholar] [CrossRef]
- Nardi, V. Megagauss Technology and Power Applications; Plenum: New York, NY, USA; London, UK, 1987; p. 269. [Google Scholar]
- Jäger, U.; Herold, H. Fast ion kinetics and fusion reaction mechanism in the plasma focus. Nucl. Fusion 1987, 27, 407–423. [Google Scholar] [CrossRef]
- Sadowski, M.J.; Zebrowski, J.; Rydygier, E.; Kucinski, J. Ion emission from plasma-focus facilities. Plasma Phys. Control Fusion 1988, 30, 763–769. [Google Scholar] [CrossRef]
- Filippov, N.V. Acceleration of Aluminium ions in a plasma focus. Sov. Phys. JETP 1979, 49, 785–786. [Google Scholar]
- Filippov, N.V.; Filippov, A.N.; Brzosko, J.R. Generation and Acceleration of Multicharged Heavy Ions in the Anode Contact Zone of the Plasma Focus. In Proceedings of the XXII International Conference on Phenomena in Ionized Gases, Hoboken, NJ, USA, 31 July–4 August 1995; Contributed Papers 4. pp. 9–10. [Google Scholar]
- Kelly, H.; Lepone, A.; Sadowski, M.J.; Baranowski, J.; Skladnik-Sadowska, E.; Marquez, A. Analysis of the nitrogen ion beam generated in a low-energy plasma focus device by a Faraday cup operating in the secondary electron emission mode. IEEE Trans. Plasma Sci. 1998, 26, 113–117. [Google Scholar] [CrossRef]
- Pasternak, A.; Sadowski, M. Analysis of ion trajectories within a pinch column of a PF-type discharge. In Proceedings of the 1998 ICPP & 25th EPS Conf. CF&PP, Prague, Czech Repulic, 29 June–3 July 1998; ECA Volume 22C. pp. 2161–2164. [Google Scholar]
- Scholz, M.; Karpinski, L.; Pisarczyk, T.; Sadowski, M.; Jakubowski, L.; Szydlowski, A.; Faenov, A.Y.; Pikuz, S.A.; Romanova, V.M. Study of current sheath dynamics and charged particle emission from PF-1000. In Proceedings of the 1998 ICPP & 25th EPS Conf. CF&PP, Prague, Czech Repulic, 29 June–3 July 1998; ECA Volume 22C. pp. 2868–2871. [Google Scholar]
- Sadowski, M.; Zebrowski, J.; Jakubowski, L. Research on emission of charged particle beams from PF-360 facility. In Proceedings of the 1998 ICPP & 25th EPS Conf. CF&PP, Prague, Czech Repulic, 29 June–3 July 1998; ECA Volume 22C. pp. 2876–2879. [Google Scholar]
- Pasternak, A.; Sadowski, M. Theoretical study of ion motion within a plasma-focus region. J. Techn. Phys. 1998, 39, 45. [Google Scholar]
- Scholz, M.; Karpiński, L.; Kasperczuk, A.; Pisarczyk, T.; Sadowski, M.; Jakubowski, L.; Szydlowski, A.; Faenov, A.Y.; Romanova, V.M. Studies of noncylindrical pinch dynamics and charged particle emis-sion within PF-1000 facility. J. Techn. Phys. 1998, 39, 67. [Google Scholar]
- Szydlowski, A.; Sadowski, M.; Scholz, M. Measurements of ion beams on the PF-1000 facility by means of nuclear track detectors. J. Techn. Phys. 1998, 39, 73. [Google Scholar]
- Kelly, H.; Lepone, A.; Marquez, A.; Sadowski, M.; Baranowski, J.; Skladnik-Sadowska, E. Faraday-cup measurements of deuteron beams generated by a small PF device. J. Techn. Phys. 1998, 39, 103. [Google Scholar]
- Sadowski, M.; Skladnik-Sadowska, E.; Baranowski, J.; Milanese, M.; Moroso, R.; Pouzo, J. Structure of ion beams emitted from a small PACO PF-device. J. Techn. Phys. 1998, 39, 109. [Google Scholar]
- Sadowski, M.; Zebrowski, J. Diagnostic methods of experimental studies on emission of pulsed deuteron and electron beams from the PF-360 facility. J. Techn. Phys. 1998, 39, 115. [Google Scholar]
- Sadowski, M.J.; Szydlowski, A.; Scholz, M.; Kelly, H.; Marquez, A.; Lepone, A. Application of solid-state nuclear track detectors for studies of fast ion beams within PF-1000 and other plasma-focus facilities. Radiat. Meas. 1999, 31, 185–190. [Google Scholar] [CrossRef]
- Składnik-Sadowska, E.; Baranowski, J.; Milanese, M.M.; Moroso, R.; Pouzo, J.; Sadowski, M.; Żebrowski, J. Research on structure of ion beams from the PACO-PF device. J. Tech. Phys. 1999, 40, 129. [Google Scholar]
- Jakubowski, L.; Baranowski, J.; Sadowski, M.; Żebrowski, J. Ion beam measurements within MA-JA-Plasma-Focus facility. J. Tech. Phys. 1999, 40, 137. [Google Scholar]
- Pasternak, A.; Sadowski, M. Modeling of ions kinetics in dynamic PF pinch column. J. Tech. Phys. 1999, 40, 141. [Google Scholar]
- Pasternak, A.; Sadowski, M.J.; Gaŀkowski, A. 3D modelling of ion motion within dynamic filamentary PF-pinch column. Czechoslov. J. Phys. 2000, 50, 159–163. [Google Scholar] [CrossRef]
- Sadowski, M.; Skladnik-Sadowska, E.; Baranowski, J.; Zebrowski, J.; Kelly, H.; Lepone, A.; Marquez, A.; Milanese, M.; Moroso, R.; Pouzo, J. Comparison of characteristics of pulsed ion beams emitted from dif-ferent small PF devices. Nukleonika 2000, 45, 179–184. [Google Scholar]
- Jakubowski, L.; Sadowski, M.; Zebrowski, J. Measurements of charged particle beams from plas-ma-focus discharges. Nucl. Fusion 2001, 41, 755–760. [Google Scholar] [CrossRef]
- Pasternak, A.; Sadowski, M. Study of deuteron motion in a filamentary PF pinch column for different configurations of filaments. Nukleonika 2001, 46, S29–S32. [Google Scholar]
- Szydłowski, A.; Scholz, M.; Karpiński, L.; Sadowski, M.; Tomaszewski, K.; Paduch, M. Neutron and fast ion emission from PF-1000 facility equipped with new large electrodes. Nukleonika 2001, 46, S61–S64. [Google Scholar]
- Skladnik-Sadowska, E.; Baranowski, J.; Milanese, M.; Moroso, R.; Pouzo, J.; Sadowski, M.J.; Zebrowski, J. Spatial structure and energy spectrum of ion beams studied with CN detectors within a small PF device. Radiat. Meas. 2001, 34, 315–318. [Google Scholar] [CrossRef]
- Jakubowski, L.; Sadowski, M.J. Hot-spots in plasma-focus discharges as intense sources of different ra-diation pulses. Brazil. J. Phys. 2002, 32, 187–192. [Google Scholar] [CrossRef]
- Pasternak, A.; Sadowski, M.J.; Galkowski, A. Progress in modeling of ion kinetics in plasma-focus dis-charges. Czech. J. Phys. 2002, 52, D177–D181. [Google Scholar]
- Moreno, J.; Pedreros, J.; Soto, L. Measurements of ions emission using Tof method and CR39 SSNTD in a Small Plasma Focus device of Hundreds of Joules. J. Phys. Conf. Ser. 2014, 511, 012025. [Google Scholar] [CrossRef] [Green Version]
- Moreno, J.; Morales, D.; Avaria, G.; Cuadrado, O.; Soto, L. Ion emission study using visible spectroscopy and Tof method in a plasma focus device of two kilojoules. J. Phys. Conf. Ser. 2015, 591, 012023. [Google Scholar] [CrossRef] [Green Version]
- Jain, J.; Moreno, J.; Davis, S.; Bora, B.; Pavez, C.; Avaria, G.; Soto, L. Experimental evidence of more than one ions acceleration mechanisms in plasma focus device: Observations and interpretations. Phys. Plasmas 2019, 26, 103105. [Google Scholar] [CrossRef]
- Banaszak, A.; Szydlowski, A.; Sadowski, M.J.; Paduch, M.; Schmidt, H.; Scholz, M.; Wolowski, J.; Bonheure, G.; Van Wassenhove, G. Application of pm-351 solid-state nuclear track detectors for ion diag-nostics in high-temperature plasma experiments. Czech. J. Phys. 2004, 54, C223–C227. [Google Scholar] [CrossRef]
- Szydlowski, A.; Banaszak, A.; Bienkowska, B.; Ivanova-Stanik, I.; Scholz, M.; Sadowski, M.J. Measure-ments of fast ions and neutrons emitted from PF-1000 plasma focus device. Vacuum 2004, 76, 357–360. [Google Scholar] [CrossRef]
- Gribkov, V.A.; Dubrovsky, A.V.; Miklaszewski, R.; Paduch, M.; Tomaszewski, K.; Scholz, M.; Pimenov, V.N.; Ugaste, Y.E.; Sadowski, M.J.; Skladnik-Sadowska, E.; et al. Experimental studies of the interaction of ion- and plasma-streams with carbon-based targets placed near a cathode of plasma-focus facility. Plasma Phys. 2005, 10, 92–94. [Google Scholar]
- Szydlowski, A.; Banaszak, A.; Sadowski, M.J.; Scholz, M.; Wolowski, J. Advantages of the use of solidstate nuclear track detectors in high-temperature plasma experiments. Radiat. Meas. 2005, 40, 479–482. [Google Scholar] [CrossRef]
- Zebrowski, J.; Sadowski, M.J.; Jakubowski, L. Correlation of Neutron Emission with Other Corpuscular and X-ray Pulses in Different Plasma-Focus Experiments. AIP Conf. Proc. 2006, 812, 229–232. [Google Scholar] [CrossRef]
- Malinowska, A.; Szydlowski, A.; Zebrowski, J.; Sadowski, M.J.; Scholz, M.; Schmidt, H.; Karpinski, P.; Jaskola, M.; Korman, A. Time-integrated measurements of fusion-produced protons emitted from PF-facilities. AIP Conf. Proc. 2006, 812, 237–240. [Google Scholar] [CrossRef]
- Malinowski, K.; Skladnik-Sadowska, E.; Sadowski, M.J.; Scholz, M.; Schmidt, H.; Czaus, K. Analysis Of The Structure Of Ion Micro-Beams Emitted From RPI- And PF-Type Facilities. AIP Conf. Proc. 2006, 812, 256–259. [Google Scholar] [CrossRef]
- Gribkov, V.A.; Malinowska, A.; Bieńkowska, B.; Dubrovsky, A.V.; Ivanova-Stanik, I.; Jakubowski, L.; Karpiński, L.; Miklaszewski, R.; Paduch, M.; Sadowski, M.J.; et al. Plasma and beams in PF-1000 device under the full-scale energy storage. AIP Conf. Proc. 2006, 875, 5–10. [Google Scholar]
- Malinowska, A.; Szydlowski, A.; Malinowski, K.; Sadowski, M.J.; Scholz, M.; Paduch, M.; Ivanova-Stanik, I.; Kubes, P. Investigation of fusion-reaction protons from PF-discharges. Czechoslov. J. Phys. 2006, 56, B303–B308. [Google Scholar] [CrossRef]
- Sadowski, M.J.; Gribkov, V.; Kubes, P.; Malinowski, K.; Skladnik-Sadowska, E.; Scholz, M.; Tsarenko, A.; Zebrowski, J. Application of intense plasma-ion streams emitted from powerful PF-type discharges for material engineering. Phys. Scr. 2006, T123, 66–78. [Google Scholar] [CrossRef]
- Scholz, M.; Bienkowska, B.; Ivanova-Stanik, I.M.; Karpinski, L.; Paduch, M.; Stepniewski, W.; Zielinska, E.; Kravarik, J.; Kubes, P.; Malinowska, A.; et al. Studies of pinch dynamics and fusion-products emission within megajoule plasma-focus facility. Rus. Phys. J. 2006, 49, 161–164. [Google Scholar]
- Żebrowski, J.; Sadowski, M.J.; Jakubowski, L.; Scholz, M.; Kubes, P. Research on correlation of x-ray pulses with electron-, ion- and neutron-emission from high-current PF-discharges. Rus. Phys. J. 2006, 49, 165–168. [Google Scholar]
- Skladnik-Sadowska, E.; Malinowski, K.; Marchenko, A.; Sadowski, M.J.; Scholz, M.; Karpinski, L.; Paduch, M.; Zielinska, B.; Gribkov, V.A.; Hartfuss, H.-J.; et al. Studies of Pulsed Plasma-Ion Streams During Their Free Propagation And Interaction with Carbon-Tungsten Targets in PF-1000 Facility. AIP Conf. Proc. 2008, 993, 365–368. [Google Scholar] [CrossRef]
- Malinowska, A.; Malinowski, K.; Sadowski, M.J.; Zebrowski, J.; Szydlowski, A. Experimental Studies of Fast Protons Originated from Fusion Reactions in Plasma-Focus Discharges. AIP Conf. Proc. 2008, 993, 354–356. [Google Scholar] [CrossRef]
- Malinowska, A.; Szydlowski, A.; Sadowski, M.J.; Zebrowski, J.; Scholz, M.; Paduch, M.; Jaskola, M.; Korman, A. Measurements of fusion-produced protons by means of SSNTDs. Radiat. Meas. 2008, 43, S295–S298. [Google Scholar] [CrossRef]
- Kubes, P.; Kravarik, J.; Klir, D.; Rezac, K.; Bohata, M.; Scholz, M.; Paduch, M.; Tomaszewski, K.; Ivanova-Stanik, I.; Karpinski, L.; et al. Determination of Deuteron Energy Distribution From Neutron Diagnostics in a Plasma-Focus Device. IEEE Trans. Plasma Sci. 2008, 37, 83–87. [Google Scholar] [CrossRef]
- Sadowski, M.J.; Scholz, M.; Stepniewski, W.; Malinowski, K. Modeling of motions of fast protons in fila-mentary pinches. In Proceedings of the 29th ICPIG, Cancun, Mexico, 12–17 July 2009; pp. 5–6. [Google Scholar]
- Malinowska, A.; Szydlowski, A.; Czaus, K.; Sadowski, M.J.; Scholz, M.; Zebrowski, J.; Scholz, M.; Paduch, M.; Zielinska, E.; Jaskola, M.; et al. Application of SSNTD for measurements of fusion prod-ucts in high-temperature plasma experiments. Radiat. Meas. 2009, 44, 878–880. [Google Scholar] [CrossRef]
- Springham, S.V.; Roshan, M.V.; Malik, F.; Sim, T.H.; Mahmood, S.; Hassan, S.M.; Shutler, P.M.E.; Tan, T.L.; Rawat, R.S.; Lee, P. Plasma Focus Fusion Research in Singapore. In Dense Magnetized Plasmas; IAEA-TECDOC-16992013; IAEA: Vienna, Austria, 2007; pp. 115–130. [Google Scholar]
- Sadowski, M.J.; Czaus, K.; Malinowski, K.; Skladnik-Sadowska, E.; Zebrowski, J. Mass- and energy-analysis of ions from plasma by means of a miniature Thomson spectrometer. Rev. Sci. Instrum. 2009, 80, 053504. [Google Scholar] [CrossRef] [PubMed]
- Składnik-Sadowska, E.; Czaus, K.; Kwiatkowski, R.; Malinowski, K.; Sadowski, M.J.; Zebrowski, J.; Karpinski, L.; Paduch, M.; Scholz, M. Recent studies of the ion emission from high-current PF-1000 experiments. Probl. Atom. Sci. Technol.Ser. Plasma Phys. 2010, 16, 199–201. [Google Scholar]
- Kwiatkowski, R.; Skladnik-Sadowska, E.; Sadowski, M.J.; Malinowski, K.; Czaus, K.; Żebrowski, J.; Karpinski, L.; Paduch, M.; Scholz, M.; Garkusha, I.E.; et al. Measurements of electron and ion beams emitted from PF-1000 device in the upstream and downstream direction. Nukleonika 2011, 56, 119–123. [Google Scholar]
- Kwiatkowski, R.; Sadowski, M.J.; Składnik-Sadowska, E.; Żebrowski, J.; Malinowski, K.; Czaus, K.; Garkusha, I.E. Research on spatial- and energetic-characteristics of ion beams emitted from PF-360 discharges. Nukleonika 2012, 57, 67–74. [Google Scholar]
- Kwiatkowski, R.; Sadowski, M.J.; Składnik-Sadowska, E.; Żebrowski, J.; Malinowski, K.; Czaus, K.; Garkusha, I.E. Time- and space-resolved measurements of high-energy ion beams emitted from PF-type discharges. Nukleonika 2012, 57, 211–214. [Google Scholar]
- Lerner, E.J.; Murali, S.K.; Shannon, D.; Blake, A.M.; Van Roessel, F. Fusion reactions from >150 keV ions in a dense plasma focus plasmoid. Phys. Plasmas 2012, 19, 032704. [Google Scholar] [CrossRef]
- Kwiatkowski, R.; Czaus, K.; Skladnik-Sadowska, E.; Sadowski, M.J.; Zaloga, D.R.; Paduch, M.; Zielinska, E. Recent ion measurements within the modified DPF-1000U facility. Nukleonika 2015, 60, 297–302. [Google Scholar] [CrossRef] [Green Version]
- Kwiatkowski, R.; Czaus, K.; Paduch, M.; Sadowski, M.J.; Skladnik-Sadowska, E.; Zielinska, E. Time- And Energy-Resolved Measurements Of Ion Beams Emitted From Plasma-Focus Type Discharges. In Proceedings of the 1st EPS conference on Plasma Diagnostics, Frascati, Italy, 14–17 April 2015; Volume 240, p. 121. Available online: https://pos.sissa.it/240/121/ (accessed on 15 July 2021).
- Kwiatkowski, R.; Czaus, K.; Paduch, M.; Sadowski, M.J.; Skladnik-Sadowska, E.; Zaloga, D.R.; Zielińska, E.; Zebrowski, J. Energy- and Time-Resolved Measurements of Fast Ions Emitted from Plasma-Focus Discharges by Means of a Thomson Spectrometer; SPIE: Wilga, Poland, 2015. [Google Scholar] [CrossRef]
- Malinowski, K.; Skladnik-Sadowska, E.; Sadowski, M.J.; Szydlowski, A.; Czaus, K.; Kwiatkowski, R.; Zaloga, D.; Paduch, M.; Zielińska, E. Research on anisotropy of fusion-produced protons and neutrons emission from high-current plasma-focus discharges. Rev. Sci. Instrum. 2015, 86, 13502. [Google Scholar] [CrossRef]
- Kubes, P.; Paduch, M.; Cikhardt, J.; Cikhardtova, B.; Klir, D.; Kravarik, J.; Rezac, K.; Zielinska, E.; Sadowski, M.J.; Szymaszek, A.; et al. Filamentation in the pinched column of the dense plasma focus. Phys. Plasmas 2017, 24, 32706. [Google Scholar] [CrossRef]
- Kubes, P.; Paduch, M.; Sadowski, M.J.; Cikhardt, J.; Cikhardtova, B.; Klir, D.; Kravarik, J.; Munzar, V.; Rezac, K.; Zielinska, E.; et al. Charac-terization of fast deuterons involved in the production of fusion neutrons in a dense plasma focus. Phys. Plasmas 2018, 25, 012712. [Google Scholar] [CrossRef]
- Sadowski, M.J. Comments on recent achievements of research on dense magnetized plasmas in Poland. Probl. Atom. Sci. Technol. Ser. Plasma Phys. 2018, 6, 121–126. [Google Scholar]
- Kubes, P.; Paduch, M.; Sadowski, M.J.; Cikhardt, J.; Cikhardtova, B.; Klir, D.; Kravarik, J.; Munzar, V.; Rezac, K.; Skladnik-Sadowska, E.; et al. Evolution of a Pinch Column During the Acceleration of Fast Electrons and Deuterons in a Plasma-Focus Discharge. IEEE Trans. Plasma Sci. 2019, 47, 339–345. [Google Scholar] [CrossRef]
- Damideh, V.; Chin, O.; Saw, S.; Lee, P.; Rawat, R.S.; Lee, S. Characteristics of Fast ion beam in Neon and Argon filled plasma focus correlated with Lee Model Code. Vacuum 2019, 169, 108916. [Google Scholar] [CrossRef]
- Kubes, P.; Paduch, M.; Sadowski, M.J.; Cikhardt, J.; Cikhardtova, B.; Klir, D.; Kravarik, J.; Kwiat-kowski, R.; Munzar, V.; Rezac, K.; et al. Features of fast dfeuterons emitted from plasma focus discharges. Phys. Plasmas 2019, 26, 032702. [Google Scholar] [CrossRef]
- Kubes, P.; Paduch, M.; Sadowski, M.J.; Cikhardt, J.; Klir, D.; Kravarik, J.; Kwiatkowski, R.; Munzar, V.; Rezac, K.; Szymaszek, A.; et al. Scenario of a magnetic dynamo and magnetic reconnection in a plasma focus discharge. Matter Radiat. Extrem. 2020, 5, 046401. [Google Scholar] [CrossRef]
- Kubes, P.; Paduch, M.; Sadowski, M.J.; Cikhardtova, B.; Cikhardt, J.; Klir, D.; Kravarik, J.; Kwiatkowski, R.; Munzar, V.; Rezac, K.; et al. Characteristics of closed currents and magnetic fields outside the dense pinch column in a plasma focus discharge. Phys. Plasmas 2020, 27, 092702. [Google Scholar] [CrossRef]
- Sadowski, M.; Paduch, M.; Kubes, P.; Krauz, V.; Gribkov, V. Recent Achievements of Plasma Studies within PF-1000U Facility. Acta Phys. Pol. A 2020, 138, 613–621. [Google Scholar] [CrossRef]
- Kubes, P.; Paduch, M.; Sadowski, M.J.; Cikhardt, J.; Cikhardtova, B.; Klir, D.; Kravarik, J.; Kwiatkowski, R.; Munzar, V.; Rezac, K.; et al. Characteristics of fast deuteron sources generated in a dense plasma focus. Eur. Phys. J. Plus 2021, 136, 810. [Google Scholar] [CrossRef]
- Bostick, W.H.; Nardi, V.; Prior, W. Production and Confinement of High-Density Plasmas. Ann. N. Y. Acad. Sci. 1975, 251, 2–29. [Google Scholar] [CrossRef]
- Bostick, W.H.; Grunberger, L.; Prior, W. Neutron Production by Vortex Annihilation in the Plasma Focus. Proc. of 3rd EPS conf. on Cont. Fusion and Plasma Physics, Utrecht, Netherlands. 1969, p. 125. Available online: http://dx.doi.org/10.1007/BF01118673 (accessed on 13 July 2021).
- Bostick, W.H.; Grunberger, L.; Prior, W.; Nardi, N. Neutron Production by Vortex Annihilation in the Plasma Focus. Proc. 4th Eur. Conf. Contr. Fus. Plas. Phys. Rome, Italy. 1970, p. 108. Available online: http://dx.doi.org/10.1007/BF01164689 (accessed on 13 July 2021).
- Bostick, W.H. Pair Production of Plasma Vortices. Phys. Fluids 1966, 9, 2078. [Google Scholar] [CrossRef]
- Herold, H.; Bertalot, L.; Jaeger, U.; Schmidt, H.; Schmidt, R.; Shakhatre, M. Plasma Dynamics, Neutron and Ion Emission of the POSEIDON Plasma Focus. Proc. 11th Europ. Conf. Control Fusion Plasma Phys, Aachen, Germany. 1983, p. 477. Available online: http://iopscience.iop.org/issue/0741-3335/26/1A (accessed on 13 July 2021).
- Sadowski, M.J.; Herold, H.; Schmidt, H.; Shakhatre, M. Filamentary structure of the pinch column in plasma focus discharges. Phys. Lett. A 1984, 105, 117–123. [Google Scholar] [CrossRef]
- Bilbao, L.; Bruzzone, H.; Nikulin, V.Y.; Rager, J.P. Plasma Dynamics during Neutron Production in the Frasacti 1 MJ plasma Focus; Laboratory Preprint from Centro di Frascati, ENEA: Frascati, Italy, 1980. [Google Scholar]
- Rager, J.P.; Bilbao, L.E.; Bruzzone, H.A.; Gourlan, C.; Guidoni, U.; Kroegler, H.; Podda, S.; Ro-bouch, B.V.; Steinmetz, K. Experiments on neutron production phase of Frascati 1-MJ plasma focus (IAEA-CN-38/G-3). In Proceedings of the 8th International Conference on Plasma Physics and Controlled Fusion, Brussels, Belguim, 1–10 July 1980; Volume II, p. 209. Available online: http://www-naweb.iaea.org/napc/physics/FEC/STIPUB563_VOL2.pdf (accessed on 13 July 2021).
- Gribkov, V.A.; Krokhin, O.N.; Nikulin, V.Y.; Fadeev, V.M. Self-organizing current—Plasma structures and their effect on plasma dynamics in a plasma focus. In Proceedings of the 1998 ICPP & 25th EPS Conf. CF&PP, Prague, Czech Repulic, 29 June–3 July 1998; ECA Volume 22C. p. 2272. [Google Scholar]
- Decker, G.; Kies, W.; Nadolny, R.; Röwekamp, P.; Schmitz, F.; Ziethen, G.; Koshelev, K.N.; Sidelnikov, Y.V.; Sopkin, Y.V. Micropinch actuation in the SPEED 2 plasma focus. Plasma Sources Sci. Technol. 1996, 5, 112–118. [Google Scholar] [CrossRef]
- Soto, L.; Pavez, C.; Castillo, F.; Veloso, F.; Moreno, J.; Auluck, S.K.H. Filamentary structures in dense plasma focus: Current filaments or vortex filaments? Phys. Plasmas 2014, 21, 72702. [Google Scholar] [CrossRef]
- Milanese, M.M.; Niedbalski, J.J.; Moroso, R.L. Filaments in the Sheath Evolution of the Dense Plasma Focus as Applied to Intense Auroral Observations. IEEE Trans. Plasma Sci. 2007, 35, 808–812. [Google Scholar] [CrossRef]
- Filaments in FF-1. Available online: https://lppfusion.com/images-catch-ff-2b-in-action (accessed on 24 April 2021).
- Khautiev, E.Y.; Krauz, V.I.; Vikhrev, V.V.; Fadeev, V.M. On the Mechanism of the Current Sheath Structure Formation in the Plasma Focus Discharge. In Proceedings of the XXIV ICPIG, Warsaw, Poland, 11–16 July 1999; pp. 89–90. [Google Scholar]
- Lu, M.-F. Evolution of the filamentary current sheath in a plasma focus device. In Proceedings of the the Fourth International Conference on Dense z-Pinches, Vancouver, BC, Canada, 28–31 May 1997; Volume 409, pp. 397–400. [Google Scholar]
- Sadowski, M.J. Plasma self-organization effects in high-current discharges of axial symmetry. In Proceedings of the 11th Kudowa Summer School “Towards Fusion Energy,” (IPPLM), Kudowa, Poland, 11–15 June 2012; pp. 53–57. [Google Scholar]
- Kubes, P.; Paduch, M.; Pisarczyk, T.; Scholz, M.; Chodukowski, T.; Klir, D.; Kravarik, J.; Rezac, K.; Ivanova-Stanik, I.; Karpinski, L.; et al. Interferometric Study of Pinch Phase in Plasma-Focus Discharge at the Time of Neutron Production. IEEE Trans. Plasma Sci. 2009, 37, 2191–2196. [Google Scholar] [CrossRef]
- Sadowski, M.J.; Paduch, M.; Skladnik-Sadowska, E.; Surala, W.; Zaloga, D.; Miklaszewski, R.; Zielinska, E.; Tomaszewski, K. Soft x-ray studies of plasma-focus pinch structures in PF-1000U experiments. Plasma Sources Sci. Technol. 2015, 24, 55003. [Google Scholar] [CrossRef]
- Alfven, H. Cosmology in the plasma universe: An introductory exposition. IEEE Trans. Plasma Sci. 1990, 18, 5–10. [Google Scholar] [CrossRef]
- Peratt, A.L. Guest Editorial Special Issue on Space and Cosmic Plasma. IEEE Tran. Plasma Sci. 2007, 35, 741–744. [Google Scholar] [CrossRef]
- Hayashi, T.; Sato, T.; the Complexity Simulation Group. Self-organizing plasmas. Plasma Phys. Control Fusion 1999, 41, A229–A238. [Google Scholar] [CrossRef]
- Alfven, A. Filamentary Structure Produced by an Electric Current in a Plasma. Arkiv Fysik 1960, 19, 25. [Google Scholar]
- Furth, H.P.; Killeen, J.; Rosenbluth, M.N. Finite-Resistivity Instabilities of a Sheet Pinch. Phys. Fluids 1963, 6, 459. [Google Scholar] [CrossRef]
- Nardi, N. Magnetic bundles in reacting flowing plasmas. Phys Rev. Lett. 1970, 25, 718–721. [Google Scholar] [CrossRef]
- Marklund, G. Steady State Models for Filamentary Plasma Structures Associated with Force-Free Magnetic Fields. Report TRITA-EPP-78-09. 1978. Available online: https://www.iaea.org/inis/collection/NCL Collection-Store/_Public/09/403/9403234.pdf (accessed on 26 April 2021).
- Auluck, S.K.H. A possible mechanism for the generation of filamentary plasma structures in the plasma focus. Atomkernenerg. Kerntech. 1980, 36, 173–176. [Google Scholar]
- Ferro Fontan, C.; Sicardi Schifino, A. Generation of kilogauss radial magnetic fields in the plasma fo-cus current sheath. In Energy Storage, Compression and Switching; Nardi, V., Sahlin, H., Bostick, W.H., Eds.; Plenum: New York, NY, USA, 1983; Volume 2, p. 607. [Google Scholar]
- Haines, M.G.; Marsh, F. A steady-state model of current filamentation caused by the electrothermal instability in a fully ionized magnetized plasma. J. Plasma Phys. 1982, 27, 427–435. [Google Scholar] [CrossRef]
- Trubnikov, B.A. Current filaments in plasmas. Plasma Phys. Rep. 2002, 28, 312–326. [Google Scholar] [CrossRef]
- Di Vita, A. Hot spots and filaments in the pinch of a plasma focus: A unified approach. Eur. Phys. J. D 2009, 54, 451–461. [Google Scholar] [CrossRef]
- Lerner, E.J.; Hassan, S.M.; Karamitsos, I.; Von Roessel, F. Confined ion energy >200 keV and increased fusion yield in a DPF with monolithic tungsten electrodes and pre-ionization. Phys. Plasmas 2017, 24, 102708. [Google Scholar] [CrossRef]
- Nikulin, V.Y.; Startsev, S.; Tsybenko, S.P. Supersonic, subsonic and stationary filaments in the plasma focus. J. Phys. Conf. Ser. 2017, 907, 12024. [Google Scholar] [CrossRef] [Green Version]
- Fadeev, V.M.; Kvartskhava, I.F.; Komarov, N.N. Self-focusing of local plasma currents. Nucl. Fusion 1965, 5, 202–209. (In Russian) [Google Scholar] [CrossRef]
- Mather, J.W. Formation of a High-Density Deuterium Plasma Focus. Phys. Fluids 1965, 8, 366. [Google Scholar] [CrossRef]
- Bostick, W.H.; Nardi, V.; Prior, W. X-ray fine structure of dense plasma in a co-axial accelerator. J. Plasma Phys. 1972, 8, 7–20. [Google Scholar] [CrossRef]
- Schönbach, K.H.; Michel, L.; Fischer, H. Correlation of soft x-ray spots with hard radiation and neutron emission in a 1-kJ plasma focus. Appl. Phys. Lett. 1974, 25, 547. [Google Scholar] [CrossRef]
- Ivanov, V.D.; Kochetov, V.A.; Moiseeva, M.P.; Palkin, A.A.; Svirskij, E.B.; Terent’ev, A.R.; Filippova, T.I.; Filippov, N.V.; Veretennikov, V.A.; Vyskubov, V.P.; et al. Experimental Studies on the Plasma Focus. IAEA-CN-38/G-1-1. In Proceedings of the 8th Int. Conf. on Plasma Phys. and Contr. Nucl. Fus. Res.; Brussels, Belgium, 1–10 July 1980, IAEA: Vienna, Australia, 1981; Volume 2, pp. 161–176. Available online: http://www-naweb.iaea.org/napc/physics/FEC/STIPUB563_VOL1.pdf (accessed on 15 July 2021).
- Koshelev, K.N.; Krauz, V.I.; Reshetniak, N.G.; Salukvadze, R.G.; Sidelnikov, Y.V.; Khautiev, E.Y. The formation of micropinch structures in plasma focus with addition of heavy impurities. J. Phys. D 1988, 21, 1827. [Google Scholar] [CrossRef]
- Koshelev, K.N.; Krauz, V.I.; Reshetnyak, N.G.; Salukvadze, R.G.; Sidel’nikov, Y.V.; Khautiev, E.Y. Formation of micropinch structures in plasma-focus discharges with admixtures of heavy atoms. Sov. J. Plasma Phys. 1989, 15, 619. [Google Scholar]
- Krauz, V.I. Plasma Focus. In Encyclopedia of Low-Temperature Plasma; Fortov, V.E., Ed.; Ser. B.; Yanus-K: Moscow, Russia, 2007; Volume IX-2, pp. 152–195. (In Russian) [Google Scholar]
- Antsiferov, P.S.; Koshelev, K.N.; Krauz, V.I.; Sidelnikov, Y.V.; Khautiev, E.Y.; Yartseva, O.N. Use of dielectronic satellites for measuring the electron density in micropinches in a plasma focus. Sov. J. Plasma Phys. 1990, 16, 754. [Google Scholar]
- Antsiferov, P.; Franz, D.; Herold, H.; Jakubowski, L.; Jonas, A.; Sadowski, M.; Schmidt, H. Hot spot formation and emission characteristics of the plasma focus. In Proceedings of the 18th EPS Conf. Control Fusion and Plasma Phys., Berlin, Germany, 3–7 June 1991; Volume 15C, Part II. p. 221. [Google Scholar]
- Choi, P.; Aliaga-Rossel, R.; Dumitrescu-Zoita, C.; Deeney, C.; Haines, M. Dynamics of Hot Spots Formation in a Dense Plasma Focus Optical and X-ray Observations. AIP Conf. Proc. 1994, 299, 288–298. [Google Scholar] [CrossRef]
- Schmidt, H.; Schulz, D.; Antsiferov, P. X-ray Emission from Micropinches in the DPF78 Plasma Focus. AIP Conf. Proc. 1994, 299, 348–355. [Google Scholar] [CrossRef]
- Rowekamp, P.; Decker, G.; Kies, W.; Schmitz, F.; Ziethen, G.; Bayley, J.M.; Koshelev, K.N.; Sidelnikov, Y.V.; Rosmej, F.B.; Schulz, A.; et al. Spectral Investigations of Micropinches in the Speed 2 Plasma Focus. AIP Conf. Proc. 1994, 299, 332. [Google Scholar] [CrossRef]
- Bayley, J.M.; Decker, G.; Kies, W.; Malzig, M.; Muller, F.; Rowekamp, P.; Westheide, J.; Sidelnikov, Y.V. Observations of soft x-ray production in the speed 2 plasma focus. J. Appl. Phys. 1991, 69, 613–617. [Google Scholar] [CrossRef]
- Favre, M.; Silva, P.; Choi, P.; Chuaqui, H.; Dumitrescu-Zoita, C.; Wyndham, E.S. Experimental in-vestigations of hotspots in a low energy plasma focus operating in hydrogen-argon mixtures. IEEE Trans. Plasma Sci. 1998, 26, 1154–1161. [Google Scholar] [CrossRef]
- Silva, P.; Favre, M. Properties of hotspots in plasma focus discharges operating in hydrogen argon mixtures. J. Phys. D Appl. Phys. 2002, 35, 2543–2550. [Google Scholar] [CrossRef]
- Brzosko, J.; Nardi, V.; Goldstein, D.; Brzosko, J. Observation of plasma domains with fast ions and enhanced fusion in plasma-focus discharges. Phys. Lett. A 1994, 192, 250–257. [Google Scholar] [CrossRef]
- Brzosko, J.S.; Brzosko, J.R.; Robouch, B.V.; Ingrosso, L. Triton burnup in plasma focus plasmas. Phys. Plasmas 1995, 2, 1259–1269. [Google Scholar] [CrossRef]
- Jakubowski, L.; Sadowski, M. Studies of hot-spots and their correlation with other phenomena in PF-type discharges. In Proceedings of the 22nd EPS Conf. on CFPP, Bournemouth, UK, 3–7 July 1995; Part II. p. 161. [Google Scholar]
- Surała, W.; Sadowski, M.J.; Paduch, M.; Zieliñska, E.; Tomaszewski, K. Recent measurements of soft X-ray emission from the DPF-1000U facility. Nukleonika 2015, 60, 303–308. [Google Scholar] [CrossRef] [Green Version]
- Zaloga, D.R.; Sadowski, M.J.; Skladnik-Sadowska, E.; Paduch, M.; Zielinska, E.; Tomaszewski, K. In-fluence of gas conditions on electron temperature inside a pinch column of plasma-focus discharges. J. Phys. Conf. Ser. 2018, 959, 012003. [Google Scholar] [CrossRef] [Green Version]
- Neil, G.R.; Post, R. Observation of overdense infrared scattering from a post-pinch plasma focus. Plasma Phys. 1981, 23, 425–434. [Google Scholar] [CrossRef]
- Shearer, J.W. Contraction of Z pinches actuated by radiation losses. Phys. Fluids 1976, 19, 1426. [Google Scholar] [CrossRef]
- Meierovich, B. Toward the realization of electromagnetic collapse. Sov. Phys. Uspekhi 1986, 29, 506–529. [Google Scholar] [CrossRef]
- D’yachenko, V.F.; Imshennik, V.S. Magnetohydrodynamic theory of the poinch effect in a dense high-temperature plasma (dense plasma focus). In Reviews of Plasma Physics; Leontovich, M.A., Ed.; Consultants Bureau: New York, NY, USA, 1970; pp. 447–495. [Google Scholar] [CrossRef]
- Haines, M.G. A review of the dense Z-pinch. Plasma Phys. Control Fusion 2011, 53, 093001. [Google Scholar] [CrossRef] [Green Version]
- Zweibel, E.G.; Yamada, M. Perspectives on magnetic reconnection. Proc. R. Soc. A Math. Phys. Eng. Sci. 2016, 472, 20160479. [Google Scholar] [CrossRef]
- Gribkov, V.; Dubrovsky, A.; Kalachev, N.; Kozlova, T.; Nikulin, V. Dynamics of plasma phenomena in “plasma focus” under the action of powerful laser radiation. J. Phys. Colloq. 1979, 40, C7-763–C7-764. [Google Scholar] [CrossRef]
- Gribkov, V.A.; Dubrovsky, A.V.; Isakov, A.I.; Kalachev, N.V.; Kozlova, T.A.; Korzavin, V.M.; Nikulin, V.Y. Dynamics of Plasma Phenomena in “Plasma Focus” under the Action of Powerful Laser Radiation. In Proceedings of the Lebedev Physical Institute; 1980; Volume 127, pp. 32–61. (In Russian). Available online: http://proceedings.lebedev.ru/wordpress/wp-content/uploads/2013/03/1980-127.djvu (accessed on 15 July 2021).
- Auluck, S.K.H. Axial magnetic field and toroidally streaming fast ions in the dense plasma focus are natural consequences of conservation laws in the curved axisymmetric geometry of the current sheath. Phys. Plasmas 2014, 21, 102515. [Google Scholar] [CrossRef] [Green Version]
- Rager, J.P. Progresses on Plasma Focus Research at Frascati, Invited Paper at the 10th European Conference on Controlled Fusion and Plasma Physics, Moscow, Russia. 1981, pp. 243–267. Available online: http://iopscience.iop.org/article/10.1088/0029-5515/22/2/014 (accessed on 15 July 2021).
- Herold, H.; Bertalot, L.; Hirano, K.; Jager, U.; Kaeppeler, H.J.; Sadowskj, M.; Schmidt, H.; Schmidt, R.; Shakhatre, M.; Shyam, A.; et al. Two phases of neutron production in the POSEIDON plasma focus. IAEA-CN-44/D-III-6-3. In Proceedings of the Inter. Conf. on Plasma Physics and Controlled Nuclear Fusion Research, London, UK, 1984; Volume 2, p. 579. Available online: http://www-naweb.iaea.org/napc/physics/FEC/STIPUB670_VOL2.pdf (accessed on 15 July 2021).
- Auluck, S.K.H. An apparent momentum balance anomaly in the plasma focus. IEEE Trans. Plasma Sci. 1997, 25, 37–41. [Google Scholar] [CrossRef]
- Mather, J.; Ahluwalia, H. The geomagnetic field-an explanation for the microturbulence in coaxial gun plasmas. IEEE Trans. Plasma Sci. 1988, 16, 56–57. [Google Scholar] [CrossRef]
- Auluck, S.K.H. Spontaneous generation of magnetic field in an imploding plasma. J. Plasma Phys. 1984, 32, 349–357. [Google Scholar] [CrossRef]
- Deutsch, R.; Kies, W. Ion acceleration and runaway in dynamical pinches. Plasma Phys. Control Fusion 1988, 30, 263–276. [Google Scholar] [CrossRef]
- Bernstein, M.J.; Comisar, G.G. Neutron Energy and Flux Distributions from a crossed-field accelera-tion model of plasma focus and z-pinch discharges. Phys. Fluids 1972, 15, 700–707. [Google Scholar] [CrossRef]
- Bernard, A.; Coudeville, A.; Jolas, A.; Launspach, J.; De Mascureau, J. Experimental studies of the plasma focus and evidence for nonthermal processes. Phys. Fluids 1975, 18, 180. [Google Scholar] [CrossRef]
- Milanese, M.M.; Pouzo, J.O. Evidence of non-thermal processes in a 1-MJ plasma focus device by ana-lyzing the neutron spectra. Nucl. Fusion 1978, 18, 533–536. [Google Scholar] [CrossRef]
- Hübner, K.; Rager, J.P.; Steinmetz, K. Space-resolved investigation on the plasma focus neutron emission. In Proceedings of the 10th European Conference on Controlled Fusion and Plasma Physics, Moscow, Russia, 14–19 September 1981; Volume 1, p. D2. Available online: http://fusionwiki.ciemat.es/wiki/European_Physical_Society_Conference_on_Plasma_Physics (accessed on 15 July 2021).
- Jaeger, U. Über die Reaktionsmechanismen im Plasmafokus—Untersuchungen an Beschleungiten Deuteronen und Reaktionsprotonen. Report-IPF-86-1. Ph.D. Thesis, Institut Fuer Plasmaforschung, University of Stuttgart, Stuttgart, Germay, 1986. (In German). [Google Scholar]
- Schmidt, H.; Kubes, P.; Sadowski, M.; Scholz, M. Neutron Emission Characteristics of Pinched Dense Magnetized Plasmas. IEEE Trans. Plasma Sci. 2006, 34, 2363–2367. [Google Scholar] [CrossRef]
- Steinmetz, K.; Hubner, K.; Rager, J.P.; Robouch, B.V. Neutron pinhole camera investigations on tem-poral and spatial structures of plasma focus neutron source. Nucl. Fusion 1982, 22, 30–32. [Google Scholar] [CrossRef]
- Thong, S.P.; Lee, S. A simplified method of switching a 2 mega-ampere capacitor bank using a volt-age-division technique. Malays. J. Sci. 1973, 2, 157–169. [Google Scholar]
- Lee, S.; Chen, Y.H. Measurements of neutrons from a focussed plasma. Malays. J. Sci. 1975, 3, 159–163. [Google Scholar]
- Lee, S.; Wong, C.S. Initiating and Strengthening Plasma Research in Developing Countries. Phys. Today 2006, 59, 31–36. [Google Scholar] [CrossRef]
- Lee, S. Plasma focus model yielding trajectory and structure. Radiations in Plasmas. In Proceedings of the Spring College in Plasma Physics, Trieste, Italy, 24 May–17 June 1983; World Scientific Pub Co.: Singapore, 1984; pp. 978–987. [Google Scholar]
- Lee, S.; Tan, B.C.; Wong, C.S.; Chew, A.C. Laser and plasma technology. In Proceedings of the First Tropical College on Applied Physics, Kuala Lumpur, Malaysia, 26 December 1983–14 January 1984; World Scientific Publishing Co.: Singapore, 1985; pp. 38–62. [Google Scholar]
- Lee, S.; Tou, T.Y.; Moo, S.P.; Eissa, M.A.; Gholap, A.V.; Kwek, K.H.; Mulyodrono, S.; Smith, A.J.; Suryadi; Usada, W.; et al. A simple facility for the teaching of plasma dynamics and plasma nuclear fusion. Am. J. Phys. 1988, 56, 62–68. [Google Scholar] [CrossRef]
- Lee, S.; Moo, S.P.; Wong, C.S.; Chew, A.C. Twelve Years of UNU/ICTP PFF—A Review.IC/98/231. In Proceedings of the Satellite Meeting of the International Meeting on Frontiers of Physics, Kuala Lumpur, Malaysia, 30 October 1998; ICTP Preprint, ICTP: Trieste, Italy, 1998; p. 101. [Google Scholar]
- Bernard, A.; Bruzzone, H.; Choi, P.; Chuaqui, H.; Gribkov, V.; Herrera, J.; Hirano, K.; Krejei, A.; Lee, S.; Luo, C.; et al. International Centre for Dense Magnetised Plasmas: A Proposal prepared on the request of UNESCO, 1994; Unpublished.
- Moo, S.P.; Chakrabarty, C.K.; Lee, S. An Investigation of the Ion Beam of a Plasma Focus Using a Metal Obstacle and a Deuter-ated Target. IEEE Trans. Plasma Sci. 1991, 19, 515–519. [Google Scholar] [CrossRef]
- Scholz, M.; Miklaszewski, R.; Gribkov, V.; Mezzetti, F. PF-1000 device. Nukleonika 2000, 45, 155–158. [Google Scholar]
- Hagen, E.C. Dense Plasma Focus Fusion Neutron Sources. International Workshop and Expert Meeting of ICDMP. 2009. Available online: http://www.icdmp.pl/images/2009/hagen_2009.pdf (accessed on 15 July 2021).
- Goldin, F.J.; Meehan, B.T.; Hagen, E.C.; Wilkins, P.R. Time-resolved spectra of dense plasma focus using spectrometer, streak camera, and CCD combination. Rev. Sci. Instrum. 2010, 81, 10. [Google Scholar] [CrossRef]
- Bennett, N.; Blasco, M.; Breeding, K.; Constantino, D.; DeYoung, A.; DiPuccio, V.; Friedman, J.; Gall, B.; Gardner, S.; Gatling, J.; et al. Development of the dense plasma focus for short-pulse applications. Phys. Plasmas 2017, 24, 012702. [Google Scholar] [CrossRef] [Green Version]
- Savage, M.E.; Johns, O.; García, M.; Lake, P.; Moore, J.K.; Ormond, E.; Webb, T.J.; Bennett, N.; Gall, B.; Gardner, S.; et al. Electrical and X-ray diagnostics on the NSTec 2-MA dense plasma focus system. In Proceedings of the 2017 IEEE 21st International Conference on Pulsed Power (PPC), Brighton, UK, 18–22 June 2017; pp. 1–7. [Google Scholar]
- Lowe, D. The NSTec Dense Plasma Focus Laboratories—An Overview. Available online: https://www.osti.gov/servlets/purl/1245474 (accessed on 24 April 2021).
- Lerner, E.J.; Murali, S.K.; Haboub, A. Theory and Experimental Program for p-B11 Fusion with the Dense Plasma Focus. J. Fusion Energy 2011, 30, 367–376. [Google Scholar] [CrossRef]
- Karakin, M.A.; Khautiev, E.Y.; Krauz, V.I.; Mokeev, A.N.; Mourenas, D.; Myalton, V.V.; Simonet, F.; Smirnov, V.P.; Tykshaev, V.P.; Vierne, J.; et al. Studies on the Liner Compres-sion in the PF-3-Facility Modernized Discharge System.BEAMS’04. In Proceedings of the 15th Int. Conf. on High-Power Particle Beams, Saint-Petersburg, Russia, 18–23 July 2004; pp. 738–741. [Google Scholar]
- Filippov, N.V.; Filippova, T.I.; Krauz, V.I.; Azizov, E.A.; Golubchikov, L.G.; Lototsky, A.P.; Nastoyashchy, A.N.; Makeev, N.G.; Rumyantsev, V.G. Recent Progress in Plasma Focus Development: From an Existing 3 MJ to Projected 100 MJ Plasma Focus Installation. In Current Trends in International Fusion Research—Proc. of the Second Symposium, Washington; Panarella, E., Ed.; NRC Research Press: Ottawa, ON, Canada, 1999; pp. 27–40. [Google Scholar]
- Filippov, N.V.; Filippova, T.I.; Khutoretskaia, I.V.; Mialton, V.V.; Vinogradov, V.P. Mega-joule Scale Plasma Focus as Efficient X-ray Source. Phys. Lett. A 1996, 211, 168–171. [Google Scholar] [CrossRef]
- Zielinska, E.; Paduch, M.; Scholz, M. Sixteen-Frame Interferometer for a Study of a Pinch Dynamics in PF-1000 Device. Contrib. Plasma Phys. 2011, 51, 279–283. [Google Scholar] [CrossRef]
- Mitrofanov, K.N.; Krauz, V.I.; Grabovski, E.V.; Myalton, V.V.; Paduch, M.; Gritsuk, A.N. Features of the Application of the Magnetic-probe Method for Diagnostics of High-temperature Plasma. Instrum. Exp. Tech. 2018, 61, 239–259. [Google Scholar] [CrossRef]
- Krauz, V.I.; Mitrofanov, K.N.; Myalton, V.V.; Vinogradov, V.P.; Vinogradova, Y.V.; Grabovski, E.V.; Zukakishvili, G.G.; Koidan, V.S.; Mokeev, A.N. Magnetic probe measurements of the current sheath on the PF-3 facility. Plasma Phys. Rep. 2010, 36, 937–952. [Google Scholar] [CrossRef]
- Krauz, V.; Mitrofanov, K.; Scholz, M.; Paduch, M.; Karpinski, L.; Zielinska, E.; Kubes, P. Experimental study of the structure of the plasma-current sheath on the PF-1000 facility. Plasma Phys. Control Fusion 2012, 54, 025010. [Google Scholar] [CrossRef]
- Krauz, V.I.; Mitrofanov, K.N.; Myalton, V.V.; Grabovski, E.V.; Koidan, V.S.; Vinogradov, V.P.; Vinogradova, Y.V.; Zukakishvili, G.G. Dynamics of the Current Distribution in a Discharge of the PF-3 Plasma Focus Facility. IEEE Trans. Plasma Sci. 2010, 38, 92–99. [Google Scholar] [CrossRef]
- Mitrofanov, K.N.; Krauz, V.I.; Kubes, P.; Scholz, M.; Paduch, M.; Zielinska, E. Study of the fine structure of the plasma current sheath and magnetic fields in the axial region of the PF-1000 facility. Plasma Phys. Rep. 2014, 40, 623–639. [Google Scholar] [CrossRef]
- Krauz, V.I.; Mitrofanov, K.N.; Voitenko, D.A.; Mateev, Yu.V.; Astapenko, G.I. Study of the azimuthal magnetic fields and scaling laws at the KPF-4-Phoenix facility. Plasma Phys. Rep. 2013, 39, 888–899. [Google Scholar] [CrossRef]
- Krauz, V.I.; Mitrofanov, K.N.; Myalton, V.V.; Vinogradov, V.P.; Vinogradova, Y.V.; Grabovski, E.V.; Koidan, V.S.; Koĭdan, V.S. Dynamics of the structure of the plasma current sheath in a plasma focus discharge. Plasma Phys. Rep. 2011, 37, 742–754. [Google Scholar] [CrossRef]
- Krauz, V.I.; Mitrofanov, K.N.; Scholz, M.; Paduch, M.; Kubes, P.; Karpinski, L.; Zielinska, E. Experimental evidence of existence of the axial magnetic field in a plasma focus. EPL Europhys. Lett. 2012, 98, 45001. [Google Scholar] [CrossRef]
- Mather, J.W.; Bottoms, P.J. Characteristics of the Dense Plasma Focus Discharge. Phys. Fluids 1967, 11, 611–618. [Google Scholar] [CrossRef]
- Bruzzone, H.; Acuña, H.; Barbaglia, M.O.; Clausse, A. A simple plasma diagnostic based on processing the electrical signals from coaxial discharges. Plasma Phys. Control Fusion 2006, 48, 609–620. [Google Scholar] [CrossRef]
- Bruzzone, H.; Acuña, H.; Clausse, A. Neutron correlations with electrical measurements in a Plasma Focus device. Braz. J. Phys. 2008, 38, 117–122. [Google Scholar] [CrossRef]
- Veloso, F.; Pavez, C.; Moreno, J.; Galaz, V.; Zambra, M.; Soto, L. Correlations among neutron yield and dynamical discharge characteristics obtained from electrical signals in a 400 joules plasma focus. J. Fusion Energy 2012, 31, 30–37. [Google Scholar] [CrossRef]
- Lu, M.F. Use of a double-Wollaston prism laser differential interferometer in a plasma focus. Rev. Sci. Instrum. 1997, 68, 1149–1151. [Google Scholar] [CrossRef]
- Jager, U.; Bertalot, L.; Herold, H. Energy spectra and space resolved measurements of fusion reaction protons from plasma focus devices. Rev. Sci. Instrum. 1985, 56, 77–80. [Google Scholar] [CrossRef]
- Talebitaher, A.; Springham, S.V.; Shutler, P.M.E.; Lee, P.; Rawat, R.S. Imaging of Plasma Focus Fusion by Proton Coded Aperture Technique. J. Fusion Energy 2011, 31, 234–241. [Google Scholar] [CrossRef]
- Talebitaher, A.; Shutler, P.M.E.; Springham, S.V.; Rawat, R.S.; Lee, P. Coded aperture imag-ing of alpha source spatial distribution. Radiat. Meas. 2012, 47, 992–999. [Google Scholar] [CrossRef]
- Springham, S.V.; Talebitaher, A.; Shutler, P.M.E.; Lee, S.; Rawat, R.S.; Lee, P. Coded aperture imaging of fusion source in a plasma focus operated with pure D2 and a D2-Kr gas admixture. Appl. Phys. Lett. 2012, 101, 114104. [Google Scholar] [CrossRef]
- Talebitaher, A.; Springham, S.V. Neutron and Proton diagnostics for Pulsed Plasma Fusion Devices. In Plasma Science and Technology for Emerging Economies; Rawat, R.S., Ed.; Springer Nature: Singapore, 2017; pp. 293–354. [Google Scholar]
- Talebitaher, A. Coded Aperture Imaging of Nuclear Fusion in the Plasma Focus Device. Ph.D. Thesis, NTU, Singapore, 2012. [Google Scholar]
- Shutler, P.M.E.; Talebitaher, A.; Springham, S.V. Signal-to-noise ratio in coded aperture imaging. NIMA 2012, 669, 22–31. [Google Scholar] [CrossRef]
- Springham, S.V.; Verma, R.; Zaw, M.; Rawat, R.; Lee, P.; Talebitaher, A.; Ang, J. Plasma focus neutron energy and anisotropy measurements using zirconium–beryllium pair activation detectors. NIMA 2021, 988, 164830. [Google Scholar] [CrossRef]
- Talebitaher, A.; Springham, S.V.; Rawat, R.S.; Lee, P. Beryllium neutron activation detector for pulsed DD fusion sources. NIMA 2011, 659, 361–367. [Google Scholar] [CrossRef]
- Pavez, C.; Pedreros, J.; Curín, C.; Muñoz, G.; Soto, L. Digital interferometry applied to transient dense plasmas. IEEE Trans. Plasma Sci. 2012, 40, 3384–3389. [Google Scholar] [CrossRef]
- Soto, L.; Chuaqui, H.; Saavedra, R. Interferometry of phase micro-inhomogeneities within macroscopic objects. Meas. Sci. Technol. 1997, 8, 875–879. [Google Scholar] [CrossRef]
- Pavez, C.; Pedreros, J.; Tarifeño-Saldivia, A.; Soto, L. Observation of plasma jets in a table top plasma focus discharge. Phys. Plasmas 2015, 22, 040705. [Google Scholar] [CrossRef]
- Pavez, C.; Pedreros, J.; Avaria, G.; Bora, B.; Moreno, J.; Soto, L. A methodology for the digital reconstruction of an interferogram, a schlieren image, or a shadowgram from a single digital holographic recording. Rev. Sci. Instrum. 2018, 89, 123103. [Google Scholar] [CrossRef]
- Moreno, J.; Birstein, L.; Mayer, R.; Silva, P.; Soto, L. System for measurement of low yield neutron pulses from D–D fusion reactions based upon a3He proportional counter. Meas. Sci. Technol. 2008, 19, 087002. [Google Scholar] [CrossRef]
- Soto, L.; Silva, P.; Moreno, J.; Zambra, M.; Kies, W.; Mayer, R.; Clausse, A.; Altamirano, L.; Pavez, C.; Huerta, L. Demonstration of neutron production in a table-top pinch plasma focus device operating at only tens of joules. J. Phys. D Appl. Phys. 2008, 41, 205215. [Google Scholar] [CrossRef]
- Tarifeño-Saldivia, A.; Soto, L. Statistical characterization of the reproducibility of neutron emission of small plasma focus devices. Phys. Plasmas 2012, 19, 092512. [Google Scholar] [CrossRef]
- Soto, L.; Pavéz, C.; Moreno, J.; Altamirano, L.; Huerta, L.; Barbaglia, M.O.; Clausse, A.; Mayer, R.E. Evidence of nuclear fusion neutrons in an extremely small plasma focus device operating at 0.1 Joules. Phys. Plasmas 2017, 24, 082703. [Google Scholar] [CrossRef]
- Tarifeño-Saldivia, A.; Mayer, R.E.; Pavez, C.; Soto, L. Calibration methodology for propor-tional counters applied to yield measurements of a neutron burst. Rev. Sci. Instrum. 2014, 85, 013502. [Google Scholar] [CrossRef]
- Veloso, F.; Moreno, J.; Tarifeño-Saldivia, A.; Pavez, C.; Zambra, M.; Soto, L. Non-intrusive plasma diagnostics for measuring sheath kinematics in plasma focus discharges. Meas. Sci. Technol. 2012, 23, 087002. [Google Scholar] [CrossRef]
- Veloso, F.; Tarifeño-Saldivia, A.; Pavez, C.; Moreno, J.; Zambra, M.; Soto, L. Plasma sheath kinematics and some implications on the modeling of very low energy plasma focus devices. Plasma Phys. Control Fusion 2012, 54, 095007. [Google Scholar] [CrossRef]
- Avaria, G.; Ardila-Rey, J.; Davis, S.; Orellana, L.; Cevallos, B.; Pavez, C.; Soto, L.; Cevallos, B.-N. Hard X-ray Emission Detection Using Deep Learning Analysis of the Radiated UHF Electromagnetic Signal From a Plasma Focus Discharge. IEEE Access 2019, 7, 74899–74908. [Google Scholar] [CrossRef]
- Orellana, L.; Ardila-Rey, J.; Avaria, G.; Diaz, M.A.; Pavez, C.; Schurch, R.; Soto, L. On the Relationship between the Electromagnetic Burst and Inductive Sensor Measurement of a Pulsed Plasma Accelerator. IEEE Access 2019, 7, 133043–133057. [Google Scholar] [CrossRef]
- Orellana, L.; Avaria, G.; Ardila-Rey, J.; Davis, S.; Schurch, R.; Pavez, C. Inference of X-ray Emission From a Plasma Focus Discharge: Comparison Between Characteristic Parameters and Neural Network Analyses. IEEE Access 2020, 8, 79273–79286. [Google Scholar] [CrossRef]
- Da Re, A.; Mezzetti, F.; Tartari, A.; Verri, G.; Rapezzi, L.; Gribkov, V.A. Preliminary study on X-ray source from Plasma Focus device for fast radiography. Nukleonika 2001, 46, S123–S125. [Google Scholar]
- Raspa, V.; Moreno, C.; Sigaut, L.; Clausse, A. Effective hard x-ray spectrum of a tabletop Mather-type plasma focus optimized for flash radiography of metallic objects. J. Appl. Phys. 2007, 102, 123303. [Google Scholar] [CrossRef] [Green Version]
- Zambra, M.; Silva, P.; Moreno, M.; Pavez, C.; Soto, L. Experimental results on hard x-ray en-ergy emitted by a low energy plasma focus device: A radiographic image analysis. Plasma Phys. Control Fusion 2009, 51, 125003. [Google Scholar] [CrossRef]
- Pavez, C.; Soto, L. Demonstration of X-ray Emission from an Ultraminiature Pinch Plasma Focus Discharge Operating at 0.1 J Nanofocus. IEEE Trans. Plasma Sci. 2010, 38, 1132–1135. [Google Scholar] [CrossRef]
- Siahpoush, V.; Tafreshi, M.A.; Sobhanian, S.; Khorram, S. Adaptation of Sing Lee’s model to the Filippov type plasma focus geometry. Plasma Phys. Control. Fusion 2005, 47, 1065–1076. [Google Scholar] [CrossRef]
- Lee, S. Radiative Dense Plasma Focus Computation Package: RADPF. Available online: http://www.plasmafocus.net/IPFS/modelpackage/File1RADPF.htm (accessed on 24 April 2021).
- Lee, S. Plasma Focus Radiative Model: Review of the Lee Model Code. J. Fusion Energy 2014, 33, 319–335. [Google Scholar] [CrossRef]
- Lee, S.; Saw, S.H. Plasma Science and Technology for Emerging Economies; Springer Science and Business Media LLC: Singapore, 2017; p. 113. [Google Scholar]
- Potter, D. The formation of high-density z-pinches. Nucl. Fusion 1978, 18, 813–823. [Google Scholar] [CrossRef]
- Lee, S.; Serban, A. Dimensions and lifetime of the plasma focus pinch. IEEE Trans. Plasma Sci. 1996, 24, 1101–1105. [Google Scholar] [CrossRef]
- Lee, S.; Saw, S.H.; Rawat, R.S.; Lee, P.; Verma, R.; Talebitaher, A.; Hassan, S.M.; Abdou, A.E.; Ismail, M.; Mohamed, A.; et al. Measurement and Processing of Fast Pulsed Discharge Current in Plasma Focus Machines. J. Fusion Energy 2011, 31, 198–204. [Google Scholar] [CrossRef]
- Auluck, S.K.H. Resistive Gratton-Vargas Model. Available online: http://www.icdmp.pl/rgv (accessed on 24 April 2021).
- Lee, S.; Saw, S.H. Pinch current limitation effect in plasma focus. Appl. Phys. Lett. 2008, 92, 021503. [Google Scholar] [CrossRef]
- Lee, S.; Lee, P.; Saw, S.H.; Rawat, R.S. Numerical experiments on plasma focus pinch cur-rentlimitation. Plasma Phys. Control Fusion 2008, 50, 065012. [Google Scholar] [CrossRef]
- Karami, F.; Roshan, M.V.; Habibi, M.; Lee, P.; Saw, S.H.; Lee, S. Neutron yield scaling withinductance in plasma focus. IEEE Trans. Plasma Sci. 2015, 43, 2155–2159. [Google Scholar] [CrossRef]
- Akel, M.; Al-Hawat, S.; Lee, S. Pinch current and soft X-ray yield limitation by numerica-lexperiments on nitrogen plasma focus. J. Fusion Energy 2010, 29, 94–99. [Google Scholar] [CrossRef]
- Lee, S. Current and neutron scaling for megajoule plasma focus machines. Plasma Phys. Control Fusion 2008, 50, 105005. [Google Scholar] [CrossRef]
- Lee, S.; Saw, S.H. Neutron Scaling Laws from Numerical Experiments. J. Fusion Energy 2008, 27, 292–295. [Google Scholar] [CrossRef]
- Saw, S.H.; Lee, S. Scaling Laws for Plasma Focus Machines from Numerical Experiments. Energy Power Eng. 2010, 02, 65–72. [Google Scholar] [CrossRef] [Green Version]
- Lee, S.; Saw, S.H.; Lee, P.; Rawat, R.S. Numerical experiments on plasma focus neon soft x-ray scaling. Plasma Phys. Control Fusion 2009, 51, 105013. [Google Scholar] [CrossRef]
- Akel, M.; Al-Hawat, S.; Saw, S.H.; Lee, S. Numerical experiments on oxygen Soft X-rayemissions from low energy plasma focus using Lee model. J. Fusion Energy 2010, 29, 223–231. [Google Scholar] [CrossRef]
- Akel, M.; Lee, S.; Saw, S.H. Numerical Experiments in Plasma Focus Operated in Various Gases. IEEE Trans. Plasma Sci. 2012, 40, 3290–3297. [Google Scholar] [CrossRef]
- Saw, S.H.; Lee, S. Multi-scaling of the dense plasma focus. J. Phys. Conf. Ser. 2015, 591, 012022. [Google Scholar] [CrossRef] [Green Version]
- Lee, S.; Saw, S.H. Plasma focus ion beam fluence and flux—Scaling with stored energy. Phys. Plasmas 2012, 19, 112703. [Google Scholar] [CrossRef]
- Lee, S.; Saw, S.H. Plasma focus ion beam fluence and flux—For various gases. Phys. Plasmas 2013, 20, 062702. [Google Scholar] [CrossRef]
- Akel, M.; Lee, S. Dependence of Plasma Focus Argon Soft X-ray Yield on Storage Energy, Total and Pinch Currents. J. Fusion Energy 2011, 31, 143–150. [Google Scholar] [CrossRef]
- Akel, M.; Lee, S. Scaling Laws of Nitrogen Soft X-ray Yields from 1 to 200 kJ Plasma Focus. J. Fusion Energy 2012, 32, 107–110. [Google Scholar] [CrossRef]
- Saw, S.H.; Lee, S. The plasma focus scaled for neutrons, soft X-rays, fast ion beams and fast-plasma streams. J. Sci. Eng. Technol. 2014, 10, 42–49. [Google Scholar]
- Lee, S. Neutron yield saturation in plasma focus: A fundamental cause. Appl. Phys. Lett. 2009, 95, 151503. [Google Scholar] [CrossRef]
- Lee, S.; Saw, S.H.; Ali, J. Numerical experiments on radiative cooling and collapse in plasmafocus operated in krypton. J. Fusion Energy 2012, 32, 42–49. [Google Scholar] [CrossRef]
- Akel, M.; Lee, S. Radiative Collapse in Plasma Focus Operated with Heavy Noble Gases. J. Fusion Energy 2012, 32, 111–116. [Google Scholar] [CrossRef]
- Lee, S.; Saw, S.H.; Akel, M.; Ali, J.; Kunze, H.-J.; Kubes, P.; Paduch, M. Conditions for Radiative Cooling and Collapse in the Plasma Focus Illustrated with Numerical Experiments on PF. IEEE Trans. Plasma Sci. 2015, 44, 165–173. [Google Scholar] [CrossRef]
- Akel, M.; Ismael, S.; Lee, S.; Saw, S.H.; Kunze, H.J. Effects of Power Terms and Thermodynamics on the Contraction of Pinch Radius in Plasma Focus Devices Using the Lee Model. J. Fusion Energy 2016, 35, 807–815. [Google Scholar] [CrossRef]
- Lee, S.; Saw, S.H.; Abdou, A.; Torreblanca, H. Characterizing Plasma Focus Devices—Role of the Static Inductance—Instability Phase Fitted by Anomalous Resistances. J. Fusion Energy 2010, 30, 277–282. [Google Scholar] [CrossRef]
- Singh, A. Comparative Study of Plasma Focus Machines. Ph.D. Thesis, INTI International University, Nilai, Malaysia, 2015. [Google Scholar]
- Lim, L.H.; Yap, S.L.; Lee, M.C.; Poh, H.S.; Ma, J.; Lee, S.; Lim, L.K.; Yap, S.S.; Lim, L.H. Comparison of measured and computed radial trajectories of plasma focus devices UMDPF1 and UMDPF0. Phys. Plasmas 2015, 22, 092702. [Google Scholar] [CrossRef]
- Lee, S.; Saw, S.H.; Rawat, R.S.; Lee, P.; Talebitaher, A.; Abdou, A.E.; Chong, P.L.; Roy, F.A.; Singh, A.; Wong, D.; et al. Correlation of Measured Soft X-ray Pulses with Modeled Dynamics of the Plasma Focus. IEEE Trans. Plasma Sci. 2011, 39, 3196–3202. [Google Scholar] [CrossRef]
- Saw, S.H.; Rawat, R.S.; Lee, P.; Talebitaher, A.; Abdou, A.E.; Chong, P.L.; Roy, F.; Ali, J.; Lee, S. SXR Measurements in INTI PF Operated in Neon to Identify Typical (Normal N) Profile for Shots with Good Yield. IEEE Trans. Plasma Sci. 2013, 41, 3166–3172. [Google Scholar] [CrossRef]
- Silva, P.; Moreno, J.; Soto, L.; Birstein, L.; Mayer, R.E.; Kies, W. Neutron emission from a fast plasma focus of 400 Joules. Appl. Phys. Lett. 2003, 83, 3269–3271. [Google Scholar] [CrossRef] [Green Version]
- Lee, S.; Saw, S.H.; Soto, L.; Springham, S.V.; Moo, S.P. Numerical experiments on plasma fo-cus neutron yield versus pressure compared with laboratory experiments. Plasma Phys. Control Fusion 2009, 51, 075006. [Google Scholar]
- Saw, S.H.; Subedi, D.P.; Khanal, R.; Shrestha, R.; Dugu, S.; Lee, S. Numerical Experiments on PF1000 Neutron Yield. J. Fusion Energy 2014, 33, 684–688. [Google Scholar] [CrossRef]
- Saw, S.H.; Lee, P.; Rawat, R.S.; Verma, R.; Subedi, D.; Khanal, R.; Gautam, P.; Shrestha, R.; Singh, A.; Lee, S. Comparison of Measured Neutron Yield Versus Pressure Curves for FMPF-3, NX2 and NX3 Plasma Focus Machines Against Computed Results Using the Lee Model Code. J. Fusion Energy 2014, 34, 474–479. [Google Scholar] [CrossRef]
- Castillo, F.; Herrera, J.E.; Rangel, J.; Alfaro, A.; Maza, M.A.; Sakaguchi, V. Neutron Anisotropy and X-ray Production of the FN-II Dense Plasma Focus Device. Braz. J. Phys. 2002, 32, 3–12. [Google Scholar]
- Singh, A.; Lee, S.; Saw, S.H. Numerical experimentation on focusing time and neutron yield in GN1 plasma focus machine. Int. J. Mod. Phys. Conf. Ser. 2014, 32, 1460325. [Google Scholar] [CrossRef]
- Singh, A.; Sing, L.; Saw, S.H. Effect of the Variation of Pressure on the Dynamics and Neutron Yield of Plasma Focus Machines. IEEE Trans. Plasma Sci. 2017, 45, 2286–2291. [Google Scholar] [CrossRef]
- Singh, A.; Heoh, S.S.; Sing, L. Numerical study on the variation of pressure on India Bhabha Atomic Research Center (BARC) and Imperial College plasma focus machines. Int. Conf. PLASMA Sci. Appl. 2017, 1824, 30002. [Google Scholar]
- Saw, S.H.; Lee, S. Numerical Experiments on Bora- Invited Workshop/Lecture. In Proceedings of the School and Training Course on Dense Magnetized Plasma as a Source of Ionizing Radiations, Their Diagnostics and Applications, Trieste, Italy, 8–12 October 2012. [Google Scholar]
- Akel, M.; Marciniak, L.; Ismael, S.; Gannom, D.; Kulinska, A.; Lee, S.; Scholz, M.; Kunze, H.-J.; Saw, S.H. Investigation of the Measured and Computed Neutron Yield From the PF-24 Device Operated with D2-xx %Ar Admixture. IEEE Trans. Plasma Sci. 2019, 47, 4301–4311. [Google Scholar] [CrossRef]
- Maslov, V.V.; Rumyantsev, V.G.; Basmanov, V.F.; Budnikov, D.V.; Garin, A.V.; Drozdov, I.Y.; Ershov, D.A.; Korkin, D.S.; Makeev, N.G.; Molodtsev, D.A.; et al. A KPU-200 movable capacitor installation. Instrum. Exp. Tech. 2014, 57, 131–134. [Google Scholar] [CrossRef]
- Zavyalov, N.; Maslov, V.V.; Rumyantsev, V.G.; Drozdov, I.Y.; Ershov, D.A.; Korkin, D.S.; Molodtsev, D.A.; Smerdov, V.I.; Falin, A.P.; Yukhimchuk, A.A. A source with a 1013 DT neutron yield on the basis of a spherical plasma focus chamber. Plasma Phys. Rep. 2013, 39, 243–247. [Google Scholar] [CrossRef]
- Lee, S.; Lee, P.; Zhang, G.; Feng, X.; Gribkov, V.; Liu, M.; Serban, A.; Wong, T.K.S. High rep rate high performance plasma focus as a powerful radiation source. IEEE Trans. Plasma Sci. 1998, 26, 1119–1126. [Google Scholar] [CrossRef]
- Zhang, G.X. Plasma Soft X-ray Source for Microelectronic Lithography. Ph.D. Thesis, NTU, Singapore, 1999. [Google Scholar]
- Shan, B. Comparative Study: Dynamics and SXR Emission of Several Plasma Focus Devices. Ph.D. Thesis, NTU, Singapore, 2000. [Google Scholar]
- Lee, S.; Rawat, R.S.; Lee, P.; Saw, S.H. Soft x-ray yield from NX2 plasma focus. J. Appl. Phys. 2009, 106, 023309. [Google Scholar] [CrossRef]
- Gautam, P.; Khanal, R.; Saw, S.H.; Lee, S. Comparison of Measured Soft X-ray Yield Versus Pressure for NX1 and NX2 Plasma Focus Devices Against Computed Values Using Lee Model Code. J. Fusion Energy 2015, 34, 686–693. [Google Scholar] [CrossRef]
- Liu, M.H.; Feng, X.P.; Springham, S.V.; Lee, S. Soft X-ray yield Measurement in a smallplas-ma focus operated in neon. IEEE Trans. Plasma Sci. 1998, 26, 135–140. [Google Scholar]
- Liu, M.H. Soft X-rays from Compact Plasma Focus. Ph.D. Thesis, NTU, Singapore, 1997. [Google Scholar]
- Roy, F., Jr. Investigation and Optimisation of Neon Soft X-ray of the INTI Plasma Focus at 12 kV. Ph.D. Thesis, INTI International University, Nilai, Malaysia, 2015. [Google Scholar]
- Roy, F.A., Jr.; Saw, S.H.; Lee, P.C.K.; Rawat, R.A.; Lee, S. Correlation of Characteristic Ne SXR Signal Pulse with Computed Plasma Focus Dynamics in the Ne (97.5%)–Kr (2.5%) Admixtures of the INTI PF Machine at 12 kV. IEEE Trans. Plasma Sci. 2019, 47, 1297–1301. [Google Scholar] [CrossRef]
- Akel, M.; Salo, S.A.; Ismael, S.; Saw, S.; Lee, S. Comparison of measured and computed beam ion current densities emitted from two 2 kJ plasma focus machines. Vacuum 2017, 136, 163–167. [Google Scholar] [CrossRef]
- Mohanty, S.R.; Neog, N.K.; Bhuyan, H.; Rout, R.K.; Rawat, R.S.; Lee, P. Effect of Anode Designs on Ion Emission Characteristics of a Plasma Focus Device. Jpn. J. Appl. Phys. 2007, 46, 3039–3044. [Google Scholar] [CrossRef]
- Hassan, M.; Qayyum, A.; Ahmad, R.; Murtaza, G.; Zakaullah, M. Nitriding of titanium by using an ion beam delivered by a plasma focus. J. Phys. D: Appl. Phys. 2007, 40, 769–777. [Google Scholar] [CrossRef]
- Akel, M.; Salo, S.A.; Ismael, S.; Saw, S.H.; Lee, S. Deuterium Plasma Focus as a Tool for Testing Materials of Plasma Facing Walls in Thermonuclear Fusion Reactors. J. Fusion Energy 2016, 35, 694–701. [Google Scholar] [CrossRef]
- Soto, L.; Pavez, C.; Moreno, J.; Inestrosa-Izurieta, M.J.; Veloso, F.; Gutierrez, G.; Vergara, J.; Clausse, A.; Bruzzone, H.; Castillo, F.; et al. Characterization of the axial plas-ma shock in a table top plasma focus after the pinch and its possible application to testing mate-rials for fusion reactors. Phys. Plasmas 2014, 21, 122703. [Google Scholar] [CrossRef] [Green Version]
- Damideh, V.; Ali, J.; Saw, S.H.; Rawat, R.S.; Lee, P.; Chaudhary, K.T.; Rizvi, Z.H.; Dabagh, S.; Ismail, F.D.; Sing, L. Fast Faraday cup for fast ion beam TOF measurements in deuterium filled plasma focus device and correlation with Lee model. Phys. Plasmas 2017, 24, 063302. [Google Scholar] [CrossRef] [Green Version]
- Akel, M.; Cikhardt, J.; Kubes, P.; Kunze, H.-J.; Lee, S.; Paduch, M.; Saw, S.H. Experiments and simulations on the possibility of radiative contraction/collapse in the PF-1000 plasma focus. Nukleonika 2016, 61, 145–148. [Google Scholar] [CrossRef] [Green Version]
- Saw, S.H.; Lee, S. Measurement of Radiative Collapse in 2.2 kJ PF: Achieving High Energy Density (HED) Conditions in a Small Plasma Focus. J. Fusion Energy 2016, 35, 702–708. [Google Scholar] [CrossRef]
- Marciniak, Ł. Investigation of Plasma Compression in the PF-24 Device with the Use of Different Z Working Gases. Ph.D. Thesis, Institute of Nuclear Physics, Polish Academy of Sciences, Krakow, Polish, 2019. [Google Scholar]
- Marciniak, Ł.; Akel, M.; Kulińska, A.; Lee, S.; Kunze, H.-J.; Scholz, M.; Saw, S.H. Results of plasma radiative compression investigation in the PF-24 device operated with D2, Ar and (100%-x)D2+x%Ar mixtures obtained using the 5-phase Lee model code. Appl. Radiat. Isot. (Under Review).
- Piriaei, D.; Mahabadi, T.D.; Javadi, S.; Ghoranneviss, M.; Saw, S.H.; Lee, S. The study of pinch regimes based on radiation-enhanced compression and anomalous resistivity phenomena and their effects on hard x-ray emission in a Mather type dense plasma focus device (SABALAN2). Phys. Plasmas 2015, 22, 123507. [Google Scholar] [CrossRef] [Green Version]
- Auluck, S.K.H. Re-appraisal and extension of the Gratton-Vargas two-dimensional analytical snowplow model of plasma focus evolution in the context of contemporary research. Phys. Plasmas 2013, 20, 112501. [Google Scholar] [CrossRef] [Green Version]
- Auluck, S.K.H. Re-appraisal and extension of the Gratton-Vargas two-dimensional analytical snowplow model of plasma focus. II. Looking at the singularity. Phys. Plasmas 2015, 22, 112509. [Google Scholar] [CrossRef]
- Auluck, S.K.H. Re-appraisal and extension of the Gratton-Vargas two-dimensional analytical snowplow model of plasma focus. III. Scaling theory for high pressure operation and its implications. Phys. Plasmas 2016, 23, 122508. [Google Scholar] [CrossRef] [Green Version]
- Gratton, F.; Vargas, J.M. Two dimensional electromechanical model of the plasma focus. In Energy Storage, Compression and Switching; Nardi, V., Sahlin, H., Bostick, W.H., Eds.; Plenum: New York, NY, USA, 1983; pp. 354–386. [Google Scholar]
- Vargas, J.M.; Gratton, F.; Gratton, J.; Bruzzone, H.; Kelly, H. Experimental Verification of a Theory of the Current Sheath in the Plasma Focus. In Proceedings of the 6th Int. Conf. on Plasma Phys. and Controlled Fusion Res., Berchtesgaden, Germany, 6–13 October 1976; IAEA-CN-35/E18.5(a). p. 483. Available online: http://www-naweb.iaea.org/napc/physics/FEC/STIPUB439_VOL1.pdf (accessed on 15 July 2021).
- Auluck, S.K.H. Axial magnetic field and toroidally streaming fast ions in the dense plasma focus are natural consequences of conservation laws in the curved axisymmetric geometry of the current sheath. II. Towards a first principles theory. Phys. Plasmas 2017, 24, 112502. [Google Scholar] [CrossRef]
- Auluck, S.K.H. Global parameter optimization of a Mather-type plasma focus in the framework of the Gratton–Vargas two-dimensional snowplow model. Plasma Sources Sci. Technol. 2014, 23, 065015. [Google Scholar] [CrossRef] [Green Version]
- Auluck, S.K.H. Design Parameter Space for a High Pressure Optimized Dense Plasma Focus Operating with Deuterium. J. Fusion Energy 2017, 36, 218–229. [Google Scholar] [CrossRef] [Green Version]
- Moreno, C.; Bruzzone, H.; Martinez, J.; Clausse, A. Conceptual engineering of plasma-focus thermonuclear pulsors. IEEE Trans. Plasma Sci. 2000, 28, 1735–1741. [Google Scholar] [CrossRef]
- Casanova, F.; Moreno, C.; Clausse, A. Finite-elements numerical model of the current-sheet movement and shaping in coaxial discharges. Plasma Phys. Control Fusion 2005, 47, 1239–1250. [Google Scholar] [CrossRef]
- Casanova, F.; Tarifeño-Saldivia, A.; Veloso, F.; Pavez, C.; Clausse, A.; Soto, L. Toroidal High-Density Singularity in a Small Plasma Focus. J. Fusion Energy 2011, 31, 279–283. [Google Scholar] [CrossRef]
- Dyachenko, V.P.; Imshennik, V.S. Plasma Focus and the Neutron Emission Mechanism in A Z–Pinch. Zh. Eksp. Teor. Fiz. 1969, 56, 1766–1777. [Google Scholar]
- Potter, D.E. Numerical Studies of the Plasma Focus. Phys. Fluids 1971, 14, 1911. [Google Scholar] [CrossRef]
- Maxon, S.; Eddleman, J. Two-dimensional magnetohydrodynamic calculations of the plasma focus. Phys. Fluids 1978, 21, 1856. [Google Scholar] [CrossRef]
- Behler, K.; Bruhns, H. Three-fluid magnetohydrodynamical simulation of plasma focus discharges. Phys. Fluids 1987, 30, 3767. [Google Scholar] [CrossRef]
- Stepniewski, W. MHD numerical modelling of the plasma focus phenomena. Vaccum 2004, 76, 51–55. [Google Scholar] [CrossRef]
- Garanin, S.F.; Mamyshev, V.I. Two-Dimensional MHD Simulations of a Plasma Focus with Allowance for the Acceleration Mechanism for Neutron Generation. Plasma Phys. Rep. 2008, 34, 639–649. [Google Scholar] [CrossRef]
- Kueny, C.S.; Flicker, D.G.; Rose, D.V. ALEGRA-HEDP Simulations of the Dense Plasma Focus; Report SAND2009-6373; SANDIA Laboratory: Albuquerque, NM, USA, 2009. [Google Scholar] [CrossRef] [Green Version]
- Meehan, B.T.; Niederhaus, J.H.J. Fully three-dimensional simulation and modeling of a dense plasma focus. J. Déf. Model. Simulation: Appl. Methodol. Technol. 2016, 13, 153–160. [Google Scholar] [CrossRef] [Green Version]
- Liu, J.X.; Sears, J.; McMahon, M.; Tummel, K.; Cooper, C.; Higginson, D.; Shaw, B.; Povilus, A.; Link, A.; Schmidt, A. Seeding the m = 0 Instability in Dense Plasma Focus Z-Pinches with a Hollow Anode. 2016. Available online: https://arxiv.org/abs/1610.09092 (accessed on 15 July 2021).
- Li, H.; Li, S.; Jungman, G.; Hayes-Sterbenz, A.C. Dense Plasma Focus Modeling; LA-UR-17-25546, Los Alamos Report, USA. 2017. Available online: https://doi.org/10.2172/1369162 (accessed on 24 July 2021). [CrossRef]
- Schmidt, A.; Tang, V.; Welch, D. Fully Kinetic Simulations of Dense Plasma Focus Z-Pinch Devices. Phys. Rev. Lett. 2012, 109, 205003. [Google Scholar] [CrossRef] [PubMed] [Green Version]
- Schmidt, A.; Link, A.; Welch, D.; Ellsworth, J.; Falabella, S.; Tang, V. Comparisons of dense-plasma-focus kinetic simulations with experimental measurements. Phys. Rev. E 2014, 89, 061101. [Google Scholar] [CrossRef] [PubMed]
- Schmidt, A.; Link, A.; Welch, D.; Meehan, B.T.; Tang, V.; Halvorson, C.; May, M.; Hagen, E.C. Fully kinetic simulations of megajoule-scale dense plasma focus. Phys. Plasmas 2014, 21, 102703. [Google Scholar] [CrossRef]
- Bazdenkov, S.V.; Vikhrev, V.V. Three-fluid MHD-model of a current shell in Z-pinch. Sov. J. Plasma. Phys. 1975, 1, 250–253. [Google Scholar]
- Scholz, M.; Ivanova-Stanik, I. Initial phase in plasma focus device—model and computer simulation. Vacuum 2000, 58, 287–293. [Google Scholar] [CrossRef]
- Yordanov, V.; Genov, D.; Ivanova-Stanik, I.; Blagoev, A. Ionization growth in the breakdown of plasma focus discharge. Vac. 2004, 76, 365–368. [Google Scholar] [CrossRef]
- Yordanov, V.; Ivanova-Stanik, I.; Blagoev, A. PIC-MCC method with finite element solver for Poisson equation used in simulation of the breakdown phase in dense plasma focus devices. J. Phys. Conf. Ser. 2006, 44, 215–220. [Google Scholar] [CrossRef]
- Yordanov, V.; Ivanova-Stanik, I.; Blagoev, A. The role of photo electrical effect in sustaining the preionization process in Plasma Focus device. J. Phys. Conf. Ser. 2007, 63, 012022. [Google Scholar] [CrossRef]
- Yordanov, V.; Ivanova-Stanik, I.; Blagoev, A. Development of the ionization wave in the breakdown of the plasma focus device. J. Phys. D: Appl. Phys. 2007, 40, 2522–2525. [Google Scholar] [CrossRef]
- Grasso, G.; Rocchi, F.; Sumini, M. Development of a Particle-In-Cell code with Structured Adaptive Mesh Refinement for Plasma Focus devices breakdown simulation. Nuovo Cim. C 2009, 32, 147–151. [Google Scholar]
- Seng, Y.S.; Lee, P.; Rawat, R.S. Electromagnetic particle in cell modeling of the plasma focus: Current sheath formation and lift off. Phys. Plasmas 2014, 21, 023509. [Google Scholar] [CrossRef]
- Blagoev, A.; Yordanov, V. A modelling of the breakdown phase in the plasma focus dis-charge. Plasma Phys. Contr. Fusion 2009, 51, 124022. [Google Scholar] [CrossRef]
- Dobretsov, L.N.; Gomoyunova, M.V. Emissionaya Electronica; Nauka: Moscow, Russia, 1966. (In Russian) [Google Scholar]
- Tawara, H.; Itikawa, Y.; Nishimura, H.; Yoshino, M. Cross Sections and Related Data for Electron Collisions with Hydrogen Molecules and Molecular Ions. J. Phys. Chem. Ref. Data 1990, 19, 617–636. [Google Scholar] [CrossRef]
- The Siglo Data Base, CPAT and Kinema Software. Available online: http://www.siglo-kinema.com (accessed on 15 July 2021).
- Seng, Y.S.; Lee, P.; Rawat, R.S. Current sheath formation dynamics and structure for different insulator lengths of plasma focus device. Phys. Plasmas 2014, 21, 113508. [Google Scholar] [CrossRef] [Green Version]
- Seng, Y.S. The Sliding Discharge Phase of a Plasma Focus. IEEE Trans. Plasma Sci. 2019, 47, 4883–4890. [Google Scholar] [CrossRef]
- Seng, Y.S. Electrical Oscillations of the UNU-ICTP Plasma Focus Device in the Early Break-down Phase. IEEE Trans. Plasma Sci. 2018, 46, 943–946. [Google Scholar] [CrossRef]
- Seng, Y.S.; Lee, P.; Rawat, R.S. External circuit integration with electromagnetic particle in cell modeling of plasma focus devices. Phys. Plasmas 2015, 22, 033524. [Google Scholar] [CrossRef]
- Ohsawa, Y. Strong ion acceleration by a collisionless magnetosonic shock wave propagating perpendicularly to a magnetic field. Phys. Fluids 1985, 28, 2130. [Google Scholar] [CrossRef]
- Davidson, R.C.; Gladd, N.T. Anomalous Transport Properties Associated with Lower-Hybrid-Drift Instability. Phys.Fluids 1975, 18, 1327–1335. [Google Scholar] [CrossRef]
- Bruzzone, H.; Bernal, L. The need of using anomalous resistivity due to Lower Hybrid In-stabilities in plasma-magnetic field interfaces. Nukleonika 2001, 46, 59–61. [Google Scholar]
- Gary, S.P.; Hohl, F. Ion kinematics in Plasma Focus. Phys.Fluids 1973, 16, 997–1002. [Google Scholar] [CrossRef]
- Jiang, S.; Higginson, D.P.; Link, A.; Holod, I.; Schmidt, A. Effect of polarity on beam and plasma target formation in a dense plasma focus. Phys. Plasmas 2019, 26, 042702. [Google Scholar] [CrossRef]
- Saito, S.; Sakai, J.I. Surfatron acceleration of ions by fast magnetosonic shocks generated dur-ing two current loops’ coalescence. Astrophys. J. 2004, 604, L133–L136. [Google Scholar] [CrossRef]
- Yousefi, R.; Sakai, J.I.; Ito, H.; Masugata, K. A New Ion Acceleration Mechanism in Z-Pinch Discharges of a Plasma Focus Device. Iranian Phys. J. 2007, 1, 31–34. [Google Scholar]
- Soto, L.; Pavez, C.; Tarifeño, A.; Moreno, J.; Veloso, F.; Tarifeño-Saldivia, A. Studies on scalability and scaling laws for the plasma focus: Similarities and differences in devices from 1 MJ to 0.1 J. Plasma Sources Sci. Technol. 2010, 19, 055017. [Google Scholar] [CrossRef]
- Klir, D.; Soto, L. Drive Parameter of Neutron-Optimized Dense Plasma Foci. IEEE Trans. Plasma Sci. 2012, 40, 3273–3279. [Google Scholar] [CrossRef]
- Turner, L. Hall Effects on Magnetic Relaxation. IEEE Trans. Plasma Sci. 1986, 14, 849–857. [Google Scholar] [CrossRef]
- Auluck, S.K.H. Description of plasma focus current sheath as the Turner relaxed state of a Hall magnetofluid. Phys. Plasmas 2009, 16, 122504. [Google Scholar] [CrossRef]
- Auluck, S.K.H. Evaluation of Turner relaxed state as a model of long-lived ion-trapping structures in plasma focus and Z-pinches. Phys. Plasmas 2011, 18, 32508. [Google Scholar] [CrossRef]
- Auluck, S.K.H. Bounds imposed on the sheath velocity of a dense plasma focus by conservation laws and ionization stability condition. Phys. Plasmas 2014, 21, 090703. [Google Scholar] [CrossRef] [Green Version]
- Auluck, S.K.H. On the representation of dense plasma focus as a circuit element. Phys. Plasmas 2021, 28, 030703. [Google Scholar] [CrossRef]
- Bailey, J.; Ettinger, Y.; Fisher, A.; Rostoker, N. Gas-puff Z pinches with D2and D2-Ar mixtures. Appl. Phys. Lett. 1982, 40, 460–462. [Google Scholar] [CrossRef] [Green Version]
- Zhang, T.; Lin, X.; Chandra, K.; Tan, T.L.; Springham, S.; Patran, A.; Lee, P.; Lee, S.; Rawat, R.S. Current sheath curvature correlation with the neon soft x-ray emission from plasma focus device. Plasma Sources Sci. Technol. 2005, 14, 368–374. [Google Scholar] [CrossRef]
- Zakaullah, M.; Baig, T.; Beg, S.; Murtaza, G. Effect of insulator sleeve length on neutron emission in a plasma focus. Phys. Lett. A 1989, 137, 39–43. [Google Scholar] [CrossRef]
- Koohestani, S.; Habibi, M.; Amrollahi, R.; Baghdadi, R.; Roomi, A. Effect of Quartz and Pyrex Insulators Length on Hard-X ray Signals in APF Plasma Focus Device. J. Fusion Energy 2010, 30, 68–71. [Google Scholar] [CrossRef]
- Dönges, A.; Herziger, G.; Krompholz, H.; Rühl, F.; Schönbach, K. The breakdown phase in a coaxial plasma gun. Phys. Lett. A 1980, 76, 391–392. [Google Scholar] [CrossRef]
- Herold, H.; Jerzykiewicz, A.; Sadowski, M.; Schmidt, H. Comparative analysis of large plas-ma focus experiments performed at IPF, Stuttgart, and IPJ, Świerk. Nucl. Fusion 1989, 29, 1255–1270. [Google Scholar] [CrossRef]
- Beg, F.N.; Zakaullah, M.; Murtaza, G.; Beg, M.M. Effect of insulator sleeve material on neu-tron emission from a plasma focus. Phys. Scr. 1992, 46, 152–154. [Google Scholar] [CrossRef]
- Hussain, S.; Shafiq, M.; Badar, M.A.; Zakaullah, M. Effect of insulator sleeve material on the x-ray emission from a plasma focus device. Phys. Plasmas 2010, 17, 092705. [Google Scholar] [CrossRef]
- Decker, G.; Kies, W.; Pross, G. Experiments solving the polarity riddle of the plasma focus. Phys. Lett. A 1982, 89, 393–396. [Google Scholar] [CrossRef]
- Mathuthu, M.; Zengeni, T.; Gholap, A. Variation of focus action with electrode length for an inner electrode of negative polarity. IEEE Trans. Plasma Sci. 1998, 26, 14–18. [Google Scholar] [CrossRef]
- Soto, L.; Tarifeño-Saldivia, A.; Pavez, C.; Avaria, G.; Moreno, J.; Cabrini, N.; Zambra, M. Experimental Study in a Plasma Focus with Modified Electrodes. In Proceedings of the 39th EPS Conference & 16th Int. Congress on Plasma Physics, Stockholm, Sweden, 2–6 July 2012; P5.103. Available online: http://ocs.ciemat.es/epsicpp2012pap/pdf/P5.103.pdf (accessed on 15 July 2021).
- Barbaglia, M.O.; Bruzzone, H.; Rios, I.; Acuña, H.; González, J.; Clausse, A. Multiple pinch formations in small plasma-focus devices. Plasma Phys. Control Fusion 2010, 52, 032001. [Google Scholar] [CrossRef]
- Barbaglia, M.O.; Soto, L.; Clausse, A. Multiple pinching in the miniature plasma focus nanoPLADEMA. J. Physics: Conf. Ser. 2012, 370, 012058. [Google Scholar] [CrossRef] [Green Version]
- Bruzzone, H.; Vieytes, R. The initial phase in plasma focus devices. Plasma Phys. Control Fusion 1993, 35, 1745–1754. [Google Scholar] [CrossRef]
- Gribkov, V.A.; Tyagunov, M.G. USSR Patent No. 1012707, 26 January 1981.
- Gribkov, V.A.; Tyagunov, M.G. USSR Patent No. 1026439, 1 March 1981.
- Gribkov, V.A.; Tyagunov, M.G. USSR Patent No. 1101838, 20 December 1982.
- Auluck, S.K.H.; Parhar, S.; Kulkarni, M.G.; Magtum, A.; Ghatge, S.; Suryavanshi, N.; Mirajkar, P.U. Demonstration of Plasma Focus Operation without Using Sliding Discharge on a Glass or Ceramic Insulator for Plasma Initiation. 2021. Available online: https://arxiv.org/abs/2104.00958 (accessed on 15 July 2021).
- Bruzzone, H.; Fischfeld, G. On The Structure of Plasma Focus Imploding Current Sheaths. Phys. Lett. A 1989, 134, 484–487. [Google Scholar] [CrossRef]
- Bruzzone, H. The role of anomalous resistivities in Plasma Focus discharges. Nukleonika 2001, 46, S3–S7. [Google Scholar]
- Volobuev, I.V.; Gurei, A.E.; Nikulin, V.Y.; Polukhin, S.N. Magnetic and Neutron Measurements on the PF-400 Plasma Focus Facility. Plasma Phys. Rep. 2010, 36, 1013–1022. [Google Scholar] [CrossRef]
- Bruzzone, H.; Acuña, H.N.; Barbaglia, M.O.; Milanese, M.M.; Miklaszewski, R.; Paduch, M.; Zieliñska, E.; Clausse, A. Time-Varying Inductance of the Plasma Sheet in the PF1000 Plasma-Focus Device. IEEE Trans. Plasma Sci. 2016, 44, 968–972. [Google Scholar] [CrossRef]
- Mitrofanov, K.N.; Krauz, V.I.; Grabovski, E.V.; Myalton, V.V.; Vinogradov, V.P.; Paduch, M.; Scholz, M.; Karpiński, L. Study of the interrelation between the electrotechnical parameters of the plasma focus discharge circuit and the plasma compression dynamics on the PF-3 and PF-1000 facilities. Plasma Phys. Rep. 2015, 41, 379–398. [Google Scholar] [CrossRef]
- Barbaglia, M.O.; Milanese, M.; Soto, L.; Clausse, A.; Moreno, J.; Pavez, C.; Moreno, C. Temporal Variation of the Current Sheet Inductance from PACO Plasma Focus Device. J. Fusion Energy 2016, 35, 561–566. [Google Scholar] [CrossRef]
- Lu, M.F. Instability of the current sheath implosion in an 18-kJ Mather-type plasma focus. Phys. Rev. E 1996, 54, R1074–R1077. [Google Scholar] [CrossRef]
- Lu, M.F. Different modes of plasma sheath motion in the radial compression and pinch phases in plasma focus. J. Phys. D Appl. Phys. 1996, 29, 660–680. [Google Scholar] [CrossRef]
- Kubes, P.; Paduch, M.; Pisarczyk, T.; Scholz, M.; Klir, D.; Kravarik, J.; Rezac, K.; Chodukow-ski, T.; Ivanova-Stanik, I.; Karpinski, L.; et al. Transformation of the Pinched Column at aPeriod of the Neutron Production. IEEE Trans. Plasma Sci. 2010, 38, 672–679. [Google Scholar] [CrossRef]
- Kubes, P.; Paduch, P.; Pisarczyk, T.; Scholz, M.; Chodukowski, T.; Klir, D.; Kravarik, J.; Rezac, K.; Ivanova-Stanik, I.; Karpinski, L.; et al. Spontaneous Transformation in the Pinched Column of the Plasma Focus. IEEE Trans. Plasma Sci. 2011, 39, 562–568. [Google Scholar] [CrossRef]
- Kubes, P.; Krauz, V.; Mitrofanov, K.; Paduch, M.; Scholz, M.; Piszarzcyk, T.; Chodukowski, T.; Kalinowska, Z.; Karpinski, L.; Klir, D.; et al. Correlation of magnetic probe and neutron signals with interferometry figures on the plasma focus discharge. Plasma Phys. Control Fusion 2012, 54, 105023. [Google Scholar] [CrossRef]
- Kubes, P.; Klir, D.; Kravarik, J.; Rezac, K.; Kortanek, J.; Krauz, V.; Mitrofanov, K.; Paduch, M.; Scholz, M.; Pisarczyk, T.; et al. Scenario of pinch evolution in a plasma focus discharge. Plasma Phys. Control Fusion 2013, 55, 035011. [Google Scholar] [CrossRef]
- Kubes, P.; Paduch, M.; Cikhardt, J.; Klir, D.; Kravarik, J.; Rezac, K.; Kortanek, J.; Cikhardtova, B.; Zielinska, E. Existence of a return direction for plasma escaping from a pinched column in a plasma focus discharge. Phys. Plasmas 2015, 22, 052706. [Google Scholar] [CrossRef]
- Kubes, P.; Paduch, M.; Cikhardt, J.; Klir, D.; Kravarik, J.; Rezac, K.; Cikhardtova, B.; Kortanek, J.; Zielinska, E. The evolution of the plasmoidal structure in the pinched column in plasma focus discharge. Plasma Phys. Control Fusion 2016, 58, 045005. [Google Scholar] [CrossRef]
- Kubes, P.; Paduch, M.; Cikhardt, J.; Cikhardtova, B.; Klir, D.; Kravarik, J.; Rezac, K.; Zielinska, E.; Sadowski, M.J.; Szymaszek, A.; et al. Transformation of the ordered internal structures during the acceleration of fast charged particles in a dense plasma focus. Phys. Plasmas 2017, 24, 072706. [Google Scholar] [CrossRef]
- Kubes, P.; Kravarik, J.; Klir, D.; Rezac, K.; Scholz, M.; Paduch, M.; Tomaszewski, K.; Ivanova-Stanik, I.; Bienkowska, B.; Karpinski, L.; et al. Correlation of Radiation with Electron and Neutron Signals Taken in a Plasma-Focus Device. IEEE Trans. Plasma Sci. 2006, 34, 2349–2351. [Google Scholar] [CrossRef]
- Scholz, M.; Bieńkowska, B.; Borowiecki, M.; Ivanova-Stanik, I.; Karpiński, L.; Stępniewski, W.; Paduch, M.; Tomaszewski, K.; Sadowski, M.; Szydłowski, A.; et al. Status of a mega-joule scale Plasma-Focus experiments. Nukleonika 2006, 51, 79–84. [Google Scholar]
- Schmidt, H.; Kasperczuk, A.; Paduch, M.; Pisarczyk, T.; Scholz, M.; Tomaszewski, K.; Szydłowski, A. Review of Recent Experiments with the Megajoule PF-1000 Plasma Focus Device. Phys. Scr. 2002, 66, 168–172. [Google Scholar] [CrossRef]
- Malinowska, A.; Malinowski, K.; Skladnik-Sadowska, E.; Sadowski, M.J.; Scholz, M.; Szydlowski, A.; Czaus, K.; Jaskóla, M.; Korman, A.; Schmidt, H. Measurements of ion micro-beams in RPI-type discharges and fusion protons in PF-1000 experiments. Phys. Scr. 2006, T123, 104–111. [Google Scholar] [CrossRef]
- Kubes, P.; Kravarik, J.; Klir, D.; Rezac, K.; Scholz, M.; Paduch, M.; Ivanova-Stanik, I.; Karpinski, L.; Tomaszewski, K.; Kusse, B.R.; et al. Neutron Production and Fast Deuteron Characteristics at the Plasma Focus Discharge. AIP Conf. Proc. 2009, 1088, 207. [Google Scholar] [CrossRef]
- Kubes, P.; Paduch, M.; Cikhardtova, B.; Cikhardt, J.; Klir, D.; Kravarik, J.; Rezac, K.; Kortanek, J.; Zielinska, E.; Sadowski, M.J.; et al. The influence of the nitrogen admixture on the evolution of a deuterium pinch column. Phys. Plasmas 2016, 23, 082704. [Google Scholar] [CrossRef]
- Yamada, M.; Kulsrud, R.; Ji, H. Magnetic reconnection. Rev. Mod. Phys. 2010, 82, 603–664. [Google Scholar] [CrossRef]
- Loureiro, N.F.; Uzdensky, D. Magnetic reconnection: From the Sweet–Parker model to stochastic plasmoid chains. Plasma Phys. Control Fusion 2016, 58, 014021. [Google Scholar] [CrossRef]
- Boozer, A.H. Particle acceleration and fast magnetic reconnection. Phys. Plasmas 2019, 26, 082112. [Google Scholar] [CrossRef] [Green Version]
- Auluck, S.K.H. Acceleration and trapping of fast ions in self-organized magneto-plasma structures in the dense plasma focus. Phys. Plasmas 2020, 27, 022308. [Google Scholar] [CrossRef]
- Roshan, M.V.; Lee, P.; Lee, S.; Talebitaher, A.; Rawat, R.S.; Springham, S.V. Backward high energy ion beams from plasma focus. Phys. Plasmas 2009, 16, 074506. [Google Scholar] [CrossRef] [Green Version]
- Bruzzone, H.; Milanese, M.M.; Niedbalski, J.J.; Acuna, H.N.; Moroso, R.L.; Supán, J.L.; Guichón, S.; Malamud, F. Temporal Correlations Between Hard X-ray and Neutron Pulses in the PACO Plasma Focus Device. IEEE Trans. Plasma Sci. 2010, 38, 1592–1597. [Google Scholar] [CrossRef]
- Moreno, J.; Veloso, F.; Pavez, C.; Tarifeño-Saldivia, A.; Klir, D.; Soto, L. Neutron energy distribution and temporal correlations with hard x-ray emission from a hundreds of joules plasma focus device. Plasma Phys. Control Fusion 2015, 57, 035008. [Google Scholar] [CrossRef]
- Jain, J.; Moreno, J.; Morales, D.; Davis, S.; Bora, B.; Avaria, G.; Inestrosa-Izurieta, M.J.; Soto, L. Observation and interpretation of neutron origin prior to hard X rays and pinch in a hundred joules plasma focus device. Laser Part. Beams 2017, 35, 656–662. [Google Scholar] [CrossRef]
- Zakaullah, M.; Akhtar, I.; Murtaza, G.; Waheed, A. Imaging of fusion reaction zone in plasma focus. Phys. Plasmas 1999, 6, 3188–3193. [Google Scholar] [CrossRef]
- Yap, S.L.; Wong, C.S.; Choi, P.; Dumitrescu, C.; Moo, S.P. Observation of Two Phases of Neutron Emission in a Low Energy Plasma Focus. Jpn. J. Appl. Phys. 2005, 44, 8125–8132. [Google Scholar] [CrossRef]
- Aliaga-Rossel, R.; Choi, P. A novel technique for scintillator light collection in neutron meas-urements. Rev. Sci. Instrum. 1994, 65, 3034. [Google Scholar]
- Kubes, P.; Paduch, M.; Cikhardt, J.; Kortanek, J.; Cikhardtova, B.; Rezac, K.; Klir, D.; Kravarik, J.; Zielińska, E. Filamentary structure of plasma produced by compression of puffing deuterium by deuterium or neon plasma sheath on plasma-focus discharge. Phys. Plasmas 2014, 21, 122706. [Google Scholar] [CrossRef]
- Kubes, P.; Paduch, M.; Cikhardt, J.; Kortanek, J.; Batobolotova, B.; Rezac, K.; Klir, D.; Kravarik, J.; Surala, W.; Zielinska, E.; et al. Neutron production from puffing deuterium in plasma focus device. Phys. Plasmas 2014, 21, 082706. [Google Scholar] [CrossRef]
- Kubes, P.; Paduch, M.; Cikhardtova, B.; Cikhardt, J.; Klir, D.; Kravarik, J.; Rezac, K.; Zielinska, E.; Zaloga, D.; Sadowski, M.J.; et al. Influence of the Al wire placed in the anode axis on the transformation of the deuterium plasma column in the plasma focus discharge. Phys. Plasmas 2016, 23, 062702. [Google Scholar] [CrossRef]
- Kubes, P.; Paduch, M.; Cikhardt, J.; Cikhardtova, B.; Rezac, K.; Klir, D.; Kravarik, J.; Kortanek, J.; Zielińska, E. Investigation of compression of puffing neon by deuterium current and plasma sheath in plasma focus discharge. Phys. Plasmas 2015, 22, 062705. [Google Scholar] [CrossRef]
- Kubes, P.; Paduch, M.; Cikhardtova, B.; Cikhardt, J.; Klir, D.; Kravarik, J.; Rezac, K.; Kortanek, J.; Zielinska, E.; Sadowski, M.J.; et al. Interferometry and X-ray diagnostics of pinched helium plasma in a dense plasma focus with an Al-wire on the axis. Phys. Plasmas 2016, 23, 112708. [Google Scholar] [CrossRef]
- Oginov, A.V.; Karakin, M.A.; Krauz, V.I.; Myalton, V.V.; Vinogradov, V.P.; Gurey, A.E.; Nikulin, V.Y.; Tikhomirov, A.A. Study of the Dynamics and Structure of Plasma-Current Sheath of Plasma Focus Discharge. BEAMS’04. In Proceedings of the 15th Int. Conf. on High-Power Particle Beams, Saint-Petersburg, Russia, 18–23 July 2005; pp. 746–749. [Google Scholar]
- Krauz, V.I.; Levashova, M.G.; Karakin, M.A.; Krokhin, O.N.; Lisitsa, V.S.; Mokeev, A.N.; Myalton, V.V.; Nikulin, V.Y.; Oginov, A.V.; Smirnov, V.P.; et al. Influence of the radiation of the plasma-focus current sheath on the implosion dynamics of condensed targets. Plasma Phys. Rep. 2008, 34, 43–51. [Google Scholar] [CrossRef]
- Krauz, V.; Mitrofanov, K.; Scholz, M.; Myalton, V.; Paduch, M.; Grabovski, E.; Karpinski, L.; Koidan, V.; Vinogradov, V.; Vinogradova, Y.; et al. Magnetic field measurements on PF-1000 and PF-3 facilities: Current sheath structure and neutron scaling. Nukleonika 2012, 57, 201–204. [Google Scholar]
- Krauz, V.I.; Mitrofanov, K.N.; Myalton, V.V.; Khautiev, E.Y.; Mokeev, A.N.; Vinogradov, V.P.; Vinogradova, Y.V.; Grabovsky, E.V.; Zukakishvili, G.G. Studies of Dynamics and Structure of Current Sheath on Plasma Focus Facility PF-3. In Proceedings of the 34th EPS Conference on Plasma Phys., Warsaw, Poland, 2–6 July 2007. ECA Vol.31F, P-1.018. [Google Scholar]
- Gurey, G.; Nikulin, V.; Polukhin, S.; Volobuev, I. Current sheath studies by magnetic probes on plasma focus PF-400.Problems of atomic science and technology. Plasma Phys. 2009, 15, 98–100. [Google Scholar]
- Andreeshchev, E.A.; Voĭtenko, D.A.; Krauz, V.I.; Markoliya, A.I.; Matveev, Yu.V.; Reshetnyak, N.G.; Khautiev, É.Y. Study of the dynamics of a plasma current sheath in the KPF-4 Phoenix plasma-focus facility. Plasma Phys. Rep. 2007, 33, 218–226. [Google Scholar] [CrossRef]
- Vinogradov, V.P.; Nashilevskii, A.V.; Krauz, V.I.; Remnev, G.E.; Vinogradova, Y.V.; Kanaev, G.G.; Mitrofanov, K.N.; Myalton, V.V. Development and study of a portable plasma focus neutron source. Plasma Phys. Rep. 2014, 40, 146–159. [Google Scholar] [CrossRef]
- Nikulin, V.Y.; Polukhin, S.N.; Tikhomirov, A.A. A simple criterion for the snowplowing efficiency of the working gas in a kJ plasma focus. Plasma Phys. Rep. 2005, 31, 591–595. [Google Scholar] [CrossRef]
- Schmidt, H.; Sadowski, M.J.; Jakubowski, L.; Skladnik-Sadowska, E.; Stanislawski, J. Gas-puff target experiments with the Poseidon plasma focus facility. Plasma Phys. Control Fusion 1994, 36, 13–24. [Google Scholar] [CrossRef]
- Milanese, M.; Moroso, R.; Pouzo, J. A study of the production of neutrons in a dense plasma focus source operated with a non-uniform density of deuterium neutral gas. J. Phys. D: Appl. Phys. 1998, 31, 85–92. [Google Scholar] [CrossRef]
- Choi, P.; Aliaga-Rossel, R. Dynamics of a Medium Energy Plasma Focus. In DENSE Z-PINCHES: Third International Conference; AIP Publishing: College Park, MD, USA, 1994; Volume 299, pp. 299–307. [Google Scholar]
- Aliaga-Rossel, R.; Choi, P. Experimental Observations of the Spatial Anisotropy of the Neu-tron Emission in a Medium Energy Plasma Focus. IEEE Trans. Plasma Sci. 1998, 26, 1138–1145. [Google Scholar] [CrossRef]
- Verma, R.; Lee, P.; Lee, S.; Springham, S.V.; Tan, T.L.; Rawat, R.S.; Krishnan, M. Order of magnitude enhancement in neutron emission with deuterium-krypton admixture operation in miniature plasma focus device. Appl. Phys. Lett. 2008, 93, 101501. [Google Scholar] [CrossRef]
- Talebitaher, A.; Lee, S.; Kalaiselvi, S.M.P.; Verma, R.; Lee, P.; Springham, S.V.; Tan, T.L.; Rawat, R.S. Influence of Krypton Seeding on DD Fusion Neutron Production: Evaluation Methodology for Plasma Focus Optimization. J. Fusion Energy 2015, 35, 370–377. [Google Scholar] [CrossRef]
- Yap, S.L.; Moo, S.P.; Wong, C.S.; Choi, P.S.; Dumitrescuzoita, C. Spatial and temporal evolution of neutron emission from a small plasma focus. AIP Conf. Proc. 1997, 409, 75–78. [Google Scholar] [CrossRef]
- Bures, B.L.; Krishnan, M.; Madden, R.; Blobner, F. Enhancing Neutron Emission From a 500-J Plasma Focus by Altering the Anode Geometry and Gas Composition. IEEE Trans. Plasma Sci. 2010, 38, 667–671. [Google Scholar] [CrossRef]
- Hahn, E.N.; Housley, D.; Narkis, J.; Conti, F.; Lowe, D.R.; Beg, F.N. Effect of krypton admixture in deuterium on neutron yield in a megaampere dense plasma focus. J. Appl. Phys. 2020, 128, 143302. [Google Scholar] [CrossRef]
- Mohammadi, M.A.; Sobhanian, S.; Rawat, R.S. Neutron production with mixture of deuter-ium and krypton in Sahand Filippov type plasma focus facility. Phys. Lett. A 2011, 375, 3002–3006. [Google Scholar] [CrossRef]
- Babazadeh, A.R.; Sadat Kiai, S.M. Study of Gas Admixture Influences on the Pinch Dynam-ics in a 90 kJ Filippov Type Plasma Focus. In Proceedings of the 32nd EPS Conference on Plasma Phys., Tarragona, Spain, 27 June–1 July 2005; ECA Volume 29C. p. 1.128. [Google Scholar]
- Scholz, M.; Karpinski, L.; Stepniewski, W.; Branitski, A.; Fedulov, M.; Medovschikov, S.; Nedoseev, S.; Smirnov, V.P.; Zurin, M.; Szydlowski, A. Foam liner driven by a plasma focus current sheath. Phys. Lett. A 1999, 262, 453–456. [Google Scholar] [CrossRef]
- Fortov, V.E.; Karakin, M.A.; Khautiev, E.Y.; Krauz, V.I.; Medovschikov, S.F.; Mokeev, A.N.; Myalton, V.V.; Nedoseev, S.L.; Smirnov, V.P.; Vinogradov, V.P.; et al. Study of the Plasma Focus as a Driver for the Magnetic Compression of Liners. In Proceedings of the 5th Int. Conf, on Z-pinches, Albuquerque, NM, USA, 23–28 June 2002; Davids, J., Deeney, C., Pereira, N.R., Eds.; Melville: New York, NY, USA, 2002; Volume 651, pp. 37–42. [Google Scholar]
- Krauz, V.I.; Karakin, M.A.; Khautiev, E.Y.; Mokeev, A.N.; Myalton, V.V.; Smirnov, V.P.; Vinogradov, V.P.; Fortov, V.E.; Nikulin, V.; Oginov, A.V.; et al. Recent results of the Filippov-type PF experiments at Kurchatov Institute. AIP Conf. Proc. 2006, 812, 43. [Google Scholar] [CrossRef]
- Mitrofanov, K.N.; Krauz, V.I.; Myalton, V.V.; Vinogradov, V.P.; Vinogradova, Y.V.; Grabovski, E.V.; Dan’ko, S.A.; Zelenin, A.A.; Medovshchikov, S.F.; Mokeev, A.N. Study of the Implosion of Wire Arrays at the PF-3 Facility. Plasma Phys. Rep. 2014, 40, 110–134. [Google Scholar] [CrossRef]
- Dan’ko, S.A.; Krauz, V.I.; Myalton, V.V.; Zhuzhunashvili, A.I.; Vinogradov, V.P.; Kharrasov, A.M.; Ananev, S.S.; Vinogradova, Y.V.; Kalinin, Y.G. Study of Soft X-ray Emission during Wire Array Implosion under Plasma Focus Conditions at the PF-3 Facility. Plasma Phys. Rep. 2015, 41, 882–894. [Google Scholar] [CrossRef]
- Kubes, P.; Kravarik, J.; Klir, D. Influence of CD2 fiber on the compression in the PF-1000 facility. Czechoslov. J. Phys. 2004, 54, 285–290. [Google Scholar] [CrossRef]
- Vinogradova, V.P.; Karakin, M.A.; Krauz, V.I.; Mokeev, A.N.; Myalton, V.V.; Smirnov, V.P.; Fortov, V.E.; Khautiev, É.Y. Dynamics of a high-temperature pinch in the presence of dust. Plasma Phys. Rep. 2006, 32, 642–655. [Google Scholar] [CrossRef]
- Maisonnier, C.; Linhart, J.G.; Haegi, M. Generation of Shocks. In A Collapsing Cylindrical Plasma Shell Nuclear Fusion Supplement. 1962. Part II. pp. 727–732. Available online: http://www-naweb.iaea.org/napc/physics/FEC/1961.pdf (accessed on 15 July 2021).
- Maisonnier, C.; Haegi, M.; Linhart, J.G. Hollow Dynamic Pinch Proc. of Conf. on Plasma Phys and Contr. Fus. Res., Culham, 6–10September 1965, V.II; IAEA: Vienna, Australia, 1966; pp. 345–365. Available online: http://www-naweb.iaea.org/napc/physics/FEC/STIPUB111_VOL2.pdf. (accessed on 15 July 2021).
- Yeh, T.R.; Wen, M.; Tzeng, C.C.; Shang, D.J.; Yeh, C.K.; Wu, K.S.; Kuo, Y.Y.; Hou, W.S. Neutron localization measurements from a two-gun plasma focus device. Laser Part. Beams 1989, 7, 773–779. [Google Scholar] [CrossRef]
- Samuelli, M.; Rapezzi, L.; Angelone, M.; Pillon, M.; Rapisarda, M.; Vitulli, S. Unconventional plasma focus devices. IEEE Trans. Plasma Sci. 2006, 34, 36–54. [Google Scholar] [CrossRef]
- Sodekoda, T.; Kuwabara, H.; Masuda, M.; Horioka, K. Demonstration of rapid electrical re-covery in repetitive operation of a counter-facing plasma-focus device. Plasma Fusion Res-arch: Rapid Commun. 2017, 12, 1206021. [Google Scholar] [CrossRef]
- Lee, J.H.; McFarland, D.R.; Hohl, F. Production of dense plasmas in a hypocycloidal pinch apparatus. Phys. Fluids 1977, 20, 313. [Google Scholar] [CrossRef]
- Hong, Y.J.; Lee, S.H.; Uhm, H.S.; Choi, E.H. Measurement of extreme ultraviolet light and electron temperature for a dense plasmas from hypocycloidal pinch device. Curr. Appl. Phys. 2011, 11, S177–S181. [Google Scholar] [CrossRef]
- Lee, J.H.; McFarland, D.R.; Harries, W.L. Investigation of a staged plasma-focus apparatus. Plasma Phys. 1978, 20, 1025–1038. [Google Scholar] [CrossRef]
- Ay, Y.; Al-Halim, M.A.; Bourham, M.A. Simulation of the plasma sheath dynamics in a spherical plasma focus. Eur. Phys. J. D 2015, 69, 1–9. [Google Scholar] [CrossRef]
- Wong, C.S.; Choi, P.; Leong, W.S.; Singh, J. Generation of High Energy Ion Beams from a Plasma Focus Modified for Low Pressure Operation. Jpn. J. Appl. Phys. 2002, 41, 3943–3946. [Google Scholar] [CrossRef]
- Wong, C.S.; Yap, S.L. Generation of Deuteron Beam from the Plasma Focus. Solid State Phenom. 2005, 107, 151. [Google Scholar] [CrossRef]
- Lim, L.K.; Yap, S.L.; Bradley, D.A. Time-resolved characteristics of deuteron-beam generated by plasma focus discharge. PLoS ONE 2018, 13, e0188009. [Google Scholar] [CrossRef] [Green Version]
- Lim, L.K.; Yap, S.L.; Nee, C.H. Dynamics of ion beam emission in a low pressure plasma focus device. Plasma Phys. Control Fusion 2021, 63, 035012. [Google Scholar] [CrossRef]
- Khan, M.Z.; Yap, S.L.; Yaqoob, I.; Kumar, N.N.; Kuang, L.L.; San, W.C. Low-Energy Plasma Focus Device as an Electron Beam Source. Sci. World, J. 2014, 2014, 1–9. [Google Scholar] [CrossRef] [PubMed]
- Soto, L.; Pavez, C.; Moreno, J.; Barbaglia, M.; Clausse, A. Nanofocus: An ultra-miniature dense pinch plasma focus device with submillimetric anode operating at 0.1 J. Plasma Sources Sci. Technol. 2008, 18, 015007. [Google Scholar] [CrossRef]
- Nayfeh, A.H. Perturbation Methods; WILEY-VCH Verlag GmbH & CO. KGaA: Weinheim, Germany, 2004. [Google Scholar]
- Auluck, S.K.H. Role of Electron-inertia-linked Current Source Terms in the Physics of Cylin-drically Symmetric Imploding Snow-Plow Shocks. Phys. Plasmas 2002, 9, 4488–4494. [Google Scholar] [CrossRef]
- Auluck, S.K.H. Dense Plasma Focus: A question in search of answers, a technology in search of applications. Int. J. Mod. Physics: Conf. Ser. 2014, 32, 1460315. [Google Scholar] [CrossRef] [Green Version]
- Auluck, S.K.H. Manifestation of Constrained Dynamics in a Low-Pressure Spark. IEEE Trans. Plasma Sci. 2013, 41, 437–446. [Google Scholar] [CrossRef] [Green Version]
- Koh, J.M.; Rawat, R.S.; Patran, A.; Zhang, T.; Wong, D.; Springham, S.V.; Tan, T.L.; Lee, S.; Lee, P. Optimization of the high pressure operation regime for enhanced neutron yield in a plasma focus device. Plasma Sources Sci. Technol. 2004, 14, 12–18. [Google Scholar] [CrossRef]
- Decker, G.; Flemming, L.; Kaeppeler, H.J.; Oppenlander, T.; Pross, G.; Schilling, P.; Schmidt, H.; Shakhatre, M.; Trunk, M. Current and neutron yield scaling of fast high voltage plasma focus. Plasma Phys. 1980, 22, 245–260. [Google Scholar] [CrossRef]
- Krompholz, H.; Rühl, F.; Schneider, W.; Schönbach, K.; Herziger, G. A scaling law for plasma focus devices. Phys. Lett. A 1981, 82, 82–84. [Google Scholar] [CrossRef]
- Milanese, M.; Pouzo, J. Neutron yield scaling laws for plasma focus devices. Small Plasma Physics Experiments. In Proceedings of the Symposium on small scale laboratory plasma experiments, Spring College on Plasma Physics, Trieste, Italy, 25 May–19 June 1987; p. 66. [Google Scholar]
- Nikulin, V.Y.; Polukhin, S.N. Saturation of the Neutron Yield from Megajoule Plasma Focus Facilities. Plasma Phys. Rep. 2007, 33, 271–277. [Google Scholar] [CrossRef]
- Herold, H.; Kaeppeler, H.J.; Schmidt, H.; Shakhatre, M.; Wong, C.S.; Deeney, C.; Choi, P. Progress in plasma focus operation up to 500 kJ bank energy. IAEA-CN-S0/C-IV-S-2, 1988. In Proceedings of the 12th International Conference on Plasma Physics and Controlled Nuclear Fusion Research, Nice, France, 12–19 October 1988; Volume 2, p. 587. Available online: http://www-naweb.iaea.org/napc/physics/FEC/STIPUB787_VOL2.pdf (accessed on 15 July 2021).
- Shakhatre, M.; Auluck, S. Saettigung der Neutronenausbeute am Plasmafokus Poster. In Proceedings of the Spring meeting of the German Physical Society, Kiel, Germany, 11–16 March 1991. [Google Scholar]
- Mitov, M.; Blagoev, A.; Zapryanov, S.; Auluck, S.K.H. First dedicated experiment on the az-imuthal electric field as a new diagnostic tool for Dense Plasma Focus. In Proceedings of the 9th International Workshop and Summer School on Plasma Physics, Sofia, Bulgaria, 30 November–4 December 2020. [Google Scholar]
- Auluck, S.K.H. Energetic Ions in Dense Magnetized Plasma and the Fundamental Premise of Thermonuclear Fusion—Significance of Energetic Ions, the Fundamental Premise of Thermonucle-AR Fusion and Present State of Understanding in DMP. School and Training Course on Dense Magnetized Plasma, Abdus Salam International Center for Theoretical Physics (ICTP), Trieste, Italy, 8–12 October 2012. Available online: http://indico.ictp.it/event/a11188/session/11/contribution/7 (accessed on 15 July 2021).
- Mannucci, S.; Mostacci, D.; Rocchi, F.; Sumini, M.; Angeli, E.; Tartari, A. Effect of a cathodic knife edge on the PFMA-1 pinch performance. Plasma Sources Sci. Technol. 2009, 18, 436–449. [Google Scholar] [CrossRef]


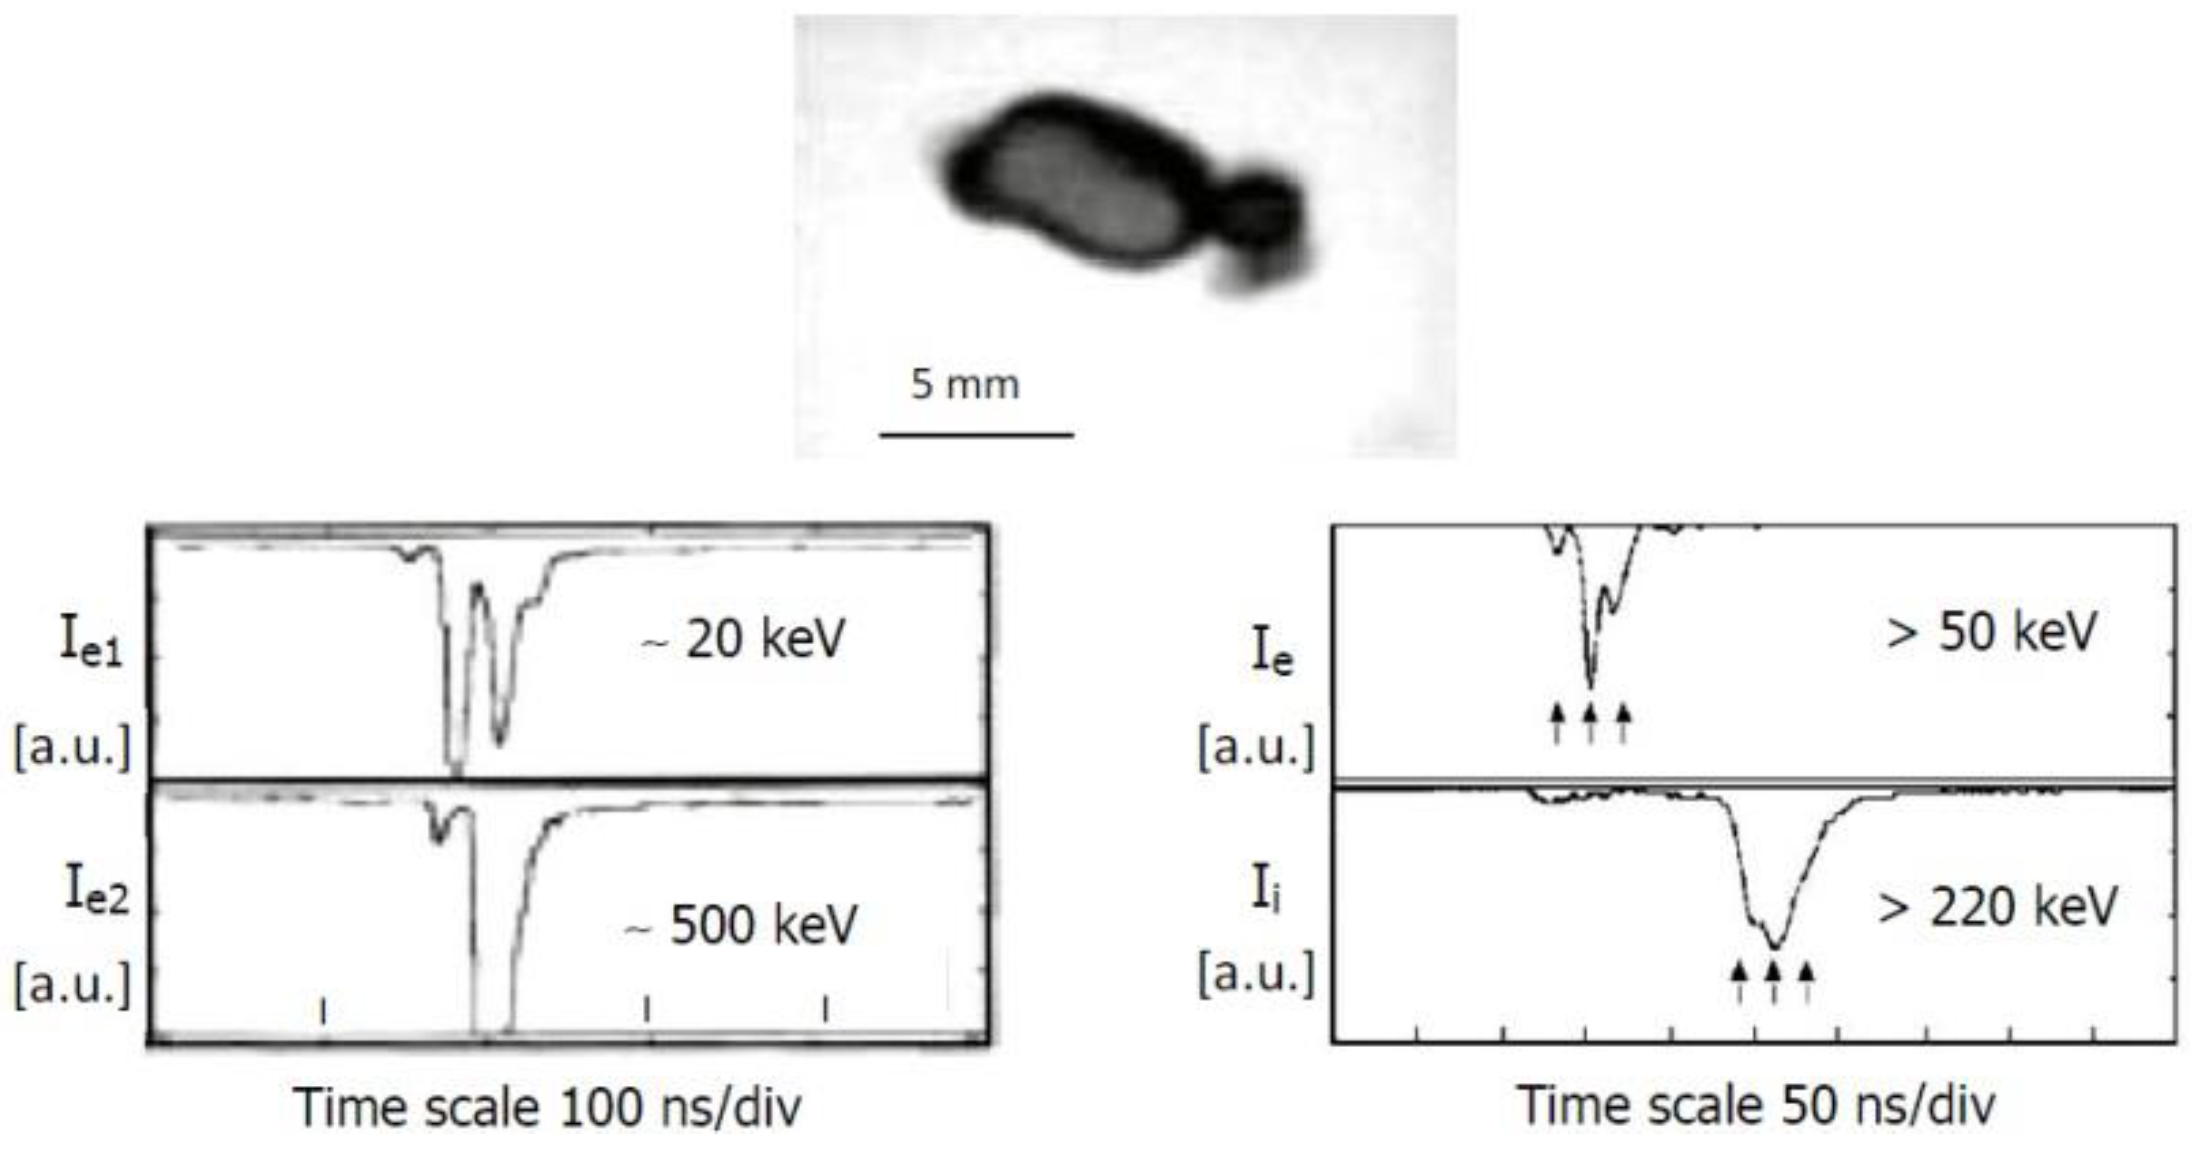
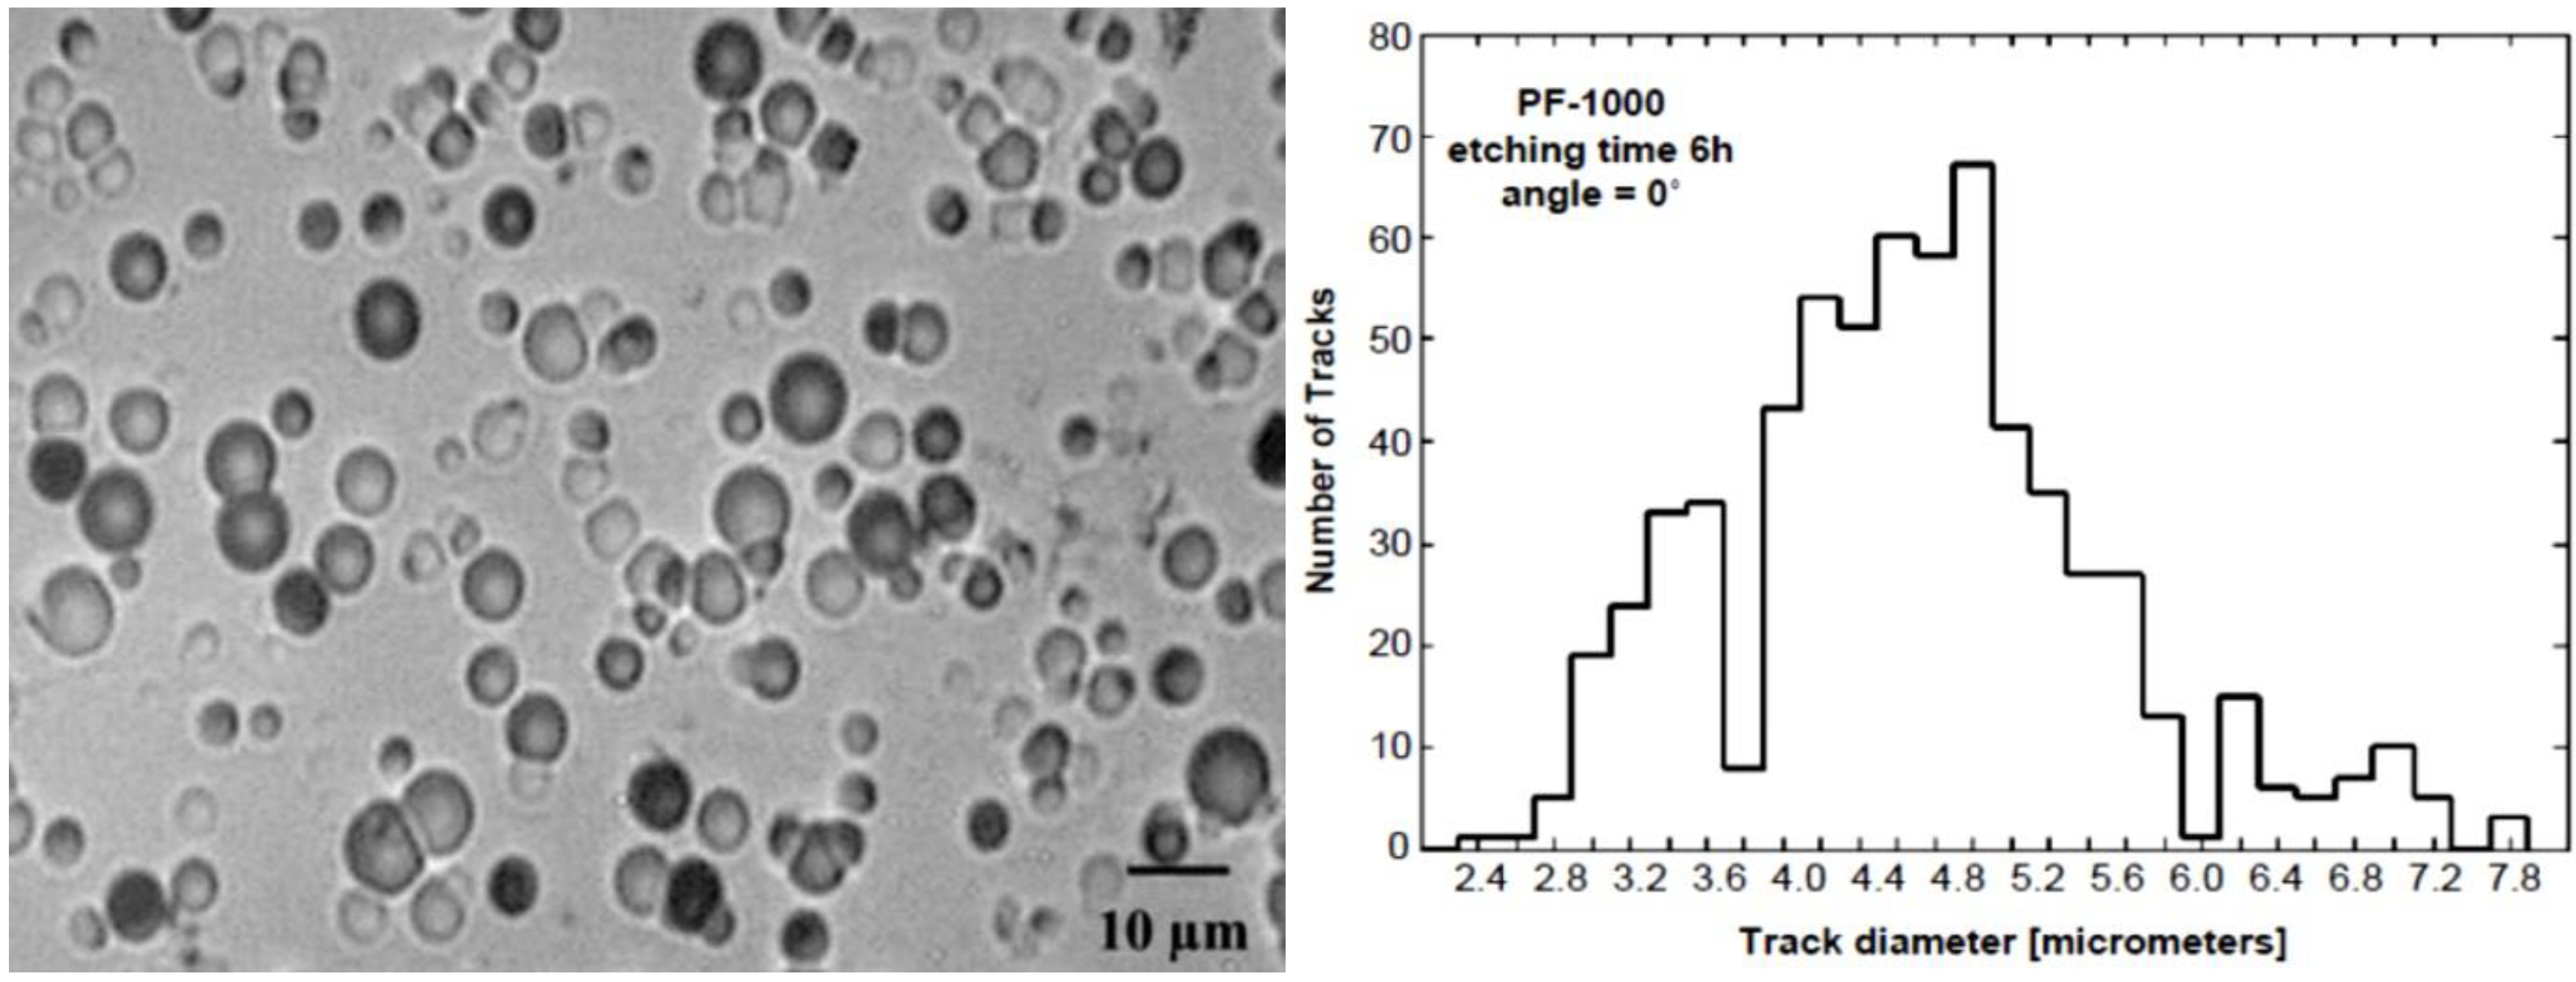
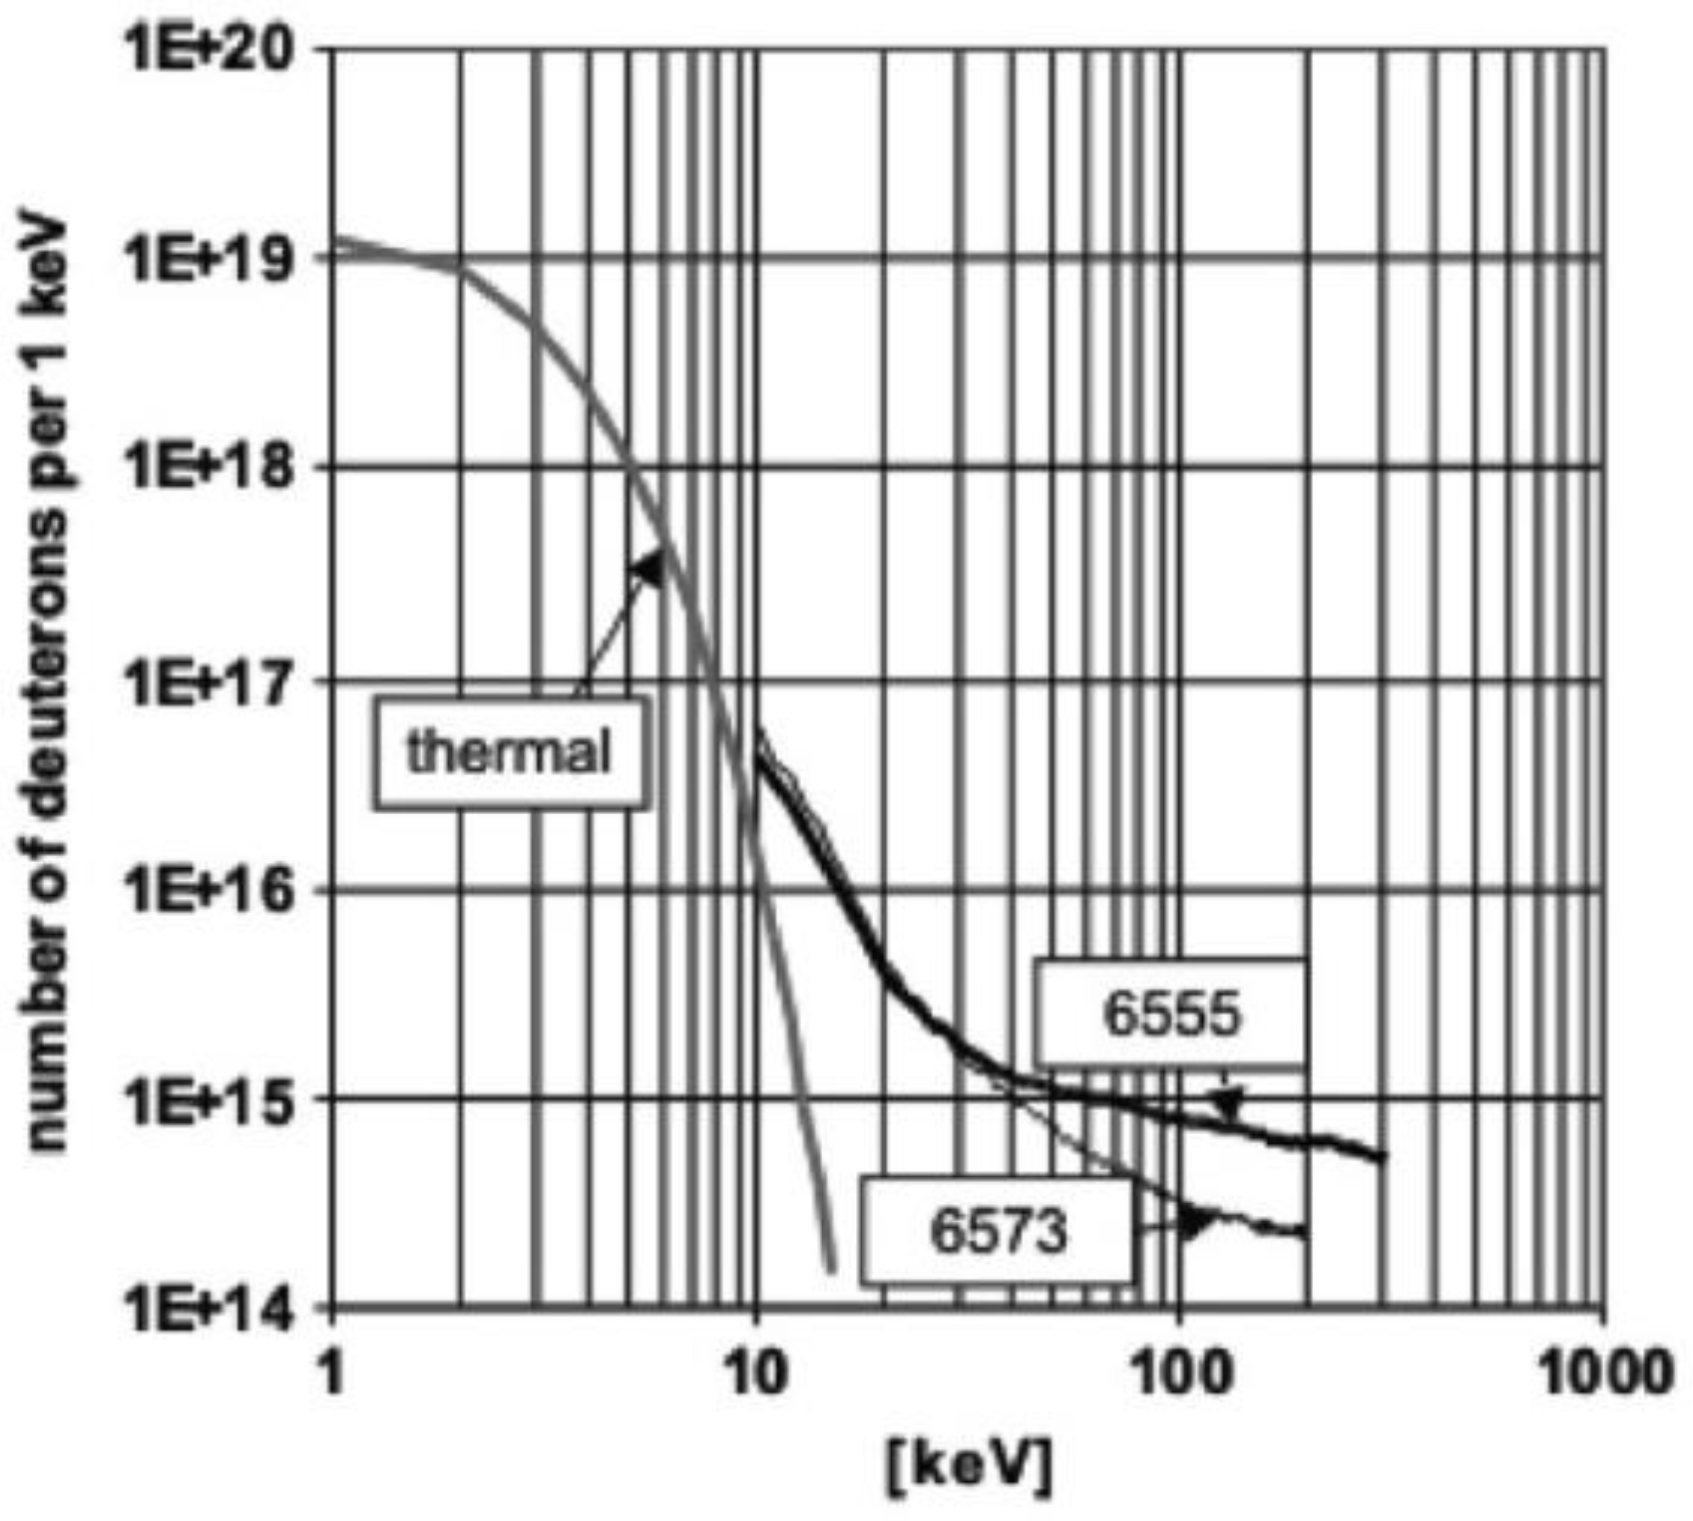
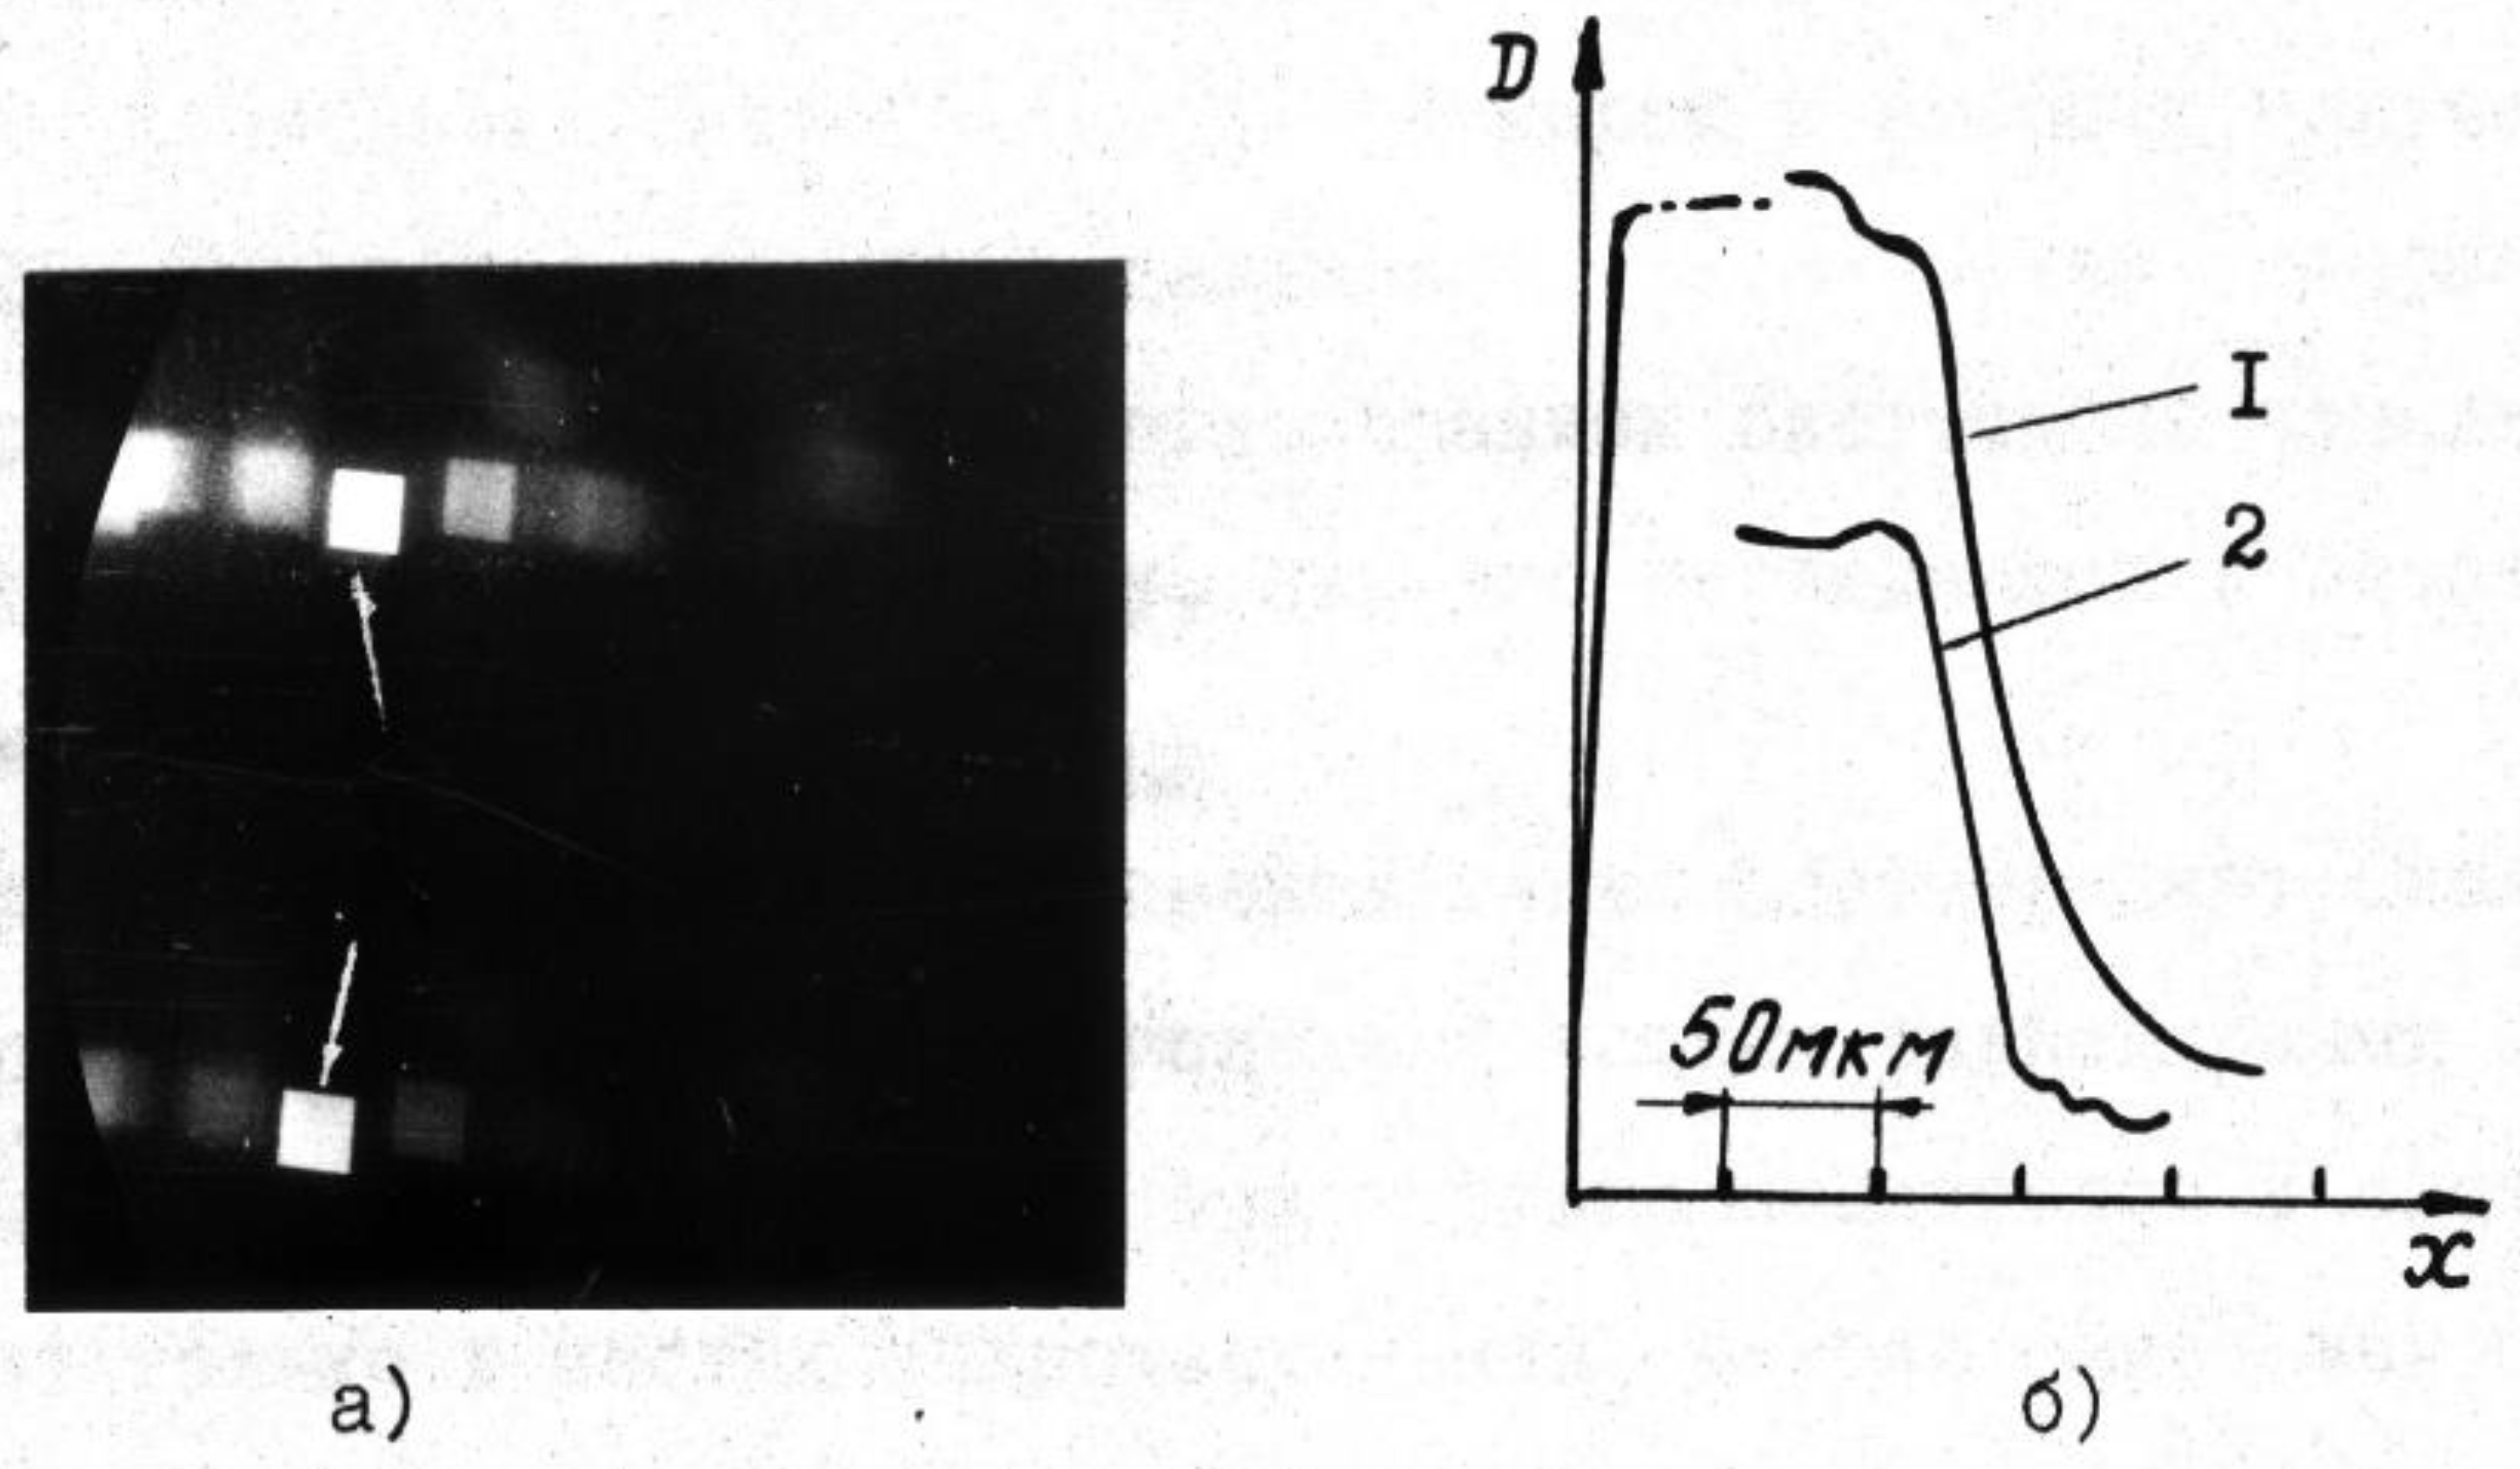
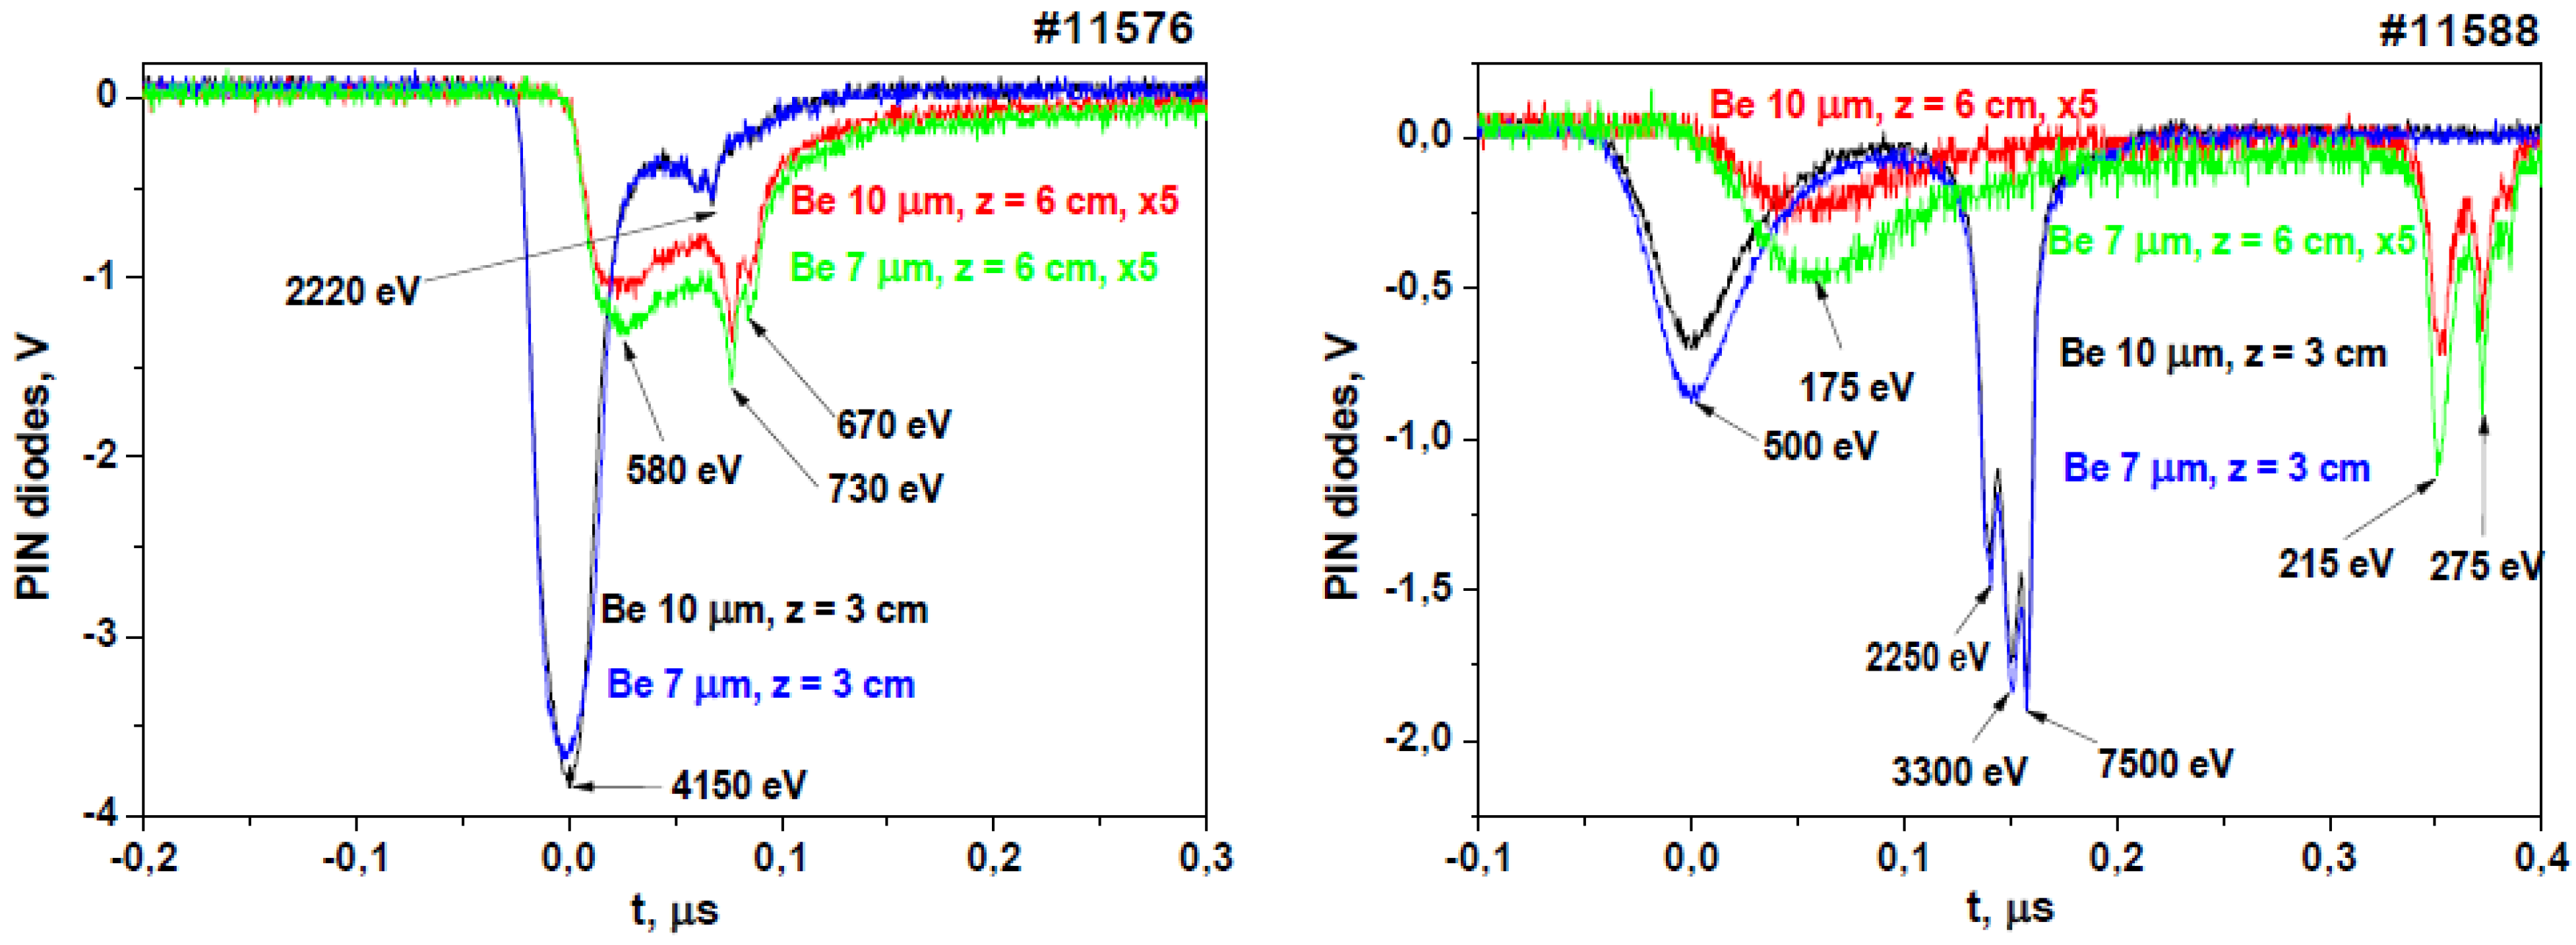
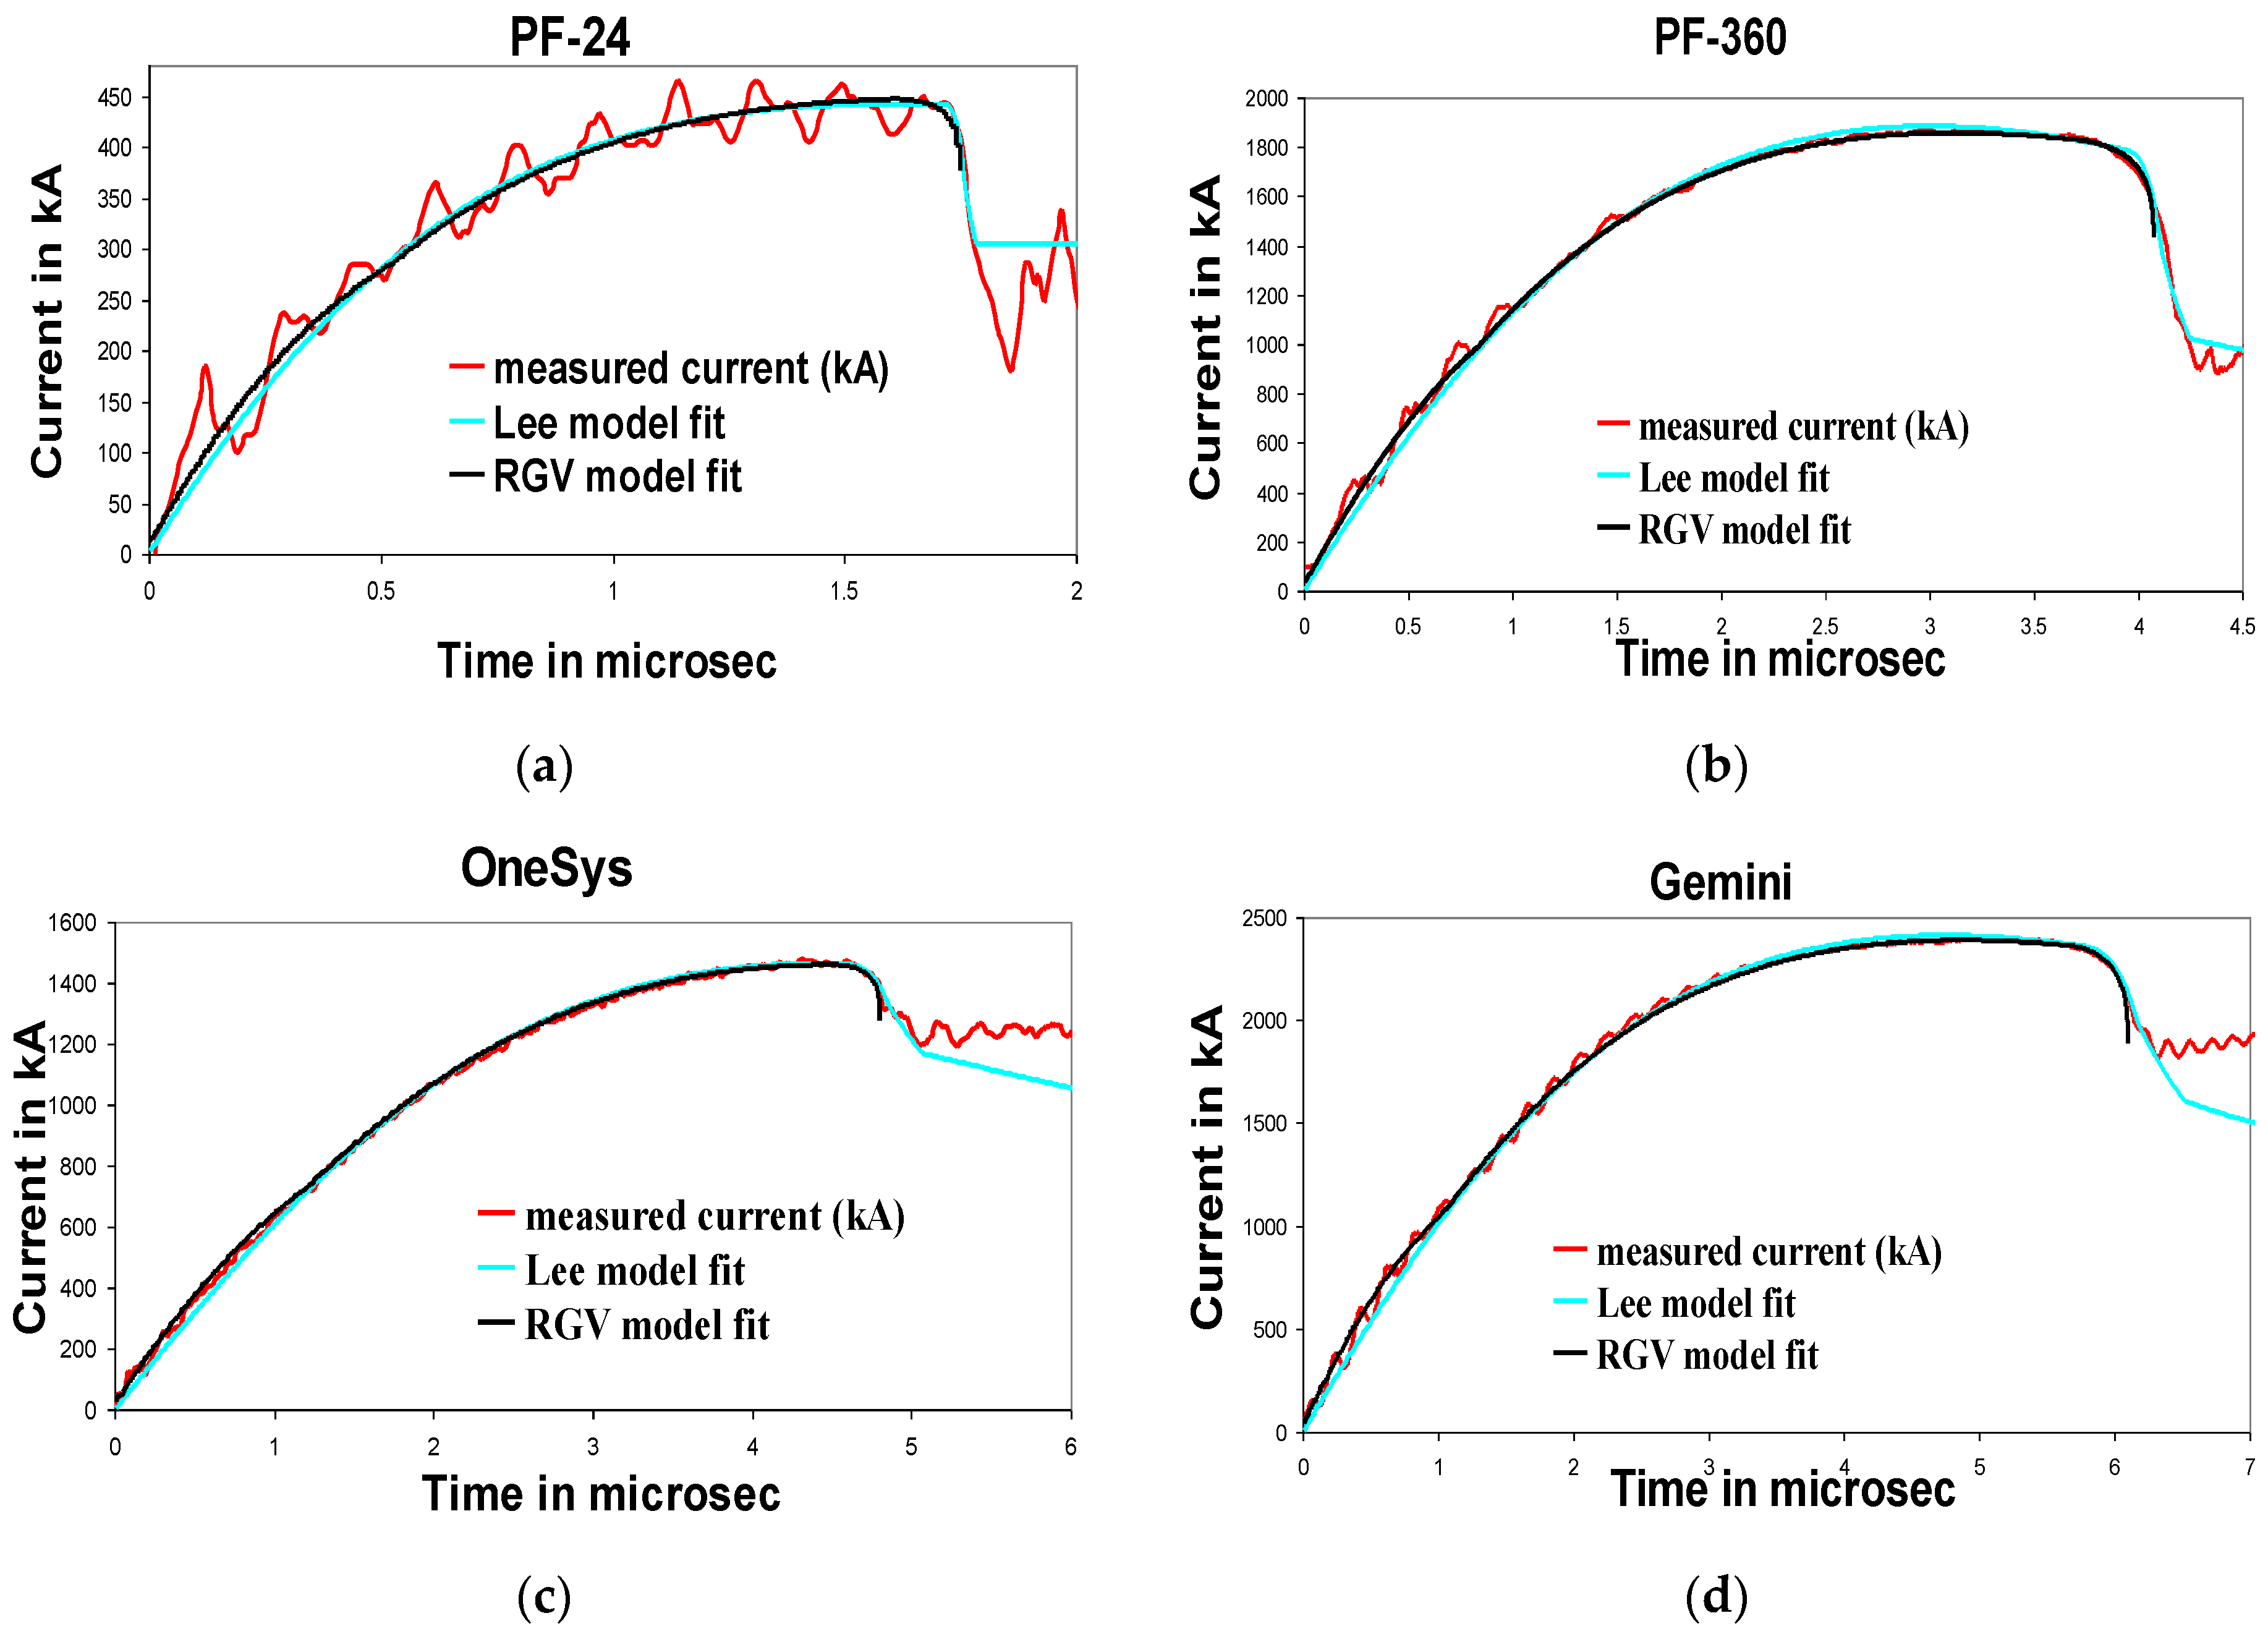
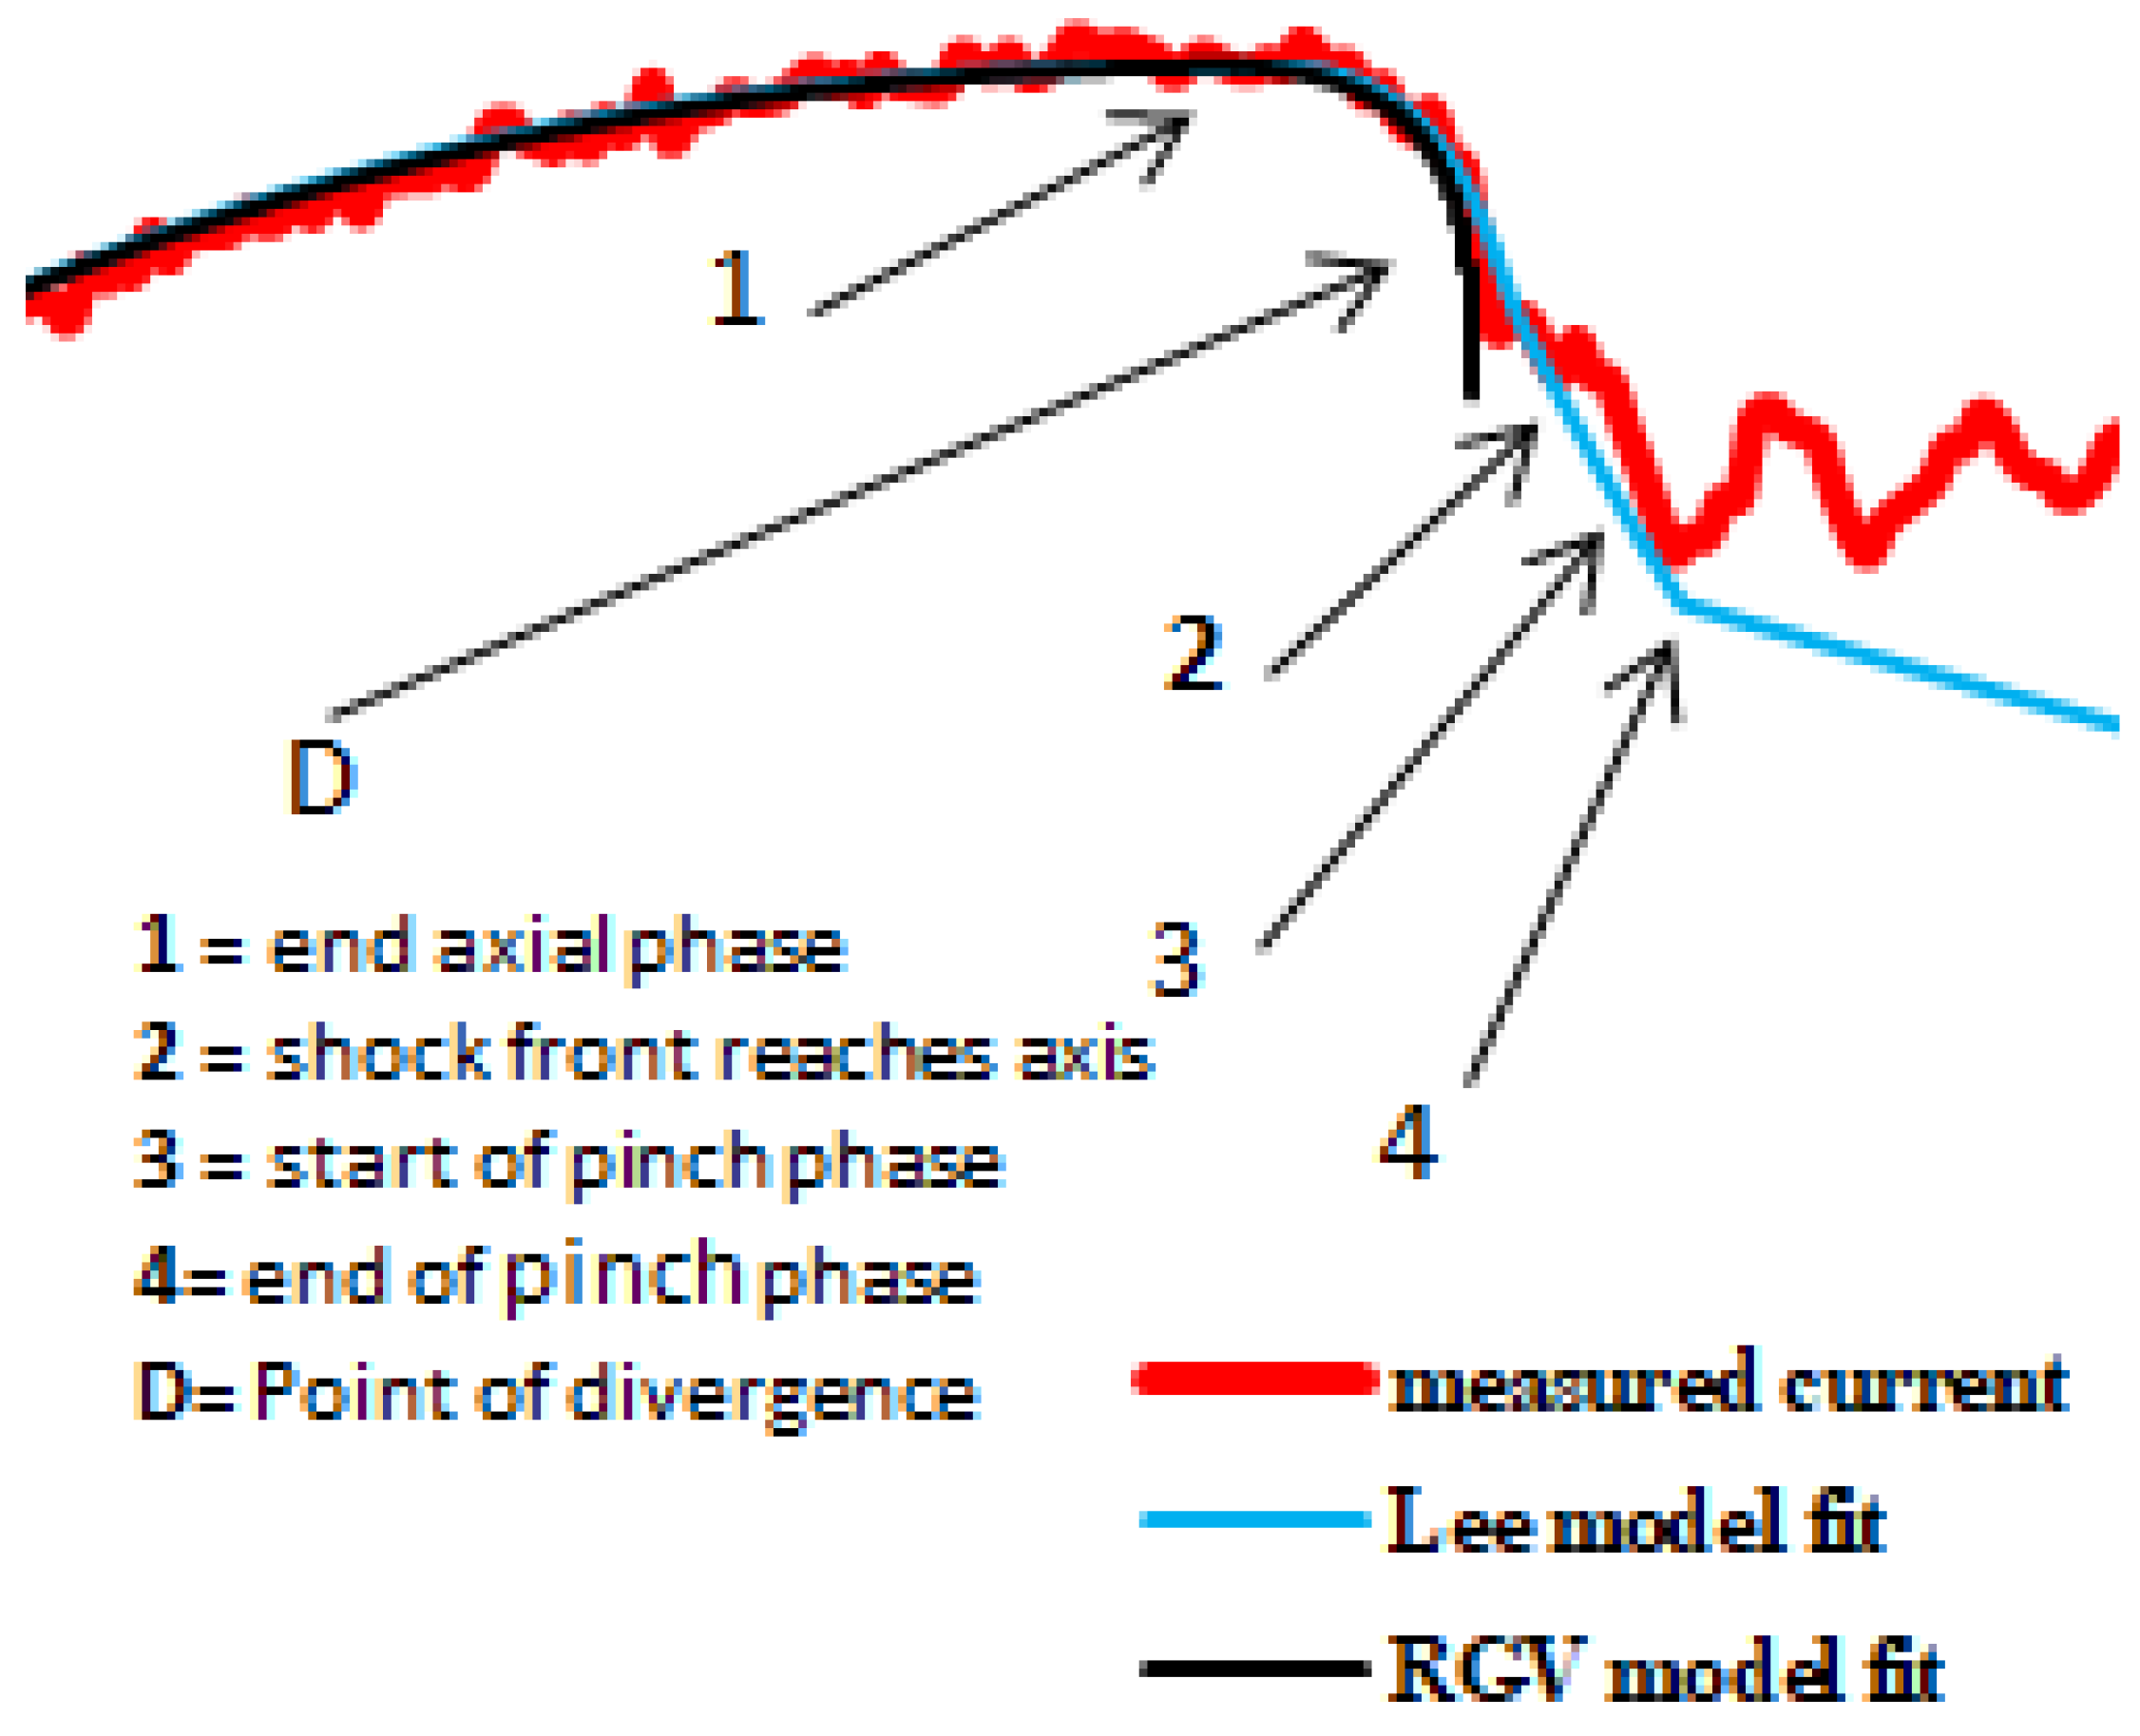
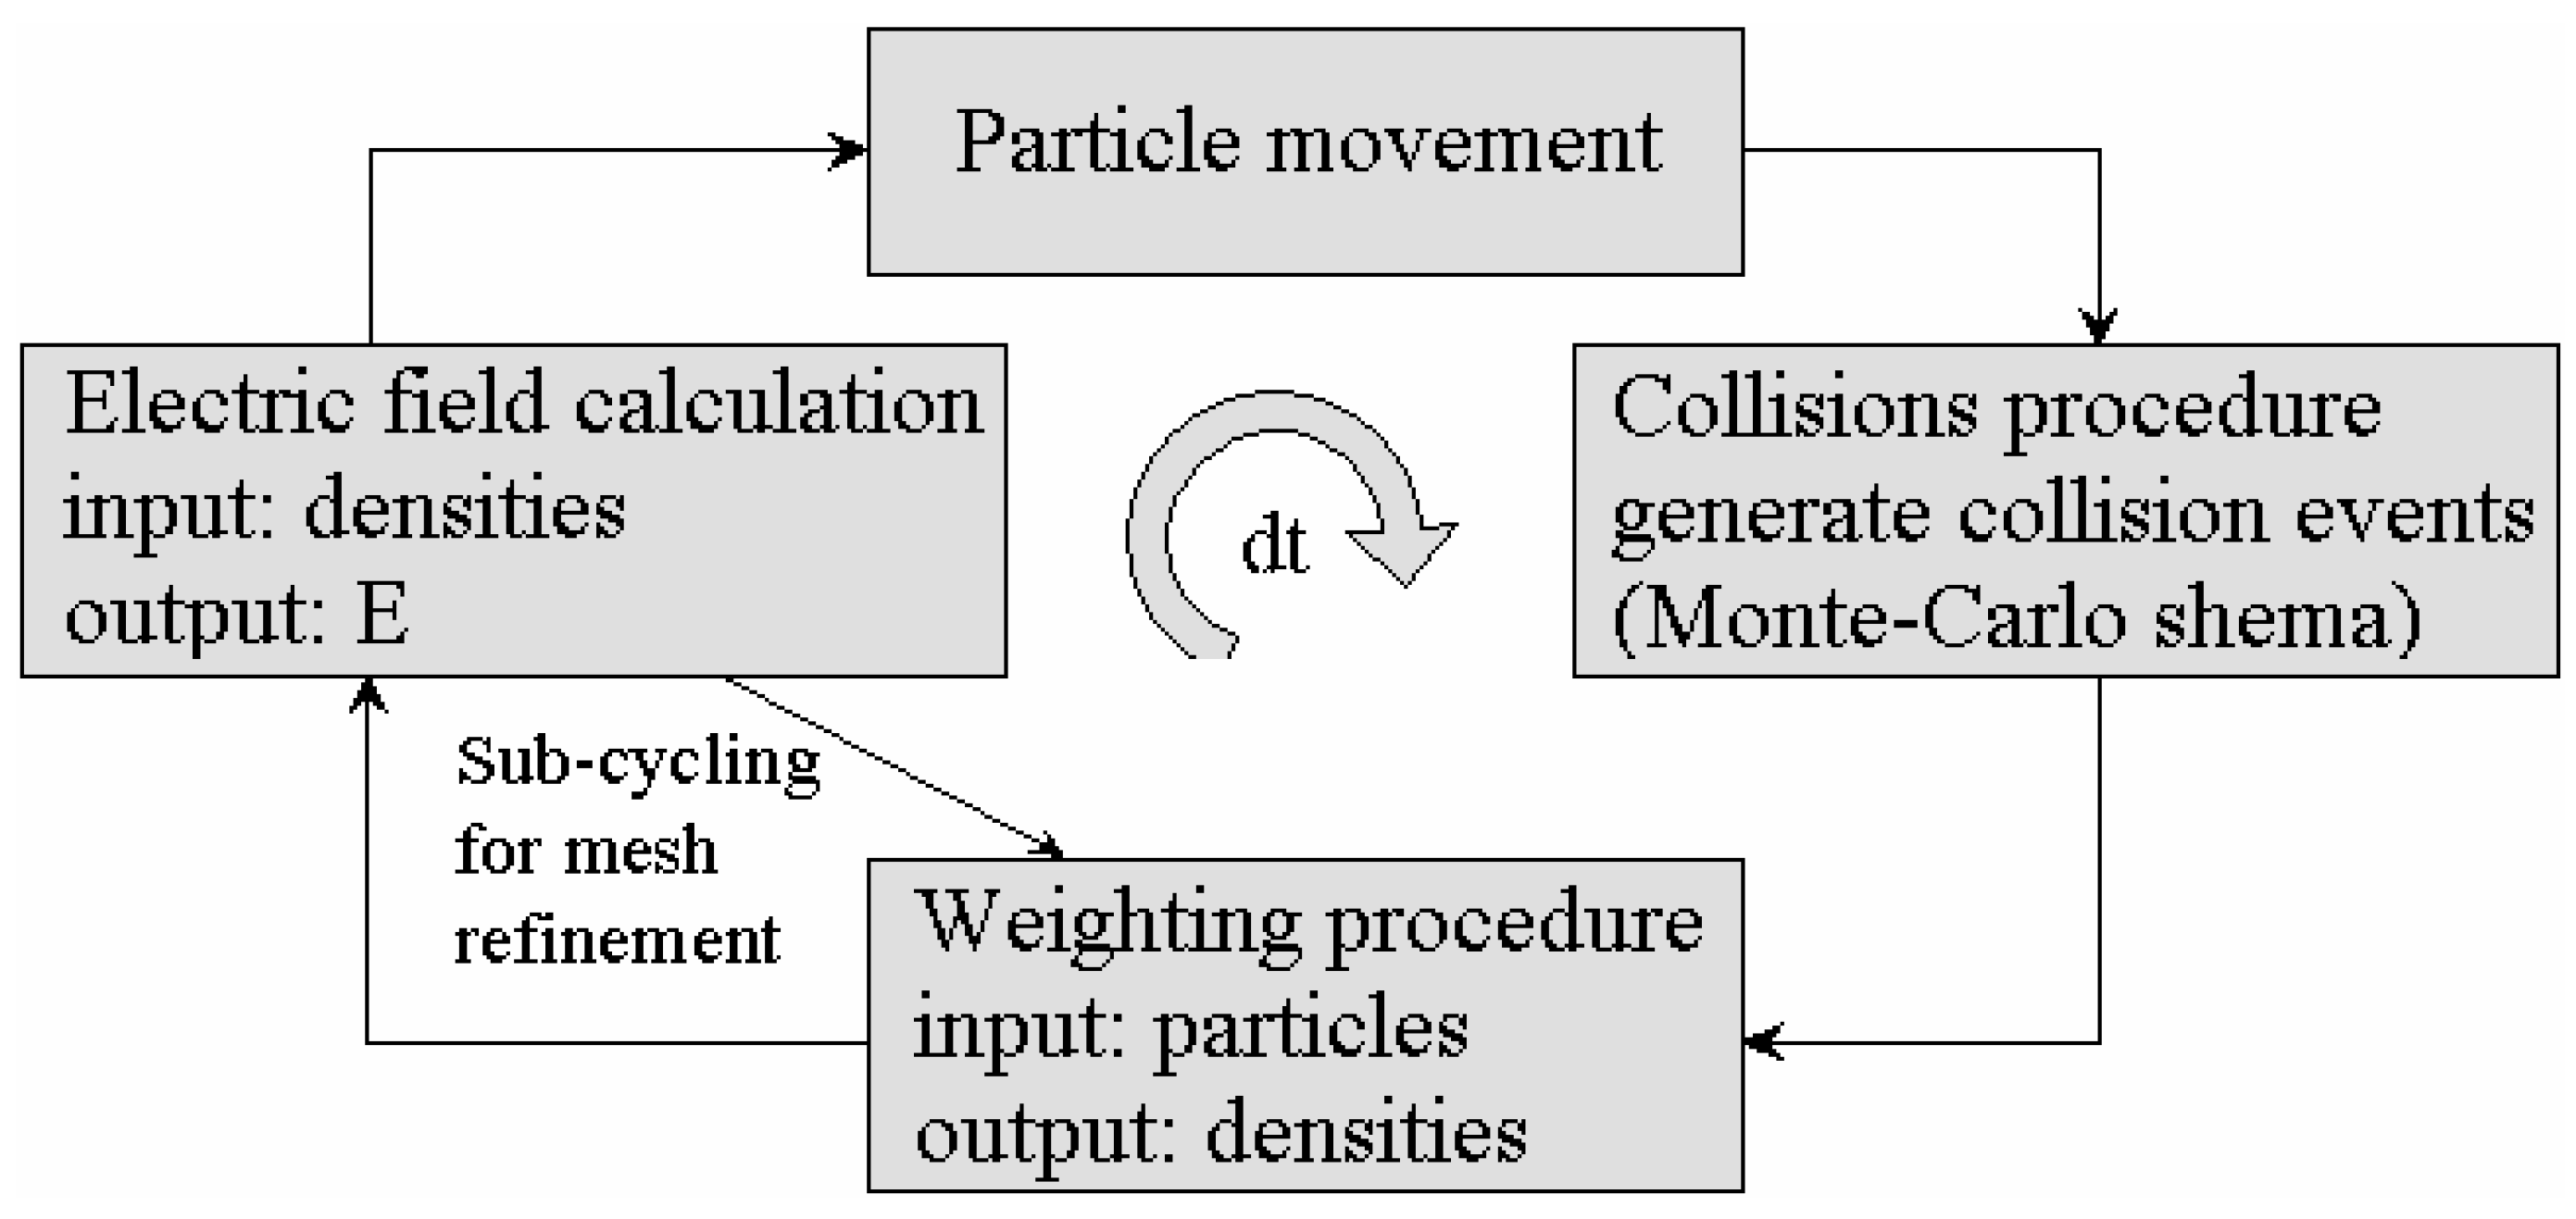
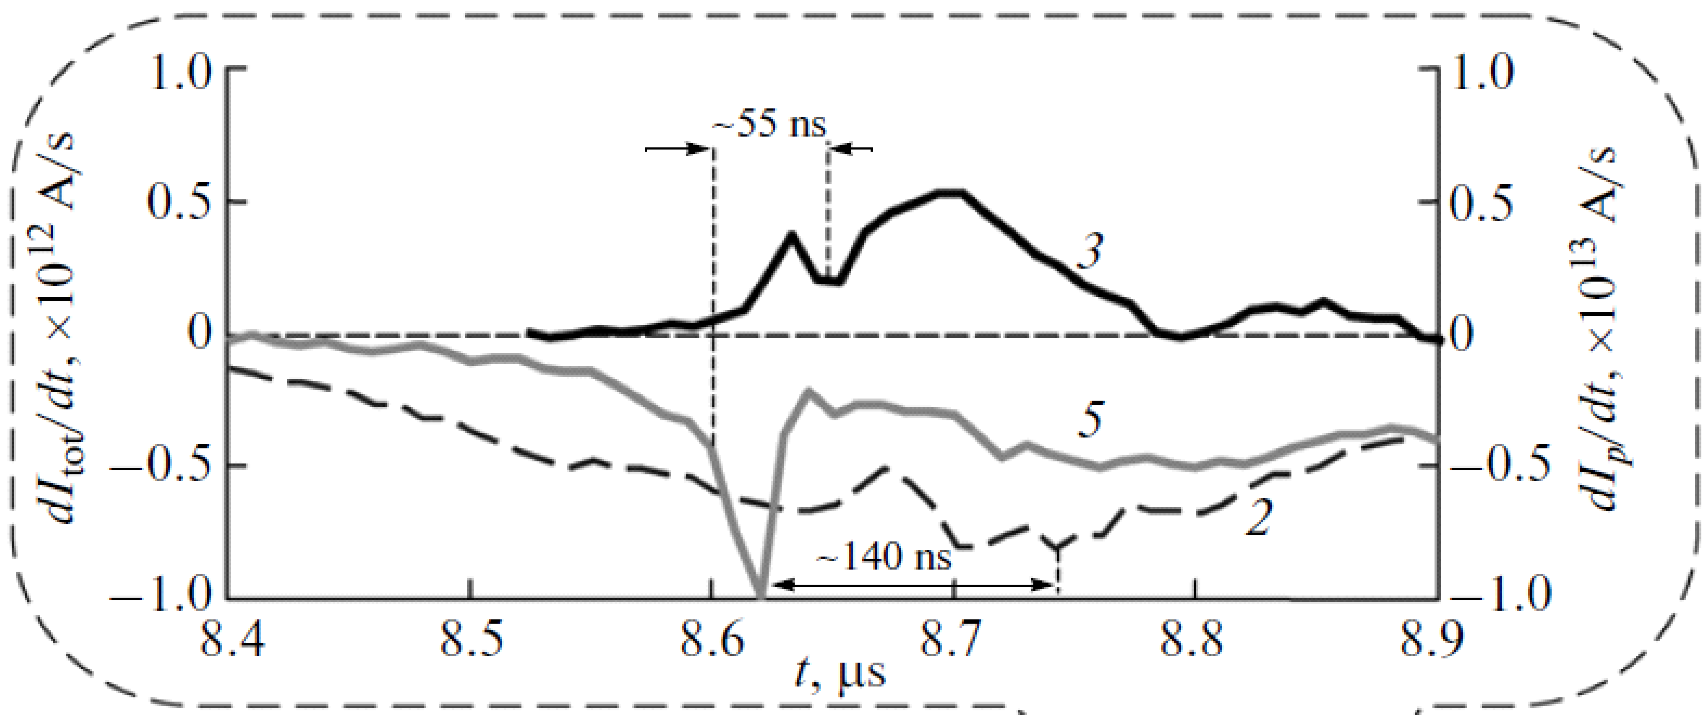
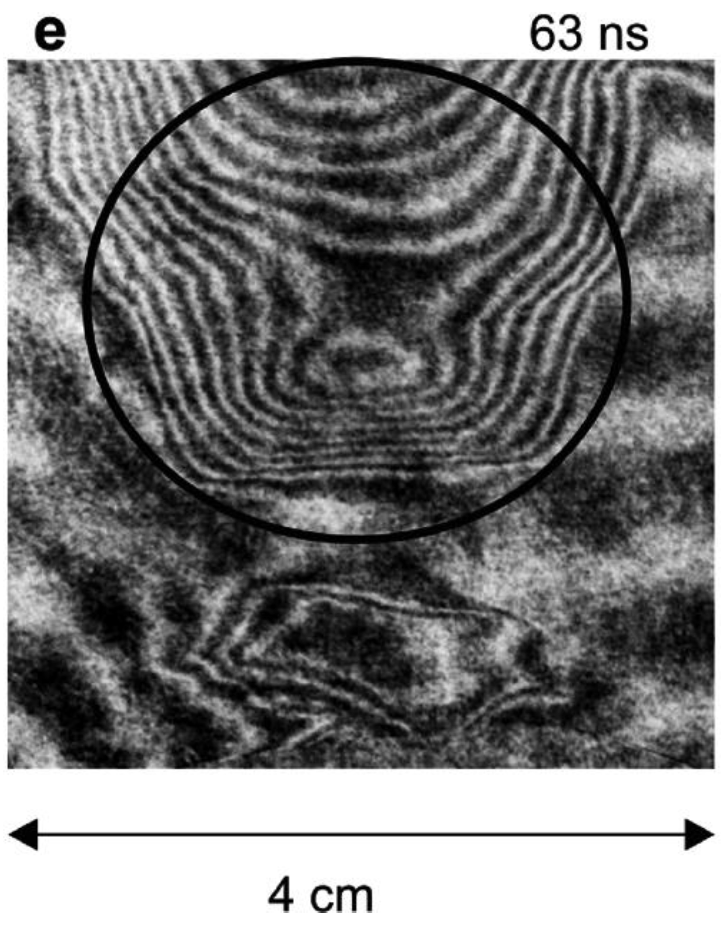
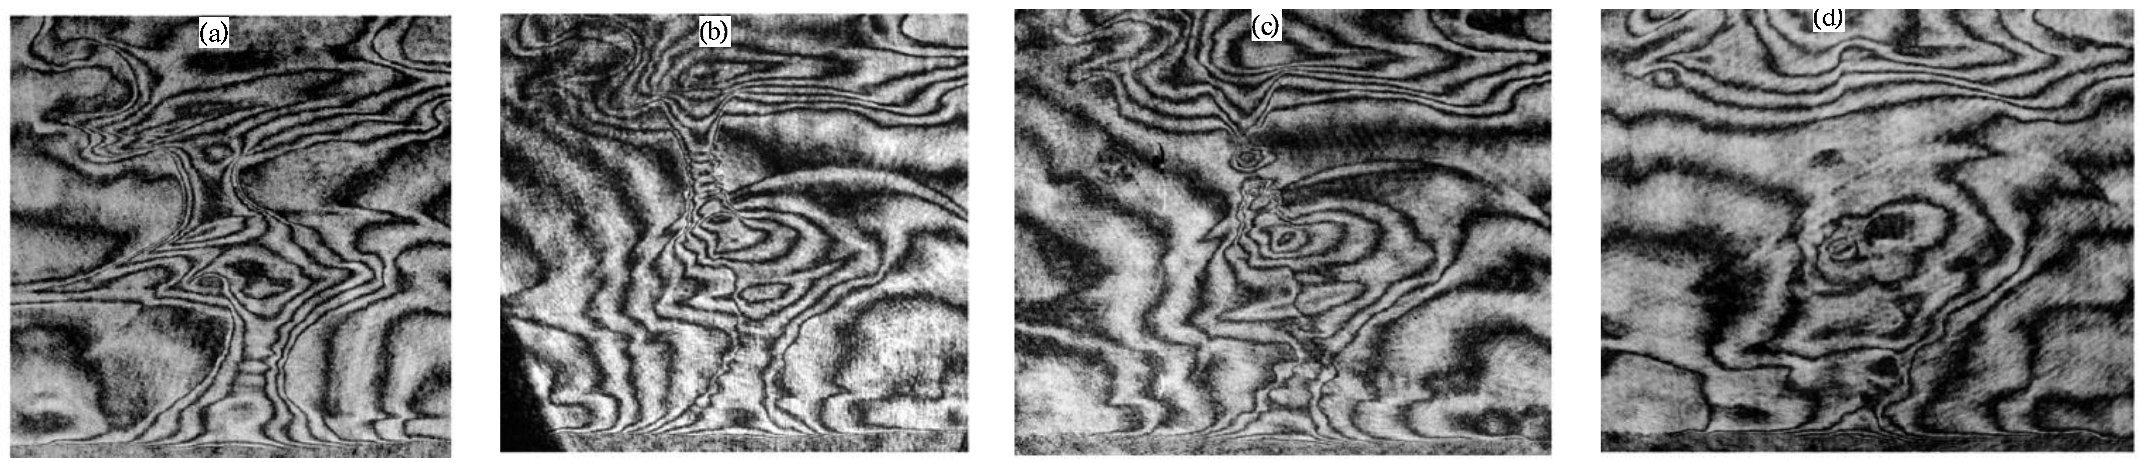
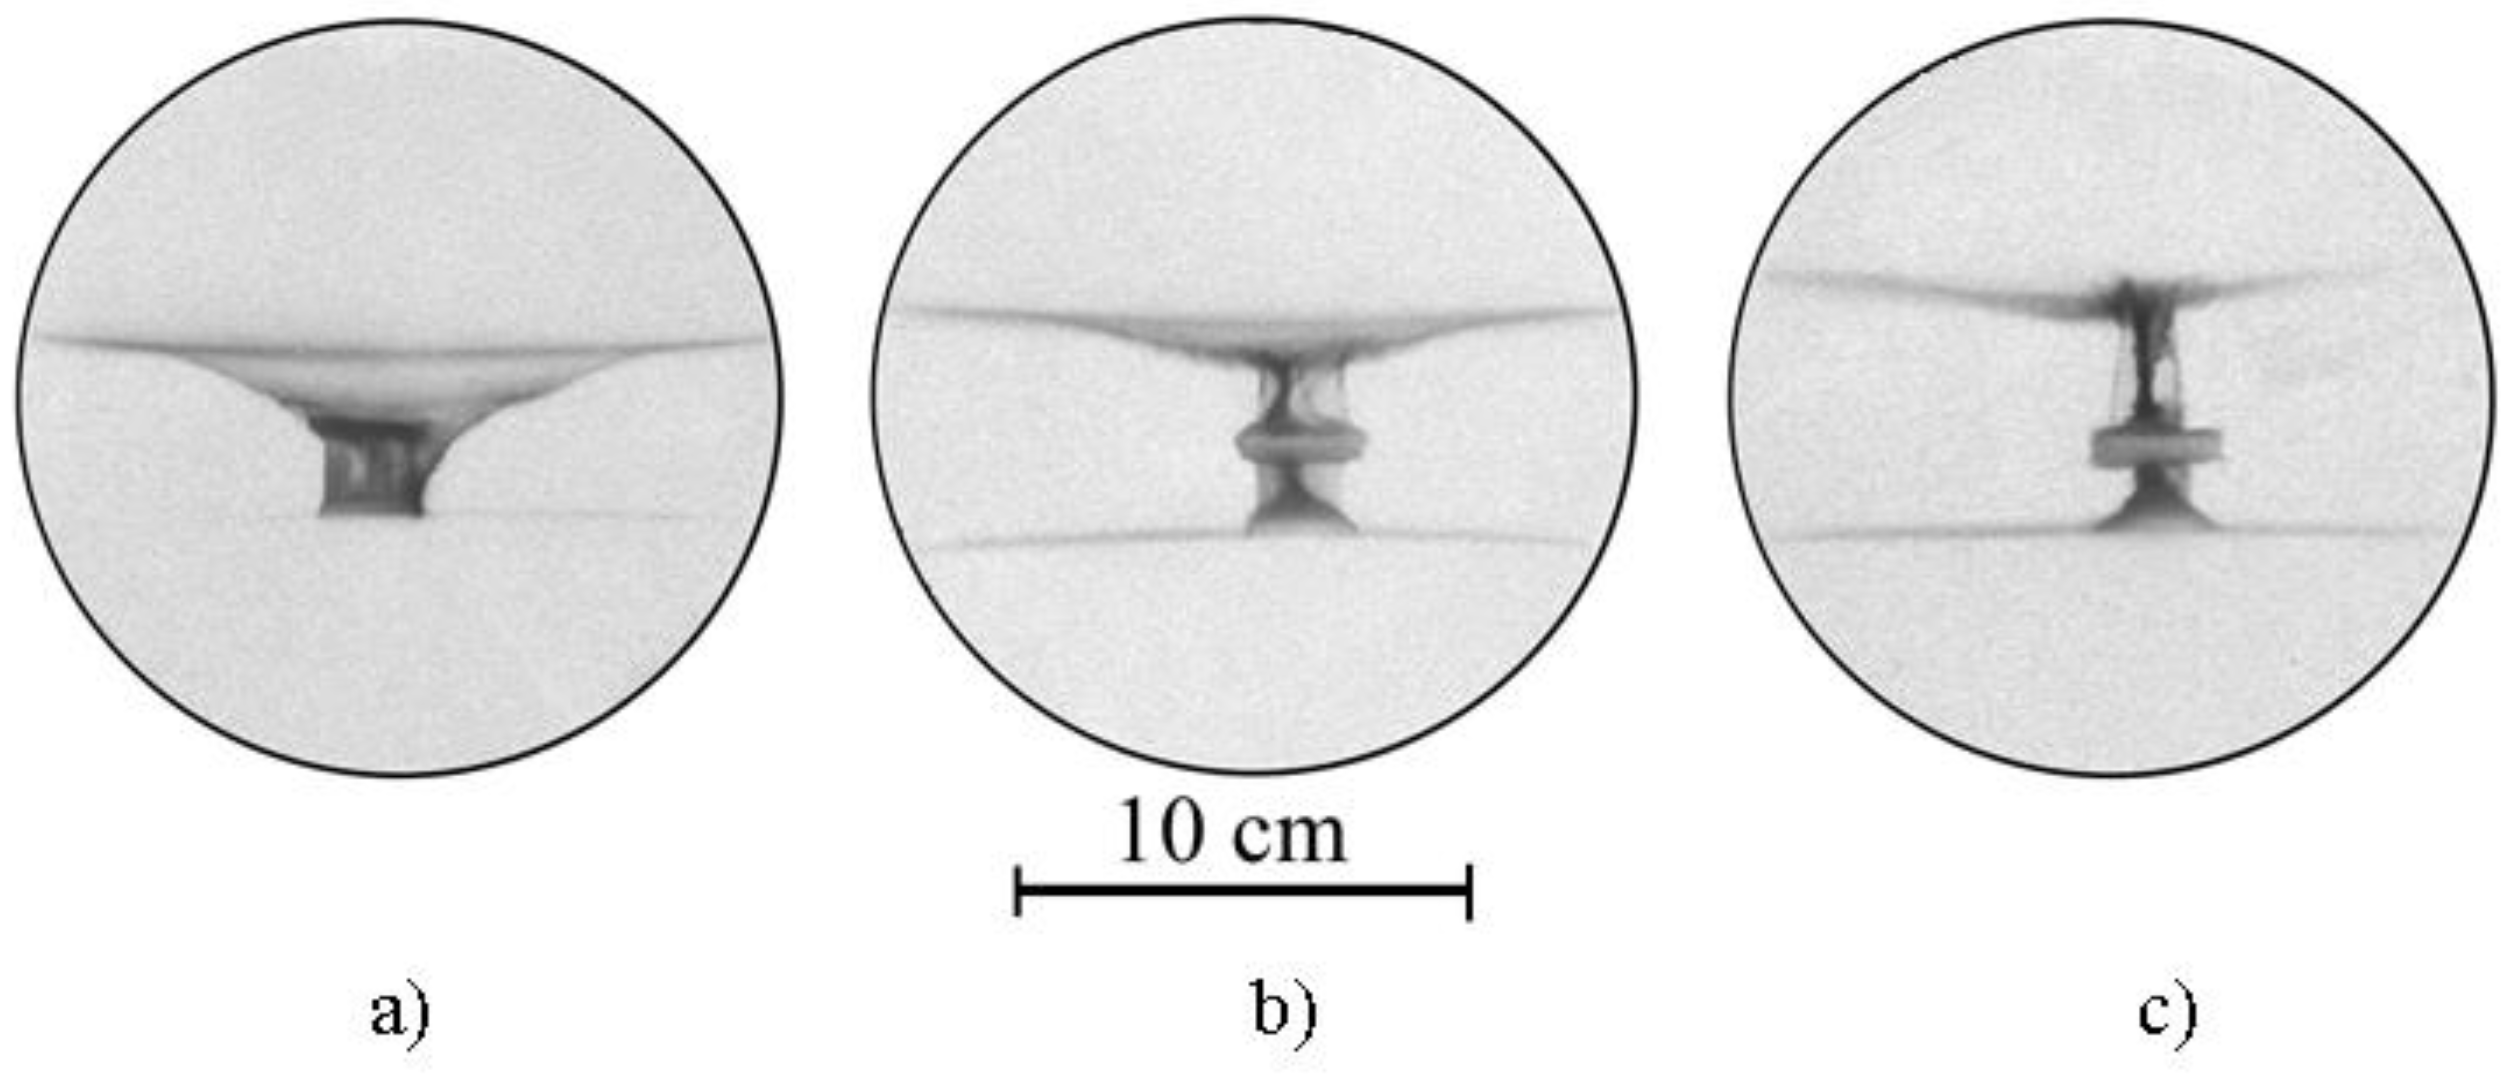
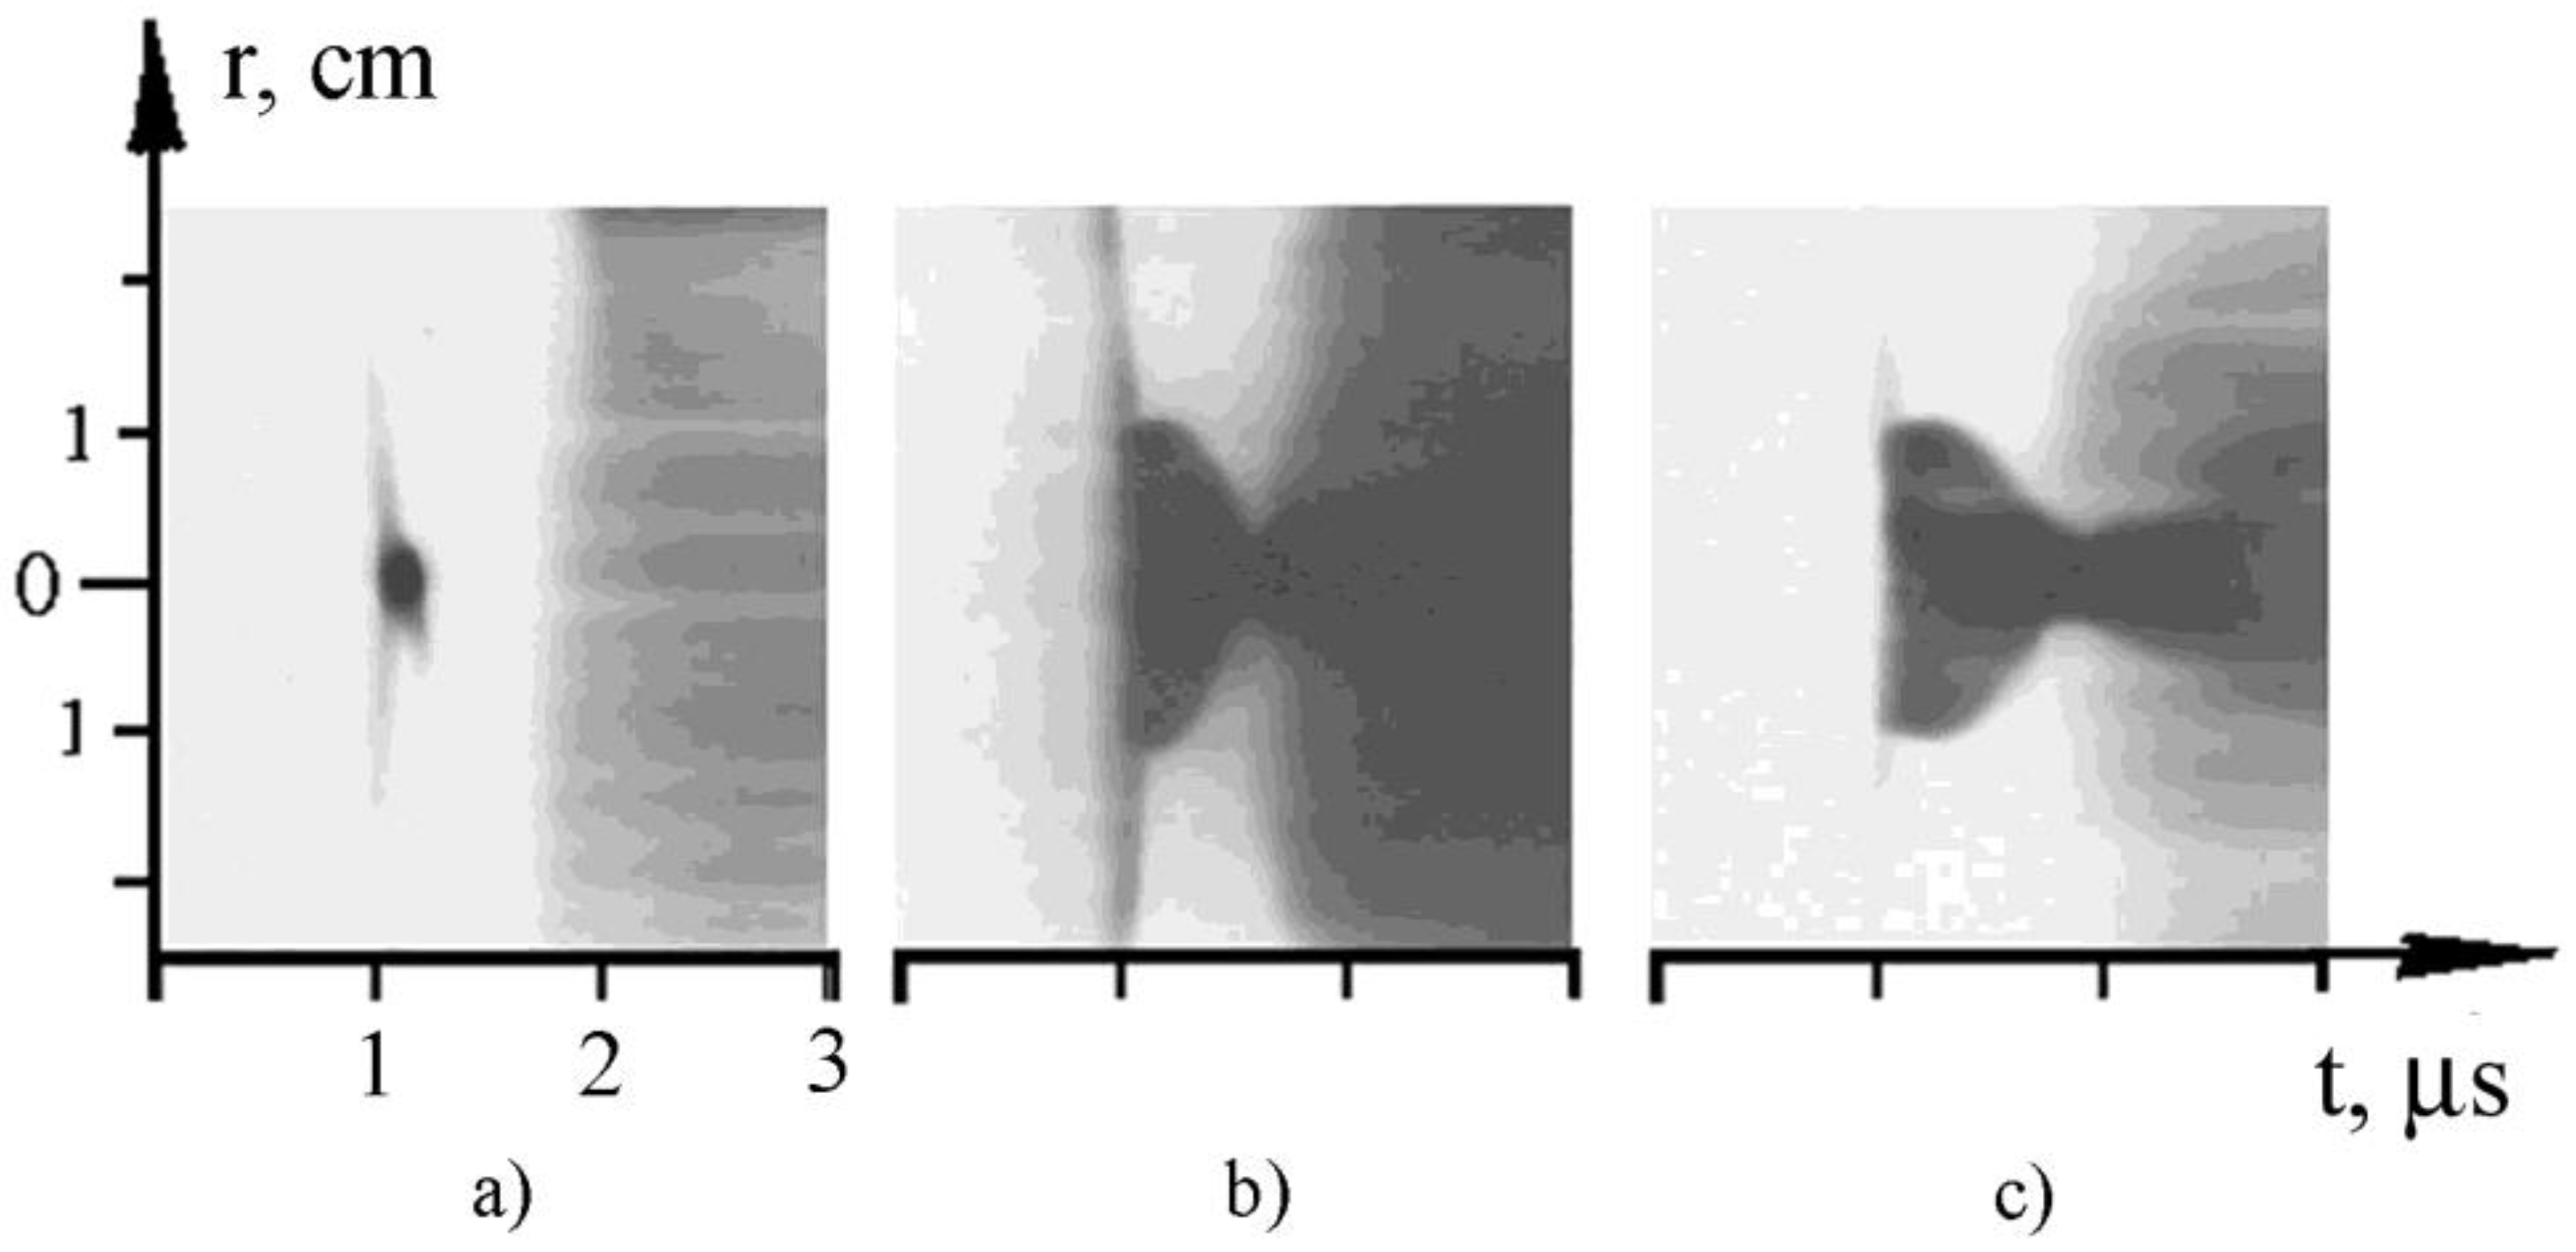
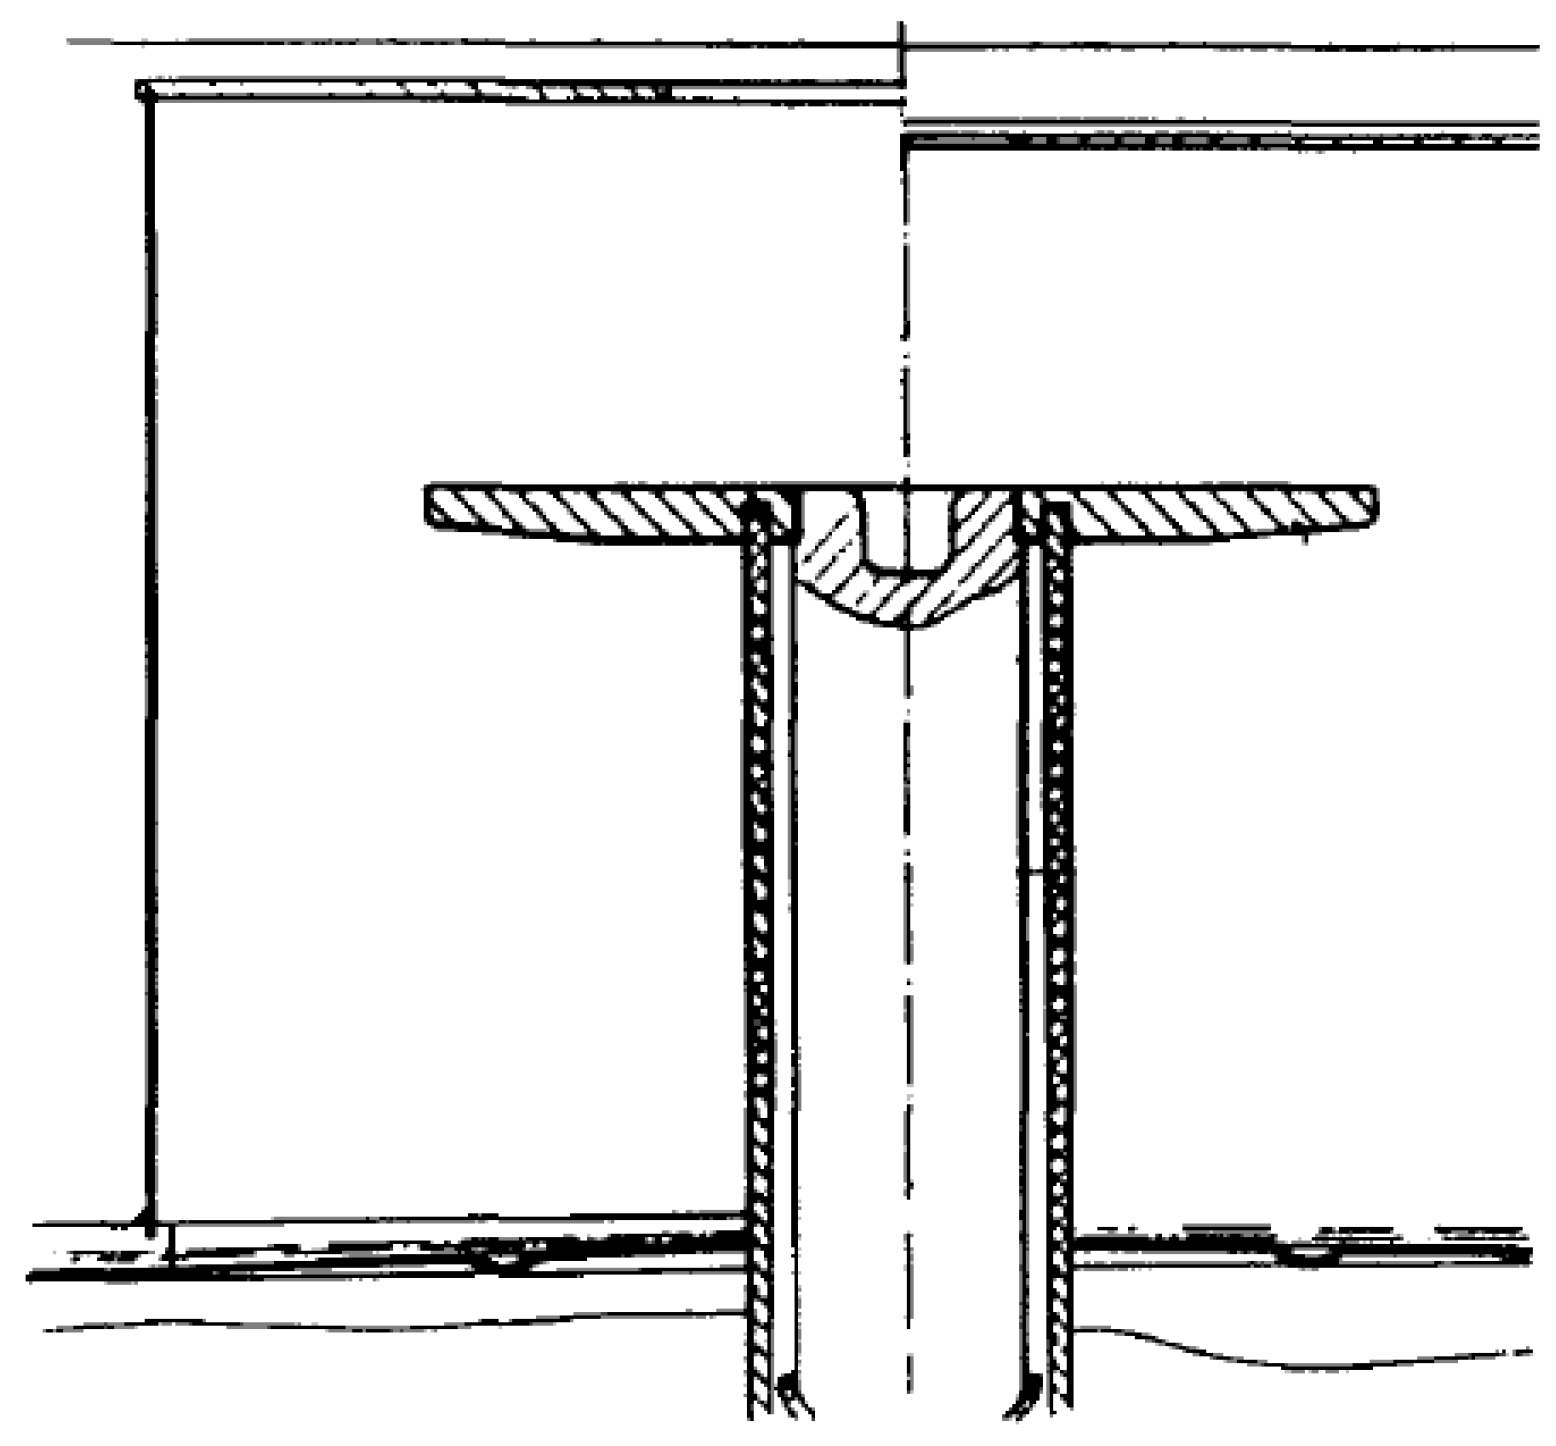
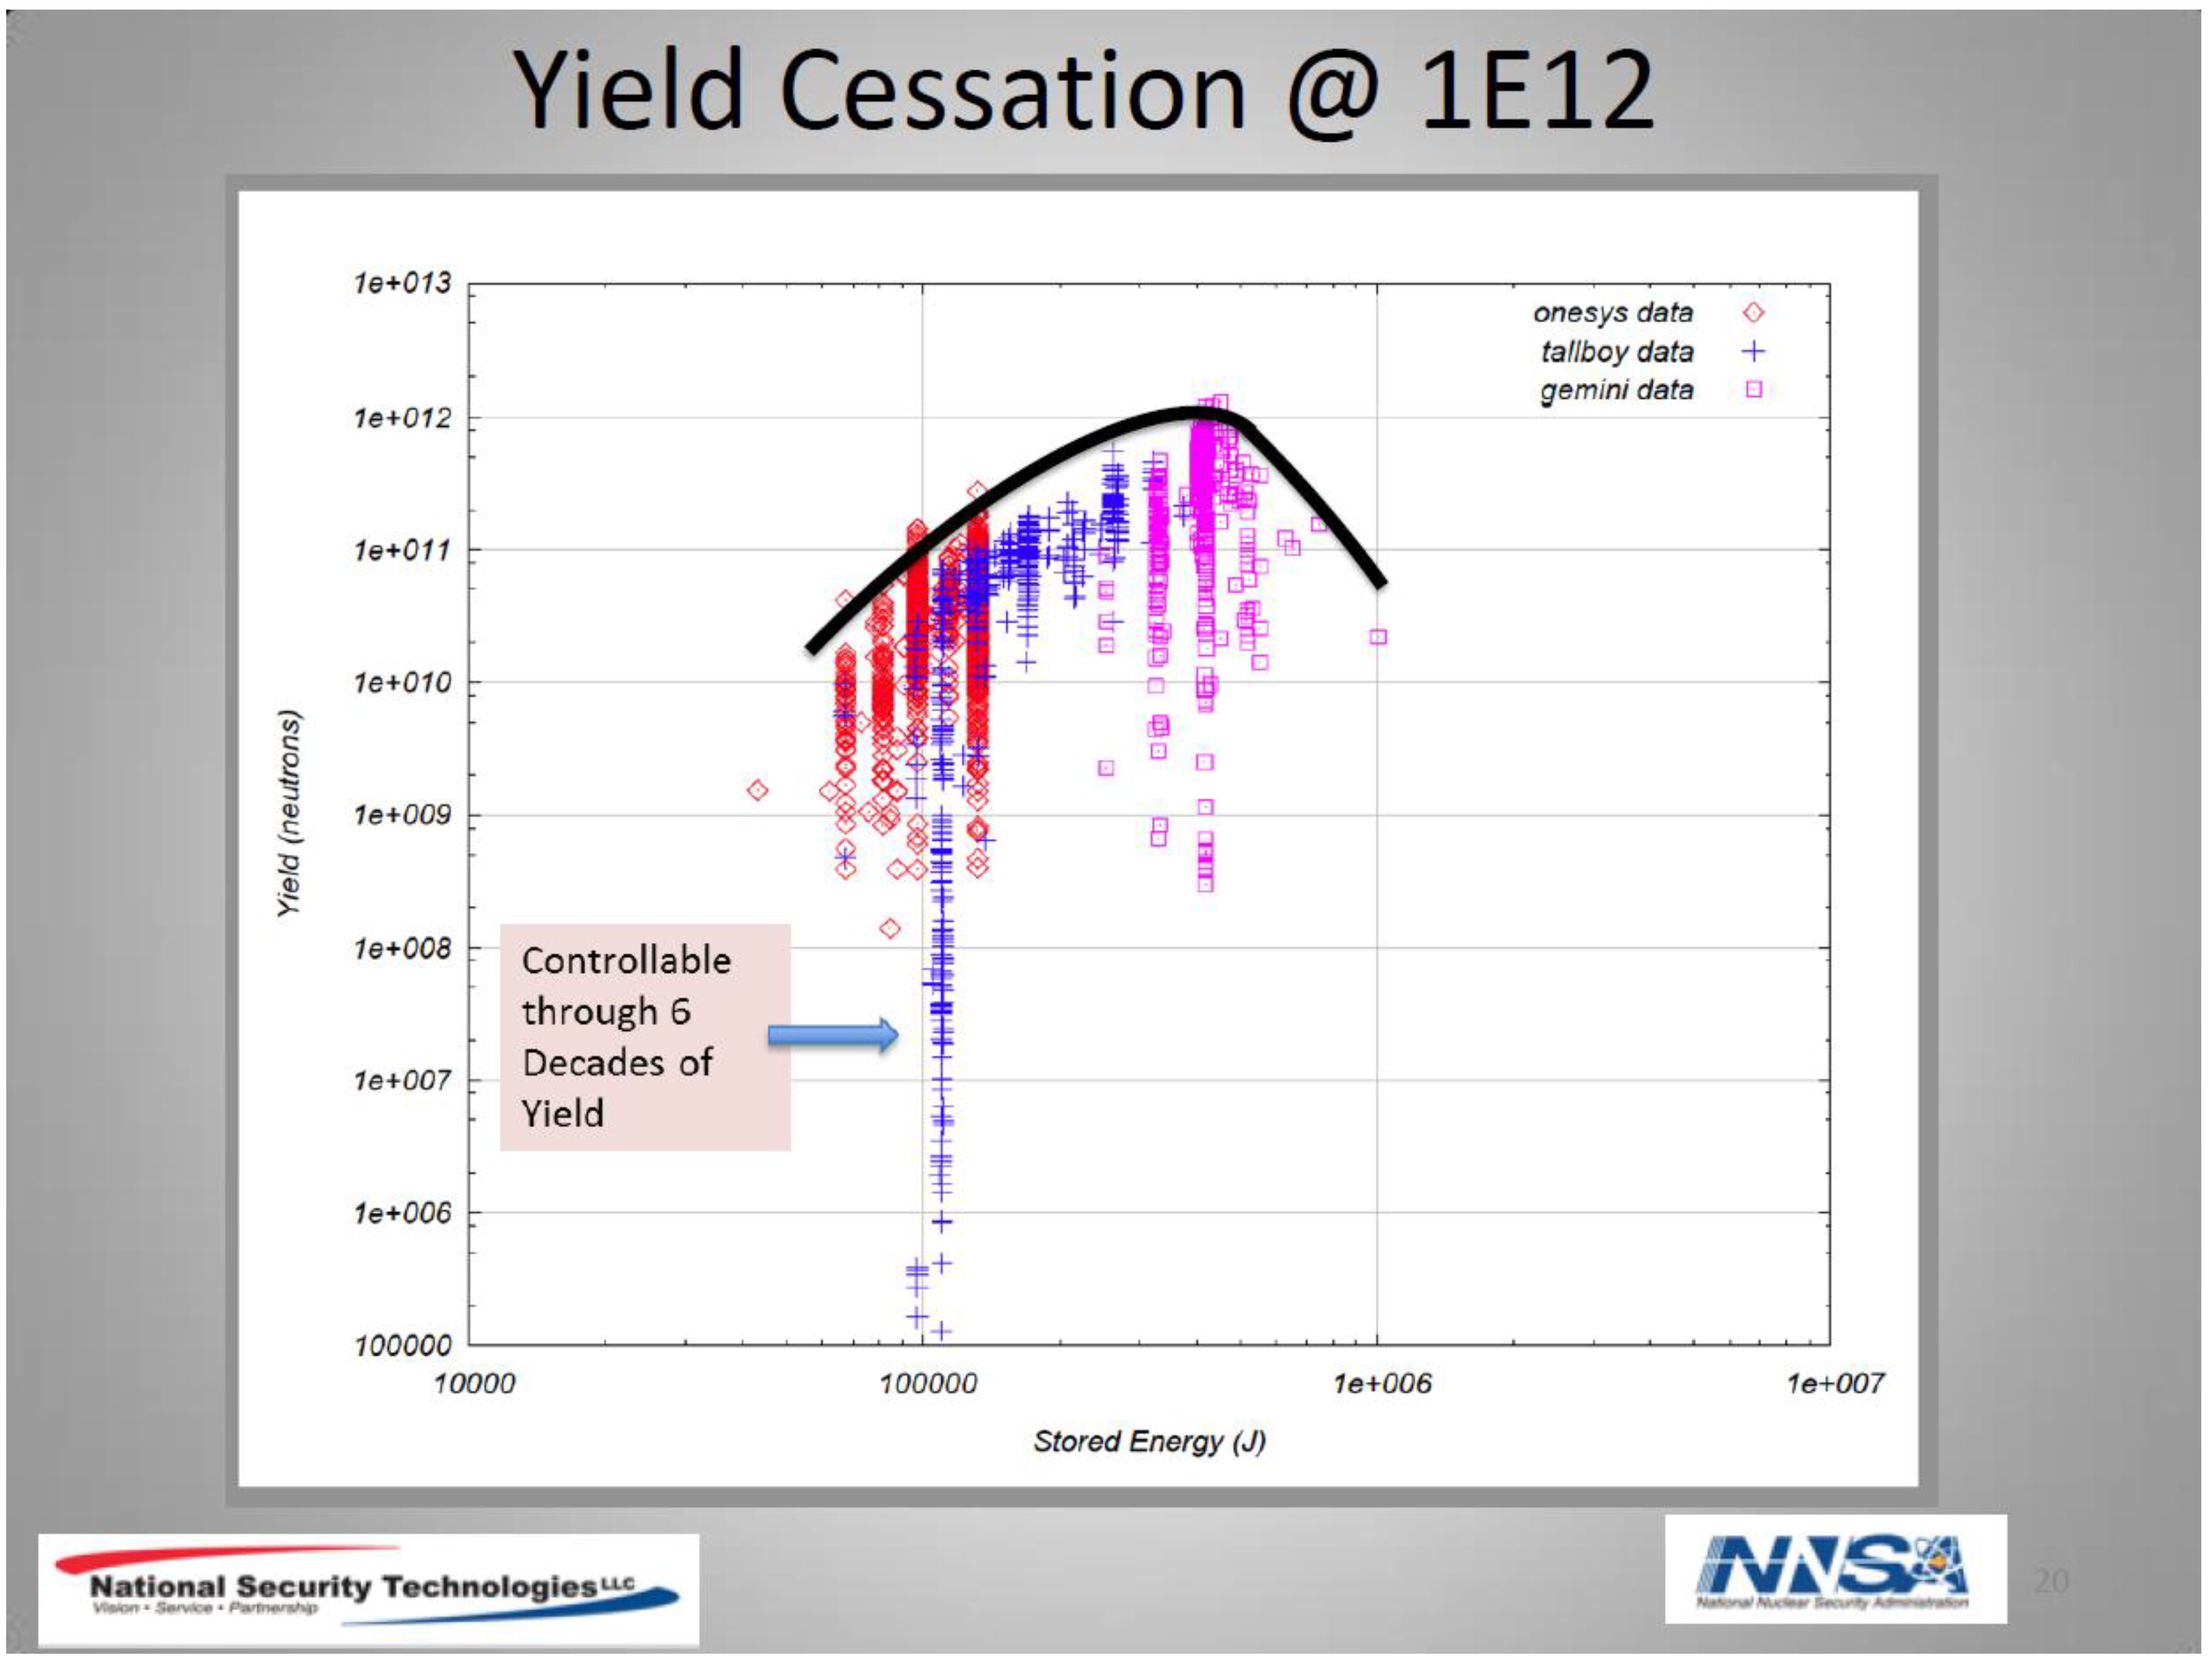
| OneSys | TallBoy | Gemini | |
|---|---|---|---|
| Type | Two stage Marx | Two Stage Marx | |
| Energy (kJ) | 133 | 515 | 1058 |
| Capacitance (μF) | 216 | 210 (effective) | 432 (effective) |
| Max Voltage (kV) | 35 | 70 (effective) | 70 (effective) |
| Anode radius | 2″ | 2″ | 3″ |
| Anode length | 15.5″ | 27.5″ | 23.5″ |
| Insulator length | 4.25″ | 10″ | 5″ |
| Cathode radius | 3″ | 3″ | 4″ |
| Fill pressure (D2) torr | 5.23 | 6.46 | 5.21 |
| Elastic electron collision | |
| Elastic ion collision | |
| Ionization | |
| Rotational excitation | |
| Vibration excitation | |
| Electronic excitation | |
| Dissociation | |
| Rydberg Excitations levels |
Publisher’s Note: MDPI stays neutral with regard to jurisdictional claims in published maps and institutional affiliations. |
© 2021 by the authors. Licensee MDPI, Basel, Switzerland. This article is an open access article distributed under the terms and conditions of the Creative Commons Attribution (CC BY) license (https://creativecommons.org/licenses/by/4.0/).
Share and Cite
Auluck, S.; Kubes, P.; Paduch, M.; Sadowski, M.J.; Krauz, V.I.; Lee, S.; Soto, L.; Scholz, M.; Miklaszewski, R.; Schmidt, H.; et al. Update on the Scientific Status of the Plasma Focus. Plasma 2021, 4, 450-669. https://doi.org/10.3390/plasma4030033
Auluck S, Kubes P, Paduch M, Sadowski MJ, Krauz VI, Lee S, Soto L, Scholz M, Miklaszewski R, Schmidt H, et al. Update on the Scientific Status of the Plasma Focus. Plasma. 2021; 4(3):450-669. https://doi.org/10.3390/plasma4030033
Chicago/Turabian StyleAuluck, Sunil, Pavel Kubes, Marian Paduch, Marek J. Sadowski, Vyacheslav I. Krauz, Sing Lee, Leopoldo Soto, Marek Scholz, Ryszard Miklaszewski, Hellmut Schmidt, and et al. 2021. "Update on the Scientific Status of the Plasma Focus" Plasma 4, no. 3: 450-669. https://doi.org/10.3390/plasma4030033