
The Nanosecond Impulsive Breakdown Characteristics of Air, N2 and CO2 in a Sub-mm Gap

Department of Electronic and Electrical Engineering, University of Strathclyde, Glasgow G1 1XQ, UK
*
Author to whom correspondence should be addressed.
Plasma 2022, 5(1), 12-29; https://doi.org/10.3390/plasma5010002
Submission received: 10 September 2021
/
Revised: 23 December 2021
/
Accepted: 28 December 2021
/
Published: 30 December 2021
Abstract
:The present paper investigates the breakdown characteristics—breakdown voltage, with breakdown occurring on the rising edge of the applied HV impulses, and time to breakdown—for gases of significance that are present in the atmosphere: air, N2 and CO2. These breakdown characteristics have been obtained in a 100 µm gap between an HV needle and plane ground electrode, when stressed with sub-µs impulses of both polarities, with a rise time up to ~50 ns. The scaling relationships between the reduced breakdown field Etip/N and the product of the gas number density and inter-electrode gap, Nd, were obtained for all tested gases over a wide range of Nd values, from ~1020 m−2 to ~1025 m−2. The breakdown field-time to breakdown characteristics obtained at different gas pressures are presented as scaling relationships of Etip/N, Nd, and Ntbr for each gas, and compared with data from the literature.
1. Introduction
Fast breakdown processes in gases are the subject of intensive experimental and theoretical investigation, and computer modeling. Significant interest in the dielectric performance of gases is a result of the wide use of gaseous insulation in different power and pulsed high-voltage systems. Understanding the transient breakdown processes and mechanisms that underpin the development of ionization fronts (plasma streamers) in gases is critically important for the further development of gaseous insulating systems, including plasma closing switches [1], gas-filled circuit breakers [2] and other HV gas-insulated systems.
In recent years, the breakdown properties of sub-mm gas-filled gaps have received significant attention in the literature on gas discharge and breakdown. Understanding of the breakdown properties of sub-mm inter-electrode gaps is required for the optimization of miniature gas-insulated systems; for the development of novel systems such as micro-plasma “lab on a chip” devices [3,4]; for the detection of different chemical compounds and elements [5]; for the development of micro-hollow cathode discharge systems [6] and miniature dielectric barrier discharge devices [7].
There also exists an urgent need for the high-voltage community to contribute to addressing the impact on global warming attributed to the usage of potent greenhouse gas(es) such as SF6, by substituting these gases in high-voltage systems containing gases with a lesser environmental impact [8,9]. These factors have resulted in significant interest in further information on the breakdown properties of gases present in atmospheric air—nitrogen and carbon dioxide—in shorter inter-electrode gaps stressed with different high-voltage impulses, including impulses with sub-μs front times. In [10], for example, the breakdown and recovery characteristics of a spark-gap filled with nitrogen were investigated, with a view to facilitating the development of compact, low-inductance spark gap switches for pulsed power applications. In [11], the breakdown properties of CO2 and CO2-O2 mixtures were investigated under different energization regimes, for prospective power industry applications (for example gas-filled circuit breakers); and in [12], the breakdown properties of air stressed with ns impulses have been studied to provide further quantitative information on the plasma kinetics of air. Other advanced applications that require detailed information on the breakdown of gases in short gaps include plasma-assisted ignition and combustion [13,14]; plasma thrusters for miniature flying robots [15]; environmental and medical applications [16,17]; and the fabrication of nanomaterials [18].
In the case of DC energization and uniform electric field, traditional Paschen breakdown curves for gases provide their breakdown voltage as a function of the product of gas pressure and inter-electrode distance. These Paschen breakdown characteristics for gases present in the atmosphere are readily available in the literature. However, a deviation from Paschen’s law for short, <15 µm, gaps was reported, and several models to characterize this deviation have been proposed [19,20]. Despite the current progress in theoretical and experimental studies to characterize the breakdown properties of gases, there is a lack of information on the impulsive breakdown properties of gases in divergent electric fields. The breakdown characteristics under such conditions can be significantly different from those predicted by Paschen’s law.
Moreover, Paschen curves do not reveal information on the pre-breakdown time, which is an important factor defining the operational characteristics of some practical, high voltage, pulsed power circuit elements, for example gas-filled plasma closing switches. Even if the time to breakdown is obtained under conditions of DC energization, i.e., when the voltage rise time is significantly shorter than the time to breakdown, and the voltage across the gas-filled gap is kept constant, the effects of the time-varying local electric field are not reflected in the measurements, [21]. These effects are of particular importance and interest in the case of short (sub-µs) time scale discharges, since the electron swarm parameters can be strong functions of the local electric field, which is governed by the rate of voltage rise across the gas-filled inter-electrode gap.
The increasing interest in miniature plasma and high-voltage systems has heightened the need for further experimental investigation of the impulsive breakdown properties of the gases present in the atmosphere, in sub-mm inter-electrode gaps stressed with short, high-voltage impulses with sub-µs front times.
In the present work, an experimental study and analysis of the impulsive breakdown characteristics of air, N2 and CO2 in a 100 µm inter-electrode gap were carried out. A needle-plane electrode topology, filled with bottled dry air, N2 and CO2 at different pressures, was stressed with HV impulses of both polarities with a rise time up to ~50 ns, and the breakdown voltage and total time to breakdown were measured and analyzed. Although there are some experimental data on impulsive breakdown in these gases (for example [22,23,24,25,26]), typically these results were obtained in specific, limited, ranges of operational parameters, for example typical values of the product (Nd) of the particle number density, N, and the gap separation between the electrodes, d, were in the range from ~1023 (m−2) to ~1025 (m−2), and typical values of the normalized breakdown field, E/N did not exceed 103–104 Td. In the present paper, the range of the experimental parameters was extended, allowing the breakdown measurements to be performed for lower values of (Nd), from ~1020 m−2 to ~1022 m−2, and higher values of E/N, up to 105 Td. Thus, a scaling relationship for the normalized breakdown field E/N(Nd) for a wide range of Nd values was obtained in the present paper. In addition, the product (Nt) of the total time to breakdown, t, and the particle number density, N, was obtained for the tested gases, and scaling relationships Nt(E/N) were established for the gases investigated in this paper, for E/N < 105 Td. These field-time characteristics obtained using the total time to breakdown were plotted together with the calculated volt-time curves, allowing for evaluation of the statistical time to breakdown under the practical conditions used in this paper.
The results obtained and presented in this work will help in developing a further understanding of the breakdown mechanisms in sub-mm gas-filled gaps. The establishment of relationships between the time to breakdown and breakdown field, and of scaling relationships linking the normalized electric field and the product of the gas number density and the gap length for gases present in the atmosphere, in practical electrode topologies, is required for use by the designers of power and pulsed power components and systems.
2. Materials and Methods
2.1. Electrode Topology and Test Cell
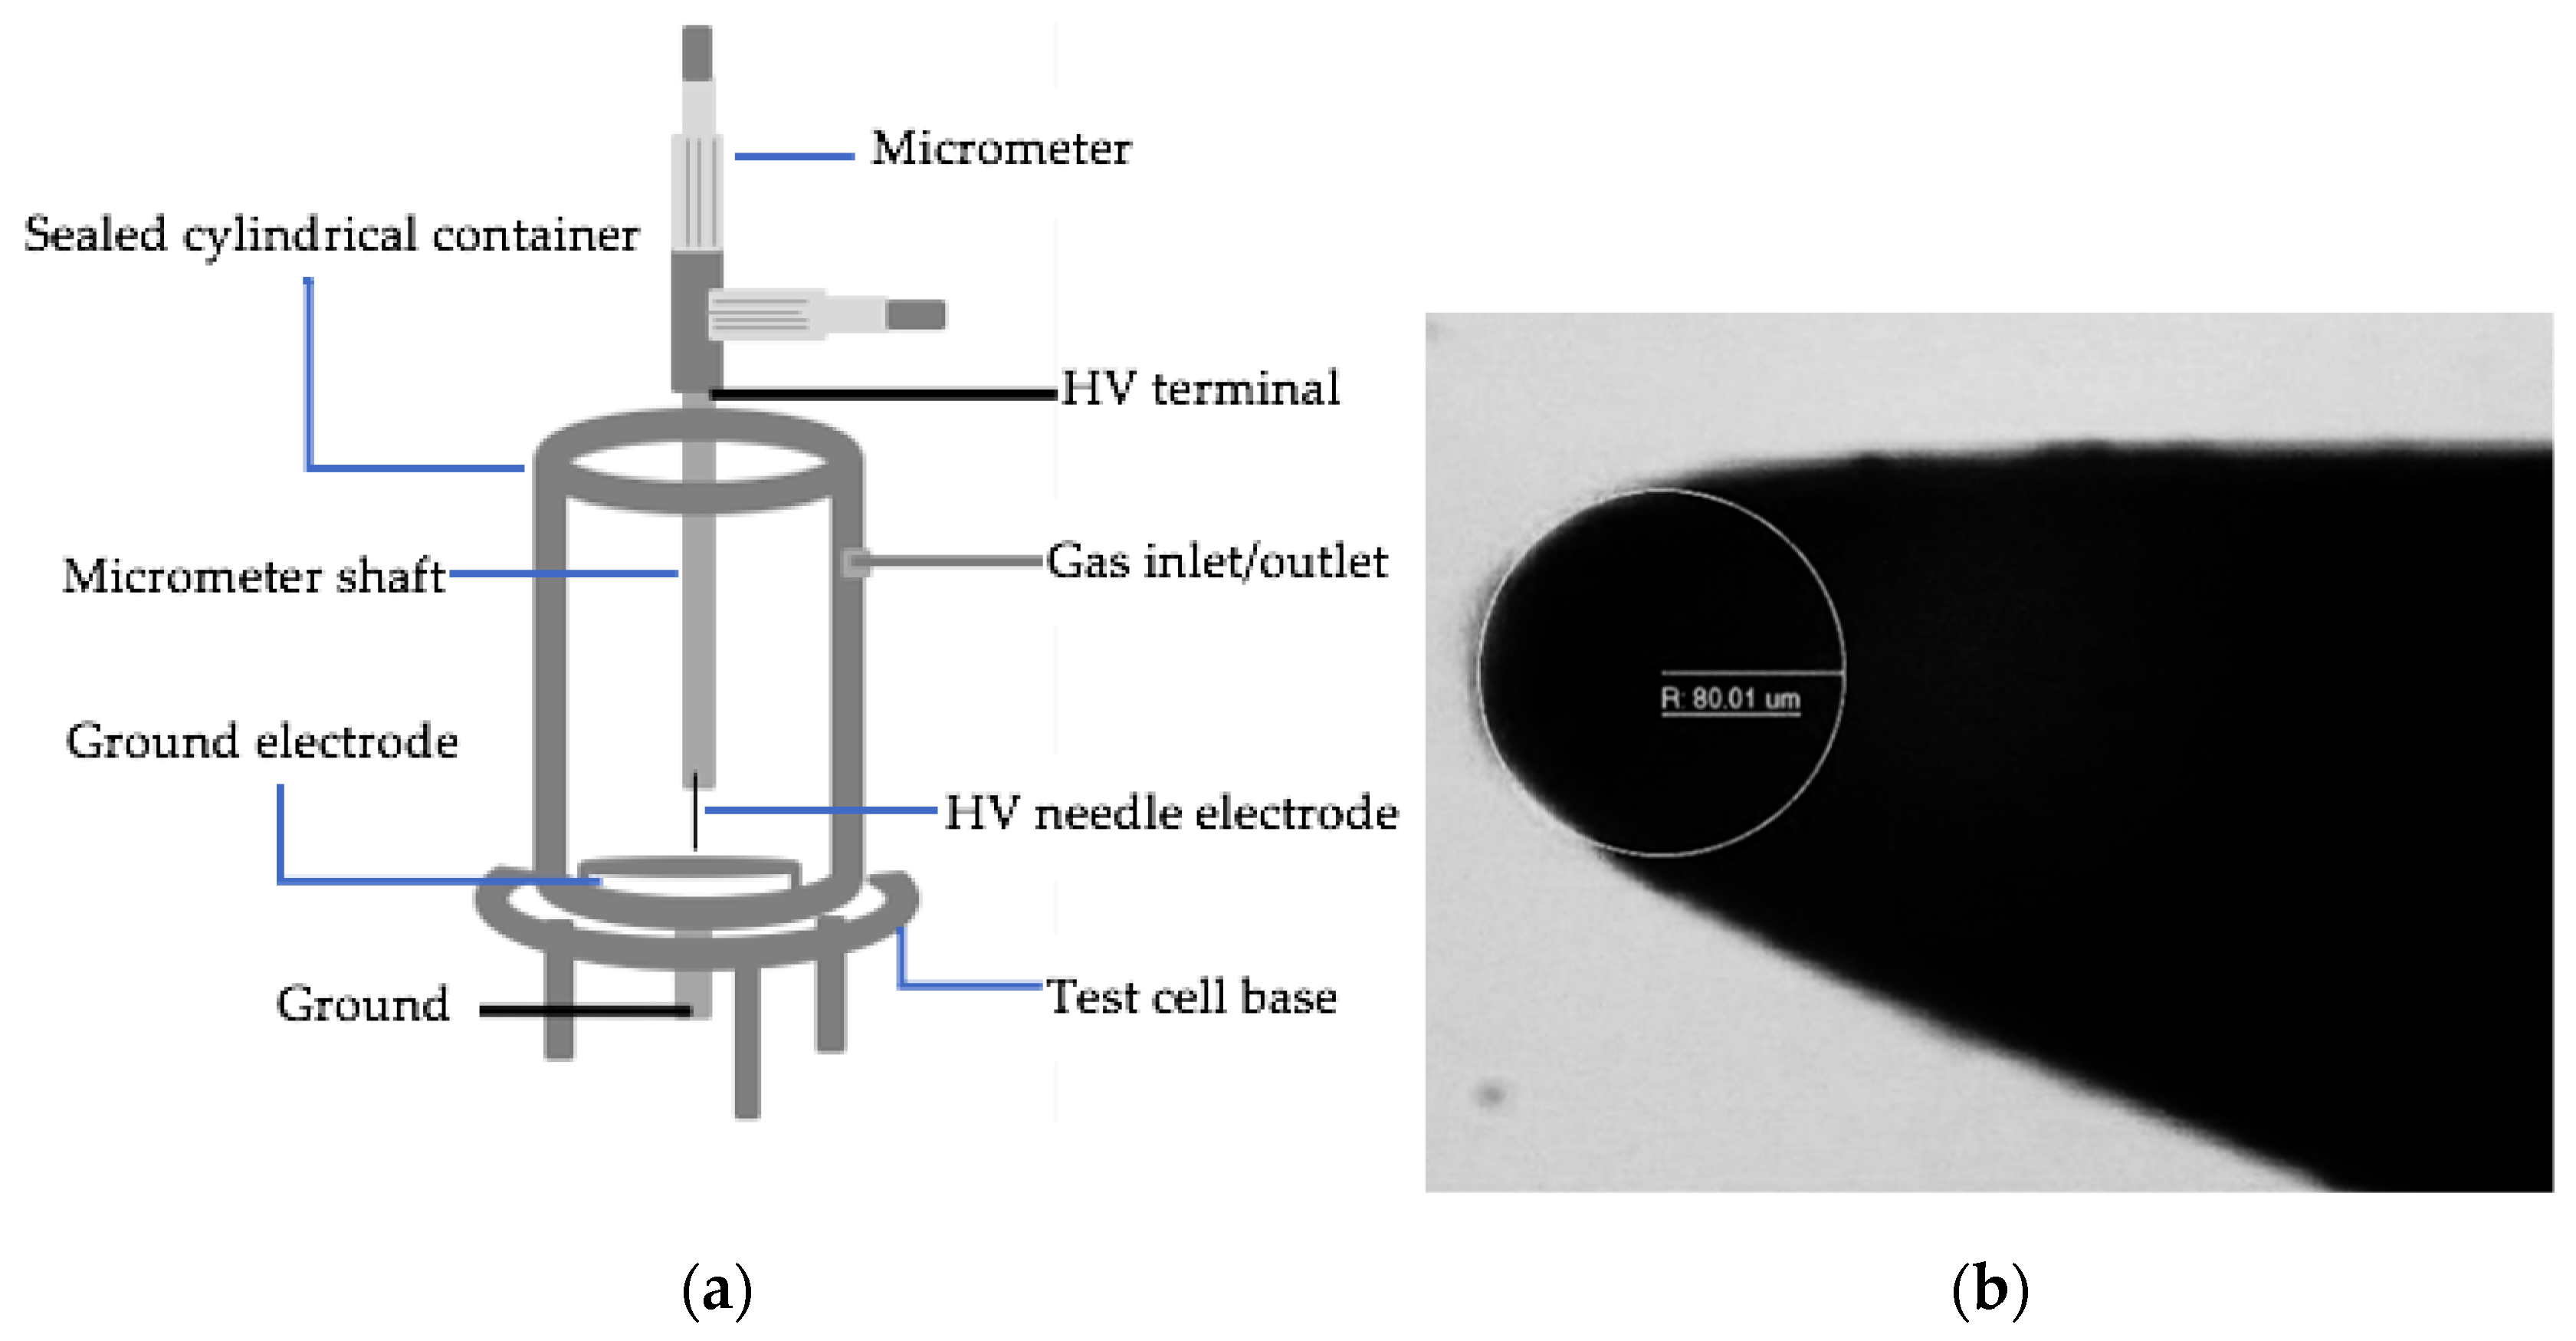
In order to investigate the breakdown characteristics of air, N2 and CO2 in a divergent electric field at sub-μs timescale, with a needle-plane topology. The needle-plane electrode system was located in a sealed cylindrical container (test cell) made of glass-reinforced nylon, as illustrated in Figure 1.
Gramophone needles with a tip radius of ~80 µm were used as HV electrodes, and a polished stainless-steel disc of 35 mm in diameter and 3 mm in thickness was used as the ground electrode. An optical microscope, equipped with a digital camera, was used to obtain the radius of the gramophone needle. Figure 1b shows a photograph of the needle (with a tip radius of ∼80 µm) taken using the microscope.
The micrometer was located on top of the upper flange of the sealed container and was used to set the inter-electrode distance between the HV needle and the ground electrode. The gap separation between the needle and plane electrodes was set to 100 ± 5.3 μm. This gap separation was used throughout the experimental tests and was selected to ensure that each breakdown event took place on the rising edge of the applied HV impulse. This ensured consistency in the breakdown conditions across all tests allowing for direct comparison of the breakdown voltage and the time to breakdown for different gases, and different conditions (gas pressure, polarity of HV impulses). Inside the sealed container, the needle (HV electrode) was attached to a micrometer’s shaft. The test cell was located inside a larger grounded Faraday cage during all breakdown tests, in order to provide electromagnetic shielding.
2.2. Gases and Gas-Handling System
The following gases have been selected for investigation of their breakdown properties in the present work: “zero grade” air, CO2, and N2. Bottled gases were purchased from BOC Ltd., Surrey, UK (a member of the Linde Group). According to the specification provided by BOC, “zero grade” air is a 79%/21% N2/O2 mixture (N2 purity 99.998%, O2 purity 99.6%); CO2 has 99.8% purity, and N2 has 99.998% purity.
A gas control and distribution system has been developed to change the gas and to set a required pressure in the test cell. This gas handling system included an Edwards BS.2212 rotary vacuum pump, used to evacuate the test cell and a custom build gas distribution board equipped with an Alicat PC-1500PSIG-D digital pressure controller (Alicat Scientific Inc, Tucson, AZ, USA), used to set and control the pressure in the test cell. Gas pressures used in the present study were ranging from 6.5 kPa to 405 kPa. Also, a digital pressure gauge (OMEGA DPGM409-010BG, Omega Engineering Ltd., Manchester, UK) was used to control the air pressure in the triggered spark-gap switch used to trigger the Blumlein high voltage generator.
2.3. Pulse Generator and Diagnostic Devices
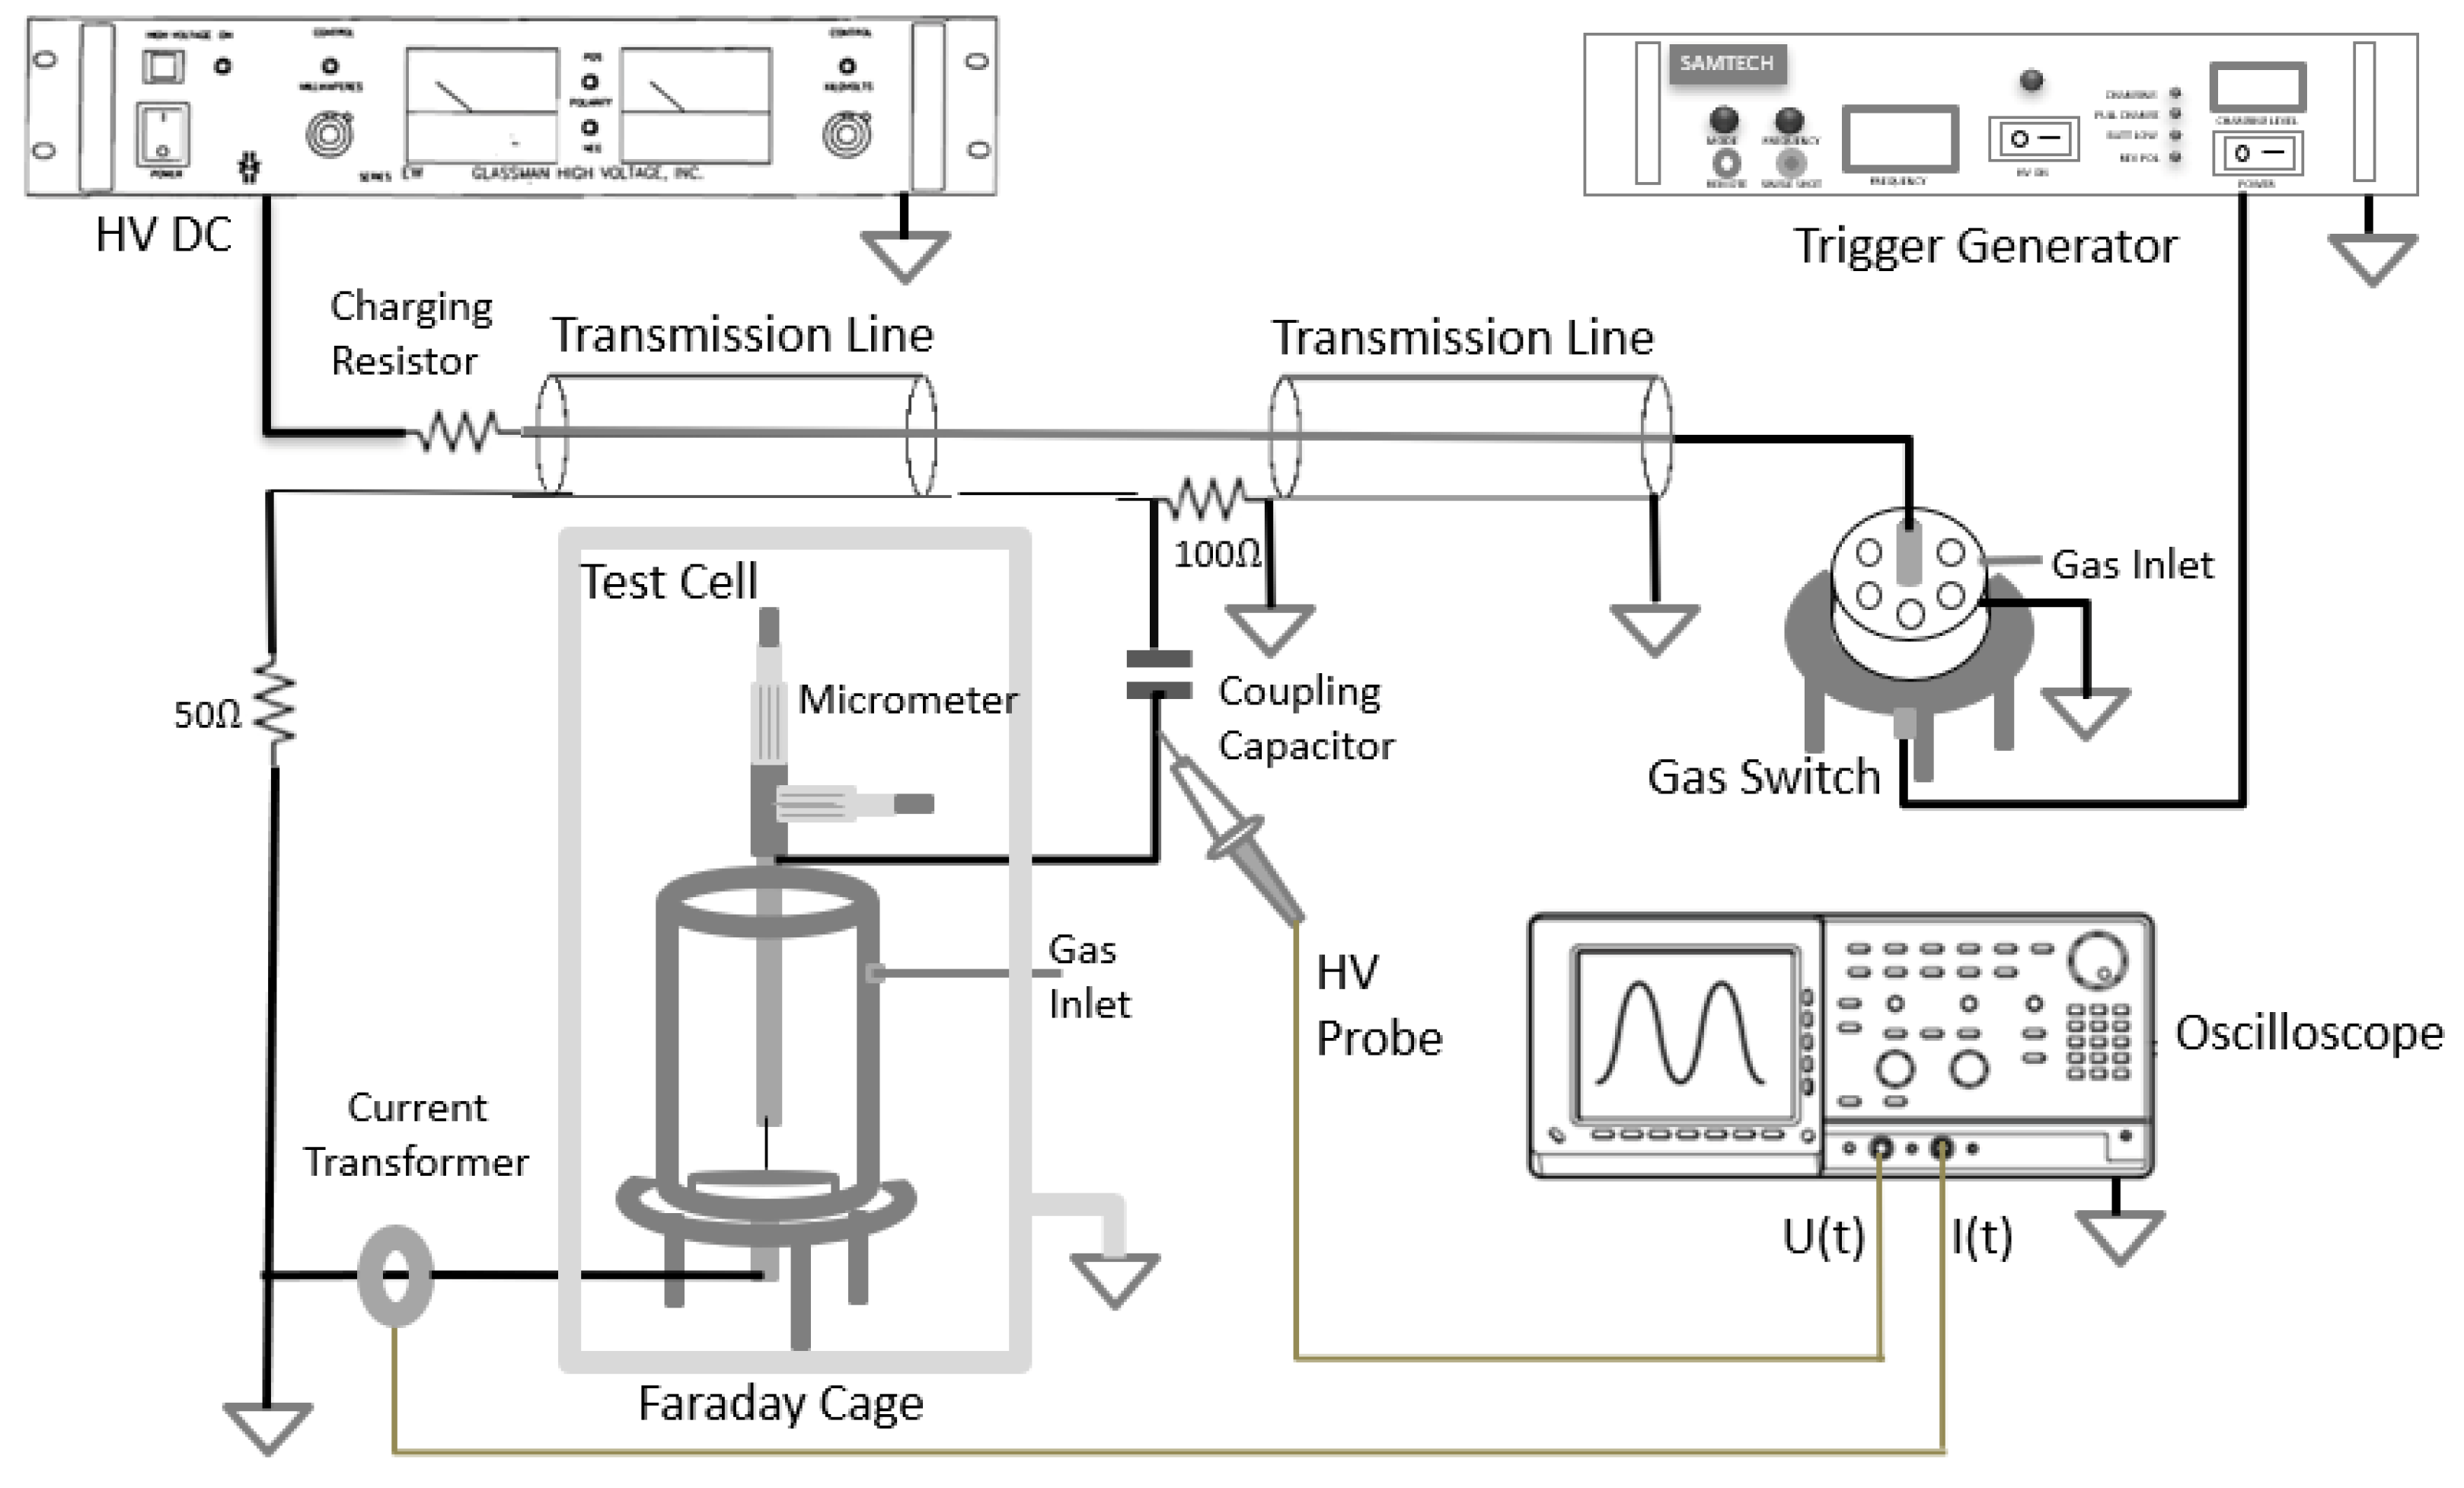
Figure 2 provides a schematic diagram of the experimental test system including the HV pulsed power supply and the test cell. The pulsed power supply used in this study was a custom-built Blumlein generator, made of two sections of URM67 coaxial cable (indicated as “transmission lines” in Figure 2, each 25 m long). The Blumlein generator was charged by a Glassman HV DC EH50P2 power supply (Glassman High Voltage Inc, High Bridge, NJ, USA), which is capable of supplying DC voltages up to 50 kV, through a 100 kΩ charging resistor. The air-filled trigatron (spark-gap switch) was triggered using pulses of up to ~37 kV, produced by a Samtech TG-01 (SAMTECH Ltd., Glasgow, Scotland) trigger generator. A 245 pF capacitor was used to couple the output of the Blumlein generator with the test tell; two matching resistors (50 Ω and 100 Ω) were used to form the required wave-shape of the HV impulse across the load (the gas-filled test cell).
The Blumlein generator was used to produce rectangular high voltage impulses of both polarities, with a rise time up to ~50 ns and a total nominal duration of ~250 ns (across an open-circuit load). The needle HV electrode was stressed with these high voltage impulses. As each breakdown event took place on the rising edge of the HV impulse, the obtained total time to breakdown in all cases was shorter than 50 ns.
Voltage and current waveforms were registered for each breakdown event in this work. Diagnostic equipment used to obtain the voltage waveforms included Tektronix P6015A HV probe (with a nominal bandwidth of 75 MHz, 100 MΩ input resistance, and 3 pF input capacitance, Tektronix Inc, Beaverton, OR, USA) and Tektronix TDS5034B digitising oscilloscope (500 MHz bandwidth, 5 GS/s sampling rate, Tektronix Inc, Beaverton, OR, USA). The HV probe was attached to the connection to the HV needle electrode located in the test cell, Figure 2. The current waveforms were obtained using a Pearson 6585 current transformer, with a nominal bandwidth of 250 MHz.
The digital cursors on the Tektronix TDS5034B oscilloscope were used to measure the breakdown voltage and the pre-breakdown time for each breakdown waveform.
Figure 3 shows typical voltage and current waveforms obtained for breakdown in air at 304 kPa. The voltage Ubr-ch was measured at the time of the first significant transient pre-breakdown disturbance (spike) in the current waveform. The observed current disturbances are the result of the development of fast ionization front(s) (streamers) in the inter-electrode gap [27,28]. It was established that a noticeable spike in the pre-breakdown current corresponds to the development of the main streamer after the initial streamer(s) crossed the gap, or when cathode- and anode-directed streamers meet each other in the gap, forming the initial body of the breakdown plasma channel, [29].
Therefore, Ubr-ch is the voltage at which the initial breakdown plasma channel is formed in the gas-filled gap; the main streamer starts to develop through this channel, leading to its thermalisation. The pre-breakdown time, tbr, was measured as the time interval between the start of the voltage impulse and the appearance of the first significant transient disturbance in the current waveform.
The development of the main streamer leads to plasma heating and formation of a highly conductive plasma-filled channel between the needle and plane electrode. When such a thermalized plasma channel is formed, the current rises sharply and the voltage across the gap collapses. It was found that in the present experimental conditions, the thermalisation time (i.e., the time interval between the first significant current spike and the moment of the sharp rise in current) is almost the same, ~(11–12) ns, for all tested gases and gas pressures, which indicates that this time is governed by the parameters of the pulsed power circuit used in these tests.
In some cases, the initial part of the voltage waveform may be disturbed by high-frequency noise. Since no significant noise was observed at the start of HV impulses produced by the Blumlein generator in the present work, the full (100%) breakdown voltage was readily obtained, from zero volts to the breakdown value Ubr-ch. However, the measured pre-breakdown time is distorted as the rise time of the Tektronix HV P6015A probe is ~5 ns, and this inaccuracy in tbr was compensated by taking the square root of the difference of squares of the measured breakdown time and the probe rise time. The compensated time to breakdown, tbr, was used in the presented analysis.
3. Results
3.1. Simulation of the HV Impulses and Electric Field in the Test Cell
The simulation of the HV pulse waveshape produced by the Blumlein generator was conducted using an equivalent RLC circuit developed using PSpice software (OrCad v.16.6). This simulation was used for the optimization of the HV generation circuit to achieve the required parameters of HV impulses used in the experimental tests. The Laplacian electrostatic field distribution in the needle-plane topology was obtained using QuickField (v.6.5) electrostatic software (in the axisymmetric mode), this field distribution was used in the analysis of the breakdown characteristics of the 100 μm gap filled with “Zero grade” air, N2 and CO2.
3.1.1. RLC Lumped-Element Equivalent Circuit
The RLC lumped element equivalent circuit of the Blumlein generator and the test cell was developed using PSpice software. Figure 4 provides the developed lumped RLC circuit of the Blumlein HV pulse generator and the test cell with including the inductances associated with conductors used in the test system.
The Blumlein generator is composed of two sections of URM67 coaxial cable, shown in Figure 4 as T1 and T2. The duration of the high-voltage impulse is defined by the length of each section of the coaxial cable and its characteristic impedance. The nominal inductance and capacitance of the URM67 cable is 250 (nH/m), and 100 (pF/m), respectively, and the characteristic impedance of the cable is 50 Ω. Polyethylene is used as an insulating material between the inner core and the outer braid of the URM67 cable, and this material has a relative permeability of μr ~1 and a relative permittivity of εr ~2.2, [30]. Therefore, the propagation velocity of electromagnetic signals travelling along this cable, obtained by:
is ~2 × 10⁸ (m/s). In Equation (1), c is the speed of light in vacuum, which is ~3 × 10⁸ (m/s). The length of each section, T1 and T2, is 25 m and the nominal duration of the output pulse generated by this Blumlein generator is 250 ns. As shown in Figure 4, the Blumlein generator is charged via the 100 kΩ charging resistor, R1. Triggering of the switch, S, leads to generation of the HV impulse, which appears across the load (the test cell) via the coupling capacitor.
Reversing the load connections to the matching resistor R3 allows for the development of HV impulses with the opposite polarity, without changing the polarity of the HV DC source: the polarity of the output voltage across the load depends on to which side of R3 the load is connected. The nominal magnitude of the output voltage produced by the Blumlein circuit is equal to the charging voltage of the HV DC power supply.
In Figure 4, the needle-plane is represented by an inductor and resistor connected in series, and this electrode system is indicated as LR1. The LR2 block in Figure 4 represents the spark discharge channel. CP represents the capacitance of the gap formed by the needle and plane electrodes, and the value of this capacitance, 1.37 pF, was obtained by simulating the needle-plane configuration in QuickField software. The HV probe is modelled as a resistor and capacitor connected in parallel (block RC1 in Figure 4)—the numerical values of for the resistance (100 MΩ) and capacitance (3 pF) of the Tektronix P6015A HV probe are provided in [31].
The RLC model shown in Figure 4 incorporates parasitic inductances associated with conductors, Lp, as in all practical pulsed power systems, parasitic inductance unavoidably exists. Parasitic inductance, Lp, of a wire of length l and radius r was obtained by Equation (2) which represents the self-inductance of a straight conductor, neglecting potential effect(s) of other adjacent conductors [32]:
where Lp is the inductance in µH, l is the wire length in cm, and r is the wire radius in cm.
Lp = 0.002l [ln(2l/r)−(3/4)]
As such, the inductance values of wires with a diameter of ~1.6 mm were obtained as a function of the wire length. This diameter represents the diameter of conductors used in the practical test system.
A rectangular voltage impulse with a pulse width of ~250 ns and a rise time of ~50 ns across the test cell (no breakdown event) was obtained by using the developed model as shown in Figure 5, the charging voltage applied to the Blumlein generator was 10 kV.
3.1.2. Simulation of Electric Field Distribution Using QuickField Software
The Laplacian electric field in the needle-plane topology with a gap separation of 100 µm was simulated using QuickField electrostatic software. The axisymmetric model allows the field distribution to be obtained for a virtual 3D case, and the resulting field distribution is shown in Figure 6.
It can be seen that the maximum electric field is achieved at the tip of the needle electrode. In the example shown in Figure 6, the applied voltage is 10 kV and the field at the needle tip is Etip ≈ 1.16 · 103 kV/cm.
3.2. Breakdown Voltage and Time to Breakdown in Investigated Gases
The breakdown voltage, Ubr-ch, and the pre-breakdown time, tbr, were obtained for air, N2 and CO2 at pressures of 6.5 kPa, 67.4 kPa, 101 kPa, 203 kPa, 304 kPa and 405 kPa for both, positive and negative, impulses. For each gas type and gas pressure, 20 breakdown events were registered, and the time to breakdown and breakdown voltage were obtained for each breakdown event (this procedure is similar to the experimental protocol used in [33] to determine the pre-breakdown delay time). Before each series of breakdown tests, the test cell was equipped with a new needle and polished ground electrode. The test cell was then sealed, evacuated and filled with gas using the gas-handling system described in Section 2.2. To ensure that there were no apparent conditioning effects during each series of breakdown tests, the breakdown voltage values were plotted as a function of breakdown number. No functional variation in the impulsive breakdown voltage was observed, i.e., any variation in Ubr-ch during a series of breakdown tests (20 tests) appeared to be random. The data were used to obtain the mean values of the breakdown voltage and time to breakdown and their standard deviation values.
The charging voltage applied to the Blumlein generator (i.e., the output voltage from the HV DC power supply used to charge the transmission lines T1 and T2, Figure 4) was increased from 10 kV to 35 kV, with an increase in the gas pressure in the test cell. For pressures up to atmospheric pressure, for all investigated gases the charging voltage was: 10 kV for 6.5 kPa, 15 kV for 67.4 kPa and 101 kPa. For higher pressures, due to higher breakdown strength of carbon dioxide, different charging voltages were used for air and N2, and for CO2. For air and N2 the charging voltage was 20 kV for 203 kPa, 25 kV for 304 kPa and 30 kV. For CO2 the charging voltage was 25 kV for 203 kPa, 30 kV for 304 kPa and 35 kV for 405 kPa.
The increased charging voltage resulted in a higher output voltage across the test cell from the Blumlein generator, which allowed for the volt-time characteristics (i.e., the breakdown voltage as a function of the time to breakdown) to be obtained. Figure 7 and Figure 8 show the volt-time breakdown characteristics obtained in air, N2, and CO2, using negative and positive impulses. Each point in these graphs represent an average value of 20 measurements, and the error bars represent the 95% confidence intervals for the breakdown voltage and time to breakdown.
The experimental data points were fitted with allometric functions
using OriginPro (v.2021) graphing software. In (3), Ubr-ch is given in kV and tbr is in ns; A and B are free fitting parameters, which were obtained for each gas type and impulse polarity, as listed in Table 1.
It can be seen that the coefficients A and B are greater for CO2 than for air and N2, for both polarities; thus, for shorter times to breakdown, CO2 demonstrates higher breakdown voltage than the other tested gases, under the present experimental conditions. However, with an increase in the time to breakdown, the breakdown voltage for CO2 reduces quicker than that for the two other gases, and becomes comparable with Ubr-ch of air and N2 at ~30 ns in the case of positive impulses, and at ~45 ns in the case of negative impulses. Figure 7 and Figure 8 also show that all three gases demonstrate higher breakdown voltage in the case of negative energisation (as compared with positive energisation), at the same time to breakdown. This could be attributed to the formation of negative space charge, which reduces the electric field in the gap, leading to higher values of Ubr-ch for negative energisation.
3.3. Scaling Relationships
3.3.1. E/N as a Function of Nd
The breakdown voltage values from Figure 7 and Figure 8 were used in the QuickField model as the peak voltages applied to the needle electrode. Thus, the maximum field at the tip of the electrode at the moment of breakdown, Etip, was obtained for each gas type and gas pressure.
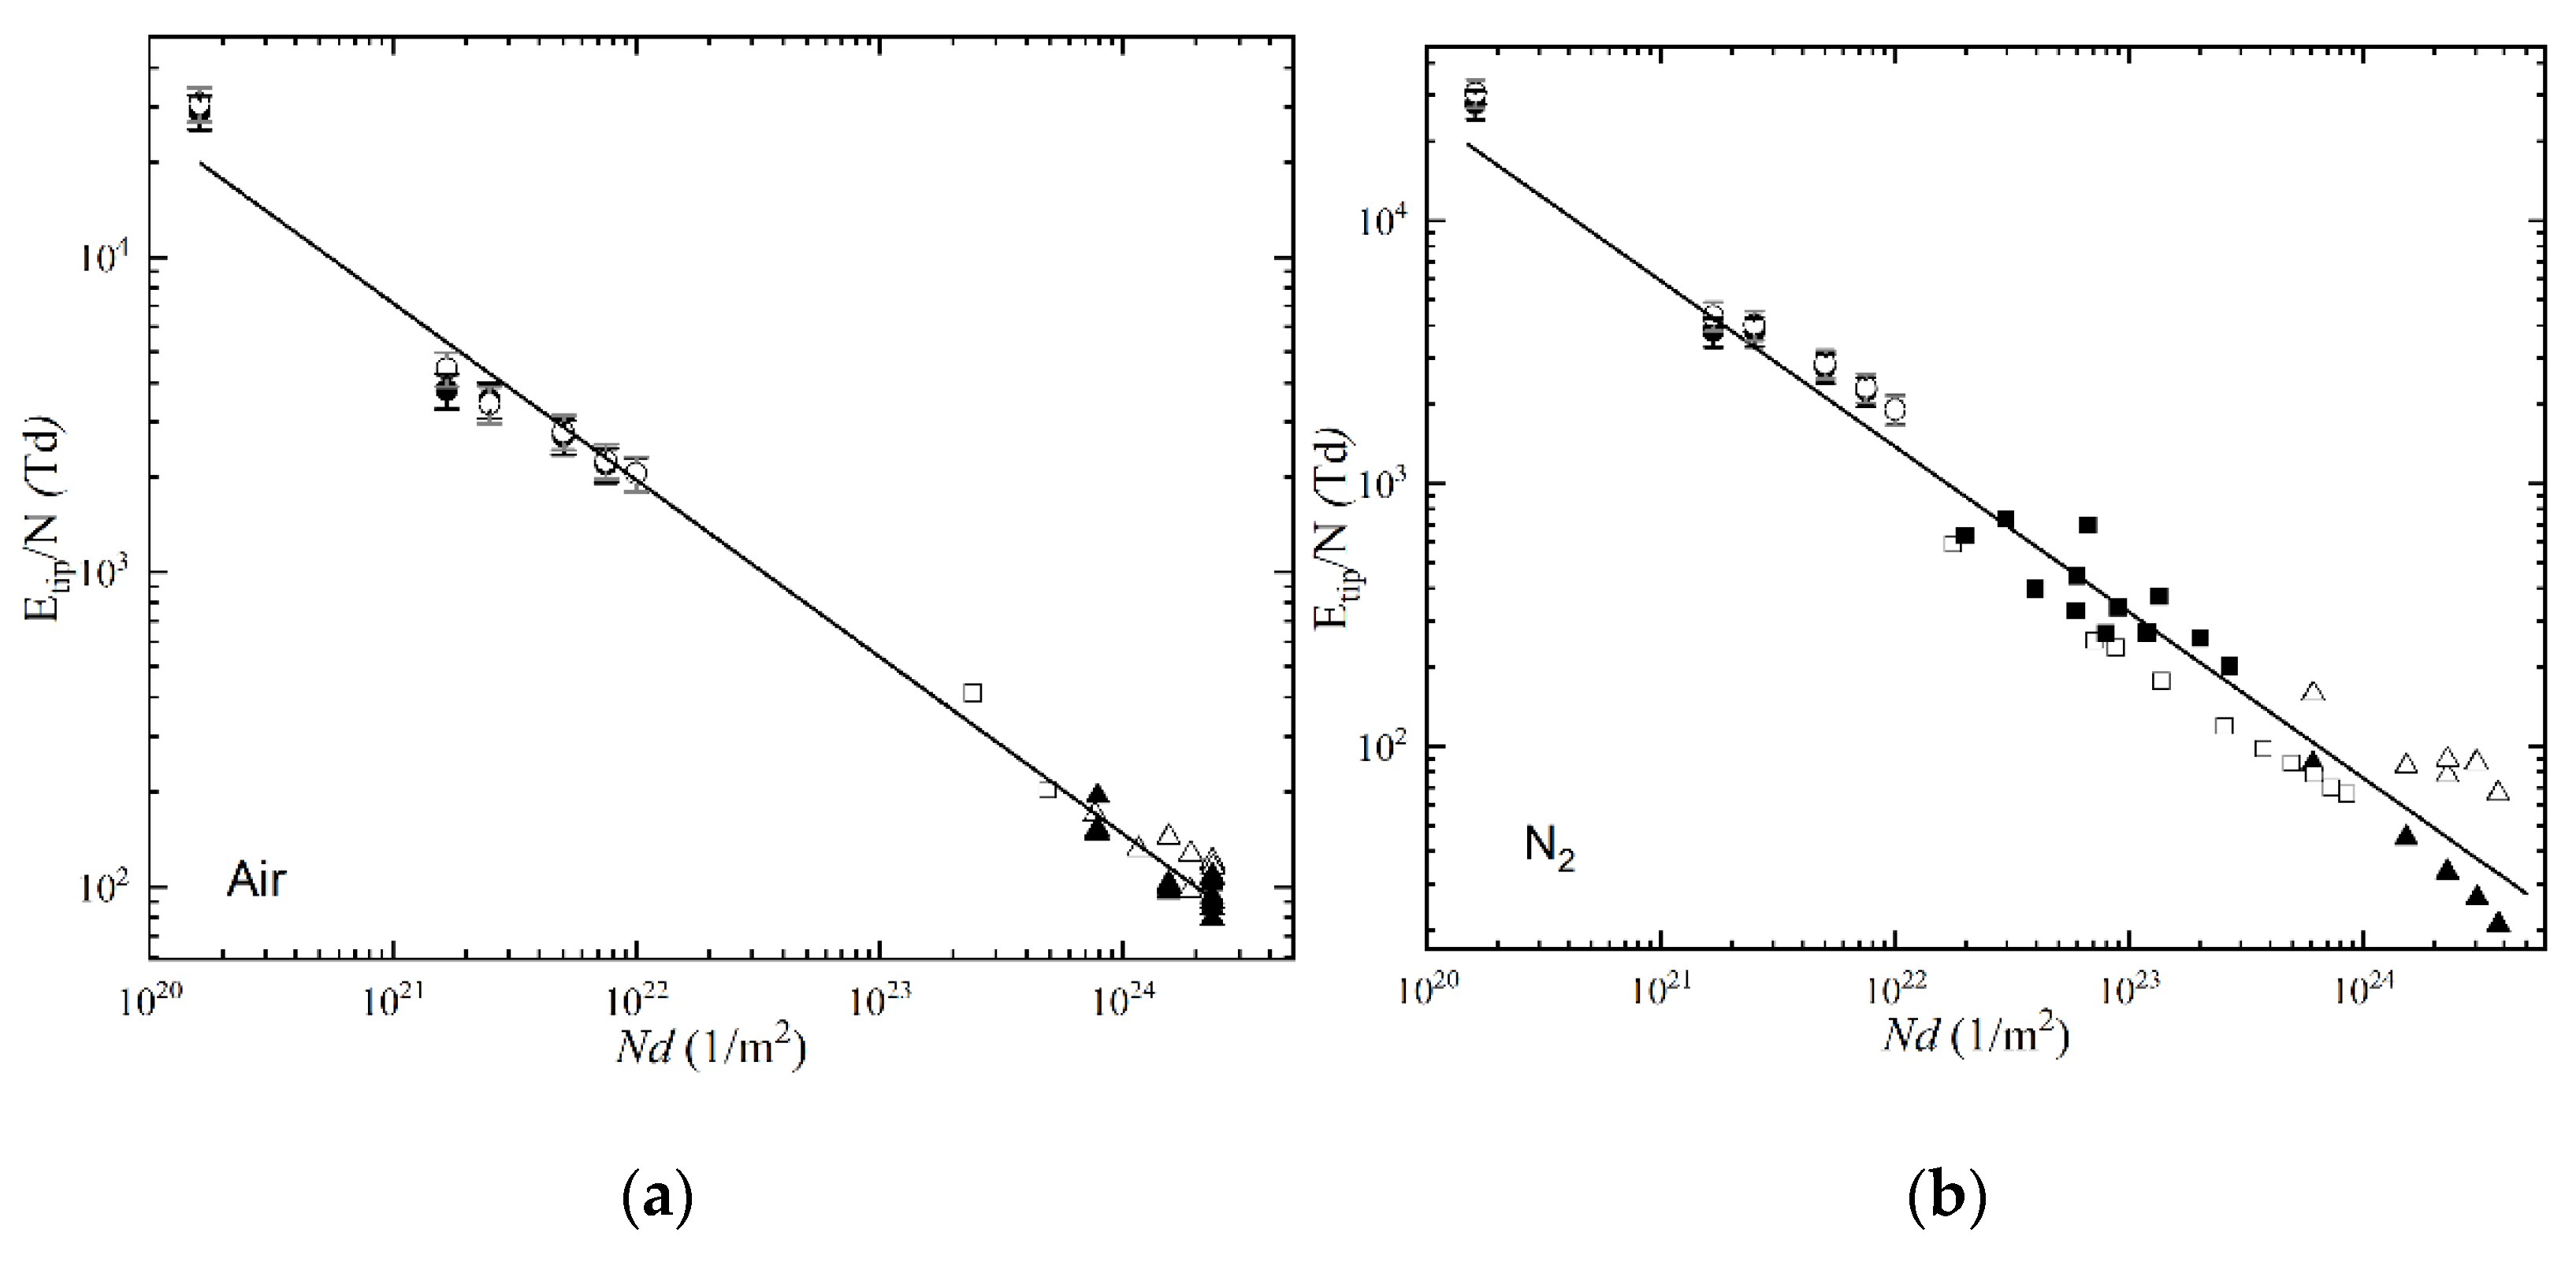
Figure 10 shows the obtained normalized electric field at the tip of the needle at the moment of breakdown, Etip/N, as a function of Nd, the product of the particle number density, N, and the gap separation between electrodes, d. It can be seen that the electrical field at the tip of the needle decreases with an increase in Nd.
Typically, the total time to breakdown, tbr, is considered as the sum of the formative time, tf, and the statistical time, ts:
tbr = tf + ts
Therefore, if both, formative time and total time to breakdown, are known, the statistical time, ts, can be calculated.
To obtain the analytical “breakdown field—formative time to breakdown” characteristics, a kinetic model can be used. The kinetic model discussed in detail in [34] links the formative time and the normalised breakdown field, E/N:
where, tf is the formative time, αeff is the effective ionization coefficient and µe is the mobility of electrons; the numerical values of αeff and µe used in the present analysis are listed in [34].
tf N = 18/[(αeff µe)(E/N)]
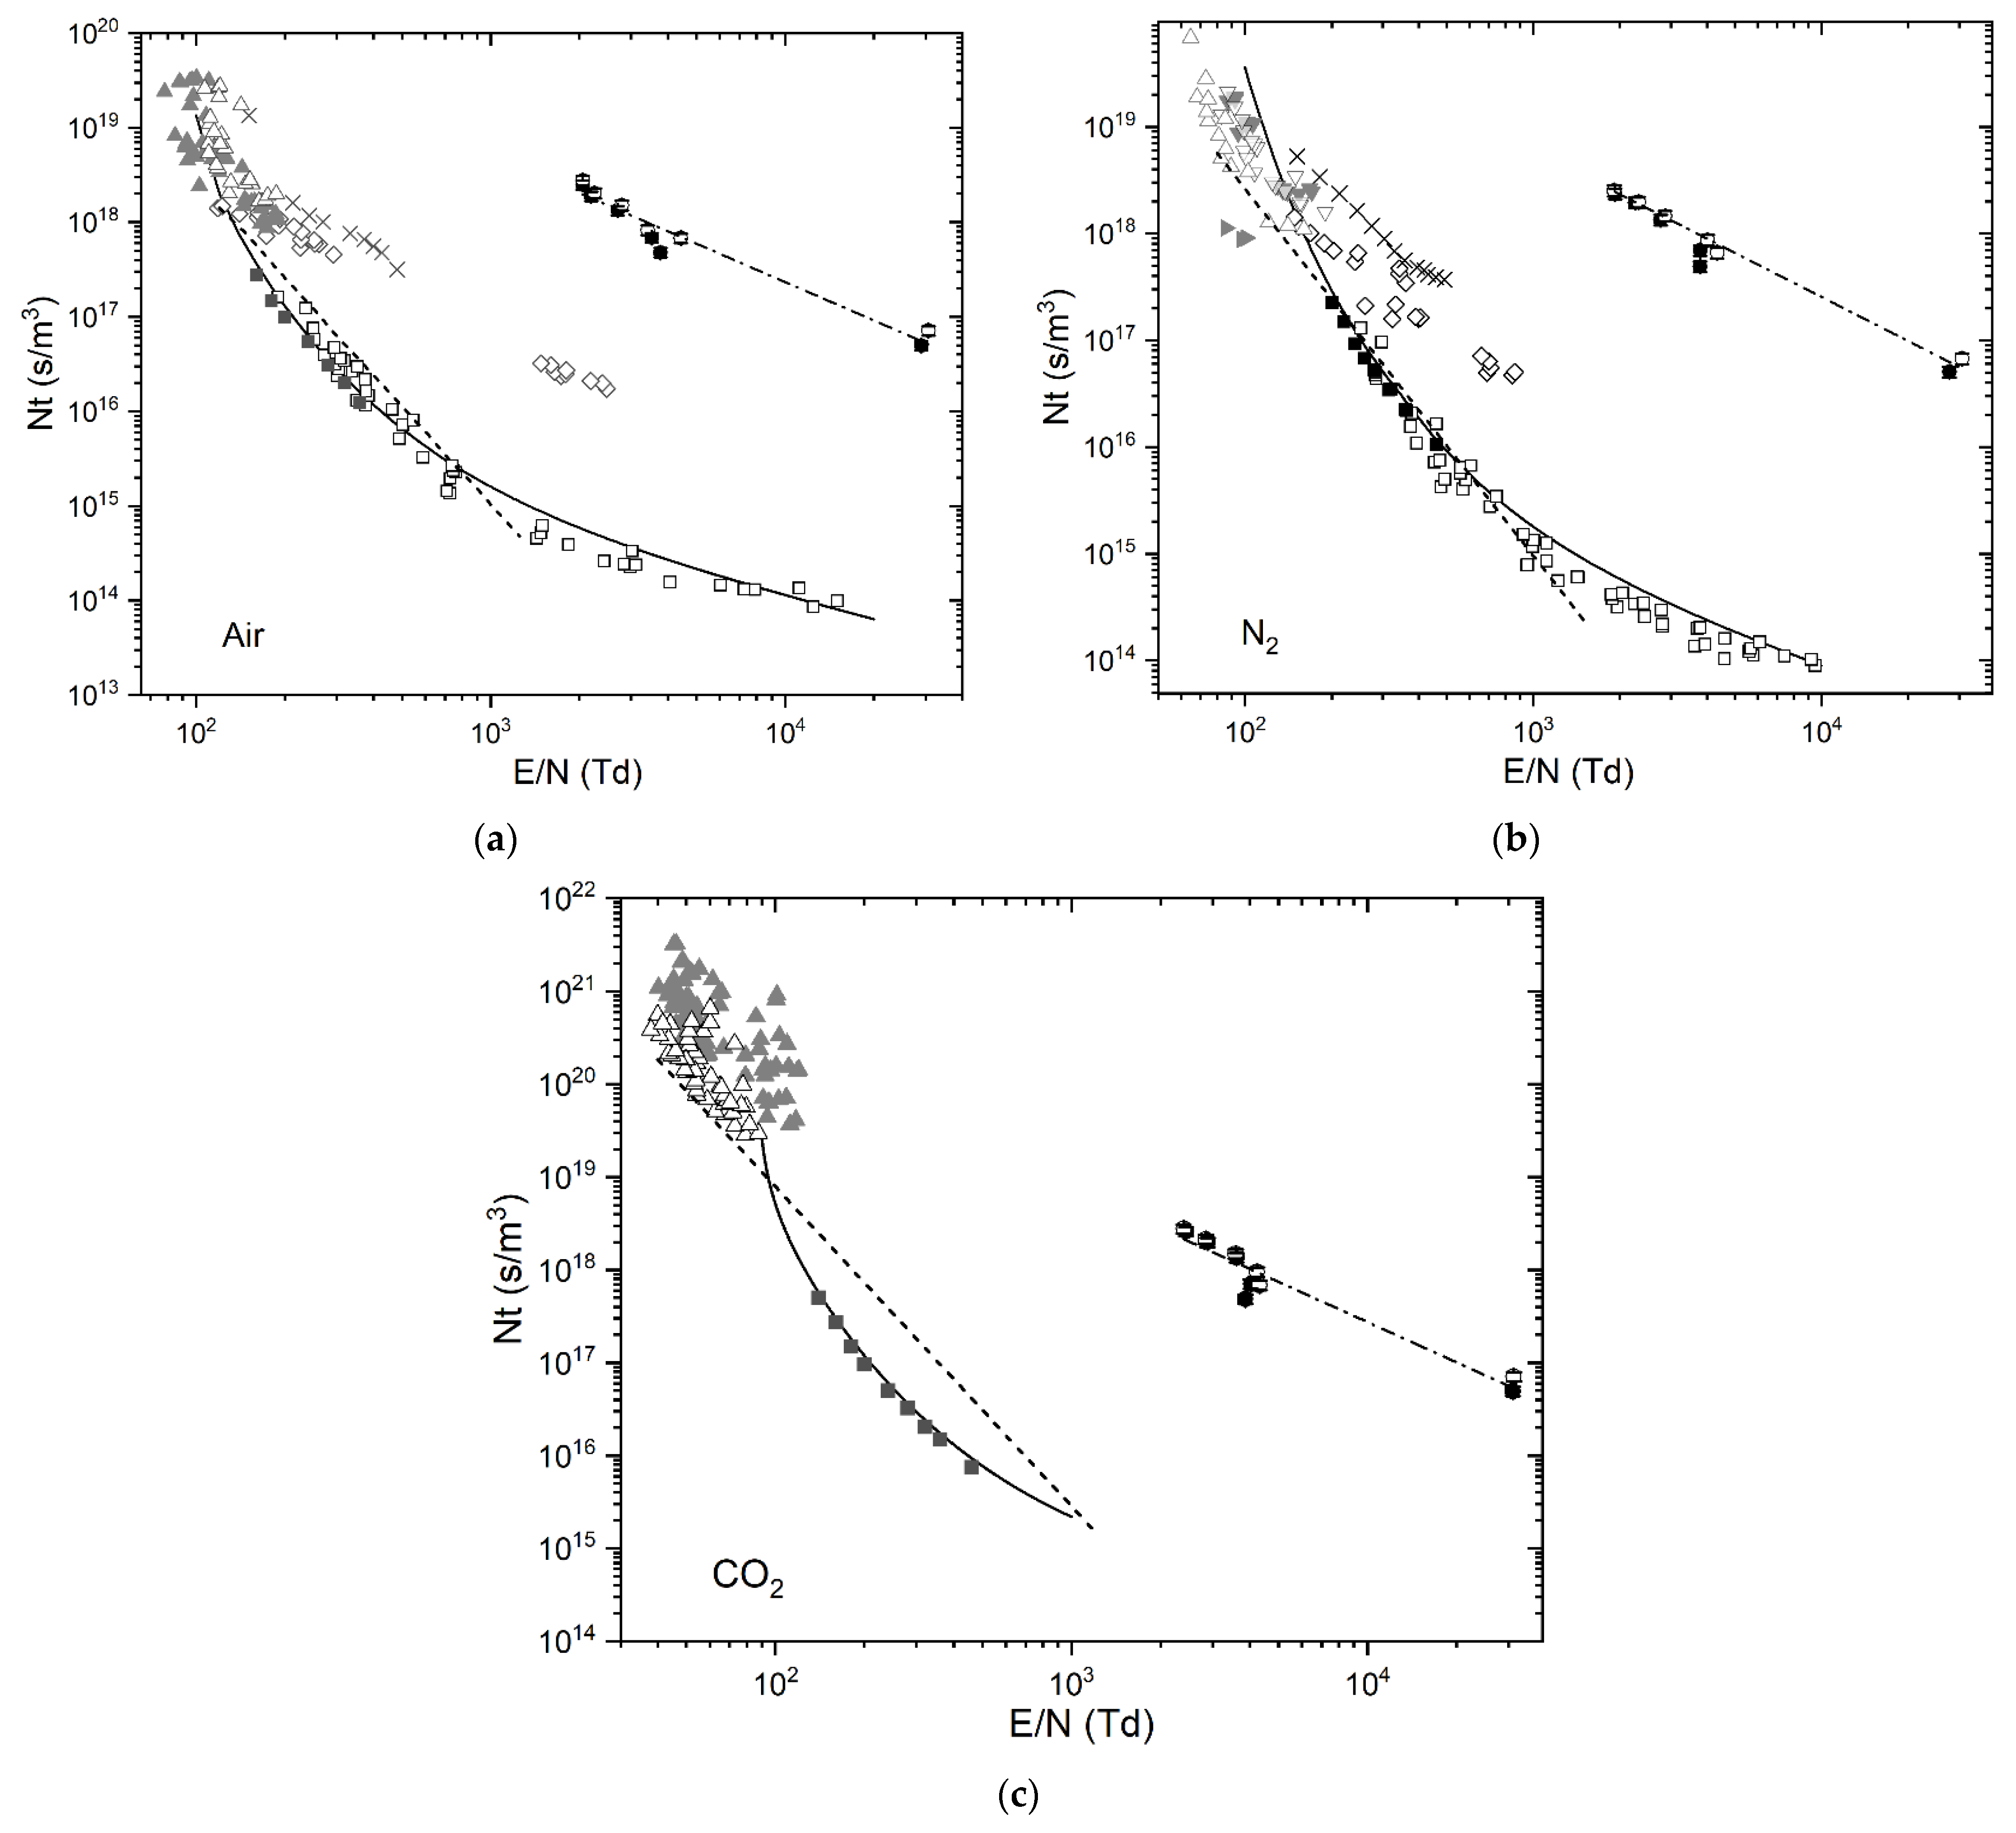
Figure 9 shows the derived formative time multiplied by N as a function of E/N obtained by Equation (5) for air, N2, CO2, and SF6. Also shown in Figure 9 is the product tbr N of the total time to breakdown, tbr, and the gas particle density, as a function of Etip/N for air, N2 and CO2; these functions, tbr N(Etip/N) are based on the results obtained in the present paper.
Based on the results presented in Figure 9, it was found that the nominal statistical time is ~1000 times longer than the calculated formative time, tf, in the present experimental conditions, for electric fields in the range from ~2 × 10³ Td to ~2 × 10⁴ Td.
Figure 10 provides the relationship between the normalised breakdown field at the tip of the needle, Etip/N, and Nd for both positive and negative polarity in air, N2, and CO2. This figure shows both, the original experimental data obtained in the present work for lower values of Nd, ~(1020–1022) 1/m2, and the data from the literature for higher values of Nd, >1023 1/m2. Each experimental point shown in Figure 10 represents the average value obtained using 20 individual data points (the error bars show the 95% confidence interval values for the data obtained in the present work).
All experimental results, that is the results obtained herein and the literature data, were fitted with allometric functions, Equation (6), using OriginPro (v.2021) graphing software. This fitting was conducted in the field range from 1020 Td to 1025 Td; C and D were free fitting parameters.
Etip/N = C · (Nd)−D (Td)
In Equation (6), Nd is expressed in units of 1/m2 and Etip/N is expressed in units of Td. The numerical values of the fitting parameters, C and D, obtained in OriginPro graphing software for each gas are given in Table 2.
3.3.2. Nt as a Function of E/N
Figure 11 shows Nt as a function of E/N for air, N2 and CO2 and includes: the results obtained in the present work (Ntbr as a function of Etip/N), the kinetic model results (Ntf as a function of E/N), and the results previously published in the literature, [10,11,22,23,24], and [34,35,36,37]. Each experimental point shown in Figure 11 represents the average value obtained using 20 individual data points, the error bars show the 95% confidence interval values, (some original experimental points do not appear to have error bars as a result of these bars being too small to display relative to the size of the point). The literature data are based on both formative and (in some cases) total time to breakdown and were obtained under various experimental conditions (type of electrodes, inter-electrode distances, gas pressures, high-voltage pulse characteristics). Details of each specific set of experimental conditions can be found in [10,11,22,23,24,34,35,36,37].
The experimental data obtained in the present paper were fitted with analytical functions (7) using OriginPro graphing software in the range of E/N from 2 × 10³ Td to 105 Td, for all tested gases:
where K and M are the free fitting parameters.
Ntbr = K · (Etip/N)−M (s/m3)
In Equation (7), Etip/N is given in the units of Td, and Ntbr is in the units of s/m3. Values of the fitting parameters K and M are listed in Table 3, for all tested gases.
It can be seen from Figure 11 that the experimental results obtained in the present work, which are based on the total time to breakdown, tbr, demonstrate that the statistical time according to Equation (4) is significantly longer than the formative time obtained by the kinetic model, for fields above 103 Td. In addition, the values of Ntbr obtained in the present work are greater than some of the results found in the literature. This can be explained by the difference in the experimental conditions (electrode topology, gap distance, gas pressure, pulse wave shape, rise time and duration) between the present experimental conditions and the experimental conditions described in the literature. For example, in some cases described in the literature, the rise time of the HV impulses was up to 100 times shorter than that used in the present work. The inter-electrode gap length used in [10,11,23,24,35,36], was significantly wider than the gap separation used in the present work. Moreover, in [36,38], ultraviolet illumination was used to trigger discharges, minimizing the statistical time; therefore, these results are based on the formative time only.
4. Discussion
The present work is focused on the systematic investigation of the impulsive breakdown characteristics—the breakdown voltage and time to breakdown, of the major gases present in the atmosphere, air, N2 and CO2, with breakdown occurring on the rising edge of the applied HV impulses. This was achieved by using a 100 µm gap between the needle (with a radius of ~80 µm) and plane electrodes and high-voltage impulses with the nominal front time up to ~50 ns.
This breakdown process can be described as follows. The electric field develops across the interelectrode gap after the application of the high-voltage pulse; the strongest electric field is observed at the tip of the HV needle electrode. The ionization processes start in this area of the strongest electric field, resulting in the exponential growth of free electrons that travel in the direction of the electric field. However, the time interval during which the voltage rises from zero to several kilovolts is short, less than ~50 ns, thus significant overvoltage can be achieved before the spark breakdown has been able to form. Thus, in the conditions used in the present work, the obtained breakdown voltage was several 10 s of times higher than the (static) DC breakdown voltage for the tested gases. These results are of particular importance for fast, sub-µs discharges, since the measurements performed under DC energization conditions miss the effects of the time-varying field [21]. The methodology used in the present work to obtain the impulsive breakdown voltages is in line with the fast breakdown measurements conducted under pulsed conditions in [33,39], when the breakdown events were registered in dynamic energization regimes, on the rising slope of the applied high-voltage impulses. Thus, the voltage rise time across the gas-filled inter-electrode gap (dV/dt) is factored into the test procedure, resulting in data that reflects the impulsive breakdown volt-time characteristics of the tested gases. These characteristics provide further insight into the dynamic (pre-) breakdown processes in gases, which are governed by the field-dependent electron swarm parameters, such as the effective ionization coefficient and mobility of charged species.
The modeled breakdown field at the tip of the needle, Etip/N, obtained in this work using the experimental breakdown voltages for each tested gas was in the range from ~103 Td to ~105 Td. This field was used to obtain the reduced breakdown field, Etip/N. The relationships between the reduced breakdown field in all tested gases were established and presented as a function of the normalized field at the needle tip, Etip/N, on Nd. The product of the breakdown time and the gap distance, Ntbr, as a function of Etip/N has also been obtained and analyzed. It was found that Etip/N, as a function of Nd for all tested gases, can be fitted with the allometric functions Etip/N = C(Nd)−D (where C and D are fitting parameters specific for each gas) over the range of Nd values used in the present work. Moreover, the obtained allometric functions also describe well the literature data for higher values of Nd. Thus, the obtained scaling relationships Etip/N(Nd) can be used to provide a link between the breakdown field, the gas number density and the inter-electrode gap in the gases present in the atmosphere.
The experimental data Ntbr were presented as a function of Etip/N, and the scaling relationships, Ntbr(Etip/N), were obtained for each tested gas. These results demonstrate that in practical cases, the time to breakdown at a specific gas pressure (the number density, N) can be significantly higher than the analytical Ntbr results obtained based on the streamer criterion. This could be due to the practical statistical time (in the experimental conditions used in this work) being significantly longer than the nominal formative time. This result is important for practical pulsed power applications since the obtained breakdown parameters can be used in the development and optimization of the operational characteristics of practical miniature plasma closing switches and other gas-filled pulsed power components and systems.
The results obtained in this work can be used in future research into the initiation and development of the fast breakdown processes in gases in more complex electrode topologies with highly divergent electric fields, and with gas/solid interfaces, for the optimization and coordination of gaseous insulation. This will help in the development of gas-insulated high-voltage pulsed power systems, such as fast plasma closing switches filled with environmentally friendly gases, and gas-insulated systems for the power industry.
Author Contributions
T.L.: Investigation, methodology, formal analysis, writing—original draft I.T.: conceptualization, methodology, supervision, resources, writing—review and editing M.P.W.: methodology, resources, writing—review and editing M.J.G.: methodology, writing—review and editing S.J.M.: supervision, methodology, resources, writing—review and editing. All authors have read and agreed to the published version of the manuscript.
Funding
This research project received no external funding.
Data Availability Statement
All data is included in the paper.
Conflicts of Interest
The authors declare no conflict of interest.
References
- Schaefer, G.; Kristiansen, M.; Guenther, A. Gas Dis-Charge Closing Switches; Springer Science + Business Media: New York, NY, USA, 1990. [Google Scholar]
- Haddad, A.; Warne, D.F. Advances in High Voltage Engineering; The Institution of Engineering and Technology: London, UK, 2007. [Google Scholar]
- Becker, K.H.; Schoenbach, K.H.; Eden, J.G. Microplasmas and applications. J. Phys. D Appl. Phys. 2006, 39, R55–R70. [Google Scholar] [CrossRef]
- Luo, D.; Duan, Y. Microplasmas for analytical applications of lab-on-a-chip. TrAC Trends Anal. Chem. 2012, 39, 254–266. [Google Scholar] [CrossRef]
- Joffrion, J.B.; Mills, D.; Clower, W.; Wilson, C.G. On-Chip Microplasmas for the Detection of Radioactive Cesium Contamination in Seawater. Micromachines 2017, 8, 259. [Google Scholar] [CrossRef] [Green Version]
- Jovović, J.; Konjević, N. Spectroscopic and electric characterization of an atmospheric pressure segmented gas discharge with micro hollow electrodes. Eur. Phys. J. D 2014, 68, 60. [Google Scholar] [CrossRef]
- Niu, G.; Knodel, A.; Burhenn, S.; Brandt, S.; Franzke, J. Review: Miniature dielectric barrier discharge (DBD) in analytical atomic spectrometry. Anal. Chim. Acta 2020, 1147, 211–239. [Google Scholar] [CrossRef]
- Paris Agreement. 2015. Available online: https://unfccc.int/sites/default/files/english_paris_agreement.pdf (accessed on 9 September 2021).
- Eves, M. A Literature Review on SF6 Gas Alternatives for Use on the Distribution Network. Western Power Distribution Innovation. 2018. Available online: https://www.westernpower.co.uk/downloads/5857 (accessed on 9 September 2021).
- Cai, X.; Zou, X.; Wang, X.; Wang, L.; Guan, Z.; Jiang, W. Over-volted breakdown and recovery of short nitrogen spark gaps. Laser Part. Beams 2010, 28, 443–450. [Google Scholar] [CrossRef]
- Kumar, S.; Huiskamp, T.; Pemen, A.; Seeger, M.; Pachin, J.; Franck, C.M. Electrical Breakdown Study in CO2 and CO2-O2 Mixtures in AC, DC and Pulsed Electric Fields at 0.1–1 MPa Pressure. IEEE Trans. Dielectr. Electr. Insul. 2021, 28, 158–166. [Google Scholar] [CrossRef]
- Simeni, M.S.; Goldberg, B.; Gulko, I.; Frederickson, K.; Adamovich, I.V. Sub-nanosecond resolution electric field measurements during ns pulse breakdown in ambient air. J. Phys. D Appl. Phys. 2017, 51, 01LT01. [Google Scholar] [CrossRef] [Green Version]
- Balmelli, M.; Farber, R.; Merotto, L.; Soltic, P.; Bleiner, D.; Franck, C.M.; Biela, J. Experimental Analysis of Breakdown With Nanosecond Pulses for Spark-Ignition Engines. IEEE Access 2021, 9, 100050–100062. [Google Scholar] [CrossRef]
- Starikovskii, A.; Anikin, N.; Kosarev, I.; Mintoussov, E.; Nudnova, M.; Rakitin, A.; Roupassov, D.; Starikovskaia, S.; Zhukov, V. Nanosecond-Pulsed Discharges for Plasma-Assisted Combustion and Aerodynamics. J. Propuls. Power 2008, 24, 1182–1197. [Google Scholar] [CrossRef]
- Drew, D.S.; Pister, K.S.J. Geometric Optimization of Microfabricated Silicon Electrodes for Corona Discharge-Based Electrohydrodynamic Thrusters. Micromachines 2017, 8, 141. [Google Scholar] [CrossRef] [Green Version]
- Park, H.J.; Kim, S.H.; Ju, H.W.; Lee, H.; Lee, Y.; Park, S.; Yang, H.; Park, S.-J.; Eden, J.G.; Yang, J.; et al. Microplasma Jet Arrays as a Therapeutic Choice for Fungal Keratitis. Sci. Rep. 2018, 8, 2422. [Google Scholar] [CrossRef] [PubMed] [Green Version]
- Doherty, K.G.; Oh, J.-S.; Unsworth, P.; Bowfield, A.; Sheridan, C.M.; Weightman, P.; Bradley, J.W.; Williams, R.L. Polystyrene Surface Modification for Localized Cell Culture Using a Capillary Dielectric Barrier Discharge Atmospheric-Pressure Microplasma Jet. Plasma Process. Polym. 2013, 10, 978–989. [Google Scholar] [CrossRef]
- Chiang, W.; Mariotti, D.; Sankaran, R.M.; Eden, J.G.; Ostrikov, K. Microplasmas for Advanced Materials and Devices. Adv. Mater. 2019, 32, e1905508. [Google Scholar] [CrossRef] [PubMed] [Green Version]
- Garner, A.L.; Meng, G.; Fu, Y.; Loveless, A.M.; Ii, R.S.B.; Darr, A.M. Transitions between electron emission and gas breakdown mechanisms across length and pressure scales. J. Appl. Phys. 2020, 128, 210903. [Google Scholar] [CrossRef]
- Loveless, A.M.; Meng, G.; Ying, Q.; Wu, F.; Wang, K.; Cheng, Y.; Garner, A.L. The Transition to Paschen’s Law for Microscale Gas Breakdown at Subatmospheric Pressure. Sci. Rep. 2019, 9, 5669. [Google Scholar] [CrossRef] [Green Version]
- Levatter, J.; Lin, S.-C. Necessary conditions for the homogeneous formation of pulsed avalanche discharges at high gas pressures. J. Appl. Phys. 1980, 51, 210–222. [Google Scholar] [CrossRef]
- Mankowski, J.; Dickens, J.; Kristiansen, M. High voltage subnanosecond breakdown. IEEE Trans. Plasma Sci. 1998, 26, 874–881. [Google Scholar] [CrossRef]
- Shao, T.; Sun, G.; Yan, P. An experimental investigation of repetitive nanosecond-pulse breakdown in air. J. Phys. D Appl. Phys. 2006, 39, 2192–2197. [Google Scholar]
- Carboni, V.; Lackner, H.; Giri, D.; Lehr, J. The breakdown fields and risetimes of select gases under the conditions of fast charging (~20 ns and less) and high pressures (20-100 atmospheres). In Proceedings of the 28th IEEE International Conference on Plasma Science and 13th IEEE International Pulsed Power Conference. Digest of Papers (Cat. No.01CH37251), Las Vegas, NV, USA, 17–22 June 2001; PPPS-2001 Pulsed Power Plasma Science 2001. Volume 1, pp. 482–486. [Google Scholar] [CrossRef]
- Kiyan, T.; Takade, M.; Namihira, T.; Hara, M.; Sasaki, M.; Goto, M.; Akiyama, H. Polarity Effect in DC Breakdown Voltage Characteristics of Pressurized Carbon Dioxide up to Supercritical Conditions. IEEE Trans. Plasma Sci. 2008, 36, 821–827. [Google Scholar] [CrossRef]
- Babich, L.; Loiko, T.V. Generalized Paschen’s law for overvoltage conditions. IEEE Trans. Plasma Sci. 2016, 44, 3243–3248. [Google Scholar] [CrossRef]
- Beloplotov, D.; Lomaev, M.; Sorokin, D.; Tarasenko, V. Displacement current during the formation of positive streamers in atmospheric pressure air with a highly inhomogeneous electric field. Phys. Plasmas 2018, 25, 083511. [Google Scholar] [CrossRef]
- Rep’ev, A.; Repin, P. Dynamics of the Optical Emission from a High-Voltage Diffuse Discharge in a Rod–Plane Electrode System in Atmospheric-Pressure Air. Plasma Phys. Rep. 2006, 32, 72–78. [Google Scholar] [CrossRef]
- Laity, G.; Neuber, A.; Fierro, A.; Dickens, J.; Hatfield, L. Phenomenology of streamer propagation during pulsed dielectric surface flashover. IEEE Trans. Dielectr. Electr. Insul. 2011, 18, 946–953. [Google Scholar] [CrossRef]
- Wilson, M.P. Impulse Breakdown of Liquid-Solid Interfaces. Ph.D. Thesis, University of Strathclyde, Glasgow, UK, 2011. [Google Scholar]
- Passive High-Voltage Probes P5100, P5120, P5122, P6015A Data Sheet. Available online: https://docs.rs-online.com/d2f5/0900766b80e4e715.pdf (accessed on 9 September 2021).
- Grover, F.W. Inductance Calculations: Working Formulas and Tables; Dover Publications, Inc.: New York, NY, USA, 1946. [Google Scholar]
- Krile, J.; Neuber, A.; Dickens, J.; Krompholz, H. DC and Pulsed Dielectric Surface Flashover at Atmospheric Pressure. IEEE Trans. Plasma Sci. 2005, 33, 1149–1154. [Google Scholar] [CrossRef]
- Liu, T.; Timoshkin, I.V.; MacGregor, S.J.; Wilson, M.P.; Given, M.J.; Bonifaci, N.; Hanna, R. Field-Time Breakdown Characteristics of air, N₂, CO₂, and SF₆. IEEE Trans. Plasma Sci. 2020, 48, 3321–3331. [Google Scholar] [CrossRef]
- Dick, A.R.; Macgregor, S.J.; Buttram, M.T.; Pate, R.C.; Rinehart, L.F.; Prestwich, K.R. Breakdown Phenomena in Ultra-Fast Plasma Closing Switches. IEEE Trans. Plasma Sci. 2000, 28, 1456. [Google Scholar] [CrossRef]
- Felsenthal, P.; Proud, J.M. Nanosecond-Pulse Breakdown in Gases. Phys. Rev. 1965, 139, A1796–A1804. [Google Scholar] [CrossRef]
- Martin, T.H. An empirical formula for gas switch breakdown delay. In Proceedings of the 7th Pulsed Power Conference, Monterey, CA, USA, 11–14 June 1989; pp. 73–79. [Google Scholar]
- Kawada, Y.; Sumikazu, S.; Tatsuzo, H. Nanosecond-pulse breakdown of gas-insulated gaps. J. Appl. Phys. 1988, 63, 1877–1881. [Google Scholar] [CrossRef]
- Levko, D.; Arslanbekov, R.; Kolobov, V. Modified Paschen curves for pulsed breakdown. Phys. Plasmas 2019, 26, 064502. [Google Scholar] [CrossRef]
Figure 1.
(a) Schematic diagram of the test cell (not in scale) with the needle-plane electrode configuration; (b) photograph of the gramophone needle tip with ~80µm radius under the microscope.
Figure 1.
(a) Schematic diagram of the test cell (not in scale) with the needle-plane electrode configuration; (b) photograph of the gramophone needle tip with ~80µm radius under the microscope.

Figure 2.
Experimental arrangement, incorporating Blumlein-based HV pulse generator, test cell and diagnostic devices.
Figure 2.
Experimental arrangement, incorporating Blumlein-based HV pulse generator, test cell and diagnostic devices.

Figure 3.
Voltage and current waveform for breakdown event in air (304 kPa). Ubr-ch and tbr are shown in this figure.
Figure 3.
Voltage and current waveform for breakdown event in air (304 kPa). Ubr-ch and tbr are shown in this figure.

Figure 4.
RLC lumped-element model of the Blumlein generator and the test cell.

Figure 5.
Impulse voltage waveform across the needle-plane electrode system, obtained by the model shown in Figure 4. The charging voltage applied to the Blumlein generator was 10 kV.
Figure 5.
Impulse voltage waveform across the needle-plane electrode system, obtained by the model shown in Figure 4. The charging voltage applied to the Blumlein generator was 10 kV.

Figure 6.
The magnitude of the electric field in the needle-plane topology. The radius of the needle is 80 µm, the gap spacing is 100 µm. The needle is stressed with 10 kV.
Figure 6.
The magnitude of the electric field in the needle-plane topology. The radius of the needle is 80 µm, the gap spacing is 100 µm. The needle is stressed with 10 kV.

Figure 7.
The breakdown voltage, Ubr-ch, as function of tbr, negative polarity: ☐—air; ○—N2; △—CO2. Dashed lines show fitting curves for each gas obtained by Equation (3).The error bars show the 95% confidence interval in the breakdown voltage and time to breakdown.
Figure 7.
The breakdown voltage, Ubr-ch, as function of tbr, negative polarity: ☐—air; ○—N2; △—CO2. Dashed lines show fitting curves for each gas obtained by Equation (3).The error bars show the 95% confidence interval in the breakdown voltage and time to breakdown.

Figure 8.
The breakdown voltage, Ubr-ch, as function of tbr, positive polarity: ■—air; ●—N2; ▲—CO2. Solid lines show fitting curves for each gas obtained by Equation (3). The error bars show the 95% confidence interval in the breakdown voltage and time to breakdown.
Figure 8.
The breakdown voltage, Ubr-ch, as function of tbr, positive polarity: ■—air; ●—N2; ▲—CO2. Solid lines show fitting curves for each gas obtained by Equation (3). The error bars show the 95% confidence interval in the breakdown voltage and time to breakdown.

Figure 9.
Field-time breakdown characteristic for different gases. Kinetic model, Equation (5), Ntf as a function of E/N: air, dotted line; N2, solid dark line; CO2, solid gray line; SF6, dashed line. Experimental results obtained in the present work, Ntbr as a function of Etip/N: air, ☐—negative polarity, ■—positive polarity; N2, ○—negative polarity, ●—positive polarity; CO2, △—negative polarity; ▲—positive polarity.

Figure 10.
(a) Etip/N as a function of Nd in air. Experimental data, present work: ○—negative polarity; ●—positive polarity; experimental data, literature: △—negative polarity (monocone) [24]; ▲—positive polarity (monocone) [24]; ☐—[23]; solid line, fitting curve, Equation (6). (b) Etip/N as a function of Nd in N2. Experimental data, present work: ○—negative polarity; ●—positive polarity; experimental data, literature: △—negative polarity (point-plane) [24]; ▲—positive polarity (point-plane) [24]; ■—[10]; ☐—[35]; solid line, fitting curve Equation (6). (c) Etip/N as a function of Nd in CO2. Experimental data, present work: ○—negative polarity; ●—positive polarity; experimental data [11]: △—negative polarity; ▲—positive polarity; solid line, fitting curve Equation (6).


Figure 11.
(a) Field-time breakdown characteristics for in air. Experimental data, present work, Ntbr (Etip/N): ○—negative polarity; ●—positive polarity. Fitting curves obtained: dash dotted line, Equation (7). Experimental data from the literature: △—negative polarity (monocone) [24]; ▲—positive polarity (monocone) [24]; × —[23]; ◇—[22]; ☐—[36]; dashed line [37]; analytical data, Ntf (E/N), from the literature: ■—drift-diffusion model [34]; solid dark line, kinetic model Equation (5). (b) Field-time breakdown characteristics for in N2. Experimental data, present work, Ntbr (Etip/N): ○—negative polarity; ●—positive polarity. Fitting curves: dash dotted line, Equation (7). Experimental data from literature: △—negative polarity (point-plane) [24]; ▽—negative polarity (monocone) [24]; ▲—positive polarity (point-plane) [24]; ▼—positive polarity (monocone) [24]; ×—[23]; ◇—[22]; ☐—[36]; dashed line [37]; analytical data, Ntf (E/N), from literature: ■—drift-diffusion model [34]; solid dark line, kinetic model Equation (5), Ntf as a function of E/N. (c) Field-time breakdown characteristics for CO2. Experimental data, present work, Ntbr (Etip/N): ○—negative polarity; ●—positive polarity. Fitting curves, dash dotted line, Equation (7). Experimental data from literature: △—negative polarity (rod-plane) [11]; ▲—positive polarity (rod-plane) [11]; dashed line [37]; analytical data, Ntf (E/N), from the literature: ■—drift-diffusion model [34]; solid dark line, kinetic model Equation (7).


Table 1.
Parameters A and B for fitting function (3) for air, N2 and CO2 for negative and positive polarity.
Table 1.
Parameters A and B for fitting function (3) for air, N2 and CO2 for negative and positive polarity.
| Ubr-ch = A · (tbr)−B | |||
|---|---|---|---|
| Negative polarity | Air | N2 | CO2 |
| A | 7.09 · 104 | 4.24 · 104 | 5.37 · 105 |
| B | 2.55 | 2.42 | 3.07 |
| Positive polarity | Air | N2 | CO2 |
| A | 6.88 · 1010 | 8.54 · 108 | 5.75 · 1015 |
| B | 6.89 | 5.55 | 10.20 |
Table 2.
Parameters C and D for fitting function (6) for air, N2 and CO2.
| Etip/N = C · (Nd)−D | |||
|---|---|---|---|
| Air | N2 | CO2 | |
| C | 4.51 · 1015 | 1.02 · 1017 | 5.08 · 1016 |
| D | 0.56 | 0.63 | 0.61 |
Table 3.
Fitting parameters K and M for Equation (7) in air, N2 and CO2.
| Ntbr = K · (Etip/N)−M | |||
|---|---|---|---|
| Air | N2 | CO2 | |
| K | 5.78 · 1022 | 8.05 · 1022 | 1.59 · 1023 |
| M | 1.35 | 1.38 | 1.44 |
Publisher’s Note: MDPI stays neutral with regard to jurisdictional claims in published maps and institutional affiliations. |
© 2021 by the authors. Licensee MDPI, Basel, Switzerland. This article is an open access article distributed under the terms and conditions of the Creative Commons Attribution (CC BY) license (https://creativecommons.org/licenses/by/4.0/).
Share and Cite
MDPI and ACS Style
Liu, T.; Timoshkin, I.; Wilson, M.P.; Given, M.J.; MacGregor, S.J. The Nanosecond Impulsive Breakdown Characteristics of Air, N2 and CO2 in a Sub-mm Gap. Plasma 2022, 5, 12-29. https://doi.org/10.3390/plasma5010002
AMA Style
Liu T, Timoshkin I, Wilson MP, Given MJ, MacGregor SJ. The Nanosecond Impulsive Breakdown Characteristics of Air, N2 and CO2 in a Sub-mm Gap. Plasma. 2022; 5(1):12-29. https://doi.org/10.3390/plasma5010002
Chicago/Turabian StyleLiu, Ting, Igor Timoshkin, Mark P. Wilson, Martin J. Given, and Scott J. MacGregor. 2022. "The Nanosecond Impulsive Breakdown Characteristics of Air, N2 and CO2 in a Sub-mm Gap" Plasma 5, no. 1: 12-29. https://doi.org/10.3390/plasma5010002