
Diagnostics of Air Purification Plasma Device by Spatially Resolved Emission Spectroscopy


School of Chemical Engineering and Advanced Materials, The University of Adelaide, Adelaide, SA 5005, Australia
*
Author to whom correspondence should be addressed.
Plasma 2022, 5(2), 206-220; https://doi.org/10.3390/plasma5020016
Submission received: 16 February 2022
/
Revised: 7 April 2022
/
Accepted: 19 April 2022
/
Published: 26 April 2022
Abstract
:A non-thermal plasma, air purification device (PlasmaShield®, MD250, Keswick, SA, Australia), was investigated using spatially resolved optical emission spectroscopy. The emission spectra were measured with two spatial dimensions to analyze and identify the transition lines of excited NO–γ (A2Σ–X2Π), N2 (C3Π–B3Π), and N2+ (B2Σ–X2Σ) systems. The N2 emission band at 337 and 316 nm were used to determine the spatially resolved vibrational temperature of N2 molecules, . It was found that the average N2 vibrational temperatures in the x and y directions are almost the same. Two key operating parameters, supplied power and air flow, influence the N2 vibrational temperature. The results demonstrate that applying higher supplied power increases the vibrational temperature, while changes in air flow velocity do not affect the vibrational temperature values. The phenomenological plasma temperature (PPT) was also estimated from the N2 vibrational temperature. It was observed that PlasmaShield® generates excited N2 and NO only within a narrow region around the discharge electrode tip (with peak intensity below 100 µm from the tip). The study also shows no presence of excited OH*, O*, and other radicals.
1. Introduction
Non-thermal plasma is a cutting-edge low-temperature technology that has been used in a range of biomedical and chemical applications such as the treatment of chronic wounds and cancer, tissue regeneration, and decontamination [1,2,3,4]. In recent years, non-thermal plasma technology has also been used to remove airborne contaminants in order to improve indoor air quality and bio-decontamination [5,6,7,8,9]. In terms of bio-decontamination, the technology has the capability to destroy microorganisms, including but not limited to harmful bacteria and viruses, by the methods such as electron beam irradiation and irreversible electroporation. It has the advantages of high efficiency of purification, short action time, with few side effects on the environment.
Specifically, non-thermal plasma is typically generated by electrical discharging under a high electric field. For air environment at atmospheric pressure, atomic species such as N(2D), N(4S), N(2P), O(3P), O(1D), and O(1S) can present in their electronic ground or excited-state through excitation, ionization, and dissociation processes [10]. These metastable species recombine and can directly collide with electrons to produce a large amount of reactive molecular species such as N2, , radicals such as NO, OH, and others. In order to restabilize, the reactive species act as electron acceptors or donors to effectively neutralize airborne contaminants, which plays a significant role in air purification. In detail, three main processes should be taken into consideration when using non-thermal plasma for air purification: (1) plasma irradiation provides sufficient energy to cleave chemical bonds in airborne contaminants and break down their structure into small molecules such as CO2, N2, and H2O. This enables the effective reduction of odorous compounds, volatile organic compounds (VOCs), and related compounds in the air [9,10]; (2) the fine airborne particles are charged by the electrons and ions in the plasma region, causing the particles to agglomerate and form larger clusters, which are then captured by an air filter [9]; (3) reactive species, such as OH, , and NO, are generated in the plasma and react with pathogens, altering their surface structure. Afterward, the species can further inactivate the harmful microorganisms by destroying the internal content at the DNA level [11,12,13,14,15]. In fact, reactive oxygen and nitrogen species produced by plasma also play key roles in sterilization and decontamination [16,17,18]. Compared with the plasma discharge in noble gases, such as helium and argon, atmospheric pressure plasma is more economical and efficient, although performance data are not broadly available; therefore, a better understanding of the reactive oxygen and nitrogen species will reveal more information about the plasma-microorganism interactions.
To obtain quantitative information about the species, optical emission spectroscopy is applied as a non-intrusive method to track changes in the plasma composition. It can analyze the excited-state atoms and molecules, the levels of non-equilibrium, and the temperatures of gases and electrons [19,20,21]. UV-visible emission spectroscopy can also identify the excited molecules and radicals during the chemical process. It is important for a better understanding of the mechanisms of species formation [22]. Furthermore, spatially resolved emission spectroscopy can provide evaluations of electron density distribution and measurement of the active plasma size, which can be used for plasma shielding and to characterize the physical mechanism of non-thermal plasma in purification processes [19].
As mentioned above, plasma characteristics have significant effects on its purification capability. Thus, developing a device with suitable plasma features is of high importance in plasma-based air purification technology. Plasma Shield Ltd. has recently manufactured a medical-grade air treatment system that can be integrated into a building’s Heating, Ventilation, and Air Conditioning (HVAC) system, aimed at the effective destruction of harmful microorganisms, elimination of VOCs, and removal of airborne particles [23]. It uses a corona discharge device to produce a plasma region. A high-intensity electric field and low-energy electron beam irradiation are generated inside the device. The electron beam irradiation inactivates viruses and microorganisms by damaging their nucleic acid, while the reactive oxygen and nitrogen species further penetrate bacteria and viruses through diffusion [24,25,26]. In addition, by adding an electric charge to passing particles, the PlasmaShield® device (PlasmaShield®, MD250, Keswick, SA, Australia) is able to collect the fine particles in the air flow and chemically decompose VOCs into harmless compounds. It has recently been evaluated for its ability to inactivate airborne microbes and remove VOCs and related compounds [27,28,29]. It is therefore important to investigate the plasma characteristics generated by PlasmaShield® as a benchmark to correlate the generated plasma field and its performance.
This study aims to characterize the plasma-induced reactive species produced by the PlasmaShield® Air Purification Device using spatially resolved optical emission spectroscopy. The emission spectra were collected near the tips of the discharge electrodes and further used to identify the reactive nitrogen species. The emission spectra were analyzed with respect to wavelength and two spatial dimensions. The vibrational temperature of N2 molecules, , was also evaluated based on the transition lines of excited N2.
2. Materials and Methods
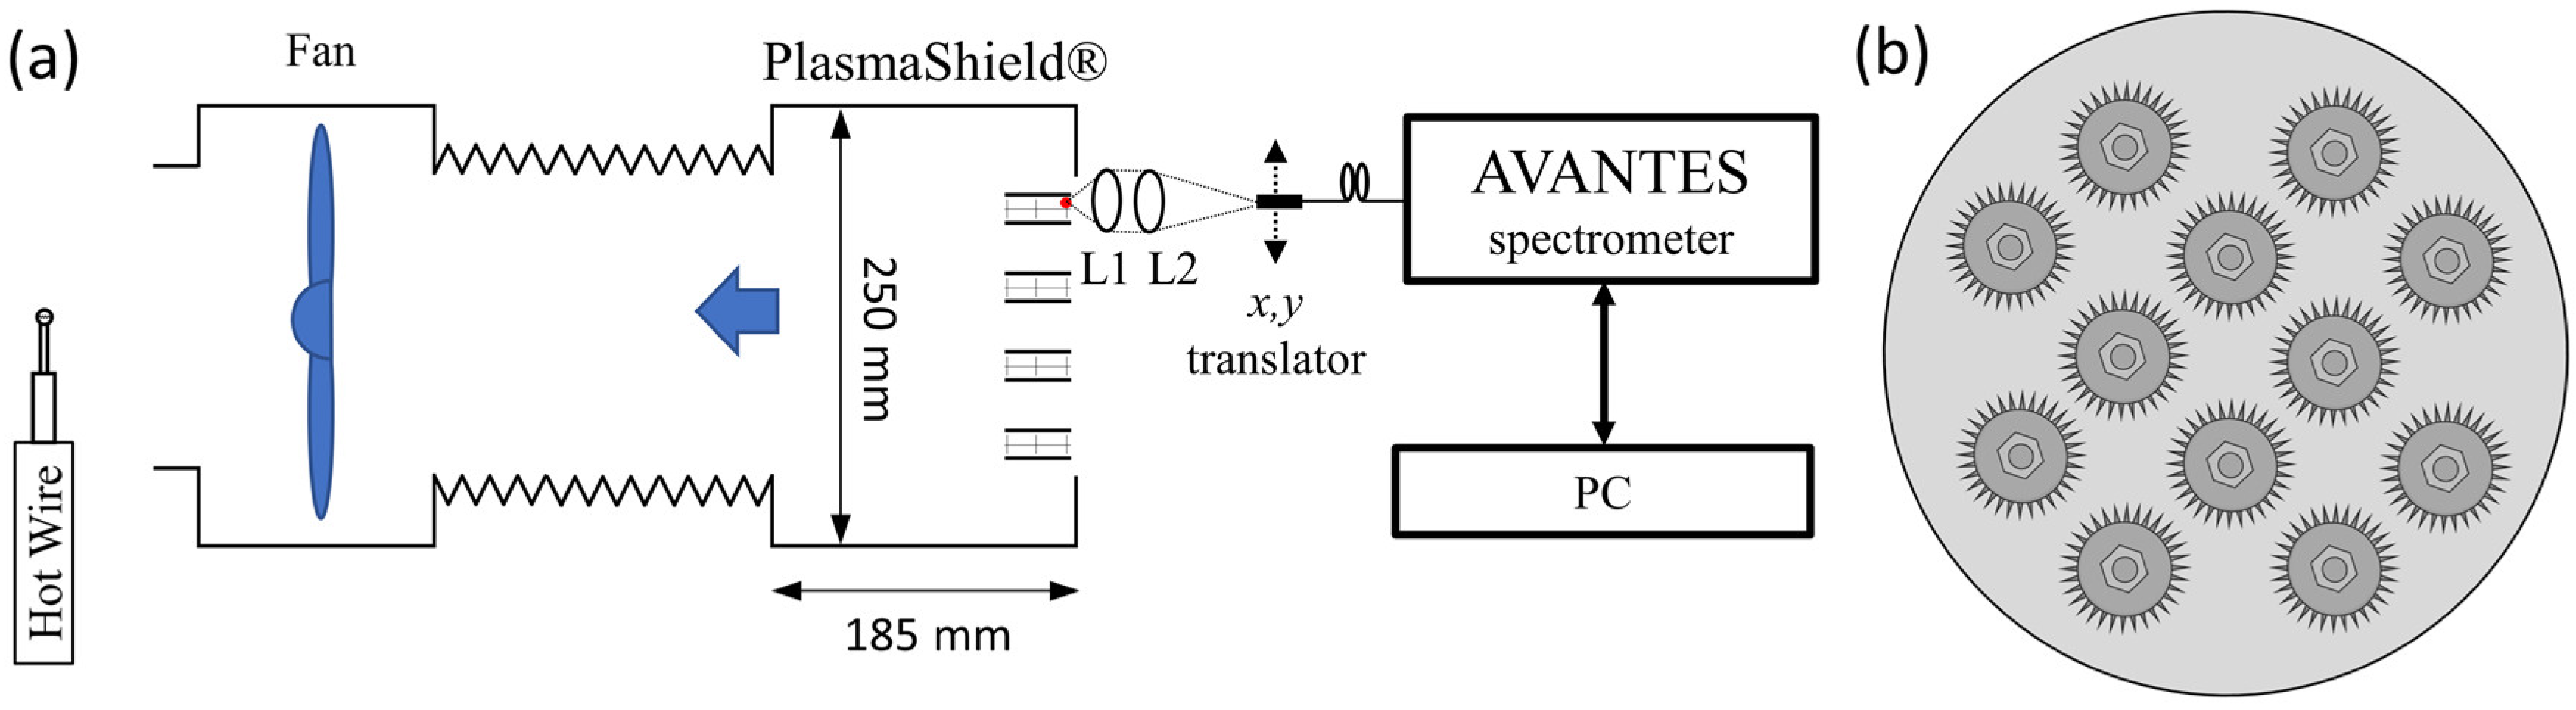
The experimental setup is outlined in Figure 1. PlasmaShield® Air Purification Device (PSAPD) was connected to an extraction fan, Blauberg Turbo 250G, to control the air flow. Air, at ambient temperature and pressure, was used as the main working fluid. The axial velocity of the air flow was measured by a calibrated hot wire, Testo 405i. The PSAPD consists of 12 cylindrical cells with multi-layered discharge arrays. Each cell is ~80 mm long and consists of round-shape metal with its external circumference engineered to form 60 rectangular sharp ~2 mm-long tips, as shown in Figure 2a. High voltage, up to 10 kV, was applied between the outside of the cell and the tips to create and sustain the non-thermal plasma. Figure 2c shows a typical plasma from a single tip, which was recorded with a digital photographic camera (Nikon D750, Nikon Hong Kong Ltd., Hong Kong, China) and Tamron 90 mm macro lens (Tamron, Saitama, Japan) with an appropriate extension tube.
The plasma emission from a single tip was collected by a fused silica lens (f = +50 mm). To increase the spatial resolution, a fused silica lens with a focal length of +100 mm, was used to double the image of the plasma on the entrance of a fiber optic cable (Thorlabs, BFL200HS02, Newton, NJ, USA). The fiber entrance was mounted on an x, y, z mechanical translation stage with a 1 mm spatial resolution in x-, y-, and z-coordinates. The other end of the optical fiber was attached to a USB spectrometer (Avantes, ULS2048-RS-EVO, Apeldoorn, The Netherlands), having diffraction grating with 300 grooves/mm, and equipped with a 25 µm entrance slit. The spectral resolution of the spectrometer is 1.4 nm. Two emission spectra were recorded and averaged at a fixed exposure time of 2 s. The fiber optic head was scanned in the x (horizontal) and y (vertical) directions, as shown in Figure 2b. Emission spectra were recorded at each location. The plus sign is defined as the position above the tip, while the minus sign denotes the position below the tip.
3. Results and Discussion
Figure 3 shows a typical emission spectrum, recorded at an air flow velocity of 1.6 m∙s−1, at x and y values of 0 and 19 µm, respectively. The spectrometer was set to record the spectrum in long scan mode from 200 to 800 nm. As expected with non-equilibrium air plasma at ambient temperature and pressure, the signals are mainly observed in the region from 200 to 450 nm dominated by emission from electronically excited NO* to spectra. The spectra show no presence of excited OH*, O*, or other radicals.
To estimate the spectral changes over location, Figure 4a shows a typical example of the spatially resolved emission spectra between 200 to 400 nm wavelength. The spectra were recorded at a fixed horizontal location (x = 0) along the vertical direction from −85 to 140 μm with a spatial resolution of 5 μm. The peaks observed in the 300–380 nm region are attributed to the N2 (C3Π–B3Π) system. The emission at 337 nm, which represents the transition of C3Π–B3Π (0–0), shows the strongest intensity at the same y location compared to the other N2 (C3Π–B3Π) signals. The line intensity at 337 nm attains the maximum at the location of −50 μm and gradually decreases along the +y direction.
NO (A2Σ–X2Π) signals are only observed at the position just above the tip, 0–50 μm, which is highlighted in the red circle in Figure 4a and presented in Figure 4b with a higher spatial resolution of 2.5 μm. According to the high-resolution scan of the NO spectra, the peak with the highest intensity measured at 226 nm is attributed to the transition of A2Σ–X2Π (0–0), and the line intensity reaches the maximum at the location near 25 μm above the tip and then attenuates along the ±y direction.
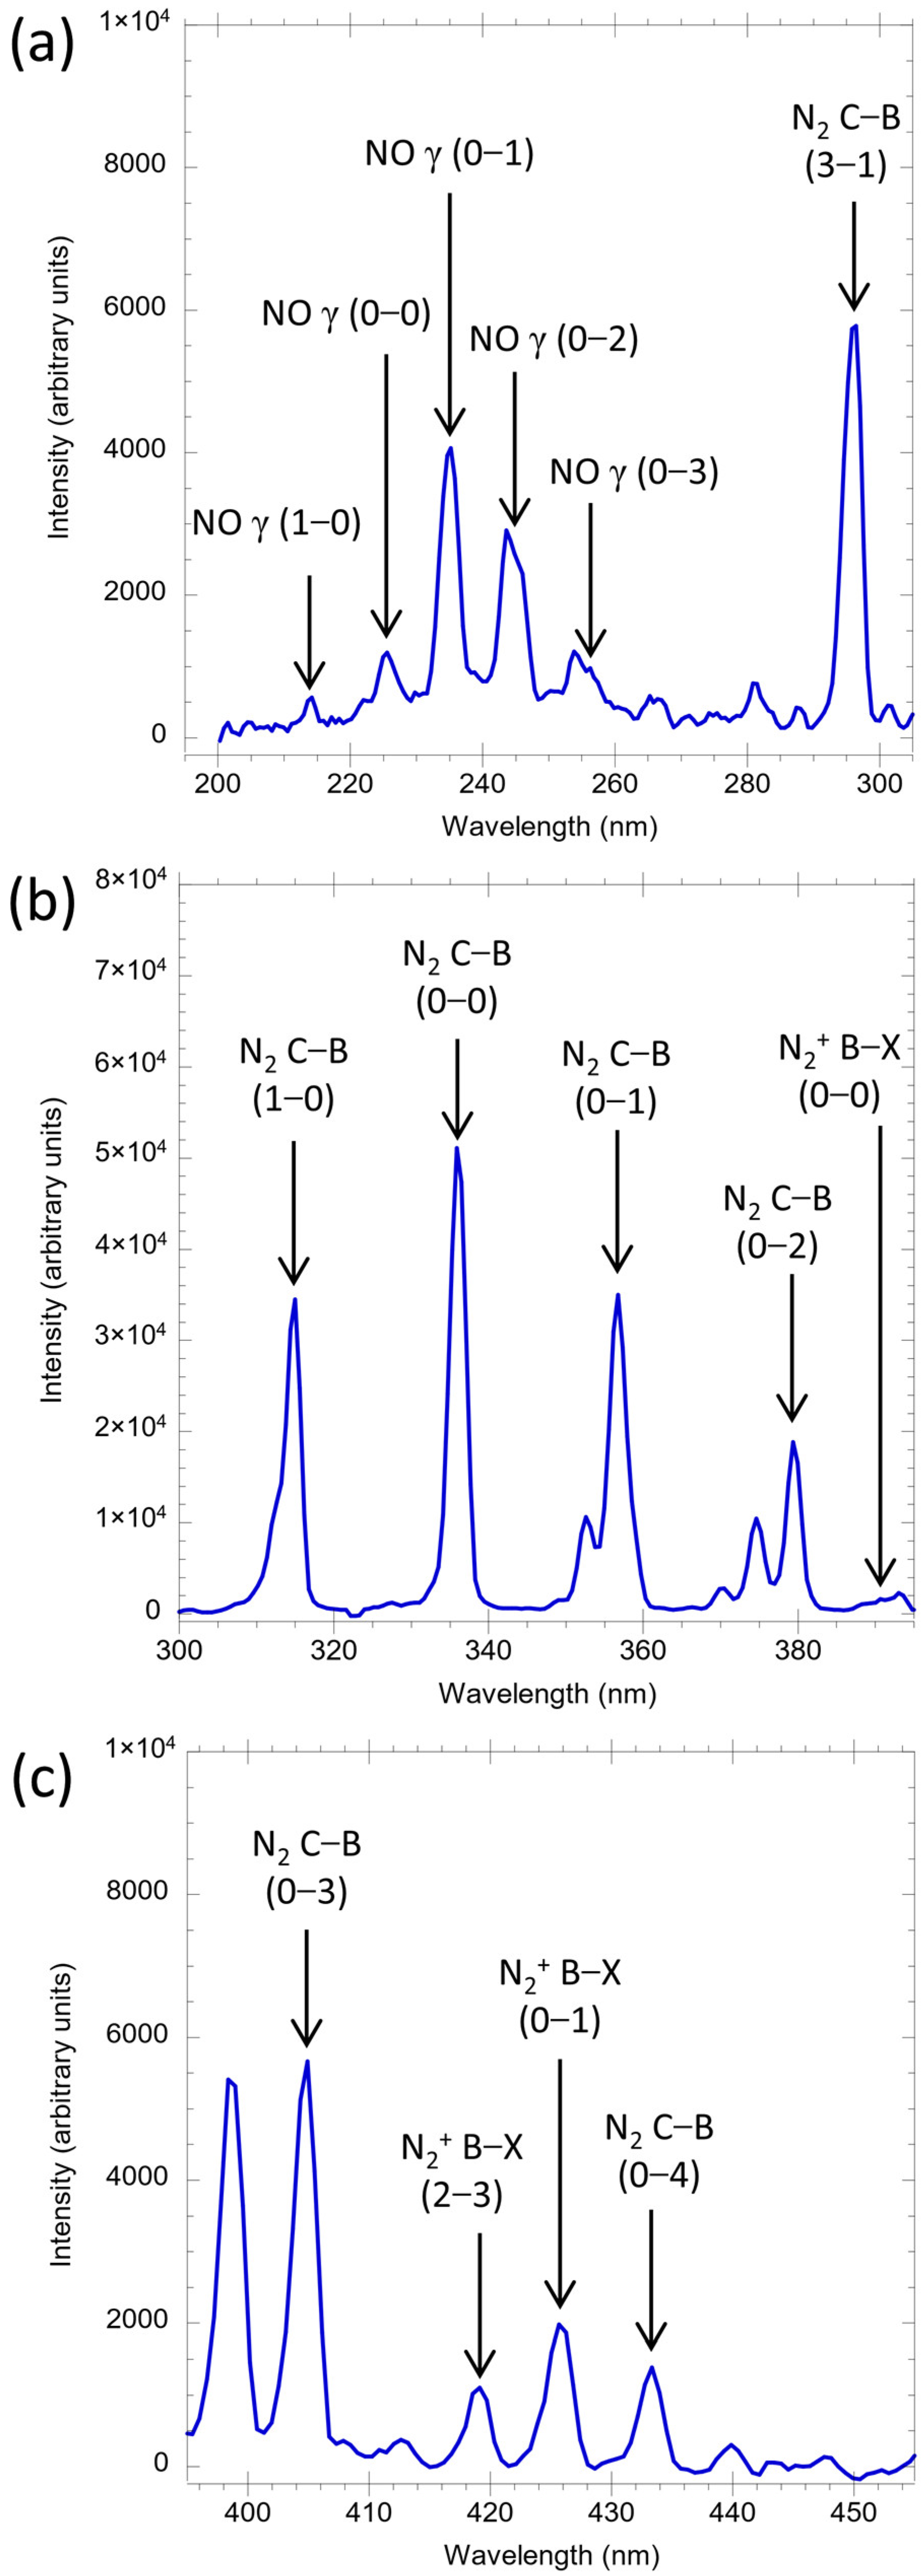
In order to extract the spectroscopic characteristics of the N2 and NO groups, the emission spectrum is divided into three individual regions, which are (a) 200–300 nm, (b) 300–390 nm, and (c) 400–450 nm for the visualization and the assignment of each known transition line. As shown in Figure 5a, the emission spectrum of air plasma shows clear peaks at 214, 226, 235, 245, and 256 nm, which are attributed to the NO–γ system (A2Σ–X2Π). The highest intensity is found at the transition band of (0–1) at 235 nm. The NO species are predominantly formed in the N2 discharge and are often detected in air plasma. NO formation is attributed to the reaction of the excited N and O species. NO acts as a free radical because of an unpaired electron in the 2p orbital. Thus, it is expected that NO can react with bacteria and viruses and damage their structure, resulting in an inhibition of their activities.
In Figure 5b,c, the predominant excited species are N2 species containing a second positive system. The spectra show relatively strong intensity at 296, 316, 337, 357, 380, 404, and 433 nm, which are assigned to the transitions of N2 C3Π–B3Π. The highest intensity is at 337 nm. The peaks of nitrogen ions, , first negative system (B2Σ–X2Σ) are also observed at 391, 419, and 427 nm with relatively weak intensity. The observed shows the existence of energetic electrons and a high level of non-equilibrium. The energetic plays a crucial role in air purification by affecting the process of excitation, dissociation, and ionization.
Table 1 presents the identified NO, N2, and transition bands with their corresponding emission wavelengths and Franck–Condon factors. The Franck–Condon factor indicates the transition probability between the upper and lower energy states. These factors are used to calculate N2 vibrational temperature. Two N2 transition lines at 316 and 337 nm were used to determine the N2 vibrational temperature.
Figure 6 presents a schematic diagram with the characteristic transition system of N2 and . The emission wavelengths are labeled on the top of each transition arrow. As shown in the figure, the transitions of (B2Σ–X2Σ) at 391, 419, and 427 nm are assigned to the transition bands (0–0), (2–3), and (0–1), respectively. The electronic state energy of is much higher than that of N2. The observed N2 (C3Π–B3Π) peaks corresponding to the wavelength of 337, 357, 380, 404, and 433 nm are assigned to the transitions from C3Π to five consecutive lower vibrational levels of the B3Π state, which are (0–0), (0–1), (0–2), (0–3), and (0–4), respectively. The highest line intensity observed at 337 nm in Figure 5 is because of the large gap between its upper and lower states compared with the other transitions. Although the transition energy of 296 and 316 nm are also high, the insufficient molecular population at these transitions makes their line intensities lower than 337 nm. It is notable that all the excited states are at an energy level above 56,000 cm−1 compared to the ground state. This implies that the excited N2 favors the production of O atoms as O–O bond dissociation of O2 requires only 410,000 cm−1 [31]. These O atoms can then couple with N species and produce NO, which is in agreement with the previous finding shown in Figure 5a.
Figure 7a clearly shows the line intensity of the N2 second positive system (C3Π–B3Π) along the y direction, where the top of the tip is referred to as the location of x = 0 and y = 0. When increasing the value of y, the intensity becomes lower. This phenomenon can be clearly observed in the added plasma photograph in Figure 2c as well. The high line intensity is observed at the location around −75 and 100 µm in the y direction. These two outwards peaks define the boundary of the plasma sphere.
It is interesting to note that there are three local maxima. For example, for N2 emission at 337 nm, the three local maxima appear at −65, 30, and 65 µm. The center one, located at y = ~30 µm, represents the strong electric field above the center of the tip. The other two maxima, at the left and the right, represent the strong eclectic fields at the edge of the side of the tip. It is worth noting that the profile of the tip is not conical but rectangular.
Figure 7b shows the line intensity of the N2 second positive system (C3Π–B3Π) along the x direction. This horizontally scanned emission intensity was recorded at the vertical location of 50 µm under the tip (y = −50 µm). The highest line intensity is observed at the location around −75 and 75 µm in the x direction. As seen in the horizontal scan, there are two more central peaks, which again represent the local plasma near the left and right sides of the tips. For example, for N2 emission at 337 nm, these two peaks appear at −30 and 35 µm. As this scan was performed under the tip, it also confirms that the plasma is not located on the top of the tip but engulfs the tip, as seen in Figure 2c. The insert images in Figure 7a,b show the scan directions in the plasma, which can illustrate the changes in intensity clearly.
It was observed that the emission spectrum with a shorter wavelength, generated from the higher energy state, is more central compared to that with a longer wavelength. This indicates the temperature gradient within the plasma core. To be able to understand this further, a spatially resolved vibrational temperature of N2 molecules, , was evaluated using two vibronic transitions. Emissions from the NO (A2Σ–X2Π) or N2 second positive system (C3Π–B3Π) can be used to evaluate the temperature. It was decided to use the N2 second positive system (C3Π–B3Π) for three reasons: (1) the signals of NO (A2Σ–X2Π) (1–0) and (0–0) are very weak; (2) NO is only present at a very small zone (see Figure 4b); (3) more importantly, the NO (A2Σ–X2Π) (0–0) transition is coupled with the electronic ground state, which means a significant absorption from the plasma may occur.
The spectra of the N2 second positive system are widely used in air plasma diagnostics as they enable the determination of vibrational temperature, . It is worth noting that the usually returns higher values than the rotational temperature, Trot, method [32]; however, the trend of the is valid [33]. It is useful for spatially resolved temperature measurement studies to include the . This is to indicate the spatial locations of the higher and lower temperate values to produce an indicative temperature profile. The light intensity at a certain wavelength is proportional to the population of gas molecules corresponding to a particular transition. It is expressed as follows:
where Iλ represents the intensity at wavelength, λ; Nν is the population of N2 molecules corresponding to the ν state; FCF is the Franck–Condon factor. It is common practice to satisfy the local thermal equilibrium (LTE) condition to characterize the entire plasma by a single temperature value. When the plasma has not reached thermalization, then the plasma temperature is not the same at all locations and at every time. In such a case, the plasma cannot be characterized by a single temperature value.
For non-thermal plasma, the local thermal equilibrium (LTE) condition is not satisfied in the entire plasma. This is because the plasma temperature is not the same at all locations and at all times. In this study, a tiny area, 19.6 µm2, was spectroscopically analyzed at a fixed sampling time. The fixed sampling time was set at 2 s, which is significantly higher than the state relaxation time, capturing the variation in the state density [34]. We will see later that each section will yield a different .
To obtain , the relationship between the population distribution of gas molecules and vibrational temperature is written as:
where Eν represents the energy of the vibronic state with ν quantum number; kB is Boltzmann constant.
Applying Equation (2) for ν = 0 and ν = 1 in the N2 second positive system (C3Π–B3Π) and solving for temperature yields:
where Iλ1 and Iλ2 are the emission intensities of the transitions at λ1 and λ2; Eν1 and Eν2 are the energy of the upper energy levels; FCF is the Frank–Condon factor.
Using the appropriate values of λ1, λ2, Eν1, Eν2, FCFλ1 and FCFλ2, namely 337 nm, 316 nm, 88,957 cm−1, 90,893 cm−1, 0.455, and 0.388, respectively, Equation (3) is simplified to:
Equation (4) was used to evaluate the spatially resolved in the x and y directions, as shown in Figure 7c,d. Due to the resolution of the spectrometer, the maximum number of recorded points within one transition is 20. Therefore, the wavelength associated with maximum intensity will not be captured accurately. This translates to a ~3% error in the maximum intensity of one given transition. Because of this, there will be a ~8% error on the evaluated .
As stated previously, the Tvib does not represent the plasma temperature, but Trot does. This is because the rotational relaxation time for atmospheric pressure plasma is very fast [33]. Zhang et al. varied the plasma temperature in a quartz tube by changing the working pressure on N2 gas. They measured both Tvib and Trot at different pressure [35]. They found that the values of Tvib are ~eight times larger than Trot, which is closely related to the plasma temperature. To obtain a meaningful measurement of the recorded values, we scaled the by a constant factor, eight, to reach a phenomenological plasma temperature (PPT).
Figure 7c,d show the derived and the PPT distributions along with the x and y directions using N2 transition lines. To be specific, in the y direction, the highest below the tip and above the tip appear at −50 and 80 μm, as 6800 and 5800 K, respectively. In the near-tip region of 0 to 50 μm, the distribution is stable, around 3200 K. In the x direction, the peak is at −65 μm. The outside two maxima, at the left and the right, represent the strong electric fields at the edge of the side of the tip. At the center of the tip, the appears uniform.
To investigate the influence of the supplied power, Figure 8a,b show the relationship between the line intensity and the supplied power, recorded at x and y of 0 and 25 µm, respectively. The line intensity of the N2 second positive system increases gradually with the supplied power. For example, at 50% of the maximum supplied power, the line intensity at 337 nm is around 1500 K, while this value approaches 4000 K when the supplied power increases to 80% of the maximum. This signal enhancement is contributed to the increased electric field, which generates an intense plasma and allows more N2 species to be excited from the ground state to the higher energy state.
Figure 8c presents the effect of the supplied power on the and PPT. Both and PPT present a linear increasing trend with the increase in supplied power and reach the highest value of 3400 K when the supplied power is at 80% of the maximum. As mentioned in Equation (2), the population of N2 in excited states is highly correlated to the . The dependence of on supplied power provides evidence that a larger population of N2 is excited under higher supplied power. In addition, because the intensity of N2 lines is also proportional to the population of N2 in excited states, a higher supplied power can lead to a higher line intensity and a higher and PPT simultaneously, which is supported by the findings in Figure 8a,b.
The values of on the and the PPT versus the air flow velocity, recorded at x and y of 0 and 25 µm, were investigated. Figure 9 shows the as a function of the air velocity from 0 to 1.6 m∙s−1. As shown in the figure, there is no significant correlation between the and the velocity of the air flow. The values, recorded at x and y of 0 and 25 µm, are maintained at approximately 3000 K under different air flow conditions. Therefore, the effect of air flow velocity on and PPT can be neglected.
Figure 10 shows the line intensity of NO and its corresponding temperature along the x and y directions. In the x direction, a strong emission of NO is observed at the location of x = 0 µm, while in the y direction, NO emission increases in the near-tip region and quickly reaches the maximum at y = 22 µm. The FWHM of the signal profile is around 26 µm in both directions. It is worth noting that the location of the maximum NO proceeds the location of N2 maxima by ~10 µm.
Although the direct measurement of the electron density in air plasmas is challenging, the spatial-resolved emission profile of the excited NO species can be used as an indication of electron density and to determine the discharge diameter [19,20]. Despite these findings, NO species may exist at a lower concentration below the detection limit in other parts of the plasma reactor or in a ground state or other system, not the A2Σ–X2Π system.
Additionally, the values of PPT at the location where NO was detected along the x and y direction are indicated by the black lines in Figure 10. The average values of PPT are around 433 K in both x and y directions. The similar emission profiles and PPT values imply that the excited NO population and the distribution of electron density are spatially symmetric. The peak temperature values measured represent the strong eclectic fields at the edge of the tip, which is consistent with the results shown in Figure 7c,d. The NO spatial distribution profiles indicate that the production radius of NO is ~13 μm. As the PPT is relatively constant, it suggests that the limiting factor is the presence of O atoms. The observed trends indicate that O atoms are consumed at y = ~26 μm.
4. Conclusions
The PlasmaShield® Air Purification Device was experimentally evaluated using spatially resolved optical emission spectroscopy for the generation of reactive nitrogen species. The emission spectra were analyzed for vibrational transition lines along the x and y directions. The signals at 214, 226, 235, 245, and 256 nm are attributed to the NO–γ system (A2Σ–X2Π), while the line intensities observed at 296, 316, 337, 357, 380, 404, and 433 nm are assigned to the transition of N2 second positive system (C3Π–B3Π). In addition, the first negative system (B2Σ–X2Σ) is at 391, 419, and 427 nm. The highest line intensity of the N2 system is at 337 nm with the location of y = −75 μm below the tip, while the highest intensity of NO is at 235 nm with y = 25 μm above the tip.
Two N2 transition lines at 316 and 337 nm were used to determine the in two dimensions. Two peaks, namely 6800 and 5800 K, are observed below the tip and above the tip appearing at −50 and 80 μm, respectively. In the x direction, the peak temperature is 6600 K at −65 μm. The finding of higher values of Tvib with respect to Trot is common for ionizing plasma [33,36]. By direct comparison, Zhang et al. has shown that the values of Tvib can reach eight times the values of Trot [35].
Although the absolute value of the Tvib is higher than Trot, it is still very important for spatially resolved studies, where 20 different values of are measured within a length of 100 µm. The recorded was converted to PPT as a meaningful measurement for the plasma chrematistics, which is useful in the absence of the high-resolution spectrometer required to resolve the rotational structure needed to measure the plasma temperature.
The effects of supplied power and air flow velocity on were evaluated. An increase in power can lead to a stronger electric field, which allows more nitrogen species to be excited from the ground state to a higher energy state and results in a higher line intensity and simultaneously, whereas air flow velocity does not impact the . The findings of this study indicate no detectable concentration of excited OH*, O*, and other radicals. The results obtained from this study can be used as a benchmark to correlate the plasma field generated by PlasmaShield® and its performance.
Author Contributions
Conceptualization, Z.T.A.; methodology, Z.T.A.; formal analysis, W.Z. and Z.T.A.; investigation, W.Z. and Z.T.A.; writing—original draft preparation, W.Z.; writing—review and editing, W.Z. and Z.T.A.; visualization, W.Z. and Z.T.A.; supervision, Z.T.A. All authors have read and agreed to the published version of the manuscript.
Funding
This research received no external funding.
Acknowledgments
The authors would like to thank Plasma Shield Ltd. for providing the Air Purification Device for the experiment. Newspec Pty Ltd. is acknowledged for providing the USB spectrometer.
Conflicts of Interest
The authors declare no conflict of interest.
References
- Lloyd, G.; Friedman, G.; Jafri, S.; Schultz, G.; Fridman, A.; Harding, K. Gas Plasma: Medical Uses and Developments in Wound Care. Plasma Process. Polym. 2010, 7, 194–211. [Google Scholar] [CrossRef]
- Heinlin, J.; Isbary, G.; Stolz, W.; Morfill, G.; Landthaler, M.; Shimizu, T.; Steffes, B.; Nosenko, T.; Zimmermann, J.; Karrer, S. Plasma applications in medicine with a special focus on dermatology. J. Eur. Acad. Derm. Venereol. 2011, 25, 1–11. [Google Scholar] [CrossRef]
- Keidar, M. Plasma for cancer treatment. Plasma Sources Sci. Technol. 2015, 24, 033001. [Google Scholar] [CrossRef]
- Steinbeck, M.J.; Chernets, N.; Zhang, J.; Kurpad, D.S.; Fridman, G.; Fridman, A.; Freeman, T.A. Skeletal cell differentiation is enhanced by atmospheric dielectric barrier discharge plasma treatment. PLoS ONE 2013, 8, e82143. [Google Scholar] [CrossRef]
- Pankaj, S.K.; Keener, K.M. Cold plasma: Background, applications and current trends. Curr. Opin. Food Sci. 2017, 16, 49–52. [Google Scholar] [CrossRef]
- Filipic, A.; Gutierrez-Aguirre, I.; Primc, G.; Mozetic, M.; Dobnik, D. Cold Plasma, a New Hope in the Field of Virus Inactivation. Trends Biotechnol. 2020, 38, 1278–1291. [Google Scholar] [CrossRef]
- Cheng, C.; Liu, P.; Xu, L.; Zhang, L.Y.; Zhan, R.J.; Zhang, W.R. Development of a new atmospheric pressure cold plasma jet generator and application in sterilization. Chin. Phys. 2006, 15, 1544–1548. [Google Scholar] [CrossRef]
- Xiao, D.; Cheng, C.; Lan, Y.; Ni, G.H.; Shen, J.; Meng, Y.D.; Chu, P.K. Effects of Atmospheric-Pressure Nonthermal Nitrogen and Air Plasma on Bacteria Inactivation. IEEE Trans. Plasma Sci. 2016, 44, 2699–2707. [Google Scholar] [CrossRef]
- Hernandez-Diaz, D.; Martos-Ferreira, D.; Hernandez-Abad, V.; Villar-Ribera, R.; Tarres, Q.; Rojas-Sola, J.I. Indoor PM2.5 removal efficiency of two different non-thermal plasma systems. J. Environ. Manag. 2021, 278 Pt 1, 111515. [Google Scholar] [CrossRef]
- Whitehead, J.C. The Chemistry of Cold Plasma. In Cold Plasma in Food and Agriculture; Academic Press: New York, NY, USA, 2016; pp. 53–81. [Google Scholar]
- Boudam, M.K.; Moisan, M.; Saoudi, B.; Popovici, C.; Gherardi, N.; Massines, F. Bacterial spore inactivation by atmospheric-pressure plasmas in the presence or absence of UV photons as obtained with the same gas mixture. J. Phys. D Appl. Phys. 2006, 39, 3494–3507. [Google Scholar] [CrossRef]
- Yasuda, H.; Miura, T.; Kurita, H.; Takashima, K.; Mizuno, A. Biological Evaluation of DNA Damage in Bacteriophages Inactivated by Atmospheric Pressure Cold Plasma. Plasma Process. Polym. 2010, 7, 301–308. [Google Scholar] [CrossRef]
- Lai, A.C.K.; Cheung, A.C.T.; Wong, M.M.L.; Li, W.S. Evaluation of cold plasma inactivation efficacy against different airborne bacteria in ventilation duct flow. Build. Environ. 2016, 98, 39–46. [Google Scholar] [CrossRef]
- Zhou, P.; Yang, Y.; Lai, A.C.K.; Huang, G.S. Inactivation of airborne bacteria by cold plasma in air duct flow. Build. Environ. 2016, 106, 120–130. [Google Scholar] [CrossRef]
- Bourke, P.; Ziuzina, D.; Han, L.; Cullen, P.J.; Gilmore, B.F. Microbiological interactions with cold plasma. J. Appl. Microbiol. 2017, 123, 308–324. [Google Scholar] [CrossRef] [Green Version]
- Yang, X.; Chang, X.; Tei, R.; Nagatsu, M. Effect of excited nitrogen atoms on inactivation of spore-forming microorganisms in low pressure N2/O2 surface-wave plasma. J. Phys. D Appl. Phys. 2016, 49, 235205. [Google Scholar] [CrossRef]
- Laroussi, M.; Leipold, F. Evaluation of the roles of reactive species, heat, and UV radiation in the inactivation of bacterial cells by air plasmas at atmospheric pressure. Int. J. Mass Spectrom. 2004, 233, 81–86. [Google Scholar] [CrossRef]
- Kolb, J.F.; Mohamed, A.A.H.; Price, R.O.; Swanson, R.J.; Bowman, A.; Chiavarini, R.L.; Stacey, M.; Schoenbach, K.H. Cold atmospheric pressure air plasma jet for medical applications. Appl. Phys. Lett. 2008, 92, 241501. [Google Scholar] [CrossRef] [Green Version]
- Machala, Z.; Janda, M.; Hensel, K.; Jedlovsky, I.; Lestinska, L.; Foltin, V.; Martisovits, V.; Morvova, M. Emission spectroscopy of atmospheric pressure plasmas for bio-medical and environmental applications. J. Mol. Spectrosc. 2007, 243, 194–201. [Google Scholar] [CrossRef]
- Laux, C.O.; Spence, T.G.; Kruger, C.H.; Zare, R.N. Optical diagnostics of atmospheric pressure air plasmas. Plasma Sources Sci. Technol. 2003, 12, 125–138. [Google Scholar] [CrossRef]
- Thiyagarajan, M.; Sarani, A.; Nicula, C. Optical emission spectroscopic diagnostics of a non-thermal atmospheric pressure helium-oxygen plasma jet for biomedical applications. J. Appl. Phys. 2013, 113, 233302. [Google Scholar] [CrossRef]
- Srivastava, N.; Wang, C.; Dibble, T.S. A study of OH radicals in an atmospheric AC discharge plasma using near infrared diode laser cavity ringdown spectroscopy combined with optical emission spectroscopy. Eur. Phys. J. D 2009, 54, 77–86. [Google Scholar] [CrossRef]
- Vossoughi Khazaei, S. A Gas Purifying Apparatus. Patent Number WO 2018/035571 Al, 1 March 2018. [Google Scholar]
- Fiebrandt, M.; Lackmann, J.-W.; Stapelmann, K. From patent to product? 50 years of low-pressure plasma sterilization. Plasma Process. Polym. 2018, 15, 1800139. [Google Scholar] [CrossRef] [Green Version]
- Liao, X.; Muhammad, A.I.; Chen, S.; Hu, Y.; Ye, X.; Liu, D.; Ding, T. Bacterial spore inactivation induced by cold plasma. Crit Rev. Food Sci. Nutr. 2019, 59, 2562–2572. [Google Scholar] [CrossRef] [PubMed]
- Raguse, M.; Fiebrandt, M.; Denis, B.; Stapelmann, K.; Eichenberger, P.; Driks, A.; Eaton, P.; Awakowicz, P.; Moeller, R. Understanding of the importance of the spore coat structure and pigmentation in the Bacillus subtilis spore resistance to low-pressure plasma sterilization. J. Phys. D Appl. Phys. 2016, 49, 285401. [Google Scholar] [CrossRef]
- Whiley, H.; Ross, K. Technical Report: Field Study Validation of the PlasmaSHIELD microbial Air Purification Capabilities; School of Science and Engineering, Flinders University: Adelaide, SA, Australia, 2020. [Google Scholar]
- Whiley, H. Technical Report: Validation Study of PlasmaShield System; College of Science and Engineering, Flinders University: Adelaide, SA, Australia, 2019. [Google Scholar]
- Crea, J.; Tkaczuk, M. Testing Conditions for the Evaluation of PlasmaSHIELD™ Non-Thermal Plasma Air Purification and Disinfection System with Common Air Contaminants; Adelaide Exposure Science and Health, The University of Adelaide: Adelade, Australia, 2018; Available online: https://adelaide.figshare.com/articles/online_resource/Interim_Technical_Report_Evaluation_of_the_PlasmaShield_Air_Purification_System/18021188 (accessed on 18 April 2022).
- Ochkin, V.N. Spectroscopy of Low Temperature Plasma; John Wiley & Sons: New York, NY, USA, 2009. [Google Scholar]
- Bytautas, L.; Matsunaga, N.; Ruedenberg, K. Accurate ab initio potential energy curve of O2. II. Core-valence correlations, relativistic contributions, and vibration-rotation spectrum. J. Chem. Phys. 2010, 132, 074307. [Google Scholar] [CrossRef] [PubMed] [Green Version]
- Laux, C.O.; Gessman, R.J.; Kruger, C.H.; Roux, F.; Michaud, F.; Davis, S.P. Rotational temperature measurements in air and nitrogen plasmas using the first negative system of N2+. J. Quant. Spectrosc. Radiat. Transf. 2001, 68, 473–482. [Google Scholar] [CrossRef]
- Hummelt, J.S.; Shapiro, M.A.; Temkin, R.J. Spectroscopic temperature measurements of air breakdown plasma using a 110 GHz megawatt gyrotron beam. Phys. Plasmas 2012, 19, 123509. [Google Scholar] [CrossRef] [Green Version]
- Ohno, N.; Razzak, M.A.; Ukai, H.; Takamura, S.; Uesugi, Y. Validity of Electron Temperature Measurement by Using Boltzmann Plot Method in Radio Frequency Inductive Discharge in the Atmospheric Pressure Range. Plasma Fusion Res. 2006, 1, 028. [Google Scholar] [CrossRef] [Green Version]
- Zhang, Q.Y.; Shi, D.Q.; Xu, W.; Miao, C.Y.; Ma, C.Y.; Ren, C.S.; Zhang, C.; Yi, Z. Determination of vibrational and rotational temperatures in highly constricted nitrogen plasmas by fitting the second positive system of N2 molecules. AIP Adv. 2015, 5, 057158. [Google Scholar] [CrossRef] [Green Version]
- Qayyum, A.; Zeb, S.; Naveed, M.A.; Rehman, N.U.; Ghauri, S.A.; Zakaullah, M. Optical emission spectroscopy of Ar–N2 mixture plasma. J. Quant. Spectrosc. Radiat. Transf. 2007, 107, 361–371. [Google Scholar] [CrossRef]
Figure 1.
(a) Experimental set-up for PlasmaShield® Air Purification Device (PSAPD) and optical emission spectroscopy. A fiber optic cable was mounted on a mechanical translation stage to enable spatial-resolved scanning. L1 and L2: fused silica lenses. (b) The front illustration of the system.
Figure 1.
(a) Experimental set-up for PlasmaShield® Air Purification Device (PSAPD) and optical emission spectroscopy. A fiber optic cable was mounted on a mechanical translation stage to enable spatial-resolved scanning. L1 and L2: fused silica lenses. (b) The front illustration of the system.

Figure 2.
(a) Image of the front view showing the round metal in each cylindrical individual unit of PSAPD. The 60 rectangular tips, with the length of ~2 mm, are engineered on the external circumference; (b) photograph of a single tip showing the geometry and the scanning direction of the fiber optic head with respect to the tip. The position of the top of the tip is 0, while x refers to the horizontal direction and y refers to the vertical direction; (c) photograph of a sustained non-thermal plasma created on the top of the tip. The red line indicates the boundary of the tip, and the dotted line indicates the part of the tip inside the plasma volume.

Figure 3.
A typical emission spectrum of air plasma as a function of the wavelength from 200 to 800 nm.
Figure 3.
A typical emission spectrum of air plasma as a function of the wavelength from 200 to 800 nm.

Figure 4.
(a) A typical spatial-resolved spectrum recorded between 200 to 400 nm as a function of the y direction from −85 to 140 μm. The spatial resolution is 5 μm. The highest signal at 337 nm is attributed to the emission of N2 (C3Π–B3Π) (0–0); (b) a zoomed-in plot of the spectral region between 200 to 280 nm with the y direction from −10 to 40 μm. The spectrum was recorded with a high spatial resolution of 2.5 μm. The observed signals are attributed to the emission of NO (A2Σ–X2Π).

Figure 5.
Typical emission spectra of the air plasma in three different UV regions: (a) 200–300 nm, (b) 300–390 nm, and (c) 400–450 nm. The peaks are predominantly generated by N2 discharge.
Figure 5.
Typical emission spectra of the air plasma in three different UV regions: (a) 200–300 nm, (b) 300–390 nm, and (c) 400–450 nm. The peaks are predominantly generated by N2 discharge.

Figure 6.
Part of the bands of N2+ (B2Σ–X2Σ) and N2 second positive system (C3Π–B3Π). The emission wavelengths are labeled on the top of each transition arrow. The unit of the wavelength is nm. Vibrational energy levels are listed from the ground state (X1Σ) to the third excited state (C3Π) for N2 molecules and the ground state (X2Σ) to the second excited state (B2Σ) for NO molecules. The spectroscopic data of N2 was taken from Ref. [30].

Figure 7.
The signal intensity of the N2 second positive system (C3Π–B3Π) along with the (a) y and (b) x directions; and the derived and PPT distribution of N2 along with the (c) y and (d) x directions. The insert images in (a) and (b) show the scan directions in the plasma.
Figure 7.
The signal intensity of the N2 second positive system (C3Π–B3Π) along with the (a) y and (b) x directions; and the derived and PPT distribution of N2 along with the (c) y and (d) x directions. The insert images in (a) and (b) show the scan directions in the plasma.

Figure 8.
The emission spectra recorded at (a) 50% and (b) 80% of the maximum supplied power; (c) the and the PPT of excited N2 species as a function of the supplied power.
Figure 8.
The emission spectra recorded at (a) 50% and (b) 80% of the maximum supplied power; (c) the and the PPT of excited N2 species as a function of the supplied power.

Figure 9.
The and the PPT as a function of the air velocity from 0 to 1.6 m∙s−1.

Figure 10.
The signal intensity of the NO (A2Σ–X2Π) (0–0) emission at 226 nm and the derived spatial PPT distribution of excited NO species along (a) x direction and (b) y direction. The red lines indicate the signals of NO emission, while the black lines indicate the PPT distributions of NO.
Figure 10.
The signal intensity of the NO (A2Σ–X2Π) (0–0) emission at 226 nm and the derived spatial PPT distribution of excited NO species along (a) x direction and (b) y direction. The red lines indicate the signals of NO emission, while the black lines indicate the PPT distributions of NO.


Table 1.
Summary of the N2, N2+, and NO transitions and their corresponding emission wavelengths and Franck-Condon factors [30].
Table 1.
Summary of the N2, N2+, and NO transitions and their corresponding emission wavelengths and Franck-Condon factors [30].
| Transition Band | Wavelength (nm) | Franck-Condon Factor | |
|---|---|---|---|
| NO–γ (A2Σ–X2Π) | 1–0 | 214 | 0.330 |
| 0–0 | 226 | 0.162 | |
| 0–1 | 235 | 0.262 | |
| 0–2 | 245 | 0.237 | |
| 0–3 | 256 | 0.161 | |
| N2 (C3Π–B3Π) | 3–1 | 296 | 0.252 |
| 1–0 | 316 | 0.388 | |
| 0–0 | 337 | 0.455 | |
| 0–1 | 357 | 0.331 | |
| 0–2 | 380 | 0.145 | |
| 0–3 | 404 | 0.0494 | |
| 0–4 | 433 | 0.0145 | |
| N2+ (B2Σ–X2Σ) | 0–0 | 391 | 0.651 |
| 2–3 | 419 | 0.229 | |
| 0–1 | 427 | 0.259 |
Publisher’s Note: MDPI stays neutral with regard to jurisdictional claims in published maps and institutional affiliations. |
© 2022 by the authors. Licensee MDPI, Basel, Switzerland. This article is an open access article distributed under the terms and conditions of the Creative Commons Attribution (CC BY) license (https://creativecommons.org/licenses/by/4.0/).
Share and Cite
MDPI and ACS Style
Zhao, W.; Alwahabi, Z.T. Diagnostics of Air Purification Plasma Device by Spatially Resolved Emission Spectroscopy. Plasma 2022, 5, 206-220. https://doi.org/10.3390/plasma5020016
AMA Style
Zhao W, Alwahabi ZT. Diagnostics of Air Purification Plasma Device by Spatially Resolved Emission Spectroscopy. Plasma. 2022; 5(2):206-220. https://doi.org/10.3390/plasma5020016
Chicago/Turabian StyleZhao, Wanxia, and Zeyad T. Alwahabi. 2022. "Diagnostics of Air Purification Plasma Device by Spatially Resolved Emission Spectroscopy" Plasma 5, no. 2: 206-220. https://doi.org/10.3390/plasma5020016