
Oxidative Stress Pathways Linked to Apoptosis Induction by Low-Temperature Plasma Jet Activated Media in Bladder Cancer Cells: An In Vitro and In Vivo Study

 ,
,  , , and
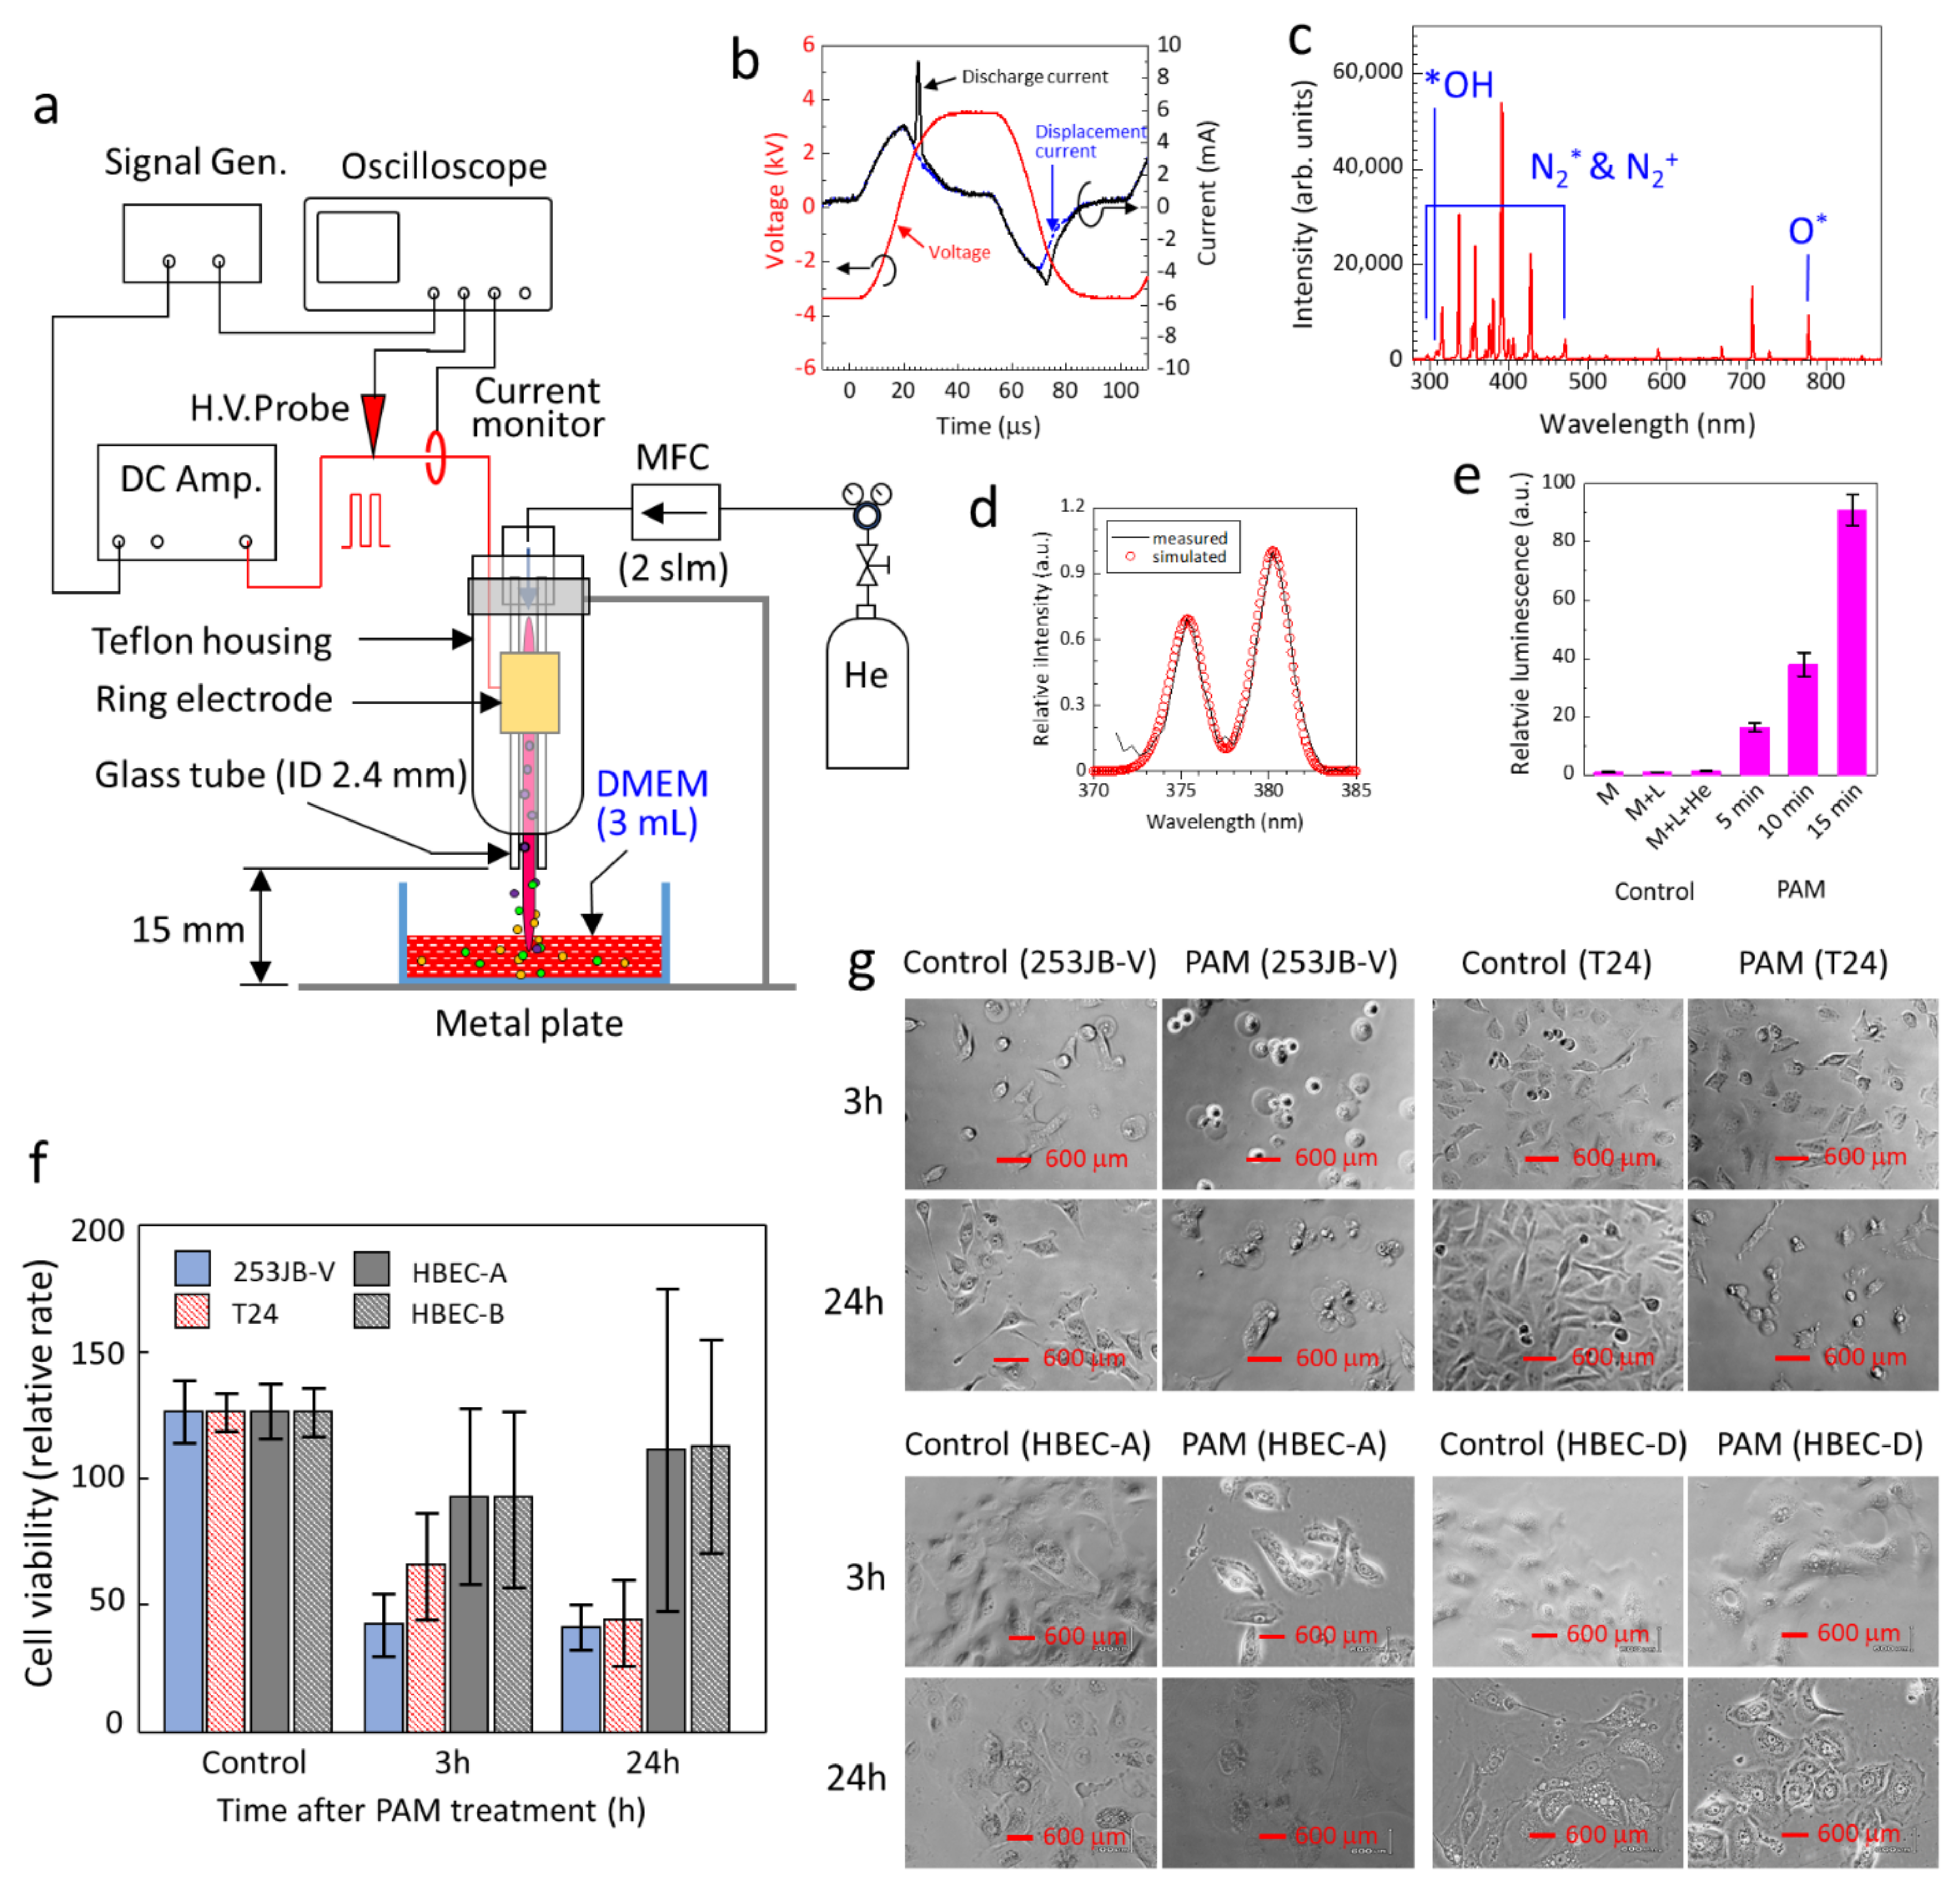
Abstract
:1. Introduction
2. Materials and Methods
2.1. Production of PAM
2.2. Human Bladder Cell Lines and Cell Culture Conditions
2.3. PAM Treatment of Cells
2.4. Cell Viability Assay
2.5. Flow Cytometry Analysis of Cell Death, Mitochondrial Membrane Potential and Mitochondrial ROS, and Cell Cycle
2.6. Quantification of Intracellular Cytochrome c and Caspase 3
2.7. Western Blot Analysis of Cell Cycle Regulatory Factors
2.8. PAM Treatment of In Vivo Subcutaneous Bladder Cancer Tumour and Analysis of Treatment Outcome
2.9. Statistical Analysis
3. Results and Discussion
3.1. Production of PAM for Targeted Bladder Cancer Treatment
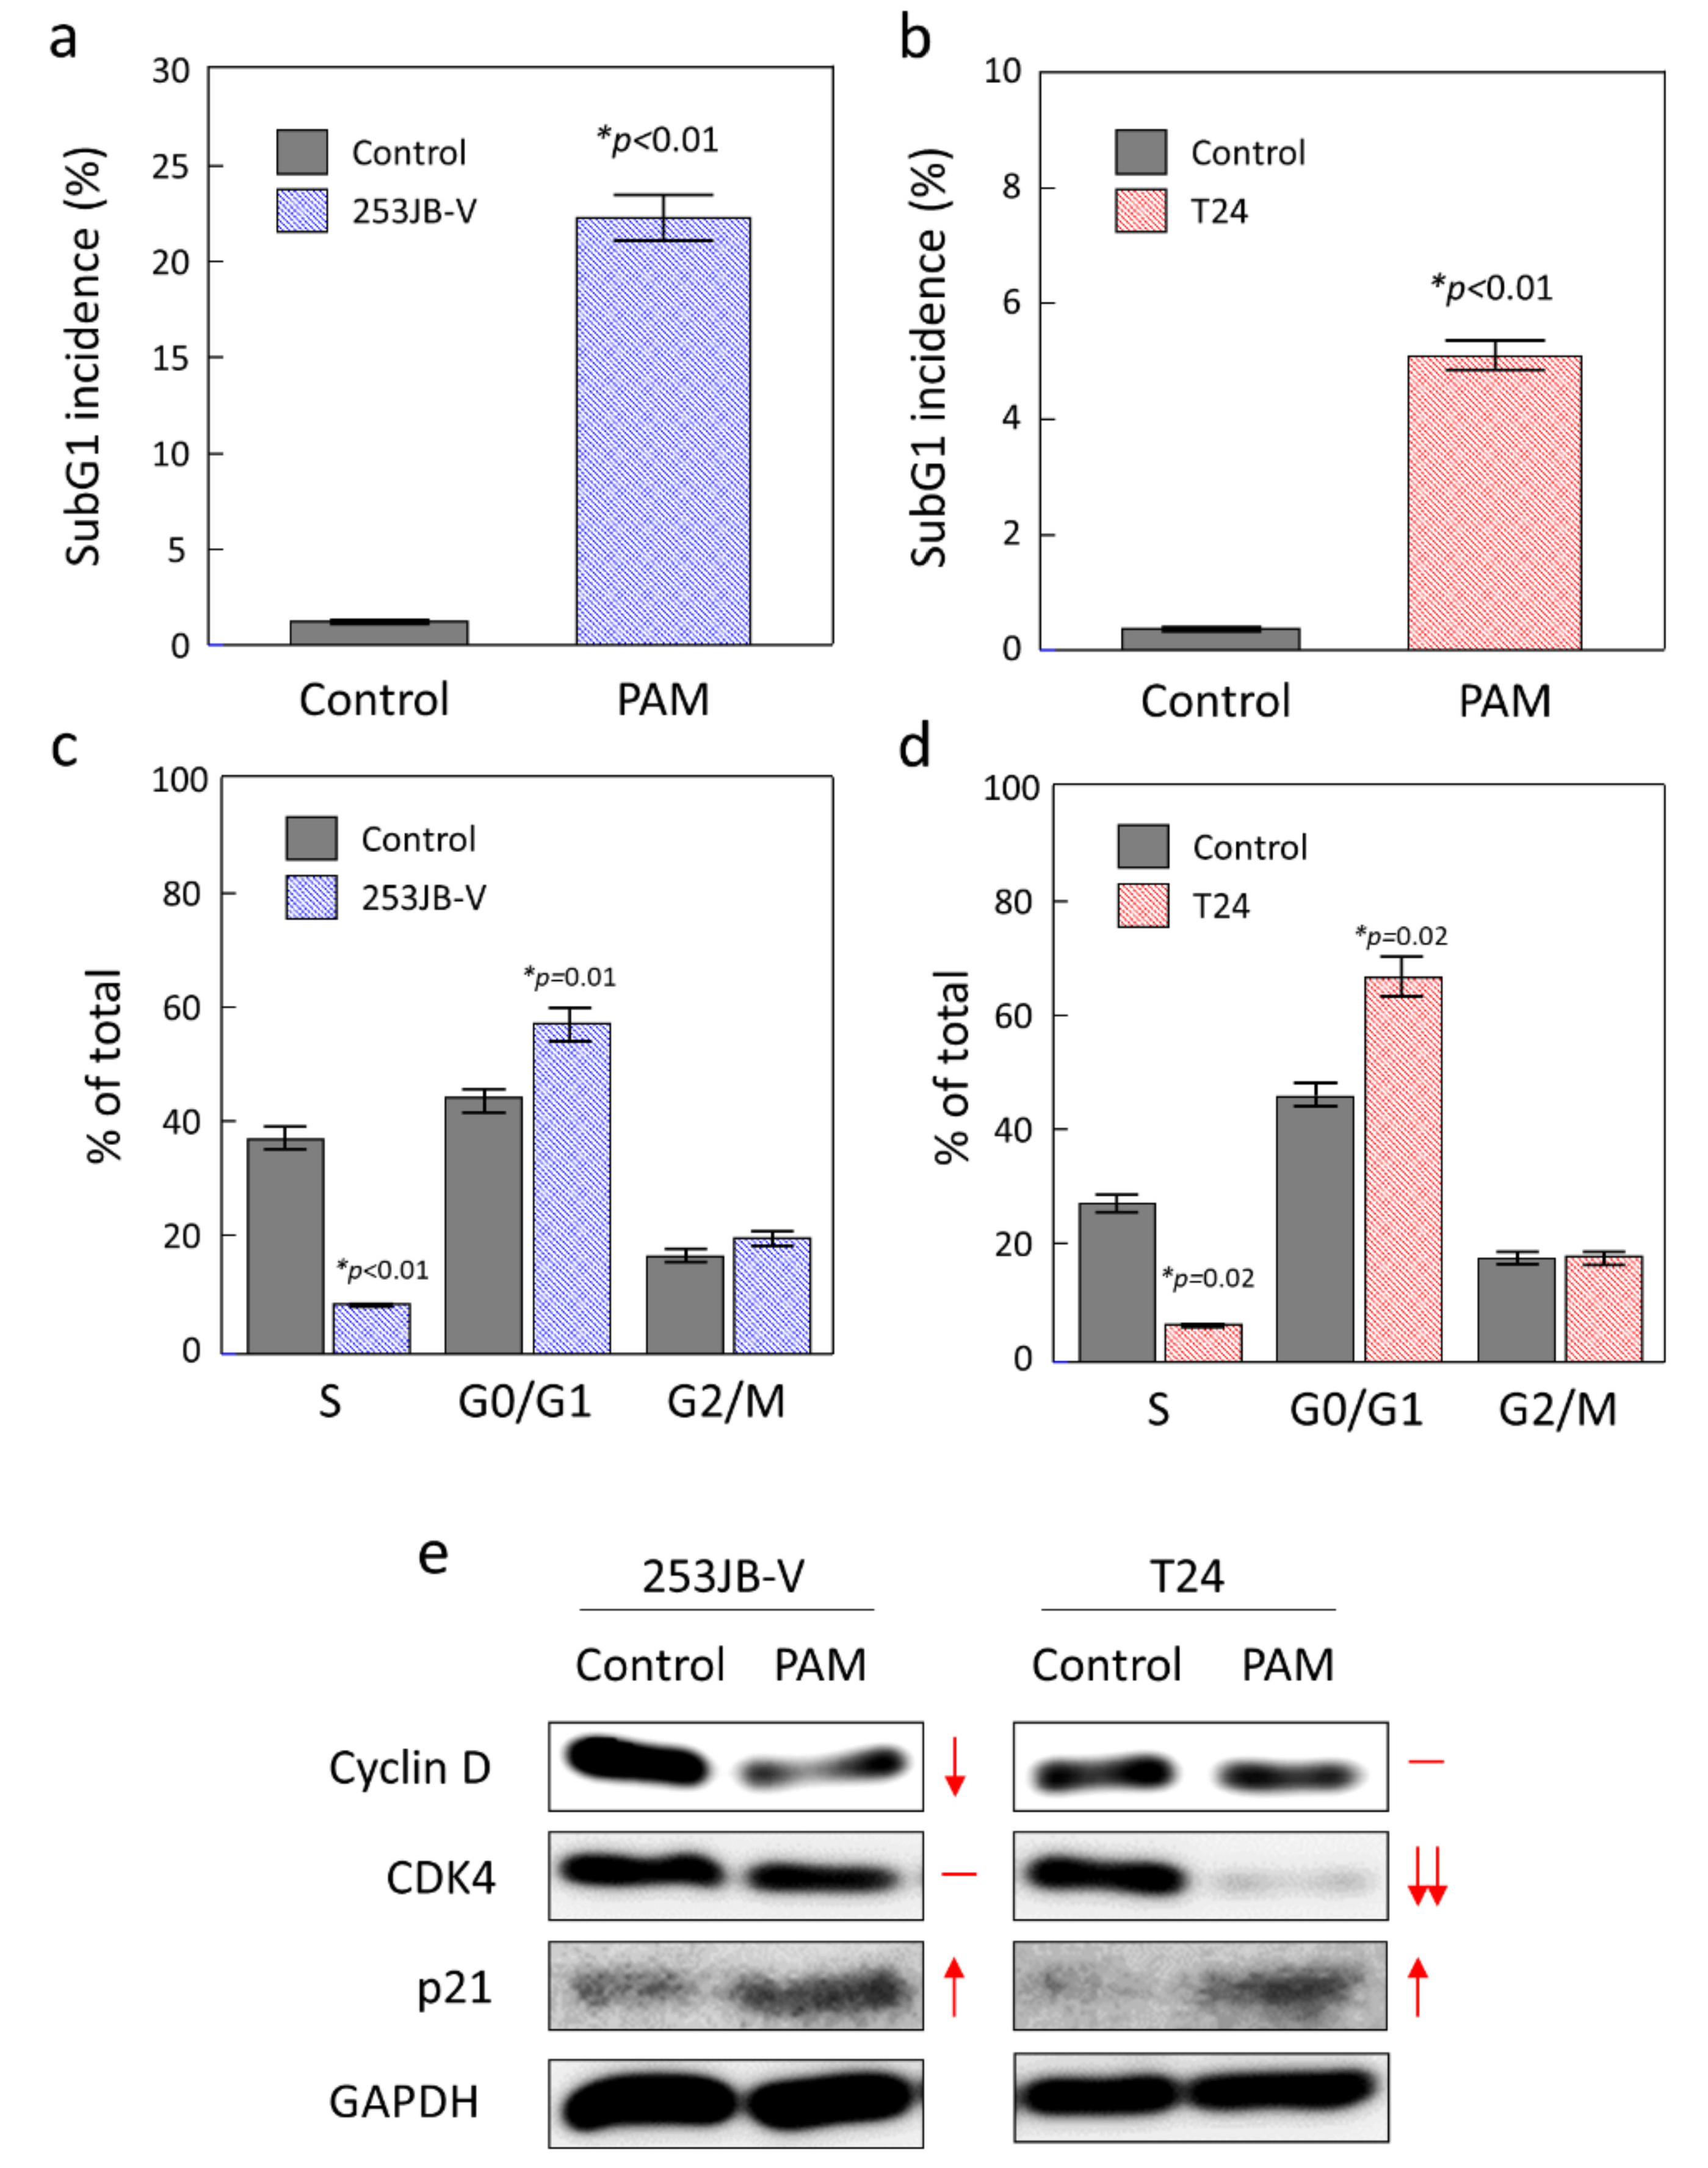
3.2. PAM Initiated Apoptosis in Bladder Cancer Cells
3.3. Role of Mitochondria in PAM Induced Apoptosis in Bladder Cancer Cells
3.4. Role of Cell Cycle Arrest in PAM Induced Apoptosis in Bladder Cancer Cells
3.5. PAM Induction of Apoptosis of a Bladder Cancer Tumour In Vivo
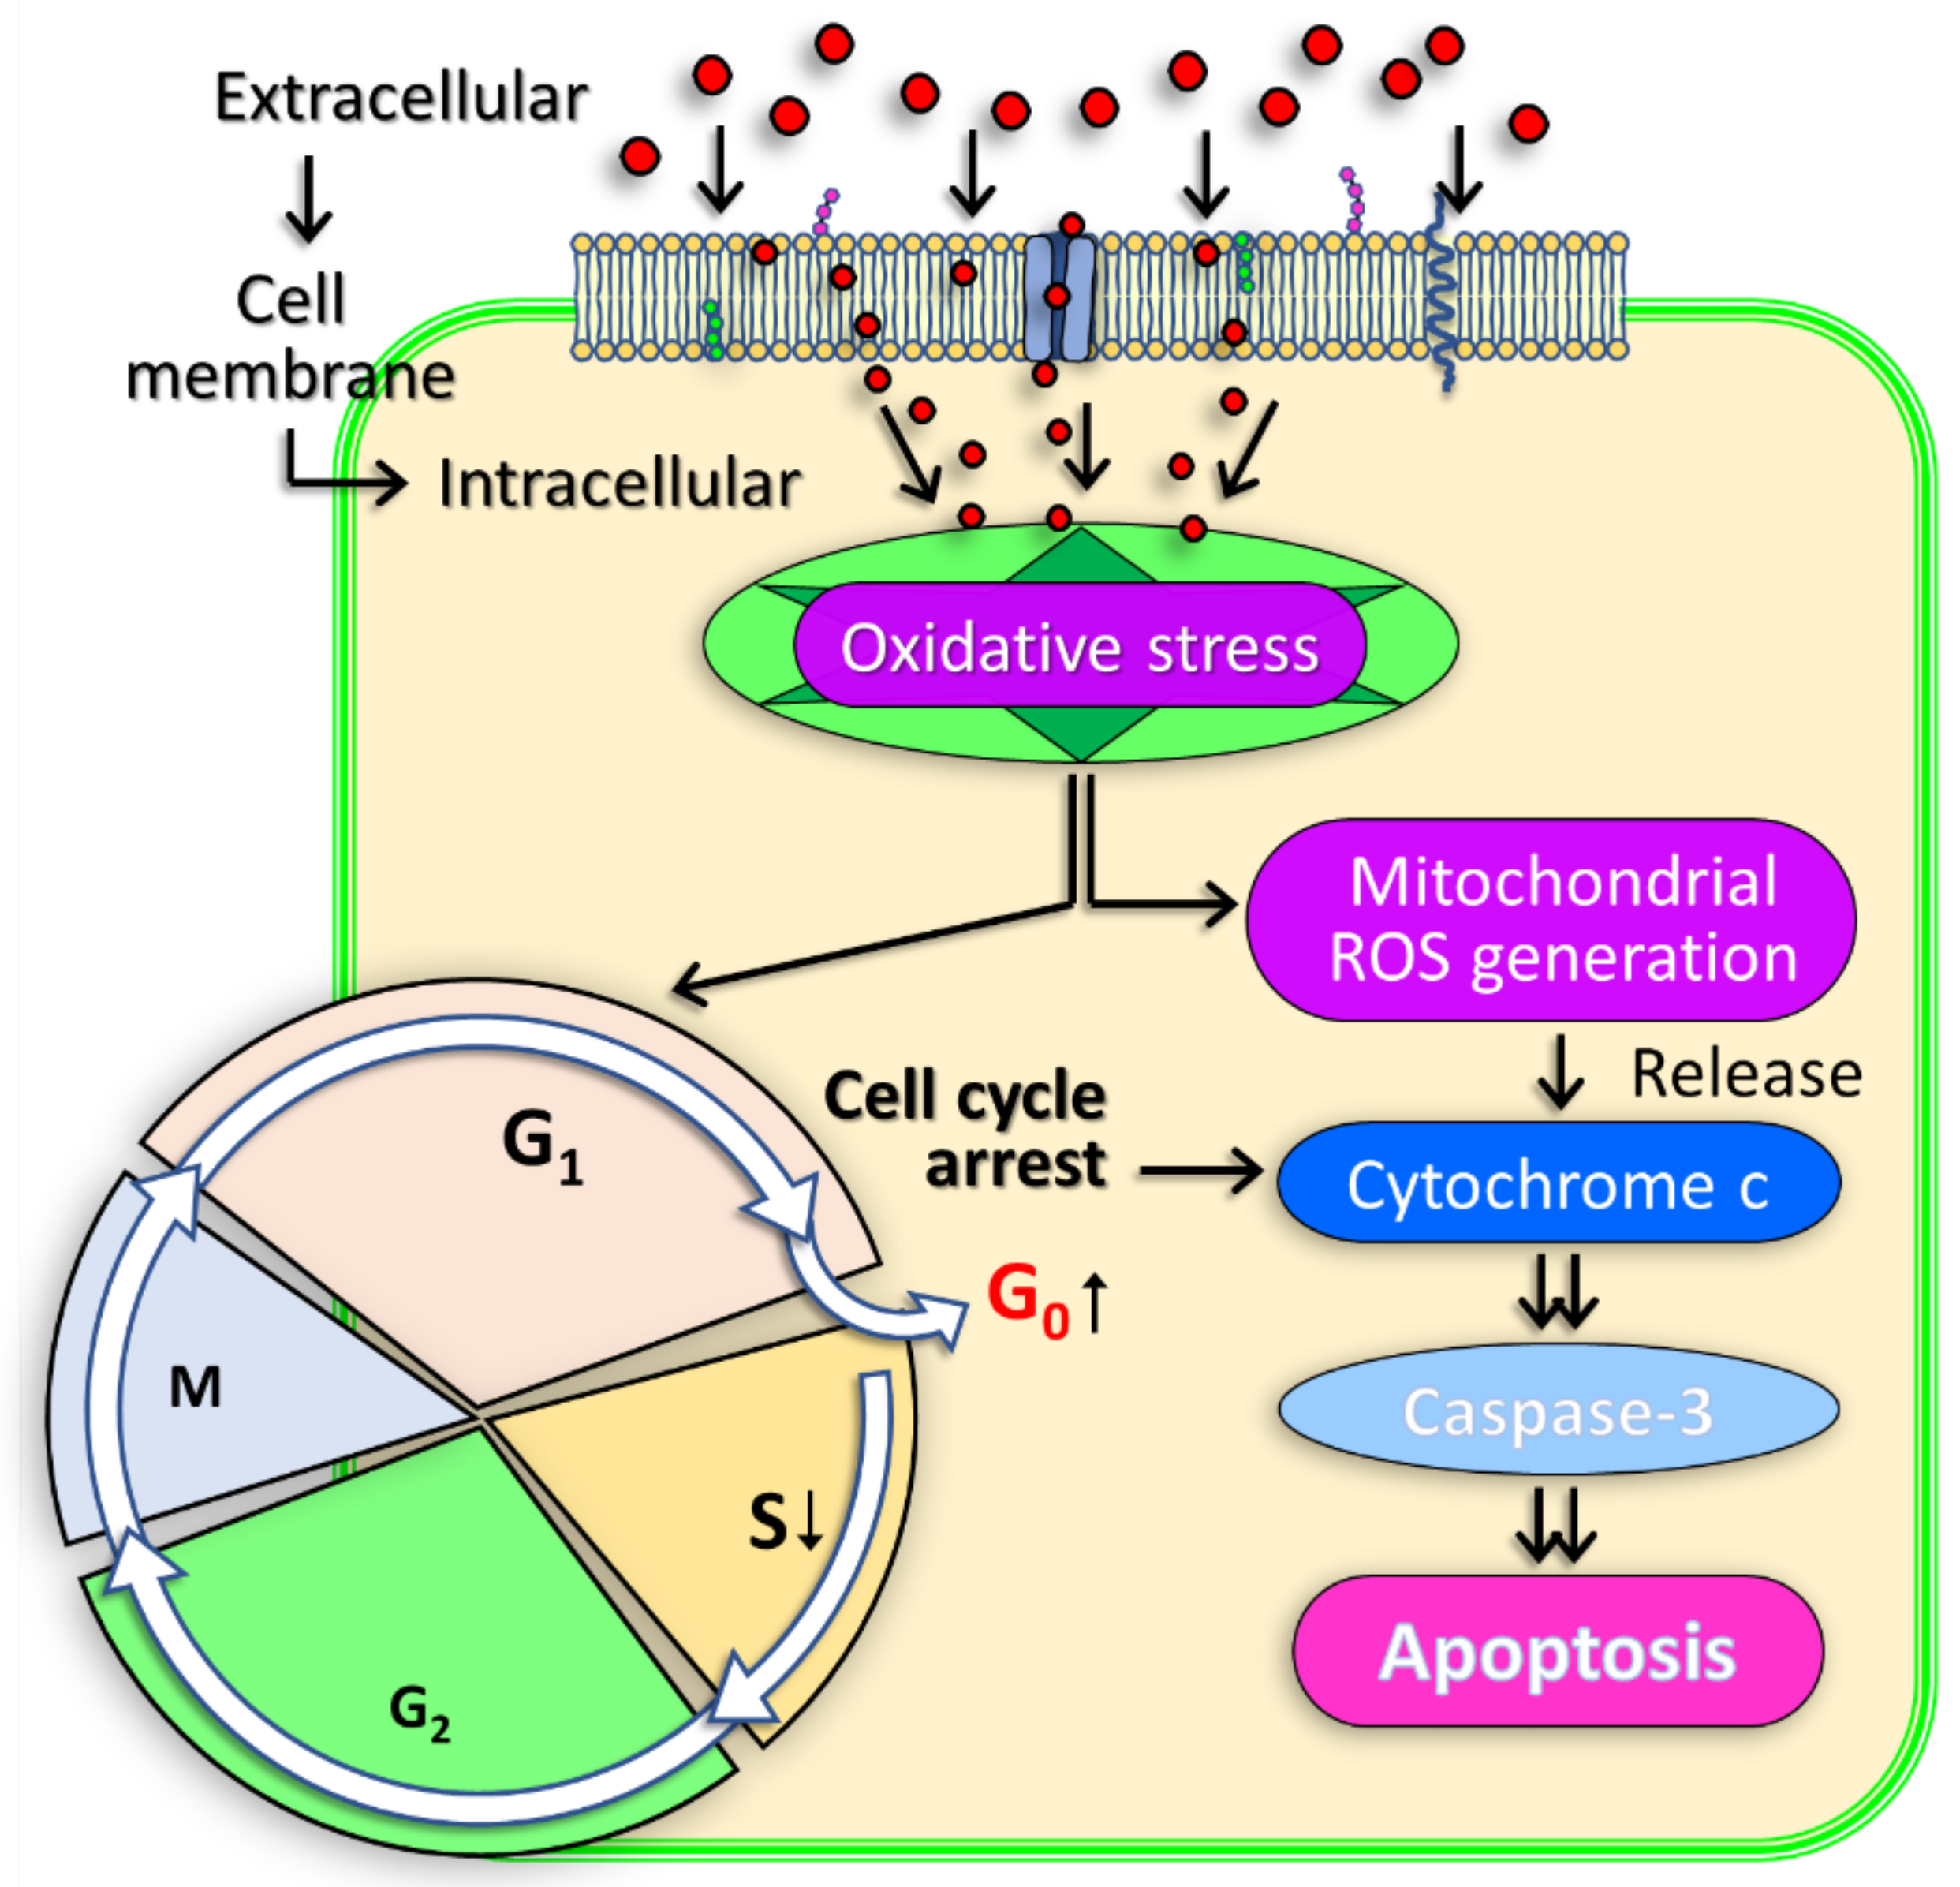
3.6. Molecular Mechanism of PAM Induced Bladder Cancer Cell Death
3.7. Opportunities of PAM in the Clinical Treatment of Non-Muscle Invasive Bladder Cancer
4. Conclusions and Future Directions
Supplementary Materials
Author Contributions
Funding
Institutional Review Board Statement
Informed Consent Statement
Data Availability Statement
Conflicts of Interest
References
- Kong, M.G.; Kroesen, G.; Morfill, G.; Nosenko, T.; Shimizu, T.; Dijk, J.V.; Zimmermann, J.L. Plasma medicine: An introductory review. New J. Phys. 2009, 11, 115012. [Google Scholar] [CrossRef]
- Ratovitski, E.A.; Cheng, X.; Yan, D.; Sherman, J.H.; Canady, J.; Trink, B.; Keidar, M. Anti-Cancer Therapies of 21st Century: Novel Approach to Treat Human Cancers Using Cold Atmospheric Plasma. Plasma Process. Polym. 2014, 11, 1128–1137. [Google Scholar] [CrossRef]
- Tanaka, H.; Mizuno, M.; Ishikawa, K.; Nakamura, K.; Kajiyama, H.; Kano, H.; Kikkawa, F.; Hori, M. Plasma-Activated Medium Selectively Kills Glioblastoma Brain Tumor Cells by Down-Regulating a Survival Signaling Molecule, AKT Kinase. Plasma Med. 2011, 1, 265–277. [Google Scholar] [CrossRef] [Green Version]
- Tanaka, H.; Mizuno, M.; Ishikawa, K.; Nakamura, K.; Utsumi, F.; Kajiyama, H.; Kano, H.; Maruyama, S.; Kikkawa, F.; Hori, M. Cell survival and proliferation signaling pathways are downregulated by plasma-activated medium in glioblastoma brain tumor cells. Plasma Med. 2012, 2, 207–220. [Google Scholar] [CrossRef] [Green Version]
- Tanaka, H.; Mizuno, M.; Ishikawa, K.; Kondo, H.; Takeda, K.; Hashizume, H.; Nakamura, K.; Utsumi, F.; Kajiyama, H.; Kano, H.; et al. Plasma with high electron density and plasma-activated medium for cancer treatment. Clin. Plasma Med. 2015, 3, 72–76. [Google Scholar] [CrossRef]
- Judée, F.; Fongia, C.; Ducommun, B.; Yousfi, M.; Lobjois, V.; Merbahi, N. Short and long time effects of low temperature Plasma Activated Media on 3D multicellular tumor spheroids. Sci. Rep. 2016, 6, 21421. [Google Scholar] [CrossRef] [PubMed]
- Nakamura, K.; Peng, Y.; Utsumi, F.; Tanaka, H.; Mizuno, M.; Toyokuni, S.; Hori, M.; Kikkawa, F.; Kajiyama, H. Novel Intraperitoneal Treatment with Non-Thermal Plasma-Activated Medium Inhibits Metastatic Potential of Ovarian Cancer Cells. Sci. Rep. 2017, 7, 6085. [Google Scholar] [CrossRef]
- Tan, L.T.-H.; Chan, K.-G.; Pusparajah, P.; Lee, W.-L.; Chuah, L.-H.; Khan, T.M.; Lee, L.-H.; Goh, B.-H. Targeting Membrane Lipid a Potential Cancer Cure? Front. Pharmacol. 2017, 8, 12. [Google Scholar] [CrossRef]
- Van Blitterswijk, W.J.; de Veer, G.; Krol, J.H.; Emmelot, P. Comparative lipid analysis of purified plasma membranes and shed extracellular membrane vesicles from normal murine thymocytes and leukemic GRSL cells. Biochim. Biophys. Acta BBA Biomembr. 1982, 688, 495–504. [Google Scholar] [CrossRef]
- Bernardes, N.; Fialho, A.M. Perturbing the Dynamics and Organization of Cell Membrane Components: A New Paradigm for Cancer-Targeted Therapies. Int. J. Mol. Sci. 2018, 19, 3871. [Google Scholar] [CrossRef] [Green Version]
- Papadopoulos, M.C.; Saadoun, S. Key roles of aquaporins in tumor biology. Biochim. Biophys. Acta BBA Biomembr. 2015, 1848, 2576–2583. [Google Scholar] [CrossRef] [Green Version]
- Saadoun, S.; Papadopoulos, M.C.; Davies, D.C.; Bell, B.A.; Krishna, S. Increased aquaporin 1 water channel expression inhuman brain tumours. Br. J. Cancer 2002, 87, 621–623. [Google Scholar] [CrossRef] [Green Version]
- Yan, D.; Talbot, A.; Nourmohammadi, N.; Sherman, J.H.; Cheng, X.; Keidar, M. Toward understanding the selective anticancer capacity of cold atmospheric plasma—A model based on aquaporins (Review). Biointerphases 2015, 10, 040801. [Google Scholar] [CrossRef]
- Keidar, M. Plasma for cancer treatment. Plasma Sources Sci. Technol. 2015, 24, 033001. [Google Scholar] [CrossRef]
- Van der Paal, J.; Hong, S.-H.; Yusupov, M.; Gaur, N.; Oh, J.-S.; Short, R.D.; Szili, E.J.; Bogaerts, A. How membrane lipids influence plasma delivery of reactive oxygen species into cells and subsequent DNA damage: An experimental and computational study. Phys. Chem. Chem. Phys. 2019, 21, 19327–19341. [Google Scholar] [CrossRef]
- Yusupov, M.; Privat-Maldonado, A.; Cordeiro, R.M.; Verswyvel, H.; Shaw, P.; Razzokov, J.; Smits, E.; Bogaerts, A. Oxidative damage to hyaluronan–CD44 interactions as an underlying mechanism of action of oxidative stress-inducing cancer therapy. Redox Biol. 2021, 43, 101968. [Google Scholar] [CrossRef]
- Keidar, M.; Shashurin, A.; Volotskova, O.; Stepp, M.A.; Srinivasan, P.; Sandler, A.; Trink, B. Cold atmospheric plasma in cancer therapy. Phys. Plasmas 2013, 20, 057101–057108. [Google Scholar] [CrossRef]
- Siegel, R.L.; Miller, K.D.; Jemal, A. Cancer statistics, 2015. CA Cancer J. Clin. 2015, 65, 5–29. [Google Scholar] [CrossRef]
- Ferlay, J.; Steliarova-Foucher, E.; Lortet-Tieulent, J.; Rosso, S.; Coebergh, J.W.W.; Comber, H.; Forman, D.; Bray, F. Cancer incidence and mortality patterns in Europe: Estimates for 40 countries in 2012. Eur. J. Cancer 2013, 49, 1374–1403. [Google Scholar] [CrossRef] [Green Version]
- Richards, K.A.; Smith, N.D.; Steinberg, G.D. The Importance of Transurethral Resection of Bladder Tumor in the Management of Nonmuscle Invasive Bladder Cancer: A Systematic Review of Novel Technologies. J. Urol. 2014, 191, 1655–1664. [Google Scholar] [CrossRef]
- Joh, H.M.; Kim, S.J.; Chung, T.H.; Leem, S.H. Reactive oxygen species-related plasma effects on the apoptosis of human bladder cancer cells in atmospheric pressure pulsed plasma jets. Appl. Phys. Lett. 2012, 101, 053703. [Google Scholar]
- Mohades, S.; Barekzi, N.; Laroussi, M. Efficacy of Low Temperature Plasma against SCaBER Cancer Cells. Plasma Process. Polym. 2014, 11, 1150–1155. [Google Scholar] [CrossRef]
- Keidar, M.; Walk, R.; Shashurin, A.; Srinivasan, P.; Sandler, A.; Dasgupta, S.; Ravi, R.; Guerrero-Preston, R.; Trink, B. Cold plasma selectivity and the possibility of a paradigm shift in cancer therapy. Br. J. Cancer 2011, 105, 1295–1301. [Google Scholar] [CrossRef] [PubMed]
- Oh, J.-S.; Szili, E.J.; Gaur, N.; Hong, S.-H.; Furuta, H.; Short, R.D.; Hatta, A. In-situ UV Absorption Spectroscopy for Monitoring Transport of Plasma Reactive Species through Agarose as Surrogate for Tissue. J. Photopolym. Sci. Technol. 2015, 28, 439–444. [Google Scholar] [CrossRef] [Green Version]
- Oh, J.-S.; Szili, E.J.; Gaur, N.; Hong, S.-H.; Furuta, H.; Kurita, H.; Mizuno, A.; Hatta, A.; Short, R.D. How to assess the plasma delivery of RONS into tissue fluid and tissue. J. Phys. D Appl. Phys. 2016, 49, 304005. [Google Scholar] [CrossRef]
- Oh, J.-S.; Kakuta, M.; Furuta, H.; Akatsuka, H.; Hatta, A. Effect of plasma jet diameter on the efficiency of reactive oxygen and nitrogen species generation in water. Jpn. J. Appl. Phys. 2016, 55, 06HD01. [Google Scholar] [CrossRef]
- Oh, J.-S.; Szili, E.J.; Hatta, A.; Ito, M.; Shirafuji, T. Tailoring the Chemistry of Plasma-Activated Water Using a DC-Pulse-Driven Non-Thermal Atmospheric-Pressure Helium Plasma Jet. Plasma 2019, 2, 127–137. [Google Scholar] [CrossRef] [Green Version]
- Lu, X.; Naidis, G.V.; Laroussi, M.; Reuter, S.; Graves, D.B.; Ostrikov, K. Reactive species in non-equilibrium atmospheric-pressure plasmas: Generation, transport, and biological effects. Phys. Rep. 2016, 630, 1–84. [Google Scholar] [CrossRef] [Green Version]
- Ghimire, B.; Szili, E.J.; Lamichhane, P.; Short, R.D.; Lim, J.S.; Attri, P.; Masur, K.; Weltmann, K.-D.; Hong, S.-H.; Choi, E.H. The role of UV photolysis and molecular transport in the generation of reactive species in a tissue model with a cold atmospheric pressure plasma jet. Appl. Phys. Lett. 2019, 114, 093701. [Google Scholar] [CrossRef] [Green Version]
- Porter, A.G.; Jänicke, R.U. Emerging roles of caspase-3 in apoptosis. Cell Death Differ. 1999, 6, 99–104. [Google Scholar] [CrossRef]
- Ow, Y.-L.P.; Green, D.R.; Hao, Z.; Mak, T.W. Cytochrome c: Functions beyond respiration. Nat. Rev. Mol. Cell Biol. 2008, 9, 532–542. [Google Scholar] [CrossRef]
- Korshunov, S.S.; Skulachev, V.P.; Starkov, A.A. High protonic potential actuates a mechanism of production of reactive oxygen species in mitochondria. FEBS Lett. 1997, 416, 15–18. [Google Scholar] [CrossRef] [Green Version]
- Zorova, L.D.; Popkov, V.A.; Plotnikov, E.Y.; Silachev, D.N.; Pevzner, I.B.; Jankauskas, S.S.; Babenko, V.A.; Zorov, S.D.; Balakireva, A.V.; Juhaszova, M.; et al. Mitochondrial membrane potential. Anal. Biochem. 2018, 552, 50–59. [Google Scholar] [CrossRef]
- Dominguez-Escrig, J.L.; Kelly, J.D.; Neal, D.E.; King, S.M.; Davies, B.R. Evaluation of the Therapeutic Potential of the Epidermal Growth Factor Receptor Tyrosine Kinase Inhibitor Gefitinib in Preclinical Models of Bladder Cancer. Clin. Cancer Res. 2004, 10, 4874–4884. [Google Scholar] [CrossRef] [Green Version]
- Pucci, B.; Kasten, M.; Giordano, A. Cell cycle and apoptosis. Neoplasia 2000, 2, 291–299. [Google Scholar] [CrossRef] [Green Version]
- Decaestecker, K.; Oosterlinck, W. Managing the adverse events of intravesical bacillus Calmette-Guérin therapy. Res. Rep. Urol. 2015, 7, 157–163. [Google Scholar]


Publisher’s Note: MDPI stays neutral with regard to jurisdictional claims in published maps and institutional affiliations. |
© 2022 by the authors. Licensee MDPI, Basel, Switzerland. This article is an open access article distributed under the terms and conditions of the Creative Commons Attribution (CC BY) license (https://creativecommons.org/licenses/by/4.0/).
Share and Cite
Fukuhara, H.; Szili, E.J.; Oh, J.-S.; Chiaki, K.; Yamamoto, S.; Kurabayashi, A.; Furihata, M.; Tsuda, M.; Furuta, H.; Lindsay, H.D.; et al. Oxidative Stress Pathways Linked to Apoptosis Induction by Low-Temperature Plasma Jet Activated Media in Bladder Cancer Cells: An In Vitro and In Vivo Study. Plasma 2022, 5, 233-246. https://doi.org/10.3390/plasma5020018
Fukuhara H, Szili EJ, Oh J-S, Chiaki K, Yamamoto S, Kurabayashi A, Furihata M, Tsuda M, Furuta H, Lindsay HD, et al. Oxidative Stress Pathways Linked to Apoptosis Induction by Low-Temperature Plasma Jet Activated Media in Bladder Cancer Cells: An In Vitro and In Vivo Study. Plasma. 2022; 5(2):233-246. https://doi.org/10.3390/plasma5020018
Chicago/Turabian StyleFukuhara, Hideo, Endre J. Szili, Jun-Seok Oh, Kawada Chiaki, Shinkuro Yamamoto, Atsushi Kurabayashi, Mutsuo Furihata, Masayuki Tsuda, Hiroshi Furuta, Howard D. Lindsay, and et al. 2022. "Oxidative Stress Pathways Linked to Apoptosis Induction by Low-Temperature Plasma Jet Activated Media in Bladder Cancer Cells: An In Vitro and In Vivo Study" Plasma 5, no. 2: 233-246. https://doi.org/10.3390/plasma5020018