Crack Detection through the Change in the Normalized Frequency Shape

Abstract
:1. Introduction
2. Finite Element Formulation
2.1. Intact Element
2.2. Damaged Element
3. Crack Detection Method
3.1. Crack Localization
3.2. Crack Quantification
4. Numerical Application
5. Experimental Application
6. Conclusions
Author Contributions
Acknowledgments
Conflicts of Interest
References
- Andreaus, U.; Casini, P. Identification of Multiple Open and Fatigue Cracks in Beam-like Structures Using Wavelets on Deflection Signals. Contin. Mech. Thermodyn. 2016, 28, 361–378. [Google Scholar] [CrossRef]
- Al-Shudeifat, M.A.; Butcher, E.A. On the Dynamics of a Beam with Switching Crack and Damaged Boundaries. J. Vib. Control 2013, 19, 30–46. [Google Scholar] [CrossRef]
- Cole, D.P.; Habtour, E.M.; Sano, T.; Fudger, S.J.; Grendahl, S.M.; Dasgupta, A. Local Mechanical Behavior of Steel Exposed to Nonlinear Harmonic Oscillation. Exp. Mech. 2017, 57, 1027–1035. [Google Scholar] [CrossRef]
- Neves, A.C.; Simões, F.M.F.; Pinto da Costa, A. Vibrations of Cracked Beams: Discrete Mass and Stiffness Models. Comput. Struct. 2016, 168, 68–77. [Google Scholar] [CrossRef]
- Das, S.; Saha, P.; Patro, S.K. Vibration-based damage detection techniques used for health monitoring of structures: A review. J. Civ. Struct. Health Monit. 2016, 6, 477–507. [Google Scholar] [CrossRef]
- Fan, W.; Qiao, P. Vibration-based damage identification methods: A review and comparative study. Struct. Health Monit. 2011, 10, 83–111. [Google Scholar] [CrossRef]
- Jassim, Z.A.; Ali, N.N.; Mustapha, F.; Abdul Jalil, N.A. A review on the vibration analysis for a damage occurrence of a cantilever beam. Eng. Fail. Anal. 2013, 31, 442–461. [Google Scholar] [CrossRef]
- Cao, M.S.; Sha, G.G.; Gao, Y.F.; Ostachowicz, W. Structural Damage Identification Using Damping: A Compendium of Uses and Features. Smart Mater. Struct. 2017, 26. [Google Scholar] [CrossRef]
- Homaei, F.; Shojaee, S.; Ghodrati Amiri, G. A direct damage detection method using Multiple Damage Localization Index Based on Mode Shapes criterion. Struct. Eng. Mech. 2014, 49, 183–202. [Google Scholar] [CrossRef]
- Ravi Prakash Babu, K.; Raghu Kumar, B.; Narayana, K.L.; Mallikarjuna Rao, K. Multiple crack detection in beams from the differences in curvature mode shapes. J. Eng. Appl. Sci. 2015, 10, 1701–1710. [Google Scholar]
- Cao, M.; Radzieński, M.; Xu, W.; Ostachowicz, W. Identification of multiple damage in beams based on robust curvature mode shapes. Mech. Syst. Signal Process. 2014, 46, 468–480. [Google Scholar] [CrossRef]
- Yazdanpanah, O.; Seyedpoor, S.M.; Akbarzadeh Bengar, H. A new damage detection indicator for beams based on mode shape data. Struct. Eng. Mech. 2015, 53, 725–744. [Google Scholar] [CrossRef]
- Rucevskis, S.; Wesolowski, M.; Chate, A. Vibration-Based Damage Identification in Laminated Composite Beams. Constr. Sci. 2009, 10, 100–112. [Google Scholar] [CrossRef]
- Rucevskis, S.; Janeliukstis, R.; Akishin, P.; Chate, A. Mode shape-based damage detection in plate structure without baseline data. Struct. Control Health Monit. 2016, 23, 1180–1193. [Google Scholar] [CrossRef]
- Zhong, S.; Oyadiji, S.O. Crack detection in simply supported beams without baseline modal parameters by stationary wavelet transform. Mech. Syst. Signal Process. 2007, 21, 1853–1884. [Google Scholar] [CrossRef]
- Jaiswal, N.G.; Pande, D.W. Sensitizing the Mode Shapes of Beam Towards Damage Detection Using Curvature and Wavelet Transform. Int. J. Sci. Technol. Res. 2015, 4, 266–272. [Google Scholar]
- Xiang, J.; Liang, M. Wavelet-based detection of beam cracks using modal shape and frequency measurements. Comput.-Aided Civ. Infrastruct. Eng. 2012, 27, 439–454. [Google Scholar] [CrossRef]
- Doebling, S.W.; Farrar, C.R.; Prime, M.B.; Shevitz, D.W. Damage Identification and Health Monitoring of Structural and Mechanical Systems from Changes in their Vibration Characteristics: A Literature Review; Los Alamos National Laboratory Report, LA-13070-MS; Los Alamos National Laboratory: Los Alamos, NM, USA, 1996.
- Lifshitzand, J.M.; Rotem, A. Determination of Reinforcement Unbonding of Composites by a Vibration Technique. J. Compos. Mater. 1969, 3, 412–423. [Google Scholar] [CrossRef]
- Salawu, O.S. Detection of structural damage through changes in frequency: A review. Eng. Struct. 1997, 19, 718–723. [Google Scholar] [CrossRef]
- Dahak, M.; Touat, N.; Benseddiq, N. On the classification of Normalized Natural Frequencies for damage detection in cantilever beam. J. Sound Vib. 2017, 402, 70–84. [Google Scholar] [CrossRef]
- Banerjee, A.; Panigrahi, B.; Pohit, G. Crack modeling and detection in Timoshenko FGM beam under transverse vibration using frequency contour and response surface model with GA. Nondestruct. Test. Evaluation 2016, 31, 142–164. [Google Scholar] [CrossRef]
- Dahak, M.; Touat, N.; Kharoubi, M. Damage detection in beam through change in measured frequency and undamaged curvature mode shape. Inverse Probl. Sci. Eng. 2018. accepted. [Google Scholar] [CrossRef]
- Mazanoglu, K.; Sabuncu, M. A frequency based algorithm for identification of single and double cracked beams via a statistical approach used in experiment. Mech. Syst. Signal Process. 2012, 30, 168–185. [Google Scholar] [CrossRef]
- Moradi, S.; Razi, P.; Fatahi, L. On the application of bees algorithm to the problem of crack detection of beam-type structures. Comput. Struct. 2011, 89, 2169–2175. [Google Scholar] [CrossRef]
- Moezi, S.A.; Zakeri, E.; Zare, A.; Nedaei, M. On the application of modified cuckoo optimization algorithm to the crack detection problem of cantilever Euler–Bernoulli beam. Comput. Struct. 2015, 157, 42–50. [Google Scholar] [CrossRef]
- Kaminski, P.C. The approximate location of damage through the analysis of natural frequencies with artificial neural networks”. J. Process Mech. Eng. 1995, 209, 117–123. [Google Scholar] [CrossRef]
- Buezas, F.S.; Rosales, M.B.; Filipich, C.P. Damage detection with genetic algorithms taking into account a crack contact model. Eng. Fract. Mech. 2011, 78, 695–712. [Google Scholar] [CrossRef]
- Boubakir, L.; Touat, N.; Kharoubi, M.; Benseddiq, N. Application of improved accelerated random search algorithm for structural damage detection. Int. J. Acoust. Vib. 2017, 22, 353–368. [Google Scholar] [CrossRef]
- Touat, N.; Pyrz, M.; Rechak, S. Accelerated random search method for dynamic FE model updating. Eng. Comput. 2007, 24, 450–472. [Google Scholar] [CrossRef]
- Meirovitch, L. Fundamentals of Vibrations; McGraw-Hill Comp, Inc.: New York, NY, USA, 2001. [Google Scholar]
- Nahvi, H.; Jabbari, M. Crack detection in beams using experimental modal data and finite element model. Int. J. Mech. Sci. 2005, 47, 1477–1497. [Google Scholar] [CrossRef]
- Tada, H.; Paris, P.; Irwin, G. The Stress Analysis of Cracks Handbook; Del Research Corp.: Hellertown, PA, USA, 1973. [Google Scholar]
- Habtour, E.; Paulus, M.; Dasgupta, A. Modeling Approach for Predicting the Rate of Frequency Change of Notched Beam Exposed to Gaussian Random Excitation. Shock Vib. 2014, 2014, 164039. [Google Scholar] [CrossRef]


| Boundary Conditions | Material | Dimensions | |||||
|---|---|---|---|---|---|---|---|
| Material | E (GPa) | ρ (kg/m3) | υ | L (mm) | w (mm) | h (mm) | |
| Cantilever | Zicral | 72 | 2810 | 0.35 | 600 | 26 | 7.6 |
| Cracks | Natural Frequencies | |||||
|---|---|---|---|---|---|---|
| Case | (mm) | (%) | f1 | f2 | f3 | f4 |
| 0 | 0 | 0 | 17.265 | 108.11 | 302.34 | 591.42 |
| 1 | 150 | 20 | 17.185 | 108.09 | 301.27 | 589.05 |
| 2 | 150 | 40 | 16.911 | 108.02 | 297.64 | 581.41 |
| 3 | 300 | 15 | 17.253 | 107.78 | 302.34 | 589.64 |
| 4 | 300 | 50 | 17.09 | 103.58 | 302.34 | 568.64 |
| 5 | 450 | 30 | 17.263 | 107.64 | 298.47 | 584.89 |
| 6 | 450 | 60 | 17.241 | 105.04 | 279.46 | 558.25 |
| Case | (mm) | Error (%) | (%) | Error (%) |
|---|---|---|---|---|
| 1 | 150 | 0 | 21.47 | 1.47 |
| 2 | 150 | 0 | 42.62 | 1.62 |
| 3 | 302 | 0.33 | 16.27 | 1.27 |
| 4 | 300 | 0 | 52.86 | 2.86 |
| 5 | 452 | 0.33 | 32.51 | 2.51 |
| 6 | 446 | 0.67 | 62.17 | 2.17 |
| Mode No. | Case 0 (Intact Beam) | Case 1 (First Crack) | Case 2 (Second Crack) | ||
|---|---|---|---|---|---|
| Frequency (Hz) | Frequency (Hz) | Normalized Frequency | Frequency (Hz) | Normalized Frequency | |
| 1 | 16.17 | 15.67 | 0.9691 | 15.57 | 0.9936 |
| 2 | 102.79 | 101.42 | 0.9867 | 99.11 | 0.9772 |
| 3 | 297.32 | 296.13 | 0.9960 | 294.15 | 0.9933 |
| 4 | 601.79 | 601.66 | 0.9998 | 591.26 | 0.9827 |
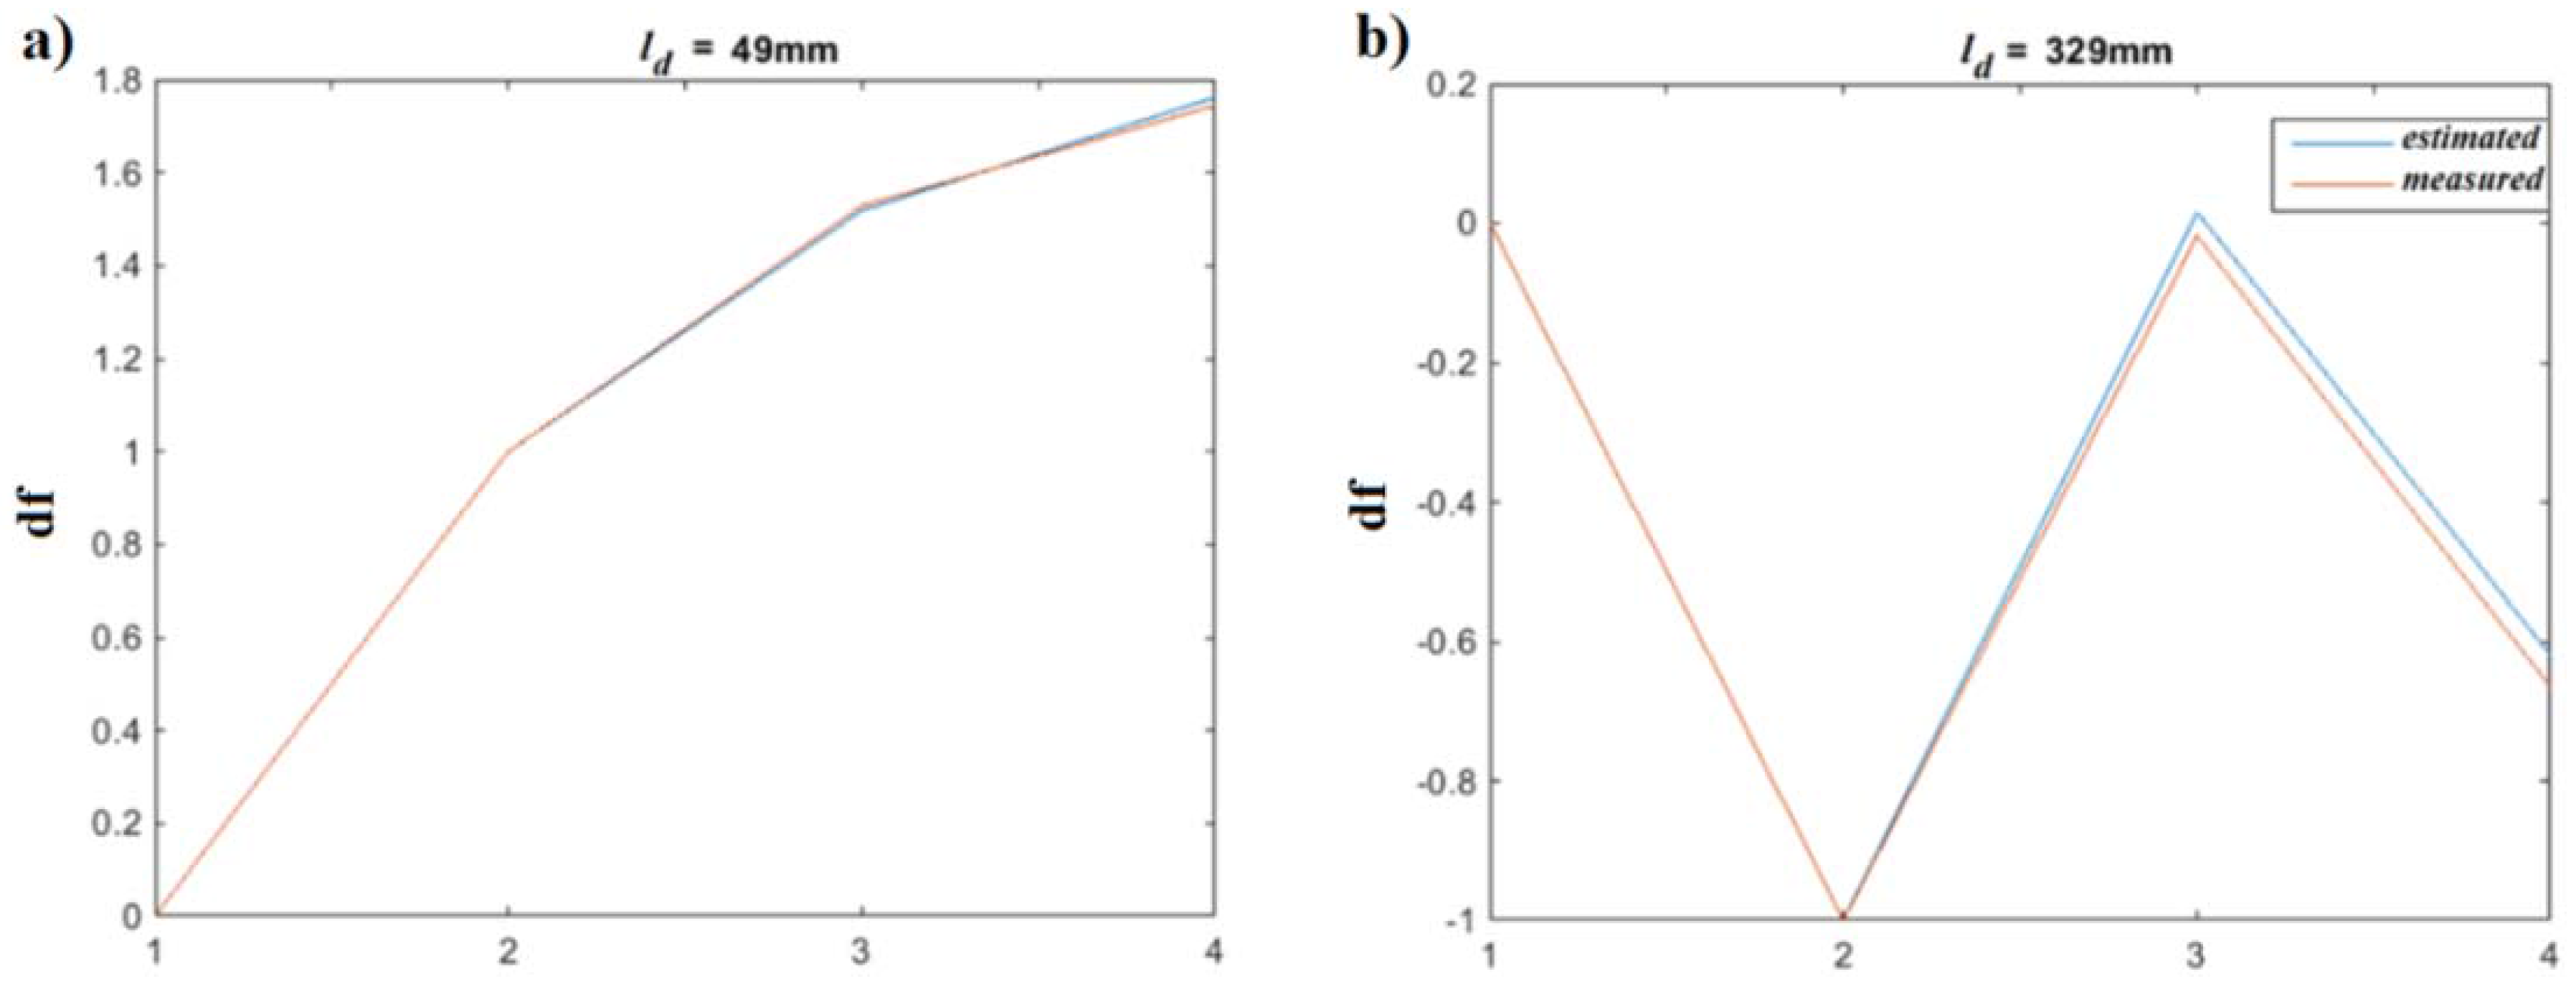
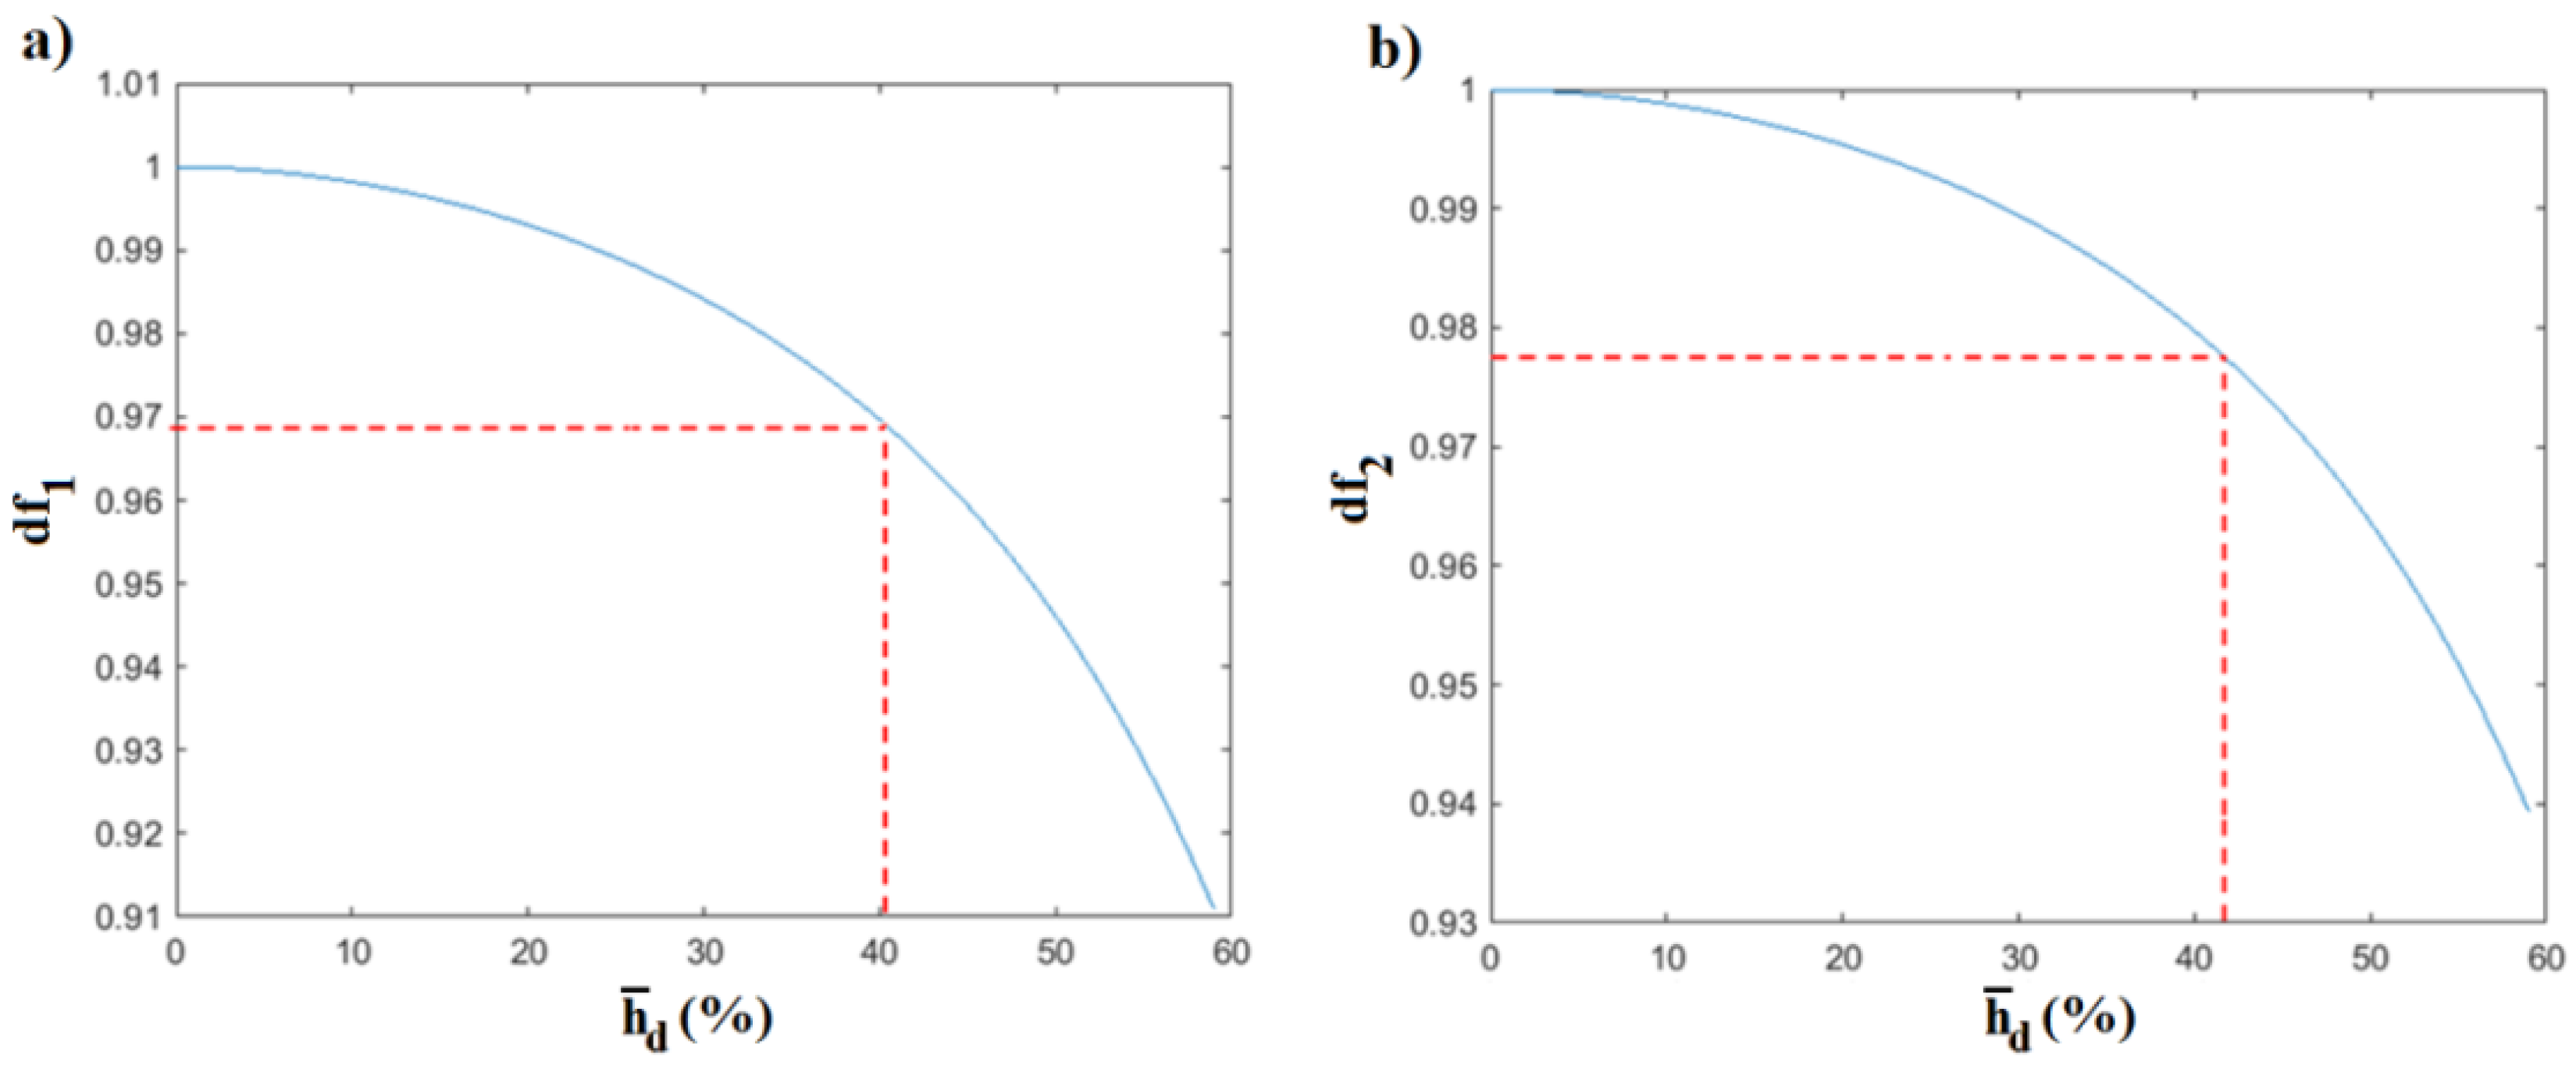
| Case | (mm) | Error (%) | (%) | Error (%) |
|---|---|---|---|---|
| 1 | 49 | 1.33 | 40.28 | 9.72 |
| 2 | 329 | 0.16 | 41.94 | 8.06 |
© 2018 by the authors. Licensee MDPI, Basel, Switzerland. This article is an open access article distributed under the terms and conditions of the Creative Commons Attribution (CC BY) license (http://creativecommons.org/licenses/by/4.0/).
Share and Cite
Dahak, M.; Touat, N.; Benkedjouh, T. Crack Detection through the Change in the Normalized Frequency Shape. Vibration 2018, 1, 56-68. https://doi.org/10.3390/vibration1010005
Dahak M, Touat N, Benkedjouh T. Crack Detection through the Change in the Normalized Frequency Shape. Vibration. 2018; 1(1):56-68. https://doi.org/10.3390/vibration1010005
Chicago/Turabian StyleDahak, Mustapha, Noureddine Touat, and Tarak Benkedjouh. 2018. "Crack Detection through the Change in the Normalized Frequency Shape" Vibration 1, no. 1: 56-68. https://doi.org/10.3390/vibration1010005
APA StyleDahak, M., Touat, N., & Benkedjouh, T. (2018). Crack Detection through the Change in the Normalized Frequency Shape. Vibration, 1(1), 56-68. https://doi.org/10.3390/vibration1010005