You Do Not Mess with the Glia


1
Department of Psychology, Vanderbilt University, Nashville, TN 37240, USA
2
Department of Biological Sciences, Vanderbilt University, Nashville, TN 37240, USA
3
Vanderbilt Brain Institute, Vanderbilt University, Nashville, TN 37240-7817, USA
*
Author to whom correspondence should be addressed.
Neuroglia 2018, 1(1), 193-219; https://doi.org/10.3390/neuroglia1010014
Submission received: 8 June 2018
/
Revised: 28 June 2018
/
Accepted: 3 July 2018
/
Published: 17 July 2018
Abstract
:Vertebrate neurons are enormously variable in morphology and distribution. While different glial cell types do exist, they are much less diverse than neurons. Over the last decade, we have conducted quantitative studies of the absolute numbers, densities, and proportions at which non-neuronal cells occur in relation to neurons. These studies have advanced the notion that glial cells are much more constrained than neurons in how much they can vary in both development and evolution. Recent evidence from studies on gene expression profiles that characterize glial cells—in the context of progressive epigenetic changes in chromatin during morphogenesis—supports the notion of constrained variation of glial cells in development and evolution, and points to the possibility that this constraint is related to the late differentiation of the various glial cell types. Whether restricted variation is a biological given (a simple consequence of late glial cell differentiation) or a physiological constraint (because, well, you do not mess with the glia without consequences that compromise brain function to the point of rendering those changes unviable), we predict that the restricted variation in size and distribution of glial cells has important consequences for neural tissue function that is aligned with their many fundamental roles being uncovered.
1. Introduction
The glue that keeps together the tendinous strings that permeate the body: that is a loose but literal translation of the term Neuroglia. Virchow’s original reference to connecting material (Nervenkitt), which he considered to be a true connective tissue (Zwischenmasse), is now known to be an underrepresentation of the role of these cells in nervous tissue [1,2]. To be fair, nerve cells have also kept their designation as “neurons”, even though both terms—one from the Latin, nervus, the other from the Greek, neuron—also grossly misrepresent what these cells actually are or do, for they literally mean tendon, cable, or sinew.
That both neurons and glia are still named after things they are not is a useful reminder of the achievements of scientific research. Persistence and inquisitiveness did bring the field a long way in understanding the actual roles of neurons and glial cells in animals. However, one simple, repeated observation could, or should, have raised much earlier suspicions of a fundamental role of glial cells in the nervous system: that every animal known to have neurons that are well differentiated from the ectoderm also has glial cells of some sort [3]. No matter what criteria are used to define glia, whatever their evolutionary or developmental origins, whether conserved across all animal clades, the fact remains that neurons do not come alone.
The developmental mechanisms that originate glial cells do appear to be shared and conserved across vertebrates, or even invertebrates, going back at least 500 million years [3,4,5,6,7]. Moreover, across a wide range of mammalian species, new evidence indicates that the mechanisms that regulate glial cell diversity and how they are added to brain tissue are indeed highly conserved in evolution. This conservation is the focus of this review: the remarkable constancy in some key characteristics regarding mammalian glial cells points to either strict biological constraints or the fundamental physical properties of these cells. In the face of abundant neuronal diversity, it becomes clear that, whatever the source of glial constancy, nature has not been able to mess with the glia.
1.1. The More Some Things Change, the More Others Stay the Same
In its simplest definition, biological evolution means change in the characteristics of life over geological time. Whereas it was once proposed that all nervous systems were derived by multiple, independent alterations starting from a single ancestral form [8,9,10], it now appears more likely that nervous systems organized multiple times independently during animal evolution [11,12]. A consequence of great relevance to comparative studies of brain tissue organization is that the two most widely used animal models for research—the fruit fly and the lab mouse—do not share homologous nervous systems derived from a common urbilaterian ancestor [12]. The lack of homology is the case even if many similar genes are expressed during the development of both vertebrates and invertebrates, which is to be expected given that the basic genetic toolkit of all animals appears to be shared from Cambrian ancestors [12].
If there is not a universal layout of the nervous system from which all versions derived, could they all still share homologous cell types? That is, are glia and neurons ancient cell types that predate animal diversity, and are they formed via the same, conserved developmental pathways in the various vertebrate and invertebrate species? Phylogenetic comparisons indicate that the machinery that allows synaptic transmission and gliotransmission did appear before the differentiation of specialized excitable cells in animals that employ them in particular ways [13]. Glial cells, and also neurons, do express similar markers across multiple vertebrate and invertebrate species, and radial glia-like cells are found in both protostomes and deuterostomes [14]. However, until phylogenomic analyses are performed systematically in a large enough number of species covering all major phyla, it is too early to draw a conclusion on whether all neurons, all radial glial types, and all myelinating cells share a conserved developmental program.
All vertebrates, however, do share a common ancestor exclusive to all of them [15,16,17,18,19], and, therefore, their nervous systems can be safely considered homologous in their organization and in the origin of the cell types that compose them, especially amongst amniotes (mammals and reptiles, including birds). That does not mean that the nervous systems of amniotes are identical; although most glutamatergic neurons are generated from radial progenitors through similar cascades of gene expression in all species examined, comparative studies of the composition of brain tissue across vertebrate species indicate that some neuronal phenotypes are particular to some clades [20]. Sauropsids (avian and non-avian reptiles), for instance, do not have commissural neurons in their cortex or pallium; those neurons are characteristic of placental mammals [21]. Callosal neurons, like other upper-layer neurons, presumably appeared during mammalian evolution with the diversification of transcription factors expressed in newly differentiated neurons in development [20].
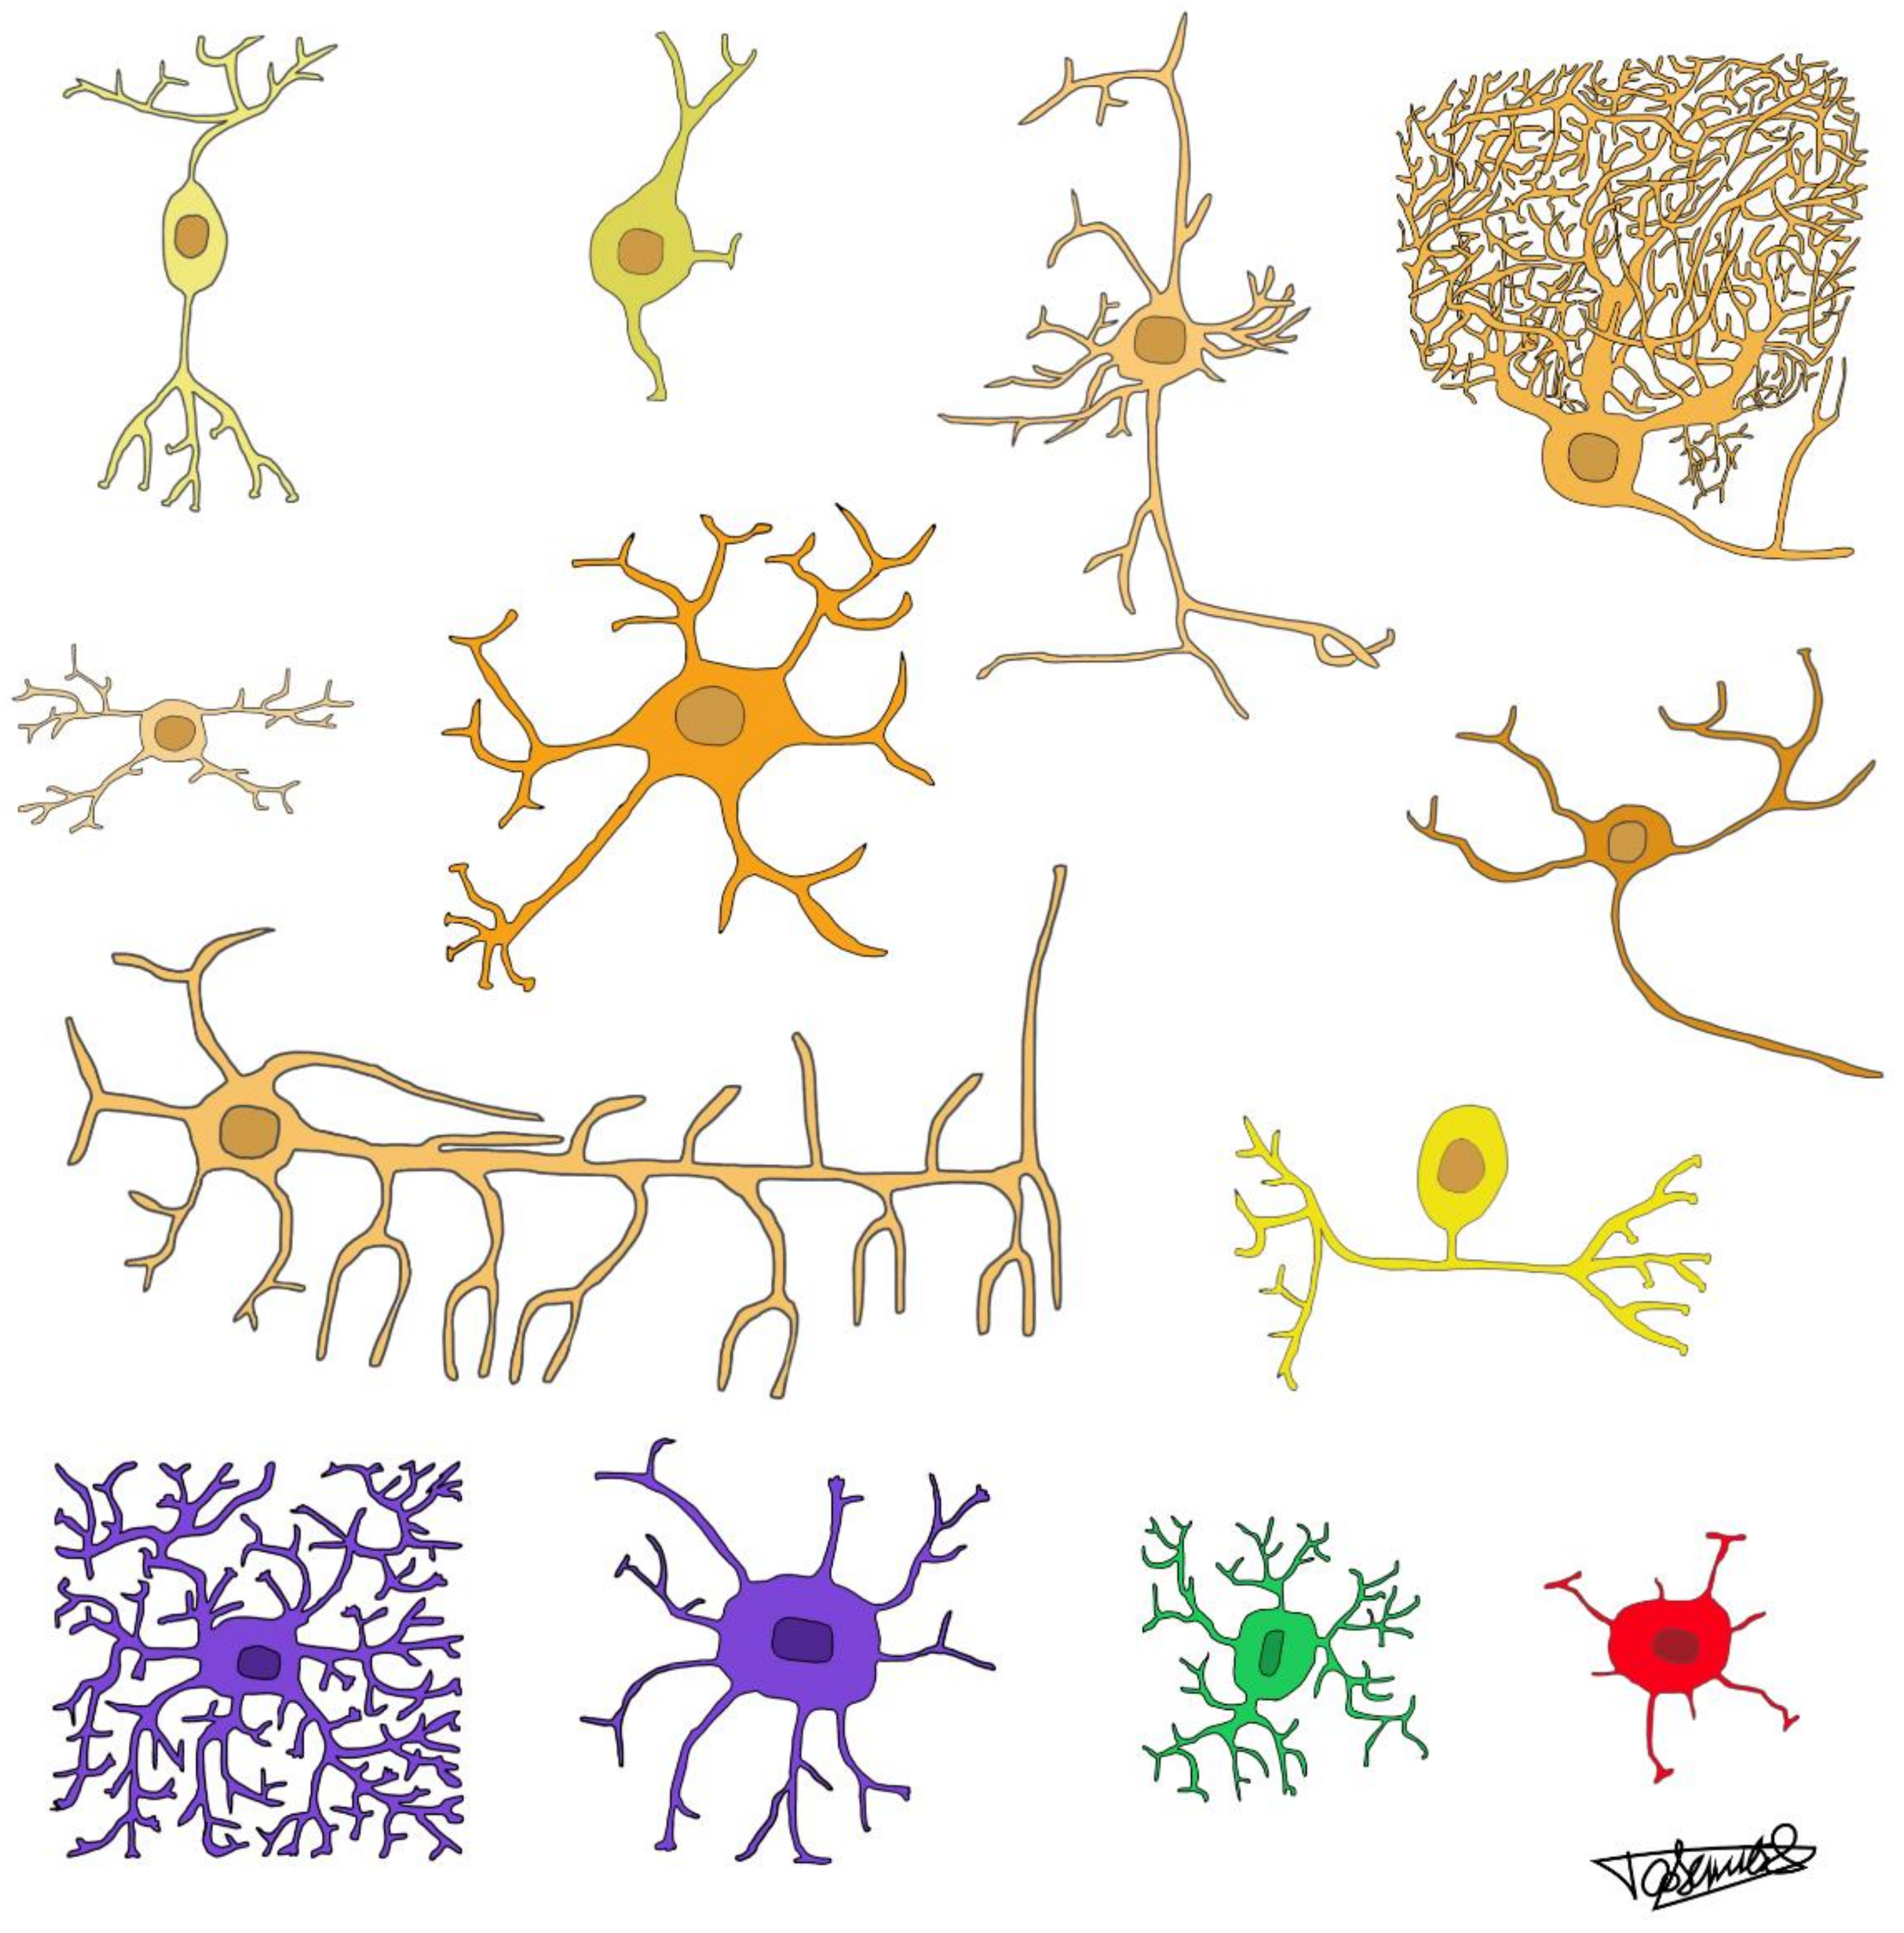
Neuronal cell types are, indeed, enormously diverse across brain structures and species in vertebrates, as illustrated in Figure 1. The much wider variation of neuronal compared to glial cell phenotypes is evident in a basic feature of nervous tissue: neurons are not distributed evenly in the tissue, instead agglomerated in clumps (nuclei), layers (cortices), or lattices (reticular formations), in which they form directional circuits. On the other hand, glial cells of different types are distributed much more homogeneously in nervous tissue and generate signals that remain local or spread little and concentrically through gap junctions [22]. Examples of clustering of neuronal, but not glial, cells are shown in Figure 2. Within glial networks, the component cells are considered equivalent in form and function; within neuronal networks, the component cells typically differ in chemical phenotype, electrophysiological properties, and connectivity patterns, endowing each part of the network with a different function.
Indeed, neurons can express multiple combinations of excitatory, inhibitory, or modulatory transmitters, whereas astrocyte cells appear to use mostly glutamate, purines, and d-serine [27]. It remains possible that interest in gliotransmission has been so recent that not many substances have been identified as mediators (just like there once were only two known neurotransmitters, acetylcholine and noradrenaline), but given the wide range of tools and resources available now to glia-minded researchers, a much greater degree of diversity should have been unveiled by now, if it existed. Similarly, while neurons may be large and highly branched with specifically targeted or widely diffuse projections, small with only local projections, or anything between those extremes, with both dendrites and axons highly intertwined with those of other neurons, glial cells, whether astrocytes, oligodendrocytes, or microglial in type, tend to have many, but only local, branches that form bricks that subdivide the parenchyma into mostly non-overlapping territories or tiles [28] (Figure 1). Such territories are consistent with known contact-mediated inhibition of proliferation of glial cell precursors [29].
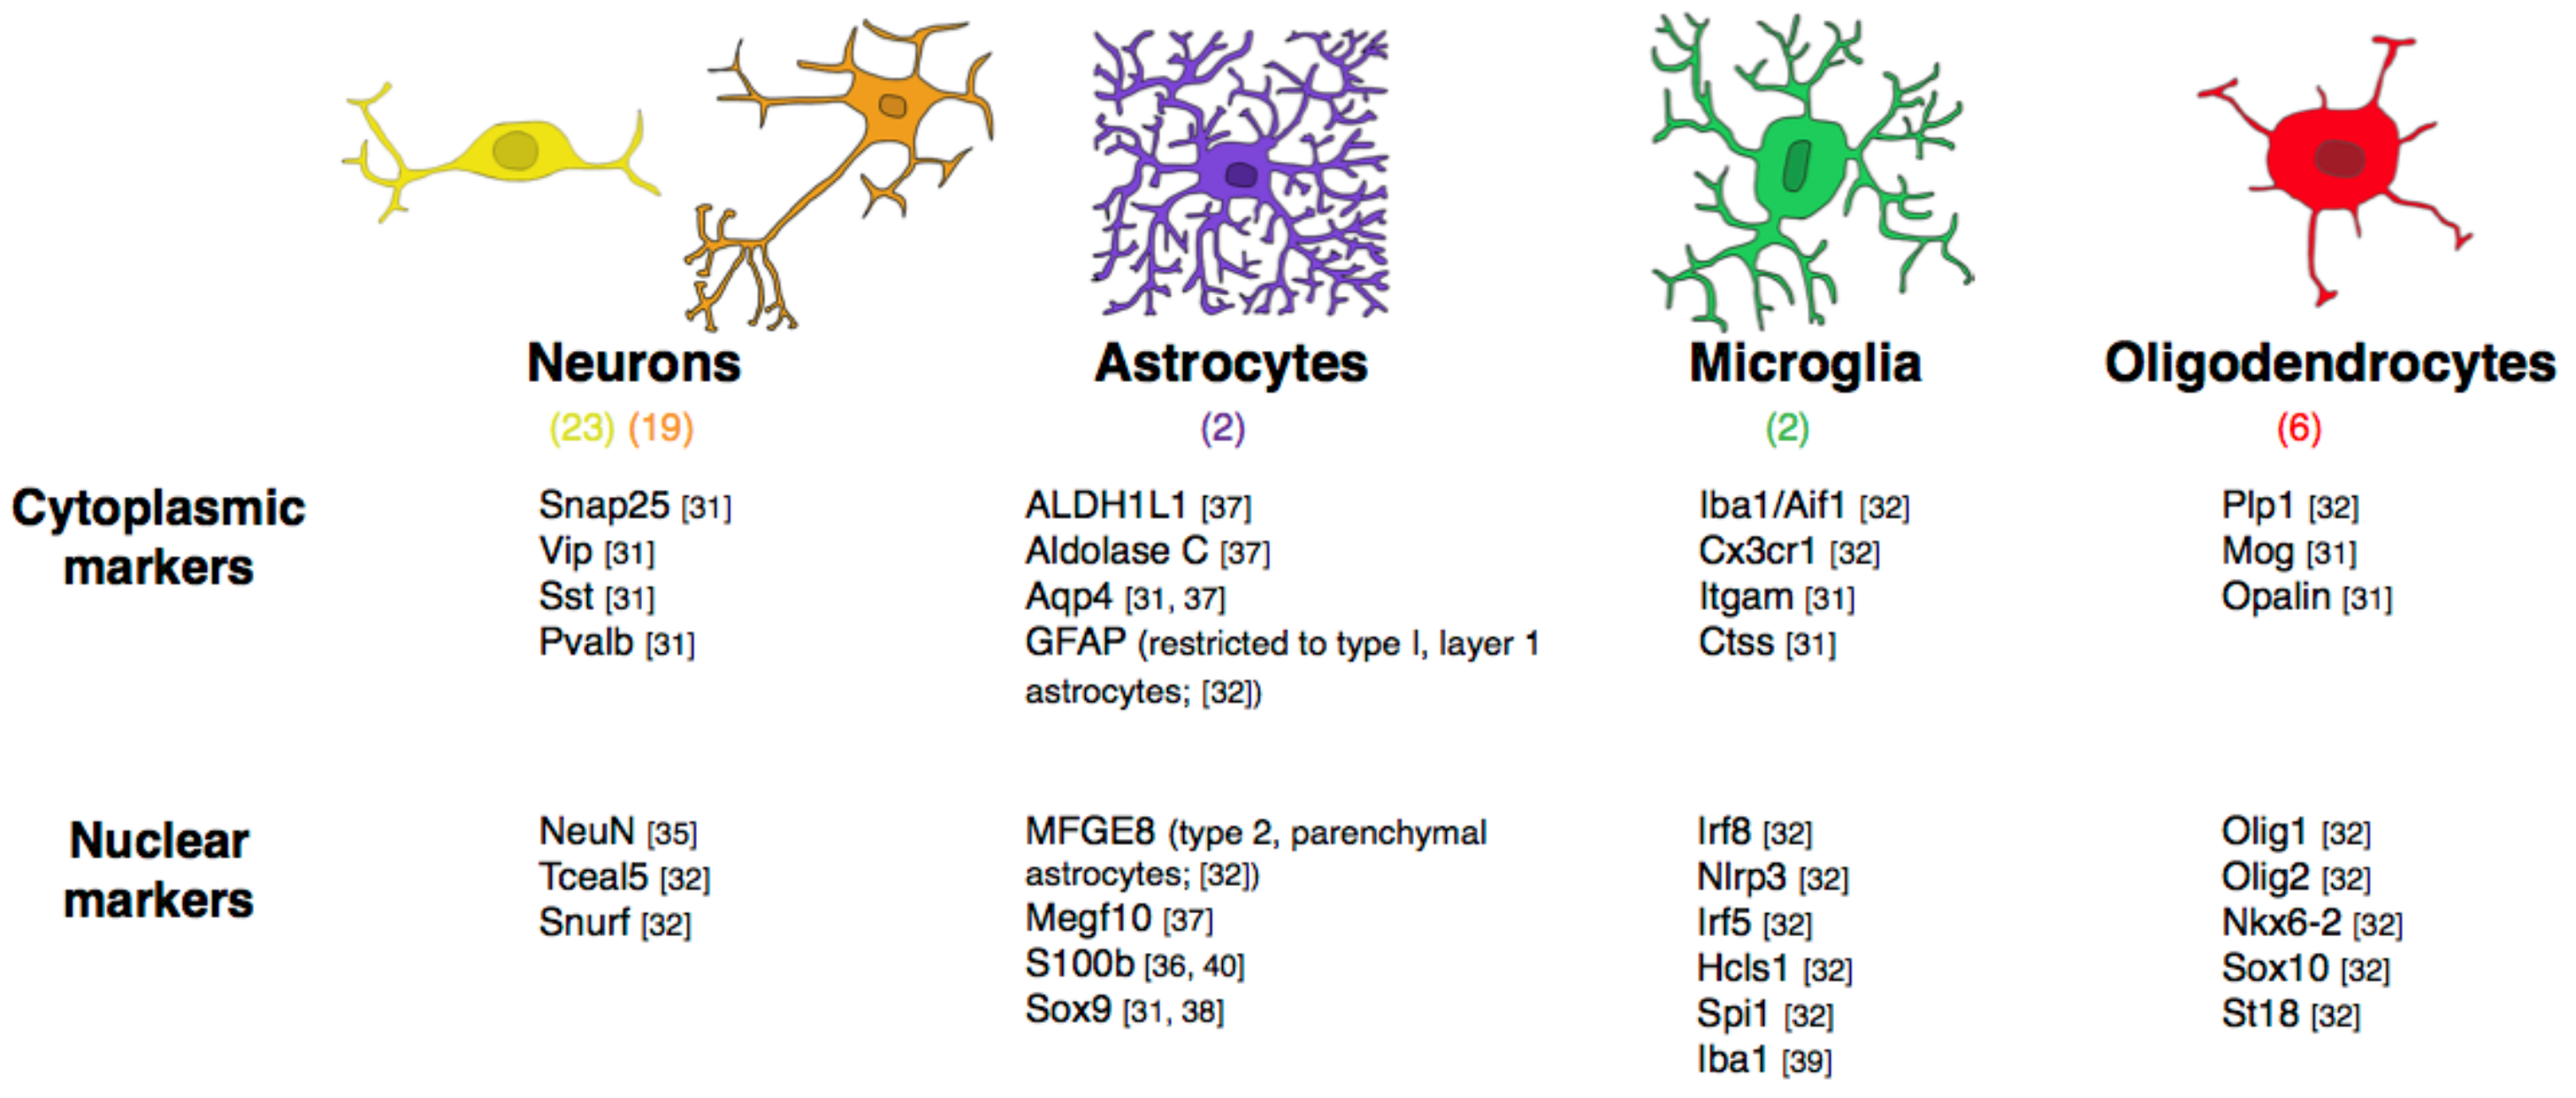
Although cell type classification is currently a much-debated issue, recent gene expression-based studies of the cell types found in brain tissue confirm that neuronal cell type diversity, gauged by unsupervised clustering analysis of single-cell transcriptomics, is much greater than that of non-neuronal cell types [30]. Using single-cell RNA sequencing (RNAseq), such studies have found that individual neurons in the mouse cerebral cortex and hippocampus express on average 4-fold more RNA and almost twice as many different genes than non-neuronal cells [31]. These studies have also identified various classes of neuronal cell types based on the clusters of co-expressed genes, which have been uncovered across thousands of cells examined. While the number of brain structures analyzed is still small, and so far, has been restricted to mouse, human, and zebrafish [32,33,34], a clear pattern already emerges of many more neuronal than non-neuronal cell types. Whereas neurons in mouse primary visual cortex can be subdivided into 42 subtypes, grouped as either excitatory (19 subtypes) or inhibitory neurons (23 subtypes), the number of non-neuronal cell subtypes in the same cortex is only seven, comprising a single type of astrocyte, a single type of oligodendrocyte (which may be subdivided in three stages of differentiation), a single type of microglial cell, and two types of vasculature-associated cells [31] (Figure 3). While that study was biased towards neurons, an unbiased single-cell RNAseq study in mouse somatosensory cortex and hippocampus found similar results: 13 subtypes of pyramidal neurons, 16 subtypes of interneurons, but only 2 subtypes of astrocytes, 1 subtype of microglia, and 6 subtypes of oligodendrocytes that actually correspond to different maturation stages, so are not true cell subtypes [32]. That study confirmed the finding that individual neurons contain more RNA than glia, and a larger number of detectable genes [32]. Even in the juvenile zebrafish brain, as many as 45 neuronal subtypes were identified, but only 3 oligodendrocyte and 1 microglial subtype(s) [34]. Having highly diverse neuronal cell types but very few glial cell types is thus a feature of both fish and mammals.
Gene expression-based estimates of the high diversity of neuronal cell types have been confirmed by more complete analyses of combined morphological, functional, and biochemical types of interneurons [41]. Although some studies have preferentially targeted neuronal cell types [31,33], others have aimed at being at least semiquantitative, capturing the proportions of cells found in the tissue examined, as discussed below [32,34]. While these studies are powerful in the depth and breadth of single-cell transcriptomic analysis, they will probably remain limited to mouse, rat, zebrafish, or human brains, for practical reasons, since the current requirement for fresh, unfixed tissue means that the tissue donor must be alive during tissue collection (but see below). Still, the rising evidence already indicates that, at least across vertebrates, neurons must have been free to change and diverge into multiple phenotypes as brains evolved, whereas glial cells have been more restricted.
1.2. Quantitative Neuroanatomy: Counting Cells by Turning Brains into Soup
Maybe neuronal cell types were most numerous, but non-neuronal cells still outnumbered neurons as a whole—or so it was long stated in the literature [42]. For a couple of decades, scientists and journalists could get away with unreferenced claims, typically in the opening lines of original papers and reviews, that glial cells as a whole, or astrocytes in particular, are the most common cell type in the brain [43,44,45,46,47]. That those claims made it through peer review and editorial processes is a testament to how widely they were believed to represent actual facts—or to extoll the virtues of the underestimated other cells of the nervous system. The view that glial cells far outnumbered neurons was found in one of the most important and influential modern textbooks [48] and maintained, in a toned-down but still incorrect version, in the most recent 5th edition [49].
The underlying problem was that, in a scientific game of telephone, glia/neuron ratios in a few brain structures had been mistaken as representative of the whole human brain [42]. While quantitative data to the contrary were not abundant for a long time, they certainly existed, and not just in the human brain. For instance, a compilation of estimates of neuronal and glial cell density available in the cerebral cortex of mammalian species showed that those densities were clearly in the same range, with no obvious preponderance of glial cells [50], and that glial cell densities were quite stable across species [51]. Even Reinhard Friede’s first (incorrect) description that there were more glial cells per neuron in more advanced species still listed only fewer than two glial cells per neuron in the human cerebral cortex [52].
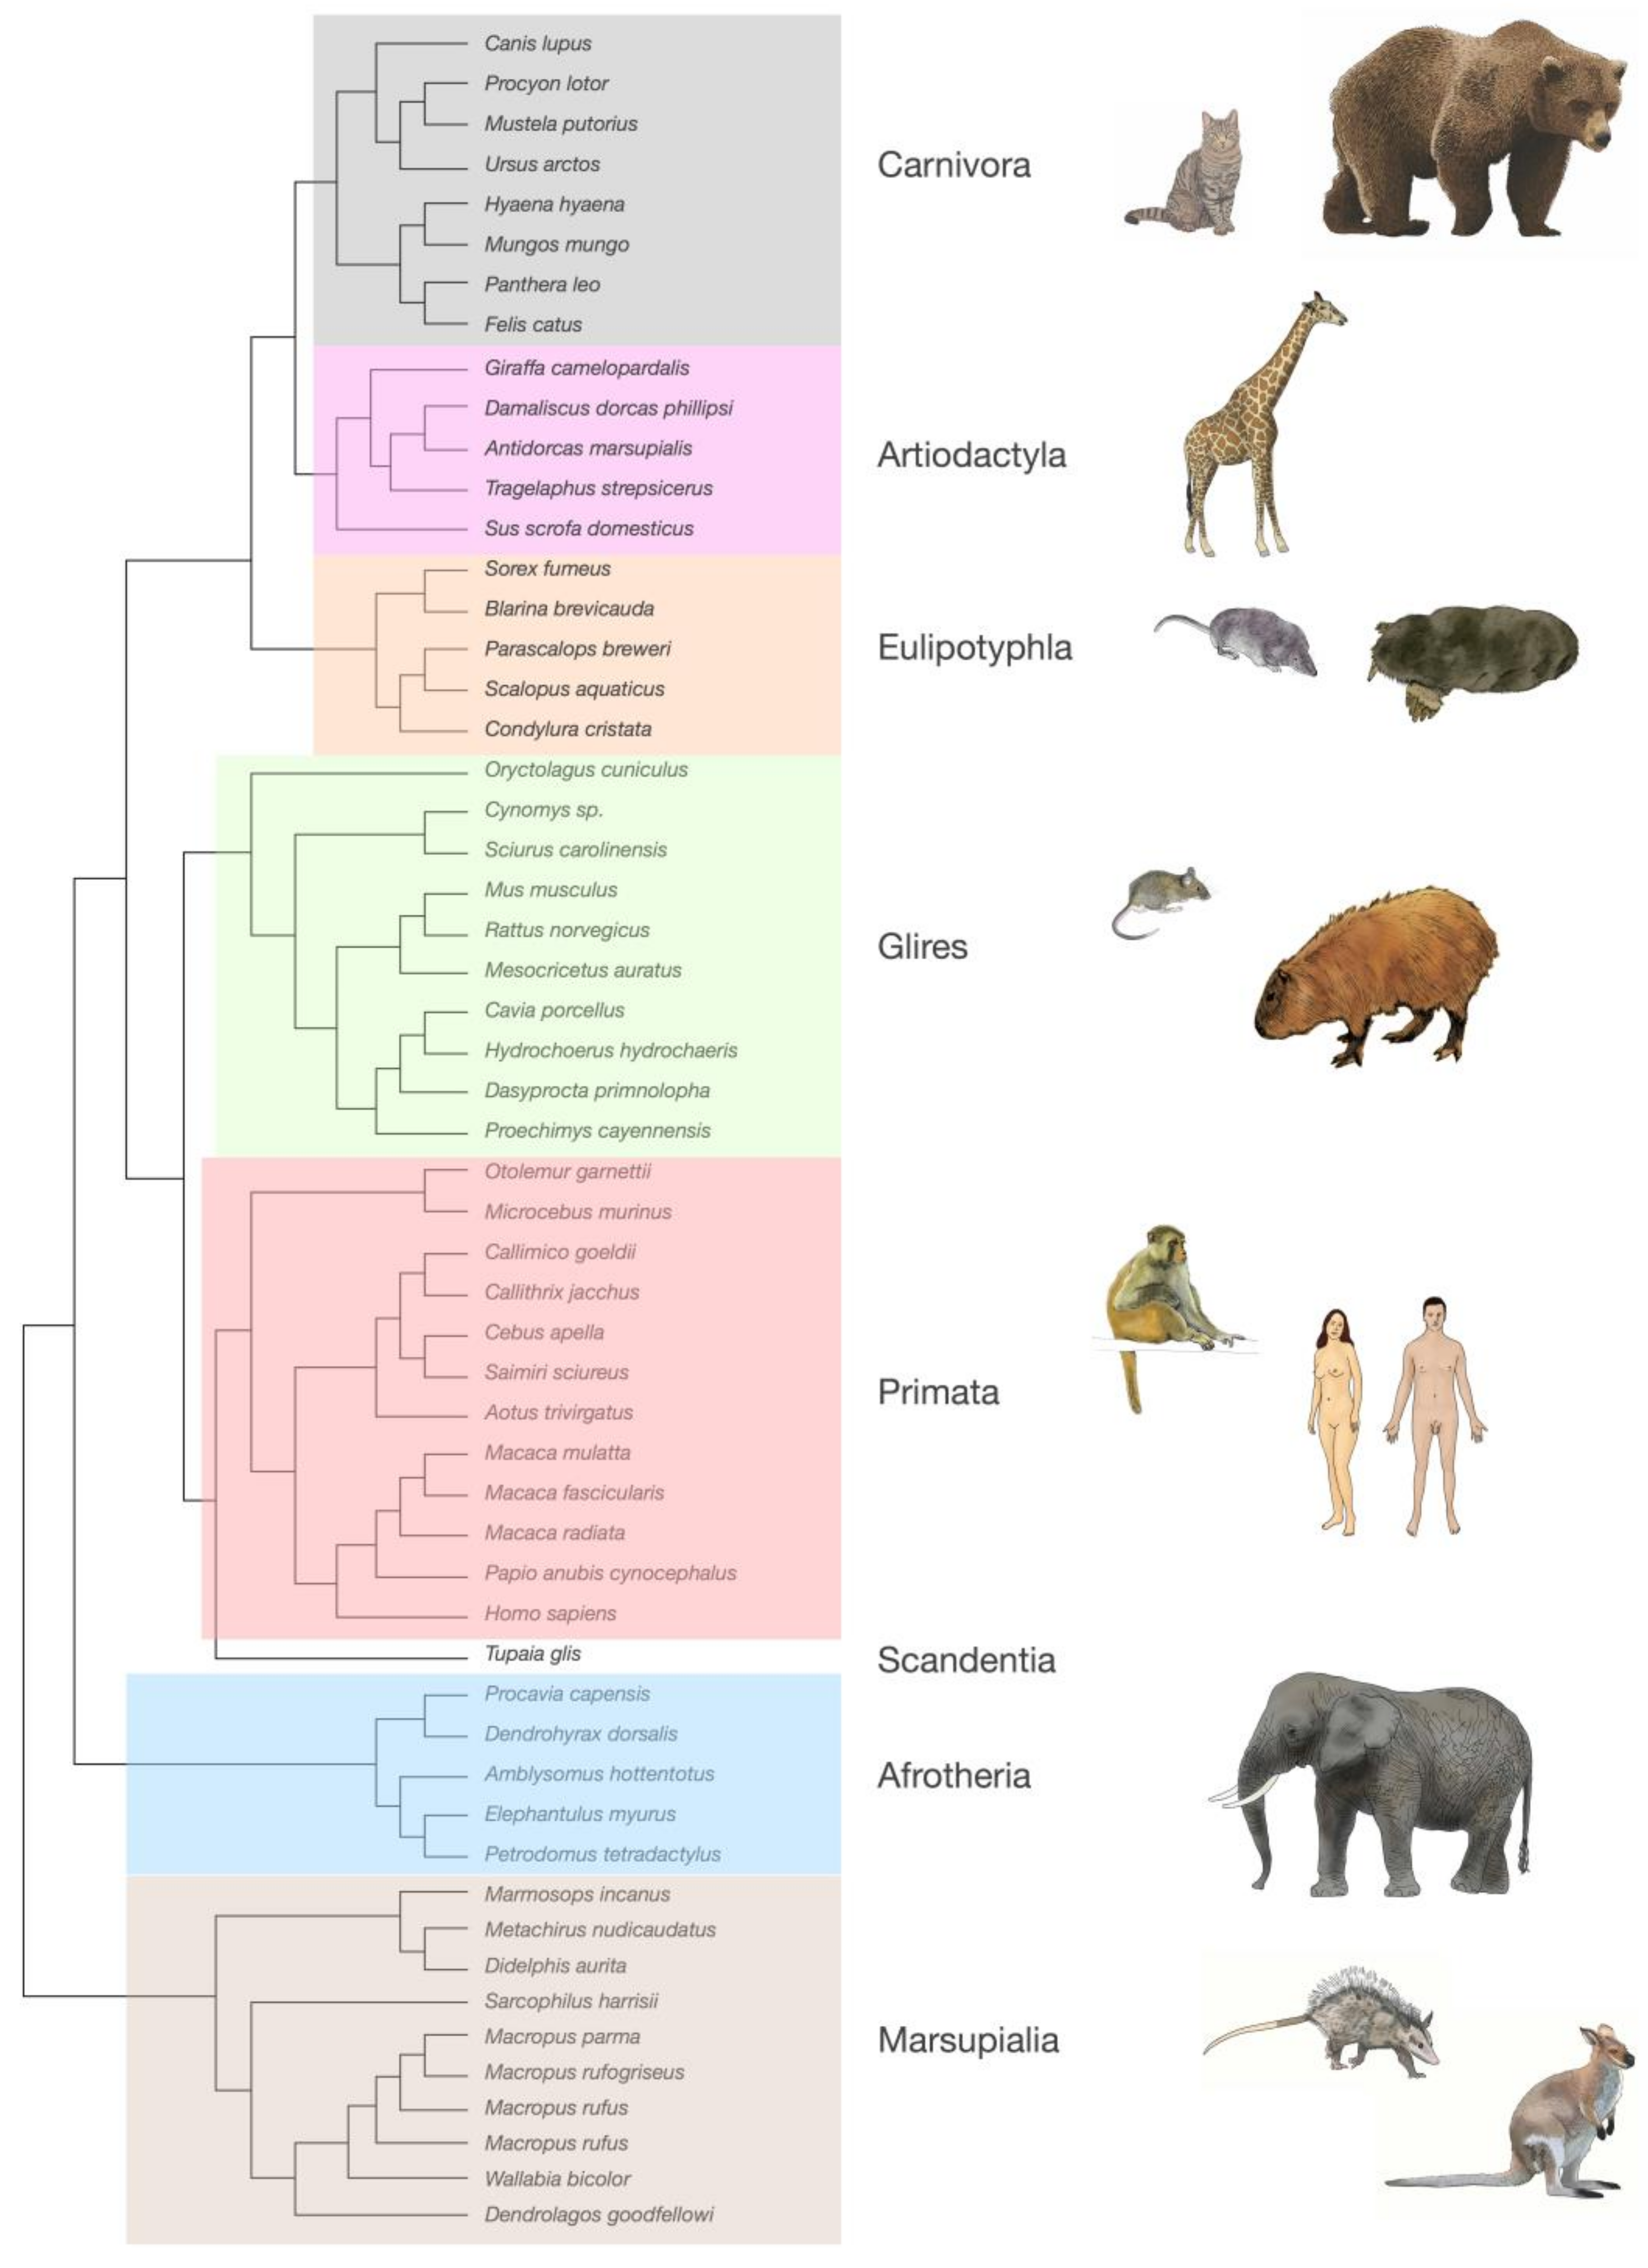
Over the last 12 years, we and our collaborators have generated a wealth of data on the numbers of neuronal and non-neuronal cells that compose brain structures in over 50 species of mammals [53,54,55,56,57,58,59,60,61,62,63,64]. Our systematic approach to determine the cellular composition of brain structures in a manner that was readily comparable across species, using reproducible dissection criteria, employed a quantitative technique that we developed—the isotropic fractionator [65]. This method consists in first dissolving dissected, fixed regions of interest into a soup of free-floating cell nuclei, whose density can be quickly determined in a cell-counting chamber under a fluorescence microscope. Multiplying the density of nuclei in suspension by the volume of the suspension yields the total number of nuclei in the original structure, and, therefore, the total number of cells (assuming that mammalian brain cells have one and only one nucleus per cell). Finally, morphological criteria or immunocytochemical markers, such as the universal neuronal nuclear marker NeuN [35], can be used to determine the proportion of nuclei that belong to particular cell types. Importantly, this cell quantification technique has been found by three independent groups to yield results that are comparable to those obtained with unbiased stereology, but are much faster to obtain and far less prone to user error and undersampling [66,67,68]. The consistency of the approach and technique across studies allowed us to collect data that could be compared systematically across structures in individual brains; across individuals of the same species; across species within a clade; across mammalian clades (Figure 4); and even across mammals, birds, and non-avian reptiles [53,54,55,56,57,58,59,60,61,62,63,64,69,70,71]. While published results have so far been limited to numbers of neuronal and non-neuronal cells, one advantage of the isotropic fractionator is that, because all tissue heterogeneities in cell distribution are literally dissolved, only very small samples are required for counting, which allows for storage of the remaining suspension at −20 °C for later studies employing new markers or morphological criteria [65]. Because the cell cytoplasm is lost, counting specific cell types in this way requires markers expressed in the cell nucleus. However, the growing wealth of single-cell transcriptomic data has been rapidly providing cell type-specific markers that can be used for this purpose in our stored collection of processed brain samples, which will be used as we are able to validate them as reliable, cell type-specific, and universal markers across species and clades (see below).
So far, we have defined neurons as nuclei (confirmed by compatible size, shape, and presence of 4′,6-diamidino-2-phenylindole (DAPI)-stained DNA) that express NeuN [72], and non-neuronal or other cells as all remaining nuclei, by exclusion of the NeuN-expressing fraction. This procedure leaves no cell unaccounted for, that is, the sum of NeuN-positive and -negative nuclei is the total number of nuclei, and therefore of cells, in the tissue of origin. While a few neuronal cell subtypes are known to not express NeuN, such as photoreceptors, Purkinje cells, mitral cells, and some hypothalamic neurons [35], those are such a small minority amongst all cells that, for the purposes herein of reporting and comparing total numbers in different structures and species, any misrepresentation of NeuN-negative neurons as non-neuronal cells can be considered negligible.
Dividing the total number of neuronal and other cells by the mass of the dissected structure of origin yields densities of neurons and other cells, respectively, expressed as number of cells per milligram of tissue. If brain tissue were made of a single type of cell, then cell density, even though calculated as number of nuclei per volume or mass, would mathematically equal the inverse of average cell size (including soma, all dendrites, all axonal arbors, and the enveloping extracellular space). The advantage of using cell densities over cell sizes is that the former are much more tractable experimentally, because even if cell integrity is, by definition, lost in our method, the number of nuclei per mass of original tissue amounts to the density of cells that composed that tissue. In contrast, measuring full three-dimensional (3D) cell size directly is a much more complicated and still impractical endeavor.
With tissue defined as being composed of neuronal and non-neuronal cells, the relationship between density and average cell size for each of the two classes of cells depends on the proportion of tissue mass that is occupied by each. Using a simple mathematical model of how densities relate to masses in this case, and building on the finding that densities of non-neuronal cells are much less variable than neuronal densities (see below), we were able to estimate that the average volume of non-neuronal cells indeed is proportional to the inverse of non-neuronal cell densities across mammalian brain structures and species [73] (see below).
2. Neurons Are Highly Variable in Density; Other Cells, Not So Much
Although several other groups have published independent, isolated estimates of cell densities using other methods in the same period, all data reported heretofore are limited to those acquired by our group and collaborators using the isotropic fractionator and consistent anatomical criteria, which ensure that all data are directly comparable across brain structures in all species indicated in Figure 4. In all of our studies, cerebral cortex includes the hippocampus, all cortex lateral to the rhinal sulcus, and the underlying subcortical white matter; in a growing number of studies, gray and white matter have been examined separately, and that is mentioned explicitly in this review, where applicable. Cerebellum includes the cerebellar peduncles, subcortical white matter, and deep nuclei; rest of brain is the ensemble of hindbrain-midbrain-striatum-diencephalon (not including the cerebellum) [74]. The olfactory bulbs are counted separately, when available, which they often are not due to the difficulty of collecting them intact.
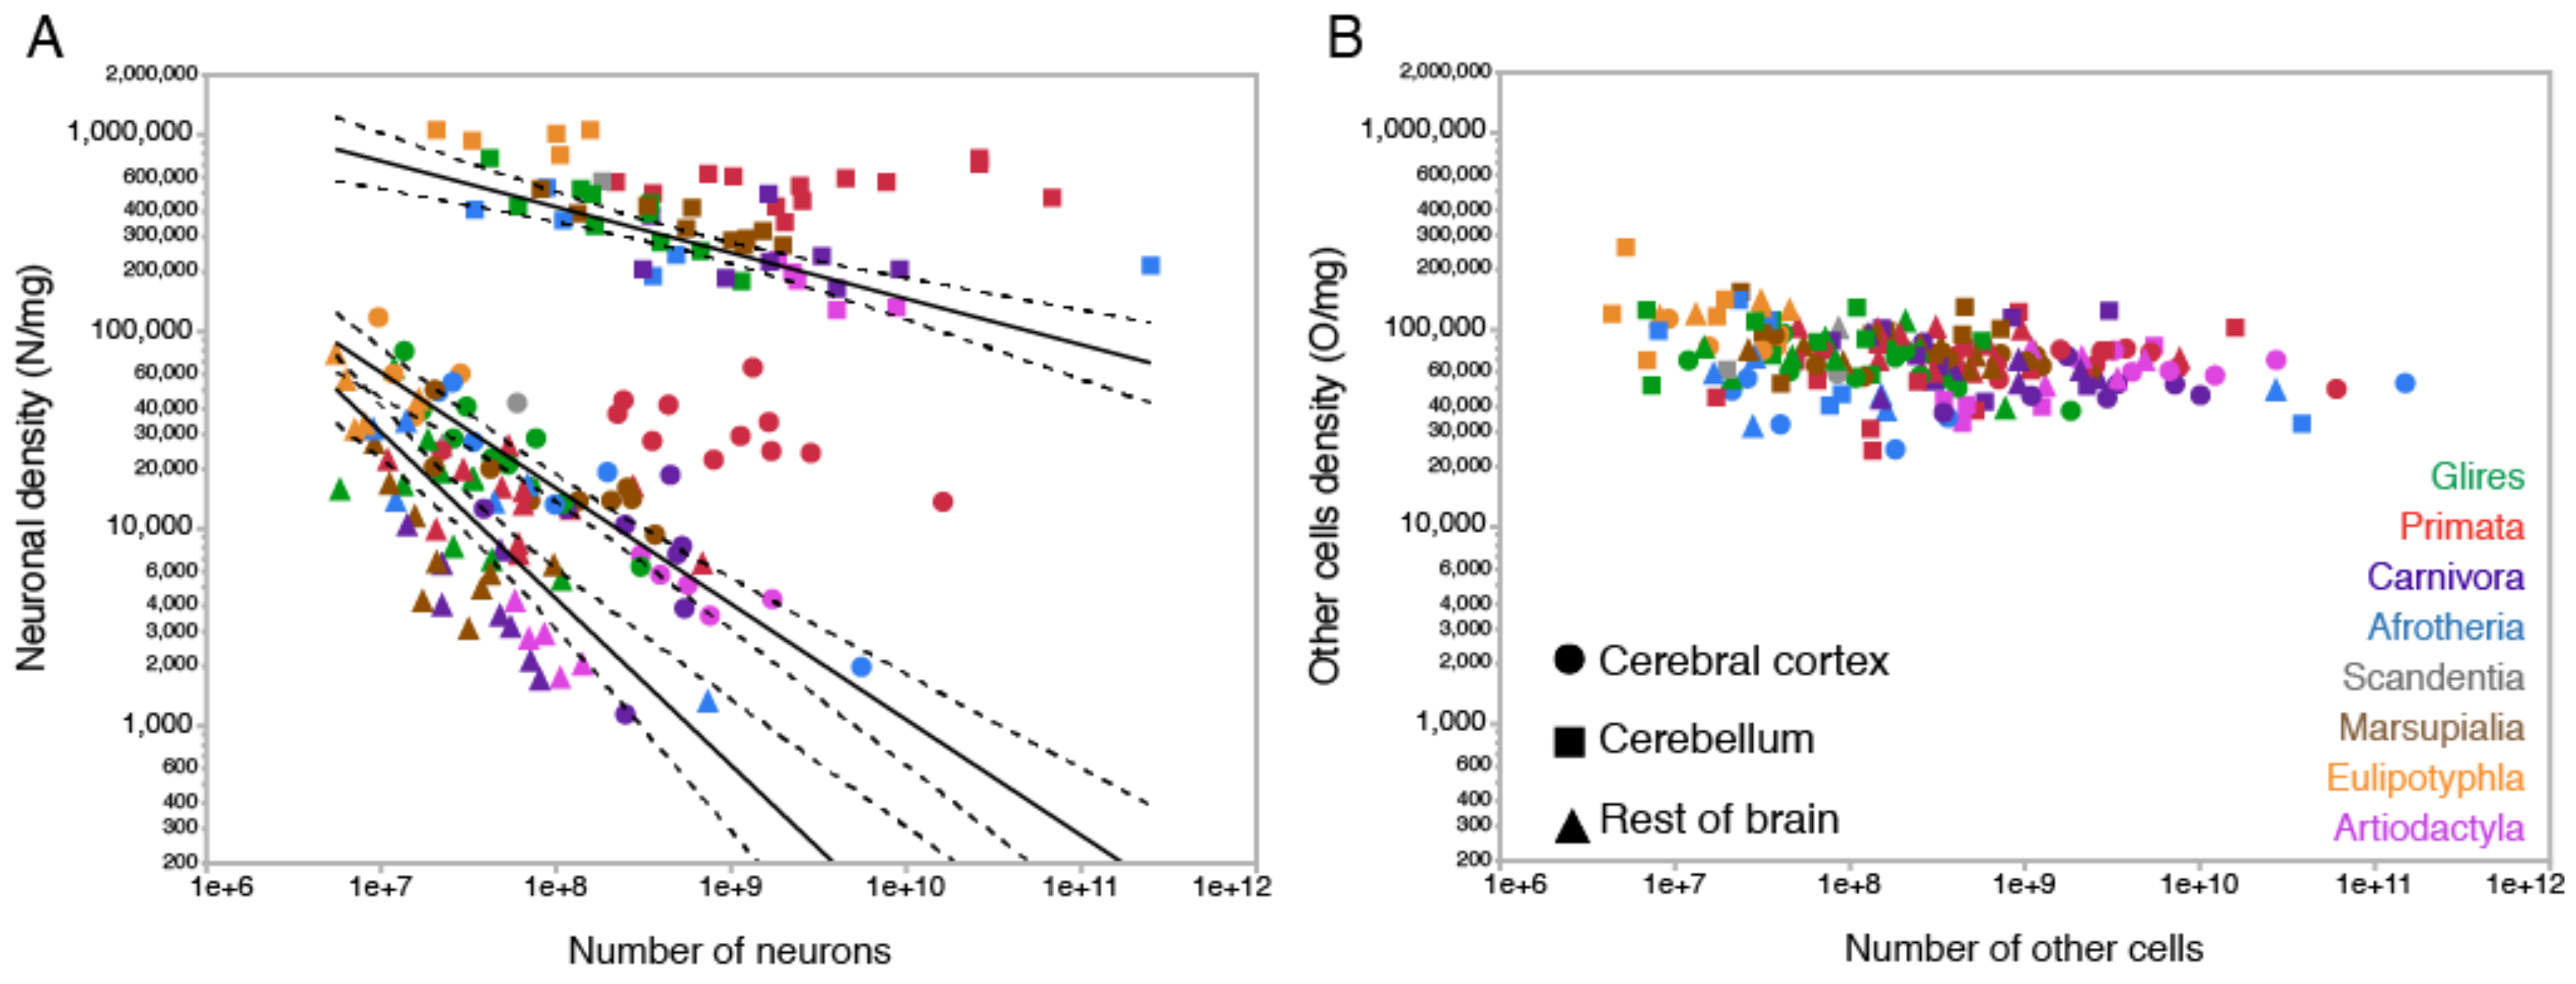
To put non-neuronal cell densities into context: we find that neuronal density varies by about 1000-fold across brain structures and species, from as few as a couple thousand neurons/mg in cerebral cortex or rest of brain structures to as many as one million neurons/mg in the cerebellum (Figure 5A). Within each structure, neuronal densities may or may not vary systematically across species: for instance, neuronal densities in the cerebellum of eulipotyphlans are consistently high (Figure 5A, orange squares) and are equally constant, albeit at lower values, across primate species (Figure 5A, red squares), whereas neuronal densities decrease systematically with increasing numbers of neurons in the cerebellum of species of other mammalian clades (Figure 5A, other squares). In the cerebral cortex, neuronal densities decrease systematically with increasing numbers of neurons across non-primate species but fail to do so across primates [75] (Figure 5A, red and other circles).
In contrast, the density of other cells varies by not even 10-fold across the same structures and species as their numbers of other cells increase, mostly concentrating around 50,000–90,000 cells/mg (Figure 5B, shown in the same scale as A). The much smaller variation in the density of other cells is not due to lack of variation in total numbers of non-neuronal cells in the brain across species; as seen in Figure 5B, absolute numbers of other cells are exactly as variable across mammalian species and brain structures as the absolute numbers of neurons in those structures, by a factor of 100,000. Thus, regardless of how many neurons are found in 1 mg of brain tissue, a similar number of non-neuronal cells are found in that same 1 mg, in any brain tissue (including white matter; see below), in any mammalian species. Intuitively, the most likely scenario that accounts for this finding is that, in 1 mg of any brain tissue in any mammalian species, non-neuronal cells have a similar overall average size (defined as cell body plus any and all ramifications), while neuronal cells can range from very small (as in the cerebellum) to very large (as in the cerebral cortex and rest of brain). The simple mathematical model described above confirmed that the average neuronal and non-neuronal cell size can indeed be estimated as the inverse of neuronal and non-neuronal cell densities, respectively, as detailed below.
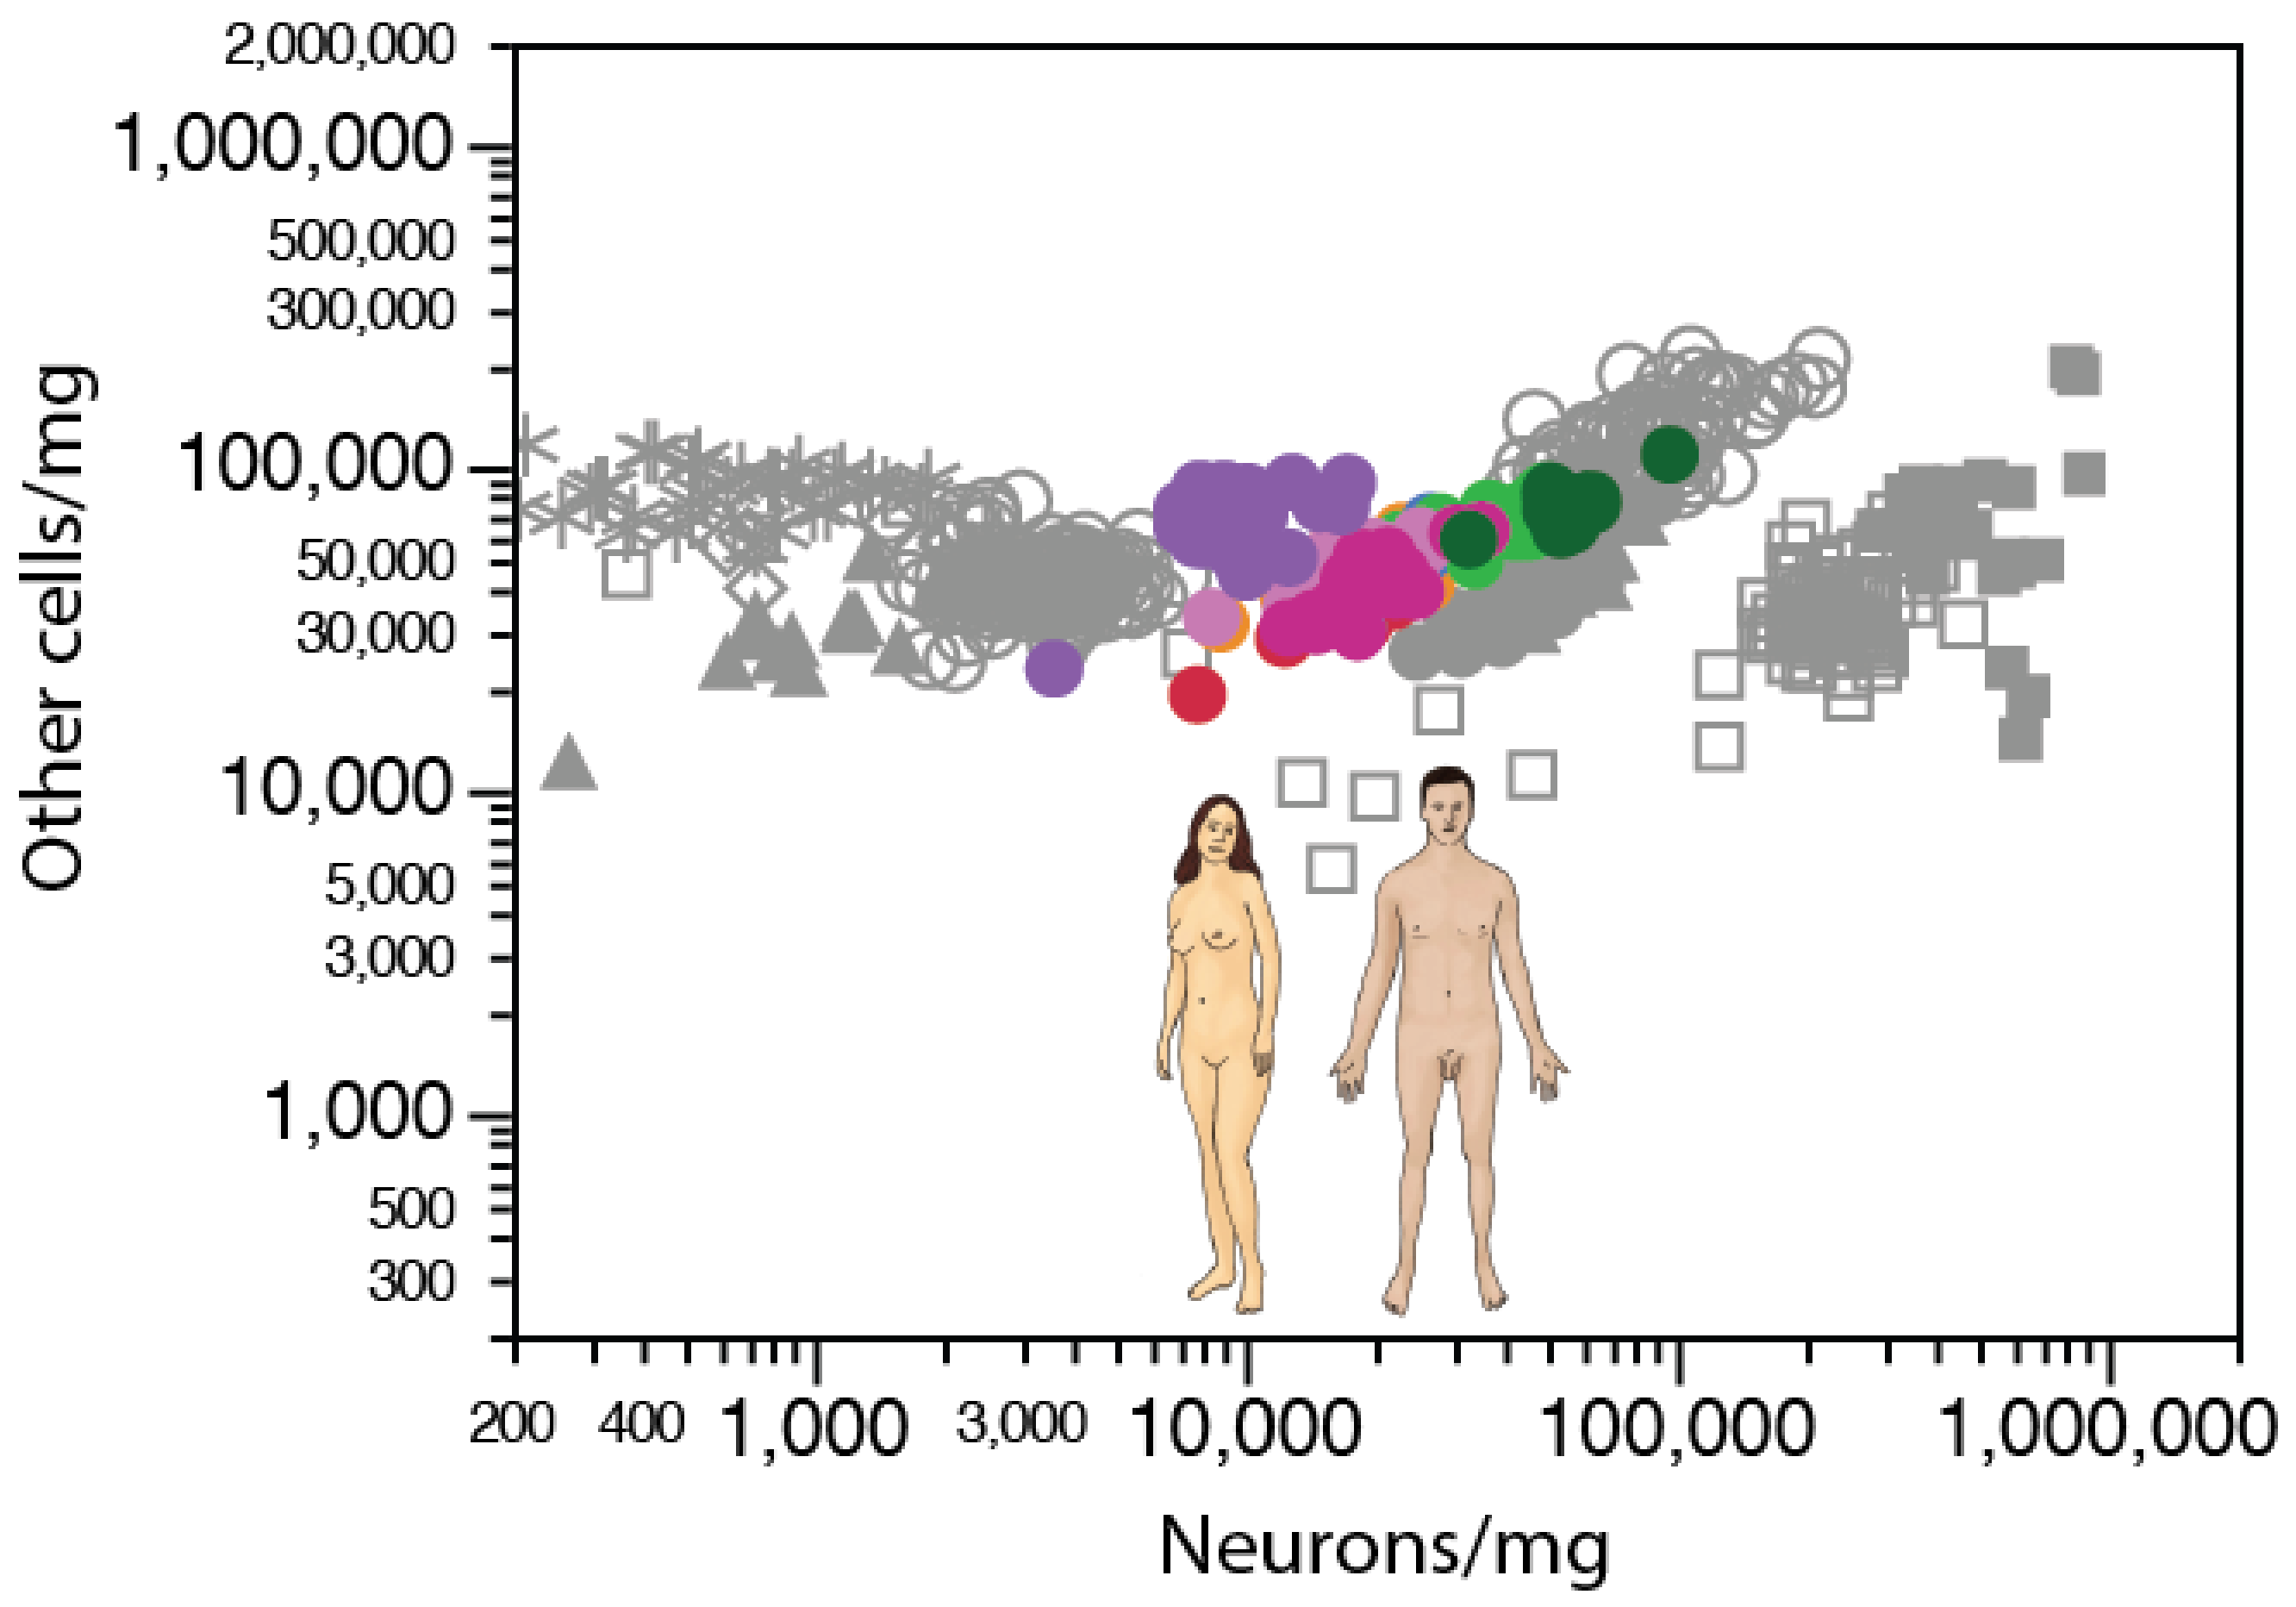
Across mammalian species, direct examination of neuronal and non-neuronal densities in different brain structures shows how the former span three orders of magnitude, whereas the latter are concentrated within a single order of magnitude, whether in the cerebellum, cerebral cortex, or rest of brain (Figure 6A). Within a single species (Swiss mouse), neuronal and non-neuronal densities vary together (as assumed in our model that estimates average cell volume from density [69]), such that those individuals with higher neuronal densities in a given brain structure also have higher non-neuronal cell densities in the structure, although always within a much-restricted range, than across species (Figure 6B, shades of orange/magenta; [69]). Neuronal and non-neuronal cell densities are positively correlated across individuals within each of the main brain structures (cerebral cortex, cerebellum, and the rest of brain), despite the much higher neuronal densities in the cerebellum [69]. Consistently, neuronal and non-neuronal densities were also positively correlated across different cortical areas identified by cytoarchitectural features in four C57B/6J mouse individuals (Figure 6B, shades of blue and green; [76]) and in one human cerebral cortex (Figure 7; [77]).
Importantly, despite the much higher neuronal densities found in the cerebellum of the same mouse individuals, densities of other cells there were similar to those found in the cerebral cortex and rest of brain (Figure 6B, compare the squares in shades of red/magenta with other shapes of similar color). Non-neuronal cell densities are similar across brain structures and species as distinct in brain size and distant in evolutionary kinship as the lab mouse and the African elephant, as illustrated in Figure 6B, despite neuronal densities being about 10-fold higher in the Swiss mouse cerebral cortex (orange/magenta circles) than in the gray matter of the elephant cerebral cortex (black circles).
A similar pattern also applies across sites in a single human cerebral cortex [77], where neuronal densities vary by as much as ten-fold across the anterior–posterior axis, but non-neuronal densities vary by only virca (ca.) three-fold and remain in the same range as non-neuronal densities in the elephant and mouse cortex (Figure 7).
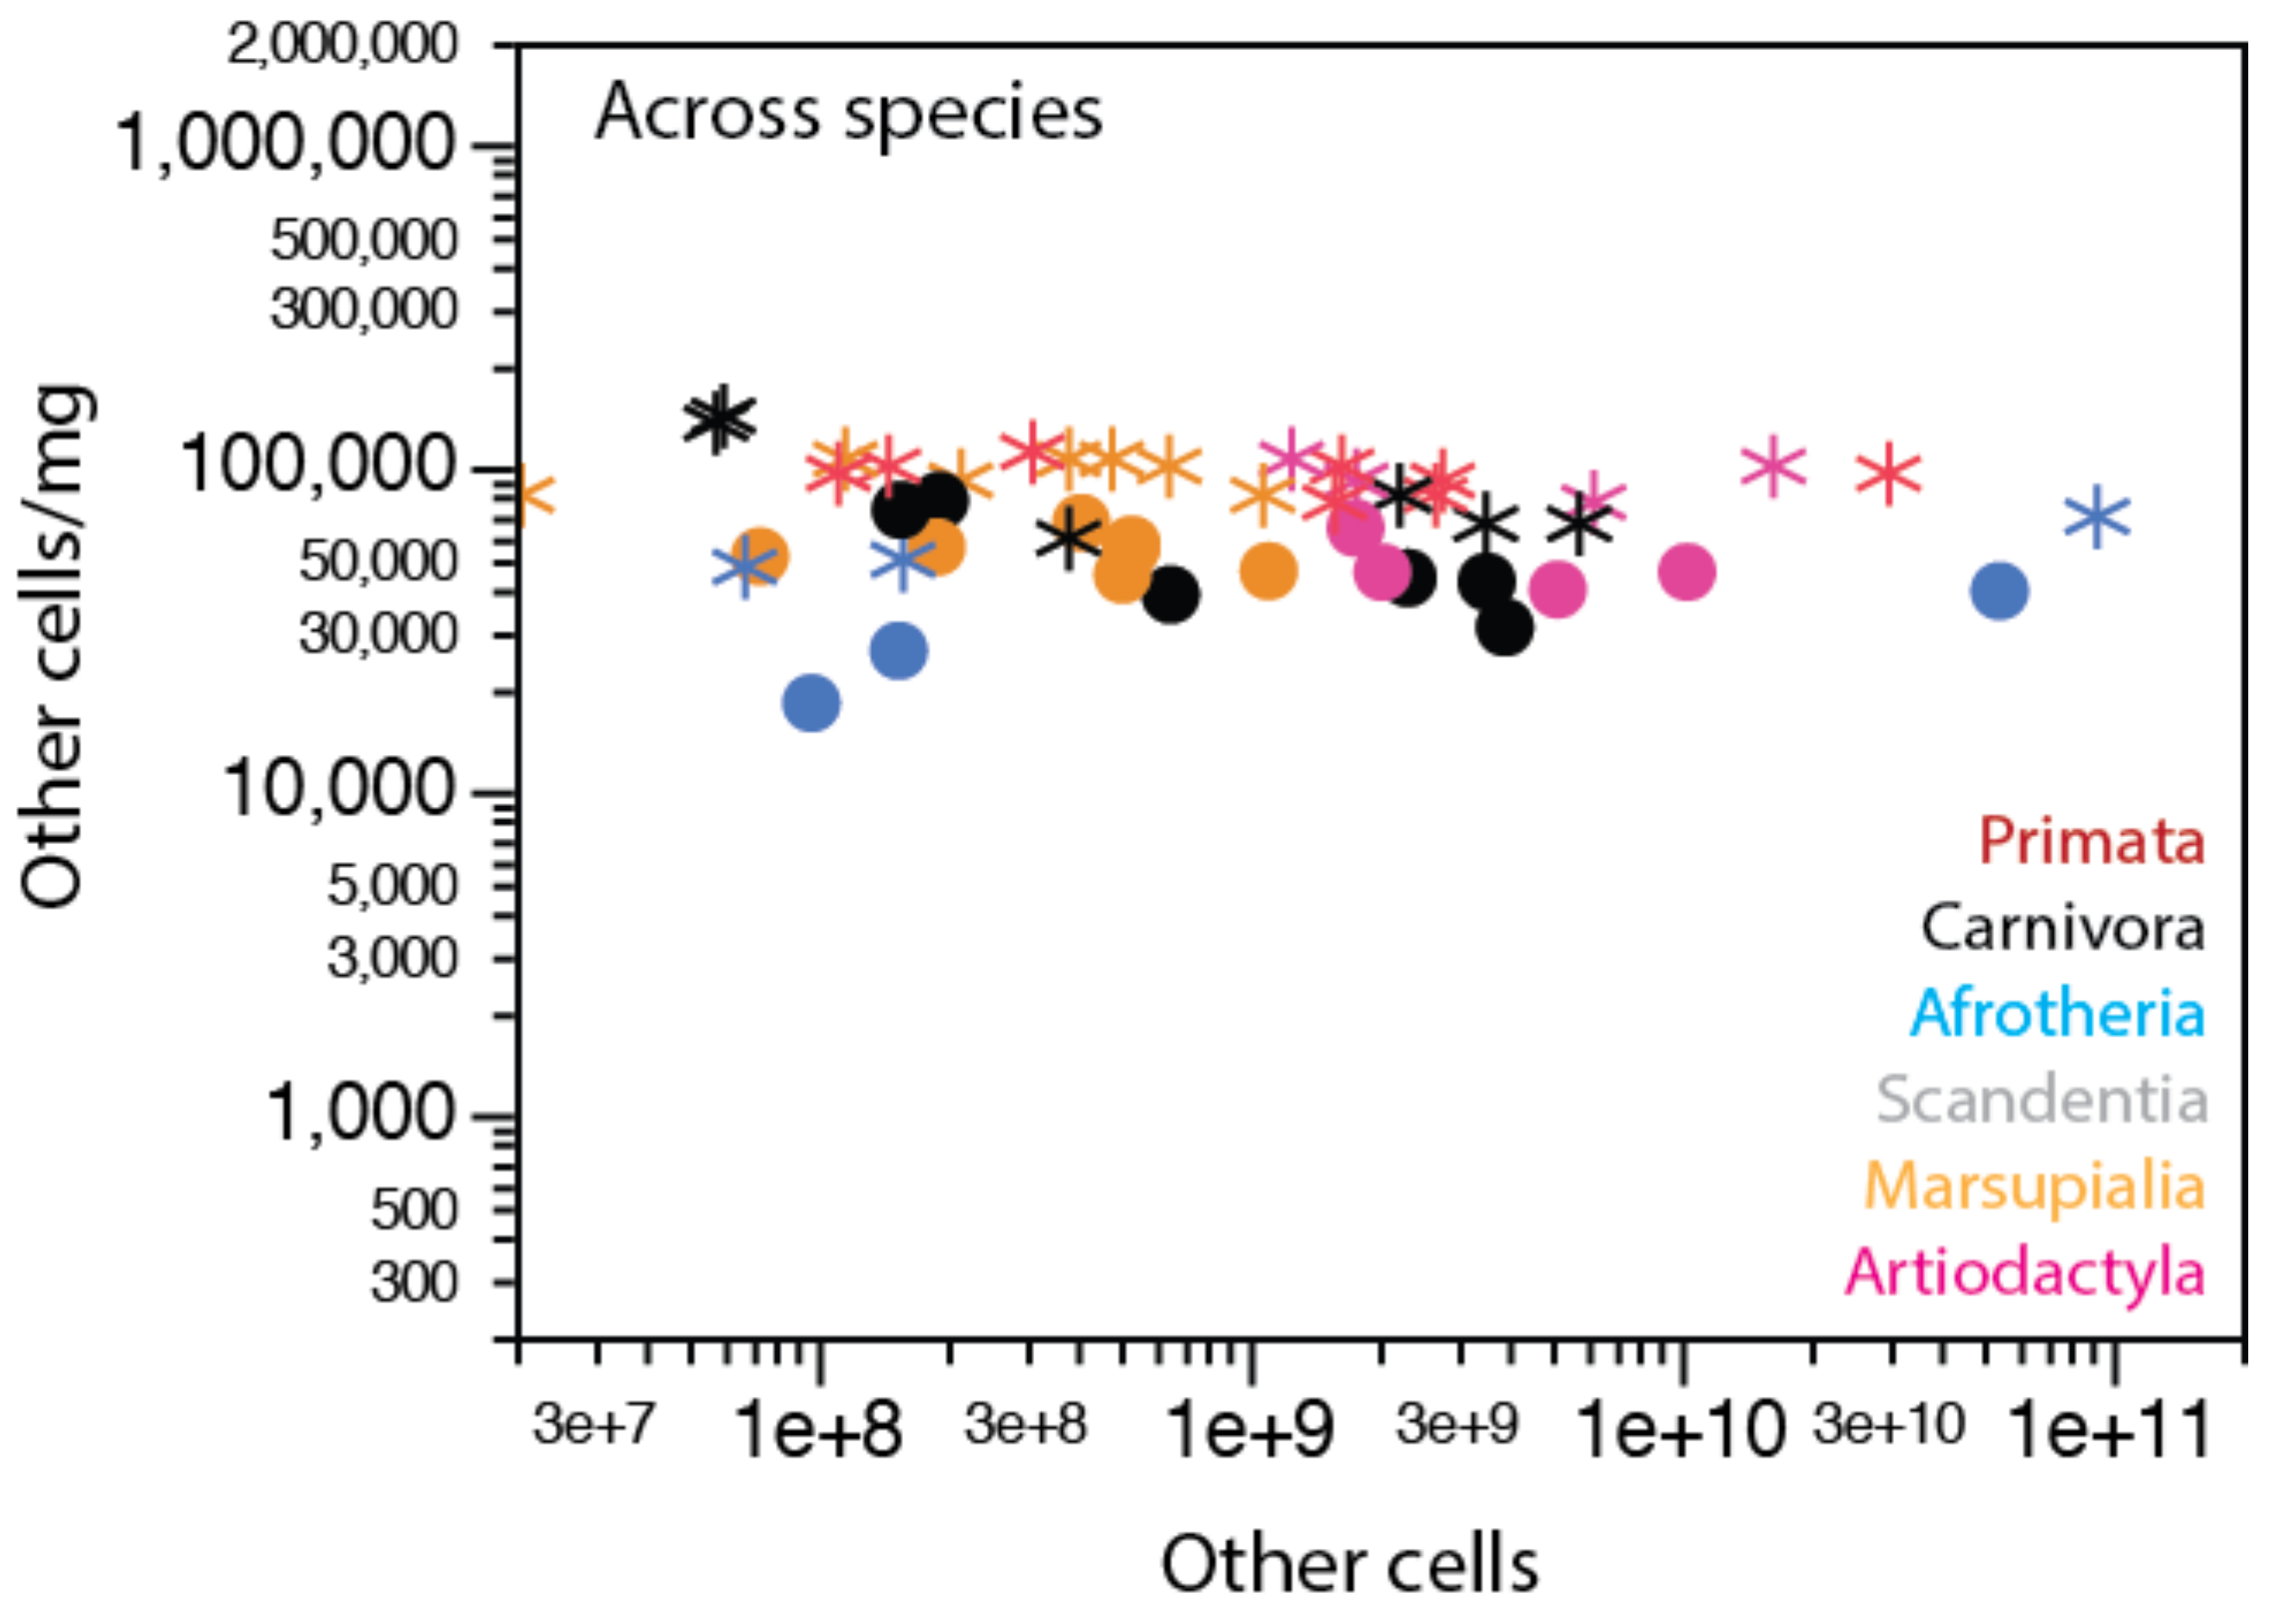
Average non-neuronal cell densities within the gray or white matter of the cerebral cortex, separately, are also very stable across species, as shown in Figure 8 across 27 species of marsupials, primates, scandentia, afrotherians, and artiodactyls. The average density of non-neuronal cells is lower in gray matter than in subcortical white matter, at 53,398 ± 15,793 cells/mg and 85,867 ± 18,053 cells/mg, respectively (Wilcoxon, p < 0.0001; Figure 8, compare stars and circles). However, given the high concentration of neuronal cell bodies in the gray matter, a lower average density of non-neuronal cells in the gray matter is still to be expected if the average size of glial cells is identical in both tissues. Only direct, systematic measurements of glial cell size in gray and white matter of different species will be able to settle this issue.
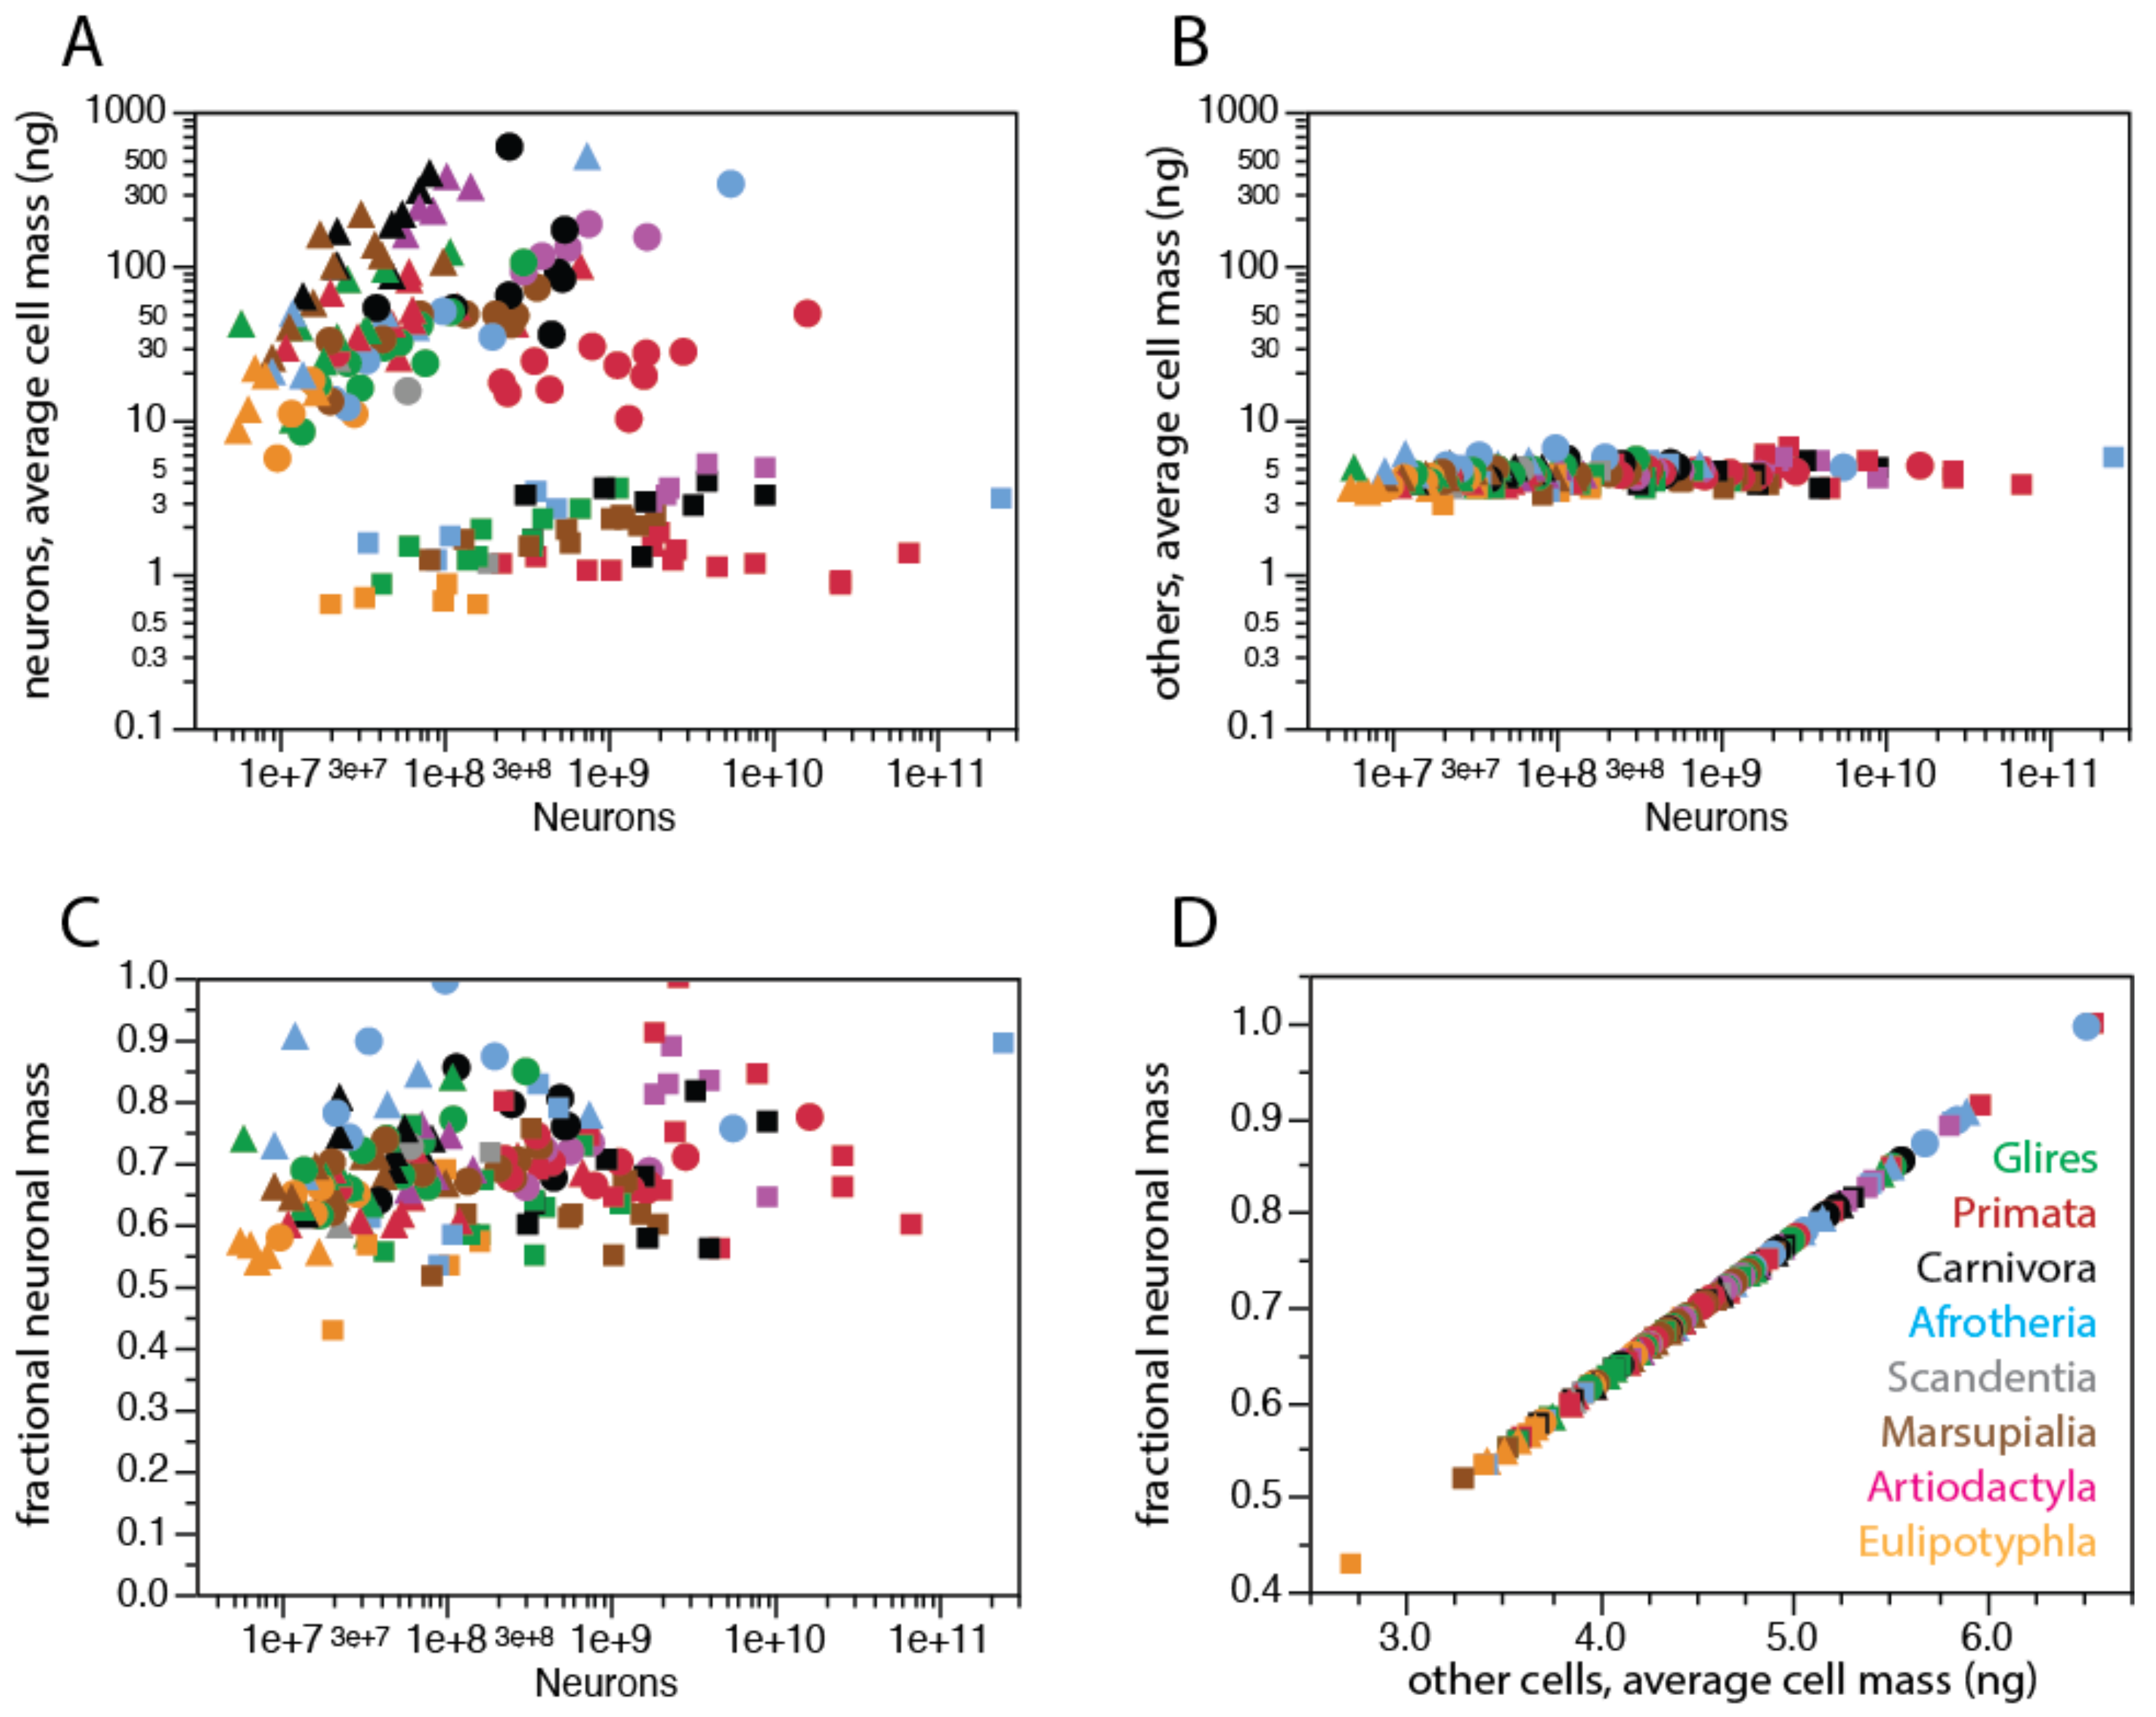
To estimate the experimentally elusive average cell sizes from the densities of neuronal and non-neuronal cells in brain structures that are easily measured with the isotropic fractionator, we used chi-square minimization of a simple model that related variations in those two densities, which allowed us to calculate average masses of individual neuronal and non-neuronal cells in the tissue analyzed [73]. Cell size (mass) in this model includes the soma, all arbors, and pericellular space of each cell, so that all tissue mass is accounted for by either neuronal or non-neuronal cells. The model considers that the relationship between the inverse of neuronal density and average neuronal cell mass depends on the fraction of tissue composed by neurons (that is, the neuronal mass fraction of the tissue). Using chi-square minimization to solve the set of equations relating measured densities and estimated average cell sizes and neuronal mass fraction, and applying the results to our most current dataset, we estimate that while the average mass of individual neuronal cells is highly variable across structures and species, spanning three orders of magnitude (from 0.6 to nearly 600 ng), the average mass of individual non-neuronal cells varies little, centered around 4.5 ng (Figure 9). For instance, we estimate that average neuronal cell mass in the cerebral cortex (including the white matter) is 8.3 ng in the mouse, 48.8 ng in the human species, and 338.8 ng in the African elephant, while the average non-neuronal cell weighs an estimated 4.4, 5.0, and 5.8 ng in the three species, respectively. According to these estimates, the average neuron in the human cerebral cortex has a similar mass to the average neuron in the cerebral cortex of the agouti (49.8 ng). Thus, even in a single structure, such as the cerebral cortex, neurons vary in their three-dimensional size from very small to very large in different mammalian species, while non-neuronal cells remain, on average, fairly small. It will be interesting to see how this enormous variation in predicted average neuronal cell size in the face of very steady average glial cell sizes relates to differences in gene expression across cell types uncovered by single-cell transcriptomics studies as they expand to a wider range of species.
Importantly, our model led to the realization that a consequence of the small variation in non-neuronal cell density, and thus average non-neuronal cell mass, is that the fractional neuronal mass of brain tissue is also remarkably similar across widely different brain structures and species, centered around 0.69 ± 0.09: that is, in 50% of all brain structures and mammalian species studied, the percentage of tissue mass composed by neurons varies narrowly between 63% and 74%. A useful mental picture of fractional neuronal and non-neuronal mass (or volume) of brain structures is the relative size of the piles of neurons and non-neuronal cells that would be obtained by passing the brain structure through a magical sieve that sorted individual cells neatly into two piles. According to our estimates, the neuronal and non-neuronal piles would amount to about 2/3 and 1/3 of any brain structure, in any mammalian species. Our estimates of average neuronal and non-neuronal individual cell mass and neuronal mass fraction for the current set of mammalian species can be found in Supplementary Table S1.
2.1. Relative Frequencies of Glial Cell Subtypes
Of course, non-neuronal cells are a collection of a few different cell types, not all of them glial. Ependymal cells are expected to be largely absent from our dataset, since we physically remove the choroid plexus of all ventricles in our dissections prior to quantification. Dura-mater and arachnoid are also removed in our dissections, but not the pia-mater, so the superficial glia limitans is presumed to be included. Removing the arachnoid excludes all major blood vessels, but endothelial and endothelium-associated cells of capillaries are part of the parenchyma, and as such are necessarily included in our counts. Still, previous estimates that the microvasculature occupies only a very small fraction of the parenchyma suggested that endothelial cells and vasculature-associated cells were a very small minority of all cells in brain tissue [78]. A minority of vascular cells amongst non-neuronal cells was also found by quantitative single-cell RNAseq in mouse somatosensory cortex and hippocampus (six and 15 times as many oligodendrocytes, astrocytes, and microglial cells as endothelial cells, respectively [32]). Upcoming evidence from our lab confirms that both the vascular fraction and the density of endothelial cells are low and fairly constant across structures in the mouse brain [79]. While these same upcoming data indicate that, in all structures, endothelial cells are a larger proportion of all cells than the ca. 2% expected from microvascular volume (which agrees with the impression that endothelial and vascular-associated cells are very small cells, much smaller than neurons and glia), they still are a minority in brain tissue [79]. In the mouse, we found that about 2/3 of non-neuronal cells are glial indeed, and because the microvascular fraction (or capillary density) is believed to be at best constant across species, if not decreasing in larger brains [80], an even larger majority of non-neuronal cells can be expected to be glial in brains larger than the mouse brain.
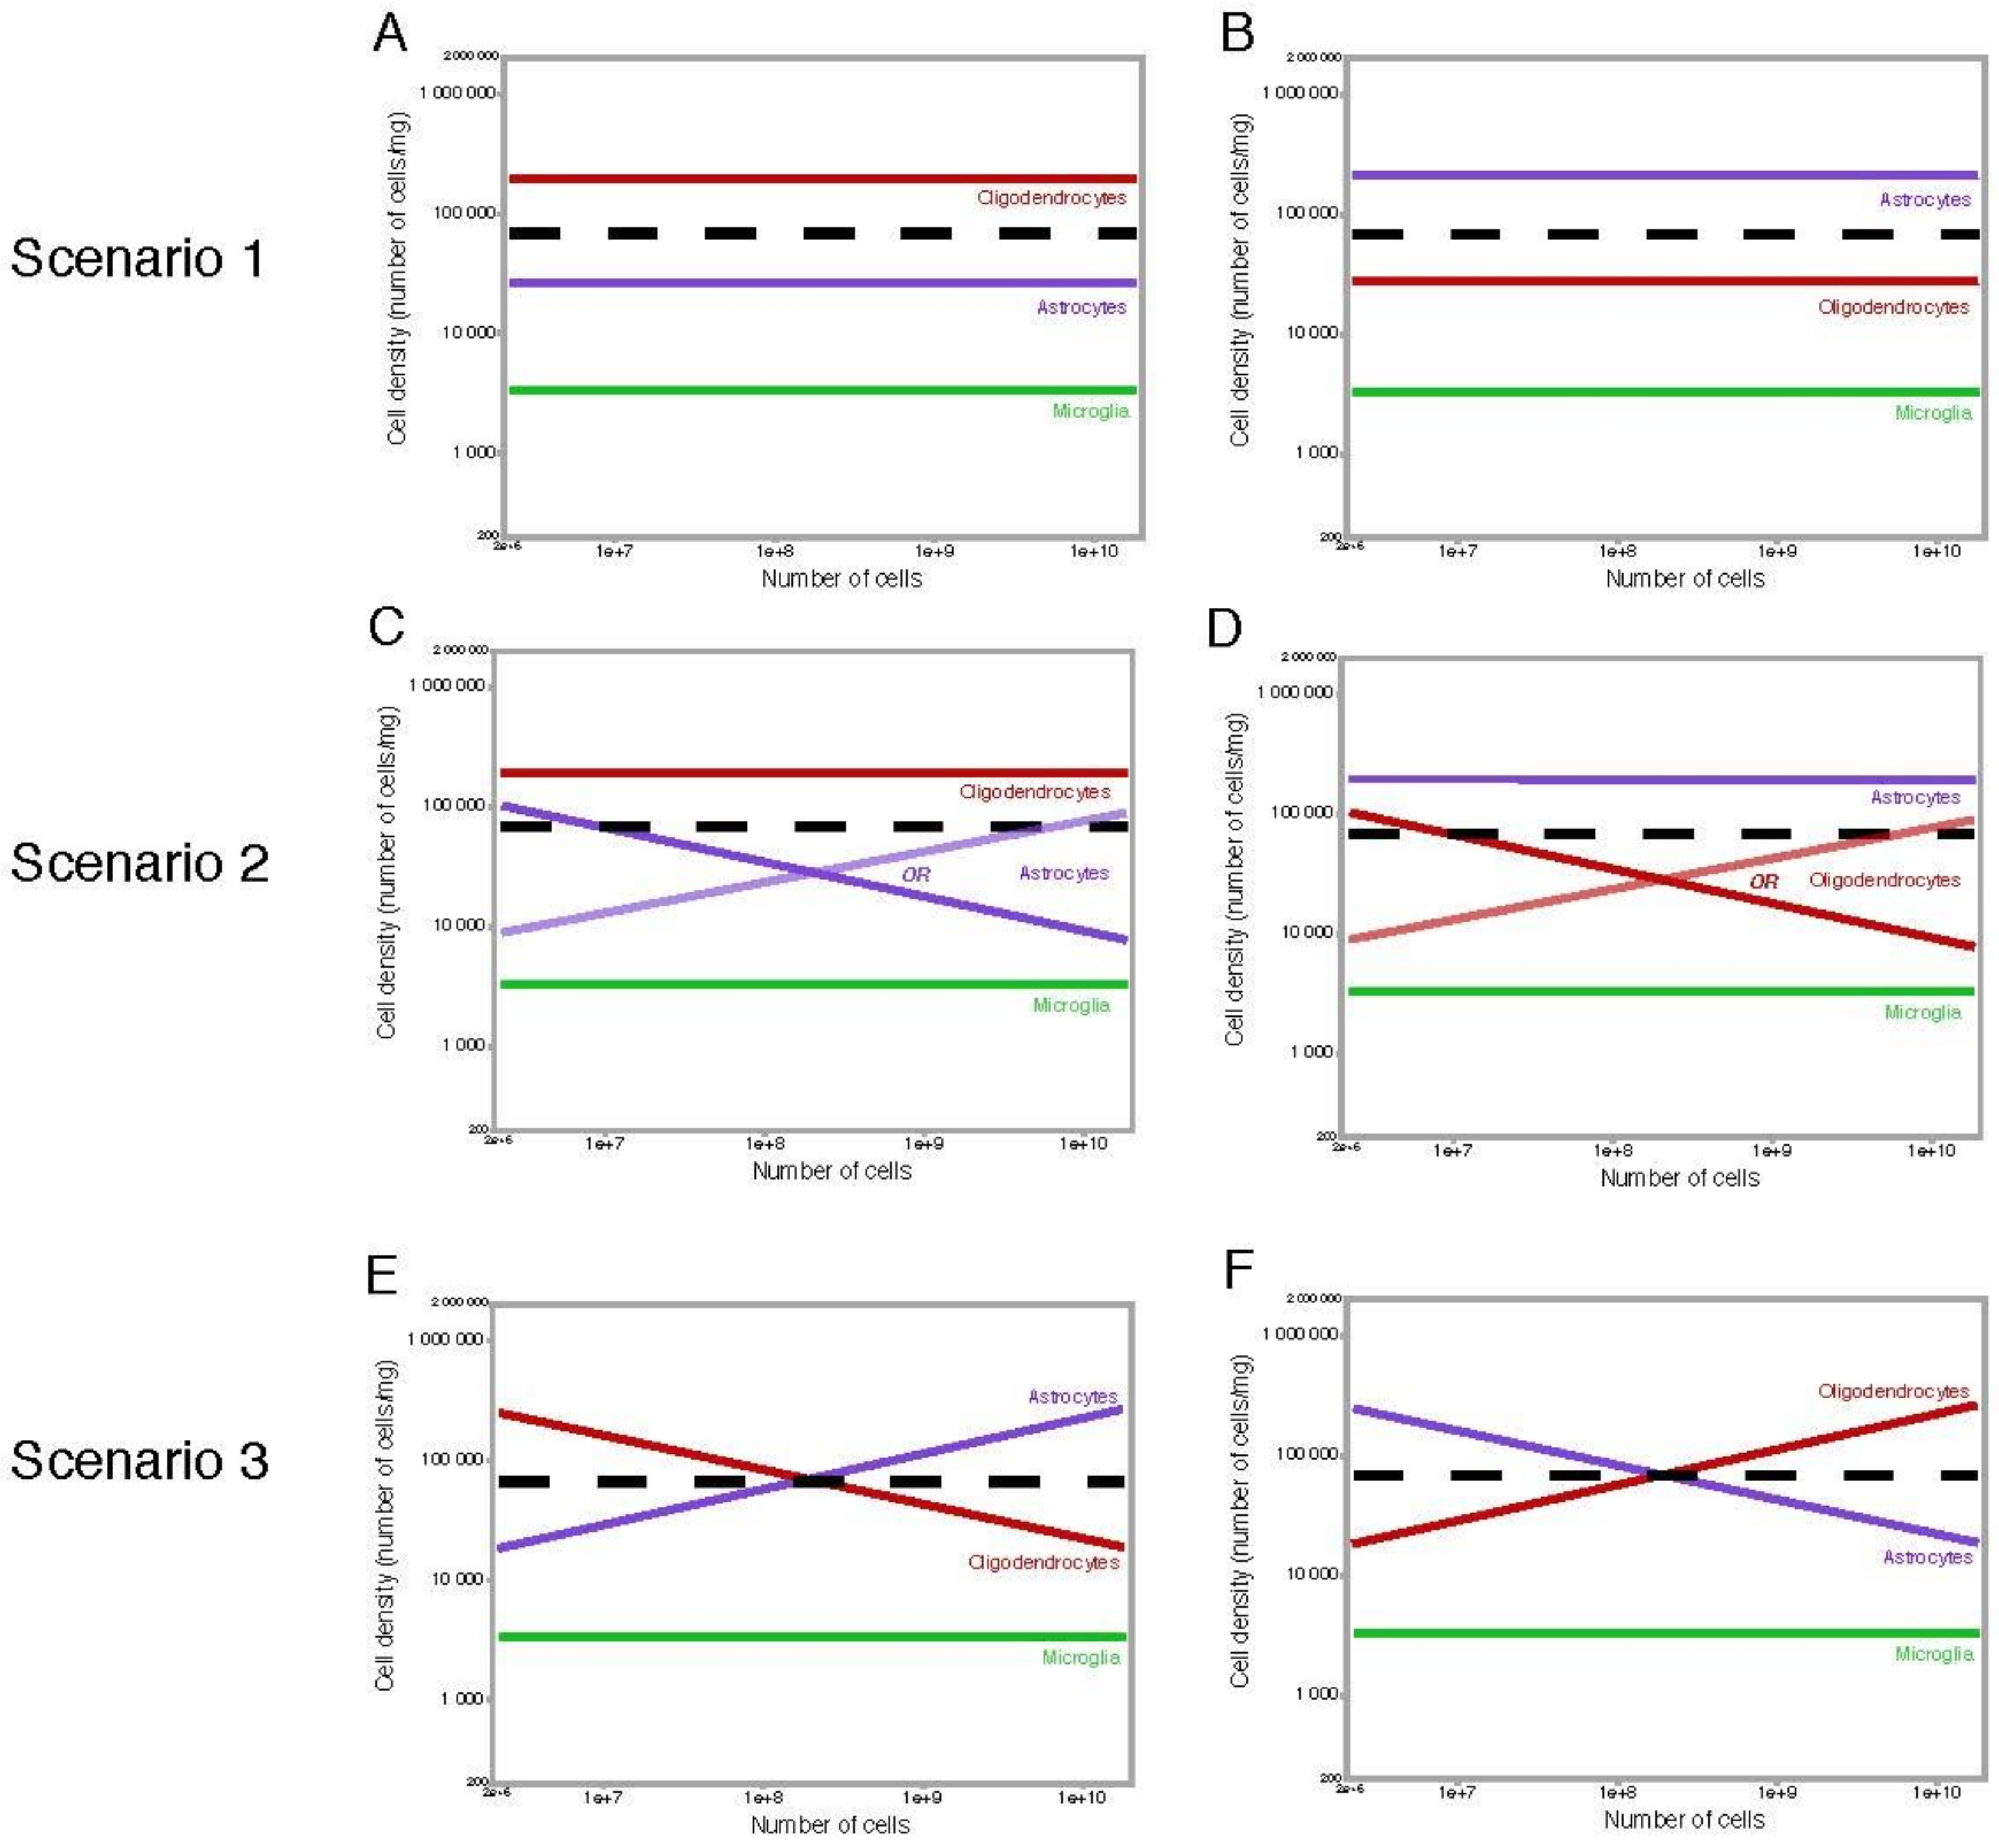
Considering that the majority of non-neuronal cells are non-ependymal glial cells, and that the volume fraction of brain tissue occupied by capillaries is so small (2–4% at best) that it is virtually negligible, it follows that the invariant density of non-neuronal cells as a whole (as shown in Figure 5A) is likely to reflect an invariant density of glial cells. Using Iba1 as a marker of microglial cells in frozen samples of our previously processed brain samples in a wide range of mammalian species, we have found the density of Iba1 + microglial cells to be invariant and low across brain structures and species, at about 4500–5000 microglial cells per milligram of tissue, on average, or about 7% of all non-neuronal cells [39]. Our upcoming findings across a range of species are consistent with isolated reports that microglial cells are a small minority of glial cells, totaling only about 5% of glial cells in the gray matter of the human cerebral cortex [81]. In this case, there are three major scenarios that would yield the fairly constant non-neuronal cell densities that we observe in the different structures of mammalian brains.
In the first, simplest scenario, all glial cell types have constant densities across brain structures and species, even if densities differ for each cell type (Figure 10A,B). In this case, the relative cell fractions represented by each glial cell type would also be constant, if different across cell types. While many researchers expect or indeed assume that astrocytes are the most common of all glial cell types [43,44,45,82], there is quantitative evidence to the contrary: in the human cerebral cortical gray matter, oligodendrocytes represent about 75% of all glial cells, and astrocytes are only about 20% [81]. Similarly, many other studies on the rat cerebral cortex found that oligodendrocytes constitute the majority of the glial cell population [83,84,85]. In this scenario, the average size of each glial subtype remains constant across structures and species.
The second scenario indicates that while one cell type retains a constant average cell size and therefore a constant cell density, another varies, but that second cell type is infrequent enough that the overall non-neuronal density still appears fairly constant (Figure 10C,D). The scenario depicted in Figure 10C would be consistent both with an initial report that some astrocytes are larger in human than in mouse cerebral cortex [86], and the evidence that oligodendrocytes are the predominant glial cell type in the cerebral cortex, at least in some species [81,83,84,85].
Finally, the third, more complicated scenario is one in which the two main glial cell types, astrocytes and oligodendrocytes, vary in average cell size, and thus in cell density, but in different directions, compensating for each other and yielding a fairly constant overall cell density (Figure 10E,F). In the scenario where astrocytes become smaller as they become more numerous, oligodendrocytes would necessarily become larger at the same time (Figure 10E); alternatively, in the scenario where astrocytes become larger as they become more numerous (as suggested by [86]), oligodendrocytes would necessarily become smaller at the same time (Figure 10F).
At the moment, all of the scenarios above remain plausible. While our data lead us to presume that the same scenario would apply to all brain structures and mammalian species examined, it remains possible that different scenarios apply to different brain structures. However, the finding that non-neuronal cell densities are remarkably consistent not only across species but also across brain structures within the same individuals makes that unlikely.
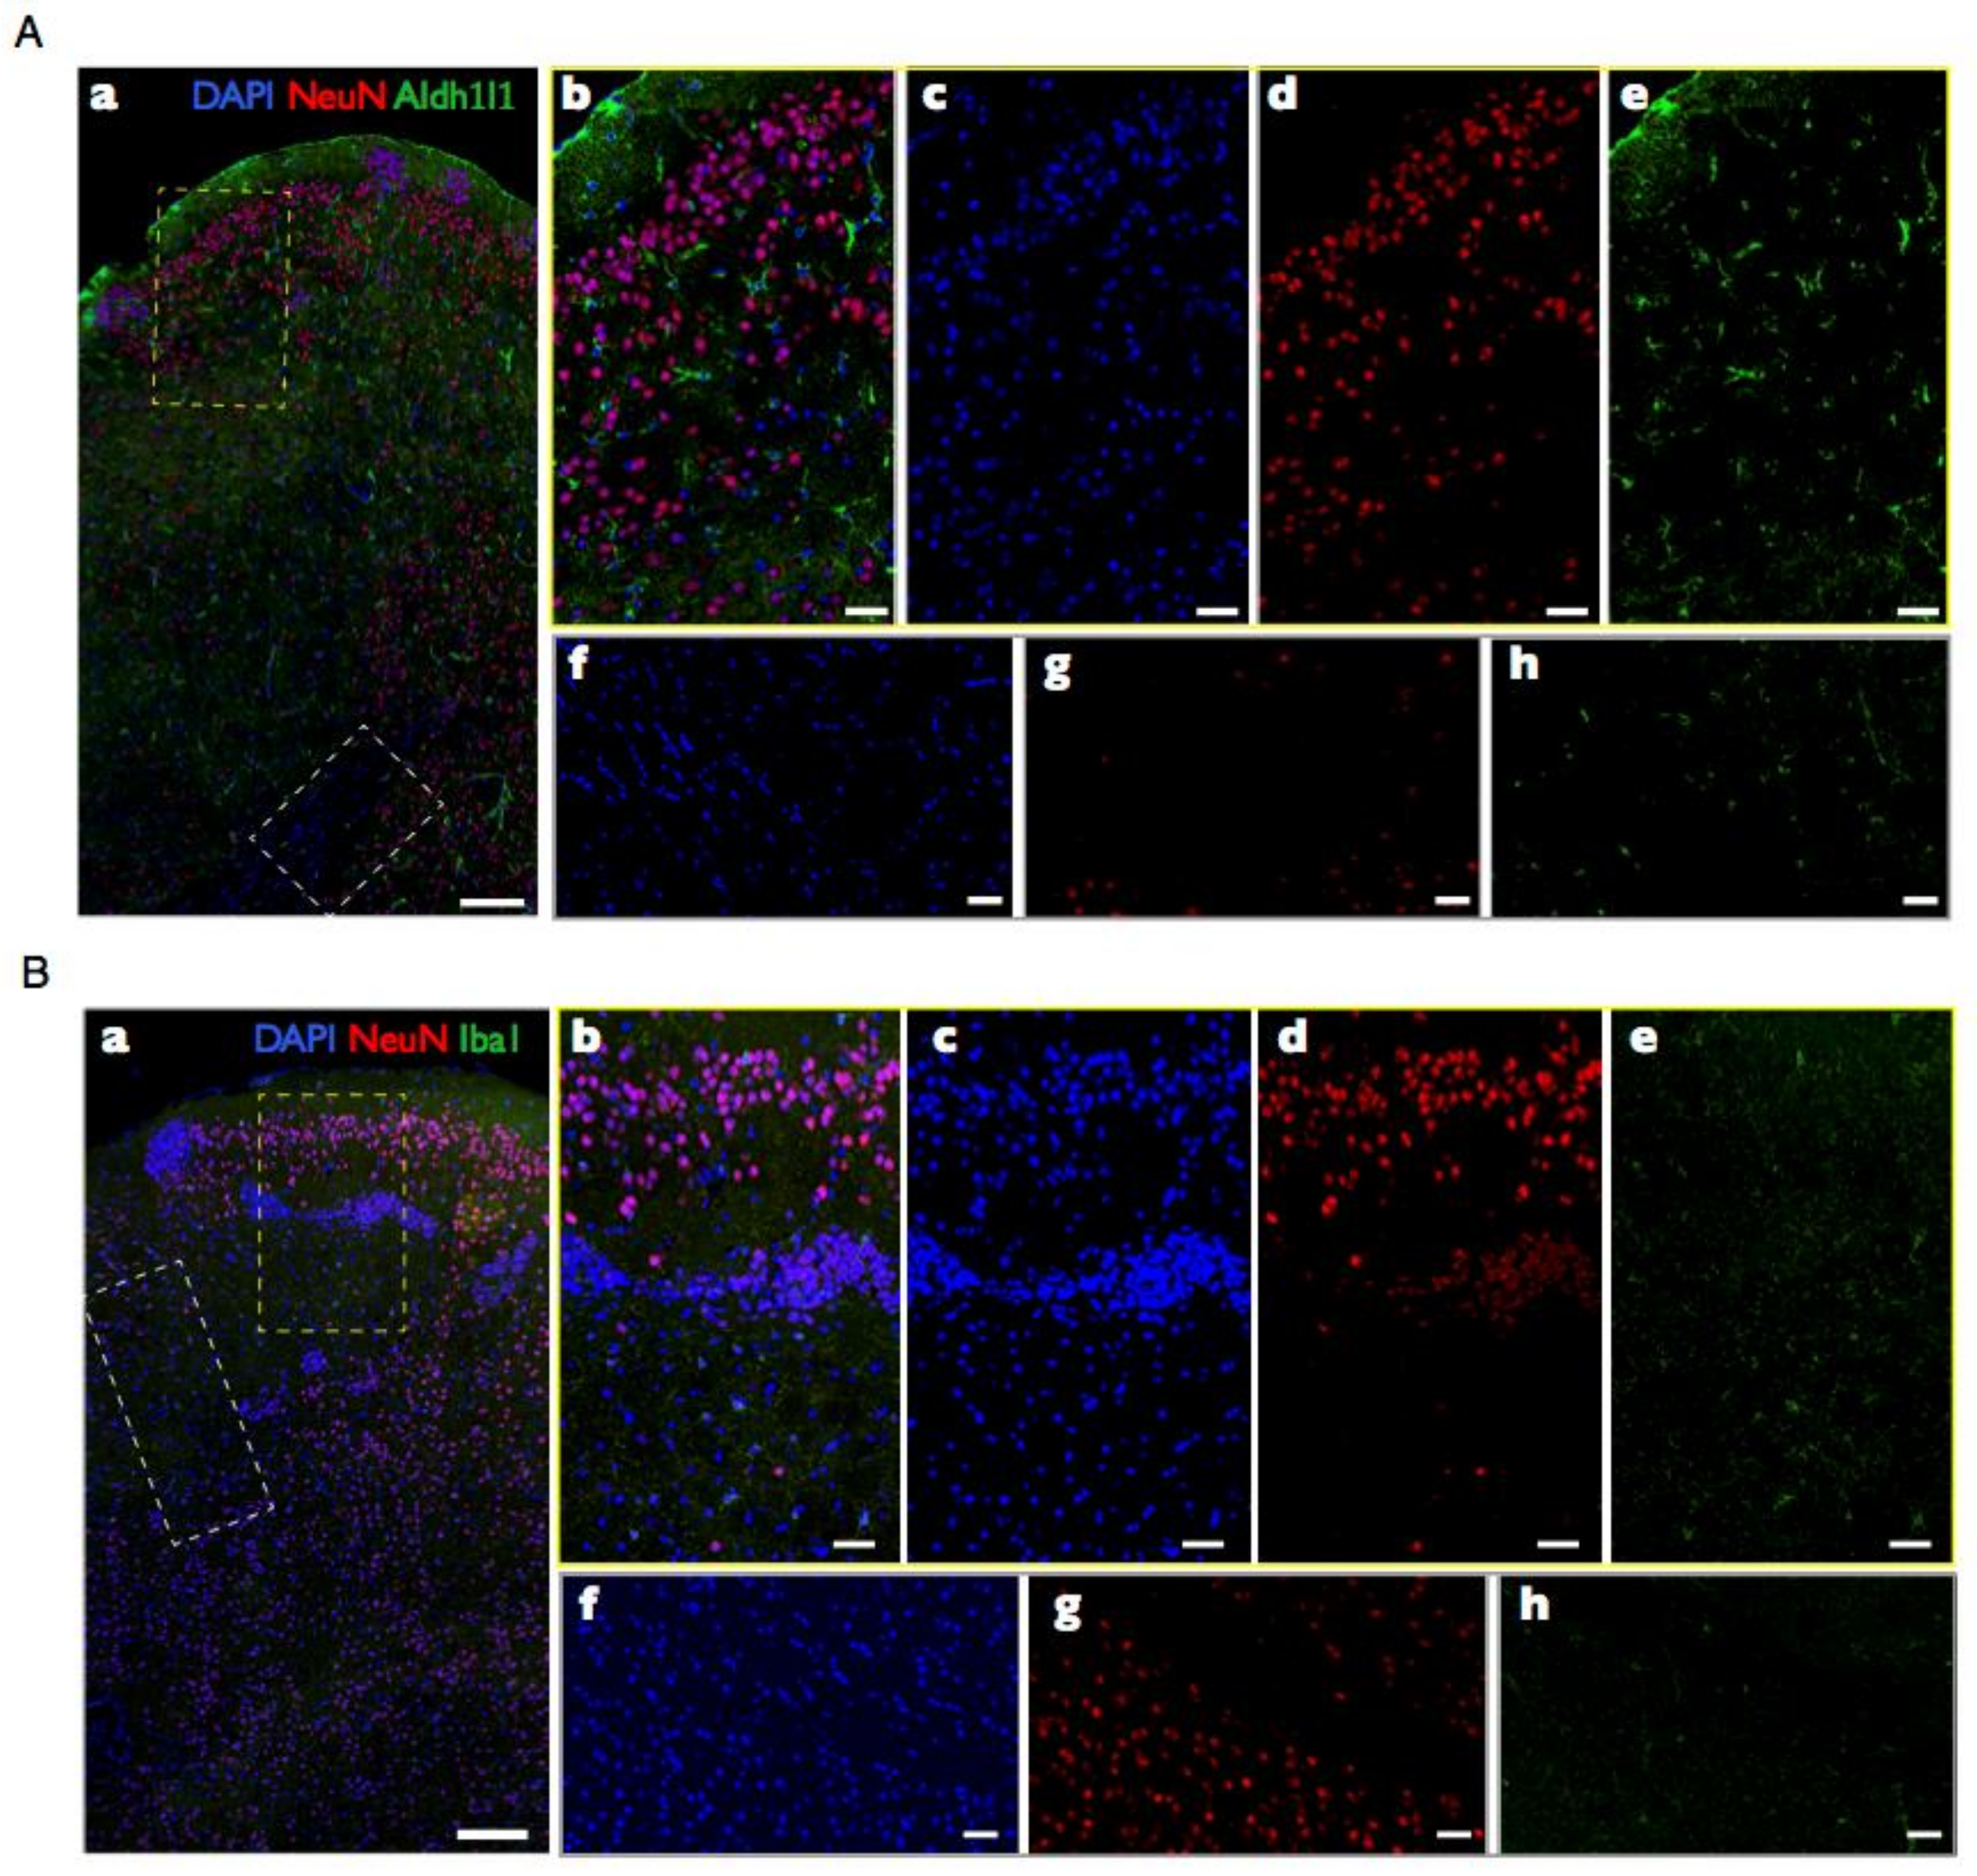
Our upcoming data on over 30 mammalian species indicate that astrocytes, identified by ALDH1L1 immunoreactivity that is largely coincident with nuclear expression of S100b, are a somewhat higher percentage of all non-neuronal cells than microglial cells are, but with a more variable percentage across species, although they still occur at fairly invariant densities, with cells spaced apart evenly [40]. These data are so far consistent with oligodendrocytes being the large majority of all non-neuronal cells across brain structures and species, including cortical gray matter [81,87], but possibly also constituting a variable percentage of the non-neuronal cell population. The somewhat variable densities of astrocytes across species are also compatible with the earlier finding that human astrocytes appear larger than mouse astrocytes [86]. However, one must keep in mind that because of the extremely ramified cell morphology, estimates of astrocyte cell size are highly dependent on measuring criteria. In the oft-cited study above, human cortical astrocytes appear more branched than rodent astrocytes when GFAP-positive ramifications are quantified—but those are now known not to represent the entirety of the vast branched ramifications of astrocytes, and, indeed, the images of dye-filled cells in the same study show astrocytes of much more similar sizes in human and mouse cortices [86]. This is an important point to reconciling the findings of higher GFAP-positive branching with ours of nearly invariant cell densities, which relate to the three-dimensional distribution of highly branched cell volume that is known not to be properly captured in GFAP stains. As this point, therefore, our preliminary data suggest that the scenarios depicted in Figure 10A,C are the most likely, where oligodendrocytes predominate among non-neuronal cells in all brain structures, including the gray matter of the cerebral cortex.
2.2. Glia/Neuron Ratio
In several brain structures of several mammalian species, non-neuronal cells are indeed more numerous than neurons. To be clear, however, contrary to many claims in review articles and opening paragraphs of original papers [88,89,90,91], the mammalian central nervous system is not composed of 10% neurons and 90% glia, or any variation thereof. Table S1 lists some actual numbers and their sources. For instance, in the human brain, non-neuronal cells do outnumber neurons by 11.2:1 in the ensemble of brainstem, diencephalon and striatum (the rest of brain), and by 3.7:1 in the entire cerebral cortex (including the subcortical white matter), but, conversely, there are only 0.2 non-neuronal cells to every neuron in the cerebellum (Table S1). Because the rest of brain holds not even 1% of all neurons in the human brain, non-neuronal cells are only as numerous as neurons in the human brain as a whole [55]. Importantly, humans fit the pattern that applies to all other species, as discussed below.
The proportion between numbers of glial cells and neurons has been considered a meaningful property of nervous tissue since well before the actual functions of glial cells were understood, if only because this proportion appears to be so variable across species. Observing that human cerebral cortex had a higher proportion of glial cells per neuron than other species, Friede [52] initially proposed that that was a feature of “more advanced” cortices, but the later analysis of other species with even larger cortices indicated that the ratio was rather related to sheer mass [51]. Since then, the idea that has gained traction in the literature is that the glia/neuron ratio (GNR) in the cerebral cortex, sometimes unduly extended to the GNR of the whole brain, increases together with total brain mass: the larger the brain (or the animal), the more glial cells that accompany each neuron [2,51,92,93]. The argument, while intuitive, is convoluted: larger animals tend to have larger brains, which are supposedly made of larger neurons [50,51], which are assumed to have a higher metabolic cost per cell than neurons in smaller brains, which would require more glial cells to supply the energetic requirement of each neuron [92,93]. Importantly, the rationale behind the assumption that larger neurons come with more glial cells per neuron was rooted on another implicit notion: that the vast majority of those glial cells that accompanied each neuron were astrocytes, responsible for providing different types of support to neuronal activity and synaptic transmission.
It will thus be crucial to separate GNRs in different brain structures and species per glial cell type. As mentioned above, a low, stable density of microglial cells in all brain structures that we find across mammalian species [39] suggests that these cells perform functions that are volume-related, which is compatible with the macrophage-like properties of these cells [94,95]. A similar finding for astrocytes would suggest that the function of these cells is also volume-related, with each individual cell capable of servicing only a limited amount of tissue. Concluding our systematic analyses of the densities of astrocytes, oligodendrocytes, and microglial cells separately will allow us to understand what glial cell types occur in numbers that accompany numbers of neurons, density of neurons, volume of tissue, or, eventually, numbers and density of synapses.
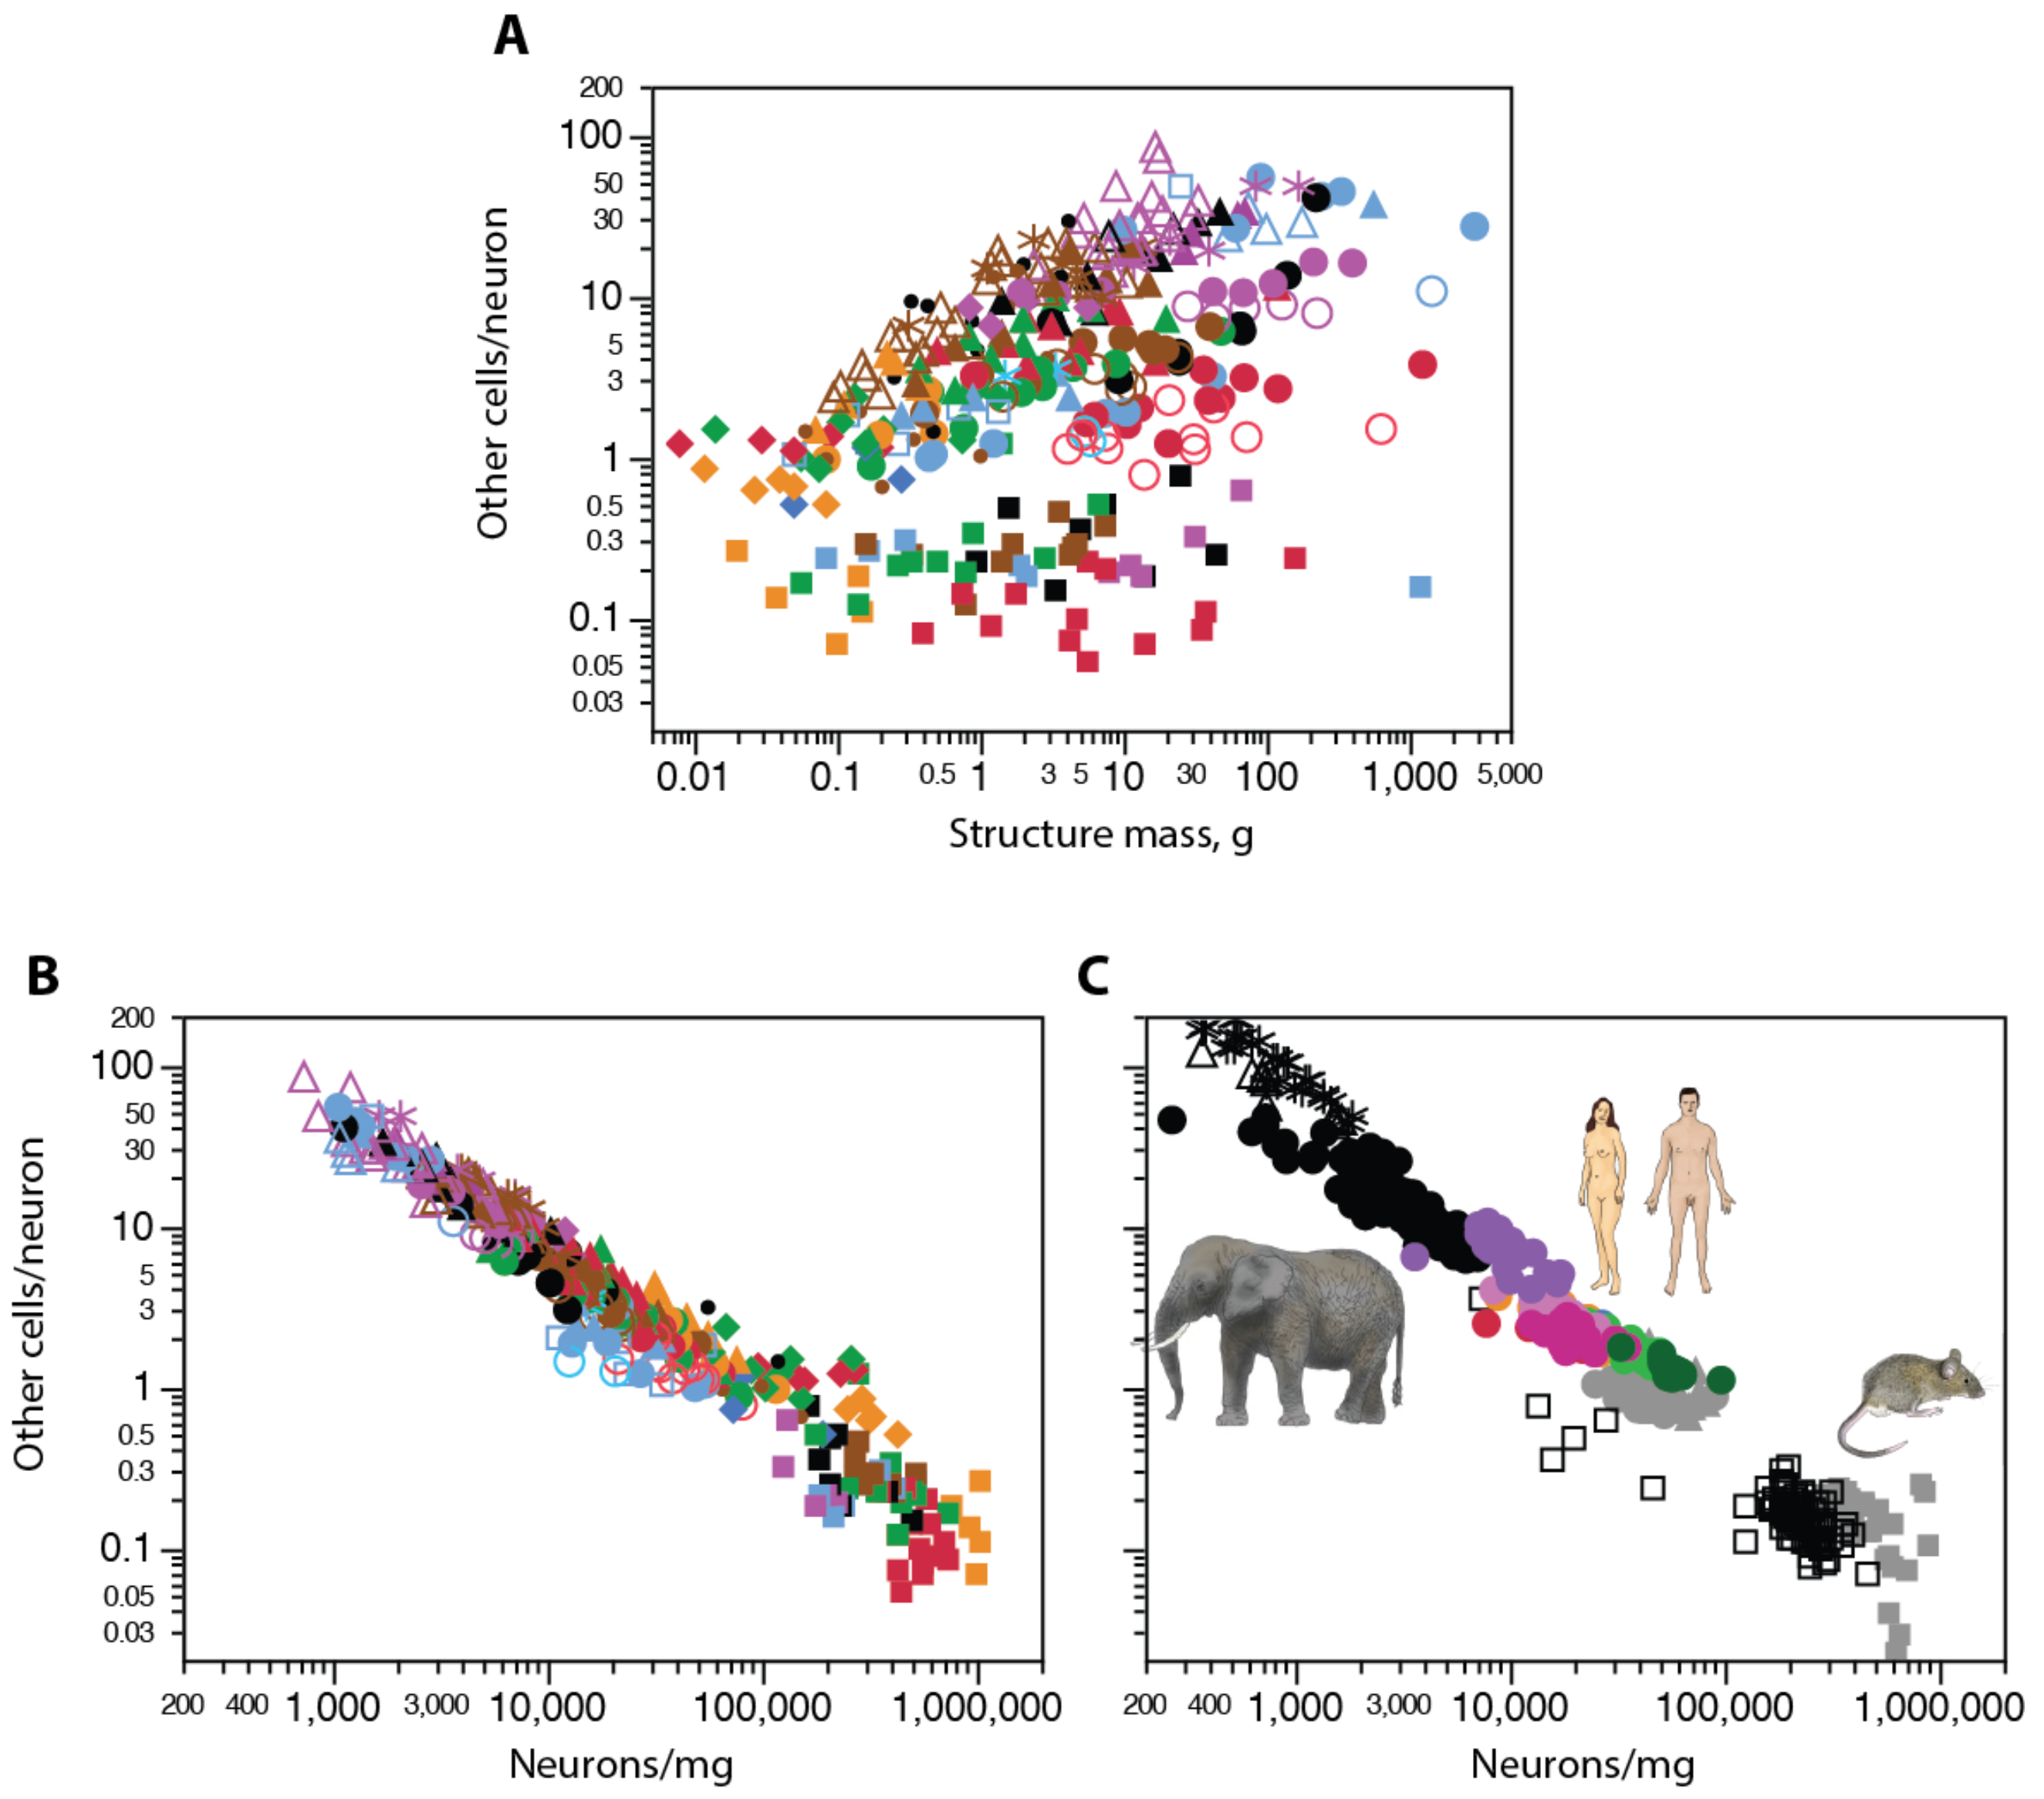
Until then, and whatever the biological origin of the much larger variation in neuronal density compared to non-neuronal density across brain structures and species, we could already establish that a mathematical consequence of that difference is that overall GNR varies essentially with the inverse of local neuronal density. Because lower neuronal densities indicate larger neurons, that means that larger neurons are accompanied by more non-neuronal cells than smaller neurons [73,96]. Importantly, the same relationship applies across all brain structures in all mammalian species analyzed so far, as illustrated in Figure 11.
Further, because neuronal densities may differ so much across structures of similar mass, numbers of neurons, and even in brains of similar size (Figure 11A), and considering that the fraction of non-neuronal cells that are not glial cells is minimal, there is no systematic, universal relationship between GNR and brain or structure mass (Figure 11A, top), contrary to common past assertions in both the scientific literature and journalistic reports that larger brains show higher GNRs [89,97,98]. While that initially appeared to be the case for the cerebral cortex alone, at a time when only a handful of species were analyzed [50], systematic examination of species representing all mammalian clades benefitting from the ease of the isotropic fractionator method showed that neuronal densities do not universally decrease with increasing brain size [53,54,55,56,57,58,59,60,61,62,63,64]—which would have been the requirement for universally increasing GNRs with increasing brain size. Despite the ease with which authors once could claim that the human brain had 10 times more glia than neurons [42,99,100], there are at best similar numbers of neuronal and glial cells in the human brain as a whole [55].
The glia/neuron ratio does vary universally across species, across structures, and even across subregions of the same structure as a function of neuronal density (Figure 11A, bottom). The existence of such a continuum, with no evidence of grade shifts across structures, species, or clades, argues strongly for a highly conserved mechanism governing how glial cells are added to tissue in development and evolution [63,73,96].
We have found recently that different neuronal densities in the cerebral cortex are not accompanied by significantly different energetic costs per neuron [101], which makes it unlikely that the larger glia/neuron ratios that accompany larger neurons are due to a higher metabolism in larger neurons, at least not across species. Instead, as noted above, it is more likely that GNRs vary as a simple consequence of the relative constancy in average glial cell size. In this scenario, glial cells are added to different tissues and species at similar densities, occupying a parenchyma that is initially mostly neuronal, but composed of neurons of highly variable individual cell size. The GNR in any given brain structure within the brain of any mammalian species is thus a simple consequence of the average cell mass of the neurons that formed the initial volume invaded by glial cell precursors, and the precise average cell mass of glial cells [73].
2.3. Why Should Glial Cell Size Be Constrained?
Life spontaneously changes over time—that is, evolves—and it is a rare feature of living beings that is found to remain constant. When one does, it is indicative of a constraint at the physical (mechanical properties of tissue), biochemical (binding site constancy), or biological level (physiology). The degree of folding of any cerebral cortex, for instance, is strictly tied to the combination of cortical surface area and thickness—even though these are free to vary—according to physical minimization of free energy as the tissue forms under uneven pressures [102]. The genetic code is possibly fixed by the matching of the spatial conformation of dinucleotides and amino acid precursors [103]. As suggested above, glial cells of different types might be constrained in size due to a biological limitation imposed by their volume-related function. Astrocytes provide electrolyte homeostasis, neurotransmitter reuptake and turnover, and metabolic support related to synaptic transmission, all strictly local functions, even if coordinated across cells connected electrotonically [2,104]; neurons, by virtue of their long, uneven projections, by definition impact physiology of both near and distant sites. Oligodendrocytes myelinate and provide energy to surrounding axons that contact them once they differentiate from neural/glial antigen 2-positive (NG2+) progenitor cells that actively probe their local environment and respond to loss of contact with oligodendrocytes by proliferating [29,105]. Microglial cells are phagocytic and thus perform volume-related tissue clearance. All of these are highly energy-demanding functions that possibly limit the volume of the individual cells performing them: there is only so much energy that an individual cell can use to perform functions that are determined by the relationship between the volume monitored by the cell and its surface area, which is costly to maintain polarized. While a similar cost applies to neurons, their activity can be self-regulated by decreasing the firing frequency; astrocytes and oligodendrocytes, on the other hand, are forced to accompany that activity. Presumably, astrocytes that became too large might enclose too many synapses to be able to support and maintain them effectively; oligodendrocytes that became too large would come into contact with too many fibers to myelinate; microglial cells that became too large might not have the power required to phagocyte all debris that they encounter.
These constraints might be determined genetically, as any spontaneous variation in genes related to cell size regulation specifically in glial cells leads to negative outcomes that are incompatible with life. Interestingly, though, there is an alternative hypothesis that glial cell size is maintained fairly constant by self-regulation. One likely source of self-regulation is the very energetic cost of maintaining volume-related glial cell function. Another is the fact that the presumed sources of high energy demand, synaptic transmission, are the very synapses which are induced in large numbers by astrocytes themselves [106,107]. Thus, in development, numbers of synapses are initially low; increase in a given tissue volume as that tissue becomes populated by astrocytes, which induce their formation and supports it with cholesterol; then support the increased metabolic demand of those neurons, recycle the transmitters, and maintain ion homeostasis [106,107,108].
Alternatively, glial cell size might be not self-regulated, but constrained by cell-autonomous means, in which case it would be their restricted size that would impose constraints on neurons. In that scenario, for example, an intrinsic limitation to changes in three-dimensional cell size and surface area of astrocytes might constrain the number of excitatory synapses that can be induced and supported per unit volume in neural tissue, which is consistent with the few reports so far of fairly restricted synaptic densities across species [44,109,110]. That would result in fewer synapses per neuron in a given volume of tissue as neurons became bigger both across brain structures and species, which in turn would contribute to keeping metabolic costs low in those neurons.
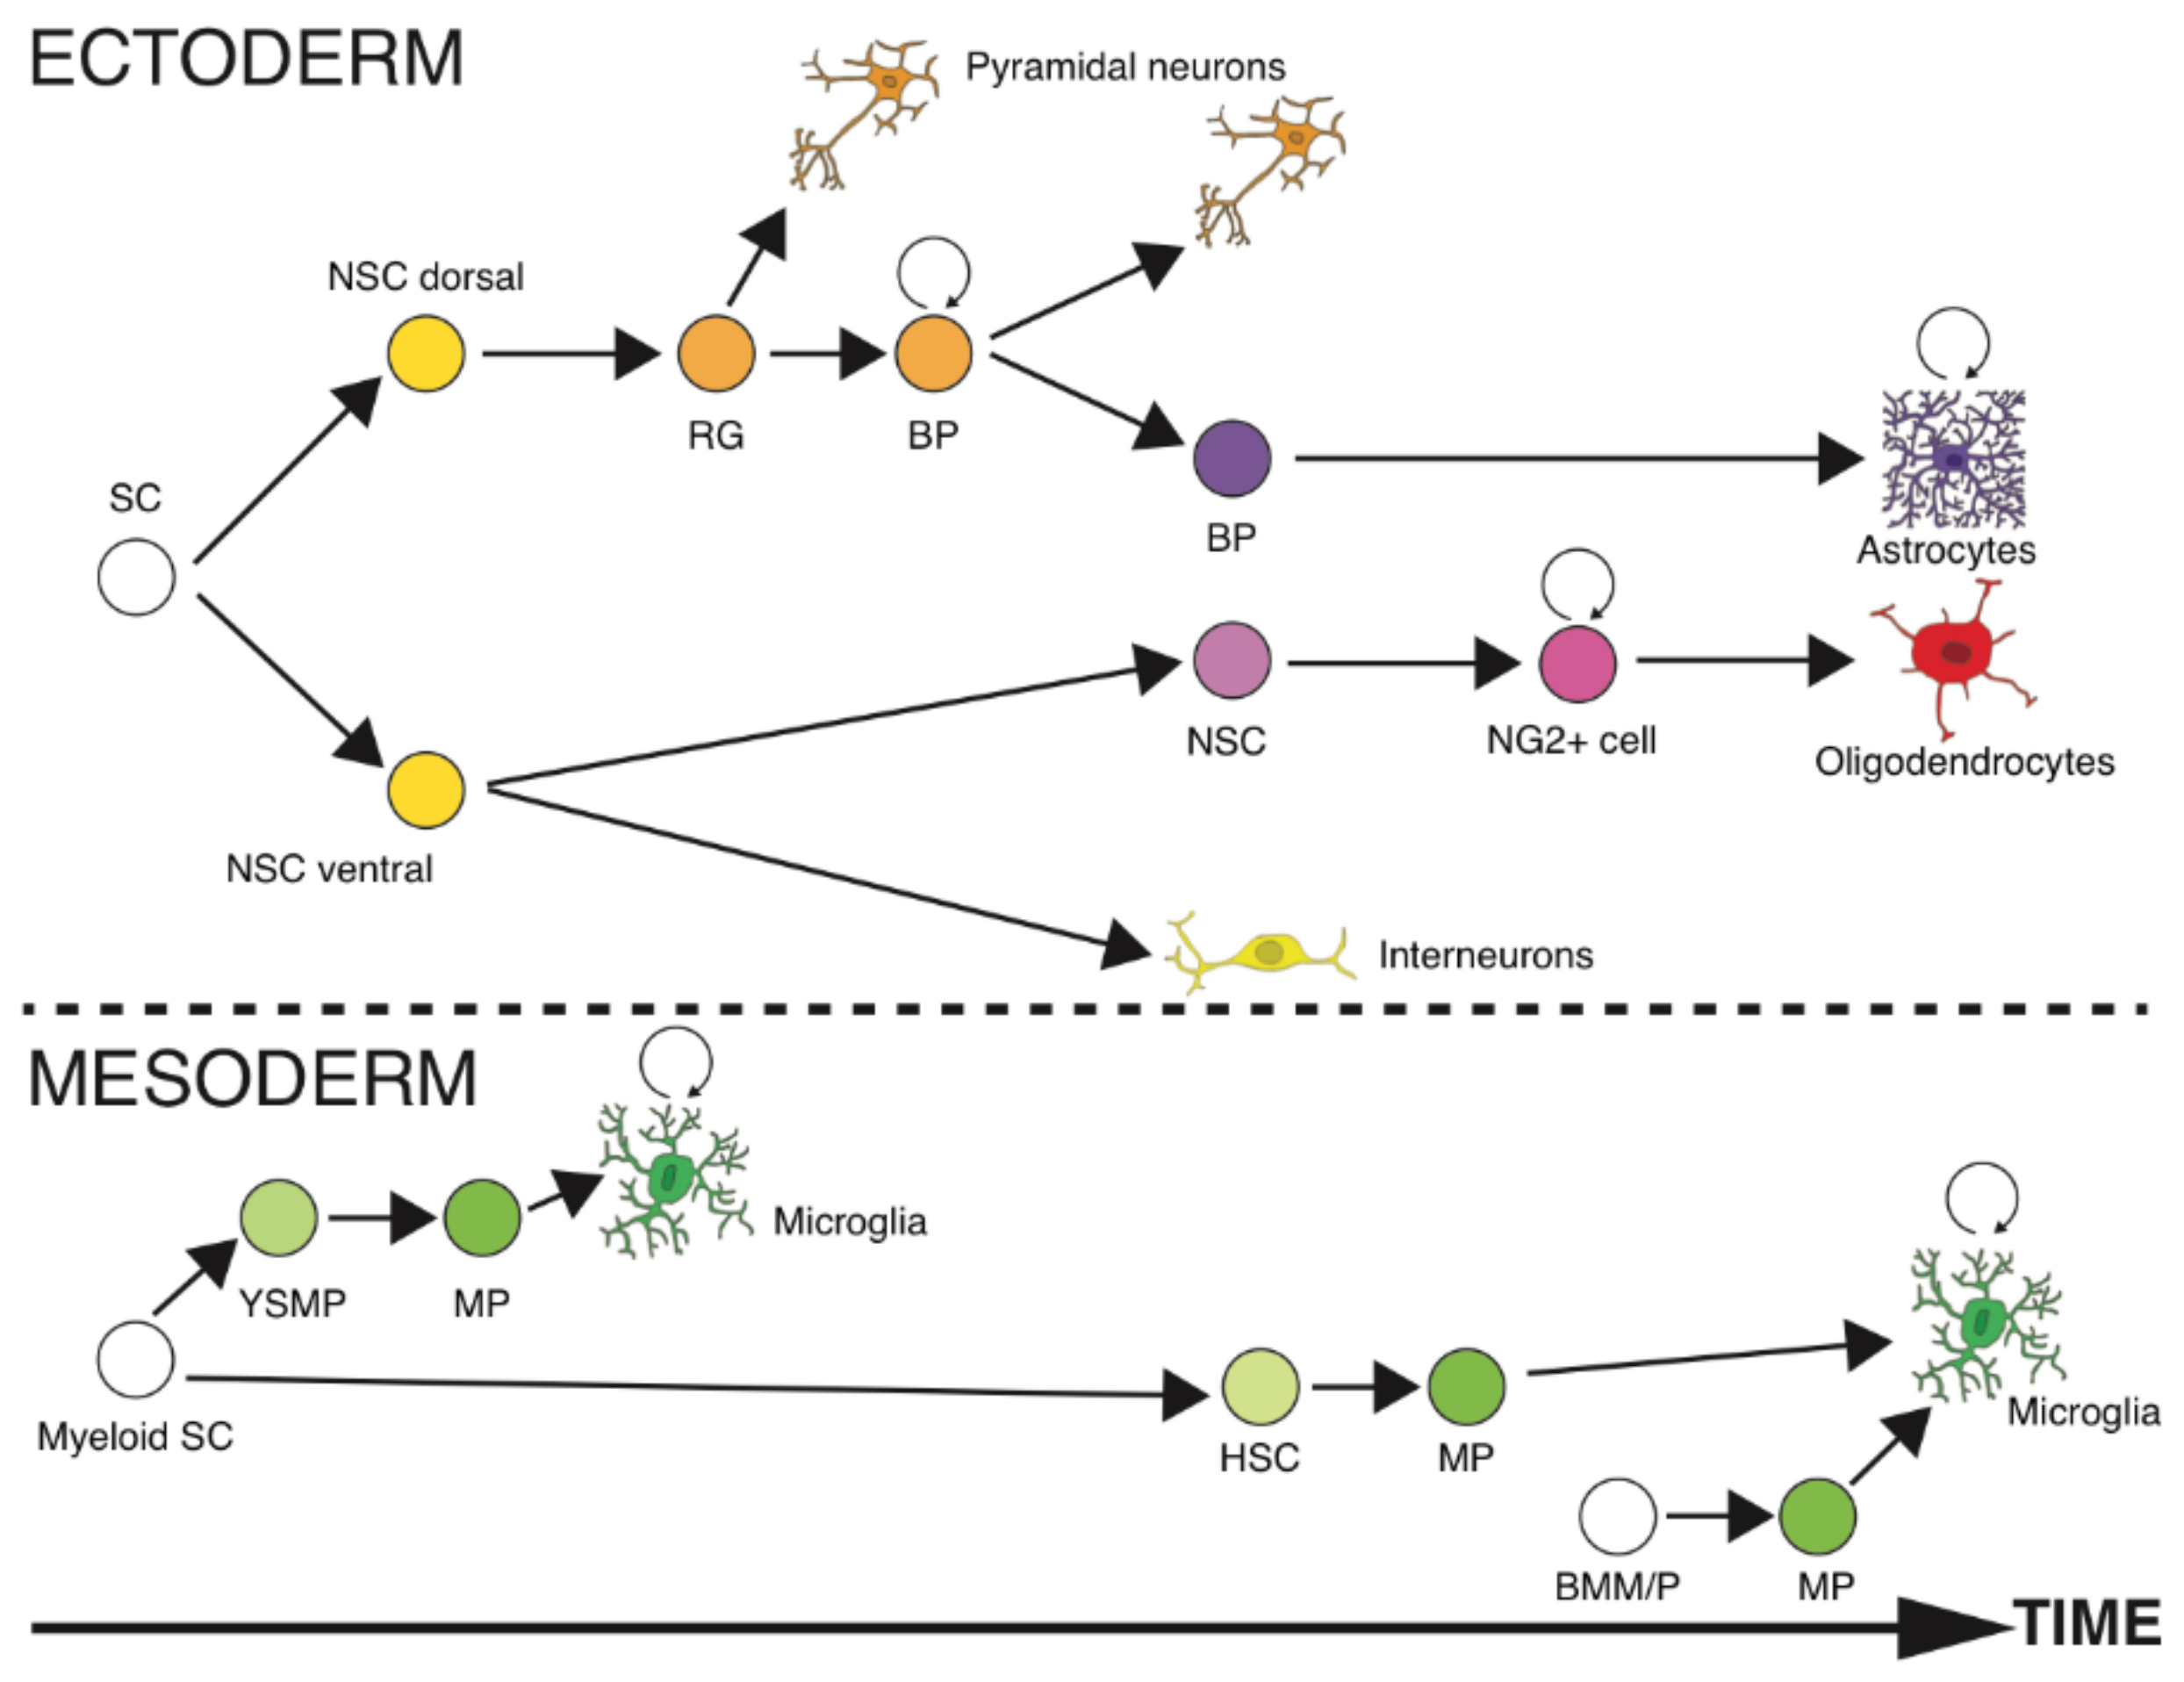
Another possibility is that (macro) glial cells are restricted in size and various other characteristics because of the circumstances of their differentiation, late in development, according to the current view that there is progressive restriction to gene expression during development. Indeed, early models of restriction of developmental potential through progressive repression of transcription along cell lineages put forward the counterintuitive notion that progressive diversification of cell types comes with progressive restriction of what each progenitor cell can generate [111]. An alternative proposition held that lineage potentials were expressed individually in a predetermined sequence as progenitor cells matured [112]. Cell lineage studies in brain development soon showed that there is indeed progressive restriction of cell fates, with a narrowing range of cell types and characteristics that culminates in specification of the final, mature identity of different cells [113,114]. Strikingly, in vertebrate brains, macroglial cells are the last cell types to be specified in development [115]: astrocytes in the lineage that earlier gave rise to excitatory neurons, and oligodendrocytes in the lineage that previously formed inhibitory neurons (Figure 12). Our quantitative analyses of developing rats [116,117] and mice [118] show that all brain tissues are indeed 95% neuronal at birth, with significant numbers of non-neuronal cells only appearing during the second postnatal week.
Progressive restriction of cell fates and cell differentiation occur with global chromatin remodeling that results in progressively compacted, repressed chromatin that corresponds with activation of lineage-specific genes and repression of lineage-inappropriate genes [125,126,127]. Such progressive restriction of genome transcription is consistent with the recent findings, discussed earlier, that the early-generated neuronal cells express a wider variety of transcripts than the later-generated glial cells [31,32]. However, cells with astrocytic phenotype are known to also function as neural progenitor cells in some regions of the brain [121,128,129,130,131], which suggests that, if these are true astrocytes, then their genome is still not irreversibly restricted in its pattern of gene expression.
Finally, while the scenarios above consider that glial cells are the exception in their size-invariance (given the general expectation that biological features tend to diversify over time), the inverse must still be considered: that all cells (or most cell types) are by default constrained in size across species as diverse as mice and elephants, and neurons are the exception in how much they can vary. In line with that possibility, some evidence, compiled from isolated studies using different methods, suggests that many cell types do share similar individual cell volume across species [132,133], but systematic studies of cell size employing the same method across a wide range of species are still lacking. Using the isotropic fractionator, our preliminary findings suggest that, like glial cells, the density of cells that form liver tissue is remarkably similar across species [134].
It has been suggested that constant cell size, accompanied by cellular metabolic rates that decrease with increasing body size, is a property of quickly dividing cells, whereas slowly dividing (or cell-cycle arrested) cells have increasing cell volume but constant cellular metabolic rates [133]. In that case, you do not mess with the glia—or with hardly anything else in the body; only neurons, and maybe a few other cell types, such as adipocytes [133], might escape that limitation. Whatever the scenario that actually applies, the enormous difference in ranges of cell densities in the nervous system indicates that while neurons are free to vary in size, glial cells are not. Two new fundamental questions thus arise regarding the lack of diversity in glial cell types, sizes, and distribution in brain tissue, at least compared to neuronal diversity: how come—and so what?
2.4. What Lies Ahead
The newfound ability to rapidly, reliably, and systematically measure numbers and densities of neuronal and non-neuronal cells in the main brain structures in dozens of mammalian species has provided a wealth of data that finally offer a solid foundation for the field. Those direct measurements have allowed us to estimate how cell sizes vary and compare across brain structures, species, and cell types: neurons are highly diverse in their average cell mass, while non-neuronal cells are hardly variable. These observations match those of budding catalogs of transcripts in single cells that find multiple clusters of neuronal cell types that are rich and diverse in the genes they transcribe, but only a handful of non-neuronal cell types are defined by their much more restricted transcriptomes. With several new hypotheses in hand, informed by the collection of these new developments, future studies that directly investigate the variation in size and three-dimensional complexity of glial cells of different types in different species and clades and how they relate to particular gene transcripts will shed new light on the origins of glial cell diversity or lack thereof. The combination of the two approaches into quantitative studies of the abundance of different cell types according to multiple genes and markers expressed in isolated cells or cell nuclei is an exciting possibility for the near future, particularly taking advantage of novel microscopy techniques such as multiplex ion beam imaging (MIBI) that allow the investigation of the expression of as many as a few dozen markers by the same cells or nuclei in fixed tissue collected from different species. Finally, upcoming methods that allow transcriptomic analysis of fixed cells and isolated nuclei [135] should allow the expansion of those studies to a much wider variety of species and brain structures, also allowing us to take advantage of the ever-growing collection of isolated cell nuclei that we have quantified in our lab. There are exciting times ahead for quantitative neuroanatomists again.
Supplementary Materials
The following are available online at https://www.mdpi.com/2571-6980/1/1/14/s1, Table S1 measured densities and ratios of neuronal and other cells, estimated average mass of individual neuronal (mN) and non-neuronal cells (mO), and estimated neuronal fractional mass of the tissue (fN) according to [73].
Author Contributions
S.H.H. and S.E.D.S. wrote the manuscript, prepared illustrations, and approved the manuscript.
Funding
Supported by Vanderbilt University start-up funds, and James S. McDonnell Foundation grant number 220020232.
Acknowledgments
Thanks to all our collaborators who participated in the original studies that generated the quantitative data mentioned here, in particular to Jon Kaas (Vanderbilt University, USA) and Paul Manger (University of the Witwatersrand, South Africa) for making these studies possible.
Conflicts of Interest
The authors declare no conflict of interest.
References
- Virchow, R. Die Cellularpathologie in Ihrer Begründung auf Physiologische und Pathologische Gewebelehre; Hirschwald: Berlin, Germany, 1858. [Google Scholar]
- Allen, N.J.; Barres, B.A. Neuroscience: Glia—more than just brain glue. Nature 2009, 457, 675–677. [Google Scholar] [CrossRef] [PubMed]
- Hartline, D.K. The evolutionary origins of glia. Glia 2011, 59, 1215–1236. [Google Scholar] [CrossRef] [PubMed]
- Umesono, Y.; Agata, K. Evolution and regeneration of the planarian central nervous system. Dev. Growth Differ. 2009, 51, 185–195. [Google Scholar] [CrossRef] [PubMed] [Green Version]
- Younossi-Hartenstein, A.; Ehlers, U.; Hartenstein, V. Embryonic development of the nervous system of the rhabdocoel flatworm Mesostoma lingua (Abilgaard, 1789). J. Comp. Neurol. 2000, 416, 461–474. [Google Scholar] [CrossRef]
- Zhu, B.; Pennack, J.A.; McQuilton, P.; Forero, M.G.; Mizuguchi, K.; Sutcliffe, B.; Gu, C.-J.; Fenton, J.C.; Hidalgo, A. Drosophila neurotrophins reveal a common mechanism for nervous system formation. PLoS Biol. 2008, 6, e284. [Google Scholar] [CrossRef] [PubMed]
- Losada-Perez, M. The evolutionary origins of glia. Glia 2018, 59, 1215–1236. [Google Scholar] [CrossRef]
- De Robertis, E.M.; Sasai, Y. A common plan for dorsoventral patterning in Bilateria. Nature 1996, 380, 37–40. [Google Scholar] [CrossRef] [PubMed]
- Hirth, F.; Kammermeier, L.; Frei, E.; Waldorf, U.; Noll, M.; Reichert, H. An urbilaterian origin of the tripartite brain: Developmental insights from Drosophila. Development 2003, 130, 2365–2373. [Google Scholar] [CrossRef] [PubMed]
- Hirth, F.; Reichert, H. Basic nervous system types: One or many? In Evolution of Nervous Systems; Kaas, J.H., Ed.; Academic Press: Amsterdam, The Netherlands, 2007; Volume 1, pp. 55–72. [Google Scholar]
- Moroz, L.L. On the independent origins of complex brains and neurons. Brain Behav. Evol. 2009, 74, 177–190. [Google Scholar] [CrossRef] [PubMed]
- Northcutt, R.G. Cladistic analysis reveals brainless Urbilateria. Brain Behav. Evol. 2010, 76, 1–2. [Google Scholar] [CrossRef] [PubMed]
- Ryan, T.J.; Grant, S.G.N. The origin and evolution of synapses. Nat. Rev. Neurosci. 2009, 10, 701–712. [Google Scholar] [CrossRef] [PubMed]
- Helm, C.; Karl, A.; Beckers, P.; Kaul-Strehlow, S.; Ulbricht, E.; Kourtesis, I.; Kuhrt, H.; Hausen, H.; Bartolomaeus, T.; Reichenbach, A.; et al. Early evolution of radial glial cells in Bilateria. Proc. R. Soc. B 2017, 284, 20170743. [Google Scholar] [CrossRef] [PubMed]
- Benton, M.J. Vertebrate Paleontology; Chapman and Hall: New York, NY, USA, 1997. [Google Scholar]
- Carroll, R.L. Patterns and Processes of Vertebrate Evolution; Cambridge Palaeobiology Series; Cambridge University Press: Cambridge, UK, 1997. [Google Scholar]
- Cameron, C.B.; Garey, J.R.; Swalla, B.J. Evolution of the chordate body plan: New insights from phylogenetic analyses of deuterostome phyla. Proc. Natl. Acad. Sci. USA 2000, 97, 4469–4474. [Google Scholar] [CrossRef] [PubMed] [Green Version]
- Hedges, S.B. Molecular evidence for the early history of living vertebrates in Major Events. In Early Vertebrate Evolution: Palaeontology, Phylogeny, Genetics and Development; Ahlberg, P.E., Ed.; Taylor & Francis: London, UK, 2001; pp. 119–134. [Google Scholar]
- Blair, J.E.; Hedges, S.B. Molecular clocks do not support the Cambrian Explosion. Mol. Biol. Evol. 2005, 22, 387–390. [Google Scholar] [CrossRef] [PubMed]
- Greig, L.C.; Woodworth, M.B.; Galazo, M.J.; Padmanabhan, H.; Macklis, J.D. Molecular logic of neocortical projection neuron specification, development and diversity. Nat. Rev. Neurosci. 2013, 14, 755–769. [Google Scholar] [CrossRef] [PubMed] [Green Version]
- Cheung, A.F.; Kondo, S.; Abdel-Mannan, O.; Chodroff, R.A.; Sirey, T.M.; Bluy, L.E.; Webber, N.; DeProto, J.; Karlen, S.J.; Krubitzer, L.; et al. The subventricular zone is the developmental milestone of a 6-layered neocortex: Comparisons in metatherian and eutherian mammals. Cereb. Cortex 2010, 20, 1071–1081. [Google Scholar] [CrossRef] [PubMed]
- Wang, X.; Lou, N.; Xu, Q.; Tian, G.F.; Peng, W.G.; Han, X.; Kang, J.; Takano, T.; Nedergaard, M. Astrocytic Ca2+ signaling evoked by sensory stimulation in vivo. Nat. Neurosci. 2006, 9, 816–823. [Google Scholar] [CrossRef] [PubMed]
- Ramon, Y.; Cajal, S. Histologie du Système Nerveux de 1’Homme et des Vertébrés; Maloine: Paris, France, 1991; Volume 1, p. 986. [Google Scholar]
- Centro Virtual Cervantes Website. Available online: https://cvc.cervantes.es/ciencia/cajal/cajal_recuerdos/recuerdos/laminas.htm (accessed on 7 May 2018).
- Del Rio, H.P. La microglia y su transformacion en celulas en basoncito y cuerpos granulo-adiposos. Trab. Lab. Investig. Biol. Madrid. 1920, 18, 37–82. [Google Scholar]
- Somjen, G.G. Nervenkitt: Notes on the History of the Concept of Neuroglia. Glia 1988, 1, 2–9. [Google Scholar] [CrossRef] [PubMed]
- Harada, K.; Kamiya, T.; Tsuboi, T. Gliotransmitter release from astrocytes: Functional, developmental, and pathological implications in the brain. Front. Neurosci. 2016, 9, 499. [Google Scholar] [CrossRef] [PubMed]
- Halassa, M.M.; Fellin, T.; Takano, H.; Dong, J.H.; Haydon, P.G. Synaptic islands defined by the territory of a single astrocyte. J. Neurosci. 2007, 27, 6473–6477. [Google Scholar] [CrossRef] [PubMed]
- Hughes, E.G.; Kang, S.H.; Fukaya, M.; Bergles, D.E. Oligodendrocyte progenitors balance growth with self-repulsion to achieve homeostasis in the adult brain. Nat. Neurosci. 2013, 16, 668–676. [Google Scholar] [CrossRef] [PubMed] [Green Version]
- Zeng, H.; Sanes, J.R. Neuronal cell-type classification: Challenges, opportunities and the path forward. Nat. Rev. Neurosci. 2017, 18, 530–546. [Google Scholar] [CrossRef] [PubMed]
- Tasic, B.; Menon, V.; Nguyen, T.N.; Kim, T.K.; Jarsky, T.; Yao, Z.; Levi, B.; Gray, L.T.; Sorensen, S.A.; Dolbeare, T.; et al. Adult mouse cortical cell taxonomy revealed by single cell transcriptomics. Nat. Neurosci. 2016, 19, 335–346. [Google Scholar] [CrossRef] [PubMed] [Green Version]
- Zeisel, A.; Muñoz-Machado, A.B.; Codeluppi, S.; Lönnerberg, P.; La Manno, G.; Juréus, A.; Marques, S.; Munguba, H.; He, L.; Betsholtz, C.; et al. Cell types in the mouse cortex and hippocampus revealed by single-cell RNA-seq. Science 2015, 347, 1138–1142. [Google Scholar] [CrossRef] [PubMed]
- Darmanis, S.; Sloan, S.A.; Zhang, Y.; Enge, M.; Caneda, C.; Shuer, L.M.; Hayden, G.M.G.; Barres, B.A.; Quake, S.R. A survey of human brain transcriptome diversity at the single cell level. Proc. Natl. Acad. Sci. USA 2015, 112, 7285–7290. [Google Scholar] [CrossRef] [PubMed]
- Raj, B.; Wagner, D.E.; McKenna, A.; Pandey, S.; Klein, A.M.; Shendure, J.; Gagnon, J.A.; Schier, A.F. Simultaneous single-cell profiling of lineages and cell types in the vertebrate brain. Nat. Biotechnol. 2018, 5, 442–450. [Google Scholar] [CrossRef] [PubMed]
- Mullen, R.J.; Buck, C.R.; Smith, A.M. NeuN, a neuronal specific nuclear protein in vertebrates. Development 1992, 116, 201–211. [Google Scholar] [PubMed]
- Rothstein, J.D.; Martin, L.; Levey, A.I.; Dykes-Hoberg, M.; Jin, L.; Wu, D.; Nash, N.; Kuncl, R.W. Localization of neuronal and glial glutamate transporters. Neuron 1994, 13, 713–725. [Google Scholar] [CrossRef]
- Cahoy, J.D.; Emery, B.; Kaushal, A.; Foo, L.C.; Zamanian, J.L.; Christopherson, K.S.; Xing, Y.; Lubischer, J.L.; Krieg, P.A.; Krupenko, S.A.; et al. A transcriptome database for astrocytes, neurons, and oligodendrocytes: A new resource for understanding brain development and function. J. Neurosci. 2008, 28, 264–278. [Google Scholar] [CrossRef] [PubMed]
- Sun, W.; Cornwell, A.; Li, J.; Peng, S.; Osorio, M.J.; Aalling, N.; Wang, S.; Benraiss, A.; Lou, N.; Goldman, S.A.; et al. SOX9 is an astrocyte-specific nuclear marker in the adult brain outside the neurogenic regions. J. Neurosci. 2017, 37, 4493–4507. [Google Scholar] [CrossRef] [PubMed]
- Dos Santos, S.E.; Botelho, L.; Medeiros, M.; Porfirio, J.; Herculano-Houzel, S. Invariant microglial cells densities suggest evolutionary conserved developmental mechanisms governing their addition to the brains of mammals. Unpublished work. 2018. [Google Scholar]
- Dos Santos, S.E.; Glassburn, L.; Hanflink, A.; Staub, M.; Palan, J.; Wimbiscus, M.; Herculano-Houzel, S. Similar densities of astrocytes found in different brain structures in a wide range of mammalian species. Unpublished work. 2018. [Google Scholar]
- Jiang, X.; Shen, S.; Cadwell, C.R.; Berns, P.; Sinz, F.; Ecker, A.S.; Patel, S.; Tolias, A.S. Principles of connectivity among morphologically defined cell types in adult neocortex. Science 2015, 350, aac9462. [Google Scholar] [CrossRef] [PubMed]
- Von Bartheld, C.S.; Bahney, J.; Herculano-Houzel, S. The search for true numbers of neurons and glial cells in the human brain: A review of 150 years of cell counting. J. Comp. Neurol. 2016, 524, 3865–3895. [Google Scholar] [CrossRef] [PubMed] [Green Version]
- Vaughan, D.W.; Peters, A. Neuroglial cells in the cerebral cortex of rats from young adulthood to old age: An electron microscope study. J. Neurocytol. 1974, 3, 405–429. [Google Scholar] [CrossRef] [PubMed]
- O’Kusky, J.; Colonnier, M. A laminar analysis of the number of neurons, glia, and synapses in the visual cortex (area 17) of adult macaque monkeys. J. Comp. Neurol. 1982, 210, 278–290. [Google Scholar] [CrossRef] [PubMed]
- Peters, A.; Josephson, K.; Vincent, S.L. Effects of aging on the neuroglial cells and pericytes within area 17 of the rhesus monkey cerebral cortex. Anat. Rec. 1991, 229, 384–398. [Google Scholar] [CrossRef] [PubMed]
- Kettenmann, H.; Ransom, B.R. The Concept of Neuroglia: A Historical Perspective; University Press: Oxford, UK, 2005. [Google Scholar]
- Agulhon, C.; Petravicz, J.; McMullen, A.B.; Sweger, E.J.; Minton, S.K.; Taves, S.R.; Casper, K.B.; Fiacco, T.A.; McCarthy, K.D. What is the role of astrocyte calcium in neurophysiology. Neuron 2008, 59, 932–946. [Google Scholar] [CrossRef] [PubMed]
- Kandel, E.R.; Schwartz, J.H.; Jessell, T.M. Principles of Neural Science, 3rd ed.; Appleton & Lange: Norwalk, CT, USA, 1991. [Google Scholar]
- Kandel, E.R.; Schwartz, J.H.; Jessell, T.M.; Siegelbaum, S.A.; Hudspeth, A.J. Principles of Neural Science, 5th ed.; McGraw-Hill: New York, NY, USA, 2013. [Google Scholar]
- Haug, H. Brain sizes, surfaces, and neuronal sizes on the cortex cerebri: A stereological investigation of man and his variability and a comparison with some mammals (primates, whales, marsupials, insectivores, and one elephant). Am. J. Anat. 1987, 180, 126–142. [Google Scholar] [CrossRef] [PubMed]
- Tower, D.B.; Young, O.M. The activities of butyrylcholinesterase and carbonic anhydrase, the rate of anaerobic glycolysis, and the question of a constant density of glial cells in cerebral cortices of various mammalian species from mouse to whale. J. Neurochem. 1973, 20, 260–278. [Google Scholar] [CrossRef]
- Friede, R. Der quantitative Anteil der Glia an der Cortex Entwicklung. Acta Anat. 1954, 20, 290–296. [Google Scholar] [CrossRef] [PubMed]
- Herculano-Houzel, S.; Mota, B.; Lent, R. Cellular scaling rules for rodent brains. Proc. Natl. Acad. Sci. USA 2006, 103, 12138–12143. [Google Scholar] [CrossRef] [PubMed] [Green Version]
- Herculano-Houzel, S.; Collins, C.; Wong, P.; Kaas, J.H. Cellular scaling rules for primate brains. Proc. Natl. Acad. Sci. USA 2007, 104, 3562–3567. [Google Scholar] [CrossRef] [PubMed] [Green Version]
- Azevedo, F.A.C.; Carvalho, L.R.B.; Grinberg, L.T.; Farfel, J.M.; Ferretti, R.E.L.; Leite, R.E.P.; Jacob, F.W.; Lent, R.; Herculano-Houzel, S. Equal numbers of neuronal and non-neuronal cells make the human brain an isometrically scaled-up primate brain. J. Comp. Neurocytol. 2009, 513, 532–541. [Google Scholar] [CrossRef] [PubMed]
- Sarko, D.K.; Catania, K.C.; Leitch, D.B.; Kaas, J.H.; Herculano-Houzel, S. Cellular scaling rules of insectivore brains. Front. Neuroanat. 2009, 3, 8. [Google Scholar] [CrossRef] [PubMed]
- Gabi, M.; Collins, C.E.; Wong, P.; Kaas, J.H.; Herculano-Houzel, S. Cellular scaling rules for the brain of an extended number of primate species. Brain Behav. Evol. 2010, 76, 32–44. [Google Scholar] [CrossRef] [PubMed]
- Herculano-Houzel, S.; Kaas, J.H. Gorilla and orangutan brains conform to the primate scaling rules: Implications for hominin evolution. Brain Behav. Evol. 2011, 77, 33–44. [Google Scholar] [CrossRef] [PubMed]
- Herculano-Houzel, S.; Ribeiro, P.F.M.; Campos, L.; da Silva, A.V.; Torres, L.B.; Catania, K.C.; Kaas, J.H. Updated neuronal scaling rules for the brains of Glires (rodents/lagomorphs). Brain Behav. Evol. 2011, 78, 302–314. [Google Scholar] [CrossRef] [PubMed]
- Neves, K., Jr.; Ferreira, F.M.; Tovar-Moll, F.; Gravett, N.; Bennett, N.C.; Kaswera, C.; Gilissen, E.; Manger, P.R.; Herculano-Houzel, S. Cellular scaling rules for the brains of Afrotheria. Front. Neuroanat. 2014, 8, 5. [Google Scholar] [CrossRef] [PubMed]
- Herculano-Houzel, S.; Avelino-de-Souza, K.; Neves, K.; Porfírio, J.; Messeder, D.; Calazans, I.; Mattos, L.; Maldonado, J.; Manger, P.M. The elephant brain in numbers. Front. Neuroanat. 2014, 8, 46. [Google Scholar] [CrossRef] [PubMed]
- Kazu, R.S.; Maldonado, J.; Mota, B.; Manger, P.R.; Herculano-Houzel, S. Cellular scaling rules for the brains of Artiodactyla. Front. Neuroanat. 2014, 8, 128. [Google Scholar] [CrossRef] [PubMed]
- Dos Santos, S.E.; Porfirio, J.; Da Cunha, F.B.; Manger, P.R.; Tavares, W.; Pessoa, L.; Raghanti, M.A.; Sherwood, C.C.; Herculano-Houzel, S. Cellular scaling rules for the brain of marsupials: Not as “primitive” as expected. Brain Behav. Evol. 2017, 89, 48–63. [Google Scholar] [CrossRef] [PubMed]
- Jardim-Messeder, D.; Lambert, K.; Noctor, S.; Marques Pestana, F.; DeCastro Leal, M.E.; Bertelsen, M.F.; Alagaili, A.N.; Mohammad, O.B.; Manger, P.R.; Herculano-Houzel, S. Dogs have the most neurons, though not the largest brain: Trade-off between body mass and number of neurons in the cerebral cortex of large carnivoran species. Front. Neuroanat. 2017, 11, 118. [Google Scholar] [CrossRef] [PubMed]
- Herculano-Houzel, S.; Lent, R. Isotropic fractionator: A simple, rapid method for the quantification of total cell and neuron numbers in the brain. J. Neurosci. 2005, 25, 2518–2521. [Google Scholar] [CrossRef] [PubMed]
- Bahney, J.; von Bartheld, C.S. Validation of the isotropic fractionator: Comparison with unbiased stereology and DNA extraction for quantification of glial cells. J. Neurosci. Meth. 2014, 222, 165–174. [Google Scholar] [CrossRef] [PubMed] [Green Version]
- Miller, D.J.; Balaram, P.; Young, N.A.; Kaas, J.H. Three counting methods agree on cell and neuron number in chimpanzee primary visual cortex. Front. Neuroanat. 2014, 8, 36. [Google Scholar] [CrossRef] [PubMed]
- Ngwenya, A.; Nahirney, J.; Brinkman, B.; Williams, L.; Iwaniuk, A.N. Comparison of estimates of neuronal number obtained using the isotropic fractionator method and unbiased stereology in day old chicks (Gallus domesticus). J. Neurosci. Meth. 2017, 287, 39–46. [Google Scholar] [CrossRef] [PubMed]
- Herculano-Houzel, S.; Messeder, D.; Fonseca-Azevedo, K.; Araujo Pantoja, N. When larger brains do not have more neurons: Intraspecific increase in numbers of cells is compensated by decreased average cell size. Front. Neuroanat. 2015, 9, 64. [Google Scholar] [CrossRef] [PubMed]
- Olkowicz, S.; Kocourek, M.; Lucan, R.K.; Portes, M.; Fitch, W.T.; Herculano-Houzel, S.; Nemec, P. Birds have primate-like numbers of neurons in the telencephalon. Proc. Natl. Acad. Sci. USA 2016, 113, 7255–7260. [Google Scholar] [CrossRef] [PubMed]
- Ngwenya, A.; Patzke, N.; Manger, P.R.; Herculano-Houzel, S. Continued growth of the central nervous system without mandatory addition of neurons in the Nile crocodile (Crocodylus niloticus). Brain Behav. Evol. 2016, 87, 19–38. [Google Scholar] [CrossRef] [PubMed]
- Herculano-Houzel, S. The Isotropic Fractionator: A fast, reliable method to determine numbers of cells in the brain or other tissues. In Neuronal Network Analysis Concepts and Experimental Approaches; Fellin, T., Halassa, M., Eds.; Springer: Berlin, Germany, 2012; pp. 391–403. ISBN 978-1-61779-633-3. [Google Scholar]
- Mota, B.; Herculano-Houzel, S. All brains are made of this: A fundamental building block of brain matter with matching neuronal and glial masses. Front. Neuroanat. 2014, 8, 127. [Google Scholar] [CrossRef] [PubMed]
- Herculano-Houzel, S.; Catania, K.; Manger, P.R.; Kaas, J.H. Mammalian brains are made of these: A dataset on the numbers and densities of neuronal and non-neuronal cells in the brain of glires, primates, scandentia, eulipotyphlans, afrotherians and artiodactyls, and their relationship with body mass. Brain Behav. Evol. 2015, 86, 145–163. [Google Scholar] [CrossRef] [PubMed]
- Herculano-Houzel, S.; Manger, P.R.; Kaas, J.H. Brain scaling in mammalian evolution as a consequence of concerted and mosaic changes in numbers of neurons and average neuronal cell size. Front. Neuroanat. 2014, 8, 77. [Google Scholar] [CrossRef] [PubMed]
- Herculano-Houzel, S.; Watson, C.; Paxinos, G. Distribution of neurons in functional areas of the mouse cerebral cortex reveals quantitatively different cortical zones. Front. Neuroanat. 2013, 7, 35. [Google Scholar] [CrossRef] [PubMed]
- Ribeiro, P.F.M.; Ventura-Antunes, L.; Gabi, M.; Mota, B.; Grinberg, L.T.; Farfel, J.M.; Ferretti, R.E.L.; Leite, R.E.P.; Jacob Filho, W.; Herculano-Houzel, S. The human cerebral cortex is neither one nor many: Neuronal distribution reveals two quantitatively different zones in the grey matter, three in the white matter, and explains local variations in cortical folding. Front. Neuroanat. 2013, 7, 28. [Google Scholar] [CrossRef] [PubMed]
- Lauwers, F.; Cassot, F.; Lauwers-Cances, V.; Puwanarajah, P.; Duvernoy, H. Morphometry of the human cerebral cortex microcirculation: General characteristics and space-related profiles. Neuroimage 2008, 39, 936–948. [Google Scholar] [CrossRef] [PubMed]
- Ventura-Antunes, L.; Botelho, L.; Maldonado, J.; Herculano-Houzel, S. Smaller energy availability per neuron in sites with higher neuronal densities in the mouse brain. Unpublished work. 2018. [Google Scholar]
- Karbowski, J. Scaling of brain metabolism and blood flow in relation to capillary and neural scaling. PLoS ONE 2011, 6, e26709. [Google Scholar] [CrossRef] [PubMed]
- Pelvig, D.P.; Pakkenberg, H.; Stark, A.K.; Pakkenberg, B. Neocortical glial cell numbers in human brains. Neurobiol. Aging 2008, 29, 1754–1762. [Google Scholar] [CrossRef] [PubMed]
- Ge, W.-P.; Miyawaki, A.; Gage, F.H.; Jan, Y.N.; Han, L.Y. Local generation of glia is a major astrocyte source in postnatal cortex. Nature 2012, 484, 376–381. [Google Scholar] [CrossRef] [PubMed]
- Bass, N.H.; Hess, H.H.; Pope, A.; Thalheimer, C. Quantitative cytoarchitectonic of neurons, glia, and DNA in rat cerebral cortex. J. Comp. Neurol. 1971, 143, 481–490. [Google Scholar] [CrossRef] [PubMed]
- Mori, S. Light and electron microscopic features and frequencies of the glial cells present in the cerebral cortex of the rat brain. Arch. Histol. Jpn. 1972, 34, 231–244. [Google Scholar] [CrossRef] [PubMed]
- Ling, E.-A.; Leblond, C.P. Investigations of glial cells in semithin sections. II Variation with age in the numbers of the various glial cell types in rat cortex and corpus callosum. J. Comp. Neurol. 1973, 149, 73–81. [Google Scholar] [CrossRef]
- Oberheim, N.A.; Takano, T.; Han, X.; He, W.; Lin, J.H.; Wang, F.; Xu, Q.; Wyatt, J.D.; Pilcher, W.; Ojemann, J.G.; et al. Uniquely hominid features of adult human astrocytes. J. Neurosci. 2009, 29, 3276–3287. [Google Scholar] [CrossRef] [PubMed]
- He, Z.; Han, D.; Efimova, O.; Guijarro, P.; Yu, Q.; Oleksiak, A.; Jiang, S.; Anokhin, K.; Velichkovsky, B.; Grünewald, S.; et al. Comprehensive transcriptome analysis of neocortical layers in humans, chimpanzees and macaques. Nat. Neurosci. 2017, 20, 886–895. [Google Scholar] [CrossRef] [PubMed]
- Kandel, E.R.; Schwartz, J.H. Principles of Neural Science, 2nd ed.; Elsevier: New York, NY, USA; Amsterdam, The Netherlands; Ofxord, UK, 1985. [Google Scholar]
- Nedergaard, M.; Ransom, B.; Goldman, S.A. New roles for astrocytes: Redefining the functional architecture of the brain. Trends Neurosci. 2003, 26, 523–530. [Google Scholar] [CrossRef] [PubMed]
- Ransom, B.; Behar, T.; Nedergaard, M. New roles for astrocytes (stars at last). Trends Neurosci. 2003, 26, 520–522. [Google Scholar] [CrossRef] [PubMed]
- Nishiyama, A.; Yang, Z.; Butt, A. Astrocytes and NG2-glia: What’s in a name? J. Anat. 2005, 207, 687–693. [Google Scholar] [CrossRef] [PubMed]
- Sherwood, C.C.; Stimpson, C.D.; Raghanti, M.A.; Wildman, D.E.; Uddin, M.; Grossman, L.I.; Goodman, M.; Redmond, J.C.; Bonar, C.J.; Erwin, J.M.; et al. Evolution of increased glia-neuron ratios in the human frontal cortex. Proc. Natl. Acad. Sci. USA 2006, 103, 13606–13611. [Google Scholar] [CrossRef] [PubMed] [Green Version]
- Hawkins, A.; Olszewski, J. Glia/nerve cell index of the cortex of the whale. Science 1957, 126, 76–77. [Google Scholar] [CrossRef] [PubMed]
- Gehrmann, J.; Matsumoto, Y.; Kreutzberg, G.W. Microglia: Intrinsic immunoeffector cell of the brain. Brain Res. Rev. 1995, 20, 269–287. [Google Scholar] [CrossRef]
- Cunningham, C.L.; Martínez-Cerdeño, V.; Noctor, S.C. Microglia regulate the number of neural precursor cells in the developing cerebral cortex. J. Neurosci. 2013, 33, 4216–4233. [Google Scholar] [CrossRef] [PubMed]
- Herculano-Houzel, S. The glia/neuron ratio: How it varies uniformly across brain structures and species and what that means for brain physiology and evolution. Glia 2014, 62, 1377–1391. [Google Scholar] [CrossRef] [PubMed]
- Kast, B. The best supporting actors. Nature 2001, 412, 674–676. [Google Scholar] [CrossRef] [PubMed]
- Zimmer, C. The dark matter of the human brain. Discover 2009, 30, 30–31. [Google Scholar]
- Banhey, J.; von Bartheld, C.S. The cellular composition and glia-neuron ratio in the spinal cord of a human and a nonhuman primate: Comparison with other species and brain regions. Anat. Rec. 2018, 301, 697–710. [Google Scholar] [CrossRef]
- Von Bartheld, C.S. Myths and truths about the cellular composition of the human brain: A review of influential concepts. J. Chem. Neuroanat. 2017, in press. [Google Scholar] [CrossRef] [PubMed]
- Herculano-Houzel, S. Scaling of brain metabolism with a fixed energy budget per neuron: Implications for neuronal activity, plasticity and evolution. PLoS ONE 2011, 6, e17514. [Google Scholar] [CrossRef] [PubMed]
- Mota, B.; Herculano-Houzel, S. Cortical folding scales universally with surface area and thickness, not number of neurons. Science 2015, 349, 74–77. [Google Scholar] [CrossRef] [PubMed]
- Copley, S.D.; Smith, E.; Morowitz, H.J. A mechanism for the association of amino acids with their codons and the origins of the genetic code. Proc. Natl. Acad. Sci. USA 2005, 102, 4442–4447. [Google Scholar] [CrossRef] [PubMed]
- Perea, G.; Navarrete, M.; Araque, A. Tripartite synapses: Astrocytes process and control synaptic information. Trends Neurosci. 2009, 32, 421–431. [Google Scholar] [CrossRef] [PubMed]
- Lee, Y.; Morrison, B.M.; Li, Y.; Lengacher, S.; Farah, M.H.; Hoffman, P.N.; Liu, Y.; Tsingalia, A.; Jin, L.; Zhang, P.-W.; et al. Oligodendroglia metabolically support axons and contribute to neurodegeneration. Nature 2012, 487, 443–450. [Google Scholar] [CrossRef] [PubMed]
- Ullian, E.M.; Sapperstein, S.K.; Chistopherson, K.S.; Barres, B.A. Control of synapse number by glia. Science 2001, 291, 657–661. [Google Scholar] [CrossRef] [PubMed]
- Mauch, D.H.; Nägler, K.; Schumacher, S.; Göritz, C.; Müller, E.-C.; Otto, A.; Pfrieger, F.W. CNS synaptogenesis promoted by glia-derived cholesterol. Science 2001, 294, 1354–1357. [Google Scholar] [CrossRef] [PubMed]
- Magistretti, P.J. Neuron–glia metabolic coupling and plasticity. J. Exp. Biol. 2006, 209, 2304–2311. [Google Scholar] [CrossRef] [PubMed]
- Cragg, B.G. The density of synapses and neurons in the motor and visual areas of the cerebral cortex. J. Anat. 1967, 101, 639–654. [Google Scholar] [PubMed]
- Miki, T.; Fukui, Y.; Itoh, M.; Hisano, S.; Xie, Q.; Takeuchi, Y. Estimation of the numerical densities of neurons and synapses in cerebral cortex. Brain Res. Protoc. 1997, 2, 9–16. [Google Scholar] [CrossRef]
- Caplan, A.I.; Ordahl, C.P. Irreversible gene repression model for control of development. Science 1978, 201, 120–131. [Google Scholar] [CrossRef] [PubMed]
- Brown, G.; Bunce, C.M.; Lord, J.M.; McConnell, F.M. The development of cell lineages: A sequential model. Differentiation 1988, 39, 83–89. [Google Scholar] [CrossRef] [PubMed]
- McConnell, S.K. Constructing the cerebral cortex: Neurogenesis and fate determination. Neuron 1995, 15, 761–768. [Google Scholar] [CrossRef]
- Grimaldi, P.; Carletti, B.; Magrassi, L.; Rossi, F. Fate restriction and developmental potential of cerebellar progenitors. Transplantation studies in the developing CNS. Prog. Brain Res. 2005, 148, 57–68. [Google Scholar] [CrossRef] [PubMed]
- Qian, X.; Shen, Q.; Goderie, S.K.; He, W.; Capela, A.; Davis, A.A.; Temple, S. Timing of CNS cell generation: A programmed sequence of neuron and glial cell production from isolated murine cortical stem cells. Neuron 2000, 28, 69–80. [Google Scholar] [CrossRef]
- Bandeira, F.; Lent, R.; Herculano-Houzel, S. Changing numbers of neuronal and non-neuronal cells underlie postnatal brain growth in the rat. Proc. Natl. Acad. Sci. USA 2009, 106, 14108–14113. [Google Scholar] [CrossRef] [PubMed] [Green Version]
- Dos Santos, S.E.; Noctor, S.C.; Herculano-Houzel, S. Discontinuous addition of cortical cells during embryonic and postnatal rat development. Unpublished work. 2018. [Google Scholar]
- Morterá, P.; Dos Santos, S.E.; Noctor, S.; Herculano-Houzel, S. Changing numbers of cells in pre- and postnatal development in the mouse. Unpublished work. 2018. [Google Scholar]
- Rowitch, D.H. Glial specification in the vertebrate neural tube. Nat. Rev. Neurosci. 2004, 5, 409–419. [Google Scholar] [CrossRef] [PubMed]
- Chan, W.Y.; Kohsaka, S.; Rezaie, P. The origin and cell lineage of microglia—New concepts. Brain Res. Rev. 2007, 53, 344–354. [Google Scholar] [CrossRef] [PubMed]
- Kriegstein, A.; Alvarez-Buylla, A. The glial nature of embryonic and adult neural stem cells. Ann. Rev. Neurosci. 2009, 32, 149–184. [Google Scholar] [CrossRef] [PubMed]
- Prinz, M.; Mildner, A. Microglia in the CNS: Immigrants from another world. Glia 2011, 59, 177–187. [Google Scholar] [CrossRef] [PubMed]
- Ginhoux, F.; Lim, S.; Hoeffel, G.; Low, D.; Huber, T. Origin and differentiation of microglia. Front. Cell. Neurosci. 2013, 7, 45. [Google Scholar] [CrossRef] [PubMed]
- Ginhoux, F.; Prinz, M. Origin of microglia: Current concepts and past controversies. Cold Spring Harb. Perspect. Biol. 2015, 7. [Google Scholar] [CrossRef] [PubMed]
- Reik, W. Stability and flexibility of epigenetic gene regulation in mammalian development. Nature 2007, 447, 425–432. [Google Scholar] [CrossRef] [PubMed]
- Golkaram, M.; Jang, J.; Hellander, S.; Kosik, K.S.; Petzold, L.R. The role of chromatin density in cell population heterogeneity during stem cell differentiation. Sci. Rep. 2017, 7, 13307. [Google Scholar] [CrossRef] [PubMed]
- Chen, T.; Dent, S.Y.R. Chromatin modifiers and remodelers: Regulators of cellular differentiation. Nat. Rev. Gen. 2014, 15, 93–106. [Google Scholar] [CrossRef] [PubMed]
- Doetsch, F.; Caille, I.; Lim, D.A.; Garcia-Verdugo, J.M.; Alvarez-Buylla, A. Subventricular zone astrocytes are neural stem cells in the adult mammalian brain. Cell 1999, 97, 703–716. [Google Scholar] [CrossRef]
- Seri, B.; Garcia-Verdugo, J.M.; McEwen, B.S.; Alvarez-Buylla, A. Atrocytes give rise to new neurons in the adult mammalian hippocampus. J. Neurosci. 2001, 21, 7153–7160. [Google Scholar] [CrossRef] [PubMed]
- Doetsch, F. The glial identity of neural stem cells. Nat. Neurosci. 2003, 6, 1127–1134. [Google Scholar] [CrossRef] [PubMed]
- Bayraktar, O.A.; Fuentealba, L.C.; Alvarez-Buylla, A.; Rowitch, D.H. Astrocyte development and heterogeneity. Cold Spring Harb. Perspect. Biol. 2015, 5. [Google Scholar] [CrossRef] [PubMed]
- Schmidt-Nielsen, K. Scaling: Why Is Animal Size So Important? Cambridge University Press: Cambridge, UK, 1984. [Google Scholar]
- Savage, V.M.; Allen, A.P.; Brown, L.H.; Gillooly, J.F.; Herman, A.B.; Woodruff, W.H.; West, G.B. Scaling of number, size, and metabolic rate of cells with body size in mammals. Proc. Natl. Acad. Sci. USA 2007, 104, 4718–4723. [Google Scholar] [CrossRef] [PubMed] [Green Version]
- Herculano-Houzel, S.; Avelino-de-Souza, K.; Manger, P.R. Constant densities of cells in the liver of reptile and mammalian species irrespective of body size. Unpublished work. 2018. [Google Scholar]
- Rosenberg, A.B.; Roco, C.M.; Muscat, R.A.; Kuchina, A.; Sample, P.; Yao, Z.; Graybuck, L.T.; Peeler, D.J.; Mukherjee, S.; Chen, W.; et al. Single-cell profiling of the developing mouse brain and spinal cord with split-pool barcoding. Science 2018, 360, 176–182. [Google Scholar] [CrossRef] [PubMed]
Figure 1.
Morphological neuronal types are more numerous than morphological glial cell types. Non-exhaustive representations of some morphological neuronal types in shades of yellow-orange (top three rows) and glial cells (bottom row) in purple, green, and red. First row, left to right: bipolar cell, short axon cell, pyramidal cell, Purkinje cell. Second row, left to right: amacrine cell, multipolar/motor cell, granule cell. Third row, left to right: basket cell, unipolar cell. Bottom row, left to right: protoplasmic astrocyte, like those found in grey matter; fibrous astrocyte, like those found in white matter; microglia; oligodendrocyte. Drawings inspired by those of Ramon y Cajal and del Rio-Hortega [23,24,25,26].

Figure 2.
Homogeneous distribution of glial cells, but not neurons, across the cerebral cortex. (A) Neuronal nuclei (NeuN) and aldehyde dehydrogenase 1 family member L1 (Aldh1l1) immunoreactivity in the mouse cerebral cortex are shown at 63× magnification with all cells stained with 4′,6-diamidino-2-phenylindole (DAPI) (c,f), neurons stained for NeuN in red (d,g), astrocytes stained for Aldh1l1 in green (e,h), and both labels merged in (a,b). Inserts in (a) are enlarged in (b) and (f) and illustrate a portion of the grey matter (b–e) and of the white matter (f–h); (B) NeuN and ionized calcium-binding adapter molecule 1 (Iba1) immunoreactivity in the mouse cerebral cortex are shown at 63× magnification with all cells stained with DAPI (c,f), neurons stained for NeuN in red (d,g), microglia stained for Iba1 in green (e,h), and both labels merged in (a,b). Inserts in (a) are enlarged in (b–e) and (f–h) and illustrate a portion of the grey and white matter, respectively. Scale bars: 150 μm (a in A and B), 50 μm (b–h in A and B).

Figure 3.
Single-cell transcriptomics identify many clusters of interneurons and of excitatory neurons, but only a few glial cell subtypes. Numbers of cell subtypes in each cluster are indicated in parentheses. Oligodendrocyte subtypes appear to be different maturation stages along the same lineage. A non-exhaustive list of specific cytoplasmic and nuclear markers is provided for neurons and each glial cell type. Data from [31,32,35,36,37,38,39,40]. Snap25: Synaptosomal-associated protein 25; Vip: Vasoactive intestinal peptide; Sst: Neuropeptide somatostatin; Pvalb: Parvalbumin; ALDH1L1: Aldehyde dehydrogenase 1 family member L1; Aqp4: Aquaporin-4; GFAP: Glial fibrillary acidic protein; Cx3cr1: Chemokine (C-X3-C motif) receptor 1; Itgam: Integrin subunit alpha M; Ctss: Cathepsin S; Plp1: Proteolipid protein 1; Mog: Myelin oligodendrocyte glycoprotein; Opalin: Oligodendrocytic myelin paranodal and inner loop protein; NeuN: Neuronal nuclei; Tceal5: Transcription elongation factor A like 5; Snurf: SNRPN upstream reading frame; MFGE8: Milk fat globule-EGF factor 8 protein; Megf10: Multiple EGF like domains 10; S100b: S100 calcium binding protein B; Sox9: SRY (sex determining region Y)- box 9; Irf8: Interferon regulatory factor 8; Nlrp3: NLR family pyrin domain containing 3; Irf5: Interferon regulatory factor 5; Hcls1: Hematopoietic cell-specific Lyn substrate 1; Spi1: Spi-1 proto-oncogene; Iba1: Ionized calcium binding adaptor molecule 1; Olig1: Oligodendrocyte transcription factor 1; Olig2: : Oligodendrocyte transcription factor 2; Nkx6-2: NK6 homeobox 2; Sox10: SRY (sex determining region Y)- box 10; St18: Suppression of tumorigenicity 18.

Figure 4.
Phylogeny of the mammalian species for which numbers of neuronal and non-neuronal cells presented in this review have been reported. Clades are color-coded similarly in all figures. Drawings by Lorena Kaz.
Figure 4.
Phylogeny of the mammalian species for which numbers of neuronal and non-neuronal cells presented in this review have been reported. Clades are color-coded similarly in all figures. Drawings by Lorena Kaz.

Figure 5.
Density of non-neuronal cells is much less variable then neuronal densities in the mammalian brain. (A) Neuronal densities per milligram of tissue are enormously variable across brain structures and mammalian species. Each point represents the neuronal density in one structure (cerebral cortex, circles; cerebellum, squares; or rest of brain, triangles) in one of 60 mammalian species belonging to 8 different clades, as indicated, plotted against the total number of neurons found in that brain structure. (B) Other cell densities per milligram of tissue vary little across the same brain structures and species. Each point represents the neuronal density in the brain structures and species as shown in the left, plotted as a function of the total number of non-neuronal cells found in that structure. All data obtained with the isotropic fractionator. Data from [53,54,55,56,57,59,60,61,62,63,64].

Figure 6.
Density of non-neuronal cells per milligram of tissue varies little in the mammalian brain. (A) Neuronal densities (horizontal axis), but not other cell densities (vertical axis), are enormously variable across brain structures and mammalian species. Each point represents the neuronal and other cell (non-neuronal) density in one structure (cerebral cortex, cerebellum, and rest of brain, the latter being composed of medulla, pons, mesencephalon, striatum, and diencephalon) in one of 60 mammalian species belonging to eight different clades, as indicated. Filled circles, whole cerebral cortex (including subcortical white matter and hippocampus); empty circles, gray matter of cerebral cortex (including hippocampus); asterisks, white matter of cerebral cortex; filled triangles, rest of brain; empty triangles, substructures of rest of brain, as above; filled squares, cerebellum; empty squares, hippocampus. (B) Neuronal and other cell densities across brain structures and regions in the mouse and elephant brains, and in individual mice. Each point in black represents neuronal and other cell density in different structures, cortical regions, or subsections of the cerebellum in one African elephant brain hemisphere [61]; each point in shades of orange to magenta represents neuronal and other cell density in the cerebral cortex (circles), cerebellum (squares), or rest of brain (triangles) of one hemisphere of each of 19 individual male mice of similar age [69]. Each point in one of four shades of blue or green represents neuronal and other cell density in one of 19 cortical areas in the brain in one of four mouse individuals [76].
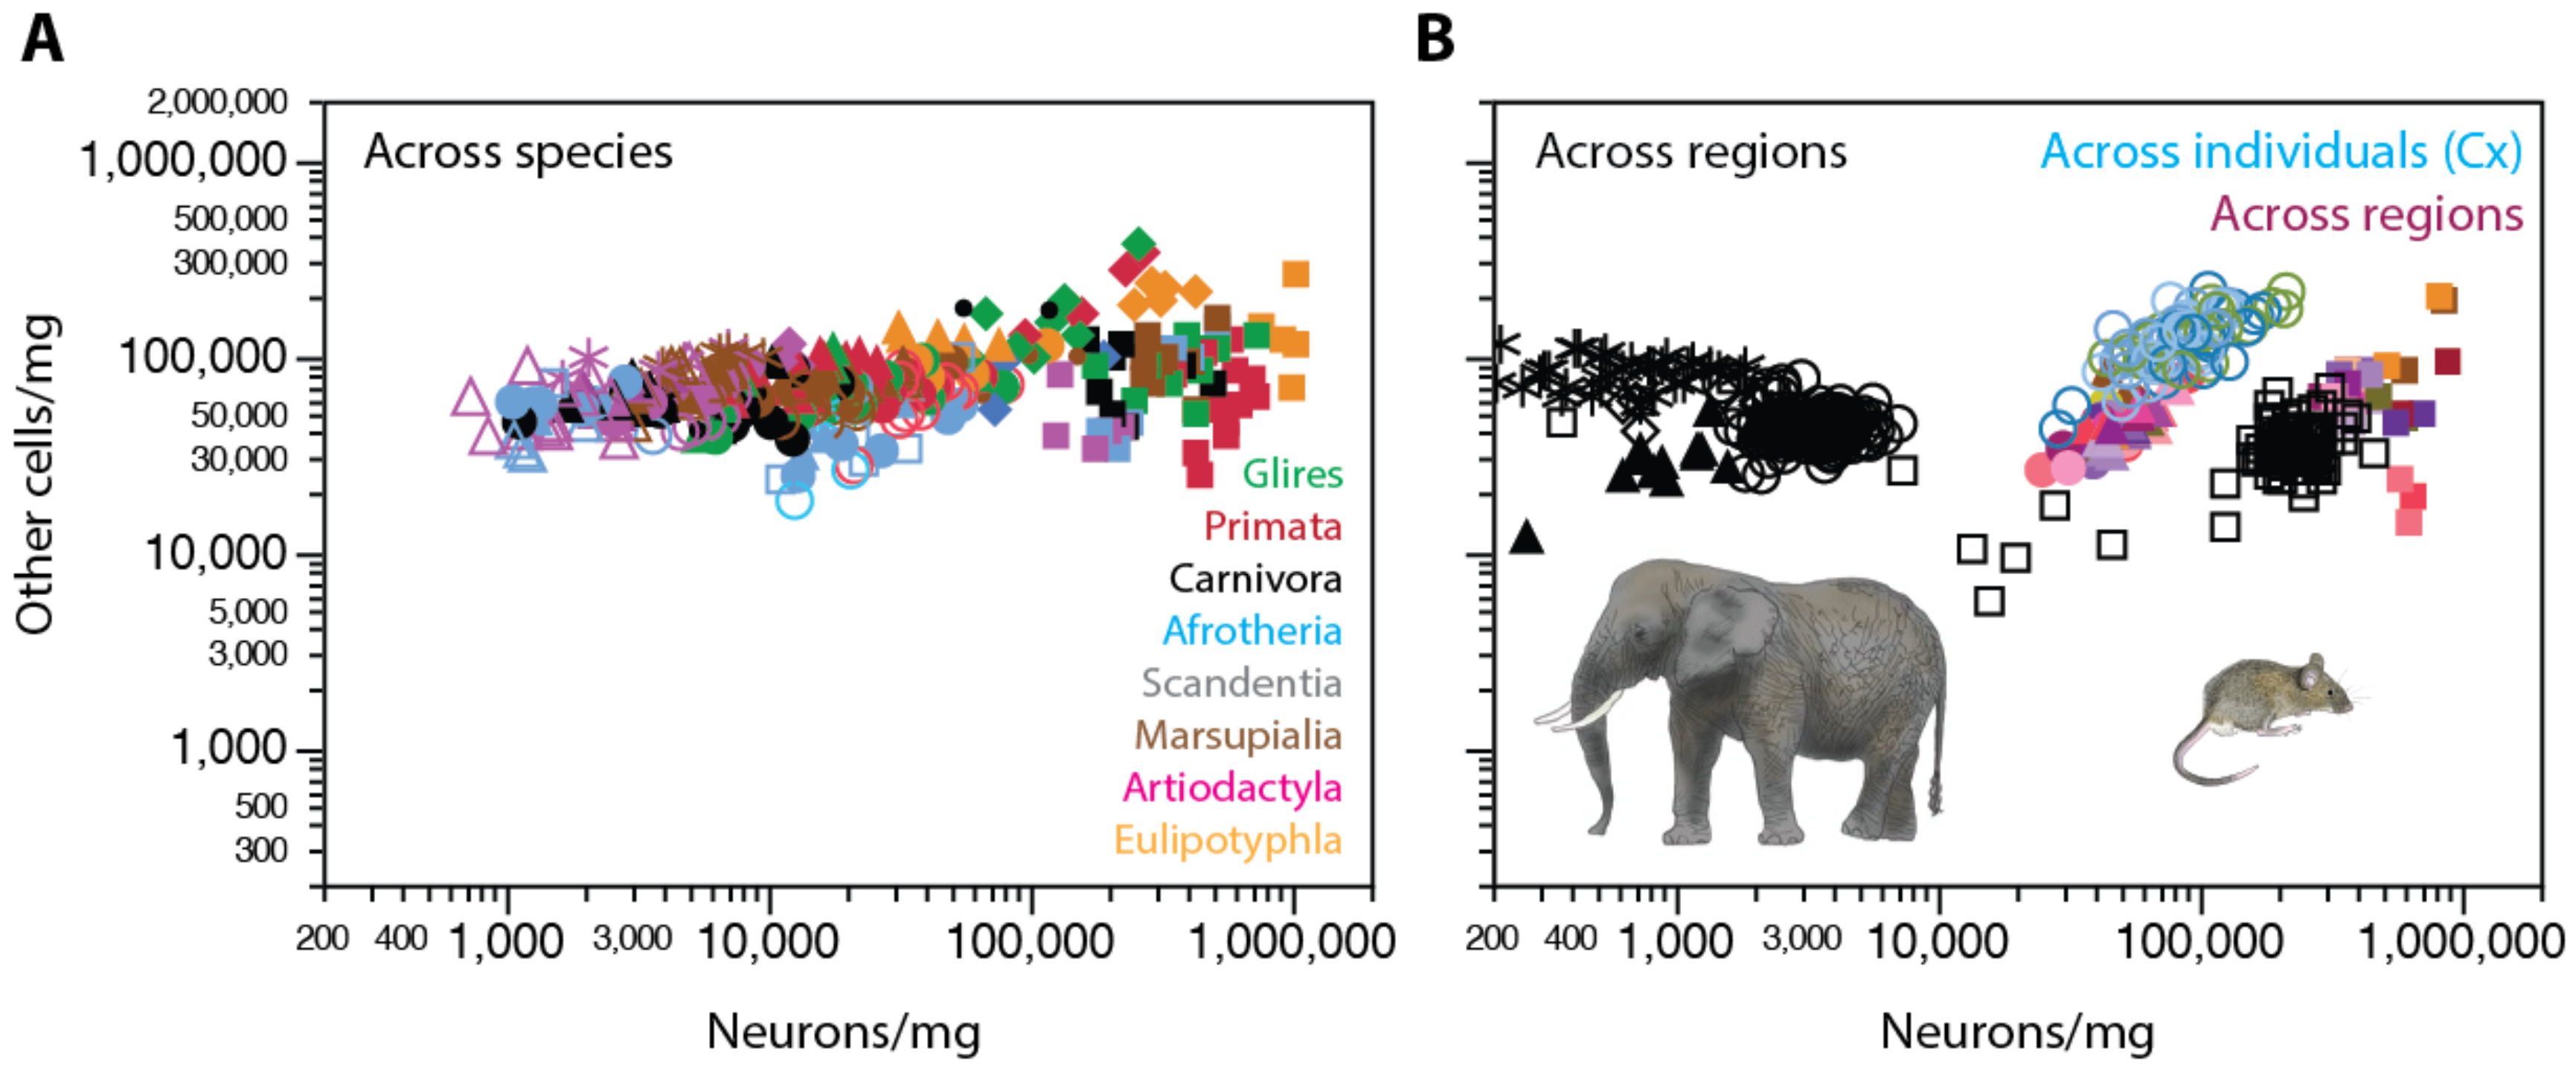
Figure 7.
Density of non-neuronal cells varies little across sites in the gray matter of the human cerebral cortex. Same as in Figure 6, right, with the addition of data for the gray matter of the human cerebral cortex [77], for which each point represents the neuronal and other cell (non-neuronal) densities in one 2 mm thick coronal section. In each section, the gray matter of the cerebral cortex was separated into prefrontal (red, anterior to callosum), frontal (orange, anterior to central sulcus), parietal (blue, posterior to central sulcus), occipital (green, posterior 1/3), V1 (dark green, within occipital region), temporal (pink), insular (magenta), and hippocampal (lavender).

Figure 8.
Average density of non-neuronal cells in the gray and white matter of the cerebral cortex varies little across mammalian species. Each point represents the total number and average density of other cells (non-neuronal) in the gray matter (unfilled circles) or in the white matter (asterisks) of the cerebral cortex of 1 of 27 mammalian species belonging to six different clades, as indicated by the colors. Data from [59,60,62,63].

Figure 9.
Estimated average mass of neuronal and non-neuronal cells and neuronal fraction in brain structures across mammalian species. (A) Average mass of individual neurons in each brain structure, estimated as 0.649 × (N/ng)−1.004 according to [73], plotted as a function of number of neurons in the structure for each species; (B) average mass of individual non-neuronal (other) cells in each brain structure, estimated as 1.648 × (O/ng)−1.370 according to [73], plotted as a function of number of neurons in the structure for each species, and shown in same scale as in (A); (C,D) fraction of structure mass composed by neuronal cells, estimated as 0.265 × (O/ng)−1.356 according to [73], plotted as a function of the number of neurons in the structure (C) or of the estimated average mass of individual non-neuronal cells in the same structure (D). Each point represents values in one structure (cerebral cortex, cerebellum, rest of brain in one of 60 mammalian species belonging to eight different clades, as indicated. Filled circles, whole cerebral cortex (including subcortical white matter and hippocampus); filled triangles, rest of brain; filled squares, cerebellum.

Figure 10.
Possible scenarios of variation in densities of glial cell subtypes across mammalian species. Assuming that vasculature-associated cells are a small percentage of non-neuronal cells [78], non-neuronal cell density variation should reflect, almost exclusively, variations in densities of each glial cell subtype and their relative abundance. Each graph shown here represents a possible relationship between cellular density and number of non-neuronal cells in the tissue. Each glial cell type is represented by a color (oligodendrocytes in red, astrocytes in purple, and microglia in green). The invariant density of non-neuronal and glial cells as a whole, as found in previous studies across brain structures and mammalian species, is represented by the black dotted line. Microglial cell density has been found to be constant and low regardless of the number of microglial cells in the structure, across mammalian brain structures and species [39], which implies that the average microglial size tends to stay stable, such that microglial density remains constant, as shown in all three scenarios. Scenario 1 (A,B): Densities of all three glial cell subtypes remain invariant in relation to their number of cells; the predominant glial cell type is either oligodendrocytes (A) or astrocytes (B). In both scenarios, average cell sizes of each glial cell type remain constant across brain structures and species; the total, constant, density of glial cells as a whole is the simple sum of the densities of each glial cell subtype. Scenario 2 (C,D): One glial cell subtype maintains a constant, and high, density (whether oligodendrocytes, C, or astrocytes, D), while the other subtype varies in density across brain structures and species, decreasing or increasing systematically with the number of those cells. Decreasing cell densities reflect increasing cell sizes. In these scenarios, the average glial cell density remains constant, as the variation in density of either astrocytes or oligodendrocytes is masked by the high density of the most numerous glial population. Scenario 3 (E,F): Densities of both astrocytes and oligodendrocytes vary as a result of the varying average size of these cells, but they compensate for each other in a way that their added densities remain invariant across structures and species.

Figure 11.
Scaling of the ratio of other (non-neuronal) cells per neuron across species and brain sites. Ratio of non-neuronal cells per neuron varies systematically, not with structure mass (A), but with neuronal density across structures and species (B), as well as across sites in individual brains (C). Each data point represents one brain structure and species, as in Figure 9 (top, left) or one brain region within the same individual (right: mouse, gray; elephant, black; human cortex, colors), as in Figure 6 and Figure 7. Data from [53,54,55,56,57,59,60,61,62,63,64,69,77].

Figure 12.
Schematics of the time sequence of generation of different neuronal and non-neuronal cell types in vertebrate brains. Neurons and macroglia (astrocytes and oligodendrocytes) have an ectodermal origin. A single stem-cell gives rise to neural stem-cells that, in turn, depending on their location in the neural tube (dorsal or ventral), give rise to pyramidal neurons and astrocytes or interneurons and oligodendrocytes, respectively. Pyramidal neurons can be generated directly from radial glial cells or from a basal progenitor early during development. Basal progenitors can divide and produce astrocytes later during development. Oligodendrocytes and interneurons are produced from ventral neural stem cells that give rise directly to interneurons early during development and later to oligodendrocytes. Microglia have a mesodermal origin and are produced in several waves throughout development. Embryonic microglia originate from a myeloid stem cell that differentiates into yolk sac macrophage and microglial precursors. This myeloid stem cell also differentiates into hematopoietic stem cells in the fetal liver and later into microglial precursors that originate microglial cells. After birth, the third wave of microglia production has an origin in the bone marrow from monocytes or other progenitors. SC: Stem cell; NSC: Neural stem cells; RG: Radial glia; BP: Basal progenitor; YSMP: Yolk sac macrophage precursor; MP: Microglial precursor; HSC: Hematopoietic stem cell; BMM/P: Bone marrow monocyte/progenitor. Data from [82,119,120,121,122,123,124].

© 2018 by the authors. Licensee MDPI, Basel, Switzerland. This article is an open access article distributed under the terms and conditions of the Creative Commons Attribution (CC BY) license (http://creativecommons.org/licenses/by/4.0/).
Share and Cite
MDPI and ACS Style
Herculano-Houzel, S.; Dos Santos, S.E. You Do Not Mess with the Glia. Neuroglia 2018, 1, 193-219. https://doi.org/10.3390/neuroglia1010014
AMA Style
Herculano-Houzel S, Dos Santos SE. You Do Not Mess with the Glia. Neuroglia. 2018; 1(1):193-219. https://doi.org/10.3390/neuroglia1010014
Chicago/Turabian StyleHerculano-Houzel, Suzana, and Sandra E. Dos Santos. 2018. "You Do Not Mess with the Glia" Neuroglia 1, no. 1: 193-219. https://doi.org/10.3390/neuroglia1010014