Article

Water Infiltration in Different Soil Covers and Management in the Cerrado–Amazon Ecotone, Brazil

by
Marco Aurélio Barbosa Alves
1,
Daniela Roberta Borella
2,3,
Rhavel Salviano Dias Paulista
2,3,
Frederico Terra de Almeida
3,4,
Adilson Pacheco de Souza
2,3,4 and
Daniel Fonseca de Carvalho
1,5,*
1
Postgraduate Program in Agronomy-Soil Sciences, Federal Rural University of Rio de Janeiro, Seropédica 23897-045, Rio de Janeiro, Brazil
2
Postgraduate Program in Environmental Physics, Federal University of Mato Grosso, Cuiabá 78060-900, Mato Grosso, Brazil
3
Postgraduate Program in Environmental Sciences, Federal University of Mato Grosso, Sinop 78550-728, Mato Grosso, Brazil
4
Institute of Agrarian and Environmental Sciences, Federal University of Mato Grosso, Sinop 78550-728, Mato Grosso, Brazil
5
Department of Engineering, Institute of Technology, Federal Rural University of Rio de Janeiro, Seropédica 23897-045, Rio de Janeiro, Brazil
*
Author to whom correspondence should be addressed.
Soil Syst. 2024, 8(1), 31; https://doi.org/10.3390/soilsystems8010031
Submission received: 29 December 2023 / Revised: 11 February 2024 / Accepted: 5 March 2024 / Published: 8 March 2024
(This article belongs to the Special Issue Land Use and Management on Soil Properties and Processes)

Abstract

:
Soil water infiltration is an important component of the hydrological cycle, and it is best evaluated when the raindrop impacts the ground surface. For this reason, it is affected by changes in land use and land cover and by the characteristics and physical–hydric properties of the soil. This study aimed to evaluate soil water infiltration in areas occupied by annual crops (soybean and corn) and pastures in two watersheds of the Teles Pires River-MT, using simulated rainfall, physical models, and principal component analysis. Infiltration rates were evaluated based on simulated rainfall with an average intensity of 75 mm h−1, with four repetitions per region (upper, middle, and lower) of the hydrographic sub-basins of the Caiabi and Renato rivers, and soil use with cover, without cover, and disturbed. Soil tillage provided higher water infiltration rates into the soil, especially in pasture areas in the two hydrographic sub-basins. There were significant adjustments to the mathematical models based on the infiltration rate data for all land use and land cover conditions. The soil attributes that most interfered with the infiltration rate were microporosity, bulk density, and total porosity in the crop areas of the middle Caiabi and microporosity, clay content, total porosity, and silt content in the areas farming at the source of the Renato River. The Horton and Philip models presented the best adjustments in the hydrographic sub-basins of the Caiabi and Renato Rivers, which are recommended for estimating the water infiltration rate into the soil in different uses, coverages, and regions.

1. Introduction

A large part of Brazilian territory is influenced by factors that can lead to soil degradation, such as different forms of contamination, desertification, and erosion, which are mainly associated with changes in soil cover and the climatic extremes of precipitation. Land use and cover changes also affect hydrological processes, especially those related to water infiltration and surface runoff [1].
Water infiltration into soil is related to the type of soil, physical properties (texture, porosity, hydraulic conductivity, and density); preparation, the management of the land, the type of vegetation cover, surface roughness, coverings with remaining cultural residues, and the water content on the surface layer before rain [2,3]. Soil infiltration capacity offers useful information for water cycling in agricultural systems because it affects both yields (through water availability in the soil) and other ecosystem outcomes, such as pollution and flooding due to surface runoff [4,5,6].
Native or covered vegetation protects the soil, favoring infiltration as, in addition to cushioning the impact of raindrops, it favors the creation of preferential paths that originate with root development [7]. The water content also influences infiltration in the soil profile, precipitation time, erosivity and rainfall patterns, soil structure, use and cover [8], organic matter content [9] and slope, which is considered one of the most important parameters for irrigation planning in agricultural production areas [10]. Thus, sustainable management must use techniques that favor water infiltration into the soil, minimizing surface runoff and soil and water losses [4,6].
Water infiltration into the soil can be quantified using different methods, although the double-ring method is widely used. Sprinkler infiltrometers are more suitable for studies related to soil use and management, as by simulating natural rain, they provide a better representation of the impact of drops and the disaggregation of surface soil particles [11]. Among the different types/models of sprinkler infiltrometers, the InfiAsper model [12] is one of the most used types of equipment in Brazil for simulating rainfall and has been used in erosion, infiltration, and runoff studies [3,13,14,15].
Studies that have modeled infiltration rates regarding different land uses and covers in the Amazon–Cerrado ecotone (a transition region between two biomes) are scarce. In this sense, this research can significantly contribute to the knowledge of the effects of changes in land use and cover on water infiltration into the soil, such as pasture management and conservation, direct planting system and minimum disturbance in soil preparation [7]. Furthermore, using multivariate statistical analyses that associate the physical attributes of the soil with infiltration can help in observing which factors have the greatest influence on water infiltration into the soil [16]. Among the different statistical techniques used in studies linked to soils is principal component analysis—PCA [17,18,19,20,21,22,23]. Together with estimates of the infiltration rate obtained by mathematical models, these analyses can contribute to the implementation of soil and water management and conservation techniques, which promote reductions in soil and water losses in crops and pastures in northern Mato Grosso, a region with a predominance of Amazon Rainforest and great agricultural expansion.
The objective of this study was to evaluate water infiltration into the soil in areas occupied by annual crops and pastures in two sub-basins of the Teles Pires River-MT, using simulated rainfall, physical models, and analysis of principal components.

2. Materials and Methods
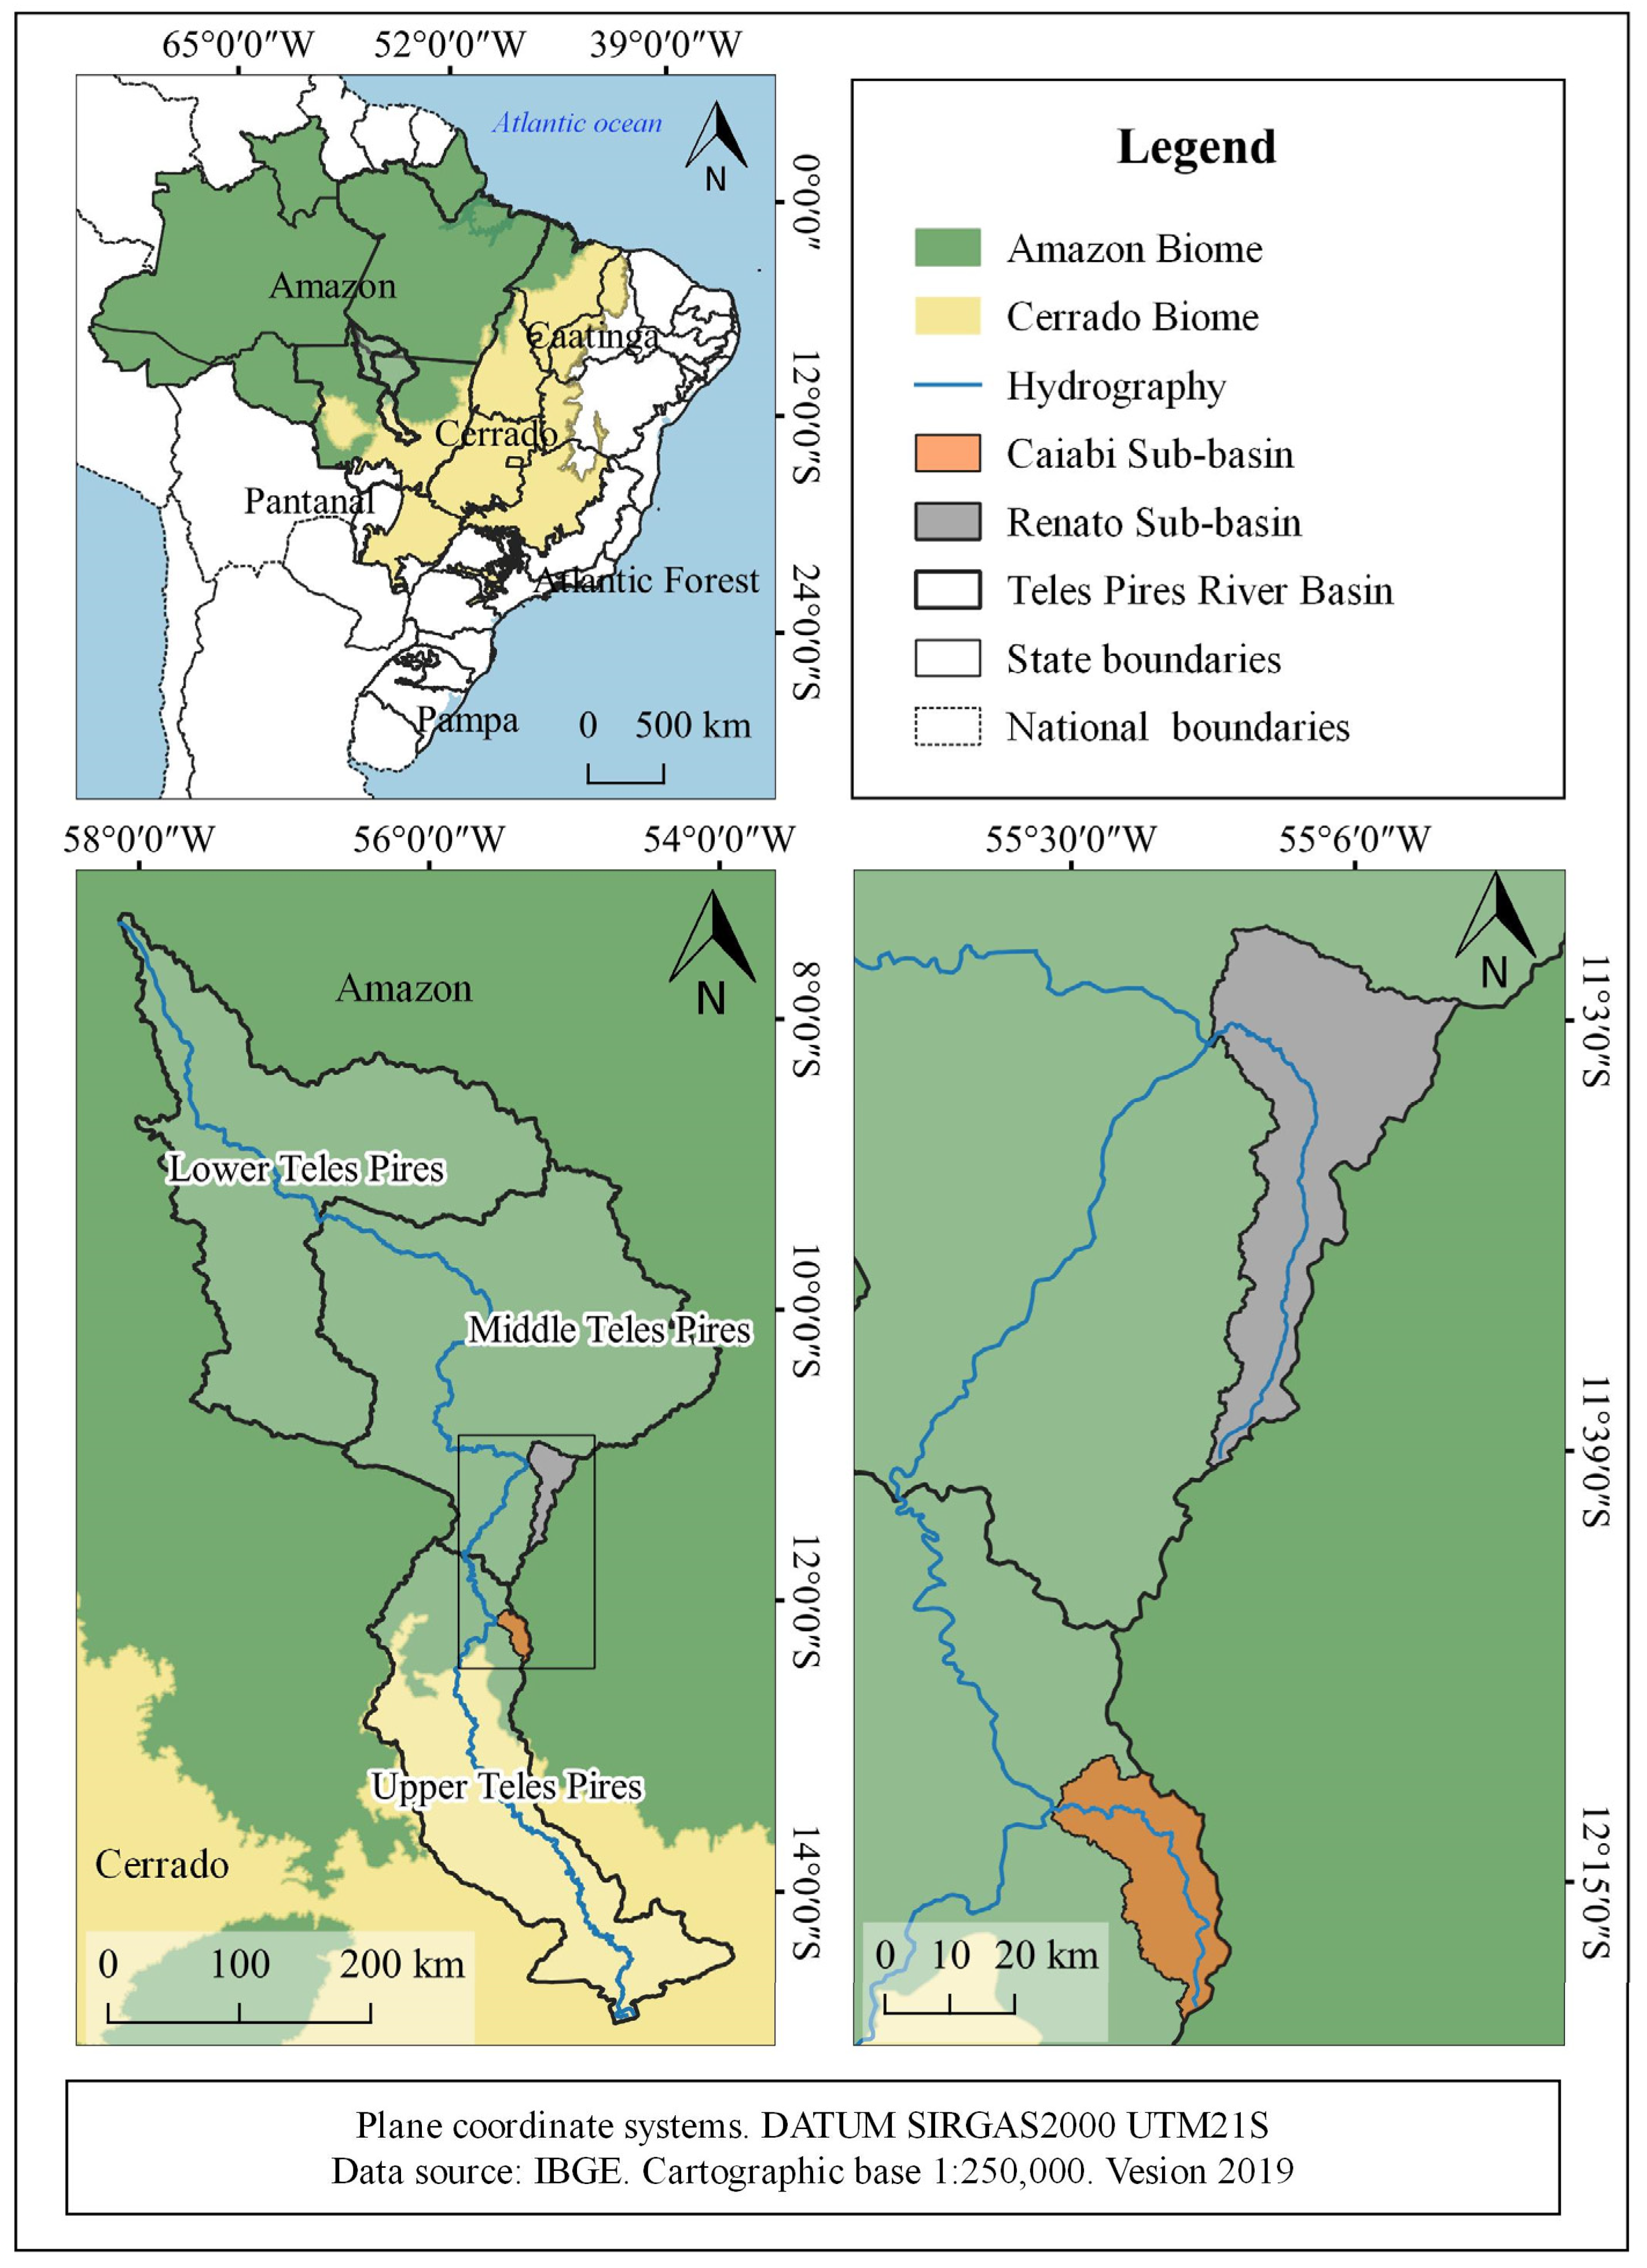
2.1. Study Area

This study was conducted in two regions of the Teles Pires River basin located north of the state of Mato Grosso, Brazil. The Caiabi River sub-basin (500 km2) is located in the upper Teles Pires region, while the Renato River sub-basin (1450 km2) is located in the middle Teles Pires and is part of the Amazon biome (Figure 1).
The two river sub-basins have different geomorphological, geological, and pedological characteristics, with the predominance of the soil Latossolo Vermelho–Amarelo Distrófico típico, according to the Brazilian Soil Classification System [24], which is equivalent to a Dystric Ferralsol in the WRB system (IUSS Working Group WRB, 2022) [25]. The Caiabi River sub-basin is in the Cerrado-Amazonia ecotone, with a predominance of monocultures comprising soy and corn, in succession with emerging cotton production, while in the Renato River sub-basin, native forests (such as the Amazon Forest) predominate with pasture expansion, followed by soybean production and succession with corn [15,23].
The region’s climate is type Aw according to the Köppen classification [26]. The average annual temperature is 25 °C, with a minimum below 16 °C and a maximum above 34 °C. Average annual precipitation varies at around 1950 mm.

2.2. Treatments and Experimental Design

Following the regional agricultural calendar, soil water infiltration tests were carried out in pasture and crop areas in the upper, middle, and lower regions of the two sub-basins [15]. These land uses were chosen because of the widespread growth of agriculture and livestock in the Teles Pires River basin, concomitantly with the pressure on local biodiversity. Given the high number of field tests, the areas occupied by crops in the Caiabi sub-basin showed soybean (Glycine max L.) cultivation at the V7 vegetative stage (seventh trifoliate leaves), with and without corn straw (conventional planting and direct planting systems). In the Renato River sub-basin, the crop areas were occupied by corn (Zea mays L.) at vegetative stage V4 (fourth developed leaf). The pasture areas in the two sub-basins presented similar conditions, occupied by Brachiaria ruziziensis with an average height of 50 cm. Simulated rainfalls in the two sub-basins were applied considering the following treatments: coverage soil (with vegetation—CS), without coverage soil (removal of plant biomass—crop or pasture—WCS), and soil with disturbance at 0.10 m in the layer (SD—simulating shallow cultivation situations). This layer was adopted depending on the size of the plot, so it would not affect the collection of surface runoff. The simulated rains were carried out consecutively at the same experimental point considering the sequence above, according to [15]. The soil was turned over manually after the end of the tests on the plots without cover.
The rains were applied with the InfiAsper simulator [12], and the surface runoff was evaluated in a 0.70 m² (1.0 × 0.7 m) collecting plot installed in areas with medium slopes of approximately 0.05 m m−1. Based on the IDF relations of the four rainfall stations closest to the study area [27], the simulator was adjusted to apply rainfall with an overage precipitation intensity (PI) of 75 mm h−1, considering events with a 10-year return period and a 42-minute average duration.
After installing the runoff collection plot and starting the tests, the ground surface was moistened (pre-wetting) to standardize soil moisture conditions [3,15]. This procedure was carried out with a watering can that kept the characteristics of the surface layer of the soil the same, through which water was applied until the runoff was about to begin. This activity was routine in all experiment plots and was carried out before the simulated rain. After the flow began, collections were carried out at 1-minute intervals, with the volume of water quantified in graduated cylinders. Considering the area of the collection plot (0.70 m2), the volume data were transformed into surface runoff depth, making it possible to determine the infiltrated depth in the same interval based on the difference in the applied rain depth.
In each treatment, the plant mass was characterized by removing the covering close to the ground and subsequently drying in an oven at 65 °C for 72 h until vegetal material reached a constant dry mass of less than 5% moisture. Dry mass was quantified on an analytical thousandth scale [15]. Close to each point of determining soil water infiltration rates, a physical–water characterization of the soil was carried out by opening mini-trenches (0.4 × 0.4 m) to collect deformed and undeformed soil samples in the 0–0.10 m layer. Granulometry (sand, silt, and clay), bulk density, particle density, macro- and microporosity, and hydraulic conductivity were evaluated. Particle size was determined using the pipette method using 1 M of sodium hydroxide (NaOH) solution with mechanical stirring for 16 h based on the principle of Stokes’ law, which deals with the particle sedimentation period. The bulk density was obtained with the cylinder method using undisturbed samples. In the laboratory, samples were dried in an oven at 105 °C and weighed 48 h later [15,28]. Particle density was determined by the volumetric flask method. Total porosity was obtained through the relationship between apparent density and particle density. Macroporosity was determined by a tension table with a tension of 10 kilopascals (kPa), and microporosity was determined by taking the difference between the total porosity and macroporosity.

2.3. Soil Water Infiltration Models

Using the DataFit software (version 9.0.59) and nonlinear regression analysis in the Gauss–Newton method, the infiltration rate values were adjusted to the Kostiakov–Lewis (K-L) [29,30], Horton [31,32], and Philip [33,34] models, represented by Equations (1), (2), and (3), respectively:
Ri = Rif + αkTα−1
Ri = Rif + (Rio − Rif) e−βT
Ri = b + 1/2 kT−0.5
where Ri = estimated instant infiltration rate (mm h−1); Rio = initial infiltration rate (mm h−1); Rif = final infiltration rate (mm h−1); and T = infiltration time (min). Additionally, α, β, b, and k are the statistical parameters of the models.
The initial and final infiltration rates were calculated by averaging the first three and last three values obtained in each test. The infiltration models were evaluated using the coefficient of determination (R2), root mean square error (RMSE), and Nash–Sutcliffe efficiency (NSE). NSE varies between −∞ and 1.0 (inclusive), with NSE = 1 being the ideal value, while RMSE values equal to 0 indicate a perfect fit [35,36].

2.4. Statistical Analyses

The experimental arrangement of assessment points for water infiltration into the soil in both sub-basins was 3 x 3, considering 3 basin regions (source, middle, and mouth) and 3 soil coverage/management conditions (covered soil, soil without cover, and soil without cover + turning) with 4 repetitions, totaling 144 tests. The initial and final infiltration rate data were subjected to the Kruskal–Wallis test at 5% probability using Statistica version 14.0. Using the same program, principal component analysis (PCA) [16] was carried out to evaluate the influence of physical attributes and soil cover/management on stable infiltration rates (Rif) in the different regions and sub-basins, considering treatments with and without coverage. The PCA did not evaluate soil disturbance treatments because this soil management condition alters the values of the attributes presented in Table 1.

3. Results

3.1. Physical Characterization of the Soil

A physical characterization of the soil and dry mass of crops and pastures in the sub-basins of the Caiabi and Renato Rivers is presented in Table 1. The region at the source of the sub-basin of the Caiabi River has higher clay content in the agricultural and pasture areas, with a predominance of sand in the middle and mouth.
Table 1. Physical–water characterization of soil and cover dry mass in different regions of the Caiabi and Renato River sub-basins in the 0–10 cm layer.
Sub-Basin
Region
SandSiltClayMicroMacroTPoPdBdK0Pdm
.............%....................m3 m−3................ g cm−3......cm h−1Mg ha−1
Caiabi River—Cultivated (Soybean)
Upper42.49 B29.61 A27.9 A0.28 A0.08 A0.36 A2.14 B1.02 B1.21 A11.91 A
Middle76.56 A5.64 B17.8 B0.27 A0.11 A0.38 A2.54 A1.50 A1.12 A10.20 A
Lower78.5 A5.9 B15.6 B0.35 A0.08 A0.43 A2.52 A1.50 A1.28 A10.99 A
Caiabi River—Pasture
Upper49.24 B14.66 A36.1 A0.27 A0.10 A0.38 A2.44 A1.41 A0.33 A8.24 A
Middle49.21 B16.19 A34.6 A0.35 A0.02 A0.37 A2.33 B1.58 A0.67 A8.90 A
Lower84.37 A4.63 B11.0 B0.29 A0.11 A0.39 A2.61 A1.58 A1.70 A7.26 A
Renato River—Cultivated (Corn)
Upper75.18 B8.62 A16.2 A0.43 A0.09 A0.52 A2.71 A1.57 A0.79 A5.21 B
Middle82.87 A4.23 A12.9 B0.29 B0.08 A0.37 B2.73 A1.53 A1.22 A6.48 B
Lower73.90 B6.7 A19.4 A0.28 B0.09 A0.37 B2.65 A1.56 A0.68 A12.07 A
Renato River—Pasture
Upper80.43 A3.67 A15.9 A0.40 A0.02 A0.42 A2.78 A1.53 B1.22 A8.07 A
Middle83.16 A3.94 A12.9 A0.37 A0.06 A0.43 A2.63 A1.59 B0.57 A8.29 A
Lower81.94 A3.36 A14.7 A0.33 A0.04 A0.37 A2.69 A1.75 A0.90 A6.65 A
Micro = microporosity, Macro = macroporosity, TPo = total porosity, Pd = particle density, Bd = bulk density, K0 = hydraulic conductivity, Pdm = plant dry mass. Means followed by equal capital letters in the same column do not differ significantly (considering the sub-basin regions and the same land use) using the Kruskal–Wallis test at 5% probability.

3.2. Initial and Final Infiltration Rates

The initial (Tio) and final (Rif) infiltration rates in different coverage/management conditions and regions of the Caiabi and Renato River sub-basins showed higher infiltration values at the beginning of runoff collection than at the end (Table 2). Even with initial moistening (pre-wetting), the soil pores in the subsurface layers were empty, filled by the infiltrated depth during rain, resulting in reduced infiltration and increased surface runoff.

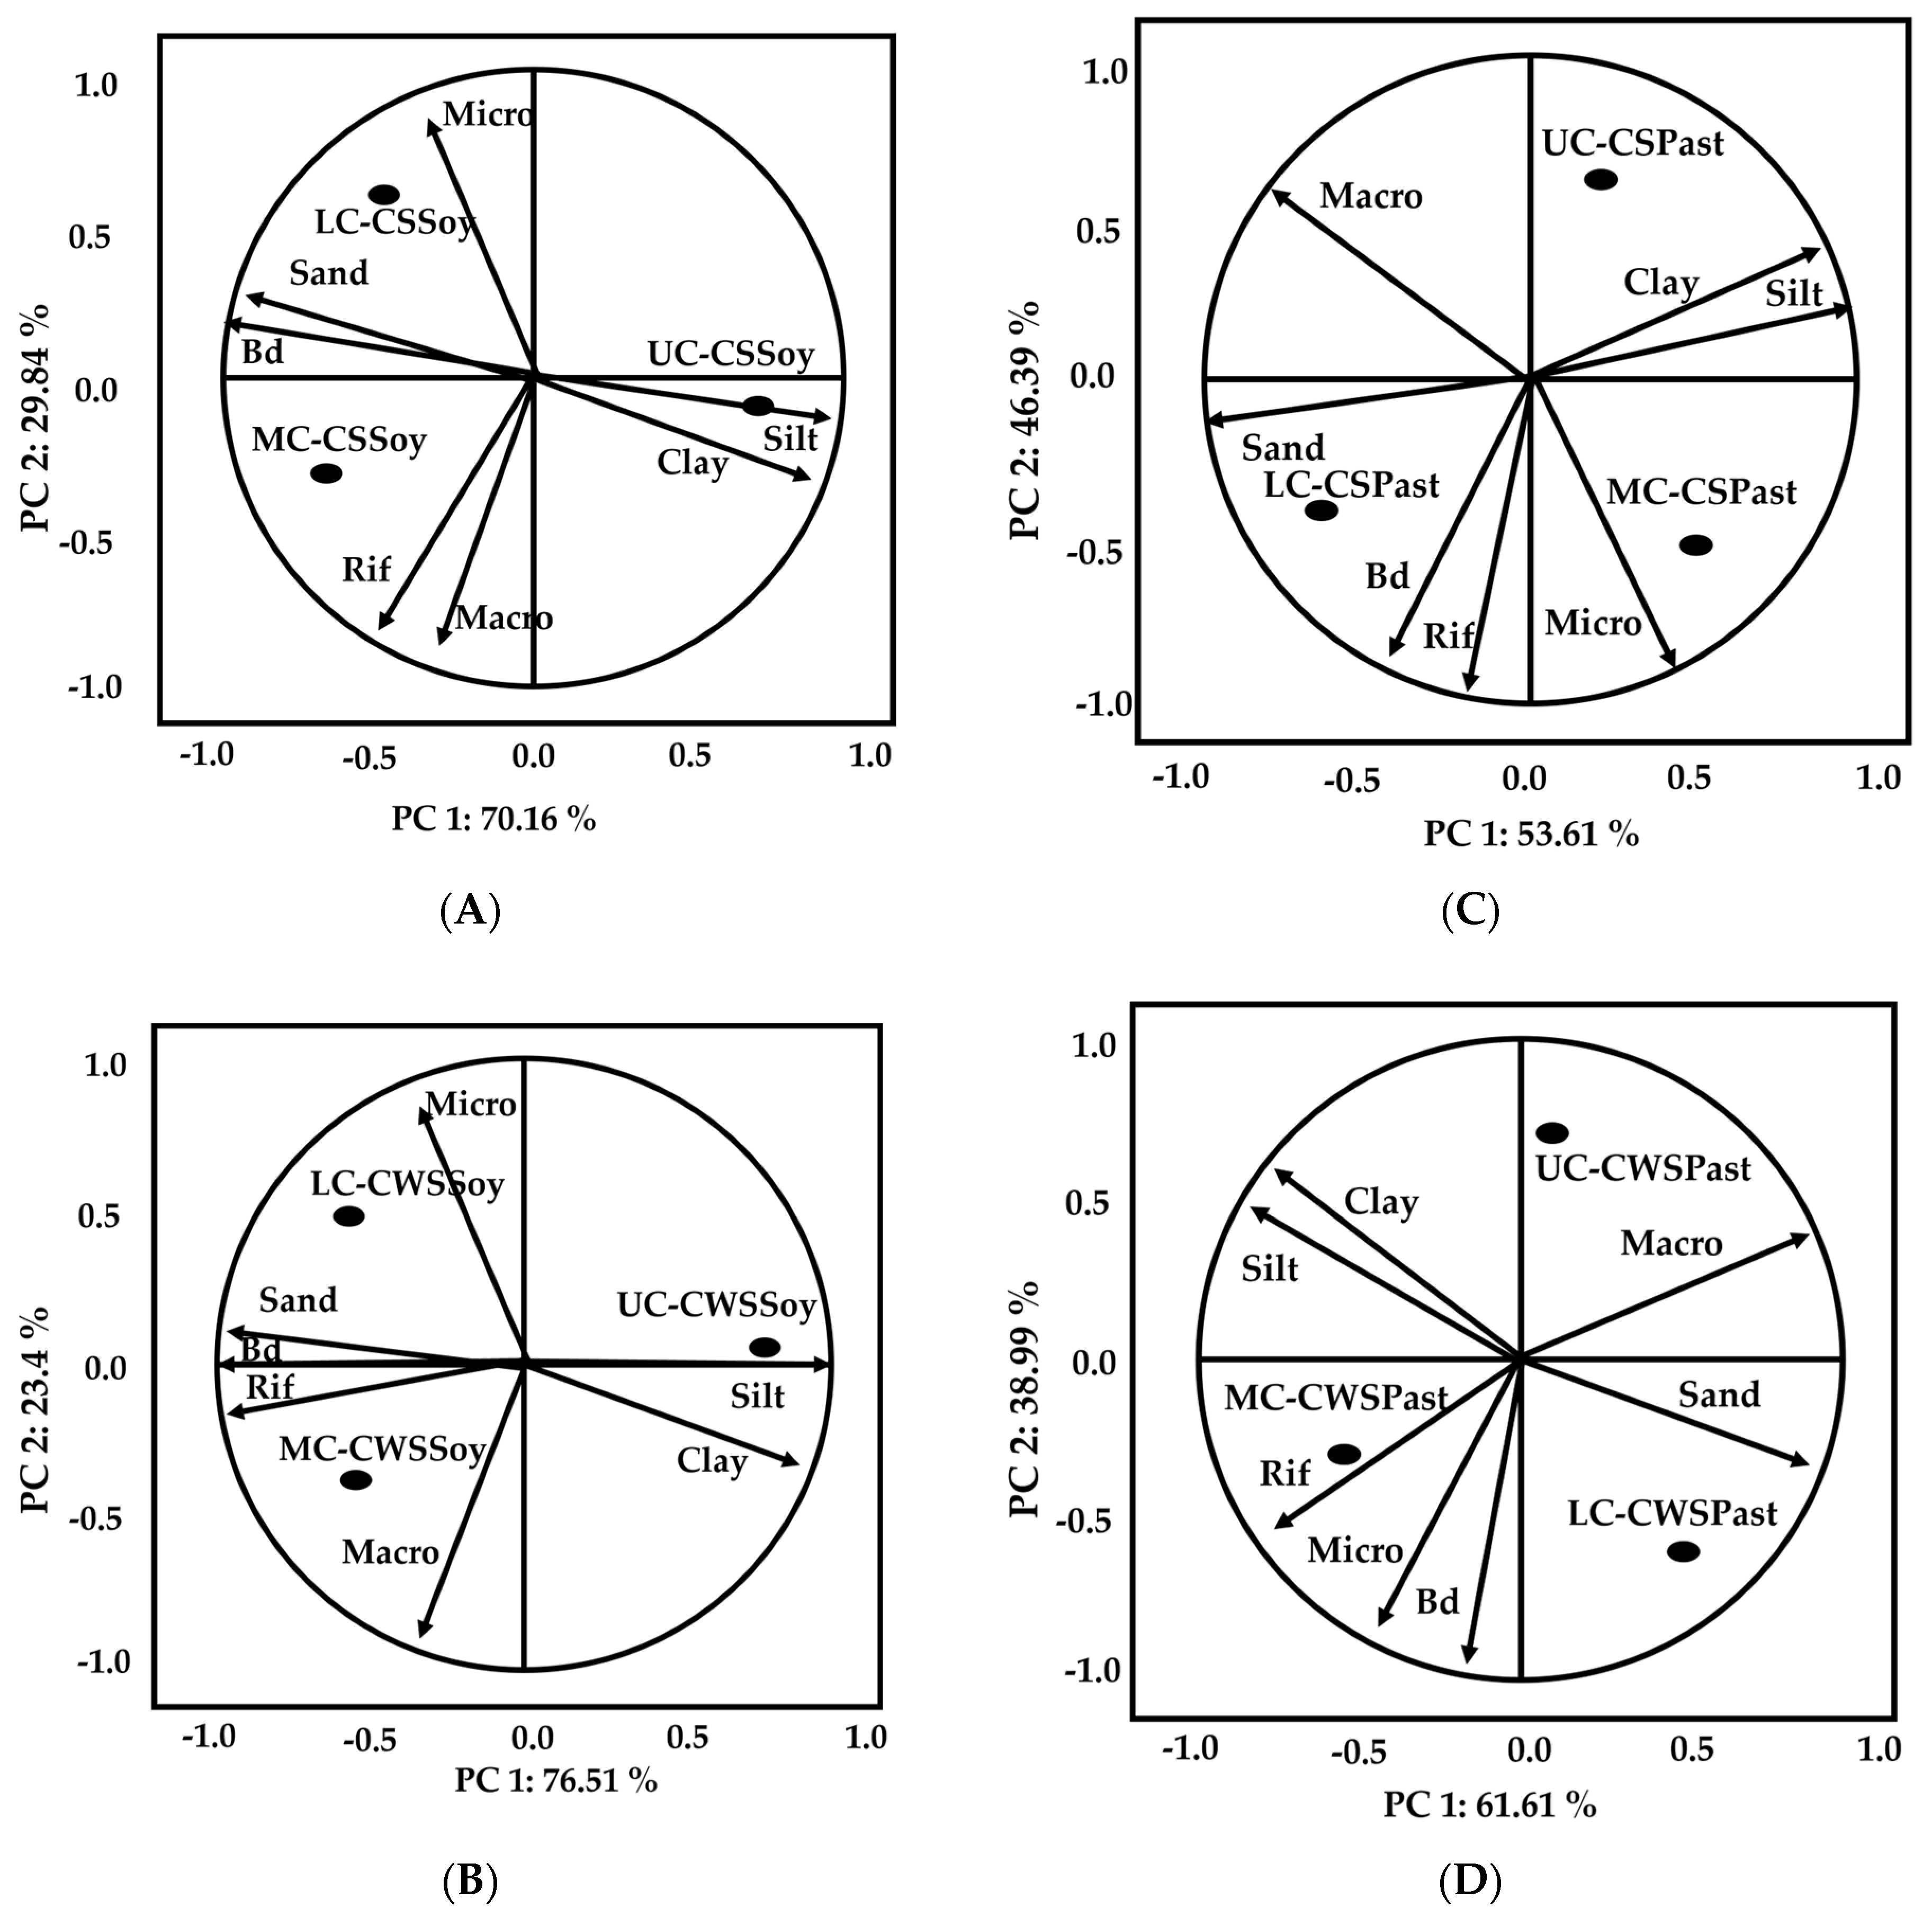
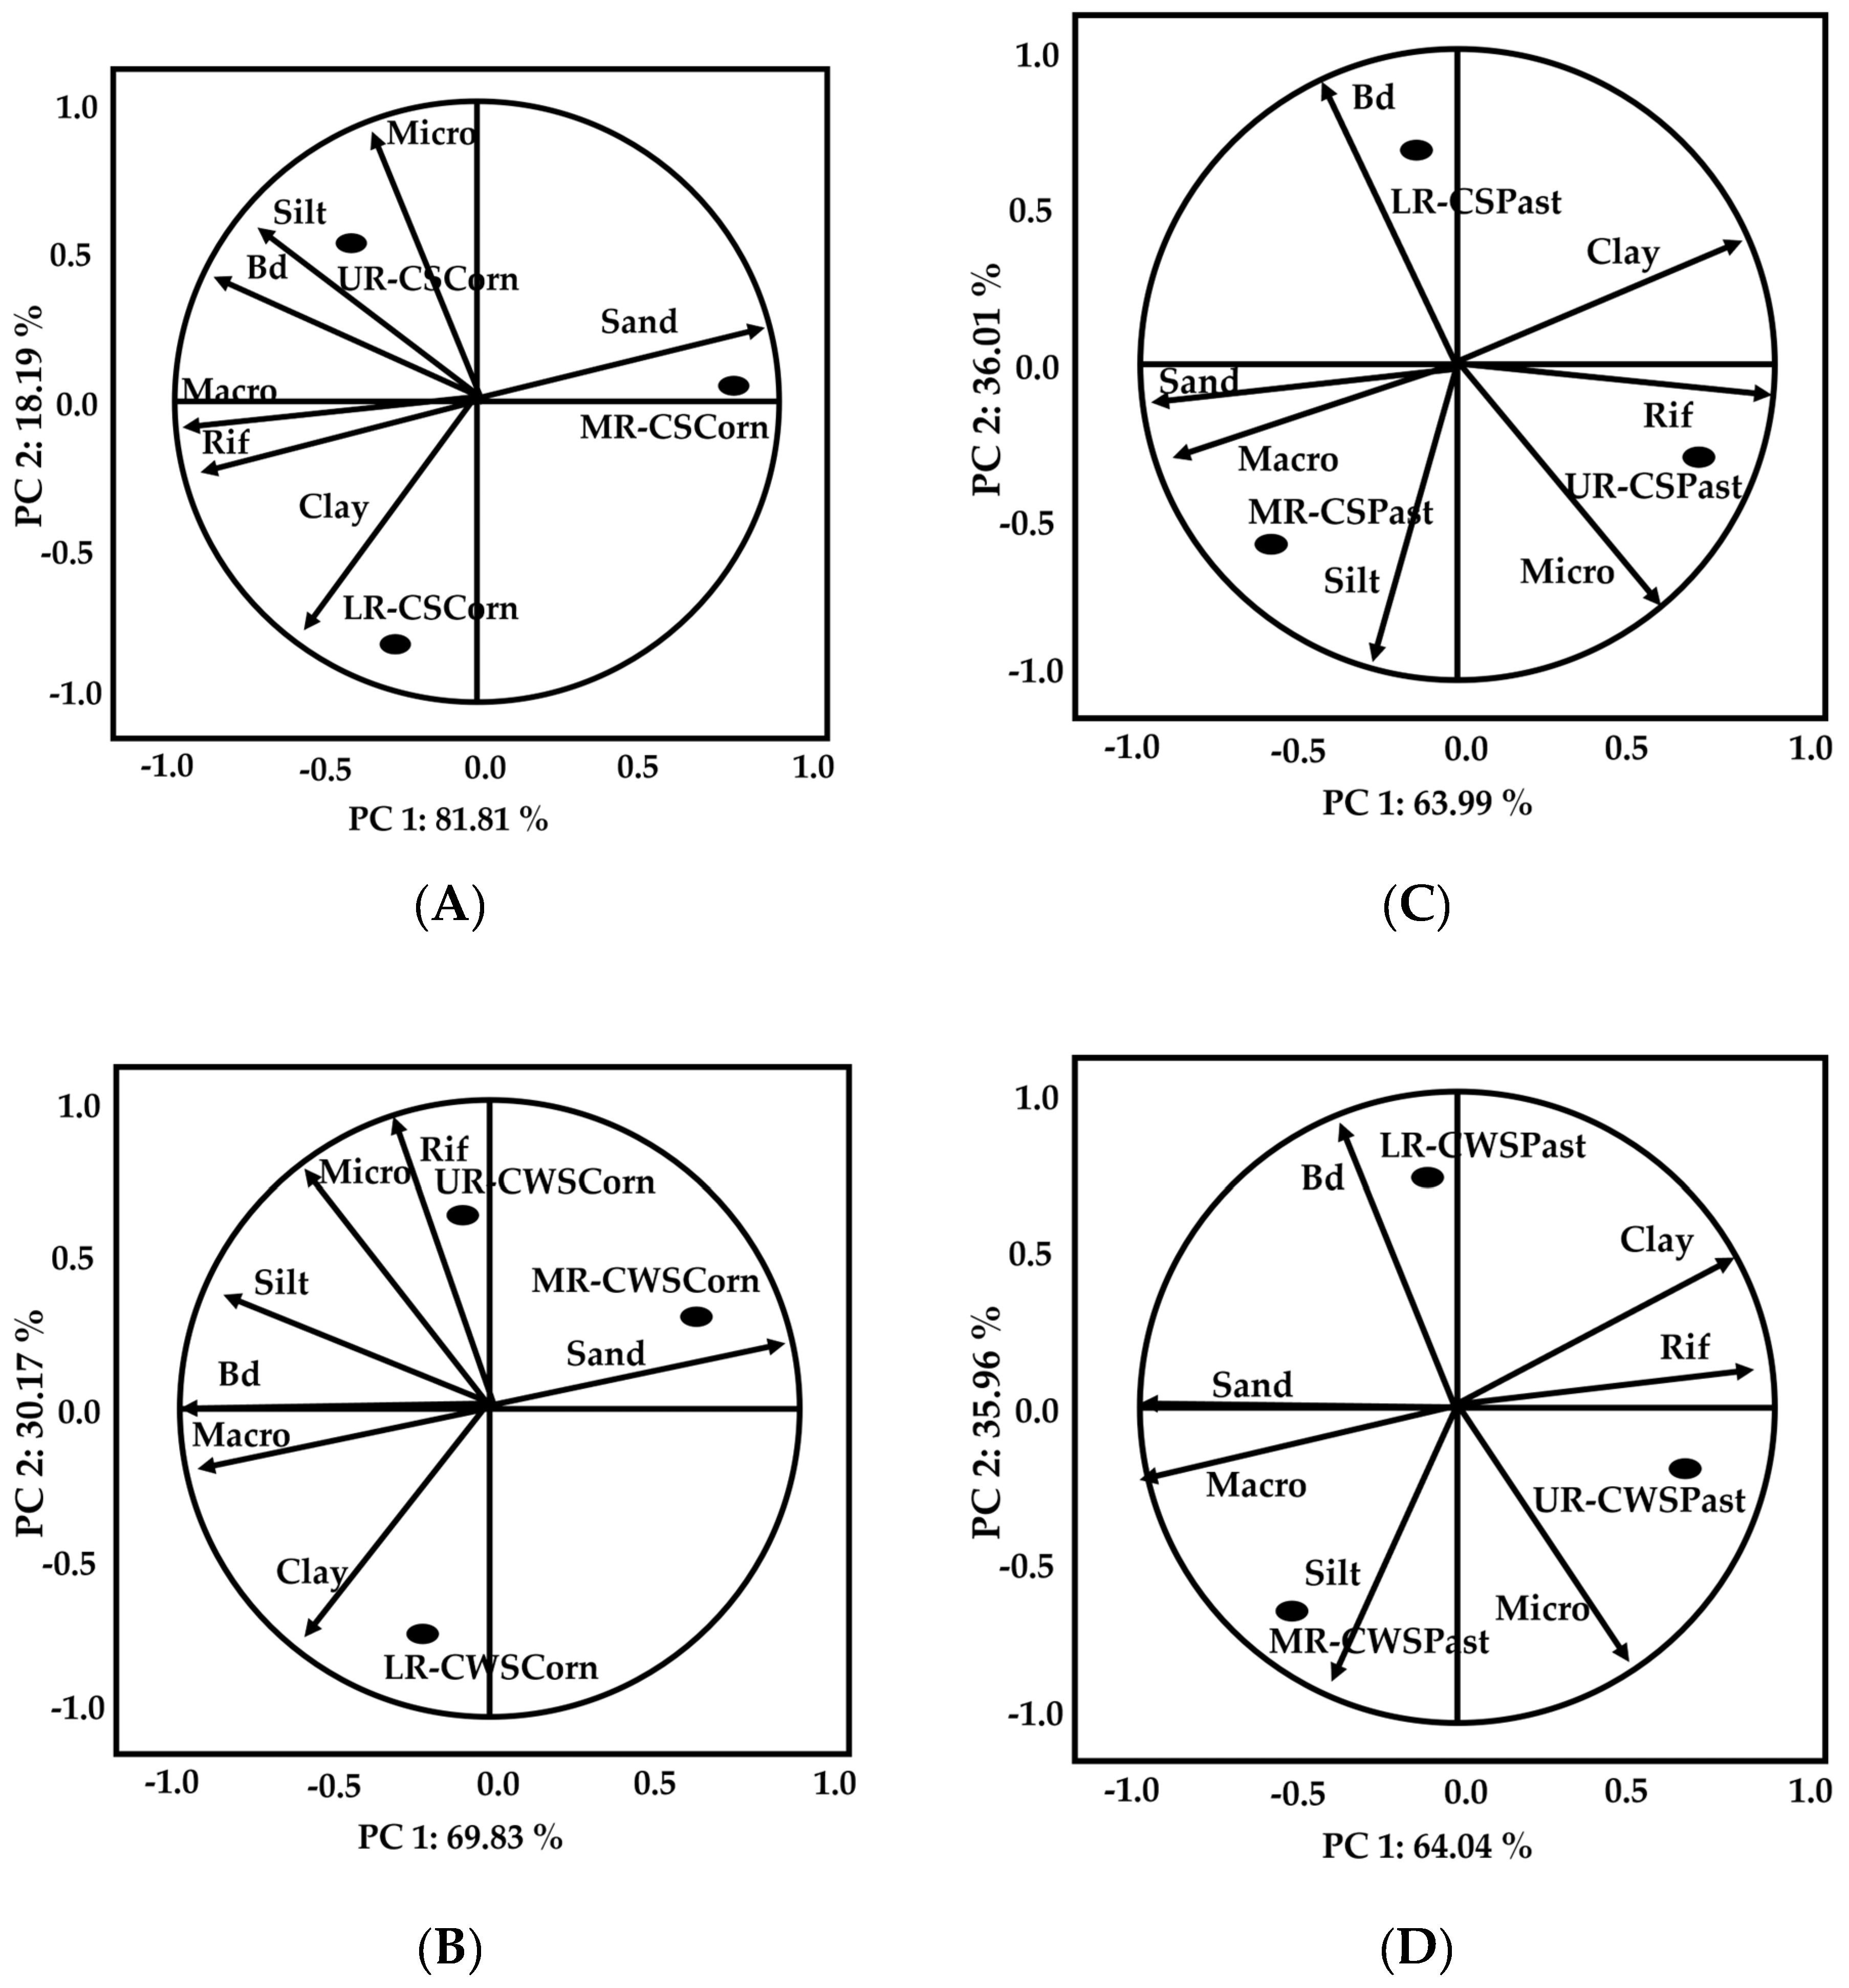
3.3. Principal Component Analysis (PCA)

Principal component analyses of the disturbed plots were not carried out in both river basins since the soil structure was altered, and the undisturbed samples would not represent the real condition of the soil at the time of precipitation. Furthermore, the PCA did not use parameters such as total porosity, particle density, and hydraulic conductivity because they were superimposed in all figures with microporosity, total sand, and the stable final infiltration rate, respectively.
Regarding the grouping of the treatments and regions of the sub-basins (Figure 2 and Figure 3), it was observed that all regions of the sub-basin of the Caiabi and Renato Rivers were in different quadrants, highlighting the difference between these regions, especially the physical attributes of the soil. This indicates that the upper, middle, and lower soil attributes are not similar in all soil attributes and thus do not belong to the same group.

3.4. Kostiakov–Lewis, Horton, and Philip Infiltration Models

Table 3 and Table 4 show the models with the best adjustments for each treatment in the Caiabi and Renato River sub-basins. The R2, RMSE, and NSE values generally indicated satisfactory model adjustments for estimating the water infiltration rate into the soil. Horton and Philip’s models were better fitted. Almeida et al. [3] evaluated the efficiency of these models in estimating infiltration rates at different levels of vegetation cover under simulated rainfall in Argisols, with results similar to those obtained in this research.

4. Discussion

The physical characterization of the soil highlights the occurrence of spatial variation in attributes in both river basins. In the Caiabi River sub-basin, bulk density and particle density values in the crop area are lower in the upper region compared with the middle and lower regions. There was a predominance of sand in the Renato River basin, with the lowest value (73.9%) at the mouth in the agricultural area. The dry mass of crops and pastures was the same, except for corn crops in the middle and eastern Renato River, both with little straw from the previous crop in the soil. Soil characteristics such as texture (total sand, clay, and silt) and particle density are related to the geology and geomorphology of the region where the soils were formed. In this sense, in the upper Teles Pires, where the studied areas of the Caiabi River sub-basin are located, the most recurrent soil classes are Red–Yellow Oxisols and Quartzarene Neosoils [24,37], formed by metasedimentary rocks belonging to the Cuiabá Group and the Raizama and Araras Formations (Alto Paraguai Group) which are fine sandstones of the Bauru Group; Cretaceous sedimentary rocks (sandstones and conglomerates) belonging to the Parecis Group; and Cenozoic detritolaterite covers [38]. On the other hand, the middle Teles Pires, where the Renato River sub-basin is located, presents a pedological characterization with Red–Yellow Oxisols, Litholic Neosols, Quartzarene Neossolos, and Plintossolos [24,37] formed by granitic and rhyolitic rocks of the Juruena Magmatic Arc, with several gold-bearing occurrences: sandstones from the Dardanelos Formation and the Benefficient Group and sandstones, siltstones, and mudstones from the Alto Tapajós Basin (Capoeiras Formation) [38]. This justifies the predominance of sand in the middle and mouth of the Caiabi River sub-basin and practically throughout the Renato River basin.
Regarding infiltration (Table 2), the smallest amplitude between the initial and final infiltration rates was observed in areas with pasture in disturbed conditions in both sub-basins. The constancy of infiltration rates in the disturbed soil is due to the rupture of the surface layer, promoting a reverse effect to that of animal trampling, which increases the levels of compaction, as indicated by the Bd values in Table 1. Animal hooves exert pressure on the soil and can compact it, limiting it to long-term pasture [39,40], and disrupting and reorganizing soil particles differently from the natural formation. According to Castro et al. [41], the upheaval of the surface layer favors infiltration by promoting an increase in surface roughness, reducing the speed and volume of surface runoff. Likewise, when studying water infiltration into the soil in conventional systems of disturbance, minimum cultivation, and direct planting systems, Santo et al. [42] concluded that soil disturbance in the conventional system has a favorable effect on reducing surface water runoff and increasing the water infiltration rate because of increased roughness and disruption of the compacted layer.
There were significant variations in Tio regarding regions in the sub-basins, which may be related to the physical characteristics of the Rif of the soils in each region despite belonging to the same class according to Alves et al. [24], who classified 18 soil profiles in the spring, middle, and mouth regions of these two aforementioned hydrographic sub-basins. This shows that, in addition to an absence of vegetation cover and disturbance, the physical properties of the soil also play a key role in water infiltration into the soil [3]. Therefore, the lower infiltration capacity in the areas with pasture cover and without cover before turning may be related to lower soil permeability, as these are areas of continuous grazing [39]. The lower infiltration rate in crop areas without cover and disturbed soil in the Renato River sub-basin may be the result of the effect of continuous scarification resulting from management since, in this case, the soil preparation, planting, spraying machinery, and harvesting may have compromised the macroporosity of these soils, which are responsible for the movement of water in the profile. When studying the effect of agricultural machinery on water infiltration into the soil, Fernandes et al. [43] concluded that the stable soil infiltration rate is reduced in places with permanent traffic from agricultural implements. On the other hand, after successive soil disturbances from management systems, the soil structure can be disrupted, which can favor greater concentrations of mineral particles in water flows, contributing to erosive processes [14]. However, the effect of disturbance on compacted soils can favor infiltration, as is the case in pasture areas in both hydrographic sub-basins. The rupture of the surface layer increased the capacity for water infiltration into the soil compared with covered and undisturbed soils since, in the pastures evaluated, there are no historical records of soil disturbance after pasture implementation; trampling; and, consequently, compression. Thus, the soil disturbance in the experimental plot broke this layer and improved the soil water infiltration conditions.
We observed that the disturbed pasture areas favored water infiltration into the soil, which does not make this an efficient management method to be adopted by all producers. Although smaller, surface runoff in these areas provides greater soil loss than covered areas with lower infiltration capacity [14]. Even though changes in the surface layer are necessary to improve the physical water attributes of the soil in pasture areas, these must be accompanied by conservation management to minimize erosion processes [6]. An alternative is to reduce soil compaction through rotational grazing, respecting the support capacity, entry, and exit of animals according to pasture height, pH correction, fertilization if necessary, and the use of cultivars with aggressive root systems to improve soil aggregation. In this sense, Dobert et al. [44] recommend adopting the rotational or rotational grazing technique combined with fallow periods as the best alternative to maintain the health of soils and pastures. In a study of infiltration rates in Cerrado soils, Sone et al. [8] concluded that sustainable pasture management is an opportunity to meet food demand and, at the same time, keep the soil in good condition. When carrying out a meta-analysis comparing infiltration rates in soils managed with conventional and alternative crops, Basche and Delonge [6] concluded that there is a general trend of potential improvement in infiltration rates with the use of alternative agricultural management practices that use soil cover with the presence of live plant roots in uncompacted soils. In soils with high levels of compaction, before encouraging infiltration, the cover plays a role in making physical, chemical, and biological improvements to the management system, whether agricultural or livestock.
Multivariate statistics from PCA explained, by more than 95%, the reliability of the relationship between soil physical attributes and stable infiltration rates (Rif) in the crop and pasture areas, in treatments with and without cover, and in all regions of the Caiabi River sub-basin. All eigenvalues of PC1 and PC2 are above one, which is considered ideal when using components to explain the groupings of soil attributes and stable water infiltration rates into the soil (Table 5). The eigenvalues in areas with soybean cover were 4.910 (PC1) and 2.080 (PC2), while in areas with pasture cover, the values were 3.70 (PC1) and 3.240 (PC2). On the other hand, the areas without soybean coverage and without pasture coverage presented eigenvalues of 5.350 and 1.640 and 4.310 and 2.680, respectively, for PC1 and PC2. Regarding variations (%) in PCs, the areas with coverage, with pasture coverage, without soy coverage, and without pasture coverage presented the sum of PC1 and PC2 as being between 95 and 100%. PC1 correlated significantly with most soil attributes, especially in soybean areas with and without cover, representing more than 70% of the variation (70.16% in soybean areas with cover and 76.51% in soybean areas without cover (Figure 2)). In pasture areas, the significance of PC1 and PC2 was more distributed among the attributes.
In the Caiabi River sub-basin, the vectors of final infiltration rates followed the direction of the macroporosity, total sand, and bulk density attributes, especially in the mouth and middle regions, where these attributes are statistically greater than at the source (Table 5). This grouping of data in the same quadrant or belonging to the same component highlights the relationship between the factors, serving as a basis for understanding the water infiltration process in sandier soils when compared with clayey soils. Similarly, in the Renato River sub-basin, the eigenvalues are also above one. The accumulated variation in the areas of corn coverage, with pasture coverage and without coverage in corn and soybean areas, is between 95 and 100% (Table 6 and Figure 3). The PC1 of the corn areas with coverage significantly correlated negatively with all soil attributes and stable infiltration rates, except total sand, which showed a positive correlation. It is worth highlighting that this component alone retained 81.81% of the variation, justifying the correlation with all soil attributes.
Regarding the models of water infiltration into the soil, it was observed that, in the Renato River sub-basin, the Horton model was the one that was best adjusted in most treatments and by region, followed by the Philip model (Table 4). When studying the performance of the models above, Santos et al. [42] concluded that Horton’s model is the most appropriate for representing the infiltration rate in Cerrado soils under conditions of minimum cultivation, direct planting system, and conventional planting and can be recommended regardless of the preparation system of the soil used. Panachuki et al. [13] evaluated the effect of different management systems (minimum cultivation and disturbed soils) on water infiltration in a Red Oxisol. They concluded that Horton’s model fit the data well, with a coefficient of determination values greater than 90 %. The same occurred with Carvalho et al. [45], who observed that Horton’s model was the most suitable for representing the water infiltration rate in Argisol. These results corroborate those found in this research.

5. Conclusions

Pasture areas presented better conditions for water infiltration into the soil when disturbed than plots with cover and without cover that were not disturbed, regardless of the sub-basin or topological region in which they were located.
Given the pedological characterization of the soils, the sand fraction predominates in the middle and lower regions of the Caiabi River sub-basin and practically throughout the Renato River sub-basin, influencing the soil water infiltration rates. The smallest amplitude between the initial and final rates was observed in areas with pasture in disturbed conditions in both sub-basins.
Crop areas influenced soil infiltration rates through macroporosity and bulk density concerning the average position of the Caiabi River sub-basin. At the same time, microporosity, clay content, total porosity, and silt were more influential in the source of the Renato River sub-basin.
The models for estimating water infiltration into the soil presented good adjustments in the Cerrado–Amazon transition sub-basins, regardless of soil use and coverage and the region of the sub-basin. However, the Horton and Philip models provided better adjustments and are recommended for estimating this variable regardless of the soil management system used and the regions of the sub-basins of the Renato and Caiabi rivers.

Author Contributions

Data collection, laboratory analysis, writing, methodology, formal analysis, and figures—M.A.B.A.; data collection and laboratory analysis—M.A.B.A.; data collection, laboratory analysis, and figures—D.R.B.; data collection and laboratory analysis—R.S.D.P.; data collection, review, editing, supervision, and financial support—A.P.d.S. and F.T.d.A.; supervision, writing, review, editing, supervision, and financial support—D.F.d.C. All authors have read and agreed to the published version of the manuscript.

Funding

This study was financed by the Coordenação de Aperfeiçoamento de Pessoal de Nível Superior—Brasil (CAPES) and the Agência Nacional de Águas e Saneamento Básico (ANA), Finance Code—001 and Process 88887.144957/2017-00. The authors wish to thank the Conselho Nacional de Desenvolvimento Científico e Tecnológico (CNPq) for its support with scientific initiation grants and a productivity grant.

Institutional Review Board Statement

Not applicable.

Informed Consent Statement

Not applicable.

Data Availability Statement

The study data can be obtained via e-mail upon request from the corresponding author or the second author. The data are unavailable on the website as the research project is still being developed.

Acknowledgments

The authors also thank all the students of the Tecnologia em Recursos Hídricos no Centro-Oeste research group (dgp.cnpq.br/dgp/espelhogrupo/2399343537529589, accessed on 10 December 2023). The authors would also like to thank the owners of the farms that allowed and supported the collection of samples, with the following highlights: (i) in Vera-MT: Fazenda Vó Maria, Agropecuária Taguá, Fazenda São José, and Fazenda Jaboticabal; (ii) in Claúdia-MT: Fazenda Continental, Fazenda Aremisa III, and Agropecuária Bedin.

Conflicts of Interest

The authors declare no conflicts of interest.

References

  1. Rápalo, L.M.C.; Uliana, E.M.; Moreira, M.C.; Da Silva, D.D.; De Melo Ribeiro, C.B.; Da Cruz, I.F.; Dos Reis Pereira, D. Effects of land-use and-cover changes on streamflow regime in the Brazilian Savannah. J. Hydrol. Reg. Stud. 2021, 38, e100934. [Google Scholar] [CrossRef]
  2. Bertol, I.; Barbosa, F.T.; Berto, C.; Luciano, R.V. Water infiltration in two cultivated soils in Southern Brazil. Revista Brasileira de Ciência Solo 2015, 39, 573–588. [Google Scholar] [CrossRef]
  3. Almeida, W.S.; Panachuki, E.; De Oliveira, P.T.S.; Da Silva Menezes, R.; Alves Sobrinho, T.; De Carvalho, D.F. Effect of soil tillage and vegetal cover on soil water infiltration. Soil Tillage Res. 2018, 175, 130–138. [Google Scholar] [CrossRef]
  4. Hunke, P.; Roller, R.; Zeilhofer, P.; Schröder, B.; Mueller, E.N. Soil changes under different land-uses in the Cerrado of Mato Grosso, Brazil. Geoderma Reg. 2015, 4, 31–43. [Google Scholar] [CrossRef]
  5. Niu, F.; Gao, Z.; Lin, Z.; Luo, J.; Fan, X. Vegetation influence on the soil hydrological regime in permafrost regions of the Qinghai-Tibet Plateau, China. Geoderma 2019, 354, e113892. [Google Scholar] [CrossRef]
  6. Basche, A.D.; Delonge, M.S. Comparing infiltration rates in soils managed with conventional and alternative farming methods: A meta-analysis. PLoS ONE 2019, 14, e0215702. [Google Scholar] [CrossRef]
  7. Fuentes-Llanillo, R.; Telles, T.S.; Junior, D.S.; De Melo, T.R.; Friedrich, T.; Kassam, A. Expansion of no-tillage practice in conservation agriculture in Brazil. Soil Tillage Res. 2021, 208, e104877. [Google Scholar] [CrossRef]
  8. Sone, J.S.; Oliveira, P.T.S.; Euclides, V.P.B.; Montagner, D.B.; De Araujo, A.R.; Zamboni, P.A.P.; Sobrinho, T.A. Cienceationtrogen fertilization and stocking rates on soil erosion and water infiltration in a Brazilian Cerrado farm. Agric. Ecosyst. Environ. 2020, 304, e107159. [Google Scholar] [CrossRef]
  9. Andrade, E.M.; Guerreiro, M.J.S.; Palácio, H.A.Q.; Campos, D.A. Ecohydrology in a Brazilian tropical dry forest: Thinned vegetation impact on hydrological functions and ecosystem services. J. Hydrol. Reg. Stud. 2020, 27, e100649. [Google Scholar] [CrossRef]
  10. Chari, M.M.; Poozan, M.T.; Afrasiab, P. Modelling soil water infiltration variability using scaling. Biosyst. Eng. 2020, 196, 56–66. [Google Scholar] [CrossRef]
  11. Sidiras, N.; Roth, C.H. Infiltration measurements with double-ring infiltrometers and a rainfall simulator under different surface conditions on an Oxisol. Soil Tillage Res. 1987, 9, 161–168. [Google Scholar] [CrossRef]
  12. Alves Sobrinho, T.; Gómez-Macpherson, H.; Gómez, J.A. A portable integrated rainfall and overland flow simulator. Soil Use Manag. 2008, 24, 163–170. [Google Scholar] [CrossRef]
  13. Panachuki, E.; Bertol, I.; Alves Sobrinho, T.; Oliveira, P.T.S.D.; Rodrigues, D.B.B. Perdas de solo e de água e infiltração de água em Latossolo Vermelho sob sistemas de manejo. Rev. Bras. Ciência Solo 2011, 35, 1777–1786. [Google Scholar] [CrossRef]
  14. Falcão, K.D.S.; Panachuki, E.; Monteiro, F.D.N.; Silva, R.; Rodrigues, D.B.; Sone, J.S.; Oliveira, P.T.S. Surface runoff and soil erosion in a natural regeneration area of the Brazilian Cerrado. Int. Soil Water Conserv. Res. 2020, 8, 124–130. [Google Scholar] [CrossRef]
  15. Alves, M.A.B.; Souza, A.P.; Almeida, F.T.; Hoshide, A.K.; Araújo, H.B.; Silva, A.F.; Carvalho, D.F. Effects of Land Use and Cropping on Soil Erosion in Agricultural Frontier Areas in the Cerrado-Amazon Ecotone, Brazil, Using a Rainfall Simulator Experiment. Sustainability 2023, 15, 4954. [Google Scholar] [CrossRef]
  16. Johnson, R.A.; Wichern, D.W. Applied Multivariate Statistical Analysis, 4th ed.; Prentice-Hall: Upper Saddle River, NJ, USA, 1999; 815p. [Google Scholar]
  17. Fox, G.A.; Metl, A.R. Soil property analysis using principal components analysis, soil line, and regression models. Soil Sci. Soc. Am. J. 2005, 69, 1782–1788. [Google Scholar] [CrossRef]
  18. Jolliffe, I.T.; Cadima, J. Principal component analysis: A review and recent developments. Philos. Trans. R. Soc. A Math. Phys. Eng. Sci. 2016, 374, e20150202. [Google Scholar] [CrossRef]
  19. Tajik, S.; Ayoubi, S.; Khajehali, J.; Shataee, S. Effects of tree species composition on soil properties and invertebrates in a deciduous forest. Arab. J. Geosci. 2019, 12, 368. [Google Scholar] [CrossRef]
  20. Abdel-Fattah, M.K.; Abd-Elmabod, S.K.; Aldosari, A.A.; Elrys, A.S.; Mohamed, E.S. Multivariate analysis for assessing irrigation water quality: A case study of the Bahr Mouise Canal, Eastern Nile Delta. Water 2020, 12, 2537. [Google Scholar] [CrossRef]
  21. Abdel-Fattah, M.K.; Mohamed, E.S.; Wagdi, E.M.; Shahin, S.A.; Aldosari, A.A.; Lasaponara, R.; Alnaimy, M.A. Quantitative evaluation of soil quality using Principal Component Analysis: The case study of El-Fayoum depression Egypt. Sustainability 2021, 13, 1824. [Google Scholar] [CrossRef]
  22. Martín-Sanz, J.P.; De Santiago-Martín, A.; Valverde-Asenjo, I.; Quintana-Nieto, J.R.; González-Huecas, C.; López-Lafuente, A.L. Comparison of soil quality indexes calculated by network and principal component analysis for carbonated soils under different uses. Ecol. Indic. 2022, 143, e109374. [Google Scholar] [CrossRef]
  23. Moratelli, F.A.; Alves, M.A.B.; Borella, D.R.; Kraeski, A.; Almeida, F.T.D.; Zolin, C.A.; Hoshide, A.K.; Souza, A.P. Effects of Land Use on Soil Physical-Hydric Attributes in Two Watersheds in the Southern Amazon, Brazil. Soil Syst. 2023, 7, 103. [Google Scholar] [CrossRef]
  24. Alves, M.A.B.; Borella, D.R.; Silva Luz, C.C.; Castagna, D.; Da Silva, W.C.; Silva, A.F.; Souza, A.P. Classes de solos nas bacias hidrográficas dos rios Caiabi e Renato, afluentes do rio Teles Pires, no sul da Amazônia. Nativa 2022, 10, 348–431. [Google Scholar] [CrossRef]
  25. IUSS Working Group WRB. World Reference Base for Soil Resources. In International Soil Classification System for Naming Soils and Creating Legends for Soil Maps, 4th ed.; International Union of Soil Sciences (IUSS): Vienna, Austria, 2022. [Google Scholar]
  26. Alvares, C.A.; Stape, J.L.; Sentelhas, P.C.; Gonçalves, J.L.M.; Sparovek, G. Köppen’s climate classification map for Brazil. Meteorol. Z. 2013, 22, 711–728. [Google Scholar] [CrossRef] [PubMed]
  27. Sabino, M.; Souza, A.P.; Uliana, E.M.; Lisboa, L.; Almeida, F.T.; Zolin, C.A. Intensity-duration-frequency of maximum rainfall in Mato Grosso State. Revista Ambiente Água 2020, 15, e2373. [Google Scholar] [CrossRef]
  28. Teixeira, P.C.; Donagemma, G.K.; Fontana, A.; Teixeira, W.G. Manual de Métodos de Análise de Solo, 3rd ed.; Embrapa Solos: Rio de Janeiro, Brazil, 2017; 573p.
  29. Kostiakov, A.N. On the dynamics of the coefficient of water percolation in soils and on the necessity of studying it from a dynamic point of view for purposes of amelioration. Trans. Sixth Comm. Int. Soc. Soil Sci. 1932, 6(Part A), 17–21. [Google Scholar]
  30. Lewis, M.R. The rate of infiltration of water in irrigation practice. Trans. Am. Geophys. Union 1937, 18, 361–368. [Google Scholar]
  31. Horton, R.E. Analysis of runoff plat experiments with varying infiltration capacity. Trans. Am. Geophys. Union 1939, 20, 693–711. [Google Scholar]
  32. Horton, R.E. The role of infiltration in the hydrological cycle. Trans. Am. Geophys. Union 1933, 14, 446–460. [Google Scholar]
  33. Philip, J.R. Theory of infiltration. Adv. Hydrosci. 1969, 5, 215–296. [Google Scholar]
  34. Philip, J.R. The theory of infiltration Sorptivity and algebraic infiltration equations. Soil Sci. 1957, 84, 257–264. [Google Scholar] [CrossRef]
  35. Moriasi, D.N.; Arnold, J.G.; Van Liew, M.W.; Bingner, R.L.; Harmel, R.D.; Veith, T.L. Model evaluation guidelines for systematic quantification of accuracy in watershed simulations. Trans. ASABE 2007, 50, 885–900. [Google Scholar] [CrossRef]
  36. Nash, J.E.; Sutcliffe, J.V. River flow forecasting through conceptual models: Part 1. A discussion of principles. J. Hydrol. 1970, 10, 282–290. [Google Scholar] [CrossRef]
  37. IBGE_Instituto Brasileiro de Geografia e Estatística. Estado do Mato Grosso: Pedologia (Mapa Exploratório de Solos). 2009. Available online: https://geoftp.ibge.gov.br/informacoes_ambientais/pedologia/mapas/unidades_da_federacao/mt_pedologia.pdf (accessed on 29 December 2023).
  38. EPE_Empresa de Pesquisa Energética. Avaliação Ambiental Integrada da Bacia Hidrográfica do Rio Teles Pires. 2009; 67p. Available online: https://www.epe.gov.br/sites-pt/publicacoes-dados-abertos/publicacoes/PublicacoesArquivos/publicacao-248/topico-292/AAI%20Teles%20Pires%20-%20Relat%C3%B3rio%20Final%20-%20Sum%C3%A1rio%20Executivo[1].pdf#search=teles%20pires> (accessed on 29 December 2023).
  39. Centeri, C. Effects of grazing on water erosion, compaction and infiltration on Grasslands. Hydrology 2022, 9, e34. [Google Scholar] [CrossRef]
  40. Baronti, S.; Ungaro, F.; Maienza, A.; Ugolini, F.; Lagomarsino, A.; Agnelli, A.E.; Calzolari, C.; Pisseri, F.; Robbiati, G.; Vaccari, F.P. Rotational pasture management to increase the sustainability of mountain livestock farms in the Alpine region. Reg. Environ. Change 2022, 22, e50. [Google Scholar] [CrossRef]
  41. Castro, L.G.; Cogo, N.P.; Volk, L.B.D.S. Alterations in soil surface roughness by tillage and rainfall in relation to water erosion. Rev. Bras. Ciência Solo 2006, 30, 339–352. [Google Scholar] [CrossRef]
  42. Santos, M.A.D.N.D.; Panachuki, E.; Alves Sobrinho, T.; Oliveira, P.T.S.D.; Rodrigues, D.B.B. Water infiltration in na ultisol after cultivation of common bean. Rev. Bras. Ciência Solo 2014, 38, 1612–1620. [Google Scholar] [CrossRef]
  43. Fernandes, B.B.; Marasca, I.; Martins, M.B.; Sandi, J.; Da Silva, K.G.P.; Lanças, K.P. Effect of traffic in agricultural soil water infiltration and the physical atributes of the soil. Irriga 2022, 27, 343–356. [Google Scholar] [CrossRef]
  44. Döbert, T.F.; Bork, E.W.; Apfelbaum, S.; Carlyle, C.N.; Chang, S.X.; KhaI-Chhetri, U.; Silva Sobrinho, L.; Thompson, R.; Boyce, M.S. Adaptive multi-paddock grazing improves water infiltration in Canadian grassland soils. Geoderma 2021, 401, e115314. [Google Scholar] [CrossRef]
  45. Carvalho, D.F.; Eduardo, E.N.; Almeida, W.S.; Santos, L.A.; Alves Sobrinho, T. Water erosion and soil water infiltration in different stages of corn development and tillage systems. Rev. Bras. Eng. Agrícola e Ambient. 2015, 19, 1072–1078. [Google Scholar] [CrossRef]
Figure 1. Location of the Teles Pires River basin and the sub-basins of the Renato and Caiabi Rivers, in the Cerrado–Amazon transition.
Soilsystems 08 00031 g001
Figure 2. Analysis of principal components in the Caiabi River sub-basin in areas of cropland with cover (A), crop without cover (B), pasture with cover (C), and pasture without cover (D). Micro—microporosity; Macro—macroporosity; Bd—bulk density; Rif—final infiltration rate; UC-CSSoy—upper Caiabi River with soybean cover; MC-CSSoy—middle Caiabi River with soybean cover; LC-CSSoy—lower Caiabi river with soybean cover; UC-CSPast—upper Caiabi River with pasture cover; MC-CSPast—middle Caiabi River with pasture cover; LC-CSPast—lower Caiabi River with pasture cover; UC-CWSSoy—upper Caiabi River in an uncovered soybean area; MC-CWSSoy—middle Caiabi River in an uncovered soybean area; LC-CWSSoy—lower Caiabi river in an uncovered soybean area; UC-CWSPast—upper Caiabi River in an uncovered pasture area; MC-CWSPast—middle Caiabi River in an uncovered pasture area; LC-CWSPast—lower Caiabi river in an uncovered pasture area. The black dots are related to the regions of the sub-watershed and the treatments (according to the identification mentioned previously) - above each point are the acronyms that identify it.
Soilsystems 08 00031 g002
Figure 3. Analysis of principal components in the Renato River sub-basin in areas of cropland with cover (A), crop without cover (B), pasture with cover (C), and pasture without cover (D). Micro—microporosity; Macro—macroporosity; Bd—bulk density; Rif—final infiltration rate; UR-CSCorn—upper Renato River with soybean cover; MR-CSCorn—middle Renato River with soybean cover; LR-CSCorn—lower Renato river with soybean cover; UR-CSPast—upper Renato River with pasture cover; MR-CSPast—middle Renato River with pasture cover; LR-CSPast—lower Renato River with pasture cover; UR-CWSCorn—upper Renato River in an uncovered soybean area; MR-CWSCorn—middle Renato River in an uncovered soybean area; LR-CWSCorn—lower Renato river in an uncovered soybean area; UR-CWSPast—upper Renato River in an uncovered pasture area; MR-CWSPast—middle Renato River in an uncovered pasture area; LR-CWSPast—lower Renato river in an uncovered pasture area. The black dots are related to the regions of the sub-watershed and the treatments (according to the identification mentioned previously) - above each point are the acronyms that identify it.
Soilsystems 08 00031 g003
Table 2. Initial and final infiltration rates (Rio and Rif) (mm h−1) in the Caiabi and Renato sub-basins.
Sub-BasinTratUpperMiddleLower
RioRifRioRifRioRif
CaiabiCultivated
CS66.46 Aa31.57 Ab65.31 Aa45.64 Aa65.31 Aa35.16 Bb
WCS61.82 Aa15.04 Bb63.51 Aa35.67 Aa44.77 Bb32.41 Ba
SD68.54 Aa34.39 Ab61.34 Aa30.98 Bb71.06 Aa60.22 Aa
Pasture
CS34.57 Ba2.67 Bb40.62 Ba15.64 Ba42.90 Ba12.23 Aba
WCS44.14 Ba3.96 Bb55.57 Aa21.29 Ba40.59 Ba5.94 Bb
SD69.86 Aa56.71 Aa61.34 Aa30.98 Ab61.20 Aa18.70 Ac
RenatoCultivated
CS61.63 Aa17.92 Aa39.00 Bb11.77 Ab58.38 Aa18.35 Aa
WCS61.93 Aa19.40 Aa17.40 Cb11.83 Ab22.37 Bb8.00 Bb
SD63.21 Aa11.2 ABa67.11 Aa5.43 Ab63.43 Aa13.43 Ba
Pasture
CS68.14 Aa38.64 Ba26.79 Cb4.19 Bc54.01 Aa12.46 Bb
WCS63.30 Aa23.30 Ba42.43 Bb1.00 Bc61.61 Aa9.76 Bb
SD69.86 Aa62.51 Aa62.57 Aa37.29 Ab68.43 Aa36.26 Ab
CS = with cover; WCS = without cover; SD = soil disturbed. Means followed by equal capital letters in the same column (compare Rio or Rif in soil cover in the same region of each sub-basin) and equal lowercase letters in the same line (compare Rio and Rif in different regions of each river sub-basin for the same soil cover) do not differ significantly from each other using the Kruskal–Wallis test at 5% probability. No comparisons were made between sub-basins or between land uses for the same sub-basins.
Table 3. Parameters and statistical indices of the best mathematical infiltration models generated for the Caiabi River sub-basin.
Land CoverSoil ManagementModelR2RMSENSE
Cultivated (soybean)Upper
CSRi = 31.57 + (66.46 − 31.57) e−0.14 THorton0.843.790.85
WCSRi = 4.55 + 1 2 116.70 T −0.5Philip0.863.270.86
SDRi = 34.39 + (68.54 − 34.39) e −7.52THorton0.5115.68−0.66
Middle
CSRi = 42.39 + 1 2 46.77 T−0.5Philip0.781.370.79
WCSRi = 29.24 + 1 2 69.06 T−0.5Philip0.901.270.90
SDRi = 24.16 + 1 2 80.08 T−0.5Philip0.782.900.78
Lower
CSRi = 26.98 + 1 2 70.23 T−0.5Philip0.831.780.83
WCSRi = 28.58 + 1 2 18 T−0.5Philip0.661.910.66
SD-------------
PastureUpper
CSRi = 2.67 + (34.57 − 2.67) e−0.15 THorton0.902.830.90
WCSRi = 3.96 + (2.70). 145.19 T−2.701KL0.853.790.84
SDRi = 56.71 + (69.86 − 56.71) e−0.13 THorton0.772.120.77
Middle
CSRi = 10.73 + 1 2 57.47 T−0.5Philip0.763.010.76
WCSRi = 13.80 + 1 2 84.91 T−0.5Philip0823.710.82
SDRi = 30.98 + (61.34 − 30.98) e−0.15 THorton0.793.860.79
Lower
CSRi = 0.82 + 1 2 121.34 T−0.5Philip0.873.560.87
WCSRi = 5.45 + 1 2 125.68 T−0.5Philip0.912.930.92
SDRi = 18.70 + (61.20 − 18.70) e−0.18 THorton0.912.470.91
R2 = coefficient of determination; RMSE = root mean square error; NSE = Nash–Sutcliffe efficiency; CS = soil with cover; WCS = soil without cover; SD = soil disturbed.
Table 4. Parameters and statistical indices of the best mathematical infiltration models generated for the Renato River sub-basin.
Land CoverSoil ManagementModelR2RMSENSE
Cultivated (corn)Upper
CSRi = 17.92 + (61.63 − 17.92) e −0.11THorton0.726.770.72
WCSRi = 19.40 + (61.93 − 19.40) e −0.85 THorton0.856.600.55
SDRi = 11.20 + (63.21 − 11.20) e −0.90 THorton0.9013.680.20
Middle
CSRi = 6.95 + 1 2 62.40 T−0.5Philip0.832.570.84
WCSRi = 9.96 + 1 2 12.74 T−0.5Philip0.232.120.24
SDRi = 11.35 + 1 2 116.40 T−0.5Philip0.875.070.90
Lower
CSRi = 11.26 + 1 2 101.87 T−0.5Philip0.942.380.94
WCSRi = 3.66 + 1 2 71.69 T−0.5Philip0.832.630.87
SDRi = 13.43 (63.43 − 13.43) e−0.10 THorton0.924.130.92
PastureUpper
CSRi = 38.64 + (68.14 − 38.64) e −0.27 THorton0.813.030.81
WCSRi = 23.30 + (0.05) 756.35 T−0.051KL0.912.420.92
SDRi = 62.51 + (69.86 − 62.51) e−0.04 THorton0.451.860.47
Middle
CSRi = 4.19 + (26.79 − 4.19) e−0.13 THorton0.822.500.82
WCSRi = 1.00 + (42.43 − 1.00) e−0.13 THorton0.824.480.85
SDRi = 37.29 + (0.38)79.05 T−0.381KL0.605.940.97
Lower
CSRi = 12.46 + (0.08) 509.14 T−0.081KL0.892.880.95
WCSRi = 9.76 + (61.61 − 9.76) e−0.24 THorton0.884.670.86
SDRi = 36.26 + (68.43 − 36.26) e−0.10 THorton0.844.690.84
R2 = coefficient of determination; RMSE = root mean square error; NSE = Nash-Sutcliffe efficiency; CS = soil with cover; WCS = soil without cover; SD = soil disturbed.
Table 5. Summary of the principal components of physical attributes and final water infiltration rate into the soil in crop and pasture areas, with and without cover, in the Caiabi River sub-basin.
Principal
Component
CCSoyCCPastCWSoyCWPast
PC 1PC 2PC 1PC 2PC 1PC 2PC 1PC 2
Eigenvalues4.9102.0803.7503.2405.3501.6404.3102.680
Variation %70.16029.83053.61046.39076.51023.49061.60038.390
AttributeCorrelation
Sand−0.984 *0.178−0.258 *−0.076−0.999 *0.051−0.186 *0.031
Silt0.993 *−0.1210.264 *0.0400.990 *0.0070.187 *0.004
Clay0.956 *−0.2950.254 *0.0920.985 *−0.1700.184−0.104
Micro−0.2740.962 *0.135−0.265 *−0.3950.919 *−0.0740.559 *
Macro−0.609−0.794−0.2050.197−0.502−0.865 *−0.094−0.526 *
Bd−0.991 *0.130−0.072−0.297 *−0.990 *0.003−0.187 *0.002
Rif−0.785 *−0.620−0.004−0.308*−0.990 *−0.144−0.185 *−0.088
Micro—microporosity; Macro—macroporosity; Bd—bulk density; Rif—final infiltration rate; CCSoy—Caiabi with soybean cover; CCPast—Caiabi with pasture cover; CWSoy—Caiabi without soybean cover; CWPast—Caiabi without a pasture area. * Significant at 5% probability.
Table 6. Summary of the principal components of physical attributes and final water infiltration rate into the soil in crop and pasture areas with and without cover in the Renato River sub-basin.
Principal
Component
RCCornRCPastRWCornRWPast
PC 1PC 2PC 1PC 2PC 1PC 2PC 1PC 2
Eigenvalues5.7201.2704.472.5204.8802.1104.4802.510
Variation %81.81018.19063.99033.01069.83030.17064.03035.960
AttributeCorrelation
Sand0.975 *0.223−0.984 *−0.1770.930 *0.367−0.728 *−0.068
Silt−0.936 *0.352−0.242−0.970 *−0.978 *0.207−0.112−0.626 *
Clay−0.821 *−0.5700.938 *0.347−0.726−0.6880.638 *0.176
Micro−0.528 *0.8490.629−0.777−0.6500.7600.597 *−0.236
Macro−0.996 *−0.092−0.971 *−0.237−0.971 *−0.241−0.495 *−0.767*
Bd−0.989 *0.150−0.4850.874 *−0.990 *−0.001−0.3590.803 *
Rif−0.989 *−0.1500.999 *−0.052−0.4170.909 *0.089–0.003
Micro—microporosity; Macro—macroporosity; Bd—bulk density; Rif—final infiltration rate; RCCorn—Renato with corn cover; RCPast—Renato with pasture cover; RWCorn—Renato without corn cover; RWPast—Renato without a pasture area. * Significant at 5% probability.
Disclaimer/Publisher’s Note: The statements, opinions and data contained in all publications are solely those of the individual author(s) and contributor(s) and not of MDPI and/or the editor(s). MDPI and/or the editor(s) disclaim responsibility for any injury to people or property resulting from any ideas, methods, instructions or products referred to in the content.

