Article

Soil-Forming Factors of High-Elevation Mountains along the East African Rift Valley: The Case of the Mount Guna Volcano, Ethiopia

by
Mekonnen Getahun Sisay
1,*,
Enyew Adgo Tsegaye
1,
Alemayehu Regassa Tolossa
2,
Jan Nyssen
3,
Amaury Frankl
3,
Eric Van Ranst
4 and
Stefaan Dondeyne
3,5
1
Department of Natural Resource Management, Bahir Dar University, Bahir P.O. Box 79, Ethiopia
2
Department of Natural Resources Management, Jimma University, Jimma P.O. Box 378, Ethiopia
3
Department of Geography, Ghent University, 9000 Ghent, Belgium
4
Department of Geology, Ghent University, 9000 Ghent, Belgium
5
Water and Climate Research Group, Vrije Universiteit Brussel, 1050 Brussels, Belgium
*
Author to whom correspondence should be addressed.
Soil Syst. 2024, 8(2), 38; https://doi.org/10.3390/soilsystems8020038
Submission received: 30 November 2023 / Revised: 16 March 2024 / Accepted: 19 March 2024 / Published: 24 March 2024

Abstract

:
The soils of the high-elevation mountains along the East African Rift Valley are poorly understood. Assessing the potential of soils for agriculture, climate change mitigation, and environmental functioning requires insight into how they relate to the factors influencing soil formation. Between 3000 and 4120 m a.s.l., 85 soil profiles of Mount Guna were described and sampled. Standard physicochemical analyses were done on all pedons. Additionally, X-ray diffraction, Alox and Feox content, and P fixation were performed on six selected profiles. Soils on Mount Guna included Andosols, Phaeozems, Leptosols, Regosols, Cambisols, Luvisols, and Vertisols. With increasing elevation, clay content, bulk density, and pH decreased while the C:N ratio remained constant. In contrast, sand, silt, silt-to-clay ratio, SOC, Ntotal, and SOCS increased. With a factor analysis, the soil-forming factors’ elevation/climate could be disentangled from the factor’s parent material as these affect topsoil and subsoil differently. In the ordination based on climate/elevation and parent material, Andosols and Vertisols stood out while other Reference Soil Groups (RSG) showed indistinct patterns. Soil erosion appeared as an additional soil-forming factor not accounted for by the factor analysis. The distribution of the RSG was significantly associated with elevation belts (p < 0.001), lithology (p < 0.001), and landcover (p < 0.003). On the summital ridge, the Andosols were crucial for groundwater storage due to high precipitation. Shallow and stony soils in the mid-elevation belt contributed to runoff generation. Average soil carbon stock ranged from 8.1 to 11 kg C m−2 in the topsoil and from 29.2 to 31.9 kg C m−2 in the upper meter, emphasizing the global importance of high-elevation areas for carbon sequestration.

1. Introduction

Knowledge of the soil properties of high-elevation mountains is important to understand their role in hydrological and global climate processes. As mountains provide over 50% of the world’s river sources, climate changes will affect their hydrologic response with large effects on people relying on these water resources for domestic use, agricultural, energy, and industrial purposes [1]. While high-elevation mountains, including the mountains along the East African Rift Valley system, play a vital role in climate, water-flow regulation, and the carbon cycle, they are also vulnerable to climate change [2,3,4]. Furthermore, a recent literature review [5] highlighted that the dynamics of soil organic carbon (SOC) in mountain regions are influenced by both natural and human-induced factors. Among the natural factors, climate change, plant community succession, and wildfires play a significant role. The impact of climate change, such as rising temperatures and heavy rainfall, tends to increase soil respiration rates, leading to the depletion of SOC stocks. Conversely, long-term wetting trends can enhance plant net primary productivity in dryland areas, which supports the accumulation of SOC [6,7].
Soil maps are required to provide accurate, high-resolution global data on soil properties and their relationships to ecosystem processes, as well as environmental and human-induced factors over time and space [8]. The central paradigm in soil survey—initially proposed in the late 19th century by Dokuchaev [9] and later further elaborated by Jenny [10]—is that soil formation is determined by climate, organism, relief, parent material, and time. For digital soil mapping, [11] reformulated this as
S = f(s,c,o,r,p,a,n)
where S stands for the soil attribute or class to be estimated, s for soil classes or other previously measured properties, c for climate characteristics, o for the influence of organisms, including land-use/landcover, fauna and human activity, r the relief, topography, or landscape attributes, p the parent material, a the age of the soil, and n the spatial or geographic position. The SCORPAN model enables the integration of conventional soil survey data with geostatistical methods and machine learning techniques in digital soil mapping at a specific resolution. However, better insights into how soil properties relate to soil-forming factors is crucial for the improvement and increased reliability of digital soil maps.
Mountain soils are highly variable as the soil-forming factors, parent material, climate, biota or organisms, topography, and time may vary greatly over short distances. The soils of the high-elevation mountains and volcanoes along the East African Rift Valley have received little attention as soil surveys have focused on lower lying agricultural areas. With high-elevation mountains, we refer to mountains that reach well above 3000 m a.s.l. Along the East African Rift Valley system, there are 13 such mountains, or mountain ranges (Figure 1). For these high-elevation areas, we could find only nine peer-reviewed publications that report detailed soil properties of 61 pedons in total (Table 1). Similarly, the Africa Soil Profiles database [12] contains data of only 33 pedons located in these high-elevation areas.
Table 1. Number of pedons reported in peer-reviewed publications with detailed data from high-elevation mountains (above approximately 3000 m a.s.l.) along the East African Rift Valley system.
CountryMountain 1PedonsReferences
EthiopiaSimien range6[13]
Simien range5[14]
KenyaMount Kenya5[13]
Mount Kenya 11[15]
Mau escarpment 22[16]
Kenya/UgandaMount Elgon 15[17]
TanzaniaMount Kilimanjaro2[18]
Mount Kilimanjaro1[19]
RwandaVirunga volcanoes5[20]
Mount Bisoke 39[21]
1 see Figure 1 for location; 2 located west of the Aberdare mountain; 3 part of the Virunga volcanoes.
Figure 1. Thirteen high-elevation mountains, or mountain ranges, with summits above 4000 m a.s.l., occur along the East African Rift Valley system. Except for the Rwenzori mountain range, all are volcanoes. The extent of the Andosols is taken from the 2nd version of the Harmonized World Soil Database (authors’ cartography based on the Global Multi-resolution Terrain Elevation Data 2010 [22] and the Harmonized World Soil Database version 2.0 [23]).
Soilsystems 08 00038 g001
Mount Guna, in North-Western Ethiopia, is one of these high-elevation mountains, whose soils had not been studied before. The western slopes of this volcano are part of the Lake Tana Basin forming the upper reaches of the Blue Nile Basin. Over the last decades, Lake Tana Basin has received considerable attention from hydrologists and geomorphologists [24,25,26]. Given the importance of soils in hydrological processes and their role in climate change mitigation, we aimed at characterizing the soils of Mount Guna. By studying a large number of soil profiles, we aimed at getting a better insight into the relationship between soils and soil-forming factors of high-elevation areas along the East African Rift Valley system. A related, side question, was whether Andosols occur on this volcano, as these have not been mapped for any of the high-elevation mountains in Ethiopia (Figure 1).

2. Materials and Methods
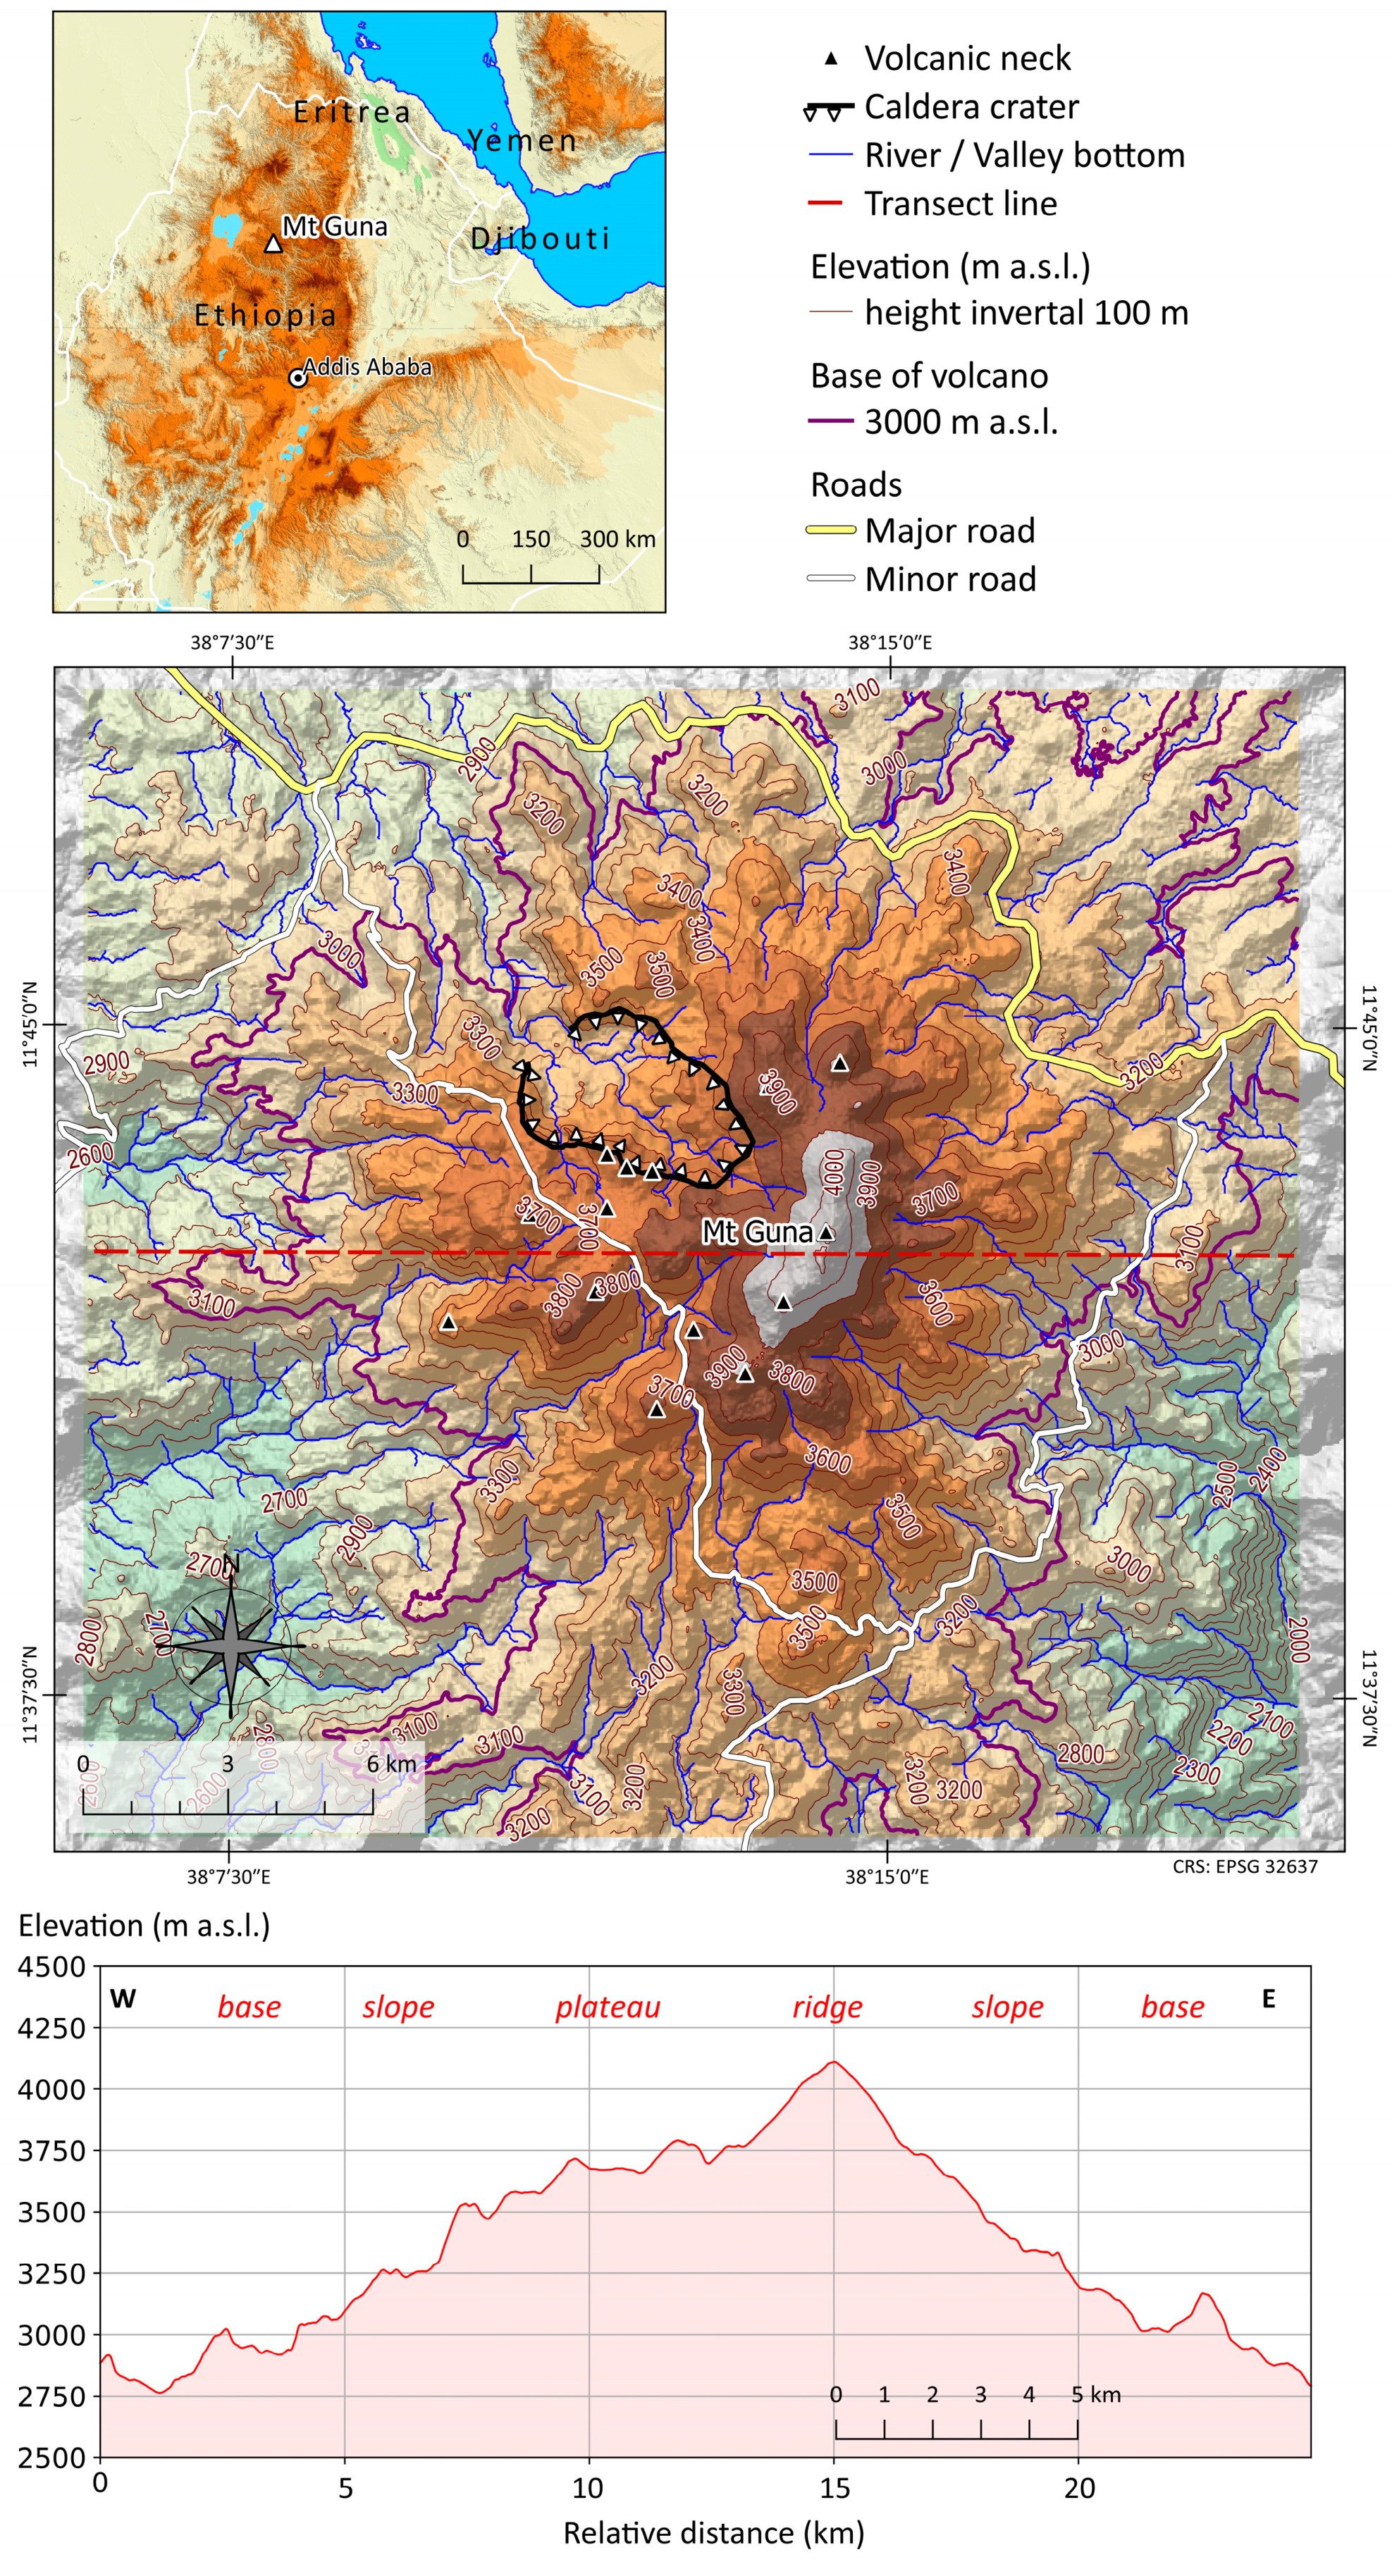
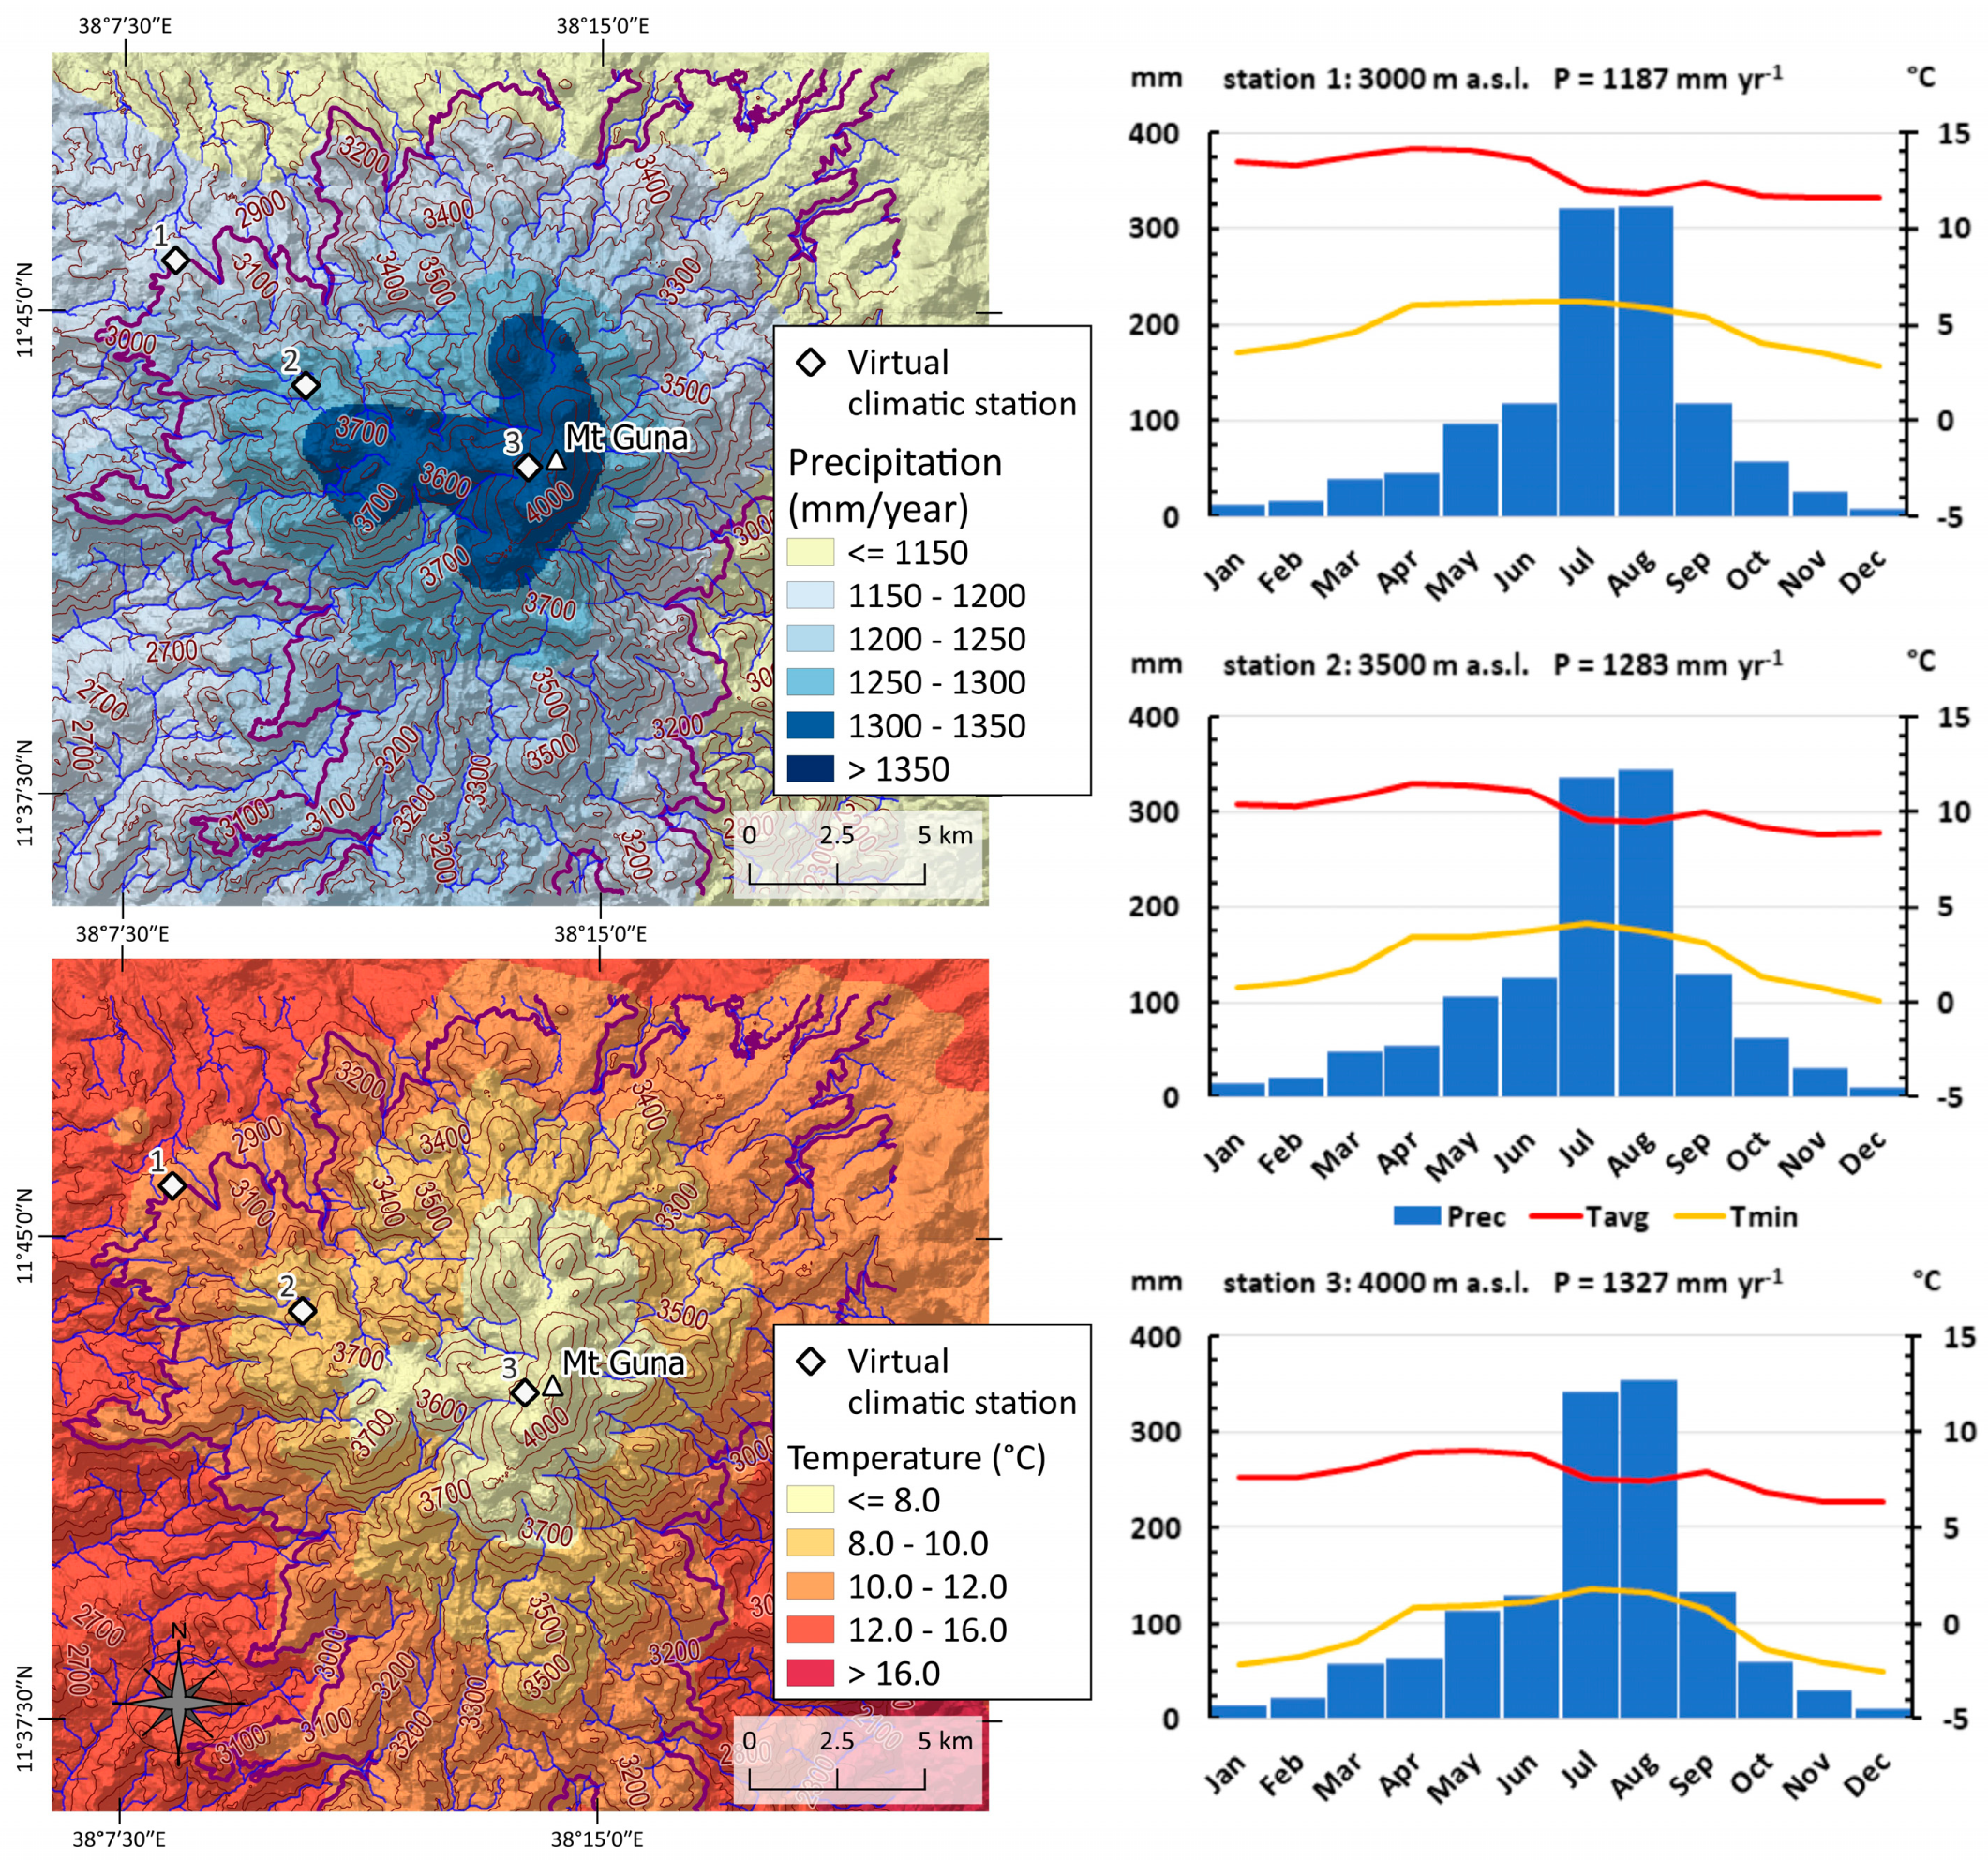
2.1. Study Area

Mount Guna is a complex volcano with its base at around 3000 m a.s.l., and with its summit reaching 4120 m a.s.l. The mountain has the general appearance of a shield volcano, forming a plateau between 3500 and 3750 m a.s.l. and featuring an eroded caldera crater in the north-western sector (Figure 2). The plateau is overarched by a north–south-oriented summital ridge featuring several volcanic necks. The geological base of Mount Guna consists of flood basalts dating back to Mid to Late Miocene [27]. The summital ridge consists of the Guna Trachyte, while the slopes of the shield are dominated by the Guna Tuff [27] (Figure 3).
Gridded climatic data, with a spatial resolution of about 1 km of WORLDCLIM version 2.0 was used [28]. The dataset has average monthly climate variables between the years 1970 and 2000. The long-term mean annual variables were used for this study through aggregate monthly precipitation and temperature datasets (Figure 4).
The landcover units, including tree cover, shrubland, grassland, cropland, and built-up areas, were derived from the ESA WorldCover 10 m 2021 v200 (Figure 5) [29]. The primary economic activities on Mount Guna and its surrounding neighbourhood involve livestock, mainly sheep, cattle, and horses, along with crop production. Potatoes and barley are commonly cultivated up to an elevation of 3700 m above sea level.

2.2. Soil Sampling and Analysis

The field surveys consisted of three phases. First, a reconnaissance survey was conducted to acquire general insights into land use, soils, and the general environment of Mount Guna. Secondly, observations on the soils were made using a standard Edelman auger, and by studying gully and road cuts. Thirdly, based on the gained insights, sites for describing soil profiles were selected. A total of 85 soil profiles were described and sampled along seven topographic transects to cover the elevation belts, besides the lithologic and landcover units (Figure 3). The soil profiles were dug to 100–120 cm, or up to the hard rock. The soil profiles were described following the FAO guidelines for soil description [30] and georeferenced with a handheld geographical positioning system. The profiles were classified according to the 4th edition of the international soil classification system World Reference Base for Soil Resources [31]. A total of 226 soil samples were collected from genetic horizons.
Soil bulk density was determined using 100 cm3 cylindrical steel rings. From each genetic horizon, bulk samples were collected in plastic bags and analysed at the National Soil Testing Center (NSTC) in Ethiopia. The soil samples were air-dried, crushed, and passed through a 2 mm sieve. The analyses of soil characteristics were determined using standard procedures [32]. The soil bulk density was determined from undisturbed soil core samples after drying to consistent weights in an oven at 105 °C.
The particle size analysis was determined by the Bouyoucos hydrometer method. Soil pH was measured in a 1:2.5 soil-to-water suspension. The Walkley and Black wet digestion method was used to estimate the organic carbon contents of the soil samples. The Kjeldahl digestion, distillation, and titration method was used to analyse total N. The Olsen method’s standard technique was followed to analyse the available phosphorous (P).
Cation exchange capacity (CEC) and exchangeable bases were determined using the ammonium acetate technique. Exchangeable Ca and Mg in the extracts were analysed using an atomic absorption spectrometer (AAS), while Na and K were analysed by a flame photometer. The computation of percentage base saturation (BS) involved dividing the total of the exchangeable bases (Ca, Mg, Na, and K) by the soil’s CEC and then multiplying the result by 100. The CEC-clay ratio was determined by dividing CEC values by the total clay content of the soil and multiplying the value by 100. The Blakemore procedure was used in determining phosphate retention capacity, whereas extractable aluminium and iron were determined by acid oxalate procedure at pH 3.0 following a four-hour shaking of acid solution in a dark room using standard methods.
Using X-ray diffraction (XRD), the nature of the colloids was determined for samples collected in the topsoil (0–25 cm) and the subsoil (25–50 cm) of six pedons (P-71, P-80, P-59, P-73, P-77, P-81) all occurring in the highest elevation belt, under Afro-alpine grassland. These analyses, conducted at Ghent University, Belgium, were aimed at verifying whether these soils could be classified as Andosols.
The samples underwent treatment with 6% NaOCl at pH 8 to remove organic matter [33]. Approximately 5 g of fine earth (<2 mm) was crushed with a mortar and pestle and then micronized in a McCrone mill. After the removal of the organic matter, the sand fraction was separated by wet sieving removal. Subsequently, the clay fraction was separated from the silt fraction by successive sedimentation with 2% Na2CO3 as a dispersant, followed by removal of salts by dialysis. The clay samples were analysed with X-ray diffraction (XRD) before and after ethylene-glycol solvation and after heating at 500 °C for 2 h. XRD patterns of air-dried, parallel-oriented clay samples were collected with a Bruker D8 ECO Advance system, equipped with a Cu tube anode and an energy-dispersive position-sensitive LynxEye XE detector. The incident beam was automatically collimated to an irradiated length of 15 mm. The tube operated at 40 kV and 25 mA. Patterns were collected in a θ–2θ geometry from 3° 2θ to 30° 2θ, at a step of 0.010° 2θ, and a count time of 48 s per step. The obtained diffraction patterns were interpreted qualitatively using the COD database [34,35,36].

2.3. Statistical Analysis

The data from the physicochemical characteristics were summarised as mean ± standard deviation (SD). To allow us to compare data from soil profiles with different horizons each of varying depths, the calculations are based on the weighted average for three depths defined as the topsoil (0–25 cm), the subsoil (25–50 cm), and the deep subsoil (50–100 cm). The analyses were conducted using the IBM SPSS statistical software (version 26.0) package for Windows [37].
A factor analysis was performed on the same weighted averages. The values of the variables which were not normally distributed were transferred by applying either an exponential function, a square root, a logarithm function, or a combination of square root and logarithm, to ensure that the skewness was ranging between −1 and 1. The first four factor axes, all with eigenvalues > 1, were retained and subjected to varimax rotation [38]. The varimax rotation was used to maximize the correlation between the factors and the soil characteristics, enhancing the interpretability of the results [39]. We focused on the first four factors, on the hypothesis that these would correspond to topography (elevation), parent material, climate, and land use. The McNemar’s chi-square test [40] was used to test the hypothesis that there would be a significant association between Reference Soil Groups (RSG) and elevation, lithology, and landcover units.

3. Results

3.1. Soil Morphological Characteristics

In the majority of the pedons, the particle size distribution exhibited a consistent pattern with respect to elevation and soil depth (Table 2; Figure 6). In terms of texture, the soils in the lower elevation belt (3000–3200 m a.s.l.) had more clay than at higher elevation. Within a profile, the clay content was higher in the subsurface layers. In the lower elevation belt, the moist soil colour changed from very dark grey (10YR3/1) to black (10YR2/1) in the topsoil to dark grey (10YR4/1) and very dark greyish brown (10YR3/2) in the subsoil horizons. In the middle elevation belt (3200–3500 m a.s.l.), it varied from dark brown to very dark grey (7.5YR3/3 to 10YR3/1) and brown/dark yellowish brown to dark reddish brown (5YR3/2). In the highest elevation belt (3500–4200 m a.s.l.), it varied from black (10YR2/1) to yellowish brown or even lighter colours.
The soil depth varied greatly depending on the topographic position. Most shallow soils occurred in the mid-elevation belt, particularly in upper shoulder and upper back slope positions. Here, soil profile development was limited to an A horizon above a C horizon, above the bedrock. In lower and midslope positions, deeper soils occurred with soil profile development typically exhibiting an A horizon, followed by a B horizon (AB, Bw, or Bt), and a C horizon above the bedrock.
The soil structure of all surface horizons was weakly developed, with a fine, granular structure. In the subsurface horizons, the structure was moderate, medium angular blocky. Likewise, the topsoil had many fine roots in the topsoil that decreased with depth. The horizon boundaries between the A and B horizons were clear and smooth, partly due to a pronounced accumulation of organic matter in the topsoil and partly due to variation in parent material. The dry consistence varied from slightly hard to very hard, whereas the moist consistence varied from friable to firm. On the other hand, the wet consistence ranged from slightly sticky/slightly plastic in the surface layers to very sticky/very plastic in the subsurface soil layers, particularly so in the Vertisols.

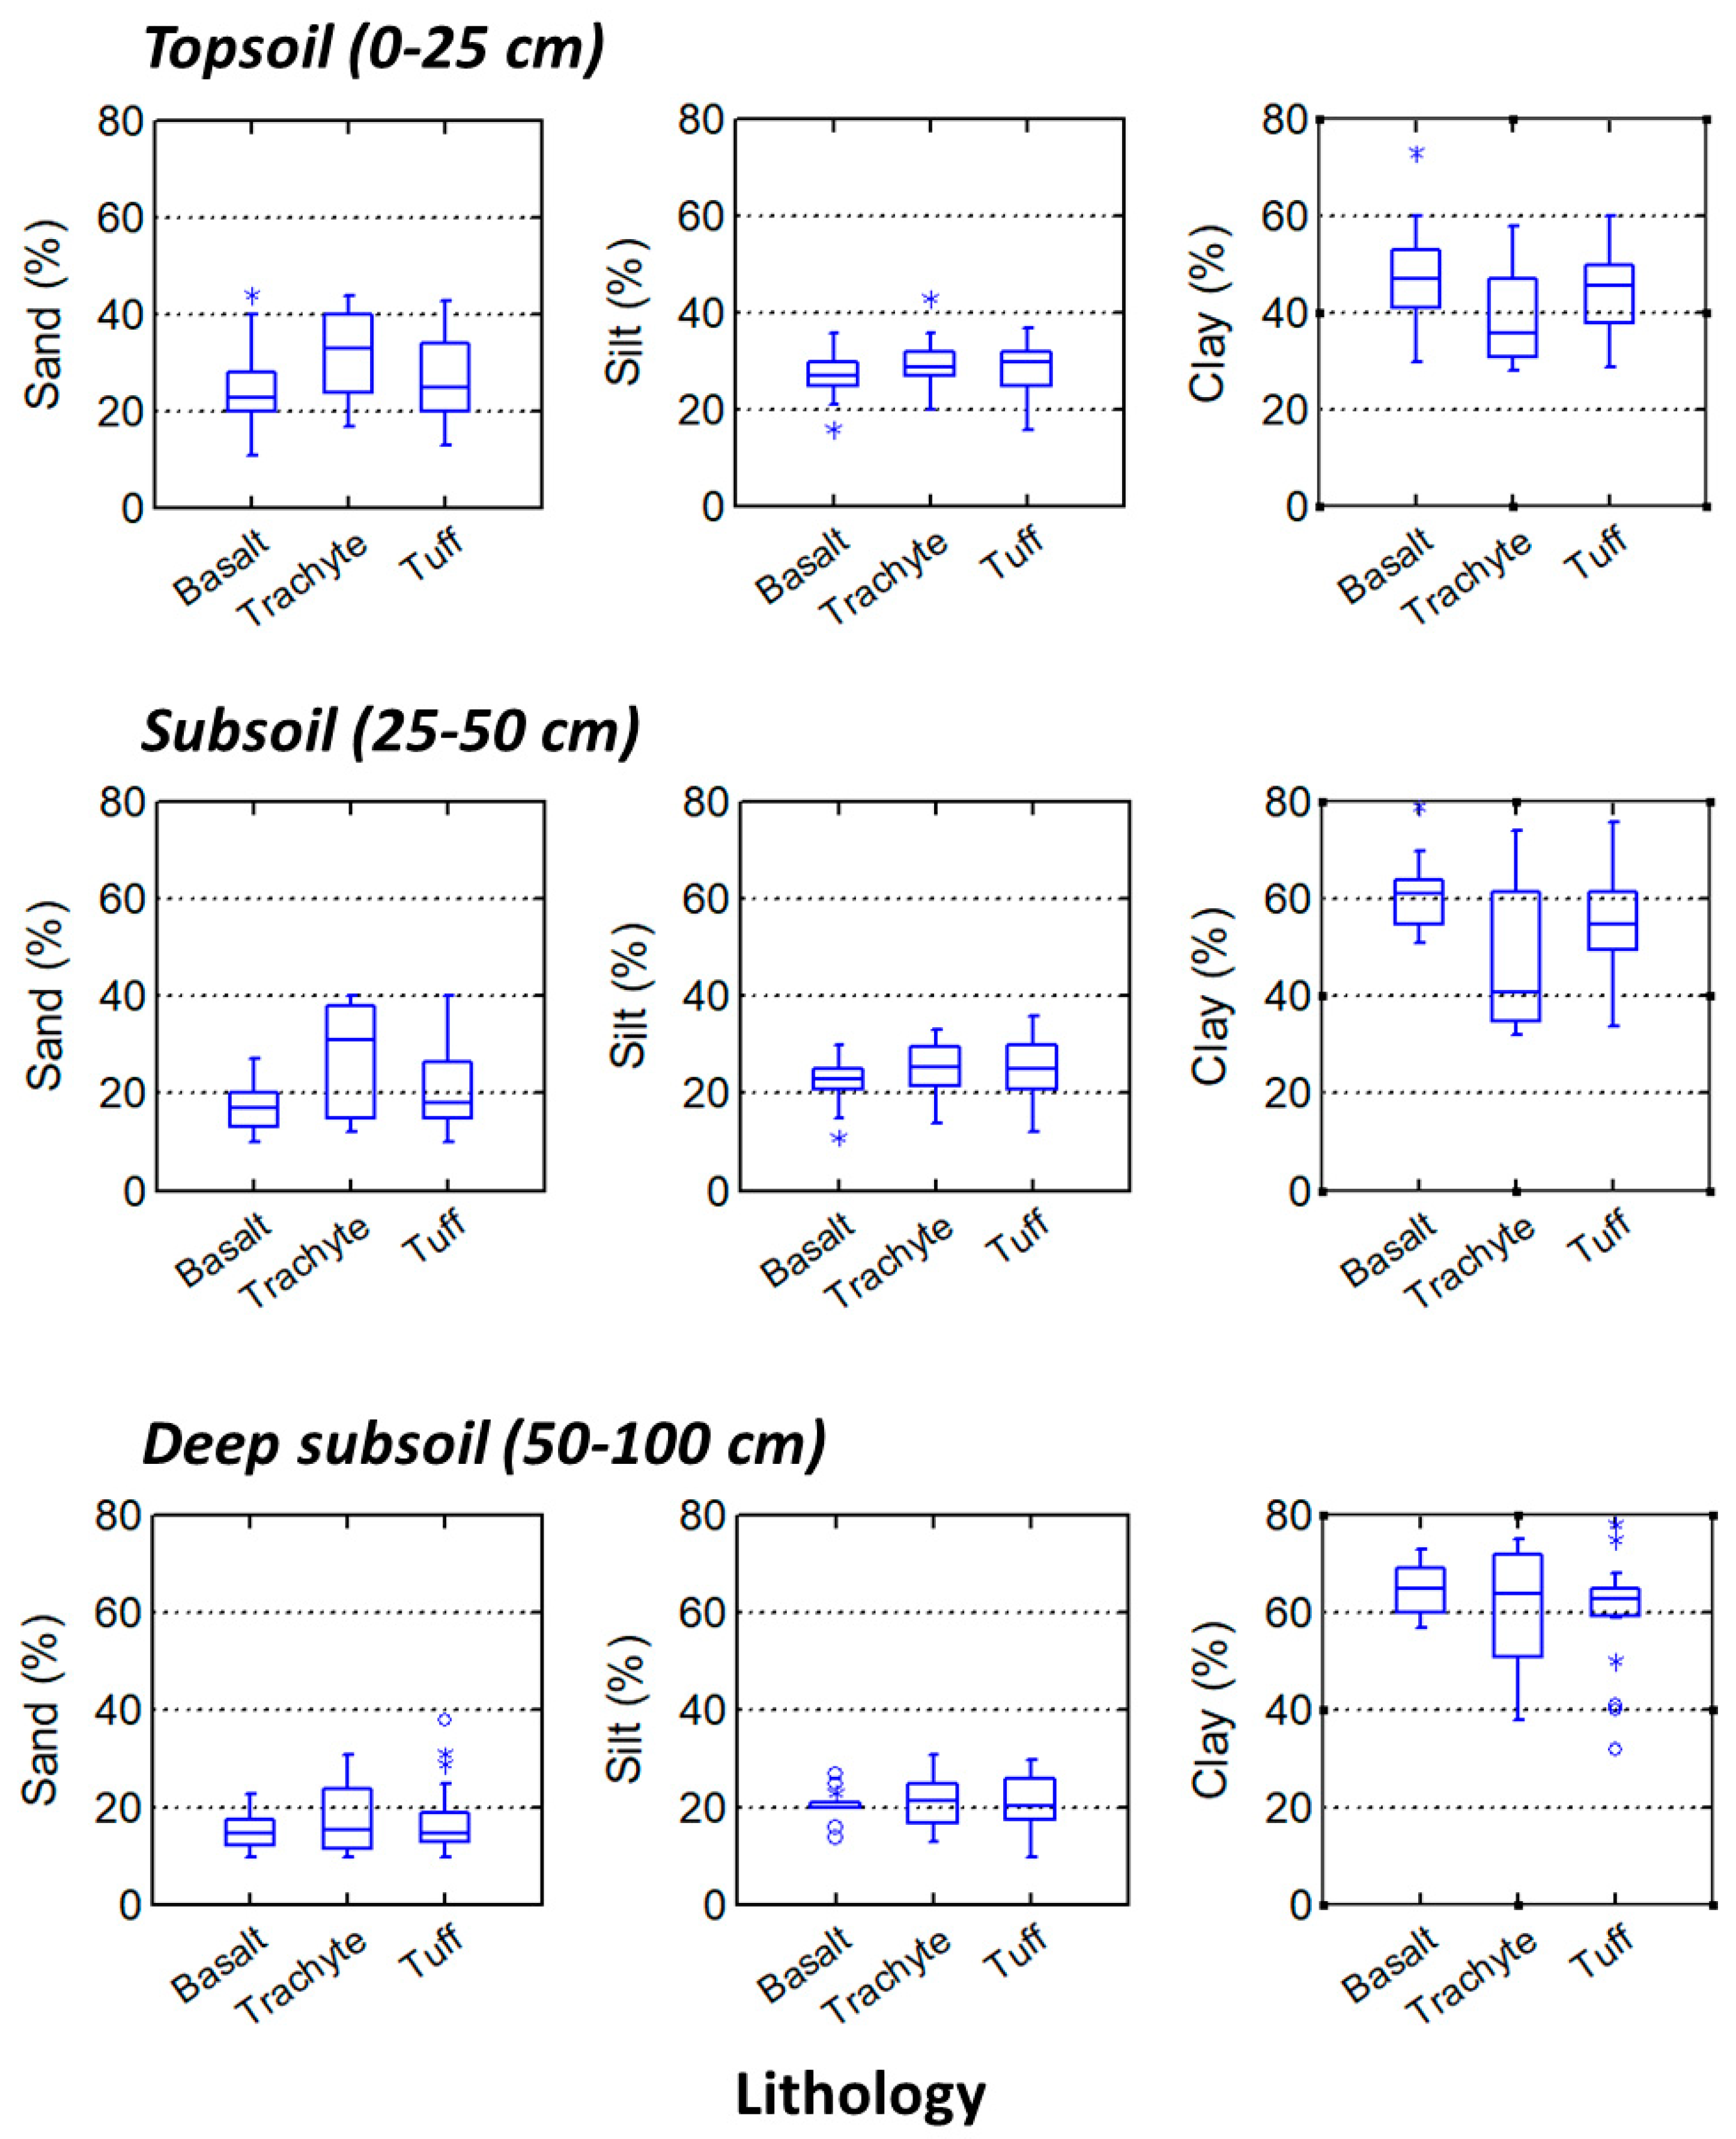
3.2. Variability in Physicochemical Characteristics along the Toposequence

The physicochemical characteristics of the soils of Mount Guna are summarized in Table 2. Soil texture exhibited distinct differences based on elevation: the sand content increased with higher elevation and consistently remained lower in the topsoil than in the subsoil. Conversely, the clay content rose from the topsoil to the subsoil, while the silt content decreased with soil depth. The soil’s bulk density was highest in the lower and mid-elevation belts and was lower near the summit. Within a soil profile, bulk density tended to increase with soil depth.
Overall, the soil pH (H2O) decreased with increasing elevation, with the topsoil horizon having lower pH values than the subsoil. Soil organic carbon content (SOC), soil organic carbon stock (SOCs), and total nitrogen (Ntotal) were higher in the high-altitudinal belt compared to lower elevations. These values were consistently higher in the topsoil and decreased with soil depth (Table 2). Overall, the C:N ratio was relatively high, but hardly changed with elevation, suggesting that there was a balance between carbon and nitrogen inputs and outputs in the soil.
In contrast to the previously soil characteristics, the mean values of Ca2+, Mg2+, CEC, and percentage BS did not change significantly with an elevation and increase only marginally with soil depth. The CEC of the clay also exhibited considerable variation but showed no clear trend in relation to elevation (Table 2). The available phosphorus content was generally relatively low and did not seem to follow a particular trend related to elevation.

3.3. Factor Analysis

Table 3 shows the factor loadings of the physicochemical characteristics. For the topsoil, factor 1 (FA-1) had high positive loadings for SOC, SOCs, and Ntotal, and high negative loadings for BD. This trend aligned with the increasing elevation and climate as soil organic matter accumulates at higher elevation, where precipitation is higher and temperature lower (Figure 4). Factor 2 reflected the parent material as it had high positive loadings for sand content and high negative loadings for clay content (Table 3). On Mount Guna, soil weathered from trachyte tends to have higher sand content than soil weathered from basalt or tuff; reciprocally, soil weathered from basalt or tuff has higher clay content (Figure 6). Silt content, on the contrary, is not related to the lithology. Factor 3 had high positive loadings for Ca2+, Mg2+, CEC, and BS values. These characteristics reflect chemical soil fertility but with no obvious link to a soil-forming factor though it may be affected by parent material and land use. Factor 4 had high negative loadings for silt and silt-to-clay ratio and moderate positive loadings for soil pH, which reflects the degree of weathering.
For the subsoil (25–50 cm), factor 1 was determined by high positive loadings for sand content, and reciprocally negative for clay content, which reflected the parent material (Figure 6) and corresponded to factor 1 of the topsoil (Table 4). Factor 2 was determined by chemical soil fertility (Ca2+, Mg2+, pH, BS, CEC, and av. P), and corresponded with factor 3 of the topsoil. Factor 3 reflected the accumulation of organic matter (SOC, N), which is higher at higher elevation, and corresponded to factor 1 of the topsoil. Factor 4 was determined by high negative loadings on Ntotal and moderate negative loadings on soil pH, and it had high positive loading for the C:N ratio.
For the deep subsoil (50–100 cm), factor 1 corresponds again to the parent material as it has high loadings for sand and clay content. Factor 2 is also related to the chemical soil fertility (Ca2+, Mg2+, and CEC). Factor 3, with high loadings for soil organic matter (SOC, Ntotal, C:N ratio) corresponds to elevation and climate. Factor 4 is determined by high positive loading for BD and moderate positive loading on pH and Ntotal contents, with no obvious link to a soil-forming factor.

3.4. Clay Mineralogy

The X-ray diffractograms of the soils which were suspected to be Andosols are illustrated for two profiles in Figure 7. The clay samples showed similar XRD patterns after the different treatments indicating that they had a similar mineralogical composition. The XRD patterns of the untreated clay fraction showed a rational series of reflections at 1.41, 0.71, 0.472, and 0.357 nm indicating a 1.4 nm spacing of phyllosilicate minerals (Figure 7). The 1.41 nm d-spacing was not significantly affected by solvation with ethylene-glycol indicating the absence of swelling 2:1 phyllosilicates (smectites) and the persistence of the 1.41 nm peak after the heating treatment; however, with some decrease in intensity, it confirmed the presence of trioctahedral chlorite. When trioctahedral chlorite was heated to temperatures as high as 500 °C, the peak intensity of the 001 reflection (1.4 nm) normally increased. The decrease in peak intensity of the 001 reflection (1.41 nm peak) in the samples was accompanied by a clear increase in intensity of the 1.0 (0.998) nm peak indicating that some 2:1 phyllosilicate layers collapsed, suggesting the presence of vermiculite besides chlorite.
Micas (rational series of reflections at 1.0 (0.998), 0.5 (0.498), and 0.334 nm) were also present in all the samples. The very weak intensity of the 002 reflection (0.5 nm) relative to the 001 reflection (1.0 nm) suggested a trioctahedral structure of the mica (biotite or phlogopite). The double peaks at 0.71 and 0.358 nm almost completely disappeared after heating the samples at 500 °C, indicating the presence of kaolinite. The double peak at 0.358 nm was the resolution of the 004 chlorite and the 002 kaolinite reflections, which can be obtained for rather well-crystallized clays. The peak at 0.447 nm was a hkl-reflection of kaolinite. Kaolinite is dehydroxylated at temperatures around and above 500 °C. The peaks at 0.426 and 0.334 nm were attributed to quartz, while the small peak at 0.325 nm indicated some minor feldspar. The diffuse broad diffraction spectrum between 20 to >30° 2θ was due to the presence of amorphous silicates (opal-A and/or pyroclastic glass).

3.5. Soil Classification and Relation with Landcover and Lithology

Following the 4th edition of the international soil classification system World Reference Base for Soil Resources [31], the soils of Mount Guna belong to the Reference Soil Groups (RSG) of the Andosols, Cambisols, Leptosols, Regosols, Luvisols, Phaeozems, and Vertisols.
The distribution of the RSG per elevation belt, lithology, and their occurrence per landcover unit is presented in Table 4. The most common RSG are the Luvisols (34 pedons), followed by Leptosols (16 pedons) and Vertisols (11 pedons). To ensure a sufficient number of observations in each category for performing the chi-square test, Cambisols, Leptosols, and Regosols were regrouped as one set of shallow or weakly developed soils, while Luvisols and Phaeozems were grouped as another set with well-developed soils.
The McNemar’s chi-square test revealed a significant association between the RSG and the elevation belts (χ2 = 0.20, df = 10, p < 0.001), as well as with the lithology (χ2 = 0.17, df = 10, p < 0.001). Similarly, a significant and even stronger association was found between the RSGs and the landcover units (χ2 = 3.63, df = 14, p < 0.003).
Andosols are predominantly found in the highest elevation belt (3500–4200 m a.s.l.) formed on trachyte. These soils are mostly under grassland and partly under cropland.
The only two pedons classified as Cambisols are found in the lower elevation belt (3000–3200 m a.s.l.) and are under cropland. The Leptosols and Regosols are mainly found in the lower and partly in the mid-elevation belt (3200–3500 m a.s.l.). The Leptosols formed on tuff can still be used for cropland, whereas the Regosols are more common under tree cover. The Regosols are predominantly formed on tuff, but some are formed on basalt and trachyte.
The Luvisols and Phaeozems occur predominantly in the lower elevation belt and are mostly used as cropland, although some are under tree cover and grassland. Vertisols are mainly in the lower elevation belt, though some still occur in the mid-elevation belt and are mainly found under cropland, with some occurring in shrubland and tree cover.
Both Silandic Andosols, characterized by a low bulk density (≤0.9 kg dm−3) and high P retention, and Vitric Andosols, distinguished by the occurrence of volcanic glass, occur. Silandic Andosols require to have oxalate extractable Al + ½ Fe value of at least 2% and a P retention capacity of at least 85%, which is the case for pedons P-71 and P-80 (Table 5). The Vitric Andosols require, besides the presence of volcanic glass in the fine earth fraction, an Al + ½ Fe oxalate extractable value of at least 0.4% and a phosphate retention of at least 25%. This is the case for the other four soil profiles suspected to be Andosols (Table 5).

4. Discussion

The SCORPAN paradigm of digital soil mapping is that spatial prediction of soil characteristics and soil classes can be made based on covariates relating to the soil-forming factors climate (C), organism (O), relief (R), parent material (P), age (A), besides prior information on soils (S), and the soil’s spatial correlation (N) [11]. Digital soil mapping at a global scale yet encounters challenges in data availability, scalability, model selection, expertise, and costs. Limited soil data in remote areas lead to incomplete or inaccurate maps [41]. By focussing on a remote and under-researched area such as Mount Guna, this study sheds light on the nature of data that are missing from such areas. The results also provide insights into the importance of these areas to the regional hydrology and their role in climate change through carbon sequestration.

4.1. Soil-Forming Factors

The soil characteristics of Mount Guna vary greatly depending on the climate, relief, parent material, and landcover. When multiple factors change, it becomes difficult to partition the importance of different factors of soil formation [42]. The factor analysis allows us to partly disentangle the intricate effect of the various soil-forming factors. Soil characteristics of the topsoil are predominantly determined by the combined effect of climate and elevation, whereas the characteristics of the subsoils are predominantly determined by the parent material (Table 3). As the climate is directly influenced by the elevation, with higher precipitation and lower temperatures at higher elevation (Figure 4), it is not possible to disentangle the combined effect of climate and topography, whereby we particularly focused on elevation. However, although the lithology of Mount Guna also varies with elevation (Figure 3), the factor analysis allows us to separate the factor parent material from elevation/climate, as it affects topsoil and subsoil characteristics differently. It has been shown that lithology can provide a powerful and easily used covariate to complement other parent material-related covariates and improve the statistical performance of digital soil models and maps [43]. As our results show that the topsoil characteristics are more influenced by the combined effect of elevation and climate, this will particularly be the case for subsoil characteristics.
The ordination of the Reference Soil Groups (RSG), based on one hand on the factor climate/elevation and on the other hand the parent material (Figure 8), reveals that Andosols are distinct from the other RSG. Although Andosols are predominantly found on the trachytes of the summital ridge of Mount Guna, it is evident that their distinctiveness is primarily linked to elevation/climate-related soil characteristics, setting them apart from the other soil groups. In terms of these two soil-forming factors, the set of Cambisols, Leptosols, and Regosols, which are soils with limited profile development that are often shallow and stony, and the set of Luvisols and Phaeozems, which are soils with pronounced soil development, seem to be principally distinct from each other in terms of topsoil characteristics. The soils of both sets of soils are predominantly formed in tuff of the lower or middle elevation belt and are extensively used for cropland (Table 4). The shallow and stony soils represent strongly eroded soils, hinting to soil erosion as a significant soil-forming factor. Following the SCORPAN paradigm, conceptually, past soil erosion can be accounted for by the time factor age [11]. Practically, in digital soil mapping, geomorphometric covariates representing, e.g., slope steepness, slope curvature, besides landcover, can be used to reflect past soil erosion [44,45]. Lastly, the Vertisols also appear as a distinct group. On Mount Guna, these soils are primarily found in the lower elevation belt formed from tuff, and where climate is warm and dry enough for developing the typical shrink and swell features. The topographic association of Andosols at higher elevation and Vertisols at lower elevation is commonly found in volcanic regions [46].

4.2. Implication for the Hydrology

Taking hydropedological characteristics into account has been shown to improve the modelling accuracy in Afromontane catchments [47,48]. The soil characteristics typically taken into account in hydrological modelling include soil texture, soil structure, soil organic matter, soil water retention, soil depth, and hydraulic conductivity. Although a hydropedological characterisation of the soils of Mount Guna was beyond the scope of the current research, our findings allow us to reflect on the implication of the soils’ characteristics on the hydrology.
In the highest elevation belt, on the summital ridge, soils are relatively deep. Andosols, which are the dominant Reference Soil Group (RSG) here, are known for their high porosity, high water-holding capacity, and high hydraulic conductivity [46,49]. Given the high precipitation in this area, these soils should be expected to play a key role in groundwater storage and recharge. The soil hydraulic properties of Andosols are however prone to deterioration when used for cultivation or livestock grazing [50,51], and therefore should be protected.
The shallow and stony soils, predominantly found in the mid-elevation belt, should be expected to have a low water-holding capacity, and where slopes are steeper, substantial sources for runoff generation. As these soils are already strongly affected by erosion, soil conservation measures should be promoted there. However, there are concerns about the potential adverse effects resulting from efforts to increase infiltration rates on steep slopes without simultaneously addressing the consequences of saturation excess overland flow development in lower-lying foot-slope positions [52]. Inappropriate land management interventions, especially in Vertisol areas, have been shown to dramatically increase gully erosion [53,54]. This research also supports previous claims that more emphasis should be placed on understanding the variability of soil properties with soil depth, and the influence this has on catchment hydrology [55].

4.3. Potential for Soil Carbon Sequestration

Soil possesses significant carbon sequestration potential, particularly in permafrost areas and soils under grassland, such as Chernozems and Kastanozems [56]. Recent studies have emphasized past depletions from the soil organic carbon pool and have indicated a heightened risk of accelerated future losses in response to a warming climate [57]. A recent literature review of the Andes region has shed light on the high potential of tropical high-elevation areas as both a carbon sink and a carbon source [58]. The paucity of soil data for the high-elevation areas of Africa, does not permit a comparable assessment. Soils of Mount Guna harbour in the topsoil 8.1 to 11 kg C m−2, and 29.2 to 31.9 kg C m−2 in the upper meter (Table 2). For the Afroalpine vegetation belt of the Abune Yosef Mountains, a high-elevation mountain to the north-east of Mount Guna (Figure 1), 8.0 kg C m−2 was reported for the topsoil [59]. For Mount Kilimanjaro in Tanzania, maximum soil organic carbon stocks in the upper meter have been reported in the range of 94.9 to 142.6 kg m−2 [18].
The values both from Mount Guna and from the Abune Yosef Mountains are lower than those reported for Mount Kilimanjaro but are comparable to SOC stocks reported for Andosols in Hawaii ranging between 30.9 and 62.5 kg C m−2 [60]. These findings emphasize the global significance of high-elevation tropical areas for soil organic carbon sequestration. However, they also indicate the need for further research in these regions.

5. Conclusions

This study, focusing on a remote area, addressed the challenge of data scarcity in global-scale digital soil mapping. By confirming the presence of Andosols in high-elevation areas of Ethiopia, the study filled a gap in existing soil maps for the region. It identified climate/elevation and parent material as key factors influencing the distribution of Reference Soil Groups. Although not explicitly expressed by the factor analysis, a significant association was also found between the Reference Soil Groups and landcover units, reflecting the soil-forming factor of organisms. Soil erosion also emerged as an important soil-forming process, conceptually only accounted for in the SCORPAN paradigm by age.
The results provide insights into the importance of high-elevation areas for regional hydrology, particularly emphasizing the role of Andosols in water storage and groundwater recharge. Furthermore, the data of Mount Guna hint at the importance of high-elevation areas along the East African Rift valley for carbon sequestration.

Author Contributions

Conceptualization, M.G.S. and S.D.; methodology, M.G.S., S.D. and A.R.T.; software, M.G.S. and S.D.; validation, M.G.S., S.D., J.N. and E.A.T.; formal analysis, M.G.S., S.D. and E.V.R.; investigation, M.G.S., S.D. and E.A.T.; resources, M.G.S. and E.A.T.; data curation, M.G.S. and S.D.; writing—original draft preparation, M.G.S.; writing—review and editing, E.A.T., S.D. and M.G.S.; visualization, M.G.S.; supervision, E.A.T., A.R.T. and S.D.; project administration, M.G.S., E.A.T., S.D. and A.F.; funding acquisition, M.G.S., E.A.T., S.D. and A.F. All authors have read and agreed to the published version of the manuscript.

Funding

This work received supported from Amhara Design and Supervision Works Enterprise and Bahir Dar University College of Agriculture and Environmental Science. Additionally, the lead author benefited from a Global Minds Short Research Stays grant at Ghent University.

Institutional Review Board Statement

Not applicable.

Informed Consent Statement

Not applicable.

Data Availability Statement

On request, the data will be provided.

Acknowledgments

The author would like to thank Amhara Design and Supervision Works Enterprise for their financial assistance and for allowing me to continue my PhD study as well as Bahir Dar University college of Agriculture and Environmental Science for financial and logistical assistance.

Conflicts of Interest

The authors declare no conflicts of interest.

References

  1. Beniston, M. Climatic Change in Mountain Regions: A Review of Possible Impacts. In Climate Variability and Change in High Elevation Regions: Past, Present & Future; Diaz, H.F., Ed.; Advances in Global Change Research; Springer: Dordrecht, The Netherlands, 2003; Volume 15, pp. 5–31. ISBN 978-90-481-6322-9. [Google Scholar]
  2. Buytaert, W.; Cuesta-Camacho, F.; Tobón, C. Potential Impacts of Climate Change on the Environmental Services of Humid Tropical Alpine Regions. Glob. Ecol. Biogeogr. 2011, 20, 19–33. [Google Scholar] [CrossRef]
  3. Marta, S.; Zimmer, A.; Caccianiga, M.; Gobbi, M.; Ambrosini, R.; Azzoni, R.S.; Gili, F.; Pittino, F.; Thuiller, W.; Provenzale, A.; et al. Heterogeneous Changes of Soil Microclimate in High Mountains and Glacier Forelands. Nat. Commun. 2023, 14, 5306. [Google Scholar] [CrossRef]
  4. Rogora, M.; Frate, L.; Carranza, M.L.; Freppaz, M.; Stanisci, A.; Bertani, I.; Bottarin, R.; Brambilla, A.; Canullo, R.; Carbognani, M.; et al. Assessment of Climate Change Effects on Mountain Ecosystems through a Cross-Site Analysis in the Alps and Apennines. Sci. Total Environ. 2018, 624, 1429–1442. [Google Scholar] [CrossRef]
  5. Zhang, L.; Wang, Y.; Chen, J.; Feng, L.; Li, F.; Yu, L. Characteristics and Drivers of Soil Organic Carbon Saturation Deficit in Karst Forests of China. Diversity 2022, 14, 62. [Google Scholar] [CrossRef]
  6. Nissan, A.; Alcolombri, U.; Peleg, N.; Galili, N.; Jimenez-Martinez, J.; Molnar, P.; Holzner, M. Global Warming Accelerates Soil Heterotrophic Respiration. Nat. Commun. 2023, 14, 3452. [Google Scholar] [CrossRef]
  7. Zhang, Z.; Li, Y.; Williams, R.A.; Chen, Y.; Peng, R.; Liu, X.; Qi, Y.; Wang, Z. Responses of Soil Respiration and Its Sensitivities to Temperature and Precipitation: A Meta-Analysis. Ecol. Inform. 2023, 75, 102057. [Google Scholar] [CrossRef]
  8. Grunwald, S.; Thompson, J.; Boettinger, J. Digital Soil Mapping and Modeling at Continental Scales: Finding Solutions for Global Issues. Soil Sci. Soc. Am. J. 2011, 75, 1201–1213. [Google Scholar] [CrossRef]
  9. Rusakova, E.; Sukhacheva, E.; Hartemink, A.E. Vasiliy Dokuchaev–A Biographical Sketch on the Occasion of His 175th Birthday. Geoderma 2022, 412, 115718. [Google Scholar] [CrossRef]
  10. Jenny, H. Factors of Soil Formation: A System of Quantitative Pedology; Unabridged Dover edition 1994; Dover Publications: New York, NY, USA, 1941; ISBN 978-0-486-68128-3. [Google Scholar]
  11. McBratney, A.B.; Mendonça Santos, M.L.; Minasny, B. On Digital Soil Mapping. Geoderma 2003, 117, 3–52. [Google Scholar] [CrossRef]
  12. Leenaars, J.G.B.; van Oostrum, A.J.M.; Ruiperez Gonzalez, M. Africa Soil Profiles Database, Version 1.2. A Compilation of Georeferenced and Standardised Legacy Soil Profile Data for Sub-Saharan Africa (with Dataset); ISRIC-World Soil Information: Wageningen, The Netherlands, 2014. [Google Scholar]
  13. Frei, E. Andepts in Some High Mountains of East Africa. Geoderma 1978, 21, 119–131. [Google Scholar] [CrossRef]
  14. Assen, M.; Tegene, B. Characteristics and Classification of the Soils of the Plateau of SIMEN Mountains National Park (Smnp), Ethiopia. SEJS 2011, 31, 89–102. [Google Scholar] [CrossRef]
  15. Speck, H. Soils of the Mount Kenya Area: Their Formation, Ecological, and Agricultural Significance. Mt. Res. Dev. 1982, 2, 201. [Google Scholar] [CrossRef]
  16. Wielemaker, W.G.; Wakatsuki, T. Properties, Weathering and Classification of Some Soils Formed in Peralkaline Volcanic Ash in Kenya. Geoderma 1984, 32, 21–44. [Google Scholar] [CrossRef]
  17. Wesche, K. The High-Altitude Environment of Mt Elgon (Uganda, Kenya): Climate, Vegetation and the Impact of Fire; Ecotropical monographs; Society for Tropical Ecology: Bonn, Germany, 2002; ISBN 3-98007780-1-0. [Google Scholar]
  18. Zech, M.; Hörold, C.; Leiber-Sauheitl, K.; Kühnel, A.; Hemp, A.; Zech, W. Buried Black Soils on the Slopes of Mt. Kilimanjaro as a Regional Carbon Storage Hotspot. Catena 2014, 112, 125–130. [Google Scholar] [CrossRef]
  19. Zech, M.; Leiber, K.; Zech, W.; Poetsch, T.; Hemp, A. Late Quaternary Soil Genesis and Vegetation History on the Northern Slopes of Mt. Kilimanjaro, East Africa. Quat. Int. 2011, 243, 327–336. [Google Scholar] [CrossRef]
  20. Mizota, C.; Chapelle, J. Characterization of Some Andepts and Andic Soils in Rwanda, Central Africa. Geoderma 1988, 41, 193–209. [Google Scholar] [CrossRef]
  21. Dondeyne, S.; Deckers, S.; Chapelle, J. The Soils and the Vegetation of the Bisoke Volcano (Rwanda): Habitat of Mountain Gorillas. Pedologie 1993, 43, 301–322. [Google Scholar]
  22. Danielson, J.J.; Gesch, D.B. Global Multi-Resolution Terrain Elevation Data 2010 (GMTED2010); U.S. Geological Survey Open-File Report; US Geological Survey: Reston, VA, USA, 2011; Open-File report 2011-1073; p. 26. [Google Scholar]
  23. Nachtergaele, F.; van Velthuizen, H.; Verelst, L.; Wiberg, D.; Henry, M.; Chiozza, F.; Yigini, Y. (Eds.) Harmonized World Soil Database Version 2.0; FAO: Rome, Italy; International Institute for Applied Systems Analysis (IIASA): Laxenburg, Austria, 2023; ISBN 978-92-5-137499-3. [Google Scholar]
  24. Astuti, A.J.D.; Annys, S.; Dessie, M.; Nyssen, J.; Dondeyne, S. To What Extent Is Hydrologic Connectivity Taken into Account in Catchment Studies in the Lake Tana Basin, Ethiopia? A Review. Land 2022, 11, 2165. [Google Scholar] [CrossRef]
  25. Poppe, L.; Frankl, A.; Poesen, J.; Admasu, T.; Dessie, M.; Adgo, E.; Deckers, J.; Nyssen, J. Geomorphology of the Lake Tana Basin, Ethiopia. J. Maps 2013, 9, 431–437. [Google Scholar] [CrossRef]
  26. Yenehun, A.; Dessie, M.; Azeze, M.; Nigate, F.; Belay, A.S.; Nyssen, J.; Adgo, E.; Van Griensven, A.; Van Camp, M.; Walraevens, K. Water Resources Studies in Headwaters of the Blue Nile Basin: A Review with Emphasis on Lake Water Balance and Hydrogeological Characterization. Water 2021, 13, 1469. [Google Scholar] [CrossRef]
  27. Haro, W.; Hailemariam, D.; Getachew, I.; Kassahun, T.; Ashenafi, S.; Burisa, G.; Edris, M. Geology, Geochemistry and Gravity Survey of the Debre Tabor Area; Basic Geoscience Mapping Core Process; Geological Survey of Ethiopia, Ministry of Mines: Addis Ababa, Ethiopia, 2010; p. vii + 77. [Google Scholar]
  28. Fick, S.E.; Hijmans, R.J. WorldClim 2: New 1-km Spatial Resolution Climate Surfaces for Global Land Areas. Int. J. Clim. 2017, 37, 4302–4315. [Google Scholar] [CrossRef]
  29. Zanaga, D.; Van De Kerchove, R.; Daems, D.; De Keersmaecker, W.; Brockmann, C.; Kirches, G.; Wevers, J.; Cartus, O.; Santoro, M.; Fritz, S.; et al. ESA WorldCover 10 m 2021 v200. 2022. Available online: https://esa-worldcover.org/en/data-access (accessed on 15 November 2023). [CrossRef]
  30. FAO. Guidelines for Soil Description, 4th ed.; Food and Agriculture Organization of the United Nations: Rome, Italy, 2006; ISBN 978-92-5-105521-2. [Google Scholar]
  31. IUSS Working Group WRB World Reference Base for Soil Resources. International Soil Classification System for Naming Soils and Creating Legends for Soil Maps, 4th ed.; International Union of Soil Sciences (IUSS): Vienna, Austria, 2022; ISBN 979-8-9862451-1-9. [Google Scholar]
  32. van Reeuwijk, L.P. Procedures for Soil Analysis, 6th ed.; International Soil Reference and Information Centre: Wageningen, The Netherlands, 2002. [Google Scholar]
  33. Siregar, A.; Kleber, M.; Mikutta, R.; Jahn, R. Sodium Hypochlorite Oxidation Reduces Soil Organic Matter Concentrations without Affecting Inorganic Soil Constituents. Eur. J. Soil Sci. 2005, 56, 481–490. [Google Scholar] [CrossRef]
  34. Downs, R.T.; Hall-Wallace, M. The American Mineralogist Crystal Structure Database. Am. Mineral. 2003, 88, 247–250. [Google Scholar]
  35. Gražulis, S.; Daškevič, A.; Merkys, A.; Chateigner, D.; Lutterotti, L.; Quirós, M.; Serebryanaya, N.R.; Moeck, P.; Downs, R.T.; Le Bail, A. Crystallography Open Database (COD): An Open-Access Collection of Crystal Structures and Platform for World-Wide Collaboration. Nucleic Acids Res. 2012, 40, D420–D427. [Google Scholar] [CrossRef] [PubMed]
  36. Gražulis, S.; Chateigner, D.; Downs, R.T.; Yokochi, A.F.T.; Quirós, M.; Lutterotti, L.; Manakova, E.; Butkus, J.; Moeck, P.; Le Bail, A. Crystallography Open Database–an Open-Access Collection of Crystal Structures. J. Appl. Crystallogr. 2009, 42, 726–729. [Google Scholar] [CrossRef] [PubMed]
  37. IBM Corp. Released IBM SPSS Statistics for Windows, Version 26.0; IBM Corp: Armonk, NY, USA, 2019. [Google Scholar]
  38. Kaiser, H.F. The Varimax Criterion for Analytic Rotation in Factor Analysis. Psychometrika 1958, 23, 187–200. [Google Scholar] [CrossRef]
  39. Abdi, H. Factor Rotations in Factor Analyses. In Encyclopedia of Social Sciences Research Methods; Sage: Thousand Oaks, CA, USA, 2004; Volume 8. [Google Scholar]
  40. McNemar, Q. Note on the Sampling Error of the Difference between Correlated Proportions or Percentages. Psychometrika 1947, 12, 153–157. [Google Scholar] [CrossRef] [PubMed]
  41. Arrouays, D.; Lagacherie, P.; Hartemink, A.E. Digital Soil Mapping across the Globe. Geoderma Reg. 2017, 9, 1–4. [Google Scholar] [CrossRef]
  42. Eger, A.; Koele, N.; Caspari, T.; Poggio, M.; Kumar, K.; Burge, O.R. Quantifying the Importance of Soil-Forming Factors Using Multivariate Soil Data at Landscape Scale. JGR Earth Surf. 2021, 126, e2021JF006198. [Google Scholar] [CrossRef]
  43. Gray, J.M.; Bishop, T.F.A.; Wilford, J.R. Lithology and Soil Relationships for Soil Modelling and Mapping. Catena 2016, 147, 429–440. [Google Scholar] [CrossRef]
  44. Amundson, R. Factors of Soil Formation in the 21st Century. Geoderma 2021, 391, 114960. [Google Scholar] [CrossRef]
  45. Wilson, J.P. Digital Terrain Modeling. Geomorphology 2012, 137, 107–121. [Google Scholar] [CrossRef]
  46. Driessen, P.M.; Deckers, J.; Spaargaren, O. (Eds.) Lecture Notes on the Major Soils of the World; World Soil Resources Reports; Food and Agriculture Organization of the United Nations: Rome, Italy, 2001; ISBN 978-92-5-104637-1. [Google Scholar]
  47. Harrison, R.; Van Tol, J.; Amiotte Suchet, P. Hydropedological Characteristics of the Cathedral Peak Research Catchments. Hydrology 2022, 9, 189. [Google Scholar] [CrossRef]
  48. Harrison, R.; Van Tol, J.; Toucher, M.L. Using Hydropedological Characteristics to Improve Modelling Accuracy in Afromontane Catchments. J. Hydrol. Reg. Stud. 2022, 39, 100986. [Google Scholar] [CrossRef]
  49. Zech, W.; Schad, P.; Hintermaier-Erhard, G. Soils of the World; Springer: Berlin/Heidelberg, Germany, 2022; ISBN 978-3-540-30460-9. [Google Scholar]
  50. Kironchi, G.; Mbuvi, J.; Gichuki, F. Hydraulic Properties of Andosols Following Deforestation in the Northern Slopes of Mt. Kenya. East Afr. Agric. For. J. 1999, 65, 115–124. [Google Scholar] [CrossRef]
  51. Rodríguez Rodríguez, A.; Guerra, J.A.; Gorrín, S.P.; Arbelo, C.D.; Mora, J.L. Aggregates Stability and Water Erosion in Andosols of the Canary Islands. Land Degrad. Dev. 2002, 13, 515–523. [Google Scholar] [CrossRef]
  52. Tebebu, T.Y.; Abiy, A.Z.; Zegeye, A.D.; Dahlke, H.E.; Easton, Z.M.; Tilahun, S.A.; Collick, A.S.; Kidnau, S.; Moges, S.; Dadgari, F.; et al. Surface and Subsurface Flow Effect on Permanent Gully Formation and Upland Erosion near Lake Tana in the Northern Highlands of Ethiopia. Hydrol. Earth Syst. Sci. 2010, 14, 2207–2217. [Google Scholar] [CrossRef]
  53. Fenta, H.M.; Aynalem, D.W.; Malmquist, L.; Haileslassie, A.; Tilahun, S.A.; Barron, J.; Adem, A.A.; Adimassu, Z.; Zimale, F.A.; Steenhuis, T.S. A Critical Analysis of Soil (and Water) Conservation Practices in the Ethiopian Highlands: Implications for Future Research and Modeling. CATENA 2024, 234, 107539. [Google Scholar] [CrossRef]
  54. Frankl, A.; Nyssen, J.; Adgo, E.; Wassie, A.; Scull, P. Can Woody Vegetation in Valley Bottoms Protect from Gully Erosion? Insights Using Remote Sensing Data (1938–2016) from Subhumid NW Ethiopia. Reg. Environ. Chang. 2019, 19, 2055–2068. [Google Scholar] [CrossRef]
  55. Weldegebriel, L.; Thompson, S.; Tilahun, S.; Dietrich, W.; Assouline, S.; Nyssen, J. Organization of the Soil Profile Controls the Risks of Runoff in the Humid Ethiopian Highlands. J. Hydrol. 2023, 617, 129031. [Google Scholar] [CrossRef]
  56. Dondeyne, S.; Mantel, S.; Deckers, S. Factors of Soil Formation: Climate. In Encyclopedia of Soils in the Environment; Elsevier: Amsterdam, The Netherlands, 2023; Volume 4, pp. 14–24. ISBN 978-0-12-409548-9. [Google Scholar]
  57. Bossio, D.A.; Cook-Patton, S.C.; Ellis, P.W.; Fargione, J.; Sanderman, J.; Smith, P.; Wood, S.; Zomer, R.J.; von Unger, M.; Emmer, I.M.; et al. The Role of Soil Carbon in Natural Climate Solutions. Nat. Sustain. 2020, 3, 391–398. [Google Scholar] [CrossRef]
  58. Alavi-Murillo, G.; Diels, J.; Gilles, J.; Willems, P. Soil Organic Carbon in Andean High-Mountain Ecosystems: Importance, Challenges, and Opportunities for Carbon Sequestration. Reg. Environ. Chang. 2022, 22, 128. [Google Scholar] [CrossRef]
  59. Gebrehiwot, K.; Desalegn, T.; Woldu, Z.; Demissew, S.; Teferi, E. Soil Organic Carbon Stock in Abune Yosef Afroalpine and Sub-Afroalpine Vegetation, Northern Ethiopia. Ecol. Process. 2018, 7, 6. [Google Scholar] [CrossRef]
  60. Schuur, E.A.G.; Chadwick, O.A.; Matson, P.A. Carbon Cycling and Soil Carbon Storage in Mesic to Wet Hawaiian Montane Forests. Ecology 2001, 82, 3182–3196. [Google Scholar] [CrossRef]
Figure 2. Topography and main geomorphologic features of Mount Guna (authors’ cartography based on 30 m resolution SRTM data—https://earthexplorer.usgs.gov/, accessed on 6 February 2018).
Soilsystems 08 00038 g002
Figure 3. Lithological units and location of the 85 pedons on Mount Guna (authors’ cartography based on the Geology, Geochemistry and Gravity Survey of the Debre Tabor Area [27]).
Soilsystems 08 00038 g003
Figure 4. Average annual and monthly rainfall and temperature of Mount Guna for the years 1970–2000 (authors’ cartography based on WorldClim 2 data [28]).
Soilsystems 08 00038 g004
Figure 5. Landcover map of Mount Guna (authors’ cartography based on ESA WorldCover 10 m 2021 [29]).
Soilsystems 08 00038 g005
Figure 6. Box plots showing the variation in the soil texture at different depths in relation to the lithology of 85 pedons of Mount Guna.
Soilsystems 08 00038 g006
Figure 7. XRD patterns of the oriented clay fraction in the topsoil (a,b) and subsoil (c,d) of two suspected Andosols profiles (P71 and P73) reveal the presence of weatherable minerals, including trioctahedral chlorite, vermiculite, micas (biotite or phlogopite), and feldspar, alongside quartz and kaolinite. Additionally, amorphous silicates such as opal-A and/or pyroclastic glass are observed.
Soilsystems 08 00038 g007
Figure 8. Ordination of the Reference Soil Groups of Mount Guna according to the soil-forming factors elevation/climate and parent material, based on a factor analysis of the physicochemical characteristics of the topsoil, subsoil, and deep subsoil of 85 pedons. The confidence ellipsoids (p = 0.683) are also indicated. Legend: Andosols (AN), soils with noncrystalline minerals of volcanic origin; Cambisols (CM), Leptosols, and Regosols (RG), soils with limited depth or profile development. Luvisols (LV) and Phaeozems (PH), soils with pronounced soil development. Vertisols (VR), soils with shrink-swell clay minerals.
Soilsystems 08 00038 g008
Table 2. Summary statistics of the physicochemical characteristics (mean ± SD) of 85 soil profiles along seven topographic transects of Mount Guna, Ethiopia.
Elevation
(m a.s.l.)
nDepth
(cm)
Sand
(%)
Silt
(%)
Clay
(%)
Silt: ClayBD
(g cm−3)
SOC
(%)
SOCs
(kg C m−2)
Ntotal (%)C:NColour
3000–3200550–2525.4 ± 9.128.6 ± 4.445.6 ± 8.60.7 ± 0.21.2 ± 0.12.8 ± 0.78.4 ± 1.60.21 ± 0.0714.1 ± 2.610YR3/1 to 10YR2/1
4125–5018.6 ± 6.523.8 ± 5.957.8 ± 9.20.4 ± 0.21.2 ± 0.12.6 ± 0.58.0 ± 1.50.16 ± 0.0517.1 ± 4.110YR4/1 to 10YR3/2
3650–10015.9 ± 5.520.4 ± 4.664.2 ± 8.50.3 ± 0.11.3 ± 0.12.0 ± 0.512.9 ± 3.40.12 ± 0.0417.8 ± 0.510YR4/2
3200–3500200–2528.6 ± 8.726.8 ± 5.344.2 ± 9.30.6 ± 0.21.2± 0.12.7 ± 0.68.2 ± 1.70.20 ± 0.0514.1 ± 2.57.5YR3/3 to 10YR3/1
1425–5020.6 ± 6.522.6 ± 6.556.6 ± 10.90.4 ± 0.21.3 ± 0.12.5 ± 0.67.9 ± 1.70.15 ± 0.0316.4 ± 3.010YR4/3 to 10YR4/4
1250–10017.9 ± 6.821.2 ± 5.660.8 ± 11.20.5 ± 0.21.3 ± 0.12.1 ± 0.513.9 ± 3.10.11 ± 0.0218.8 ± 3.95YR3/2
3500–4200100–2532.9 ± 8.930.3 ± 5.136.8 ± 9.20.9 ± 0.20.9 ± 0.34.9 ± 1.710.3 ± 3.00.42 ± 0.1612.2 ± 1.010YR2/1
1025–5029.4 ± 11.026.3 ± 5.644.3 ± 14.80.7 ± 0.31.0 ± 0.23.3 ± 1.28.2 ± 2.30.21 ± 0.0516.2 ± 4.910YR5/4
450–10018.5 ± 8.622.5 ± 7.659.0 ± 15.40.4 ± 0.31.2 ± 0.12.1 ± 0.612.7 ± 4.10.11 ± 0.0118.4 ± 4.410YR8/1
pH
H2O
CaMgKNaCECCEC ClayBS
(%)
Av. P
(mg/kg)
(cmolc/kg)
3000–3200550–255.6 ± 0.610.7 ± 1.42.8 ± 0.80.6 ± 0.40.2 ± 0.225.7 ± 1.836.5 ± 955.6 ± 5.05.1 ± 1.6
4125–505.9 ± 0.611.8 ± 1.43.4 ± 0.80.6 ± 0.30.3 ± 0.227.1 ± 1.537.8 ± 959.0 ± 5.34.8 ± 1.4
3650–1006.1 ± 0.512.6 ± 1.53.7 ± 0.80.6 ± 0.40.3 ± 0.227.9 ± 1.721.5 ± 1261.6 ± 5.83.8 ± 1.3
3200–3500200–255.8 ± 0.510.6± 0.93.0 ± 0.90.7 ± 0.30.3 ± 0.225.3 ± 1.732.2 ± 657.5 ± 5.84.6 ± 1.5
1425–506.0 ± 0.511.7 ± 1.23.6 ± 1.00.7 ± 0.30.3 ± 0.226.7 ± 2.233.1 ± 8.60.7 ± 6.14.3 ± 1.1
1250–1006.3 ± 0.512.5 ± 1.43.8 ± 1.20.6 ± 0.30.3 ± 0.327.5 ± 2.535.4 ± 1162.7 ± 5.93.2 ± 1.0
3500–4200100–255.3 ± 0.410.3 ± 0.82.7 ± 0.70.7 ± 0.30.3 ± 0.325.5 ± 1.633.5 ± 855.0 ± 3.95.3 ± 0.8
1025–505.7 ± 0.311.2 ± 1.03.5 ± 1.30.6 ± 0.40.3 ± 0.326.3 ± 1.734.2 ± 859.5 ± 6.14.2 ± 0.8
450–1006.1 ± 0.512.4 ± 1.03.9 ± 0.80.4 ± 0.20.2 ± 0.227.7 ± 0.936.2 ± 960.8 ± 4.13.7 ± 0.7
Table 3. Factor loadings on the first four axes (FA) after VARIMAX rotation, of the topsoil (0–25 cm), subsoil (25–50 cm), and deep subsoil (50–100 cm) characteristics in 85 pedons of Mount Guna. Only loadings with an absolute value greater than 0.4 are presented.
Characteristics0–25 cm25–50 cm50–100 cm
FA-1FA-2FA-3FA-4FA-1FA-2FA-3FA-4FA-1FA-2FA-3FA-4
Sand (%)-0.86--0.86---0.86---
Silt (%)---−0.890.74---0.84---
Clay (%)-−0.82-0.45−0.96---−0.98---
Silt/clay ratio-0.58-−0.760.92---0.96---
f(BD) (g/cm3)−0.62--0.47−0.71------0.41
pH H2O---0.55-0.45-−0.52---0.60
Ca2+ (cmolc/kg)--0.81--0.84---0.90--
Mg2+ (cmolc/kg)--0.79--0.73---0.85--
K+ (cmolc/kg)-0.47--0.44-------
f(Na+) (cmolc/kg)-0.54--0.60------0.46
CEC (cmolc/kg)--0.56--0.53---0.63--
f(BS) (%)--0.82--0.84---0.75--
f(SOC) (%)/SOC 10.90-----0.96---0.96-
f(Ntotal (%))0.96-----0.56−0.77 0.420.71
f(C:N)/C:N 1−0.54------0.91 0.76−0.46
av. P (mg/kg)0.47−0.58---0.46--
f(SOCs)/SOCs 1
(t C m−2)
0.81-----0.88- 0.96
Total var. (%)20.616.815.312.926.417.113.511.021.718.116.89.9
Cum var. (%)23.637.452.865.626.443.556.967.921.739.756.566.4
Note: Transformations applied as f(BD) = BD10; f(Na+) = sqrt(Na+); f(BS) = log(BS); f(Ntotal) = log(Ntotal); f(C:N) = sqrt(log(C:N)); f(SOCs) = log(SOCs); 1 transformation for SOC, C:N, and SOCs of the deep subsoil was not needed; the units are of the not-transformed data.
Table 4. Association between Reference Soil Groups (RSG), elevation belts, lithology, and landcover units based on 85 pedons of Mount Guna.
Elevation (m a.s.l.)Lithology
RSG\
Landcover
n3000–32003200–35003500–4200BasaltTrachyteTuff
Andosols
Cropland3-12-3-
Grassland5--5-5-
Shrubland1--1-1-
Tree cover11--1--
Subtotal10118190
Cambisols 1
Cropland22--1-1
Leptosols 1
Cropland1385--112
Tree cover33--1-2
Subtotal1611501114
Regosols 1
Cropland11--1--
Tree cover743 1-6
Subtotal853 206
Luvisols 2
Cropland2318413218
Grassland4112-13
Shrubland11----1
Tree cover651--15
Subtotal3425633427
Phaeozems 2
Cropland22----2
Grassland2 11-11
Subtotal4211-13
Vertisols
Cropland853---8
Shrubland11----1
Tree cover211---2
Subtotal117400011
Grand Total8553201281562
1 Set of RSG with shallow or weakly developed soils; 2 set of RSG with well-developed soils.
Table 5. Acid oxalate extractable Al and Fe values, and P fixation capacity of topsoil horizons six Andosols of Mount Guna.
Soil Unit 1ProfileDepth
(cm)
Acid Oxalate Extractable (%)P Retention
Capacity (%)
Alox + 1/2 Feox
(%)
AlFe
AN-snP-710–251.711.05882.24
25–501.871.19932.47
P-800–251.321.43892.04
25–501.431.51912.19
AN-viP-590–250.371.01460.88
25–500.340.89470.79
P-730–250.661.65651.49
25–500.611.80691.51
P-770–250.681.23591.30
25–500.671.30601.32
P-810–251.251.17791.84
25–501.291.26831.92
1 AN-sn: Silandic Andosol; AN-vi: Vitric Andosols.
Disclaimer/Publisher’s Note: The statements, opinions and data contained in all publications are solely those of the individual author(s) and contributor(s) and not of MDPI and/or the editor(s). MDPI and/or the editor(s) disclaim responsibility for any injury to people or property resulting from any ideas, methods, instructions or products referred to in the content.

