Removal of Acid Dyes from Textile Wastewaters Using Fish Scales by Absorption Process

 ,
, 
Abstract
:1. Introduction
2. Methods
2.1. Materials and Chemicals
2.2. Preparation of FS
2.3. Preparation of Dye Solution and Absorption Process
2.4. Characterization
2.5. Determination of Dye Removal Efficiency
2.6. Statistical Analysis
3. Result and Discussion
3.1. Characterization
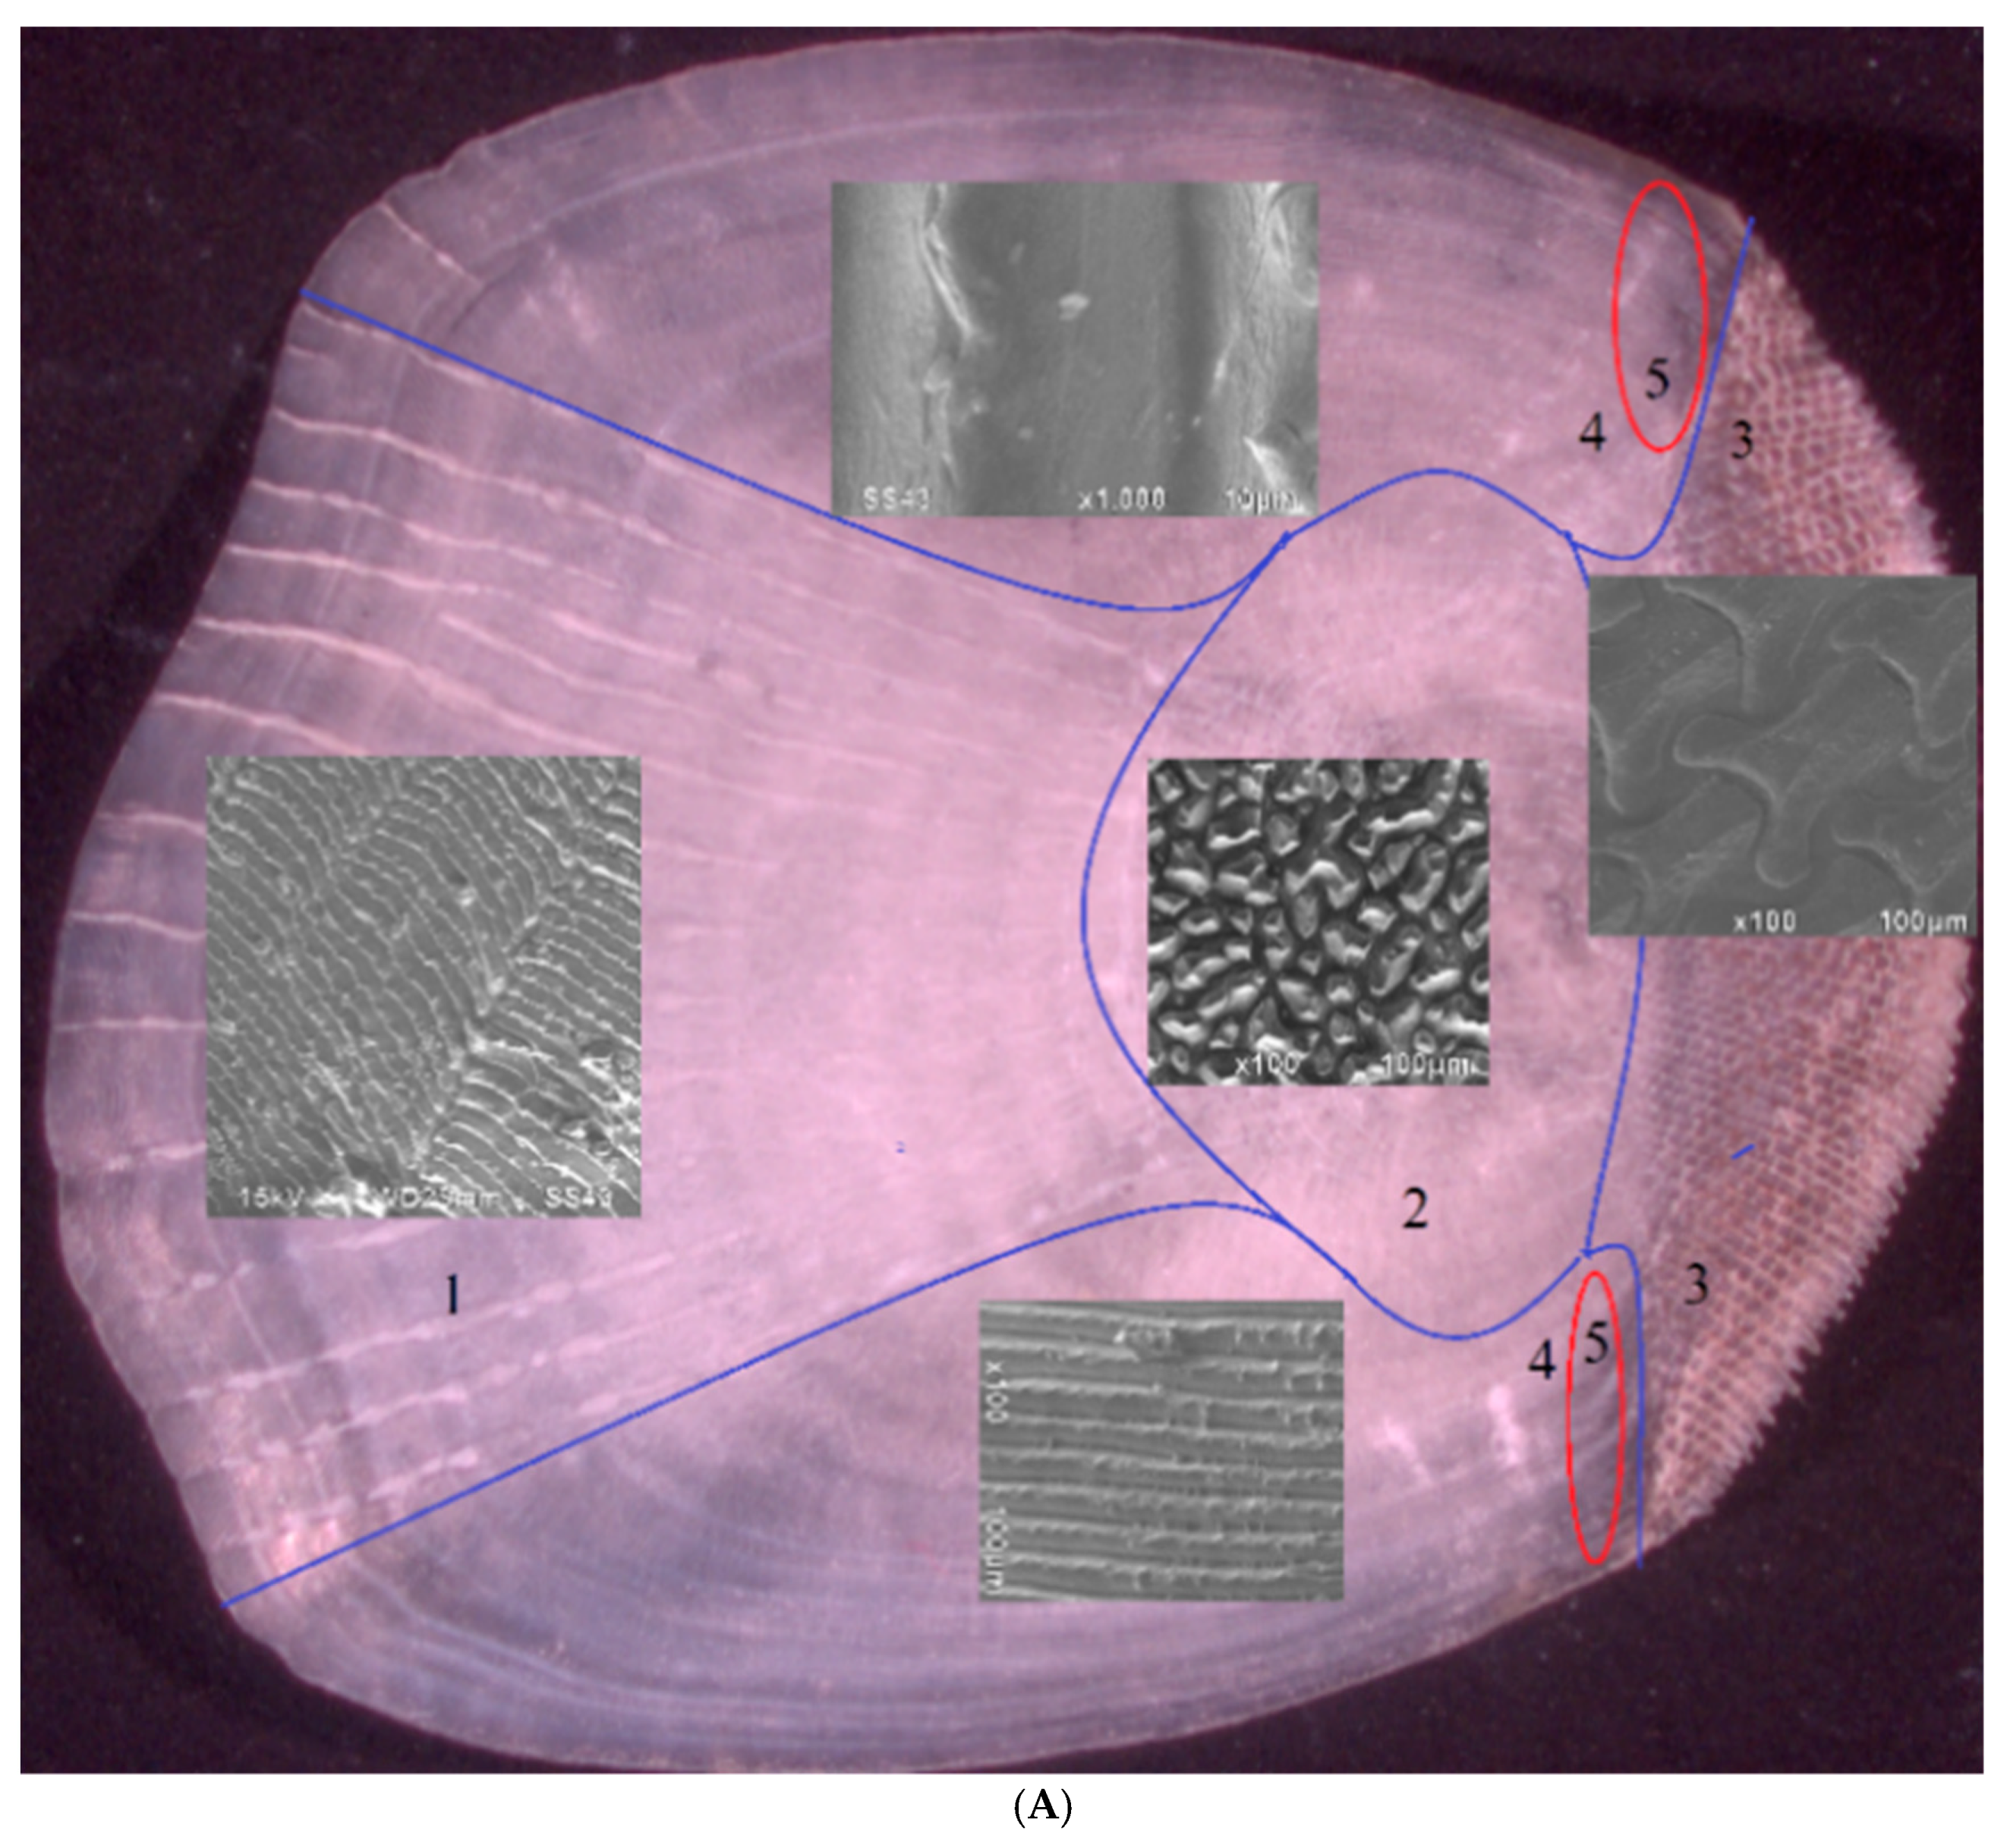
3.1.1. Drum’s Scale Architecture
3.1.2. SEM and EDS
3.1.3. Thermo-Gravimetric Analysis of FS
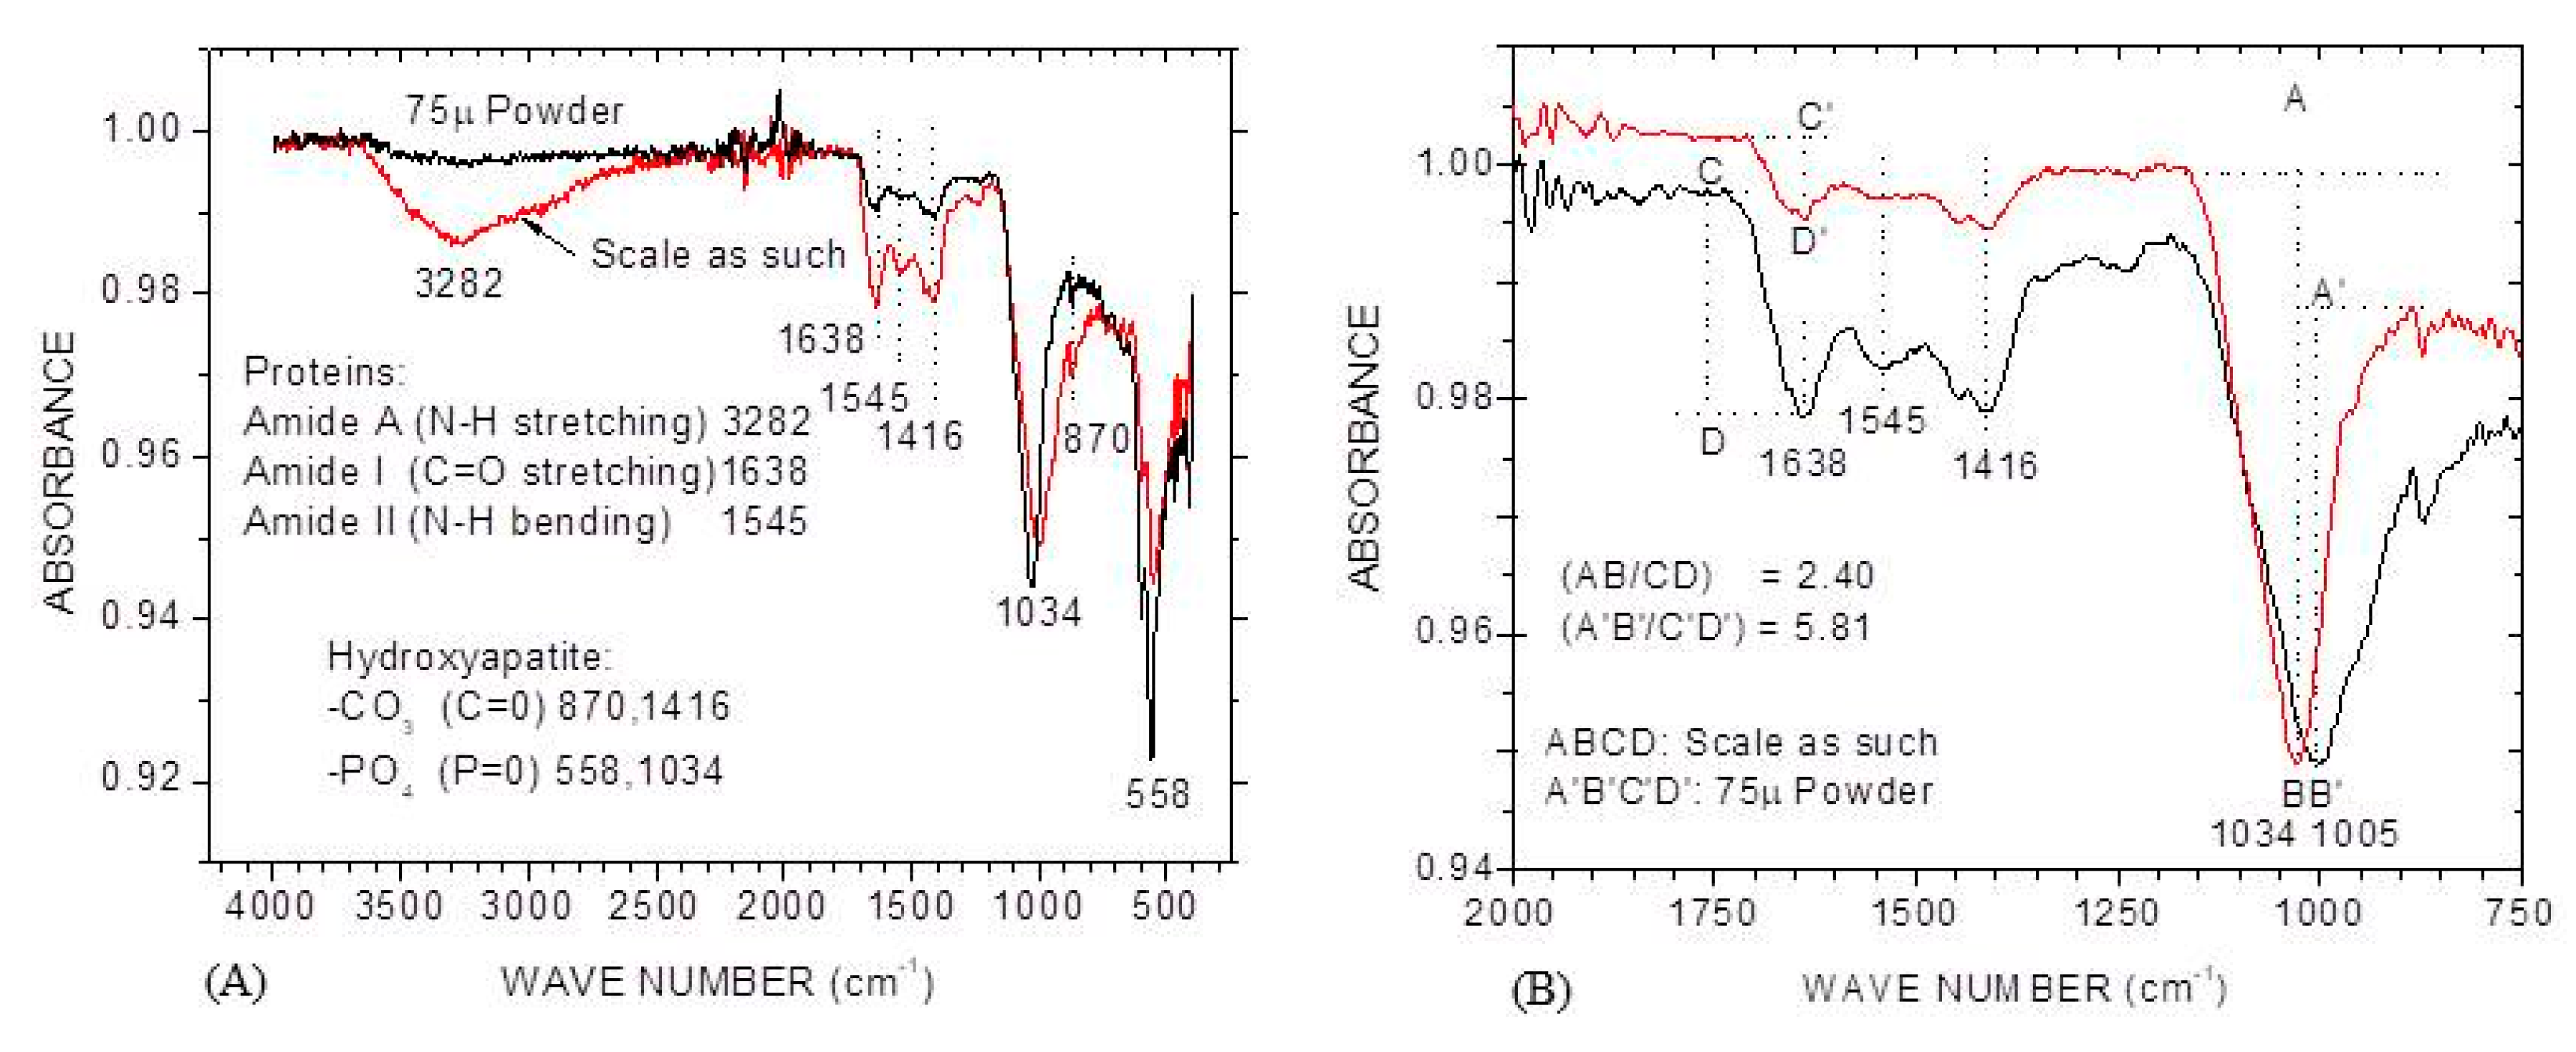
3.1.4. FTIR
3.2. Effects of Process Parameters
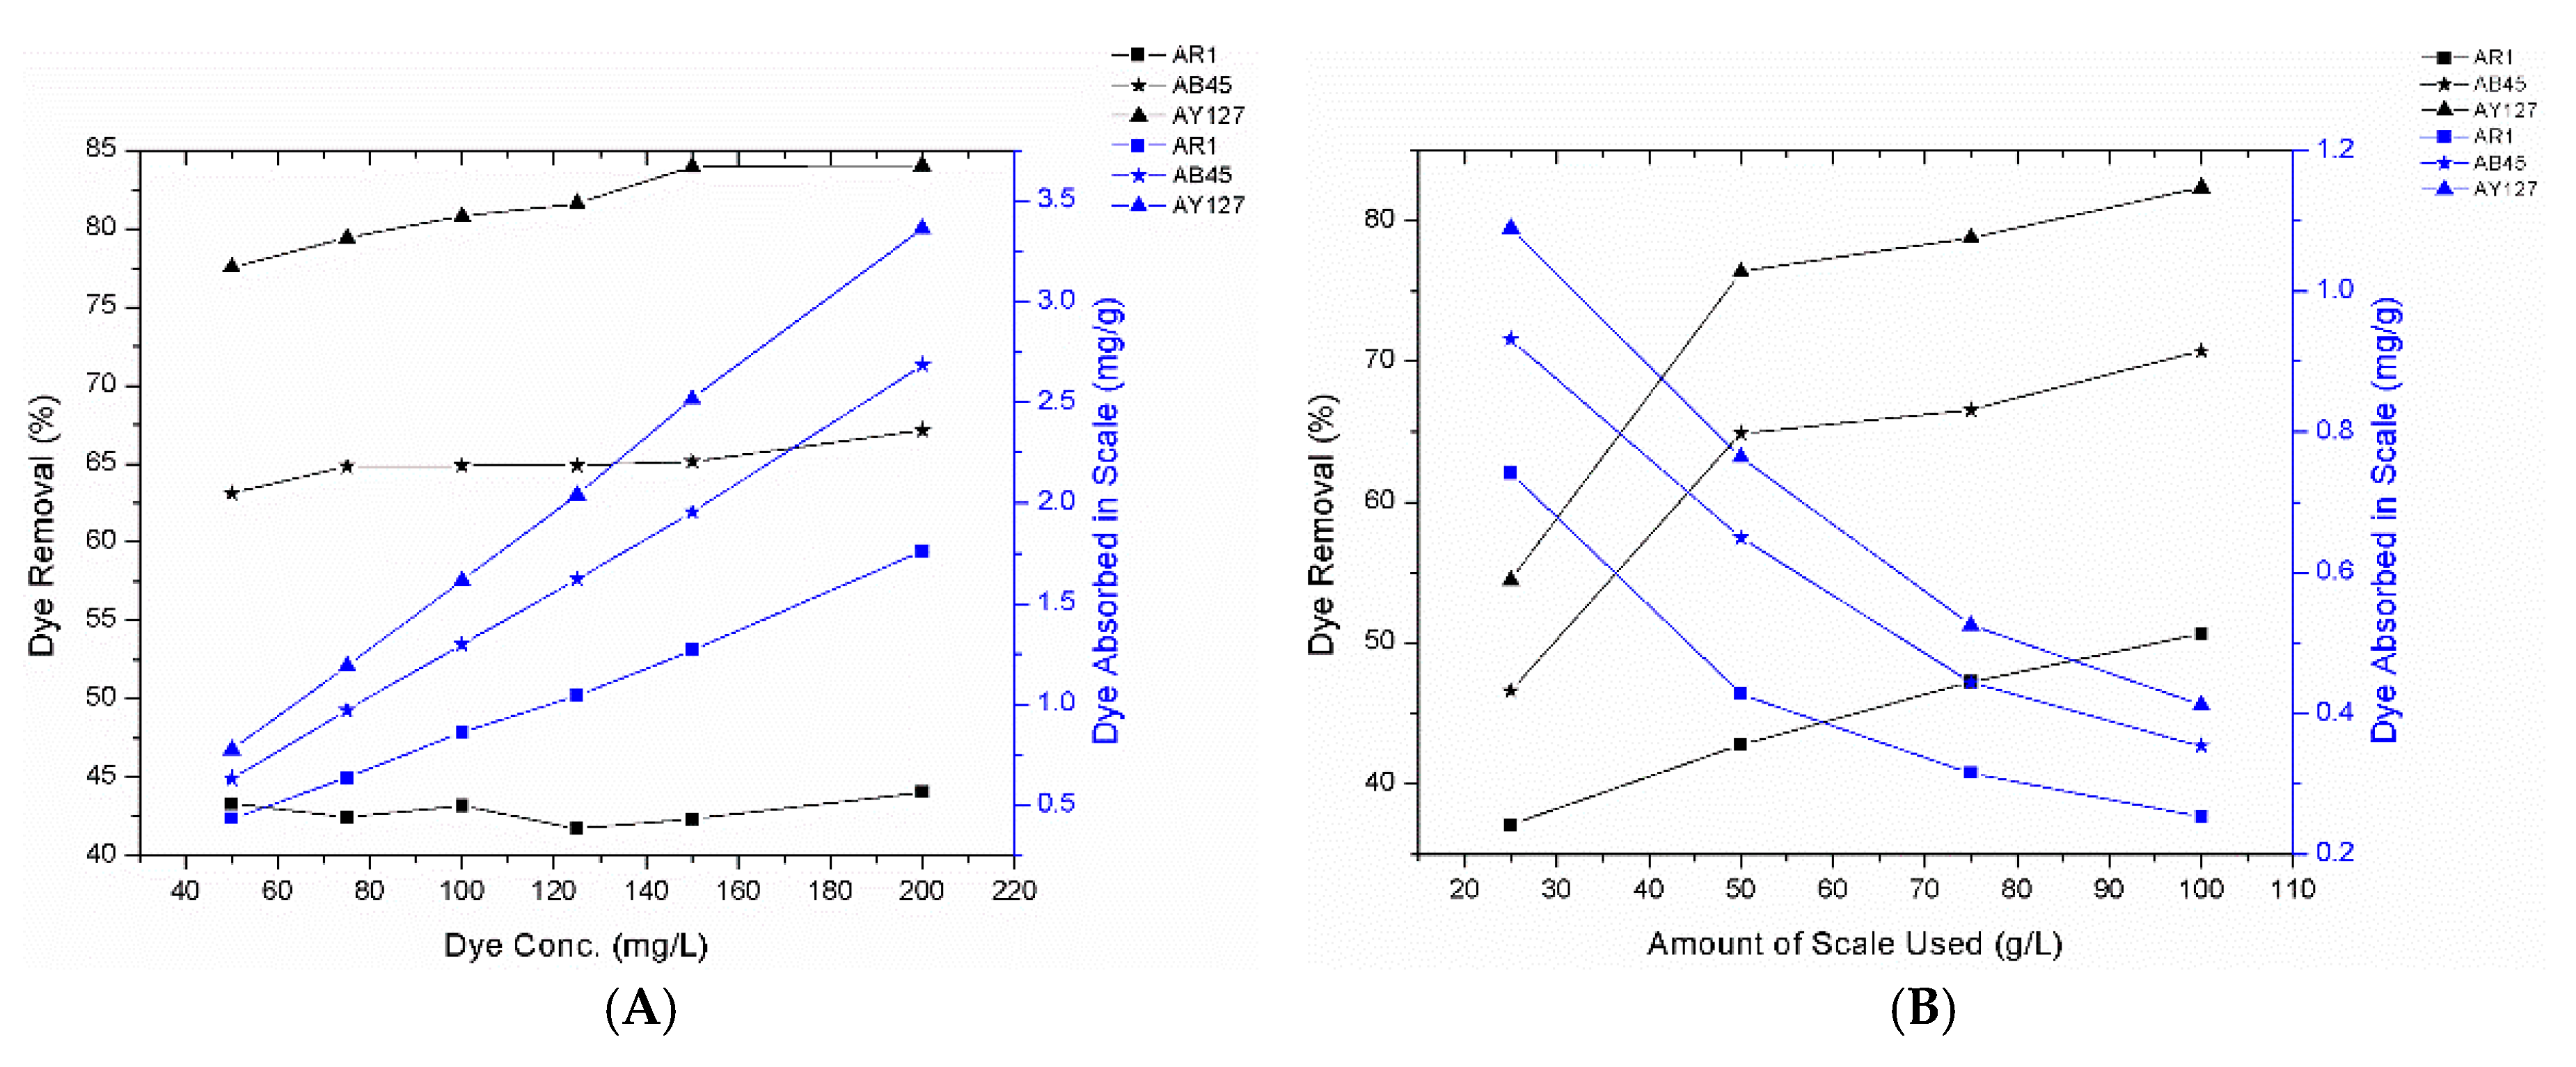
3.2.1. Effect of the Initial Dye Concentration and the Amount of FS Used
- (1)
- The type of dyes and FS used in the present study are different from the literature and thereby, may produce different results, as shown in Table 5.
- (2)
- To study the effect of amount of FS used, it was considered a high amount of FS (25 to 100 gm/L) compared to other studies (4 g/L at most) mentioned in Table 5. This is because the absorption process is held by electrostatic attraction and amounts of active dye binding sites present in the FS, whereas the adsorption process (all other studies in Table 5) is a physical process. So, the amount of dye binding sites, viz., collagens, are responsible for the dye absorption. In the present attempt, FS were not processed, and TGA data has shown that with 50% inorganics, and 17% moisture and volatile matters, only 33% accounted for collagen, which was later depleted to some extend due to leaching. Therefore, the available dye absorbing collagen was not much, as compared to the whole amount of scales used. Consequently, a high denominator value (Xo) in Equation (2), provided a low qe value, dye absorption by sorbent (FS). On the contrary, most of the studies cited above processed FS through heat and/or chemical treatments that resulted in moisture and volatile evaporations; for instance, Ooi et al. [21] noticed that application of high heat, such as 800 °C, ended up with 8.6% ash content, and Marrakchi et al. [8] yielded 12.18 g carbonized FS out of 100 g by heating at 600 °C. Ultimately, these processes came up with high removal capacities, since the density gets lower (the volume remained almost the same but the weight decreased significantly). The variations in dye removal performances among dyes might be due to the bulky chemical structures, chemical functionalities and size of dyes. Though, AY127 has a higher molecular weight (803.63) than AR1 (509.42) and AB45 (474.33), its linear structure enables an easy penetration in FS, compared to penetration of the bulky structures of the other two dyes.
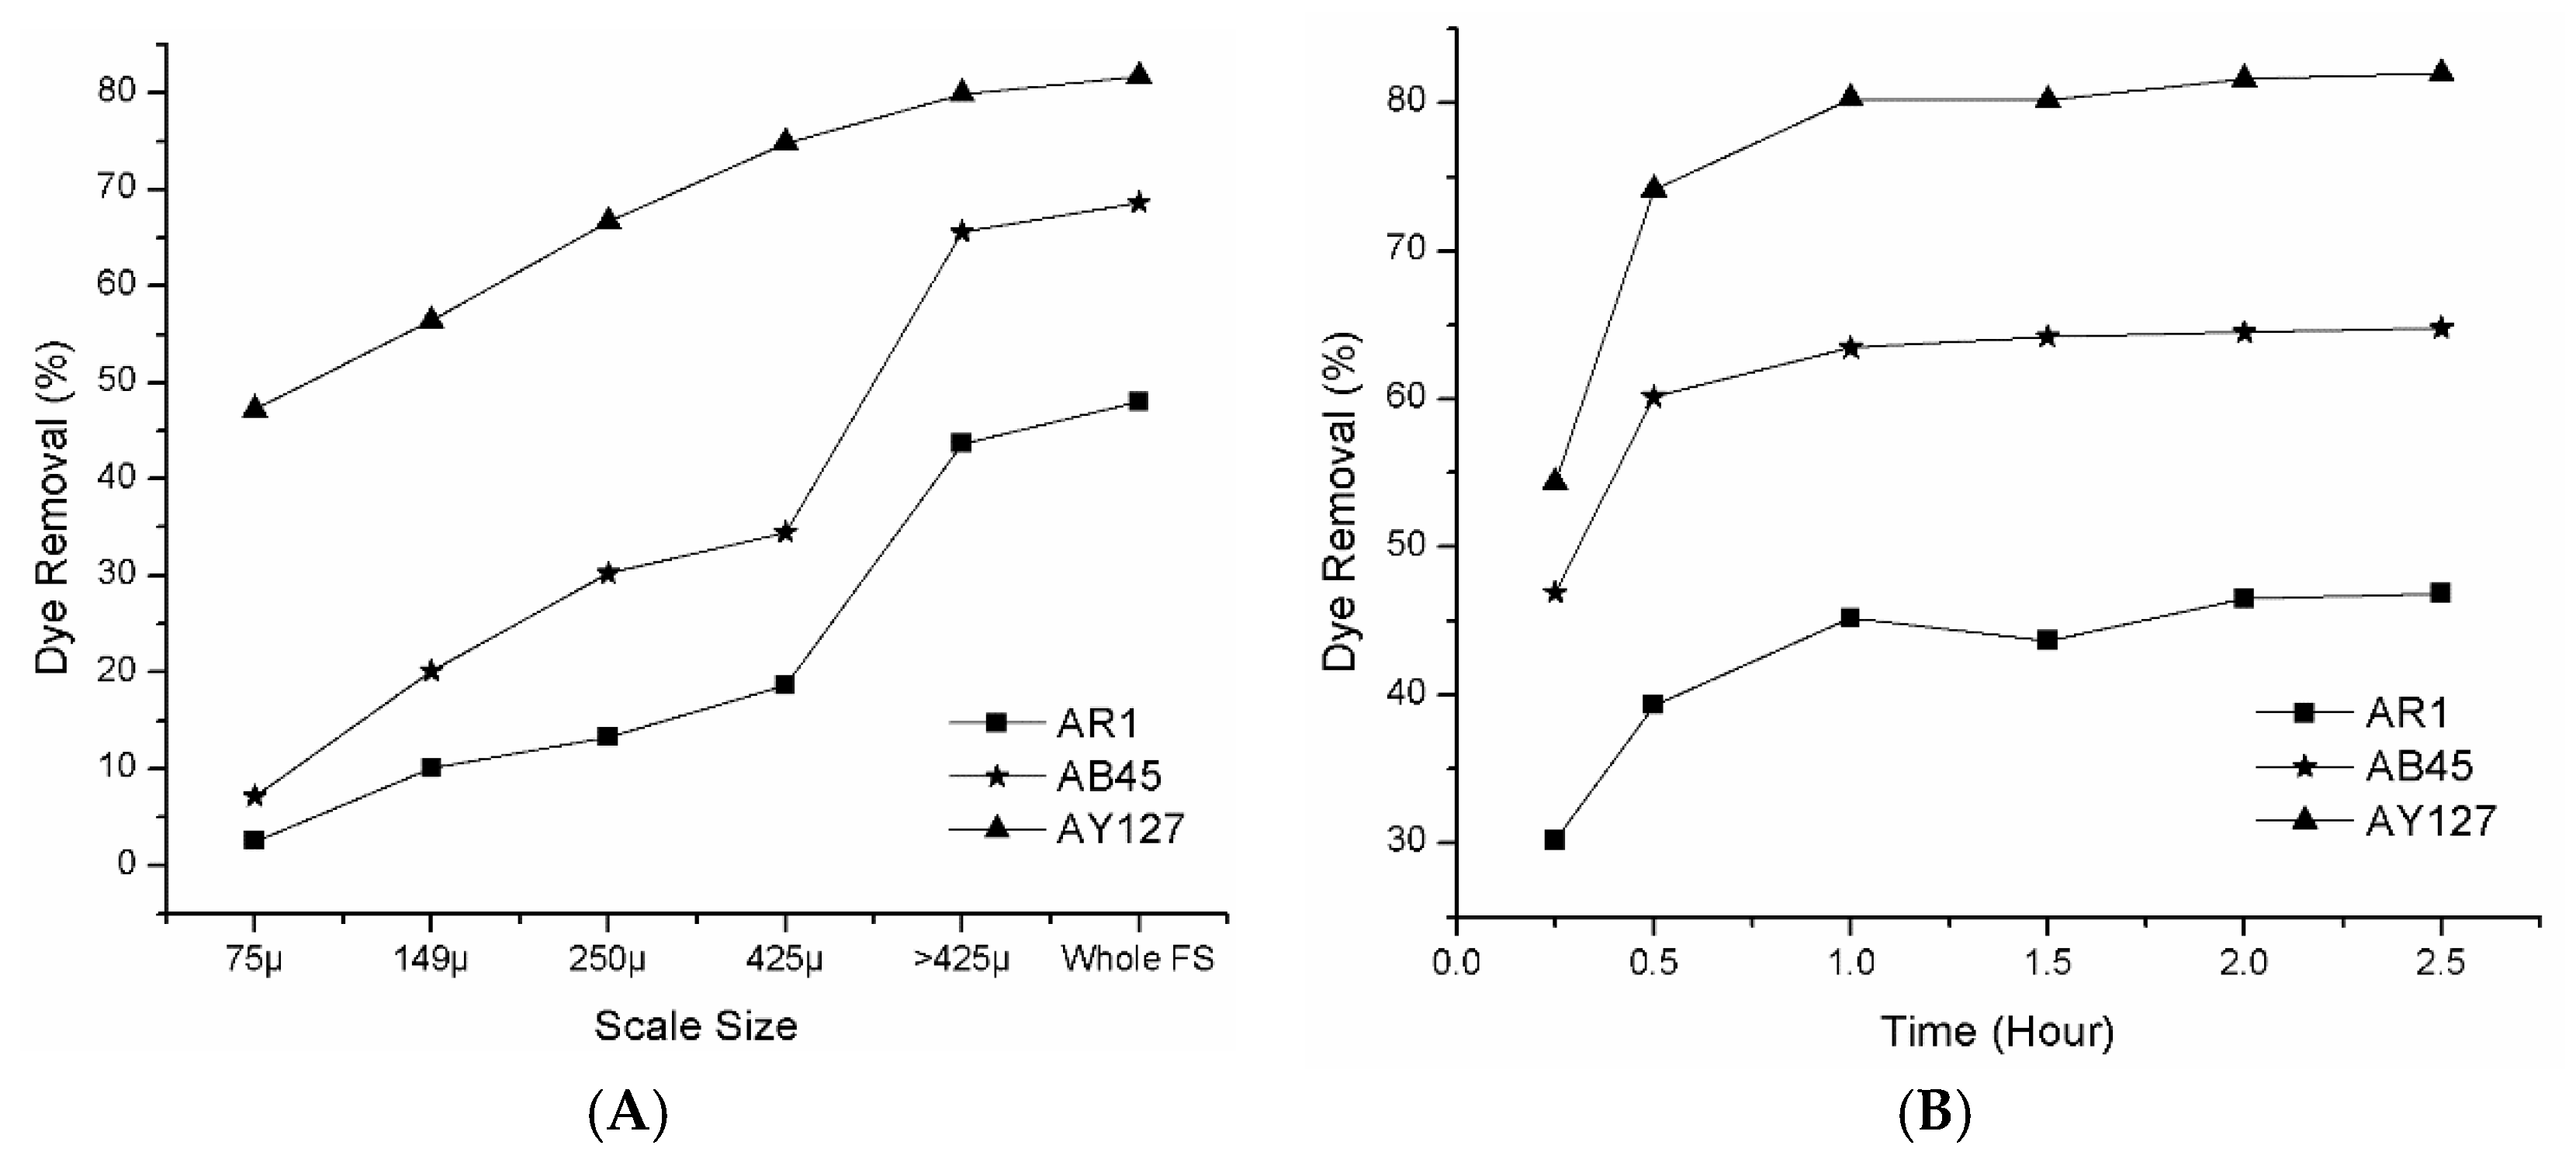
3.2.2. Effect of Scale Size and Contact Time on Acid Dye Removal
3.2.3. Effects of Temperature, Salt, Acid, Additives (Acid and Salt), Stirring, and Vacuum on the Anionic Acid Dye Removal
3.3. Statistical Analysis
4. Conclusions
- SEM-EDS identified the structural and chemical variation in FS. TGA showed that mineral content accounted for 50% of the FS, and the rest was moisture and organic volatile components. FTIR confirmed absorptions characteristic of dyes.
- Dye absorption increased with initial dye concentration, amount of scale used, and decreased due to additives. The best and the worst dye removal performances were found for the dye solution without any additives and fine pulverized scales, respectively.
- The contact time and the temperature allowed the absorption process to achieve equilibrium within 60 min, and it was endothermic.
- The statistical analysis showed strong evidence that the process parameters, dyes, and dye type X process parameters interactions had significant effect on the dye absorption. Although the dye loading on scales is not significantly high, the dye removal percentage is appreciable.
Author Contributions
Acknowledgments
Conflicts of Interest
References
- Hinrichsen, D.; Tacio, H. The coming freshwater crisis is already here. In The Linkages between Population and Water; Woodrow Wilson International Center for Scholars: Washington, DC, USA, 2002; pp. 1–26. [Google Scholar]
- Saxena, S.; Raja, A.; Arputharaj, A. Challenges in Sustainable Wet Processing of Textiles. In Textiles and Clothing Sustainability; Springer: Berlin, Germany, 2017; pp. 43–79. [Google Scholar]
- Kabir, S.; Chakraborty, S.; Hoque, S.; Mathur, K. Sustainability Assessment of Cotton-Based Textile Wet Processing. Clean Technol. 2019, 1, 232–246. [Google Scholar] [CrossRef] [Green Version]
- Grady, C.L.J.; Daigger, G.T.; Love, N.G.; Filipe, C.D. Biological Wastewater Treatment; CRC Press: Boca Raton, FL, USA, 2011. [Google Scholar]
- Gupta, V.; Carrott, P.; Ribeiro Carrott, M.M.L.; Suhas. Low-cost adsorbents: Growing approach to wastewater treatment—A review. Crit. Rev. Environ. Sci. Technol. 2009, 39, 783–842. [Google Scholar] [CrossRef]
- Zhu, K.; Gong, X.; He, D.; Li, B.; Ji, D.; Li, P.; Peng, Z.; Luo, Y. Adsorption of Ponceau 4R from aqueous solutions using alkali boiled Tilapia fish scales. RSC Adv. 2013, 3, 25221–25230. [Google Scholar] [CrossRef]
- Begum, H.A.; Kabir, M.H. Removal of Brilliant Red from Aqueous Solutions by Adsorption on Fish Scales. Dhaka Univ. J. Sci. 2013, 61, 7–12. [Google Scholar] [CrossRef]
- Marrakchi, F.; Ahmed, M.J.; Khanday, W.; Asif, M.; Hameed, B. Mesoporous carbonaceous material from fish scales as low-cost adsorbent for reactive orange 16 adsorption. J. Taiwan Inst. Chem. Eng. 2017, 71, 47–54. [Google Scholar] [CrossRef]
- Neves, C.; Scheufele, F.; Nardino, A.; Vieira, M.; da Silva, M.; Módenes, A.; Borba, C. Phenomenological modeling of reactive dye adsorption onto fish scales surface in the presence of electrolyte and surfactant mixtures. Environ. Technol. 2018, 39, 2467–2483. [Google Scholar] [CrossRef] [PubMed]
- Ribeiro, C.; Scheufele, F.B.; Espinoza-Quinones, F.R.; Módenes, A.N.; da Silva, M.G.C.; Vieira, M.G.A.; Borba, C.E. Characterization of Oreochromis niloticus fish scales and assessment of their potential on the adsorption of reactive blue 5G dye. Colloids Surf. A Physicochem. Eng. Asp. 2015, 482, 693–701. [Google Scholar] [CrossRef]
- Zynudheen, A. Utilization of Fishery Waste in India. Central Institute of Fisheries Technology: Kerala, India, 2010. [Google Scholar]
- Vieira, E.F.; Cestari, A.R.; Carvalho, W.A.; Oliveira, C.d.S.; Chagas, R.A. The use of freshwater fish scale of the species Leporinus elongatus as adsorbent for anionic dyes. J. Therm. Anal. Calorim. 2012, 109, 1407–1412. [Google Scholar] [CrossRef]
- Marrakchi, F.; Auta, M.; Khanday, W.; Hameed, B. High-surface-area and nitrogen-rich mesoporous carbon material from fishery waste for effective adsorption of methylene blue. Powder Technol. 2017, 321, 428–434. [Google Scholar] [CrossRef]
- Chakraborty, J.; Dey, S.; Halder, U.C. An eco-friendly bio-sorbent derived from fish (Carp) scale: A study of commercial dye removal. Int. J. Sci. Eng. Res. 2016, 7, 5. [Google Scholar]
- Uzunoğlu, D.; Özer, A. Adsorption of Acid Blue 121 dye on fish (Dicentrarchus labrax) scales, the extracted from fish scales and commercial hydroxyapatite: Equilibrium, kinetic, thermodynamic, and characterization studies. Desalin. Water Treat. 2016, 57, 14109–14131. [Google Scholar] [CrossRef]
- Chowdhury, S.; Das Saha, P.; Ghosh, U. Fish (Labeo rohita) scales as potential low-cost biosorbent for removal of malachite green from aqueous solutions. Bioremediation J. 2012, 16, 235–242. [Google Scholar] [CrossRef]
- Eaglen, M.; Pollak, J. How to Save Money, Reform Processes, and Increase Efficiency in the Defense Department; Heritage Foundation: Washington, DC, USA, 2011. [Google Scholar]
- Mahapatra, N.N. Textile Dyes; Woodhead Publishing: New Delhi, India, 2016. [Google Scholar]
- Ogawa, M.; Portier, R.J.; Moody, M.W.; Bell, J.; Schexnayder, M.A.; Losso, J.N. Biochemical properties of bone and scale collagens isolated from the subtropical fish black drum (Pogonia cromis) and sheepshead seabream (Archosargus probatocephalus). Food Chem. 2004, 88, 495–501. [Google Scholar] [CrossRef]
- Negulescu, I.I. Laboratory Procedure; Louisiana State University: Baton Rouge, LA, USA, 2017. [Google Scholar]
- Ooi, J.; Lee, L.Y.; Hiew, B.Y.Z.; Thangalazhy-Gopakumar, S.; Lim, S.S.; Gan, S. Assessment of fish scales waste as a low cost and eco-friendly adsorbent for removal of an azo dye: Equilibrium, kinetic and thermodynamic studies. Bioresour. Technol. 2017, 245, 656–664. [Google Scholar] [CrossRef]
- Bhuiyan, M.R.; Ali, A.; Islam, A.; Hannan, M.; Kabir, S.F.; Islam, M. Coloration of polyester fiber with natural dye henna (Lawsonia inermis L.) without using mordant: A new approach towards a cleaner production. Fash. Text. 2018, 5, 2. [Google Scholar] [CrossRef]
- Kabir, S.F. Waste Management by Waste: Removal of Acid Dyes from Wastewaters of Textile Coloration Using Fish Scales. Master’s Thesis, Louisiana State University, Baton Rouge, LA, USA, 2018. in press.
- Calloway, D. Beer-lambert law. J. Chem. Educ 1997, 74, 744. [Google Scholar] [CrossRef]
- Rodger, A. Concentration Determination Using Beer-Lambert Law. In Encyclopedia of Biophysics; Springer: Berlin, Germany, 2013; pp. 360–361. [Google Scholar]
- Lagler, K.F. Lepidological studies 1. Scale characters of the families of Great Lakes fishes. Trans. Am. Microsc. Soc. 1947, 66, 149–171. [Google Scholar] [CrossRef]
- Torres, F.G.; Troncoso, O.P.; Amaya, E. The effect of water on the thermal transitions of fish scales from Arapaima Gigas. Mater. Sci. Eng. C 2012, 32, 2212–2214. [Google Scholar] [CrossRef]
- Mota, J.A.; Silva, E.S.; Vieira, E.F.; Sussuchi, E.M.; Cestari, A.R. A highly efficient adsorbent synthesized by reactive depositions of chitosan layers on fish scale collagen—Hydrodynamic swelling and dichlorophenol derivative sorption evaluated by continuous long-term solution microcalorimetry. J. Environ. Chem. Eng. 2013, 1, 480–485. [Google Scholar] [CrossRef]
- Chakraborty, R.; Bepari, S.; Banerjee, A. Application of calcined waste fish (Labeo rohita) scale as low-cost heterogeneous catalyst for biodiesel synthesis. Bioresour. Technol. 2011, 102, 3610–3618. [Google Scholar] [CrossRef]
- Kabir, S.; Rashid, T.U.; Negulescu, I.I. Gelation of Textile Dye Solution Treated with Fish Scales. Gels 2019, 5, 37. [Google Scholar] [CrossRef] [PubMed]
- Martins, T.D.; Schimmel, D.; dos Santos, J.o.B.; da Silva, E.A. Reactive blue 5G adsorption onto activated carbon: Kinetics and equilibrium. J. Chem. Eng. Data 2012, 58, 106–114. [Google Scholar] [CrossRef]
- Al-Degs, Y.; Khraisheh, M.; Allen, S.; Ahmad, M. Adsorption characteristics of reactive dyes in columns of activated carbon. J. Hazard. Mater. 2009, 165, 944–949. [Google Scholar] [CrossRef] [PubMed]
- Sun, L.; Wan, S.; Luo, W. Biochars prepared from anaerobic digestion residue, palm bark, and eucalyptus for adsorption of cationic methylene blue dye: Characterization, equilibrium, and kinetic studies. Bioresour. Technol. 2013, 140, 406–413. [Google Scholar] [CrossRef]
- Kongsri, S.; Janpradit, K.; Buapa, K.; Techawongstien, S.; Chanthai, S. Nanocrystalline hydroxyapatite from fish scale waste: Preparation, characterization and application for selenium adsorption in aqueous solution. Chem. Eng. J. 2013, 215, 522–532. [Google Scholar] [CrossRef]
- Iqbal, J.; Wattoo, F.H.; Wattoo, M.H.S.; Malik, R.; Tirmizi, S.A.; Imran, M.; Ghangro, A.B. Adsorption of acid yellow dye on flakes of chitosan prepared from fishery wastes. Arab. J. Chem. 2011, 4, 389–395. [Google Scholar] [CrossRef] [Green Version]
- Stannard, C.R.; Kabir, S.M.F. Fishy finery. In Proceedings of the 2018 ITAA Annual Conference Proceesings: Design Presentation, Cleveland, OH, USA, 5–9 November 2018. [Google Scholar]
- Al-Degs, Y.S.; El-Barghouthi, M.I.; El-Sheikh, A.H.; Walker, G.M. Effect of solution pH, ionic strength, and temperature on adsorption behavior of reactive dyes on activated carbon. Dyes Pigment. 2008, 77, 16–23. [Google Scholar] [CrossRef]
- Adeyemo, A.A.; Adeoye, I.O.; Bello, O.S. Adsorption of dyes using different types of clay: A review. Appl. Water Sci. 2017, 7, 543–568. [Google Scholar] [CrossRef]
- Moreira, R.; Peruch, M.; Kuhnen, N. Adsorption of textile dyes on alumina. Equilibrium studies and contact time effects. Braz. J. Chem. Eng. 1998, 15. [Google Scholar] [CrossRef]


| Chemical Structures | Molecular Weights | Wavelength in mm at Maximum Absorption | Molar Coefficients in M−1 cm−1 |
|---|---|---|---|
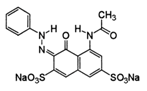 Acid red 1 (AR1) | 509.42 | 506 | 19,593 |
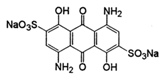 Acid blue 45 (AB45) | 474.33 | 595 | 7048.4 |
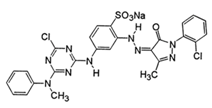 Acid yellow 127 (AY127) | 803.63 | 407 | 8658.8 |
| ID for Statistical Analysis | Treatments | Parameter Applied (‘√ ‘ Mark Means Applied, ‘-’ if Not) | |||||
|---|---|---|---|---|---|---|---|
| Temperature (60° C) | Salt 62.5 mg/L | Acid 7.5 mg/L | Additives (Acid and Salt Together) | Stirring (1000 rpm) | Vacuum for 1.5 h after Absorption Process | ||
| Control | Std. | √ | √ | √ | √ | √ | - |
| AR1/AB45/AY127 2 | No temp | - | √ | √ | √ | √ | - |
| AR1/AB45/AY127 3 | No salt | √ | - | √ | - | √ | - |
| AR1/AB45/AY127 4 | No acid | √ | √ | - | √ | √ | - |
| AR1/AB45/AY127 5 | No additives | √ | - | - | - | √ | - |
| AR1/AB45/AY127 6 | No Stirring | √ | √ | √ | √ | - | - |
| AR1/AB45/AY127 7 | Vacuum effect | √ | √ | √ | √ | √ | √ |
| Other parameters: 50 mg/L dye solutions, 1 h process time, 50 g/L large pulverized FS | |||||||
| Treatment | Treatment Levels | Other Process Conditions |
|---|---|---|
| Effect of dye concentration | 50, 75, 100, 125, 150 and 200 mg/L | As control in Table 2 |
| Effect of amount of FS used | 25, 50, 75 and 100 g/L | |
| Scale size | Whole scales, large pulverized FS and powdered FS with sieve no. 40 (420 µ), 60 (250 µ), 100 (149 µ), 200 (74 µ) | |
| Effect of time | 0.25, 0.5, 1, 1.5, 2 and 2.5 h |
| Elements | C | N | O | Na | Mg | P | S | Ca | References | ||
|---|---|---|---|---|---|---|---|---|---|---|---|
| Criteria | |||||||||||
| Drum | P* | T* | 27.02 | 16.65 | 38.62 | 0.7 | 0.53 | 7.25 | NA | 9.22 | This study |
| B* | 55.41 | 23.49 | 21.10 | NA | NA | NA | NA | NA | |||
| C* | T | 4.64 | 3.34 | 53.52 | NA | NA | 12.0 | 0.79 | 25.71 | ||
| B | 48.58 | 18.72 | 32.72 | NA | NA | NA | NA | NA | |||
| Rohita | NA* | NA | 46.08 | 26.64 | 24.86 | NA | NA | 0.91 | 0.24 | 1.27 | [8] |
| Tilapia | NA | NA | 45.7 | NA | 38.9 | 0.2 | 0.2 | 5.6 | NA | 9.4 | [10] |
| E* bass | NA | NA | 40.1 | 0.54 | 24.0 | NA | NA | 8.47 | NA | 9.6 | [15] |
| Sorbent Types | Sorbates | qe in mg/g | References | |
|---|---|---|---|---|
| Activated carbon | Reactive blue 5G | 149.13 | [31] | |
| Activated carbon | Blue 5G | 0.88 | [32] | |
| Palm bark | Methylene blue | 2.66 | [33] | |
| Eucalyptus | Methylene blue | 2.06 | [33] | |
| Fish Scales | Tilapia nilotica | Selenium | 1.02 | [34] |
| Labeo rohita | Brilliant reactive red 2 | 3.19 | [7] | |
| Labeo rohita | Malachite green | 38.46 | [16] | |
| Tilapia fish | Ponceau 4R | 116 | [6] | |
| Mixed FS | Acid blue 113 | 145.3–157.3 | [21] | |
| Pogonias cromis | AR1, AB45, AY127 | 1.8, 2.7 and 3.4, respectively | This study | |
© 2019 by the authors. Licensee MDPI, Basel, Switzerland. This article is an open access article distributed under the terms and conditions of the Creative Commons Attribution (CC BY) license (http://creativecommons.org/licenses/by/4.0/).
Share and Cite
Kabir, S.M.F.; Cueto, R.; Balamurugan, S.; Romeo, L.D.; Kuttruff, J.T.; Marx, B.D.; Negulescu, I.I. Removal of Acid Dyes from Textile Wastewaters Using Fish Scales by Absorption Process. Clean Technol. 2019, 1, 311-324. https://doi.org/10.3390/cleantechnol1010021
Kabir SMF, Cueto R, Balamurugan S, Romeo LD, Kuttruff JT, Marx BD, Negulescu II. Removal of Acid Dyes from Textile Wastewaters Using Fish Scales by Absorption Process. Clean Technologies. 2019; 1(1):311-324. https://doi.org/10.3390/cleantechnol1010021
Chicago/Turabian StyleKabir, S M Fijul, Rafael Cueto, Sreelatha Balamurugan, Laurel D. Romeo, Jenna T. Kuttruff, Brian D. Marx, and Ioan I. Negulescu. 2019. "Removal of Acid Dyes from Textile Wastewaters Using Fish Scales by Absorption Process" Clean Technologies 1, no. 1: 311-324. https://doi.org/10.3390/cleantechnol1010021