Article

Electroreforming of Glucose and Xylose in Alkaline Medium at Carbon Supported Alloyed Pd3Au7 Nanocatalysts: Effect of Aldose Concentration and Electrolysis Cell Voltage

by
Thibault Rafaïdeen
,
Neha Neha
,
Bitty Roméo Serge Kouamé
,
Stève Baranton
and
Christophe Coutanceau
*
IC2MP, UMR CNRS—Université de Poitiers n° 7285, 4 rue Michel Brunet, TSA 51106, CEDEX 9, 86073 Poitiers, France
*
Author to whom correspondence should be addressed.
Clean Technol. 2020, 2(2), 184-203; https://doi.org/10.3390/cleantechnol2020013
Submission received: 24 April 2020 / Revised: 25 May 2020 / Accepted: 8 June 2020 / Published: 16 June 2020
(This article belongs to the Special Issue Green Process Engineering)

Abstract

:
The effects of cell voltage and of concentration of sugars (glucose and xylose) on the performances of their electro-reforming have been evaluated at a Pd3Au7/C anode in 0.10 mol L−1 NaOH solution. The catalyst synthesized by a wet chemistry route is first comprehensively characterized by physicochemical and electrochemical techniques. The supported catalyst consists in alloyed Pd3Au7 nanoparticles of circa 6 nm mean diameter deposited on a Vulcan XC72 carbon support, with a metal loading close to 40 wt%. Six-hour chronoamperometry measurements are performed at 293 K in a 25 cm2 electrolysis cell for the electro-conversion of 0.10 mol L−1 and 0.50 mol L−1 glucose and xylose at cell voltages of +0.4 V, +0.6 V and +0.8 V. Reaction products are analyzed every hour by high performance liquid chromatography. The main products are gluconate and xylonate for glucose and xylose electro-reforming, respectively, but the faradaic yield, the selectivity and the formation rate of gluconate/xylonate decrease with the increase of aldose concentration, whereas lower faradaic yields and higher formation rates of gluconate/xylonate are observed at +0.8 V than at +0.4 V (higher chemical yields).

1. Introduction

With the perspective of moving from fossil to renewable resources to produce fine chemicals, the conversion of hexoses and pentoses into their corresponding carboxylic acid derivatives has recently received much attention. Xylonic and gluconic acids, for example, are considered as very important value-added chemicals from biomass [1]. They can be used as such in the food and pharmaceutical industry, in cosmetics and as a concrete admixture or as building blocks in numerous industrial applications: syntheses of bio-sourced chemicals and polymers, chelating agents, etc. [2,3]. For these reasons, different biotechnological and chemical methods for glucose and xylose oxidation into gluconic (gluconate) and xylonic (xylonate) acids have been developed.
Biotechnological methods generally allow reaching high selectivity but have several disadvantages, such as control of conversion parameters, slow conversion, multicomponent media, large footprint, complex separation processes, disposal of wastewater, etc. [4,5]. These drawbacks have propelled heterogeneous catalysis as an attractive potential industrial process for the conversion of carbohydrates [5,6,7]. Biotechnological processes allow starting from highly concentrated media (concentration of glucose around 1 mol L−1, i.e., 180 g L−1) [8,9], whereas a few works can be found concerning aldose oxidation on heterogeneous catalysts at concentrations higher than 0.10 mol L−1 (> 18.0 g L−1) [10,11,12,13]. Aldose concentrations lower than 0.10 mol L−1 (< 18.0 g L−1) are generally considered for the conversion of biomass by heterogeneous catalysis processes [5,14,15,16,17], including electrocatalysis [18,19,20,21,22,23]. Such concentrations remain low to overcome one of the main challenges in biomass conversion, which is the rapid and selective conversion of highly concentrated solutions. Another action lever than that of substrate concentration to improve the conversion rate could be the increase of the electrolysis cell voltage, which will mainly determine the anode potential. However, the increases of the aldose concentration and of the cell voltage can have an impact on the selectivity and yield of the reaction.
In a previous paper [24], we have studied the electrocatalytic oxidation of 0.10 mol L−1 glucose (18.0 g L−1) and 0.10 mol L−1 xylose (15.0 g L−1) at palladium/gold nano-alloys of different atomic ratios deposited on a high specific surface area carbon support (PdxAu10-x/C, x from 0 to 10) and we showed that the Pd3Au7 atomic composition allowed reaching both high activity and selectivity towards gluconate and xylonate, respectively, by avoiding the breaking of the C-C bonds at low anode potentials. Our results agreed with those obtained by Yan et al. [21] with non-alloyed Pdx-Au10-x/C catalysts (x from 0 to 10), who observed a lower surface poisoning for the glucose oxidation reaction at a Pd3-Au7/C catalyst. However, the onset potential of aldose oxidation was shifted towards lower values with our alloyed Pd3Au7/C catalyst [24] than with their non-alloyed Pd3-Au7/C catalyst [21].
The present contribution aims at studying and comparing the conversion of glucose and xylose at a comprehensively characterized Pd3Au7/C anode catalyst in an electrolysis cell fed with an alkaline electrolyte (0.10 M NaOH) containing different concentrations of aldose, i.e., 0.10 mol L−1 (18.0 g L−1 and 15.0 g L−1 for glucose and xylose, respectively) and 0.50 mol L−1 (90.0 g L−1 and 75.0 g L−1 for glucose and xylose, respectively), at different cell voltages (+0.4 V, +0.6 V and +0.8 V). The activity of the catalyst is first determined by cyclic voltammetry. Then long-term electrolysis measurements at 293 K (6 h) are performed in a 25 cm2 filter press-like electrolysis cell at different cell voltages for different aldose concentrations with simultaneous hydrogen production at the Pt/C cathode of the cell. The recording of the current vs. time curves, the analysis of reaction products and the determination of the faradaic yield give information on the chemical and electrochemical processes occurring in the electrosynthesis cell as a function of the experimental conditions.

2. Experimental

The monometallic Pt/C, Pd/C, Au/C and bimetallic Pd3Au7/C catalysts are synthesized by a “water-in-oil” microemulsion method [25,26,27]. This synthesis method consists in reducing by sodium borohydride (Merk Sigma-Aldrich, 99% purity, Darmstadt, Germany) appropriate amounts of metal salts (hexachloroplatinic acid H2PtCl6, tetrachloropalladate K2PdCl4 and tetrachloroauric acid trihydrate HAuCl4·3 H2O 99.9% purity from Alfa Aesar, Kandel, Germany) dissolved in water (Merk MilliQ, Millipore 18 MW cm, Darmstadt, Germany) nanodroplets dispersed in an oil phase and protected by a surfactant (Brij®30). For the Pd3Au7/C catalyst, the Pd/Au molar ratio in aqueous solution of K2PdCl4 and HAuCl4·3 H2O is fixed to 3/7. The obtained nanoparticles are deposited on a carbon powder support (Vulcan XC 72). The method is described in Supplementary Materials (S1).
Thermogravimetric analysis (TGA, TA Instrument model SDT Q 600) and atomic absorption spectroscopy (AAS, Perkin Elmer AA200 Atomic absorption spectrometer) measurements are carried out to determine the actual metal loading and composition of catalysts. TEM analyses are performed using a JEOL JEM 2100 (UHR) microscope with a resolution of 0.19 nm. The Feret’s diameters determined on circa 300 isolated nanoparticles (NPs) using the ImageJ free software [28] are considered for the statistics. X-ray Diffraction (XRD) patterns are acquired using a PANalytical Empyrean X-ray diffractometer and refined using the Fityk free software [29]. More details for material characterization are available in Ref. [24] and in Supplementary Materials (S2).
Electrochemical measurements are performed at 293 K using a Voltalab PGZ402 potentiostat (Radiometer analytical) in a three-electrode cell containing a N2-purged 0.10 mol L−1 NaOH (semiconductor grade 99.99%, Merk Sigma-Aldrich, Darmstadt, Germany) electrolyte without or with dissolved glucose or xylose (99%, Merk Sigma-Aldrich, Darmstadt, Germany). The reference electrode is a reversible hydrogen electrode (RHE), the counter electrode is a glassy carbon plate of 6 cm2 geometric surface area and the working electrode is a glassy carbon disk of 0.071 cm2 geometric surface area on which the catalyst is deposited. The formulation of the catalytic ink and the preparation of the working electrode leading to a metal loading of 100 µg cm−2 are detailed in Ref. [24] and in Supplementary Materials (S2).
Chronoamperometry measurements are conducted at 293 K in a 25 cm2 single electrolysis cell fitted with a Pd3Au7/C anode (0.5 mgmetal cm−2) and a Pt/C cathode (0.5 mgPt cm−2). The working principle of the cell is described elsewhere [24,30] and presented in Supplementary Materials (S3). The reaction products are analyzed by high performance liquid chromatography (HPLC) every hour of chronoamperometry measurements. The analytical method is given in Supplementary Materials (S3).

3. Results

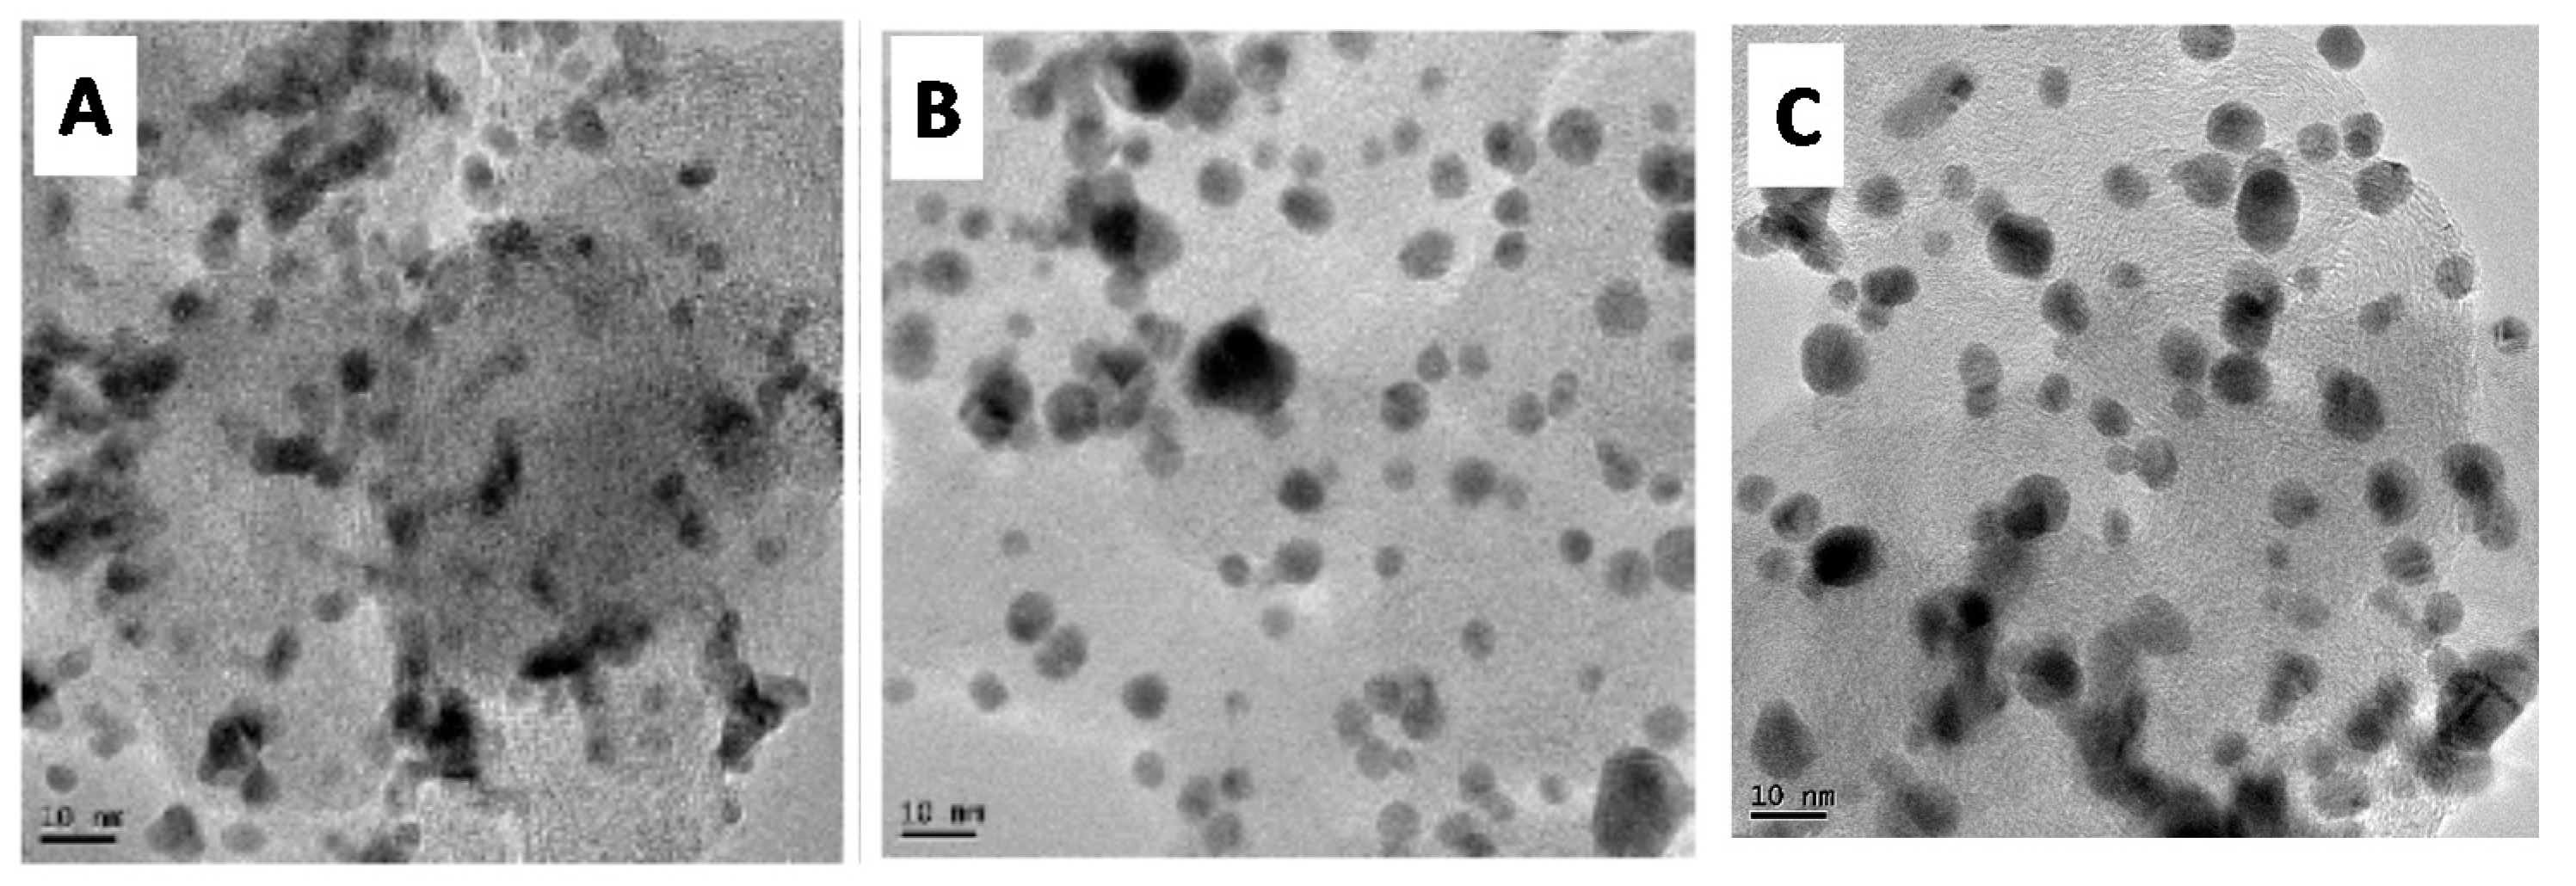
3.1. Physicochemical Characterization of Catalysts

The actual metal loadings and bulk compositions of materials determined by TGA and AAS, respectively, are listed in Table 1. The results agree with the nominal ones (40 wt% metal loading and Pd/Au ratio of 3/7 for the bimetallic material), which indicates that the synthesis is quantitative.
TEM pictures in Figure 1 indicate that Pd (Figure 1A), Au (Figure 1B) and Pd3Au7 (Figure 1C) nanoparticles are relatively well dispersed on the Vulcan XC72 carbon support; the mean sizes are circa 4 nm, 7 nm and 6 nm, respectively. As expected from metallic Pd and Au based materials, all XRD patterns in Figure 2 display typical diffraction peaks related to materials crystalizing in the face centered cubic (fcc) structure (JCPDS 05-0681 for Pd and 04-0784 for Au) [24,27]. The XRD pattern of Pd/C (Figure 2A) shows also peaks corresponding to the tetragonal PdO phase (JCPDS 41-1107). These diffraction peaks do not appear in the XRD pattern of Pd3Au7/C (Figure 2B). The diffraction peak centered close to 25° visible in all patterns corresponds to the (002) plane of turbostratic graphite [31]. The width of the diffraction peaks at half maximum allows approximating the mean particle size for all catalysts using the Scherrer equation [32] (2.9 nm, 4.4 nm and 5.9 nm for Pd/C, Pd3Au7/C and Au/C, respectively). In the case of the bimetallic material (Figure 2B), the XRD diffraction peaks are located between those of pure Pd (Figure 2A) and those of pure Au (Figure 2C), which clearly shows the formation of a bulk alloy. The position of the diffraction peaks allows determining the cell parameter using the Bragg equations [33]: acell(Pd) = 0.390 nm, acell(Au) = 0.407 nm and acell(Pd3Au7) = 0.403 nm. The value of the cell parameter for the Pd3Au7 material follows the Vegard’s law [34] for a ratio close to 30 at% Pd and 70% Au in a PdAu bulk alloy. TEM and XRD results are reported in Table 1.
Electrocatalytic reactions are surface reactions; therefore, it is important to determine the surface composition of the bimetallic catalyst. Rand and Wood [35] have shown that the position of a PdAu surface oxide reduction peak was related to the surface alloy composition. Figure 3 displays the tenth stable cycle voltammograms (CVs) recorded on Pd/C (Figure 3A), Au/C (Figure 3B) and Pd3Au7/C (Figure 3C) catalysts under the same experimental conditions at 5 mV s−1 and 293 K in a N2-purged 0.10 mol L−1 NaOH aqueous electrolyte. The CV in Figure 3A presents features typically recorded on a clean Pd/C catalyst [36,37], with the region of hydrogen adsorption/absorption (negative current densities) and hydrogen desorption (positive current densities) between +0.100 V and +0.550 V vs. RHE [37], and that of the Pd surface oxidation (positive current densities) and Pd surface oxide reduction (negative current densities) between +0.550 V and +1.450 V vs. RHE, the surface oxide reduction peak being centered at +0.650 V vs. RHE [36]. The CV in Figure 3B presents features typically recorded on clean Au/C catalysts, with Au surface oxide formation (positive current densities) and reduction (negative current densities) in the +1.000 V to +1.450 V vs. RHE region [38], the reduction peak being centered at +1.100 V vs. RHE. Considering the theoretical charge density values of 424 μC cm−2 for the reduction of a PdO monolayer [39] and of 280 μC cm−2 for the reduction of an AuO monolayer [40] formed in 0.10 M NaOH electrolyte for an upper potential limit of +1.450 V vs. RHE, electrochemical surface areas (ECSA) of circa 61 m2 g−1 and 14 m2 g−1 are calculated for Pd/C and Au/C catalysts, respectively.
The tenth stable CV in Figure 3C recorded on the Pd3Au7/C catalyst displays a very small hydrogen region in the potential range from +0.100 V to +0.500 V vs. RHE. The surface oxidation region (positive current densities) in the potential range from +0.600 V to +1.450 V vs. RHE leads to several reduction peaks for the negative potential scan located at +1.100 V vs. RHE, +0.835 V vs. RHE and +0.735 V vs. RHE. The negative peak at +1.100 V vs. RHE is related to the reduction of gold surface oxides, the negative peaks at +0.835 V and +0.735 V vs. RHE are related to the reduction of different oxidized PdAu surface alloys. Their compositions are calculated from the following equations [35]:
E red alloy = X Pd E red PdO + X Au E red AuO
X Pd + X Au = 1   X Au = 1 X Pd
E p alloy = X Pd E red PdO + ( 1 X Pd ) E red AuO
X Pd = E p E red AuO E red PdO E red AuO
where XPd and XAu are the Pd and Au atomic fractions, respectively, in the PdAu surface alloy, E red PdO and E red AuO are the potential values of the reduction peaks of PdO and AuO surface oxides, respectively, ( E red PdO = +0.650 V vs. RHE and E red AuO = +1.100 V vs. RHE) and E p alloy is the potential value of the reduction peak of the PdAu surface alloy.
The coulombic charges in the reduction peaks allow determining the surface percentage of each structure and then determining the whole surface composition [25,27,41]. The surface of the Pd3Au7/C catalyst exhibits non-alloyed Au islands (56% of the surface) and two PdAu alloys with Pd/Au atomic compositions of 6/4 (36% of the surface) and 8/2 (8% of the surface) leading to a global surface composition of 28 at% Pd and 72 at% Au close to the bulk nominal one (30 at% Pd and 70 at% Au). The ECSA of the bimetallic catalyst could be determined using the method developed by Łukaszewski and Czerwiński [42]. A value of 20 m2 gmetal−1 between that of Au/C and that of Pd/C is obtained, which agrees with particle and crystallite sizes determined by TEM and XRD, respectively. Main characterization data are listed in Table 1.

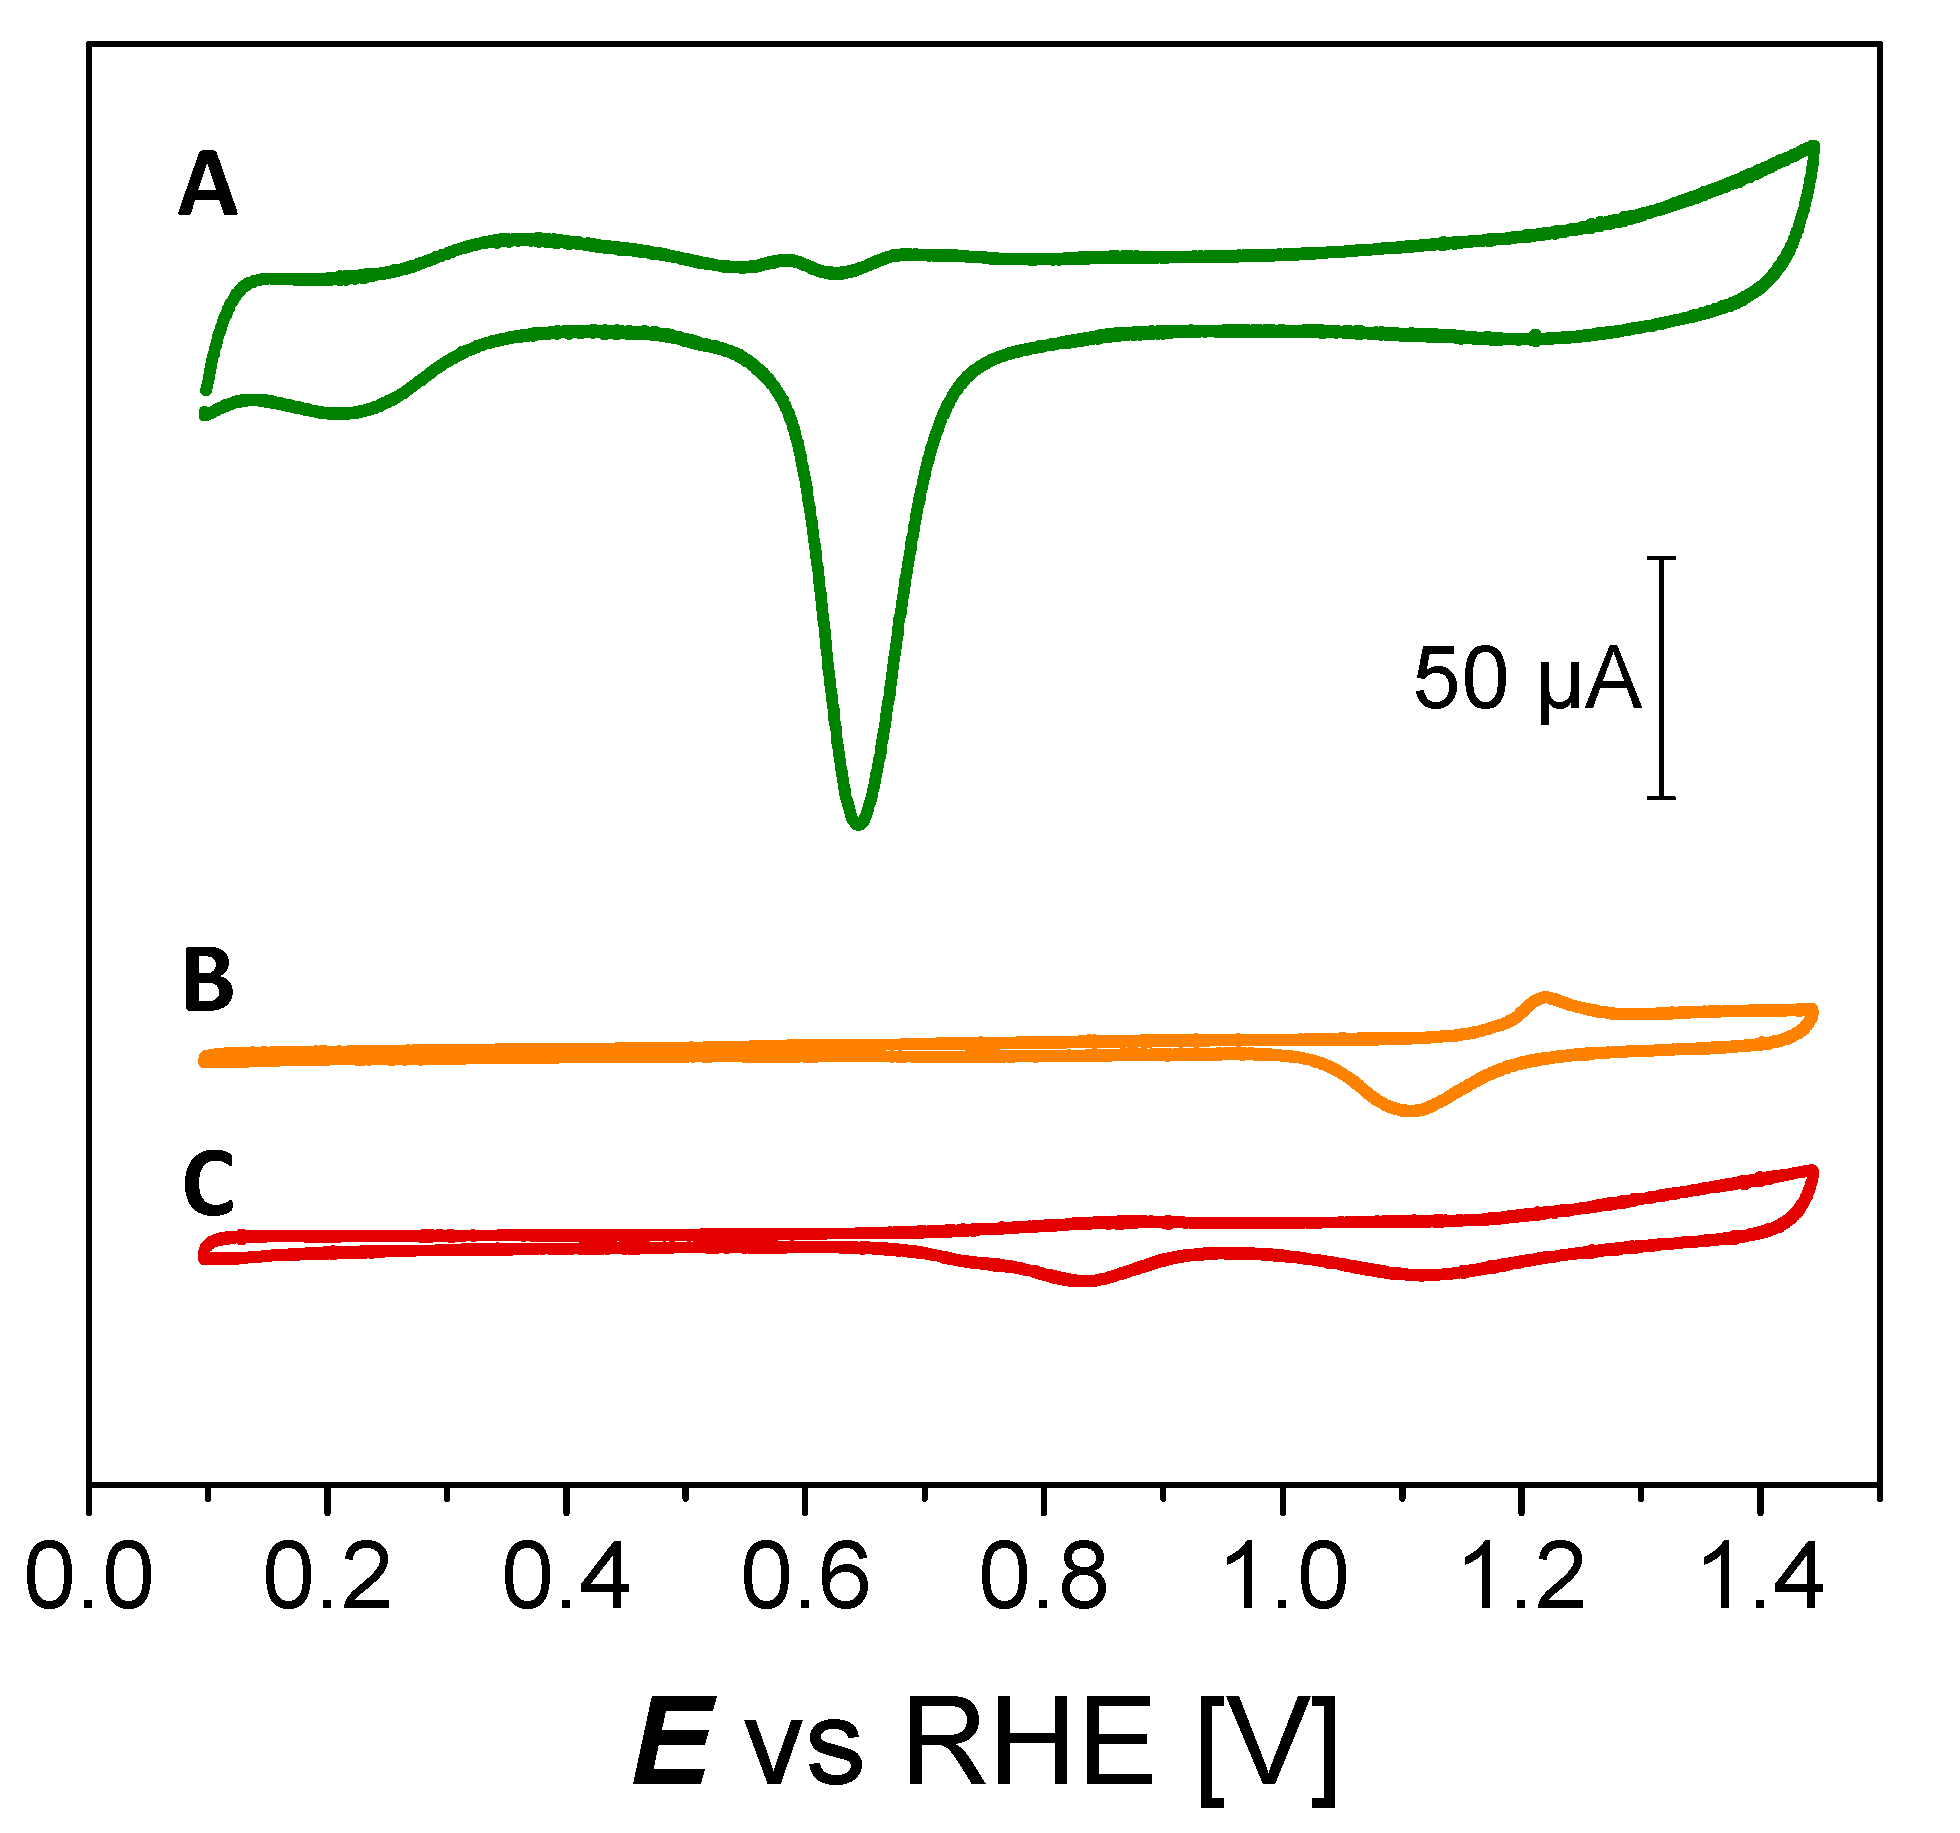
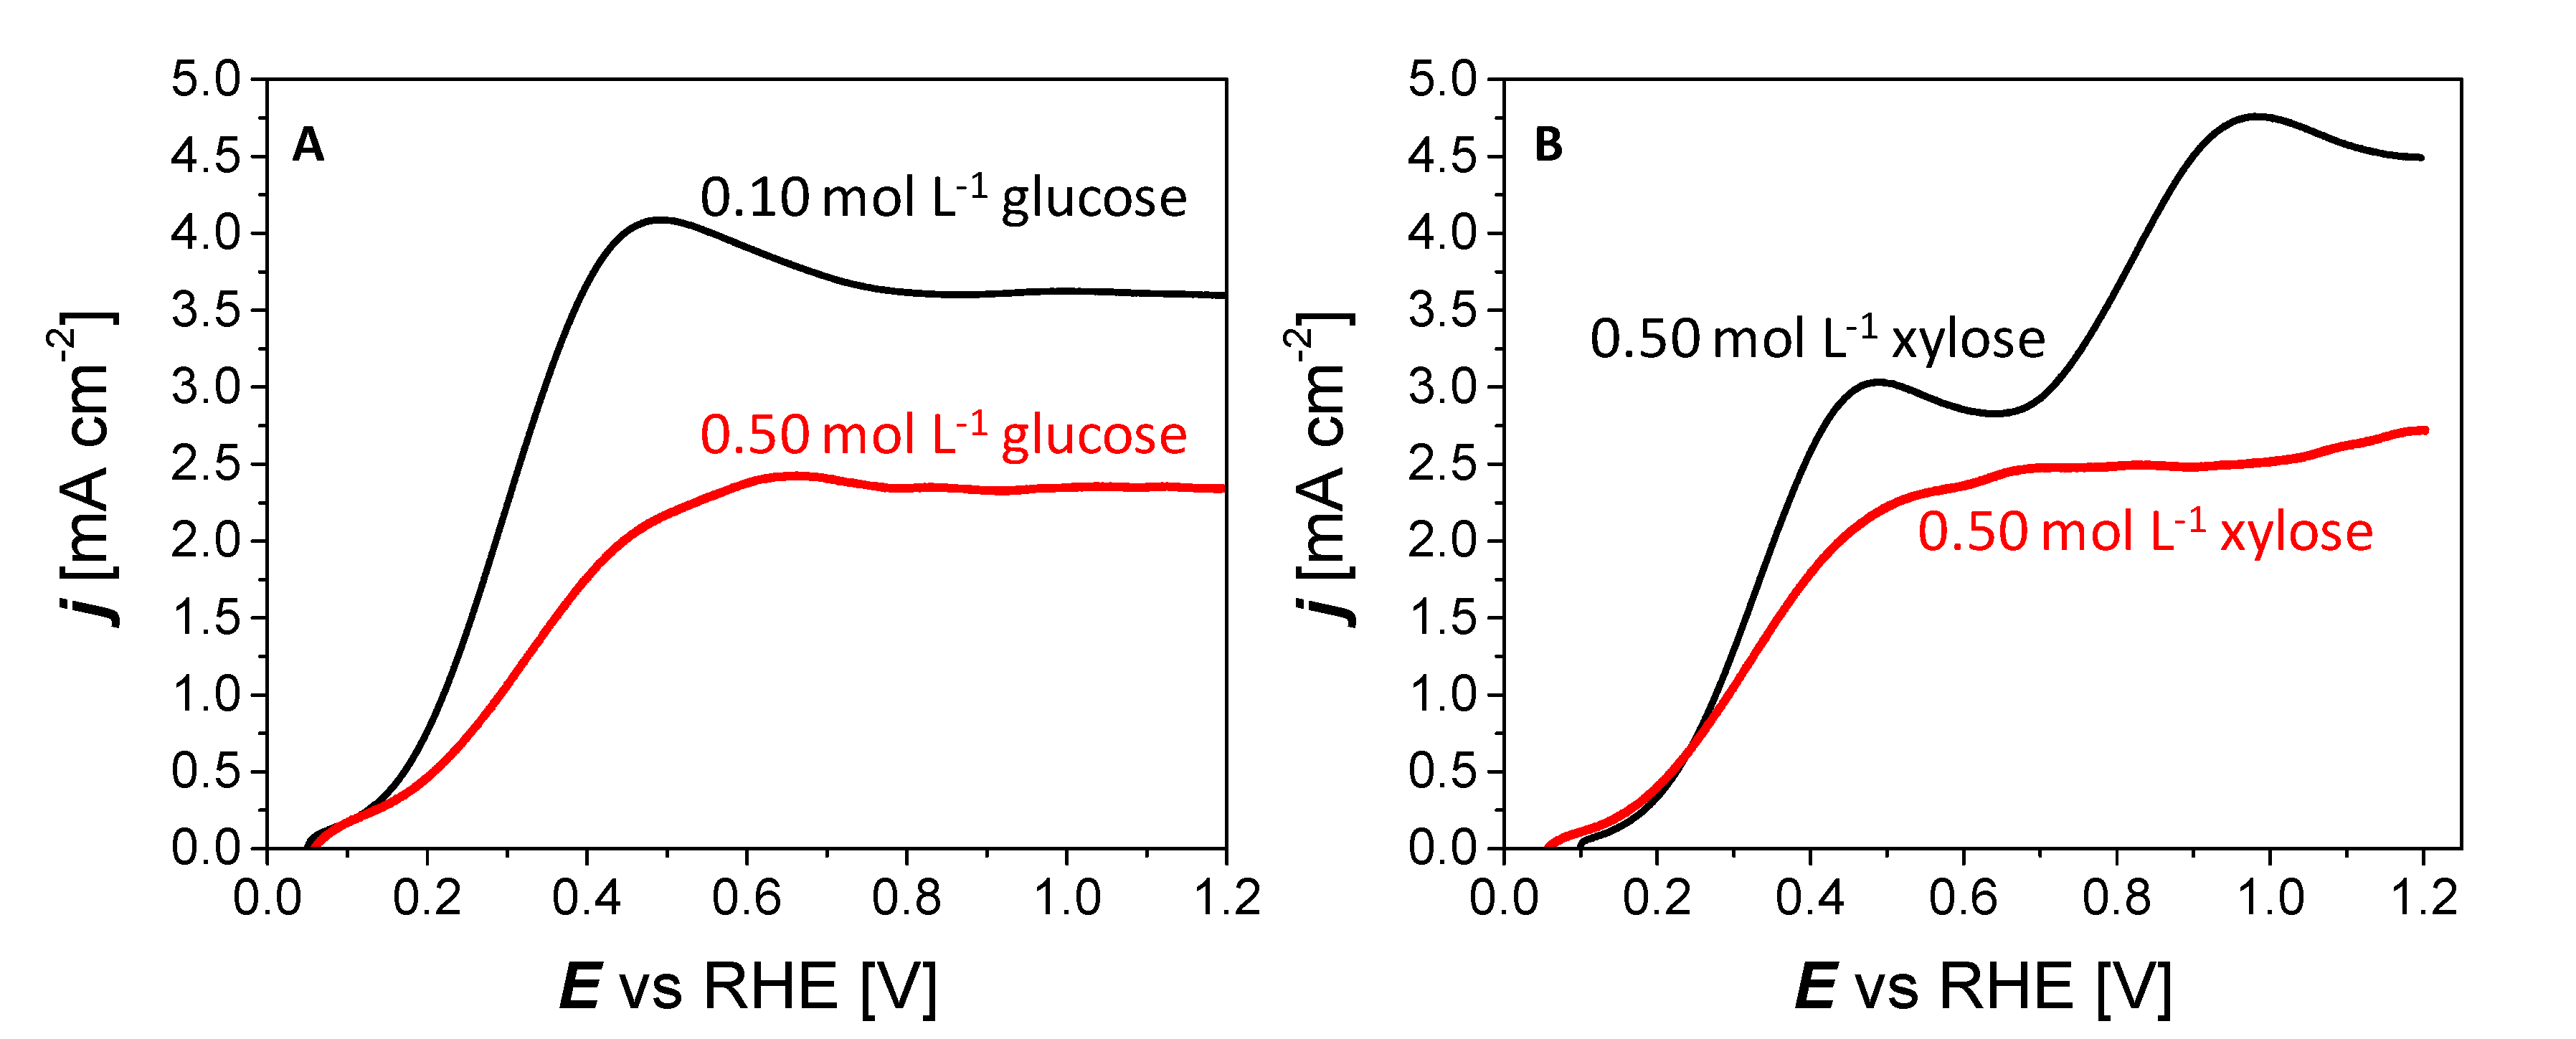
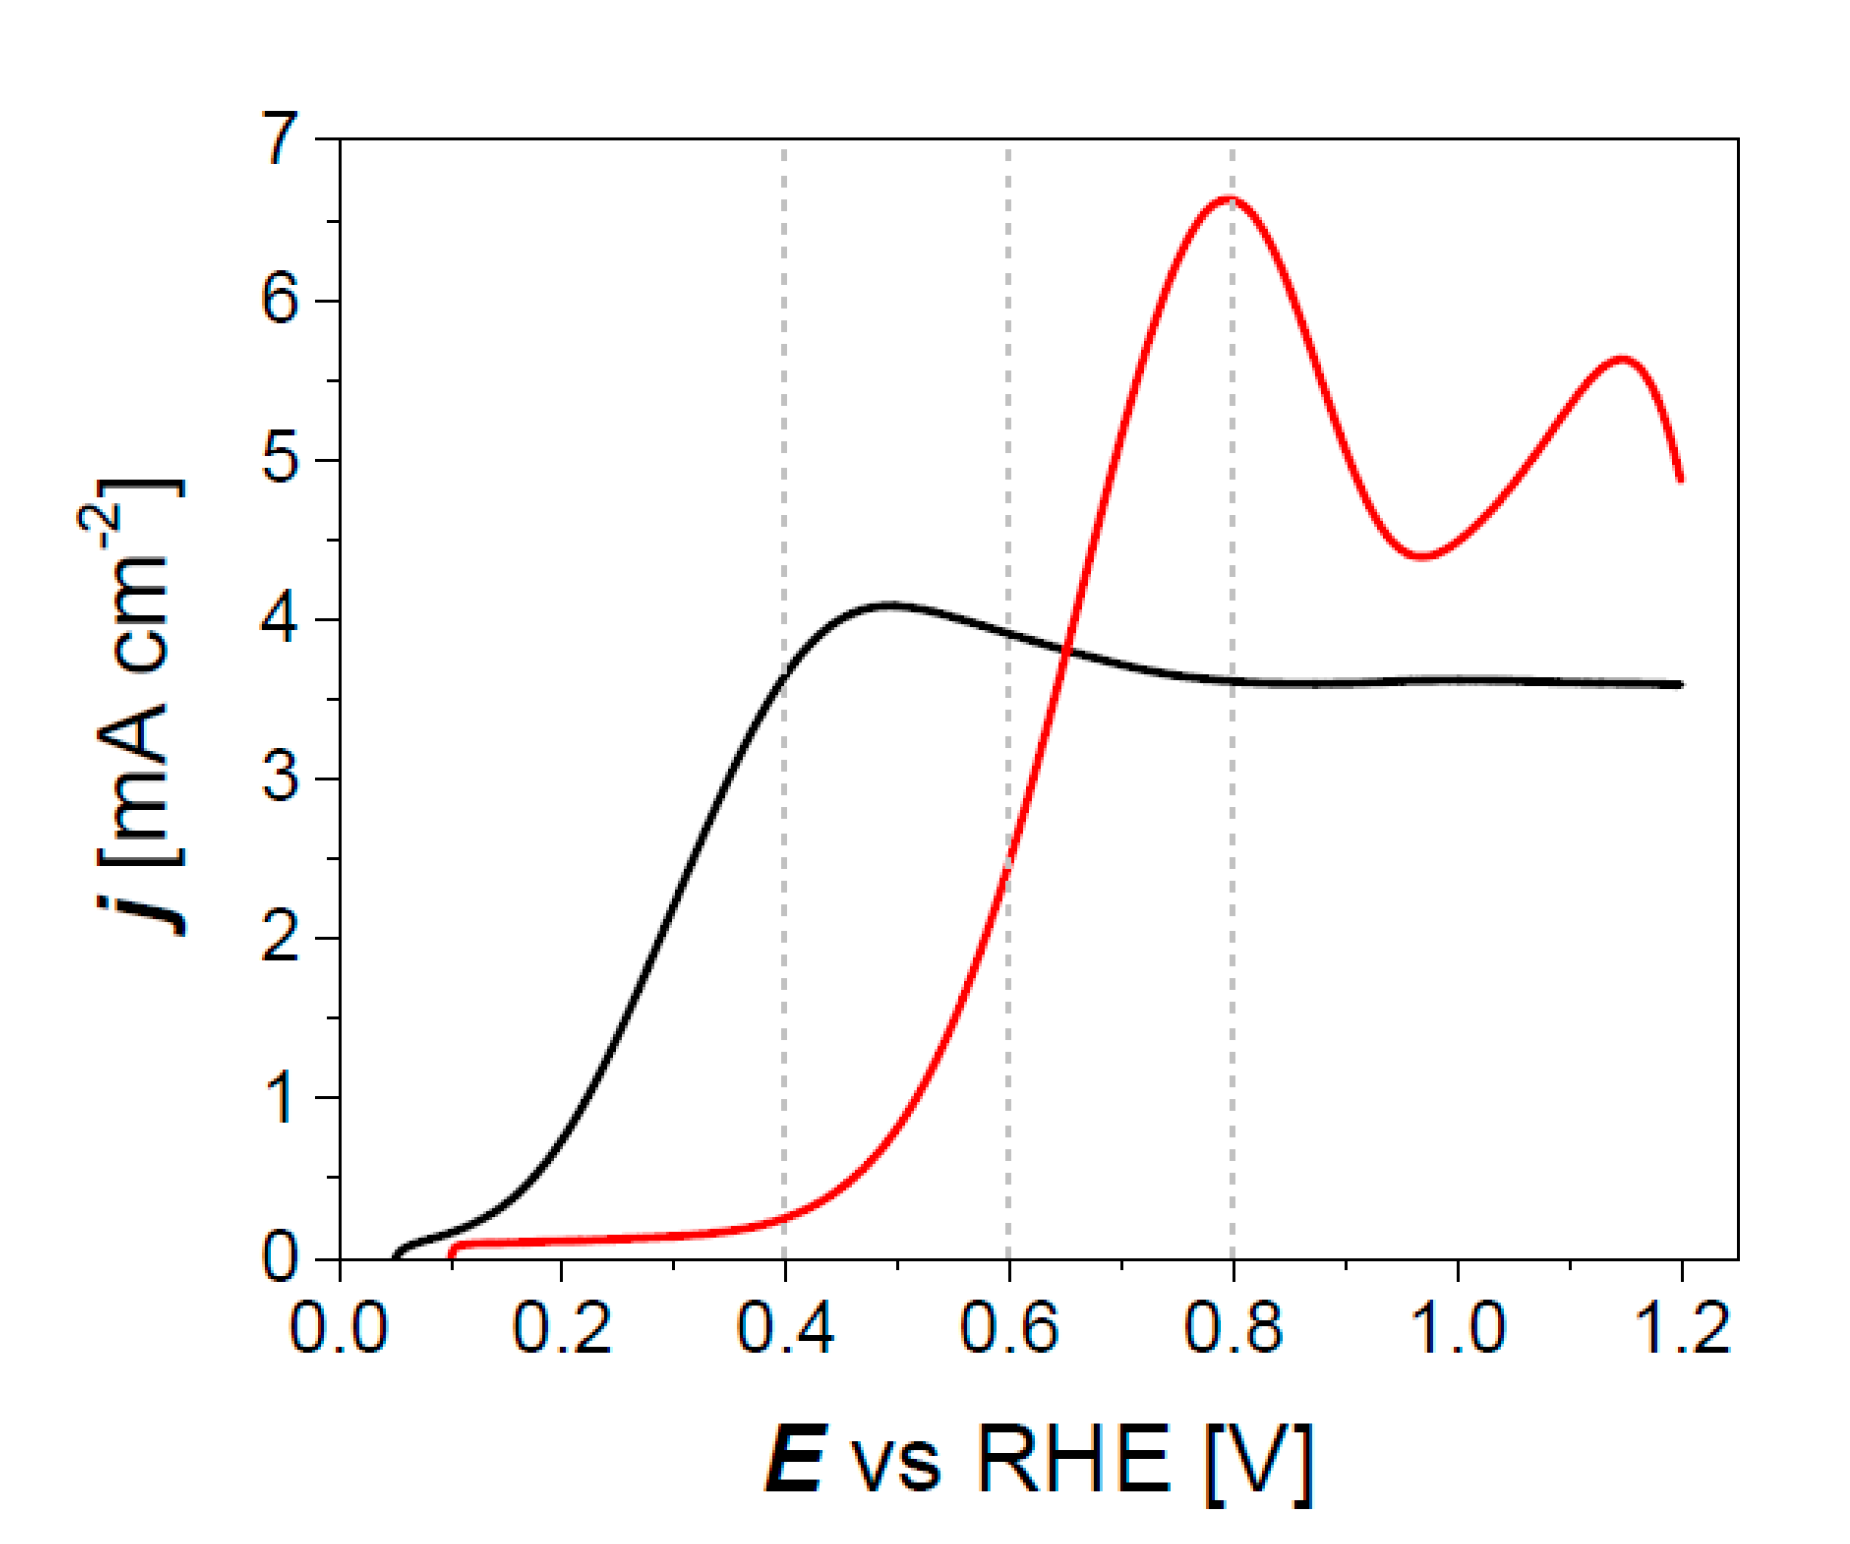
3.2. Electrocatalytic Activity of Pd3Au7/C Materials

Figure 4 compares the third (stable) linear scan voltammetry (LSV) curves recorded at 5 mV s−1 on monometallic Pd/C, Au/C and bimetallic Pd3Au7/C catalysts for the oxidation of 0.10 mol L−1 glucose (Figure 4A) and 0.10 mol L−1 xylose (Figure 4B) in 0.10 mol L−1 NaOH aqueous electrolyte. The bimetallic Pd3Au7/C catalyst leads to lower onset potentials of sugar oxidation (circa +0.100 V vs. RHE and circa+ 0.150 V vs. RHE for glucose and xylose, respectively) and to higher activities from the sugar oxidation onset potentials to circa +0.700 V vs. RHE as higher current densities are recorded over this potential range. Elsewhere [24], it has been proposed that the high catalytic activity at low potentials of the Pd3Au7/C catalyst was mainly due to the “ensemble effect” [43]: the presence of gold at the surface of the catalytic nanoparticles leads to avoid or limit surface poisoning from dissociative adsorption of glucose or xylose into adsorbed CO species on palladium. However, the “ligand effect” [43] cannot be discarded: the change of the cell parameter when alloying Pd and Au results in change of the electronic density of states close to the Fermi level [44], which further impacts the adsorption process and adsorption strength of species modifying the route, intermediates and products of the electro-oxidation reaction.
Figure 5 compares the LSV curves recorded at the Pd3Au7/C catalyst in 0.10 mol L−1 NaOH medium in the presence of 0.10 mol L−1 and 0.50 mol L−1 glucose (Figure 5A) and of 0.10 mol L−1 and 0.50 mol L−1 xylose (Figure 5B). The oxidation onset potentials of both sugars are the same as those observed with 0.10 mol L−1 aldoses, but the achieved current densities are lower over the whole potential range studied with 0.50 mol L−1 glucose or xylose than with 0.10 mol L−1 glucose or xylose. This behavior can be explained in terms of higher poisoning of the catalyst surface due to higher concentration of sugars. Indeed, in the high potential range (E > +0.500 V vs. RHE) the current densities remain lower in the presence of 0.50 mol L−1 glucose or xylose than in the presence of 0.10 mol L−1 glucose or xylose. In this potential region, both metals, Pd and Au, become able to adsorb and activate water or hydroxyl molecules [45] that will serve to complete the oxidation reaction and to desorb high oxidized species (bifunctional or Langmuir-Hinshelwood mechanism [43]). The increase of the concentration of glucose or xylose changes the balance between adsorbed species from glucose or xylose and adsorbed OH species favoring the first process at the expense of the second one and then the poisoning of the catalytic surface by organics from adsorption. It is also possible that the presence of high amount of glucose or xylose in the vicinity of the catalyst surface decreases the hydroxyl concentration gradient, and hence, the internal conductivity of the cell, therefore its efficiency.

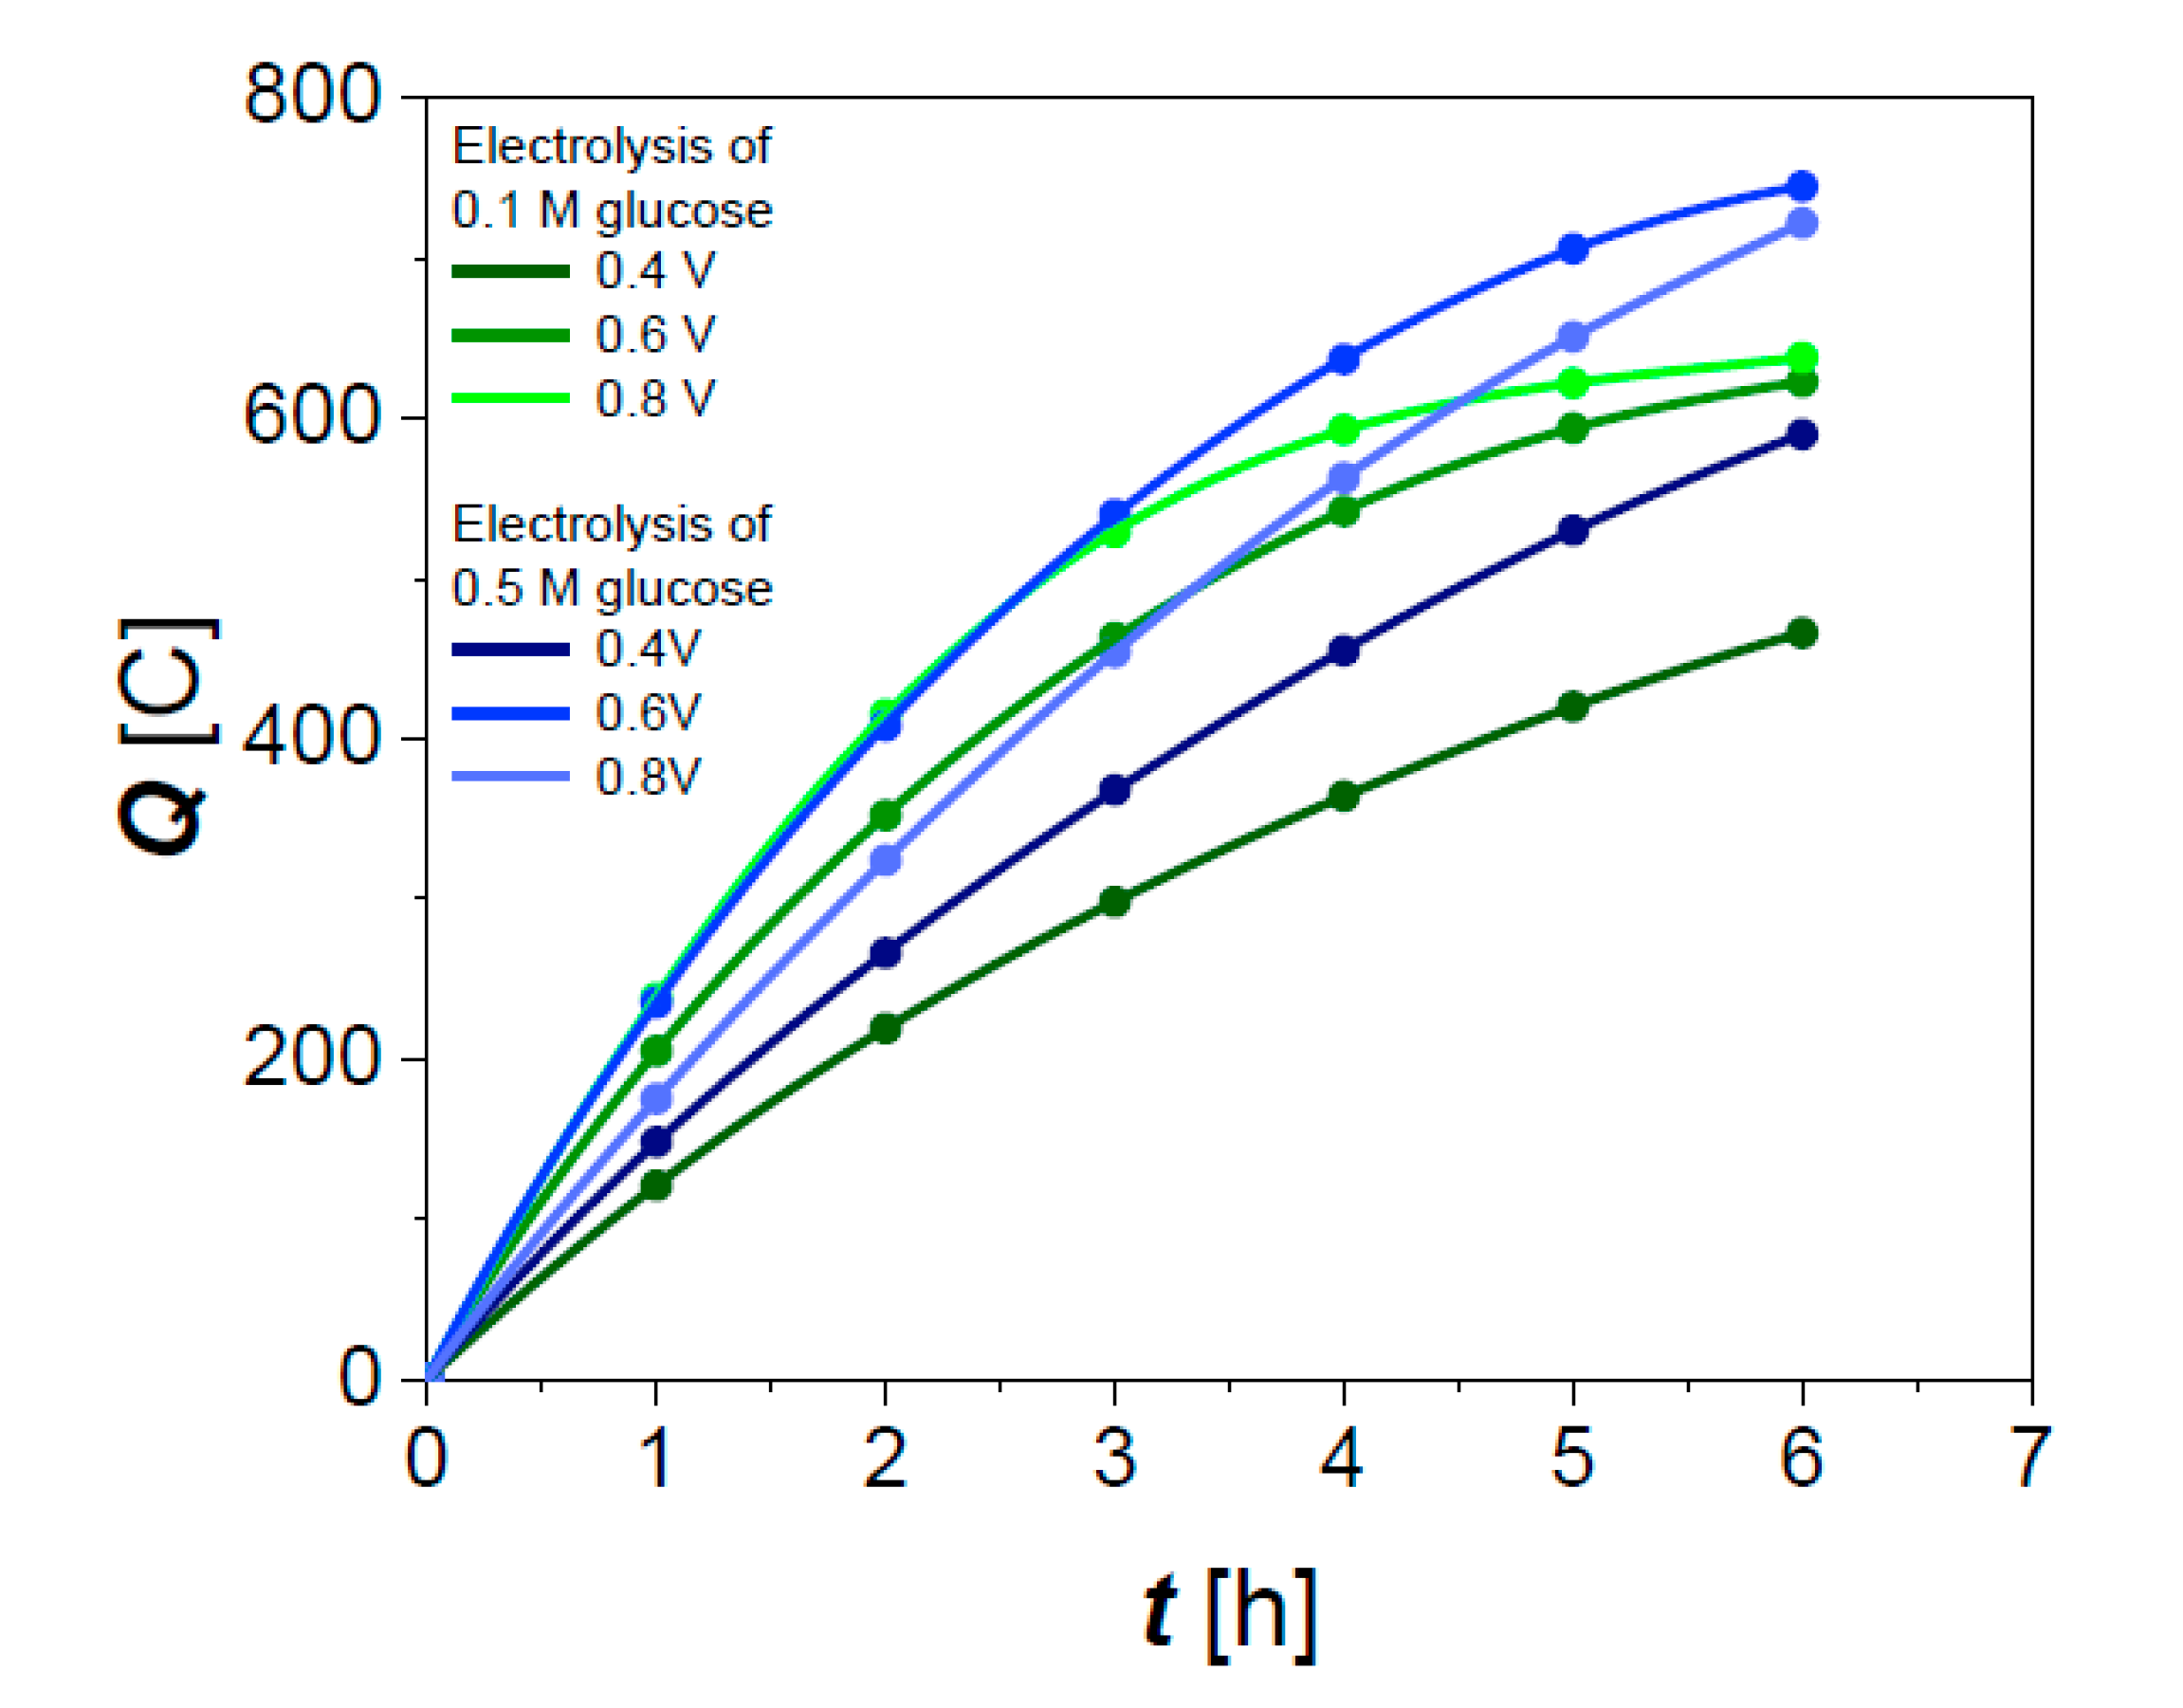
3.3. Chronoamperometry (CA) Measurements

In order to verify the effects of the concentration and cell voltage in a real electrosynthesis flow reactor, chronoamperometry measurements were carried out for six hours at 293 K at different cell voltages (Ucell = +0.4 V, +0.6 V and +0.8 V) in a filter-press like electrolysis cell fitted with a Pd3Au7/C anode for the oxidation of 30 mL alkaline aqueous solution (0.10 mol L−1 NaOH) of glucose or xylose at different concentrations (0.10 mol L−1 and 0.50 mol L−1) and a Pt/C cathode for the hydrogen evolution reaction as counter reaction. The formation of gluconate or xylonate is followed as a function of time by HPLC. In order to avoid the complete consumption of dissolved sugars, which will result in oxidation of primary reaction products into secondary reaction products, and will further decrease the selectivity, the electrolysis time was fixed at 6 hours. The metal loading in electrodes (40 wt%) was chosen to reduce the electrode thickness in order to achieve high hydroxyl ion conductivity and mass transport rate (reactants towards catalytic sites and reaction products away from catalytic sites) [46]. Moreover, the pH of solution was measured before and after chronoamperometry measurements. The initial pH value was 13, whereas the final pH values were never measured below 12.

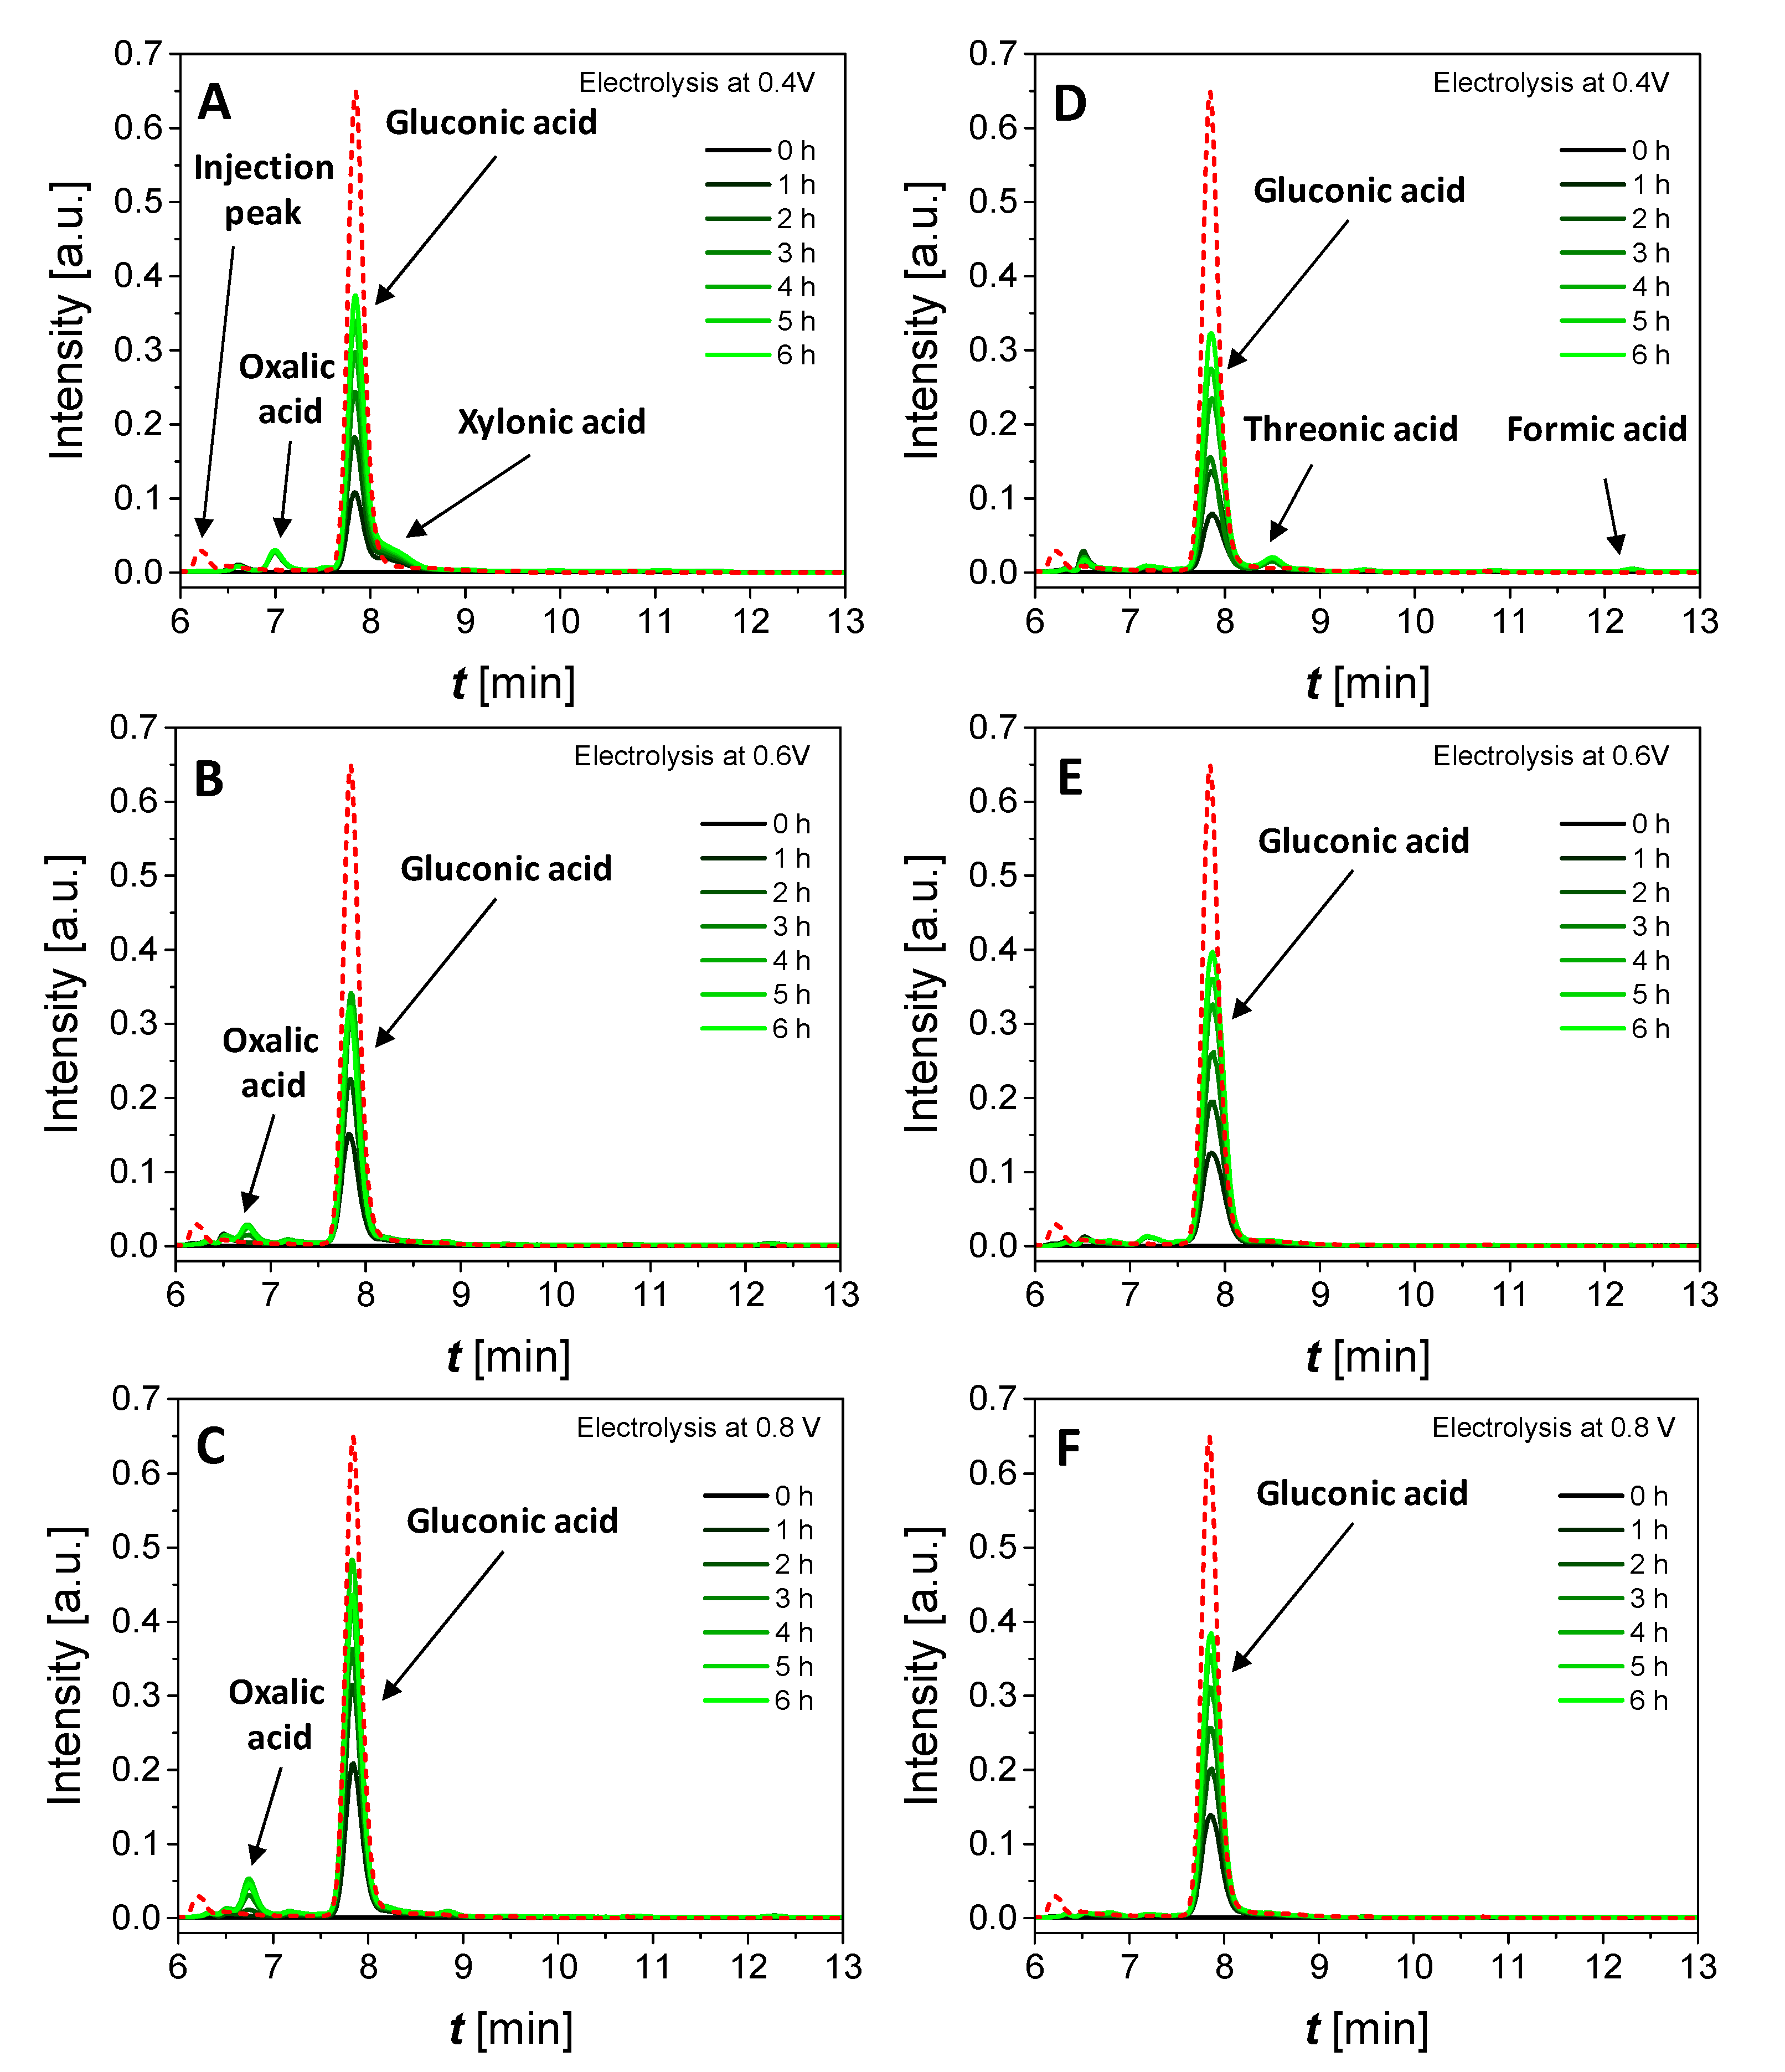
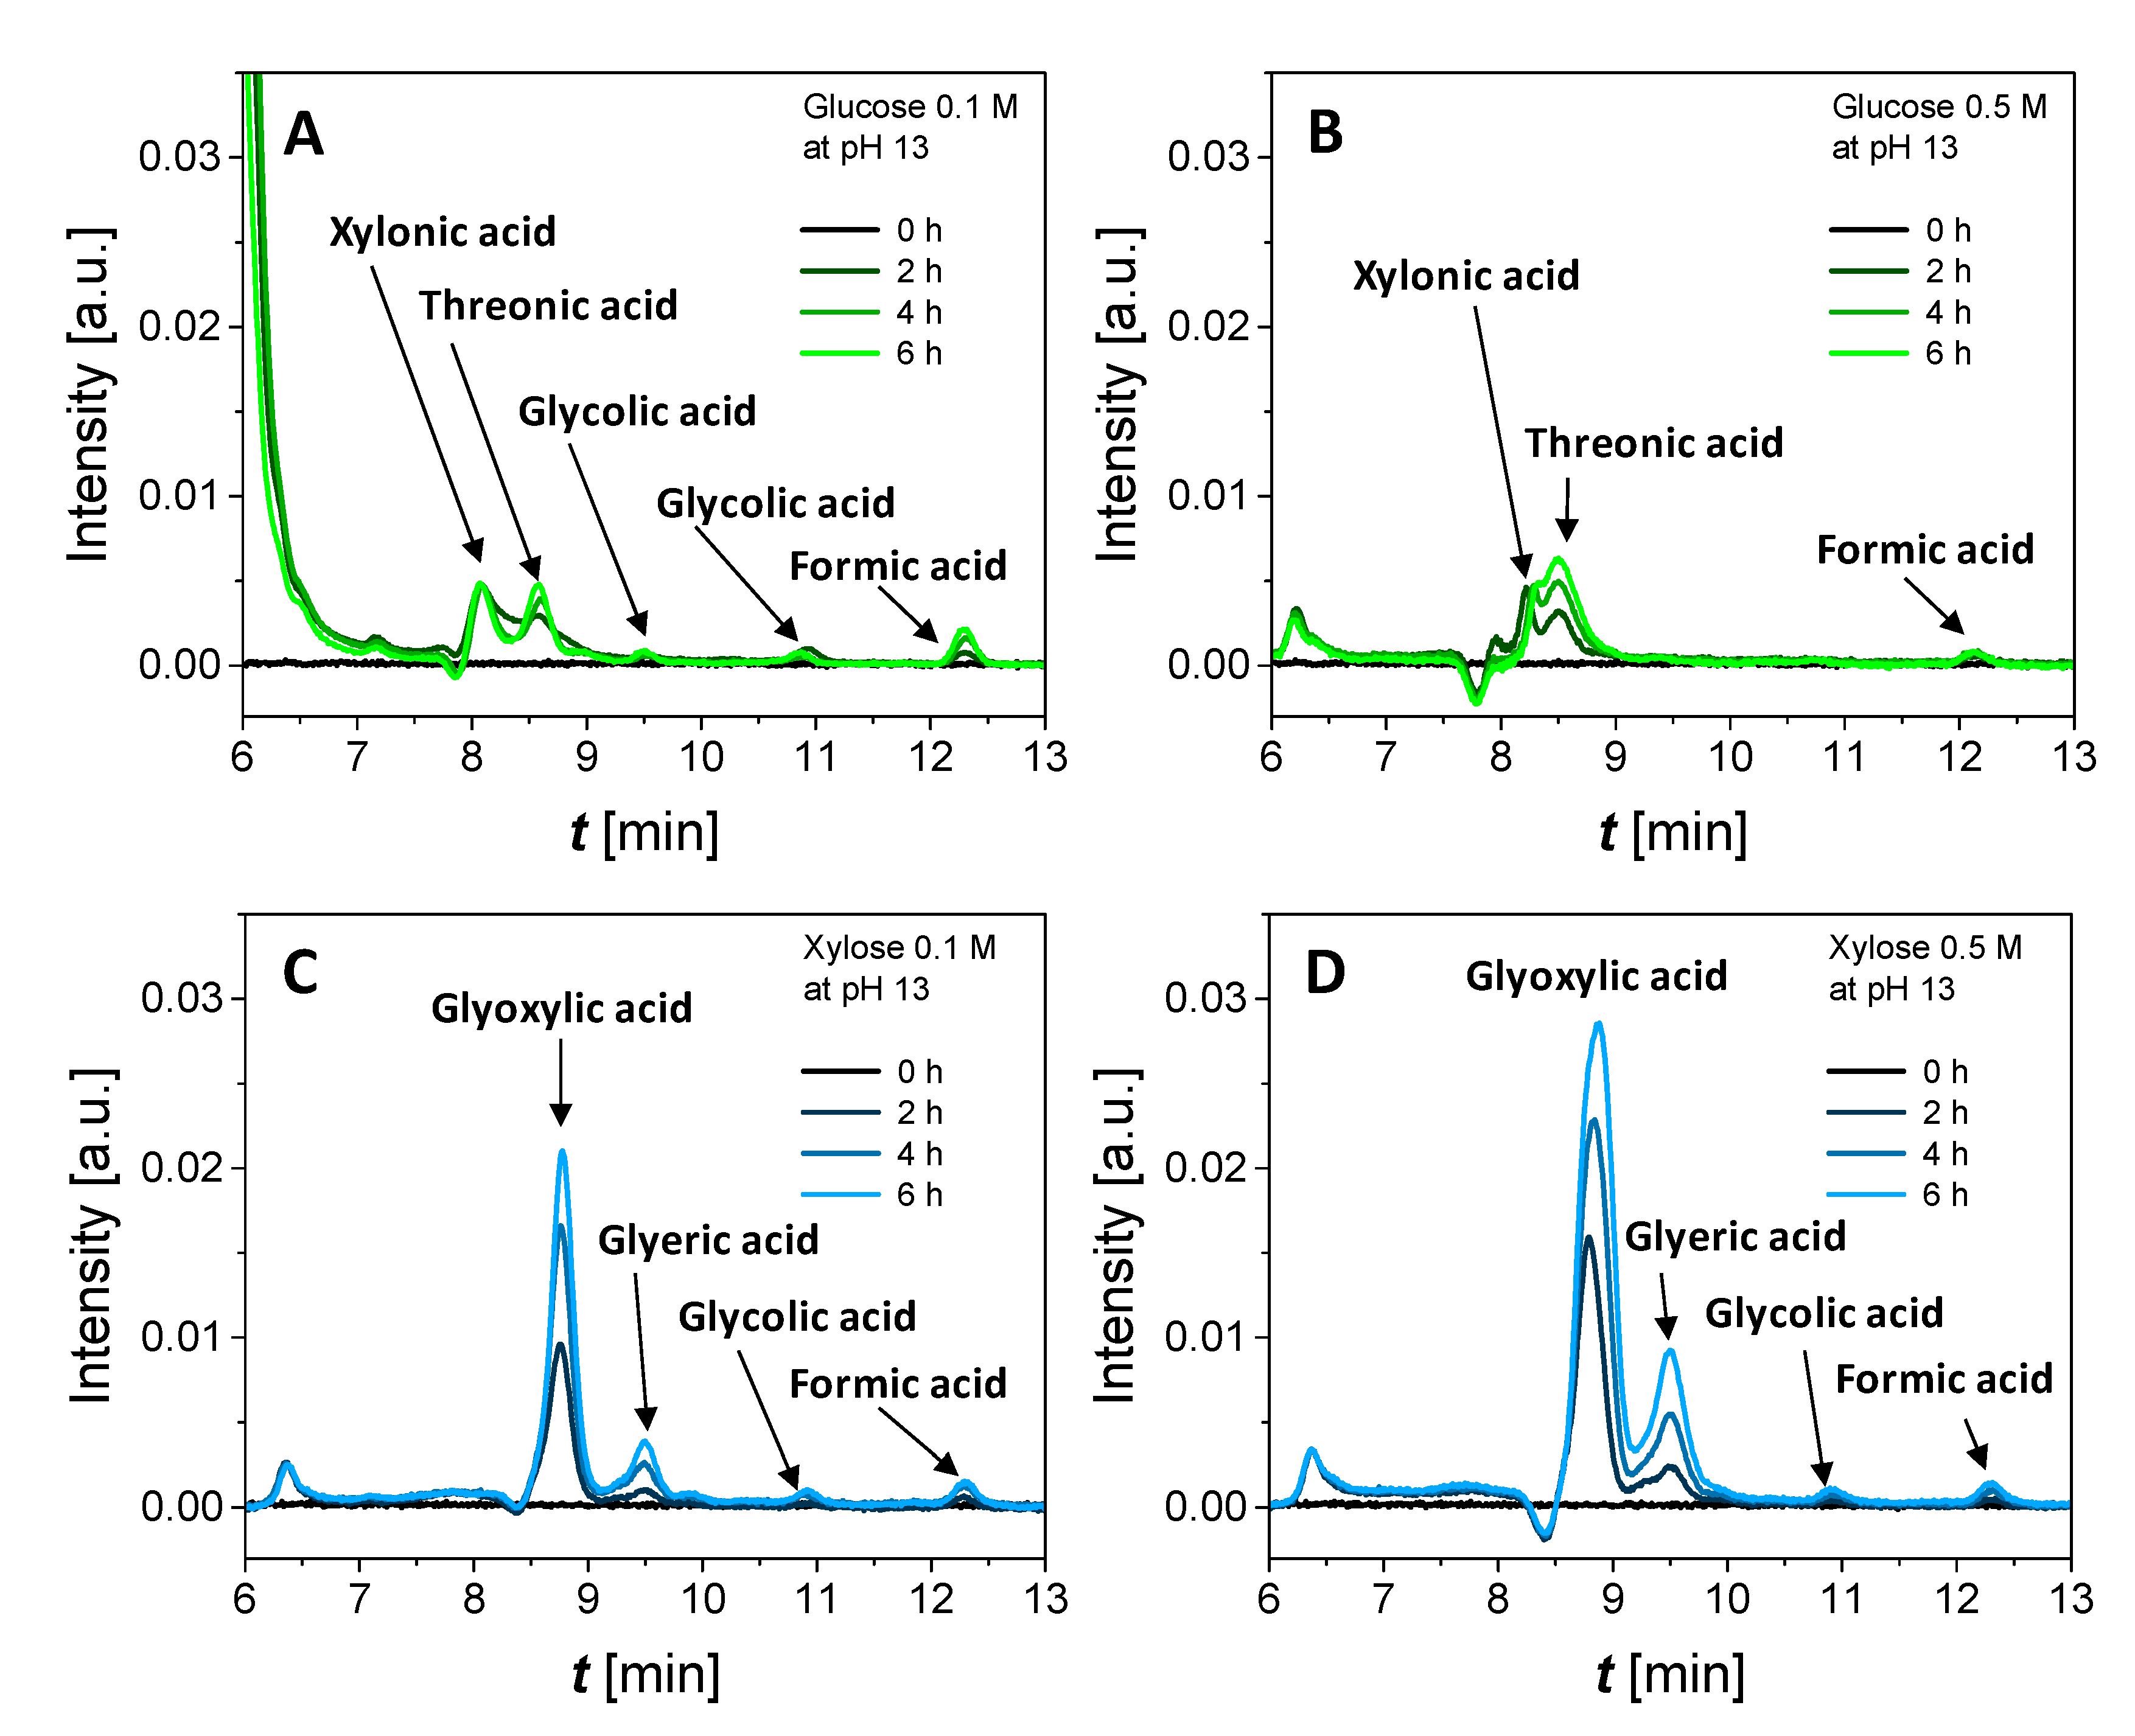
3.3.1. Effect of Cell Voltage and Glucose Concentration

The results for the electro-reforming of glucose are given in Table 2. Regarding the charges involved for 0.10 mol L−1 glucose oxidation, the higher the cell voltage, the higher the charge achieved after six hours of electro-reforming. The Q(t) curves at +0.6 V and +0.8 V are less separated than those at +0.4 V and +0.6 V (Figure 6), which indicates that mass transport limitation may occur in agreement with the polarization curve recorded for the oxidation of 0.10 M glucose at Pd3Au7/C in Figure 4A, which shows a diffusion plateau for potentials higher than +0.700 V vs. RHE. The Q(t) curves at +0.6 V and +0.8 V tend to a very close value at t = 6 h (Figure 6), which is mainly due to the depletion of reactant in the feeding solution. Indeed, we have shown in a previous work that the decay in current vs. time (i.e., in charge involved) for glucose electro-reforming at +0.4 V on Pd3Au7/C was due to glucose depletion [24]. At cell voltages of +0.6 V and +0.8 V, the same effect could occur more dramatically, even if the catalyst surface restructuration cannot be discarded at such high anode potentials. For 0.50 mol L−1 glucose electro-reforming, higher coulombic charges are involved at +0.4 V and +0.6 V than for 0.10 mol L−1 glucose electro-reforming at +0.4 V and +0.6 V (Figure 6), respectively. However, for a cell voltage of +0.8 V the charges involved are lower than those at +0.6 V, which can be explained in terms of higher surface poisoning in agreement with results from electrocatalytic study in Section 3.2.
From the coulombic charges involved for the electro-reforming of glucose, the theoretical concentrations of gluconate (CCA), which are expected assuming only the formation of gluconate via a two-electron process (Equations (5)–(7)), are calculated and given in Table 2.
Anode: C6H12O6 + 3OH → C6H11O7 + 2H2O + 2e
Cathode: 2H2O + 2e → H2 + 2OH
Overall: C6H12O6 + OH → C6H11O7 + H2
The comparison of these theoretical concentrations to the actual ones determined by HPLC (CHPLC) allows determining the faradaic efficiency for the glucose electro-conversion reaction (ηF). Figure 7 displays the sets of chromatograms recorded as a function of time for the electro-reforming of 0.10 mol L−1 and 0.50 mol L−1 glucose at cell voltages of +0.4 V, +0.6 V and +0.8 V, together with the chromatograms corresponding to that of 0.10 mol L−1 sodium gluconate standard recorded after each measurement campaign (red line).
All chromatograms display the same main peak centered at circa 7.7 min that corresponds to the retention time of gluconic acid. A small peak at a retention time of circa 6.8 min can be attributed to some traces of a diacid, certainly oxalic acid according to the chromatograms presented in Figure 8. The integration of the peak at 7.7 min and the comparison of its surface with that of the 0.10 mol L−1 sodium gluconate standard allows determining the experimental gluconate concentration for each given glucose concentration, cell voltage and sampling time. Knowing the theoretical gluconate concentrations from chronoamperometry measurements (CCA) and the actual ones from HPLC analyses (CHPLC), the faradaic yield (ηF) can be calculated. Results are given in Table 2. The highest faradaic yields are obtained for low glucose concentration (0.10 mol L−1) and low cell voltage (+0.4 V) with values decreasing from 77.5% to 63.3% between 1 h and 6 h of CA. However, a higher gluconate production rate (0.075 mol L−1) is obtained for the electro-reforming of 0.10 mol L−1 glucose at +0.8 V for 5-h CA. It seems that the increase of the glucose concentration does not improve the process efficiency, whereas the increase of the cell voltage up to +0.8 V allows increasing the gluconate formation rate and amount (chemical yield, ηCh).
Looking at the general shapes of the main peak centered at circa 7.7 min in chromatograms of Figure 7, one can remark that this peak is asymmetric for measurements at +0.4 V with a shoulder at slightly higher retention time and symmetric for measurements at higher cell voltages. In a previous work [24], we have shown that the electro-conversion of 0.10 mol L−1 glucose at a cell voltage of +0.4 V produced few amounts of xylonate and threonate. For the higher cell voltages of +0.6 V and +0.8 V gluconate is the only compounds detected.
The amounts of glucose remaining after 6 h CA of 0.10 mol L−1 glucose solutions at cell voltages of +0.6 V and +0.8 V are determined by HPLC, leading to 0.0130 mol L−1 at +0.6 V and 0.0190 mol L−1 at +0.8 V. However, only 0.0500 and 0.0670 mol L−1 gluconate are formed at +0.6 and +0.8 V, respectively (Table 2). Thus, 0.0370 mol L−1 glucose at +0.6 V and 0.0140 mol L−1 glucose at +0.8 V are transformed into other compounds than gluconate. Because HPLC measurements show no peak from the injection peak retention time to 20 min that could corresponds to any possible C1 to C5 degradation products (Figure 8), it is possible that these other compounds are carbonate and carbon dioxide, which are not detected by HPLC. Indeed, we showed in a previous work [24] using in-situ infrared spectroscopy measurements that the formation of CO2 occurred from circa 0.6 V vs. RHE on a Pd3Au7/C catalyst for the oxidation of 0.10 mol L−1 glucose or xylose in 0.10 mol L−1 NaOH electrolyte. The counter reaction in the electrolysis cell is the very fast hydrogen evolution reaction at a Pt/C electrode (occurring with a low over-potential) and the H2O/H2 redox couple has a reversible potential of 0.000 V vs. RHE; the cell voltage being the different between the anode potential and the cathode potential, the anode potential values are close to the applied cell voltage values [24,30], i.e., +0.6 V vs. RHE and +0.8 V vs. RHE. If CO2 is formed, then carbonate is also formed in alkaline medium.

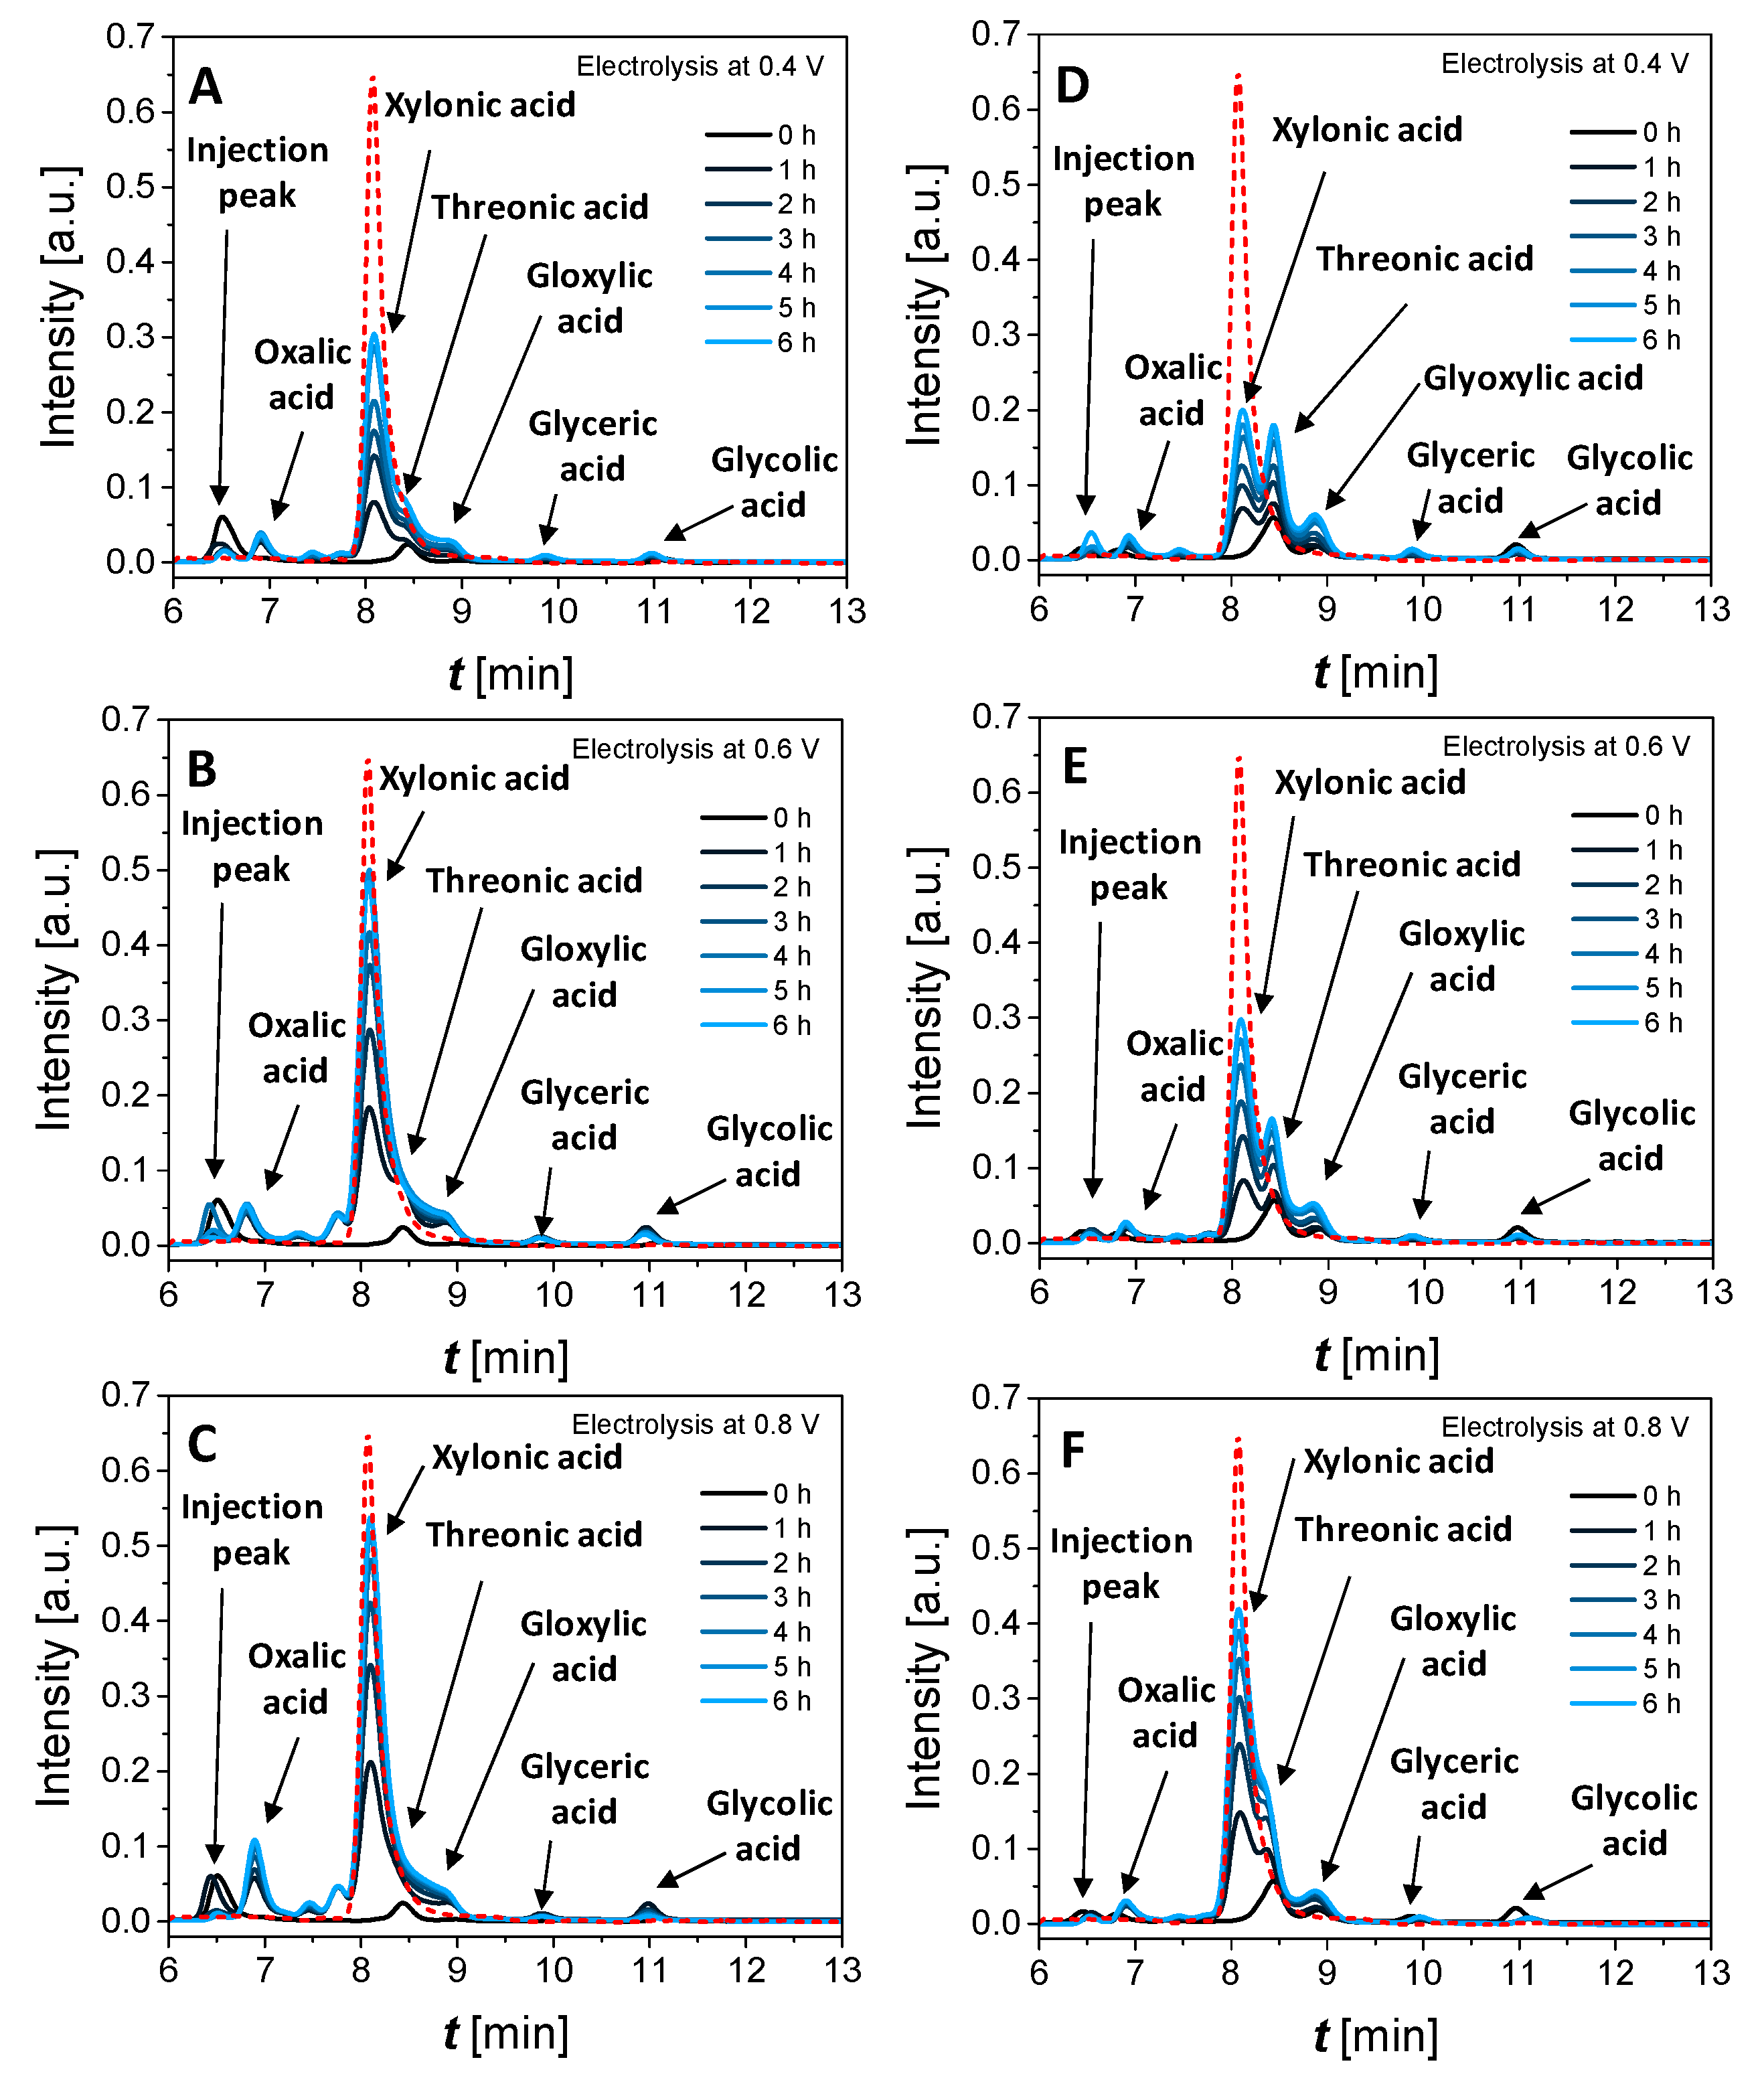
3.3.2. Effect of Cell Voltage and Xylose Concentration

The same experiments as for glucose electro-reforming were performed with 30 mL xylose solutions feeding the electrolysis cell. Results are presented in Table 3. Globally, the same trends as for glucose electro-reforming are observed, but the faradaic yields for xylose into xylonate are generally higher than those for glucose into gluconate for given concentration and cell voltage. As for glucose electro-reforming, higher faradaic yields are obtained for low xylose concentration (0.10 mol L−1) and low cell voltage (+0.4 V) with values decreasing from 100% to 80.3% between 1 h and 6 h CA. However, a higher xylonate production rate (0.082 mol L−1) is obtained for the electro-reforming of 0.10 mol L−1 xylose at +0.8 V for 6-h CA than in the case of glucose electro-reforming under the same experimental conditions. It seems again that the increase of the xylose concentration does not improve the process efficiency, whereas the increase of the cell voltage up to +0.8 V allows improving the xylonate formation rate and amount (chemical yield).
Figure 9 displays the sets of chromatograms recorded at different cell voltages and xylose concentrations. All chromatograms appear very complex with several peaks, indicating that several products are formed. All chromatograms also present a main peak at 8.1 min, corresponding to the retention time of xylonic acid. Among the other peaks, a first one at circa 6.3 min is already present at t = 0 h, i.e., for the xylose solution, and can be assigned to the injection peak. The second and third ones at 6.8 and 7.4 min are reasonably attributed to diacids, certainly oxalic and xylaric acids, respectively. Indeed, looking to the chromatograms of standards in Figure 8, all diacids display retention times lower than those for monoacids. A fourth small peak at 7.6 min is visible when chronoamerometry measurements are performed on 0.10 mol L−1 xylose with the intensity increasing with the cell voltage. This is certainly related to the formation of another diacid or an aldehyde acid. Indeed, the peak corresponding to glucuronic acid in Figure 8 appears at a higher retention time that that of glucaric acid. The same trend could occur for reaction products from xylose oxidation (xyluronic and xylaric acids). This peak present much lower intensity in the case of electro-reforming of 0.5 mol L−1 xylose. For higher retention times, the peaks at circa 8.4 min, 9.8 min and 10.8 min correspond to threonic, glyceric and glycolic acids, respectively. It is worth to note that no formic acid was detected for all xylose concentrations and cell voltages. Most of these last peaks indicate that some degradation products from xylose oxidation are formed, according to the following anodic reactions:
Threonate: C5H10O5 + 9OH → C4H7O5 + CO32− + 6H2O + 6e
Glycerate: C5H10O5 + 15OH → C3H5O4 + 2CO32− + 10H2O + 10e
Glycolate: C5H10O5 + 21OH → C2H3O3 + 3CO32− + 14H2O + 14e
Oxalate: C5H10O5 + 26OH → C2O42− + 3CO32− + 18H2O + 18e
Carbonates: C5H10O5 + 30OH → 5CO32− + 20H2O + 20e
Furthermore, the peak observed at a retention time of 8.8 min, corresponding to glyoxylate, tends to increase with CA time. The glyoxylate could originate from the oxidation of glycolate, according to the following reaction:
C2H3O3 + 2OH → C2HO3 + 2H2O + 2e
Indeed, glycolate concentrations tend to remain constant at low cell voltages (Figure 9A,D) or to decrease with CA time at cell voltages over +0.6 V (Figure 9B,C,E,F).
At a low xylose concentration of 0.10 mol L−1, the relative intensities of peaks due to degradation products vary for cell voltages from +0.4 V to +0.6 V. For +0.8 V, the intensities of peaks related to threonic, glyceric and glycolic acids do not change significantly, whereas those of peaks assigned to oxalic acid and aldehyde-acid have increased, which indicates stronger degradation process induced by the anode potential. However, the intensities of the peaks related to degradation products are much lower than that of the peak of xylonic acid, indicating that they are formed as traces. The formation of xylonic acid increases from 0.0477 mol L−1 after 6-h CA at +0.4 V to 0.0770 mol L−1 after 5-h CA at +0.6 V and to 0.0820 mol L−1 after 6-h CA at +0.8 V, leading to faradaic yields of 80.3%, 66.3% and to 64.2%, respectively. The formation of degradation products even at a low extent consumes more electrons than that of xylonic acid, 6 to 20 (Equations (8)–(12)) against 2, respectively, explaining the decrease of the faradaic yield, while the selectivity towards xylose remains high.
At a high xylose concentration of 0.50 mol L−1, the co-formations of threonic and glyceric acids together with xylonic acid become important, being in the case of threonic acid almost as high as that of xylonic acid at +0.4 V, whereas co-formations of glycolic and oxalic acids are very low (traces). The higher charges involved in CA, the lower concentrations of xylonic acid determined by HPLC and the lower faradaic yields for 0.50 mol L−1 than for 0.10 mol L−1 xylose indicate a lower selectivity towards xylonate for high xylose concentrations.

4. Discussion

Both sugars, glucose and xylose, noticeably display the same behavior towards electro-reforming with respect to concentration and cell voltage. For instance, it is worth to note that for both sugars the faradaic yields after 6-h CA at +0.4 V and +0.8 V are significantly higher at a concentration of 0.10 mol L−1 than at a concentration of 0.50 mol L−1, whereas the faradaic yields after 6 h electrolysis at +0.6 V are much closer. Additionally, the formations of gluconate and xylonate at +0.6 V reach maximum values before 6 h of CA for the electro-reforming of 0.10 mol L−1 aldose. These facts indicate that the selectivity towards gluconate and xylonate is lowered and that other oxidized compounds are formed with higher rates at +0.6 V. Moreover, the oxidation of gluconate, as an example, occurs for electrode potentials higher than +0.4 V vs. RHE (Figure 10), which can lead to threonate, glycerate, glycolate, oxalate and carbonate. For 0.10 mol L−1 glucose and xylose, the concentrations of glyceric and glycolic acids remain unchanged for 6-hours CA at +0.6 V and +0.8 V, whereas that of oxalic acid increases, which confirms the higher formation rate of degradation products with increased cell voltage and the further oxidation of primary formed C6, C5, C4 and C3 acids. For 0.50 mol L−1 glucose or xylose, the concentrations of glyceric, glycolic and oxalic acids either remain close to zero or tend to decrease, respectively, with the increase of the cell voltage, which confirms the formation of CO32- and/or CO2. It seems that the degradation process occurs by decarboxylation reducing the chain length one carbon atom at a time from gluconate to xylonate, then threonate, glycerate, glycolate and finally oxalate.
In the case of glucose oxidation, this assumption would imply that the sum (gluconic acid concentration + xylonic acid concentration + threonic acid concentration) should correspond to the total glucose having reacted because no other peaks are visible on chromatograms. For the electro-reforming of 0.10 mol L−1 glucose at +0.4 V at a Pd3Au7/C anode, it was demonstrated that only gluconate, xylonate and threonate were formed with a selectivity between 84% and 90% towards gluconate after 6-h CA (conversion between 65% and 70%) [24]. Applying the same calculation method to results obtained at the higher cell voltages of +0.6 V and +0.8 V leads to negative threonic acid concentrations and to concentrations of xylonic acid sufficiently high to be visible on the chromatograms, which is obviously not the case in Figure 9. This confirms that glucose electro-reforming at cell voltages higher than +0.4 V leads to the formation of non-detectable products such as CO32- and/or CO2. The same reasoning has been applied for 0.50 mol L−1 glucose electro-reforming, and for xylose electro-reforming leading to same conclusions.
A very important difference of behavior between both sugars is the much higher formation rate of degradation products for xylose electro-reforming than for glucose electro-reforming. Looking at the chromatogram at t = 0 h for xylose electro-reforming, i.e., before electrochemical reaction, one can see peaks corresponding to the formation of threonic and glyceric acids, whereas no peak is visible for glucose à t = 0 h. This can be due to a lower stability of xylose compared to glucose in 0.10 mol L−1 NaOH alkaline medium. Figure 11 compares the chromatograms recorded as a function of time of 0.10 mol L−1 glucose (Figure 11A) and xylose (Figure 11C) in 0.10 mol L−1 NaOH and of 0.50 mol L−1 glucose and xylose (Figure 11B,D, respectively) in 0.10 mol L−1 NaOH aged for 6 h in air atmosphere. Clearly, glucose exhibits a much higher stability in alkaline medium than xylose since very small peak intensities are recorded on the chromatograms compared to those recorded on xylose degradation chromatograms. A second remark is that peaks of higher intensities are recorded in the presence of 0.50 mol L−1 glucose or xylose than in the presence of 0.10 mol L−1 glucose or xylose; the higher the concentration of sugars, the higher their degradation rates. In the case of glucose, xylonate and threonate are the main products formed; glycerate, glycolate and formate remain as traces. In the case of xylose, glyoxylate, glycerate and glycolate are significantly formed, whereas threonate (as a shoulder at the beginning of the glyoxylate peak) and formate remain as traces. The spontaneous oxidation of aldoses in alkaline medium in presence of pure oxygen atmosphere was reported [47,48,49]. The experiment consisted in aging for two days a 0.05 mol L−1 glucose in 0.85 mol L−1 KOH solution under 1 atm oxygen atmosphere. After distillation of the mixture, the authors separated several molecules: arabonic acid (conformation isomer of xylonic acid) and formic acid. They proposed the following oxidation mechanism:
C6H12O6 + O2 + 2OH → C5H9O6 + HCOO + 2H2O
The authors confirmed their results with other sugars such as fructose. Therefore, these results could certainly be extended to the degradation of xylose in alkaline medium according to the following equation:
C5H10O5 + O2 + 2OH → C4H7O5 + HCOO + 2H2O
In both cases, glucose and xylose degradation, a peak corresponding to the formation of formic acid is visible on chromatograms, but with very low intensity. Then, even if the mechanism proposed by Bamford and Collins [47,48,49] could apply, it cannot explain the significant formation of threonate in the case of glucose degradation process and of glycerate, glyoxylate and glycolate in the case of xylose degradation process. Because threonate is a stable compound [50,51], glycerate should be formed following another mechanism than that of threonate degradation. We propose the hypothesis that xylose may degrade in presence of oxygen into glycerate, glycolate and glyoxylate according to the reaction Equations (16) and (17):
C5H10O5 + O2 + 2OH → CH2OH–COO + CH2OH–CHOH–COO + 2H2O
C5H10O5 + 3/2O2 + 2OH → CHO–COO + CH2OH–CHOH–COO + 3H2O
It is important to note that the resulting concentrations of glycolate and formate are very low in comparison to the concentrations of electrolysis reaction products.
Lastly, it is worth to note that such electrosynthesis reactor technology allows producing clean hydrogen at cell voltages lower than those for the water electrolysis process, which are higher than the reversible cell voltage of 1.23 V [52], together with value-added products. Hydrogen production at the cell voltage of +0.8 V with high conversion rate of aldoses and high chemical yield into gluconate/xylonate could be economically interesting, and therefore, of great industrial interest [24,53]. The clean hydrogen produced by the electro-reforming system is valuable for different applications. For example, fossil oils refinery and ammonia synthesis need pure hydrogen [52]. Another very important application concerns the development of fuel cells. These systems are considered as very promising clean energy technologies for the future [54,55], if hydrogen is produced from non-fossil resources [52,53].
Table 4 summarizes the amount of hydrogen concomitantly produced, the electrical energy consumed and the cost related to electric energy consumption for the production of 1 ton of gluconate/xylonate using the best configurations of Table 2 and Table 3 (the higher production of gluconate and xylonate at each cell voltage and each concentration). The details of calculation are given in Supplementary Materials (S4) [24,30].
The results in Table 4 show that the mass of hydrogen produced from 0.10 mol L−1 aldose (or from 0.50 mol L−1 aldose) are of the same orders independently of the cell voltage: between 15.5 and 15.8 kg on average per ton gluconate/xylonate from the electro-reforming of 0.10 mol L−1 aldose and circa 19.4 and 21.4 kg in average per ton gluconate/xylonate from the electro-reforming of 0.50 mol L−1 aldose. The energy cost is higher for the electro-reforming of 0.5 mol L−1 aldose than that for the electro-reforming of 0.1 mol L−1 aldose, confirming that the increase of concentration has a negative effect. The increase of the cell voltage also increases the energy cost for aldose electro-reforming because the electrical energy consumed is not dependent on time but only on cell voltage (Supplementary Materials S4). However, a higher production rate will be achieved at +0.8 V than at +0.4 V, meaning that equivalent amount of gluconate/xylonate will be obtained in less electrolysis time at +0.8 v than at +0.4 V.
Tacking as examples the lower (22.91 €) and higher (69.80 €) costs for the production of 1 ton gluconate by electro-reforming of 0.10 mol L−1 glucose at +0.4 V for 6 hours and the electro-reforming of 0.50 mol L−1 glucose at +0.6 V for 6 hours, respectively, they represent between 3.5% and 13% of the price of industrial sodium gluconate purchased at Dezhou Huiyang Biotechnology Co., Ltd, Wuxi Fengmin Environmental Technology Development Co., Ltd, etc. (between circa 600 and circa 750 US $ per ton, i.e., between circa 550 and circa 690 € per ton), which is produced by biotechnological processes. In addition, the hydrogen cost will range between 1.60 € kg−1 and 3.20 € kg−1, which is already lower than the cost of hydrogen produced by wind, solar or nuclear water electrolysis (between 4.15 $ kg−1 and 23.27 $ kg−1) [57].
Therefore, the possibility of “pairing” reduction of water and oxidation of aldose in a single cell and producing value-added chemicals at the anode and the cathode is then a way to minimize the energy requirements of the process and to decrease the cost of production of both compounds.

5. Conclusions

The objective of this contribution was to study the possibility of improving the performance of the electro-reforming of glucose and xylose into gluconate and xylonate, respectively, at a Pd3Au7/C anode by increasing the cell voltage and sugar concentration. For both sugars, it was shown that increasing the concentration from 0.10 mol L−1 (18 g L−1 for glucose and 15 g L−1 for xylose) to 0.50 mol L−1 (90 g L−1 for glucose and 75 g L−1 for xylose) resulted in the decrease of both the faradaic yield and the gluconate/xylonate production (chemical yield, ηCh) independently on the cell voltage, which is certainly due to poisoning of the catalyst surface. Therefore, the increase of the concentration is not the relevant lever to improve the electro-reforming process. Moreover, it favors the spontaneous degradation of sugars in alkaline medium. For both sugars, the increase of the cell voltage from +0.4 V to +0.8 V resulted in the decrease of the faradaic yield, but in the enhancement of the gluconate/xylonate formation rate (chemical yield, ηCh), which means a higher energy cost for the formation of gluconate/xylonate but lower time for producing the same amount as that at +0.4 V, as well as higher hydrogen production rate. Indeed, 0.0580 mol L−1F = 63.3%, ηCh = 58%) and 0.0670 mol L−1F = 53.5%, ηCh = 67%) gluconate were produced from the electro-reforming of 0.10 mol L−1 glucose at the cell voltages of +0.4 V and +0.8 V, respectively, whereas in the case of the electro-reforming of 0.10 mol L−1 xylose, 0.0477 mol L−1F = 80.3%, ηCh = 47%) and 0.0820 (ηF = 64.5%, ηCh = 82%) mol L−1 xylonate were obtained at cell voltages of +0.4 V and +0.8 V, respectively.
Lastly, it has been emphasized that the possibility of “pairing” reduction of water and oxidation of aldose in a single cell and producing value-added chemicals at the anode (gluconate and xylonate) and the cathode (in this case hydrogen) is a way to minimize the energy requirements of the process and to decrease the cost of production of both compounds, making such systems economically and industrially interesting.

Supplementary Materials

The following are available online at https://www.mdpi.com/2571-8797/2/2/13/s1, Section S1: Synthesis of catalysts by the water in oil microemulsion method, Section S2: Formulation of the catalytic ink and preparation of the working electrode for cyclic voltammetry experiments, Section S3: Chronoamperometry measurements, Figure S3: Picture of the electrochemical cell for chronoamperometry measurements and schematic representation of the electrolysis system designed for the chronoamperometry measurements, Section S4: Calculation of the energetic consumption to produce xylonate and hydrogen.

Author Contributions

All authors have contributed equally to the conceptualization, investigations, formal analysis and original draft preparation. All authors have read and agreed to the published version of the manuscript.

Funding

This research received no external funding.

Acknowledgments

The authors acknowledge the European Union (ERDF), the "Région Nouvelle Aquitaine," the INCREASE research federation (FR CNRS 3707) and the PHC Tournesol (French-Belgian cooperation Hubert Curien) for financial supports.

Conflicts of Interest

The authors declare no conflict of interest.

References

  1. Werpy, T.; Petersen, G.; Aden, A.; Bozell, J.; Holladay, J.; White, J.; Manheim, A.; Elliot, D.; Lasure, L.; Jones, S.; et al. Top Value Added Chemicals from Biomass: Results of Screening for Potential Candidates from Sugars and Synthesis Gas; US Department of Energy: Oak Ridge, TN, USA, 2004. [Google Scholar] [CrossRef] [Green Version]
  2. Liu, H.; Valdehuesa, K.N.G.; Nisola, G.M.; Ramos, K.R.M.; Chung, W.-J. High yield production of D-xylonic acid from D-xylose using engineered escherichia coli. Bioresour. Technol. 2012, 115, 244–248. [Google Scholar] [CrossRef]
  3. Cañete-Rodríguez, A.M.; Santos-Dueñas, I.M.; Jiménez-Hornero, J.E.; Ehrenreich, A.; Liebl, W.; García-García, I. Gluconic acid: Properties, production methods and applications—An excellent opportunity for agro-industrial by-products and waste bio-valorization. Process Biochem. 2016, 51, 1891–1903. [Google Scholar] [CrossRef]
  4. Beltrame, P.; Comotti, M.; Pina, C.D.; Rossi, M. Aerobic oxidation of glucose I. Enzymatic catalysis. J. Catal. 2004, 228, 282–287. [Google Scholar] [CrossRef]
  5. Tathod, A.; Kane, T.; Sanil, E.S.; Dhepe, P.L. Solid base supported metal catalysts for the oxidation and hydrogenation of sugars. J. Mol. Catal. A Chem. 2014, 388–389, 90–99. [Google Scholar] [CrossRef]
  6. Gallezot, P. Conversion of biomass to selected chemical products. Chem. Soc. Rev. 2012, 41, 1538–1558. [Google Scholar] [CrossRef]
  7. Climent, M.J.; Corma, A.; Iborra, S. Converting carbohydrates to bulk chemicals and fine chemicals over heterogeneous catalysts. Green Chem. 2011, 13, 520–540. [Google Scholar] [CrossRef]
  8. Ramachandran, S.; Fontanille, P.; Pandey, A.; Larroche, C. Gluconic acid: Properties, applications and microbial production. Food Technol. Biotechnol. 2006, 44, 185–195. [Google Scholar]
  9. Sauer, M.; Mattanovich, D.; Marx, H. Microbial production of organic acids for use in food. In Microbial Production of Food Ingredients, Enzymes and Nutraceuticals, Woodhead Publishing Series in Food Science, Technology and Nutrition; Elsevier: Amsterdam, The Netherlands, 2013; pp. 288–320. [Google Scholar]
  10. Gallezot, P. Selective oxidation with air on metal catalysts. Catal. Today 1997, 37, 405–418. [Google Scholar] [CrossRef]
  11. Biella, S.; Prati, L.; Rossi, M. Selective oxidation of D-Glucose on gold catalyst. J. Catal. 2002, 206, 242–247. [Google Scholar] [CrossRef]
  12. Bujak, P.; Bartczak, P.; Polanski, J. Highly efficient room-temperature oxidation of cyclohexene and D-glucose over nanogold Au/SiO2 in water. J. Catal. 2012, 295, 15–21. [Google Scholar] [CrossRef]
  13. Liang, X.; Liu, C.-J.; Kuai, P. Selective oxidation of glucose to gluconic acid over argon plasma reduced Pd/Al2O3. Green Chem. 2008, 10, 1318–1322. [Google Scholar] [CrossRef]
  14. Onda, A.; Ochi, T.; Kajiyoshi, K.; Yanagisawa, K. A new chemical process for catalytic conversion of D-glucose into lactic acid and gluconic acid. Appl. Catal. A-Gen. 2008, 343, 49–54. [Google Scholar] [CrossRef]
  15. Hermans, S.; Deffernez, A.; Devillers, M. Au–Pd/C catalysts for glyoxal and glucose selective oxidations. Appl. Catal. A Gen. 2011, 395, 19–27. [Google Scholar] [CrossRef]
  16. Mirescu, A.; Prüße, U. A new environmental friendly method for the preparation of sugar acids via catalytic oxidation on gold catalysts. Appl. Catal. B Environ. 2007, 70, 644–652. [Google Scholar] [CrossRef]
  17. Amaniampong, P.N.; Trinh, Q.T.; De Oliveira Vigier, K.; Dao, D.Q.; Tran, N.H.; Wang, Y.; Sherburne, M.P.; Jeéroôme, F. Synergistic effect of high-frequency ultrasound with cupric oxide catalyst resulting in a selectivity switch in glucose oxidation under argon. J. Am. Chem. Soc. 2019, 141, 14772–14779. [Google Scholar] [CrossRef]
  18. Governo, A.T.; Proença, L.; Parpot, P.; Lopes, M.I.S.; Fonseca, I.T.E. Electro-oxidation of D-xylose on platinum and gold electrodes in alkaline medium. Electrochim. Acta 2004, 49, 1535–1545. [Google Scholar]
  19. Tominaga, M.; Nagashima, M.; Nishiyama, K.; Taniguchi, I. Surface poisoning during electrocatalytic monosaccharide oxidation reactions at gold electrodes in alkaline medium. Electrochem. Commun. 2007, 9, 1892–1898. [Google Scholar] [CrossRef]
  20. Pasta, M.; La Mantia, F.; Cui, Y. Mechanism of glucose electrochemical oxidation on gold surface. Electrochim. Acta 2010, 55, 5561–5568. [Google Scholar] [CrossRef]
  21. Yan, L.; Brouzgou, A.; Meng, Y.; Xiao, M.; Tsiakaras, P.; Song, S. Efficient and poison-tolerant PdxAuy/C binary electrocatalysts for glucose electrooxidation in alkaline medium. Appl. Catal. B Environ. 2014, 150–151, 268–274. [Google Scholar] [CrossRef]
  22. Ghosh, S.; Holade, Y.; Remita, H.; Servat, K.; Beaunier, P.; Hagège, A.; Kokoh, K.B.; Napporn, T.W. One-pot synthesis of reduced graphene oxide supported gold-based nanomaterials as robust nanocatalysts for glucose electrooxidation. Electrochim. Acta 2016, 212, 864–875. [Google Scholar] [CrossRef]
  23. Holade, Y.; Servat, K.; Napporn, T.W.; Morais, C.; Berjeaud, J.-M.; Kokoh, K.B. Highly selective oxidation of carbohydrates in an efficient electrochemical energy converter: Cogenerating organic electrosynthesis. ChemSusChem 2016, 9, 252–263. [Google Scholar] [CrossRef]
  24. Rafaïdeen, T.; Baranton, S.; Coutanceau, C. Highly efficient and selective electrooxidation of glucose and xylose in alkaline medium at carbon supported alloyed PdAu nanocatalysts. Appl. Catal. B Environ. 2019, 243, 641–656. [Google Scholar] [CrossRef]
  25. Simões, M.; Baranton, S.; Coutanceau, C. Electrooxidation of sodium borohydride (NaBH4) at Pd, Au and PdxAu1-x carbon supported nanocatalysts. J. Phys. Chem. C 2009, 113, 13369–13376. [Google Scholar] [CrossRef]
  26. Lamy, C.; Devadas, A.; Simões, M.; Coutanceau, C. Clean hydrogen production through the electrocatalytic oxidation of formic acid in a PEM electrolysis cell (PEMEC). Electrochim. Acta 2012, 60, 112–120. [Google Scholar] [CrossRef]
  27. Lankiang, S.; Chiwata, M.; Baranton, S.; Uchida, H.; Coutanceau, C. Oxygen reduction reaction at binary and ternary nanocatalysts based on Pt, Pd and Au. Electrochim. Acta. 2015, 182, 131–142. [Google Scholar] [CrossRef]
  28. Rasband, W.S.; Image, J. US National Institutes of Health. Available online: http://rsbweb.nih.gov/ij/ (accessed on 24 April 2020).
  29. Wojdyr, M. Fityk: A general-purpose peak fitting program. J. Appl. Cryst. 2010, 43, 1126–1128. [Google Scholar] [CrossRef]
  30. Neha, N.; Kouamé, B.S.R.; Rafaïdeen, T.; Baranton, S.; Coutanceau, C. Remarkably efficient carbon-supported nanostructured platinum-bismuth catalysts for the selective electrooxidation of glucose and methyl-glucoside. Electrocatalysis 2020. [Google Scholar] [CrossRef]
  31. Zhu, H.; Li, X.; Han, F.; Dong, Z.; Yuan, G.; Ma, G.; Westwood, A.; He, K. The effect of pitch-based carbon fiber microstructure and composition on the formation and growth of SiC whiskers via reaction of such fibers with silicon sources. Carbon 2016, 99, 174–185. [Google Scholar] [CrossRef]
  32. Scherrer, P. Bestimmung der Größe und der inneren Struktur von Kolloidteilchen mittels Röntgenstrahlen. Nachr. Ges. Wiss. Göttingen Math. Phys. Kl. 1918, 26, 98–100. [Google Scholar]
  33. Warren, B.E. X-Ray Diffraction; Dover Publications, Inc.: New York, NY, USA, 1981. [Google Scholar]
  34. Duan, H.L.; Wang, J.; Kahiraloo, B.L. Theory of elasticity at the nanoscale. Adv. Appl. Mech. 2009, 42, 1–68. [Google Scholar]
  35. Rand, A.J.; Woods, R. Determination of surface composition of smooth noble metal alloys by cyclic voltammetry. J. Electroanal. Chem. 1972, 57, 57–69. [Google Scholar] [CrossRef]
  36. Zalineeva, A.; Baranton, S.; Coutanceau, C. Bi-modified Palladium nanocubes for glycerol electrooxidation. Electrochem. Commun. 2013, 34, 335–338. [Google Scholar] [CrossRef]
  37. Zalineeva, A.; Padilla, M.; Martinez, U.; Serov, A.; Artyushkova, K.; Baranton, S.; Coutanceau, C.; Atanassov, P.B. Self-supported Pd-Bi catalysts for the electrooxidation of glycerol in alkaline media. J. Am. Chem. Soc. 2014, 136, 3937–3945. [Google Scholar] [CrossRef] [PubMed]
  38. Parpot, P.; Santos, P.R.B.; Bettencourt, A.P. Electro-oxidation of D-mannose on platinum, gold and nickel electrodes in aqueous medium. J. Electroanal. Chem. 2007, 610, 154–162. [Google Scholar] [CrossRef]
  39. Grdén, M.; Lukaszewski, M.; Jerkiewicz, G.; Czerwinski, A. Electrochemical behavior of palladium electrode: Oxidation, electrodissolution and ionic adsorption. Electrochim. Acta. 2008, 53, 7583–7598. [Google Scholar] [CrossRef]
  40. Kahyaoglu, A.N. Oxydation électrocatalytique du glycérol sur le platine, l’or et leurs alliages binaires. Ph.D. Thesis, University of Poitiers, Poitiers, France, 1981. [Google Scholar]
  41. Rafaïdeen, T.; Baranton, S.; Coutanceau, C. Pd-shaped nanoparticles modified by gold ad-atoms: Effects on surface structure and activity toward glucose electrooxidation. Front. Chem. 2019, 7, 453. [Google Scholar] [CrossRef]
  42. Łukaszewski, M.; Czerwiński, A. Electrochemical preparation and characterization of thin deposits of Pd-noble metal alloys. Thin Solid Film. 2010, 518, 3680–3689. [Google Scholar] [CrossRef]
  43. Climent, V.; García-Aríá, N.; Feliu, J.-M. Clues for the molecular-level understanding of electrocatalysis on single-crystal platinum surfaces. In Fuel Cell Catalyst, a Surface Science Approach; Koper, M.T.M., Ed.; Wiley: Hoboken, NJ, USA, 2009; pp. 209–244. [Google Scholar]
  44. Baber, A.E.; Tierney, H.L.; Sykes, E.C.H. Atomic-scale geometry and electronic structure of catalytically important Pd/Au alloys. Acs Nano 2010, 4, 1637–1645. [Google Scholar] [CrossRef]
  45. Simoes, M.; Baranton, S.; Coutanceau, C. Electrochemical valorization of glycerol. ChemSusChem 2012, 5, 2106–2124. [Google Scholar] [CrossRef]
  46. Antolin, E. Structural parameters of supported fuel cell catalysts: The effect of particle size, inter-particle distance and metal loading on catalytic activity and fuel cell performance. Appl. Catal. B Environ. 2016, 181, 298–313. [Google Scholar] [CrossRef]
  47. Bamford, C.H.; Collins, J.R. Kinetic studies on carbohydrates in alkaline conditions. I. The Kinetics of the autoxidation of glucose. In Proceedings of the Royal Society of London. Series A, Mathematical and Physical Sciences; The royal Society: London, UK, 1950; Volume 204, pp. 62–84. [Google Scholar]
  48. Bamford, C.H.; Bamford, D.; Collins, J.R. Kinetic studies on carbohydrates in alkaline conditions-II. The kinetics of the rearrangements of glucose and fructose in alkaline solution. In Proceedings of the Royal Society of London. Series A, Mathematical and Physical Sciences; The royal Society: London, UK, 1950; Volume 204, pp. 85–98. [Google Scholar]
  49. Bamford, C.H.; Collins, J.R. Kinetic studies on carbohydrates in alkaline conditions. III. Interconversion of D-glucose, D-fructose and D-mannose in feebly alkaline solution. In Proceedings of the Royal Society of London. Series A, Mathematical and Physical Sciences; The royal Society: London, UK, 1955; Volume 228, pp. 100–119. [Google Scholar]
  50. Lin, Y.T.; Liang, C. Carbon tetrachloride degradation by alkaline ascorbic acid solution. Environ. Sci. Technol. 2013, 47, 3299–3307. [Google Scholar] [CrossRef] [PubMed]
  51. Gleason, W.B.; Bark, R. Oxidation of pentoses in alkaline solution. Can. J. Chem. 1971, 49, 1425–1432. [Google Scholar] [CrossRef] [Green Version]
  52. Coutanceau, C.; Baranton, S. Electrochemical conversion of alcohols for hydrogen production: A short overview. WIREs Energy Environ. 2016, 5, 388–400. [Google Scholar] [CrossRef]
  53. Lamy, C.; Coutanceau, C.; Baranton, S. Production of clean hydrogen by the electrochemical reforming of oxygenated organic compounds. In Hydrogen and Fuel Cells Primers; Pollet, B., Ed.; Elsevier: Amsterdam, The Netherlands, 2020; pp. 81–111. ISBN 978-0-12-821500-5. [Google Scholar]
  54. IEA. The Future of Hydrogen, IEA, Paris. 2019. Available online: https://www.iea.org/reports/the-future-of-hydrogen (accessed on 22 May 2020).
  55. Leader, A.; Gaustad, G. Critical material applications and intensities in clean energy technologies. Clean Technol. 2019, 1, 164–183. [Google Scholar] [CrossRef] [Green Version]
  56. Energy prices and costs in Europe-2019–Enerdata. Report from the commission to the European parliament, the Council, the European Economic and Social Committee and the Committee of the regions: Energy prices and costs in Europe. Available online: https://www.enerdata.net/about-us/company-news (accessed on 22 May 2019).
  57. Kayfeci, M.; Keçebaş, A.; Bayat, M. Hydrogen production. In Solar Hydrogen Production. Processes, Systems and Technologies; Calise, F., Santarelli, M., Dentice D’Accadia, M., Lanzini, A., Ferrero, D., Eds.; Elsevier: Amsterdam, The Netherlands, 2019; pp. 45–83. [Google Scholar]
Figure 1. TEM images of (A) Pd/C, (B) Au/C and (C) Pd3Au7/C materials prepared from the “water in oil” microemulsion method.
Cleantechnol 02 00013 g001
Figure 2. XRD patterns of (A) Pd/C ( indicates the diffraction peaks related to the tetragonal PdO structure from the JCPDS card n°41-1107), (B) Au/C and (C) Pd3Au7/C materials prepared from the “water in oil” microemulsion from the JCPDS cards No. 05-0681 (face centered cubic Pd) and n°04-0784 (face centered cubic Au).
Cleantechnol 02 00013 g002
Figure 3. Tenth stable cycle voltammograms (CVs) recorded at 5.0 mV s−1 and 293 K in a N2-purged 0.10 mol L−1 NaOH aqueous electrolyte of (A) Pd/C, (B) Au/C and (C) Pd3Au7/C materials.
Cleantechnol 02 00013 g003
Figure 4. Third stable linear scan voltammetry curves recorded in a 0.10 mol L−1 NaOH aqueous electrolyte at 5 mV s−1 on Pd/C (green), Au/C (orange) and Pd3Au7/C (red) catalysts in the presence of (A) 0.10 mol L−1 glucose and (B) 0.10 mol L−1 xylose.
Cleantechnol 02 00013 g004
Figure 5. Third stable linear scan voltammetry curves recorded at Pd3Au7/C catalyst in 0.10 mol L−1 NaOH medium in the presence of (A) 0.10 mol L−1 and 0.50 mol L−1 glucose and (B) 0.10 mol L−1 and 0.50 mol L−1 xylose.
Cleantechnol 02 00013 g005
Figure 6. Coulombic charge versus time (Q(t)) curves from chronoamperometry measurements of 0.10 mol L−1 glucose electro-reforming in 0.10 mol L−1 NaOH solution at +0.4 V, +0.6 V and +0.8 V.
Cleantechnol 02 00013 g006
Figure 7. Chromatograms recorded as a function of time (every hour from 0 to 6 hours of chronoamperometry) for the electro-reforming in 0.10 mol L−1 NaOH solution of (A) 0.10 mol L−1 glucose at +0.4 V, (B) 0.10 mol L−1 glucose at +0.6 V, (C) 0.10 mol L−1 glucose at +0.8 V, (D) 0.50 mol L−1 glucose at +0.4 V, (E) 0.50 mol L−1 glucose at +0.6 V and (F) 0.50 mol L−1 glucose at +0.8 V. The sodium gluconate standard (0.10 mol L−1) is presented in red.
Cleantechnol 02 00013 g007
Figure 8. Chromatograms of standard solutions of any possible C1 to C5 degradation products from glucose and xylose oxidation (except carbonate and CO2): 0.10 mol L−1 gluconic, xylonic, glyceric, glycolic, glyoxylic, oxalic, formic, glucaric and glucuronic acids, and 0.025 mol L−1 threonic acid.
Cleantechnol 02 00013 g008
Figure 9. Chromatograms recorded as a function of time (every hour from 0 to 6 h chronoamperometry) for the electro-reforming in 0.10 mol L−1 NaOH solution of (A) 0.10 mol L−1 xylose at +0.4 V, (B) 0.10 mol L−1 xylose at +0.6 V, (C) 0.10 mol L−1 xylose at +0.8 V, (D) 0.50 mol L−1 xylose at +0.4 V, (E) 0.50 mol L−1 xylose at +0.6 V and (F) 0.50 mol L−1 xylose at +0.8 V. The lithium xylonate standard (0.1 mol L−1) is presented in red.
Cleantechnol 02 00013 g009
Figure 10. Third stable linear scan voltammetry curves recorded at Pd3Au7/C catalyst in 0.10 mol L−1 NaOH electrolyte in the presence of 0.10 mol L−1 glucose (black line) and 0.10 mol L−1 gluconate (red line).
Cleantechnol 02 00013 g010
Figure 11. Chromatograms recorded as a function of time for 6 hours aging of (A) 0.10 mol L−1 glucose, (B) 0.50 mol L−1 glucose, (C) 0.10 mol L−1 xylose and (D) 0.50 mol L−1 xylose in 0.10 mol L−1 NaOH.
Cleantechnol 02 00013 g011
Table 1. Characterization data of Pd/C, Au/C and Pd3Au7/C by TGA, AAS, TEM, XRD and CV.
Pd/CAu/CPd3Au7/C
Metal loading (TGA)/wt%4035.541
Composition (AAS)/at%100 (Pd)100 (Au)23 (Pd)/77 (Au)
Particle size (TEM)/nm4.06.85.8
Crystallite size (XRD)/nm2.95.94.4
Cell parameter (XRD)/nm0.3900.4070.403
Composition (XRD)/at%100 (Pd)100 (Au)24 (Pd)/76 (Au)
ECSA (m2 g−1)611420
Surface composition (at%)100 (Pd)100 (Au)8 (Pd8Au2)/36 (Pd6Au4)/56 (Au)
Global surface composition (at%)100 (Pd)100 (Au)28 (Pd)/72 (Au)
Table 2. Experimental data for glucose electro-reforming: cell voltages (Ucell), initial glucose concentrations (CGlucose, i), coulombic charges involved (Q), corresponding gluconate concentrations if two electrons are exchanged per glucose molecule oxidized (CCA), gluconate concentrations determined by HPLC (CHPLC) and faradaic yields (ηF).
UcellCGlucose, it (h)Q (C)CCA (mol L−1)CHPLC (mol L−1)ηF (%)
+0.4 V0.10 mol L−111210.02130.016577.5
22190.03940.028071.1
32980.05470.038069.5
43640.06830.046067.3
54200.08010.052565.3
64660.09160.058063.3
0.50 mol L−111480.02600.012046.2
22660.04780.020041.8
33680.06760.024035.5
44550.08540.035041.0
55300.10170.042041.3
65900.11580.050043.2
+0.6 V0.10 mol L−112050.03610.023063.7
23520.06330.035055.3
34630.08500.047055.3
45420.10170.052051.1
55940.11390.050043.9
66230.12250.050040.1
0.50 mol L−112350.04140.019045.9
24080.07340.030040.9
35400.09920.040040.3
46370.11960.050041.8
57060.13550.056041.3
67450.14620.061041.7
+0.8 V0.10 mol L−112380.04200.032076.2
24150.07480.048064.2
35290.09730.056057.6
45930.11130.065058.4
56220.11940.075062.8
66380.12530.067053.5
0.50 mol L−111750.03080.021068.2
23240.05850.031053.0
34540.08340.040048.0
45630.10570.048045.4
56510.12490.055044.0
67220.14170.059041.6
Table 3. Experimental data for xylose electro-reforming: cell voltages (Ucell), initial xylose concentrations (Cglucose, i), coulombic charges involved (Q), corresponding xylonate concentrations if two electrons are exchanged per xylose molecule oxidized (CCA), xylonate concentrations determined by HPLC (CHPLC) and faradaic yields (ηF).
UcellCxylose, it (h)Q (C)CCA (mol L−1)CHPLC (mol L−1)ηF (%)
+0.4 V0.10 mol L−11680.01240.0124100
21260.02270.022297.8
31770.03260.027383.7
42240.04200.033579.8
52650.05090.045188.6
63030.05940.047780.3
0.50 mol L−11610.01270.011086.6
21090.02340.015064.1
31490.03330.019057.1
41840.04280.025058.4
52150.05160.028054.3
62410.06010.031051.6
+0.6 V0.10 mol L−112490.04390.028063.8
24040.07270.044060.5
35050.09280.057562.0
45680.10660.064060.0
56050.11620.077066.3
66230.12230.074560.9
0.50 mol L−11960.01690.013076.9
21790.03220.022068.3
32510.04620.029062.8
43120.05860.036061.4
53650.07010.042059.9
64080.08010.046057.4
+0.8 V0.10 mol L−112260.03980.032080.4
23860.06940.052575.6
34980.09150.065571.6
45750.10800.074568.9
56250.12000080066.7
66510.12770.082064.2
0.50 mol L−111600.02820.023081.6
22860.05140.037072.0
33860.07090.046064.9
44660.08740.054061.8
55230.10050.060059.7
67150.14040.064045.6
Table 4. Amount of hydrogen concomitantly produced electrical energy consumed and cost related to the electric energy consumption to produce 1 ton of gluconate/xylonate using the best configurations of Table 2 and Table 3 (the highest production of gluconate and xylonate at each cell voltage and each concentration).
Gluconate
Ci, glucoseUcelltelectrolyse (h)mH2 (kg)We (kWh)Cost (€) *
0.10 mol L−1+0.4 V614.23152.7622.91
+0.6V418.47297.2644.59
+0.8 V514.69315.3647.30
0.50 mol L−1+0.4 V620.91224.3533.65
+0.6V621.64348.3152.24
+0.8 V621.68465.3469.80
Xylonate
Ci, xyloseUcelltelectrolyse (h)mH2 (kg)We (kWh)Cost (€) *
0.10 mol L−1+0.4 V613.30142.7321.41
+0.6V516.45264.8339.72
+0.8 V616.62356.7853.52
0.50 mol L−1+0.4 V616.28174.6926.20
+0.6V618.57298.9544.84
+0.8 V623.39502.0675.31
* Costs are determined considering the mean electricity price for industry in Europe of 0.15 €/kWh [56].

