Assessing the Sustainable Potential of Corrugated Board-Based Bundle Packaging of PET Bottles: A Life Cycle Perspective—A Case Study


Abstract
:
1. Introduction
1.1. Legislation
1.1.1. EN 643:2014 [3]
1.1.2. Directive 2019/904/EC [4]
1.1.3. Packaging and Packaging Waste Directive
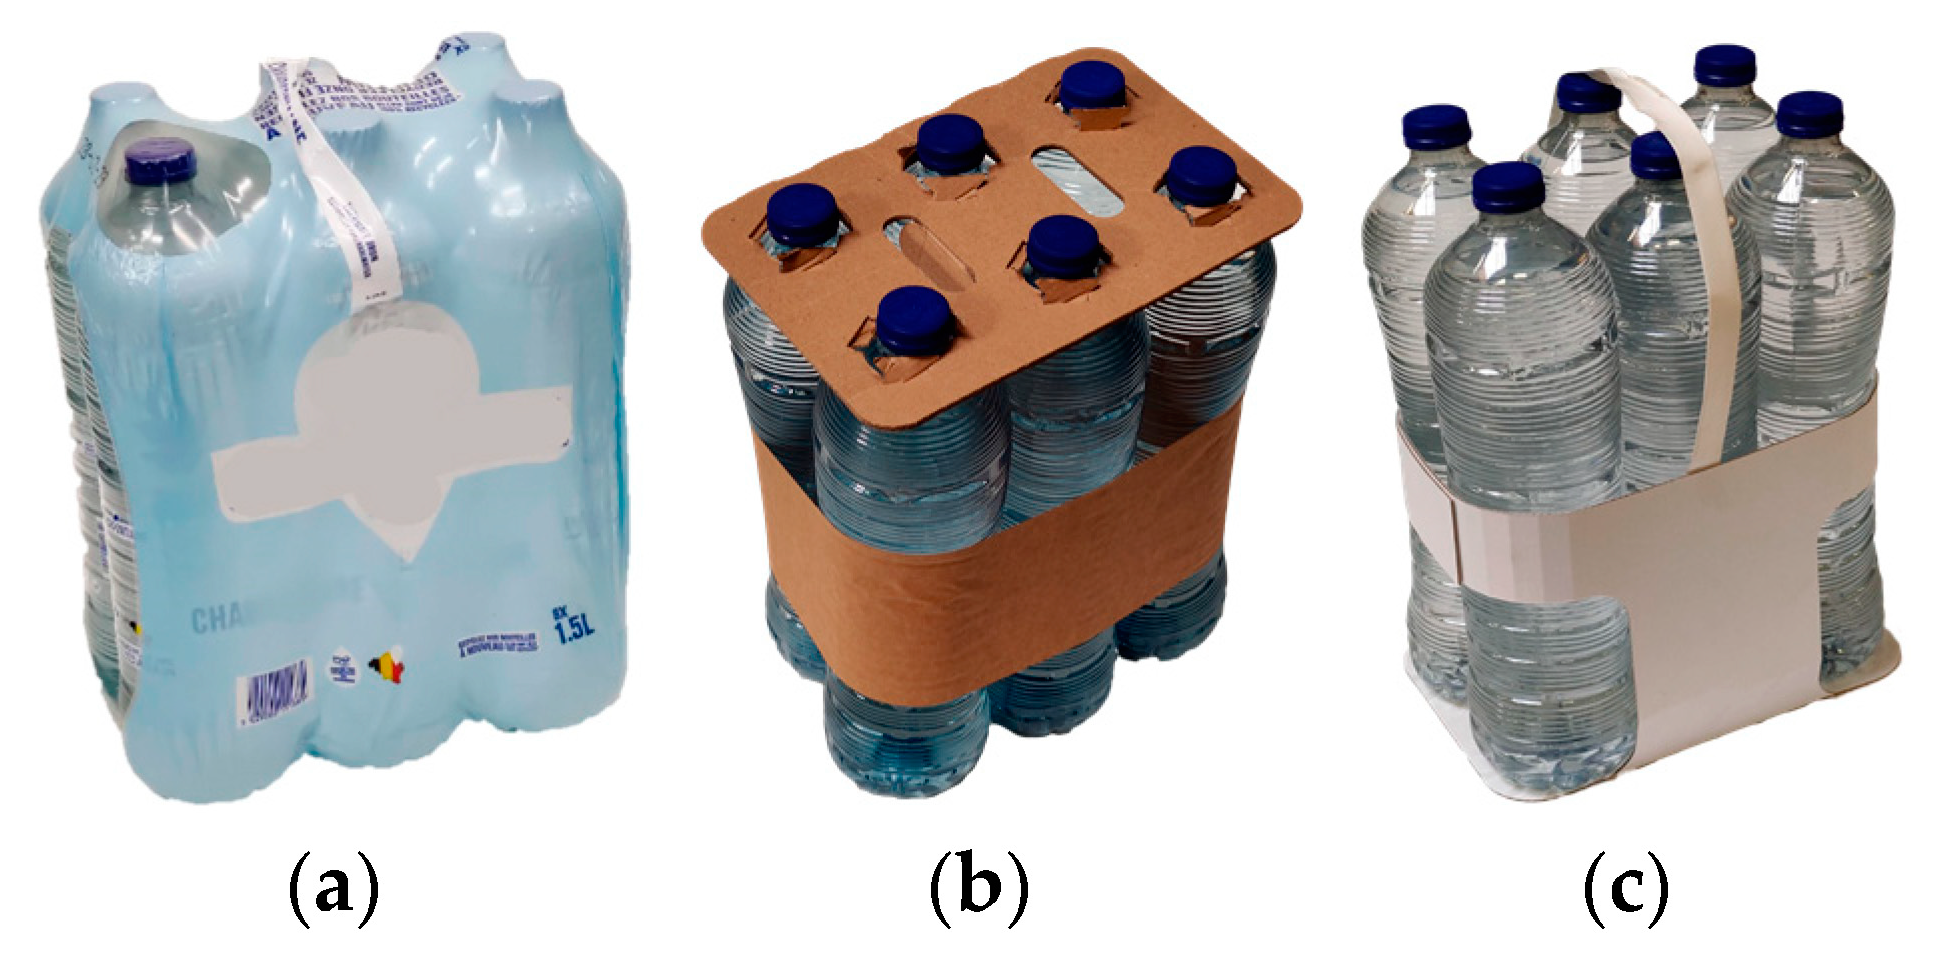
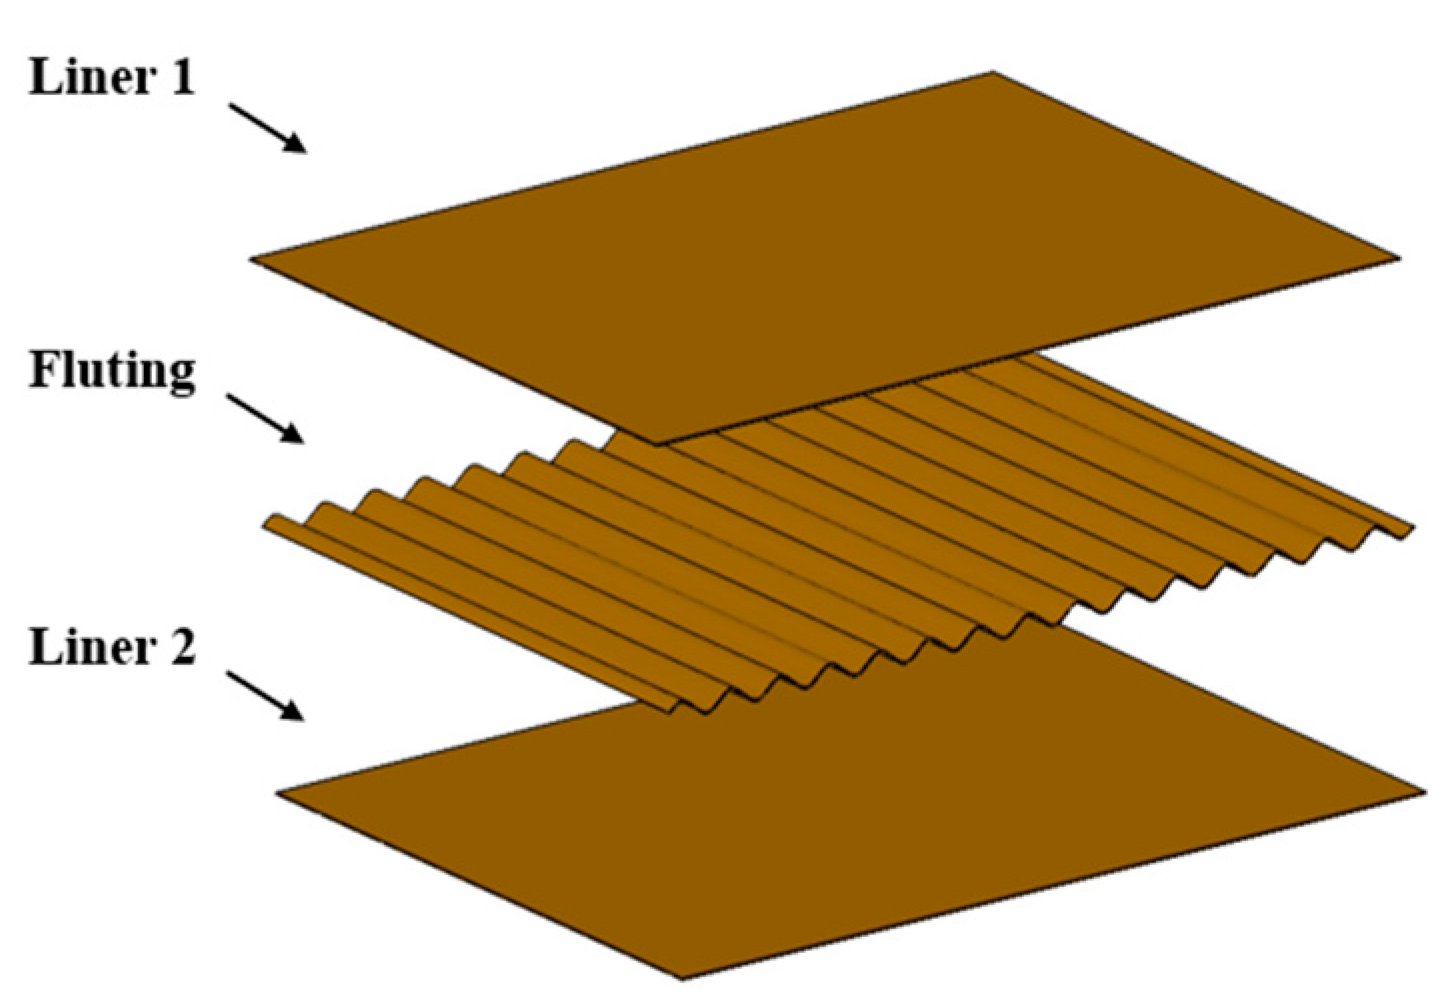
1.2. Bundle Packaging
2. Materials and Methods
2.1. Goal and Scope
2.2. Functional Unit
2.3. System Boundaries
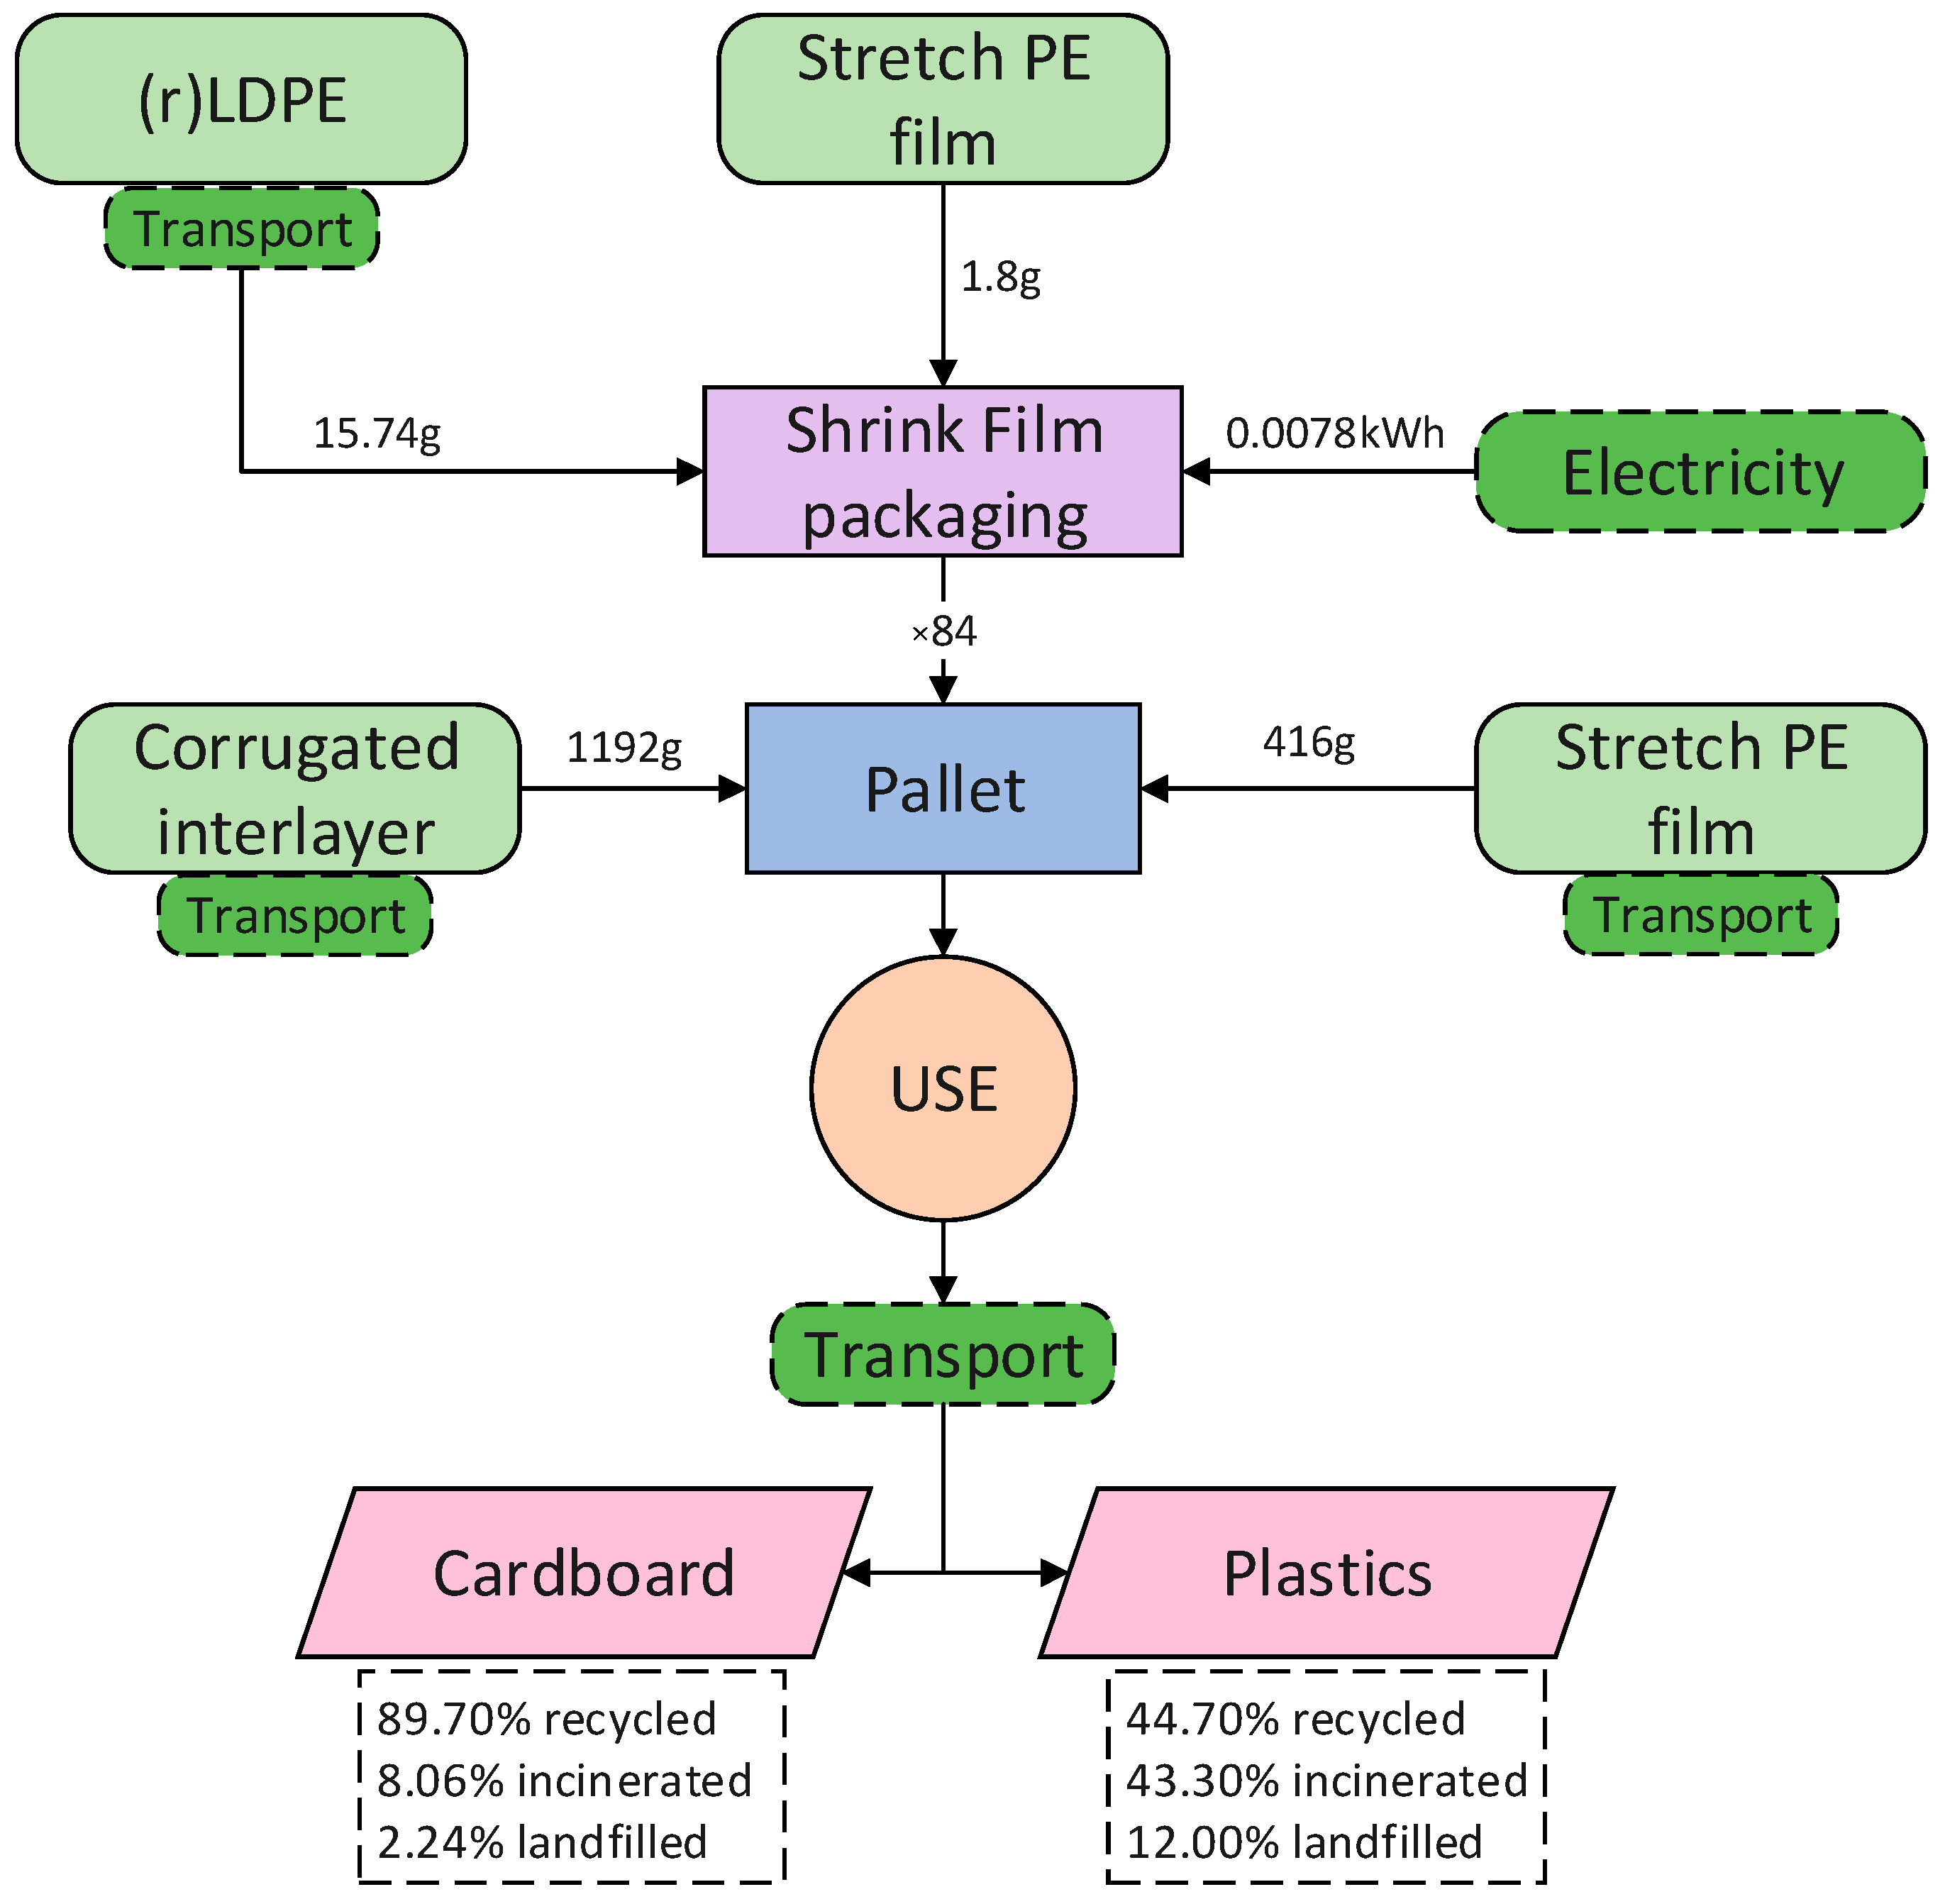
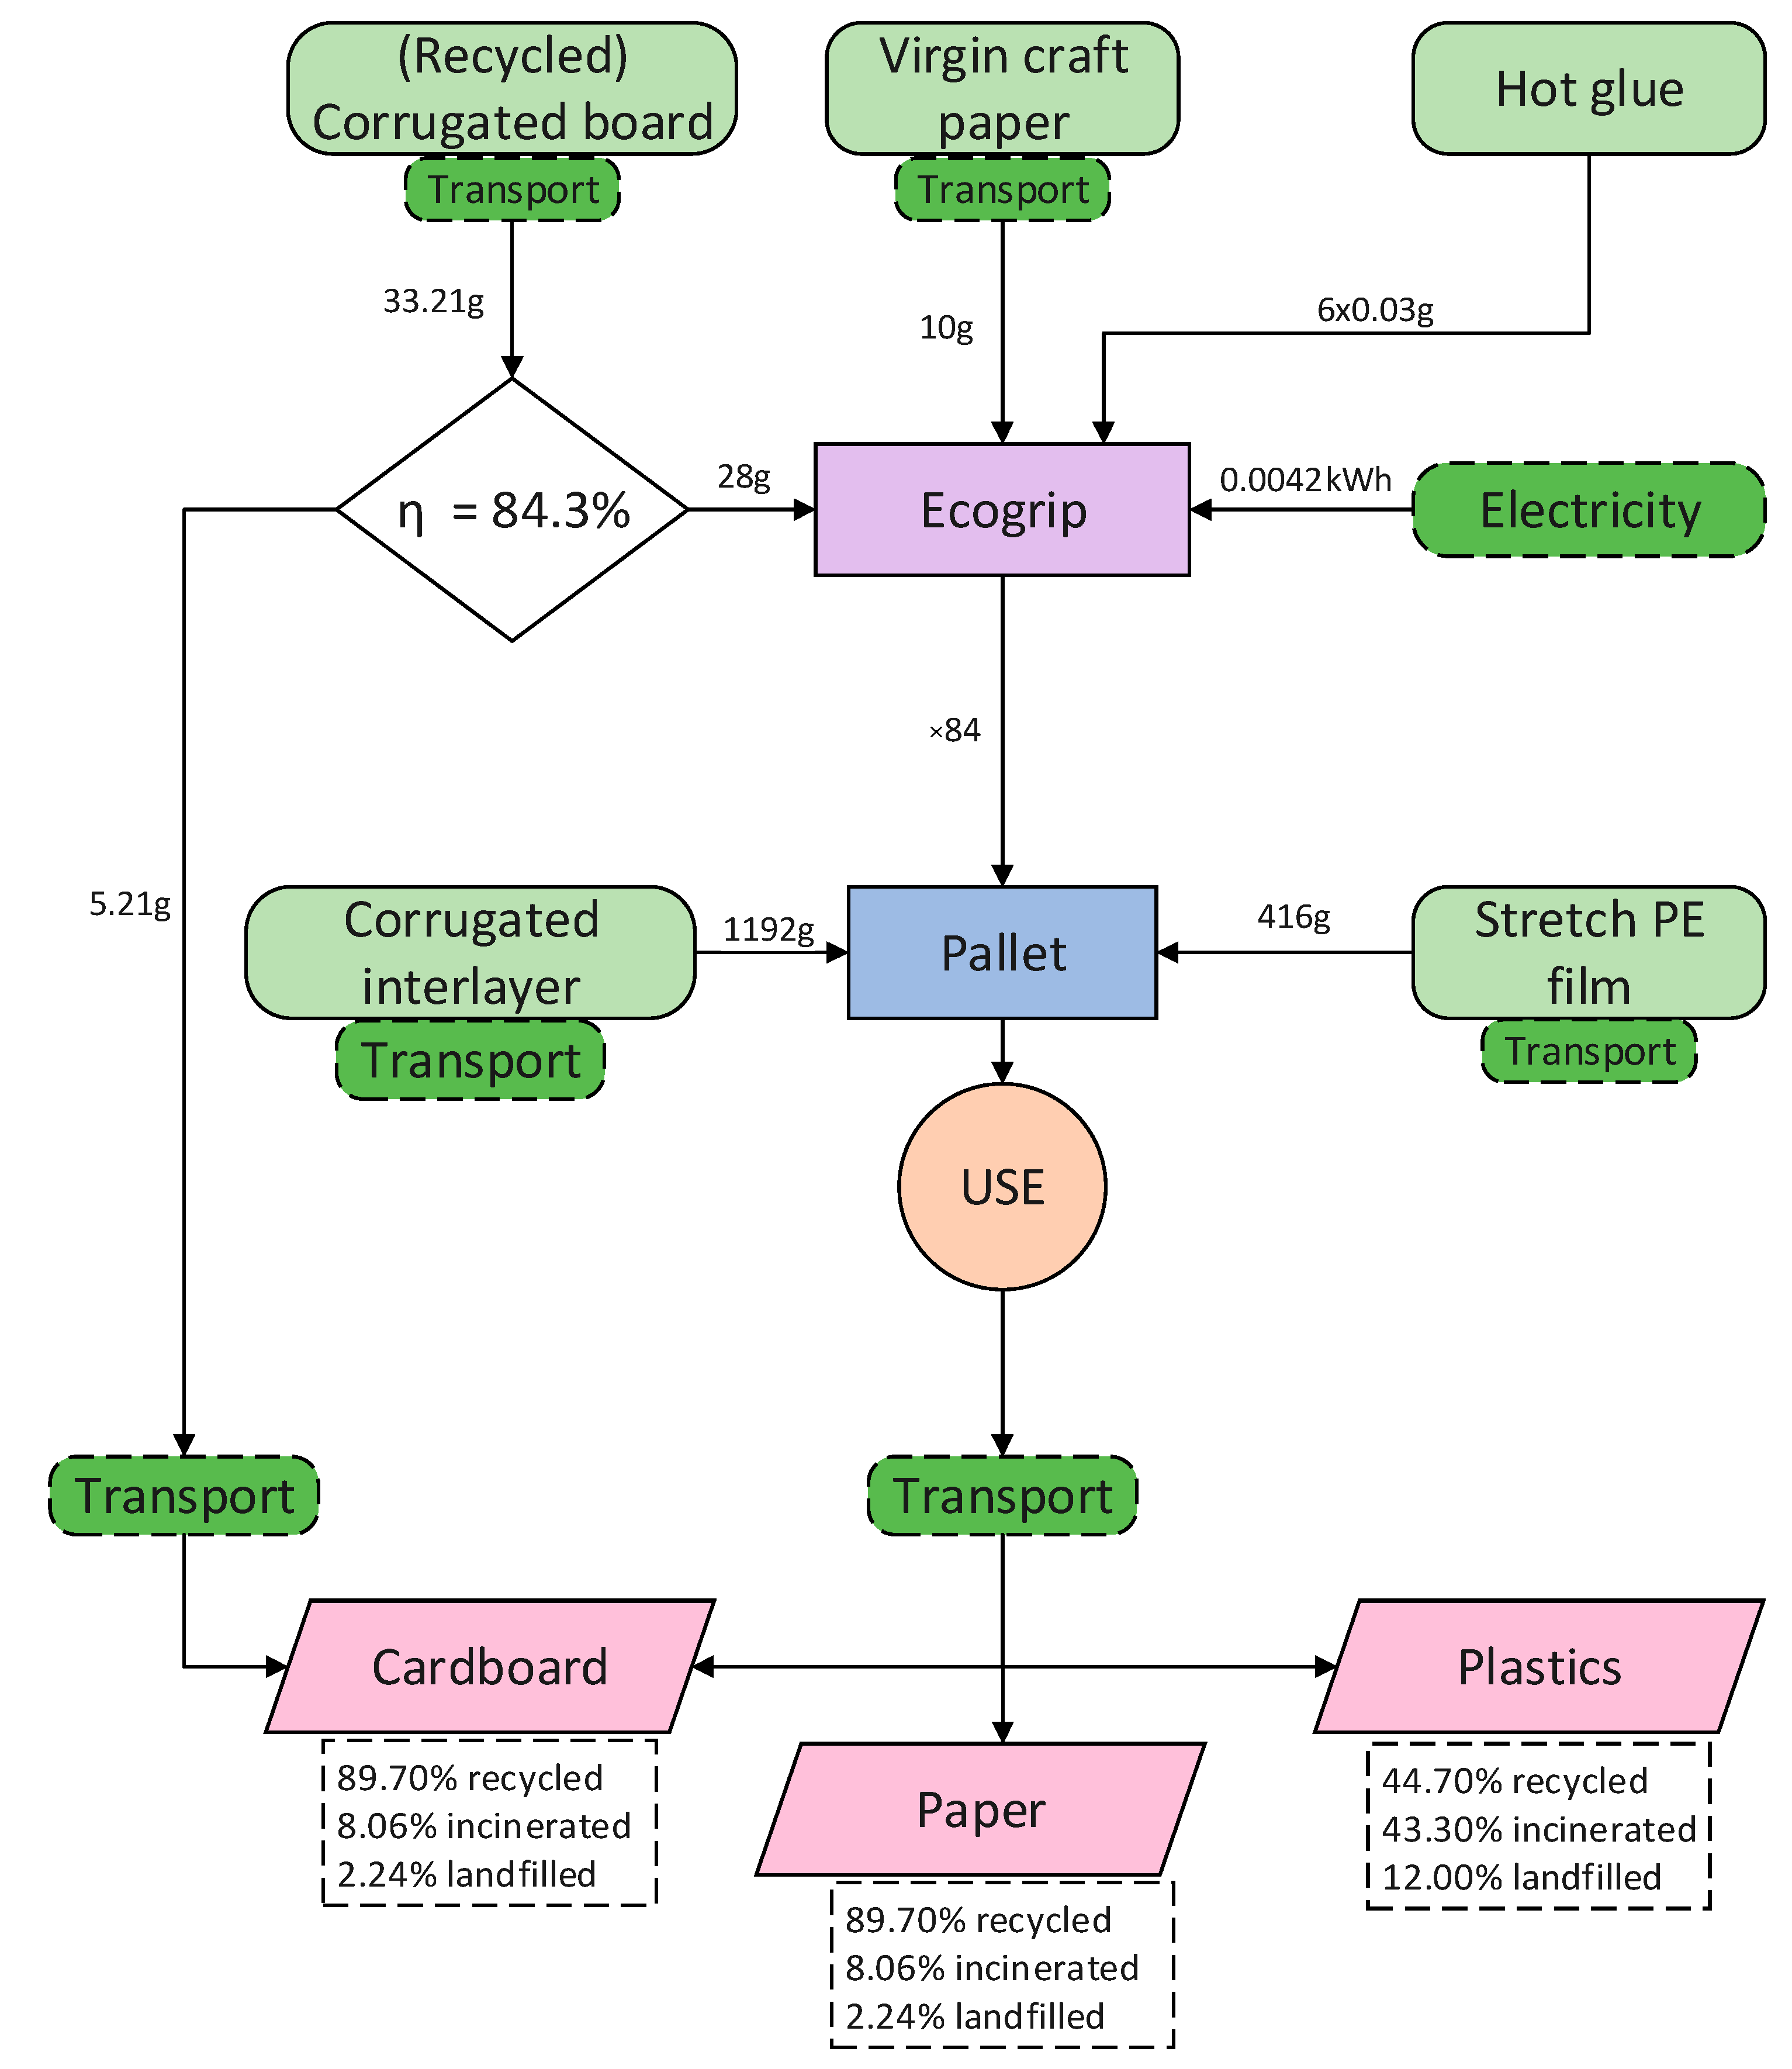
2.4. Life Cycle Inventory
- Qualitative information on raw materials used;
- Weight of the finished product;
- Electricity consumption during the packaging forming phase.
2.4.1. (Recycled) Shrink Film Packaging
2.4.2. Ecobundle
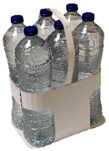
2.4.3. Ecogrip
2.4.4. Transport
- Transport from the water factory to the average consumer in Belgium: the transportation distance from the water factories [19] to the average consumer in Belgium is considered. These data are not used in the model because this transport is part of the use phase.
- Transport from the consumer to the waste disposal: the transportation distance is determined based on the location of incinerators in Belgium [20] and the demographic center; the average distance is 60.614 km.
2.4.5. End of Life
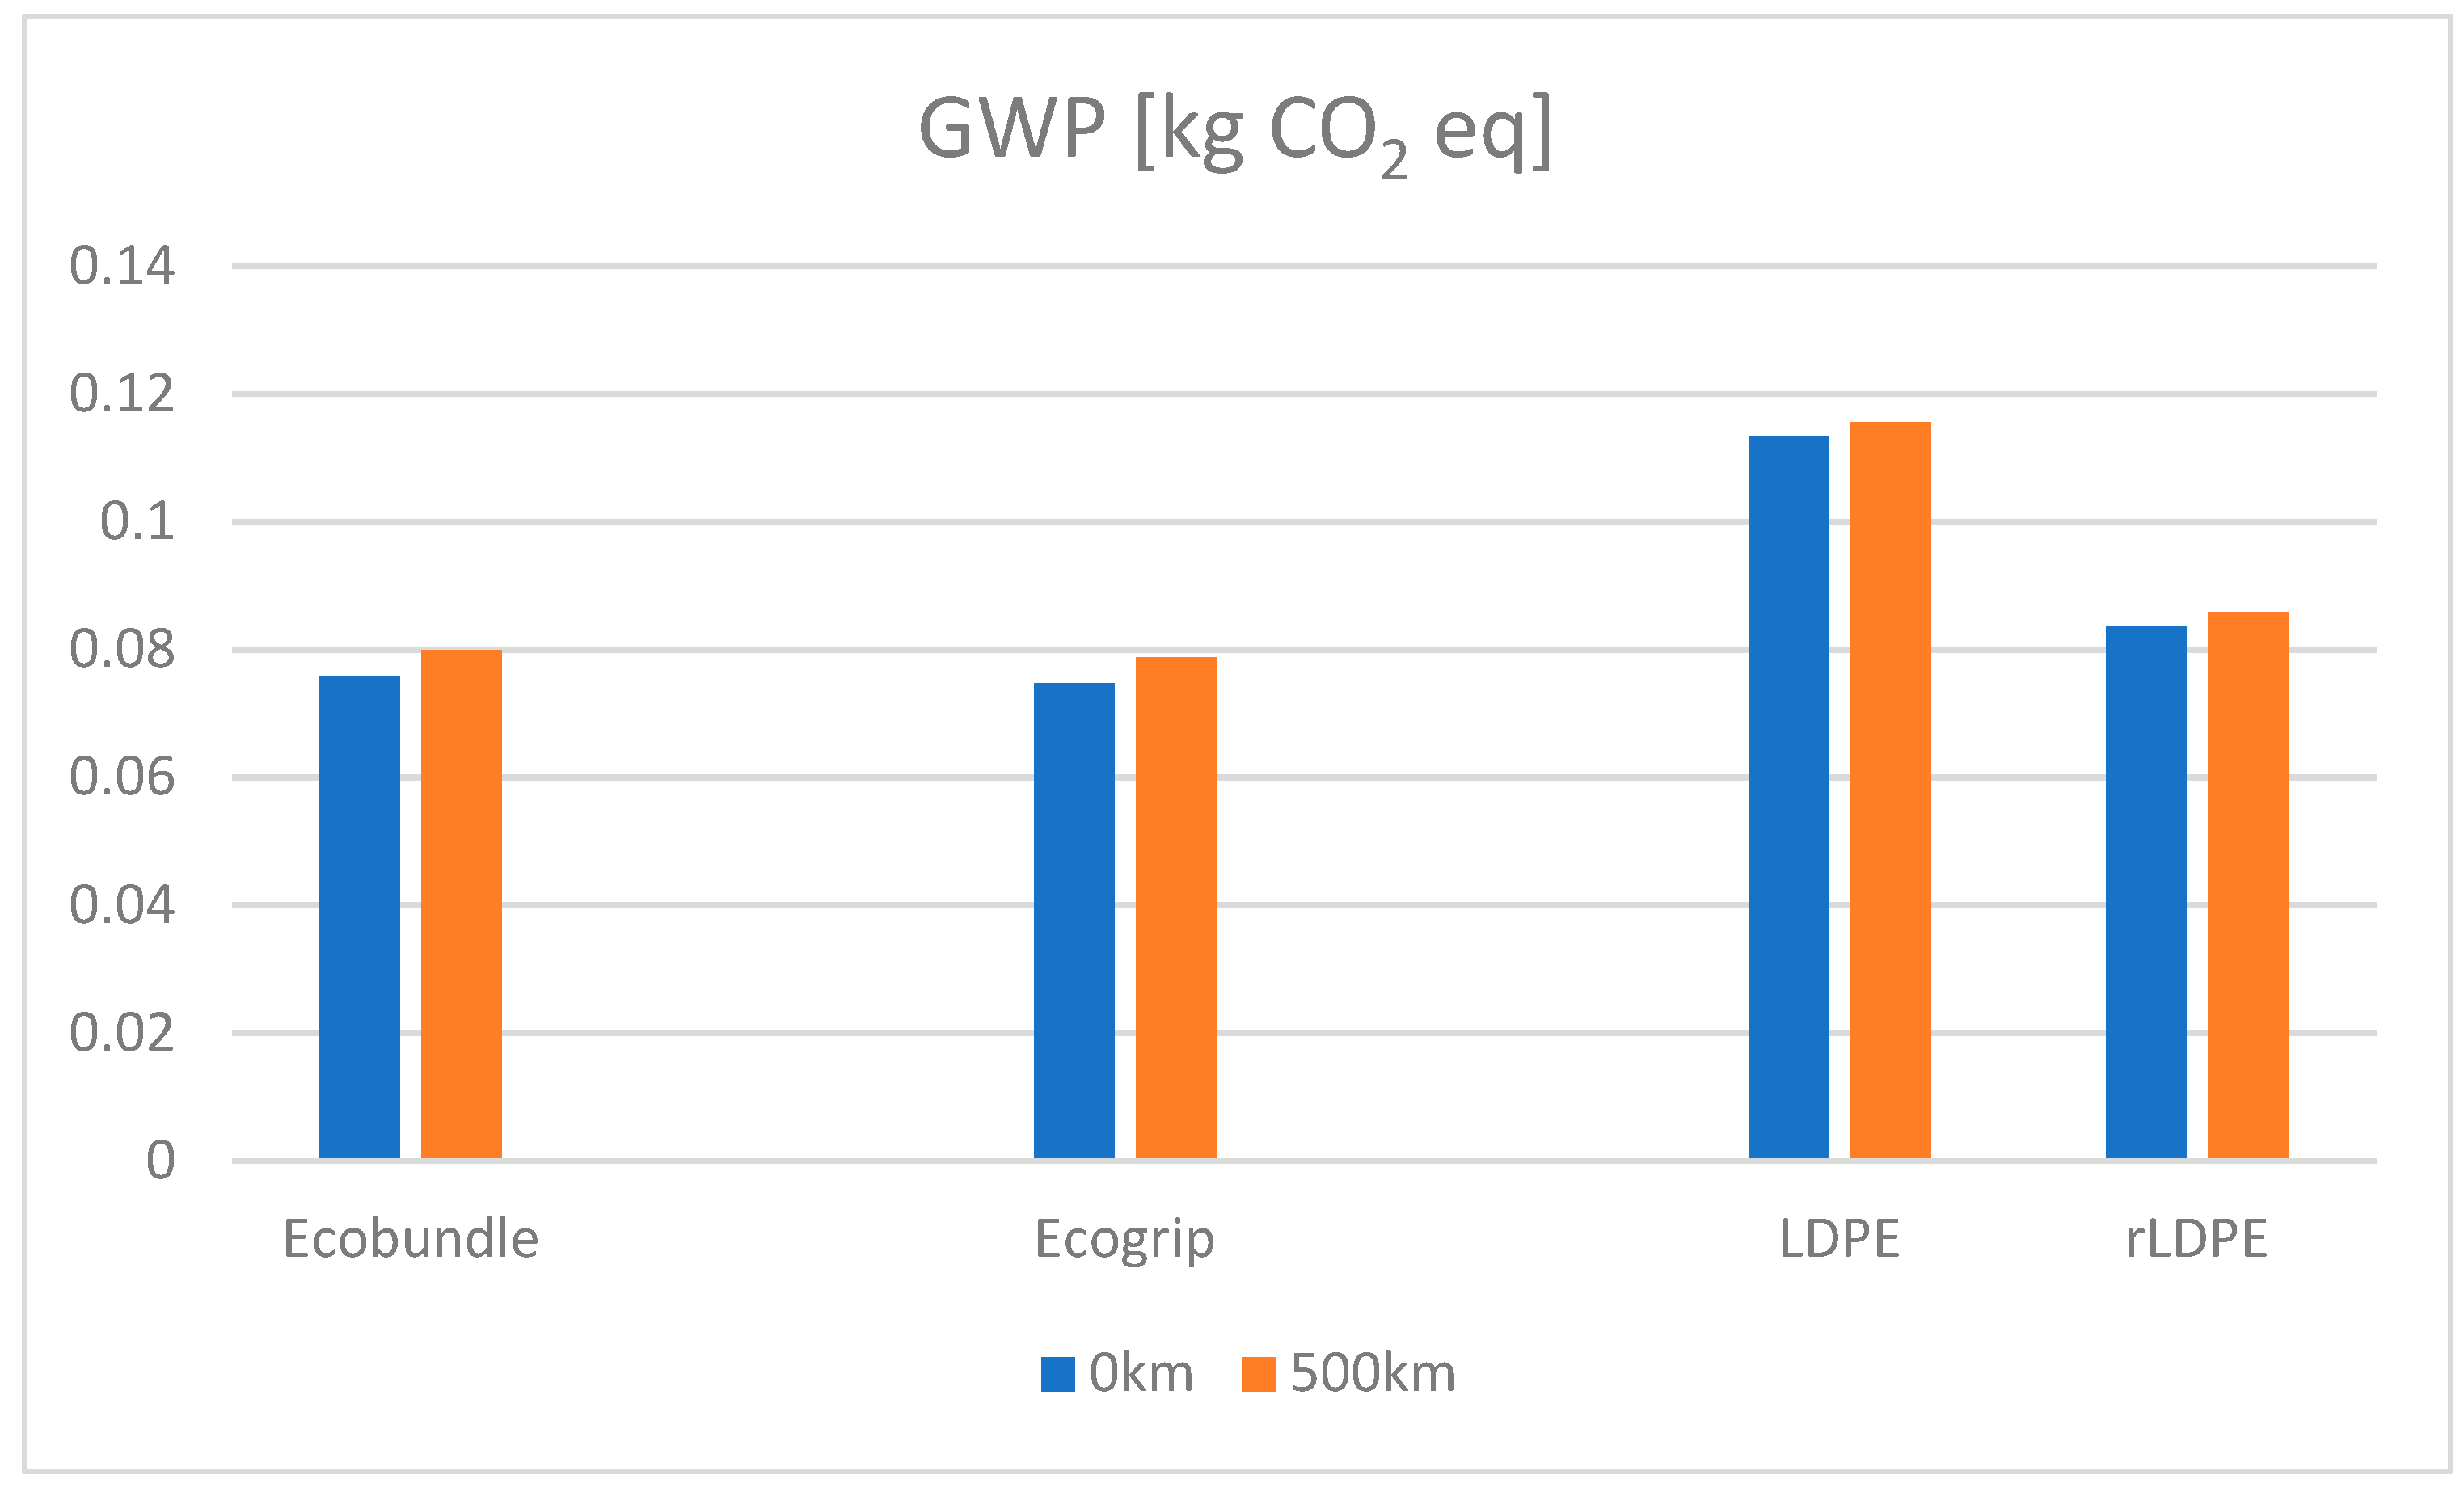
3. Results
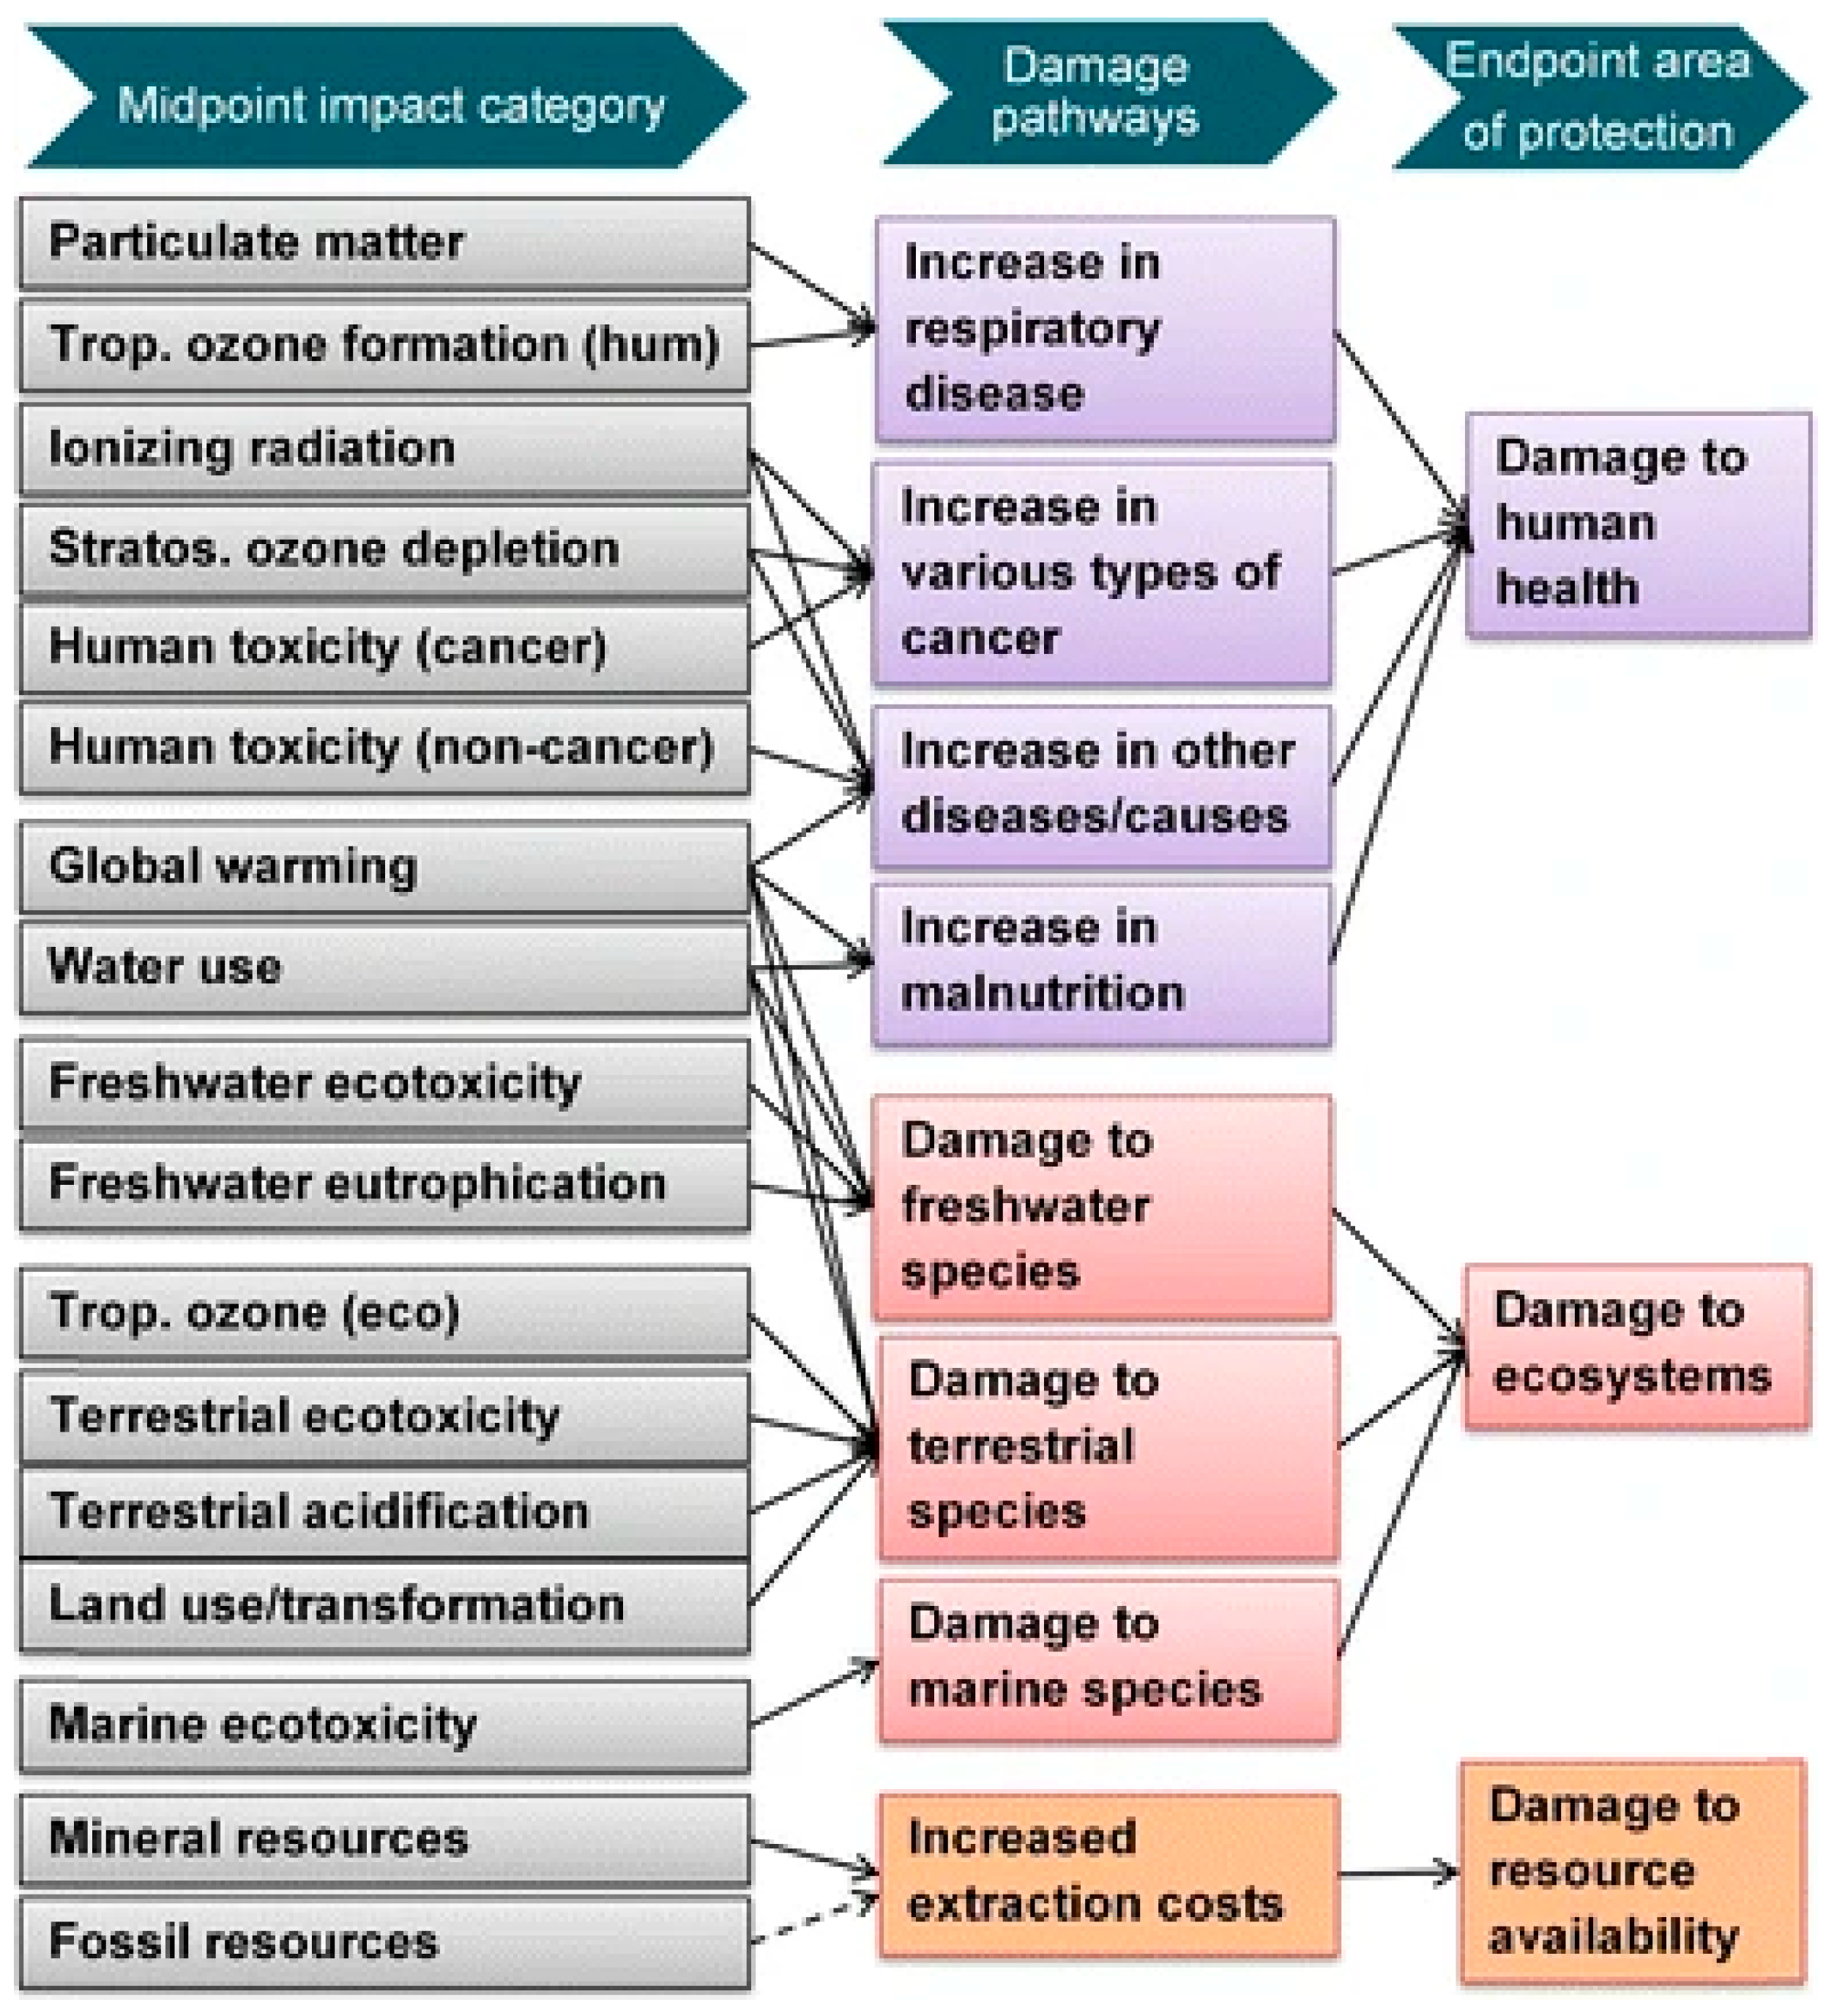
3.1. Midpoint Assessment
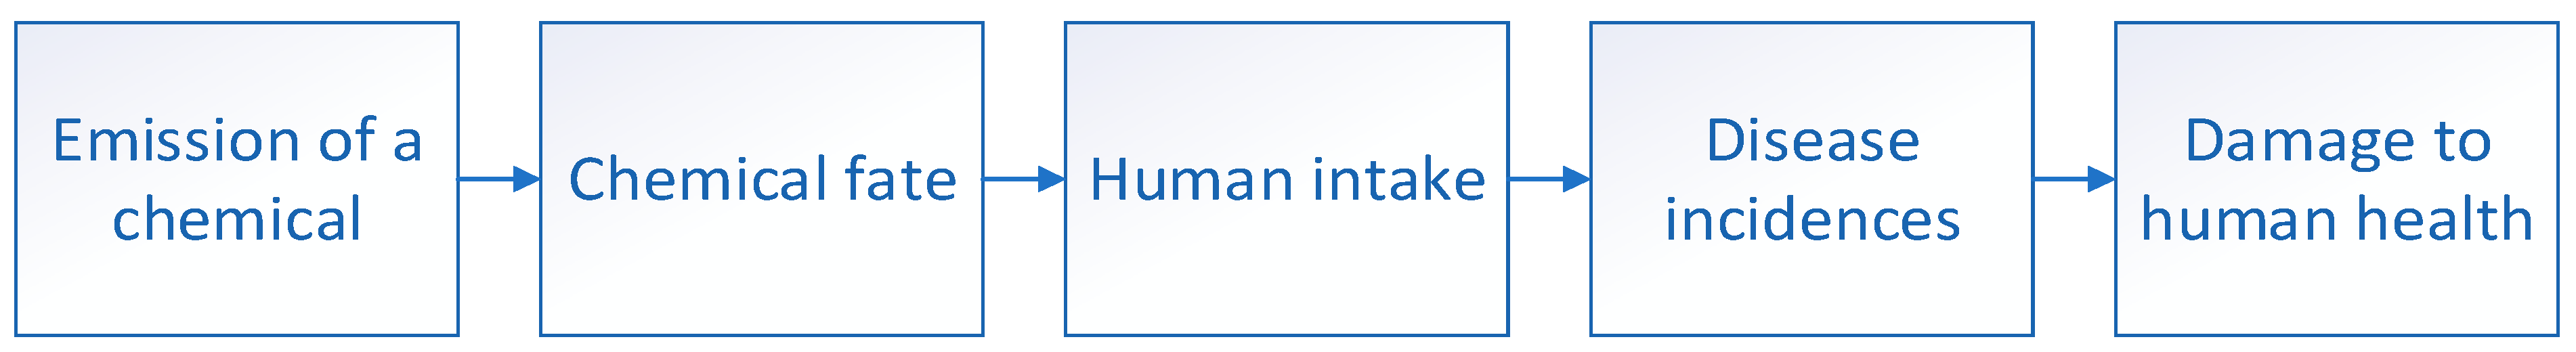
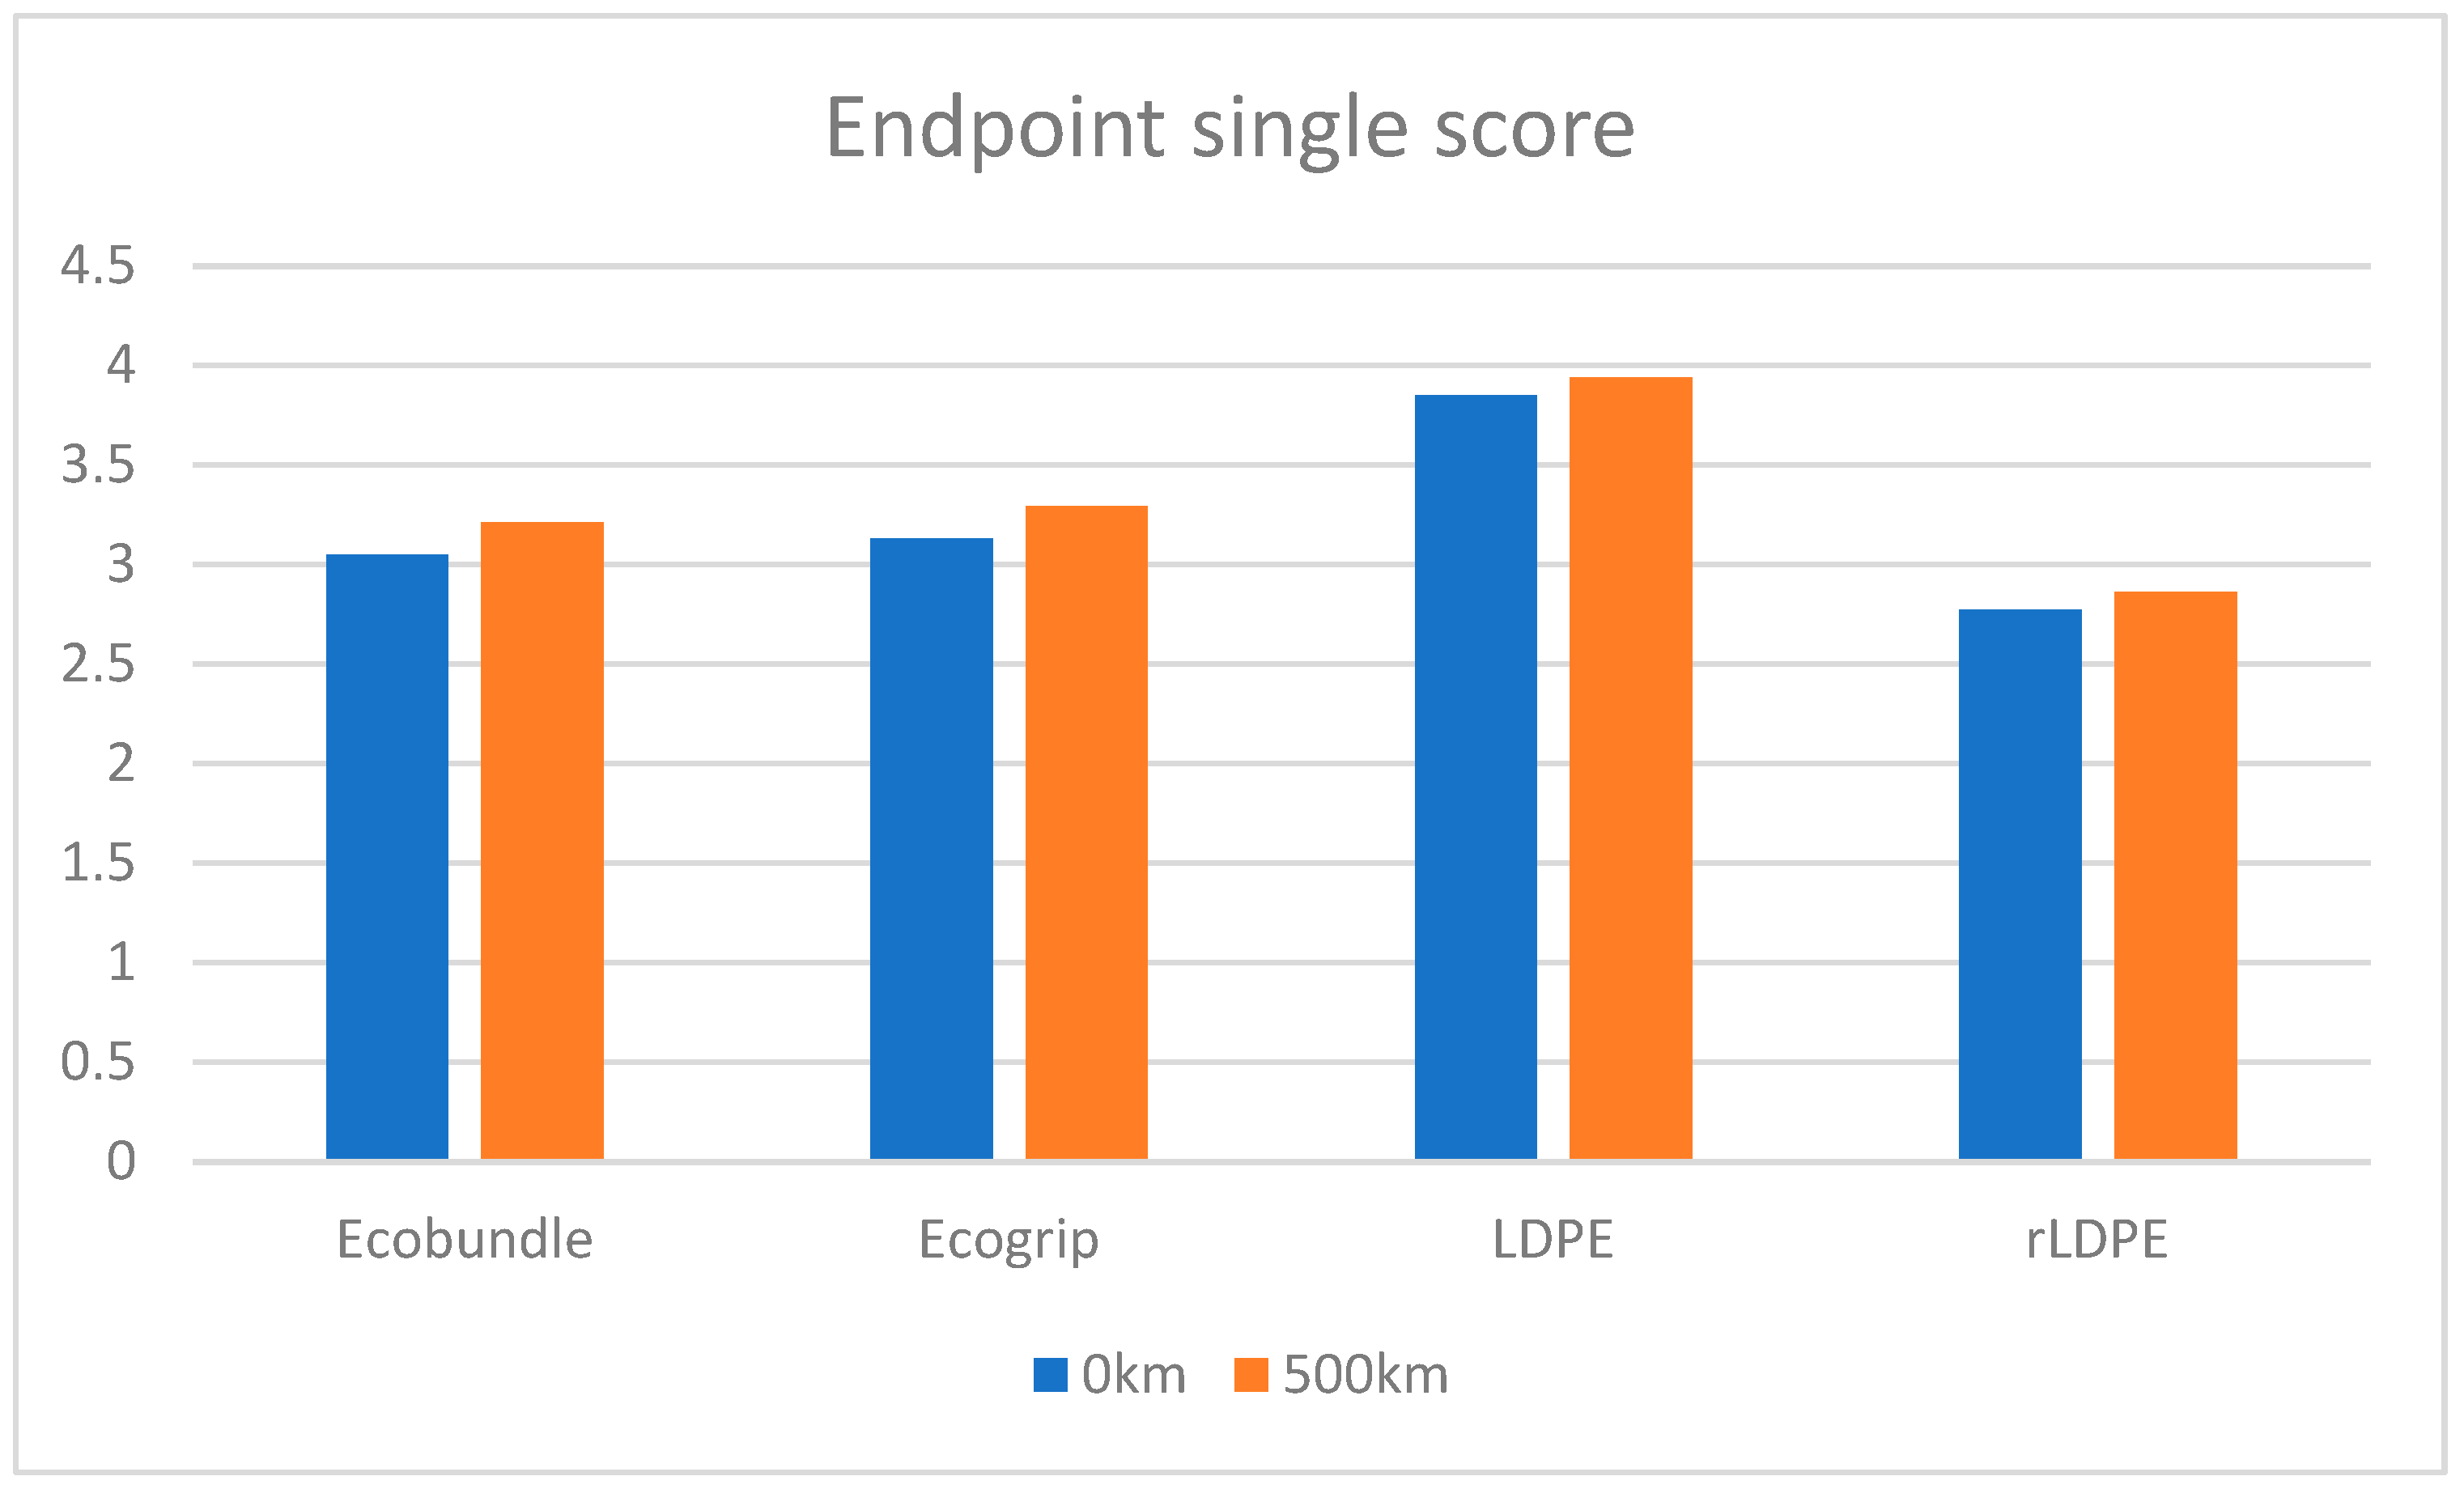
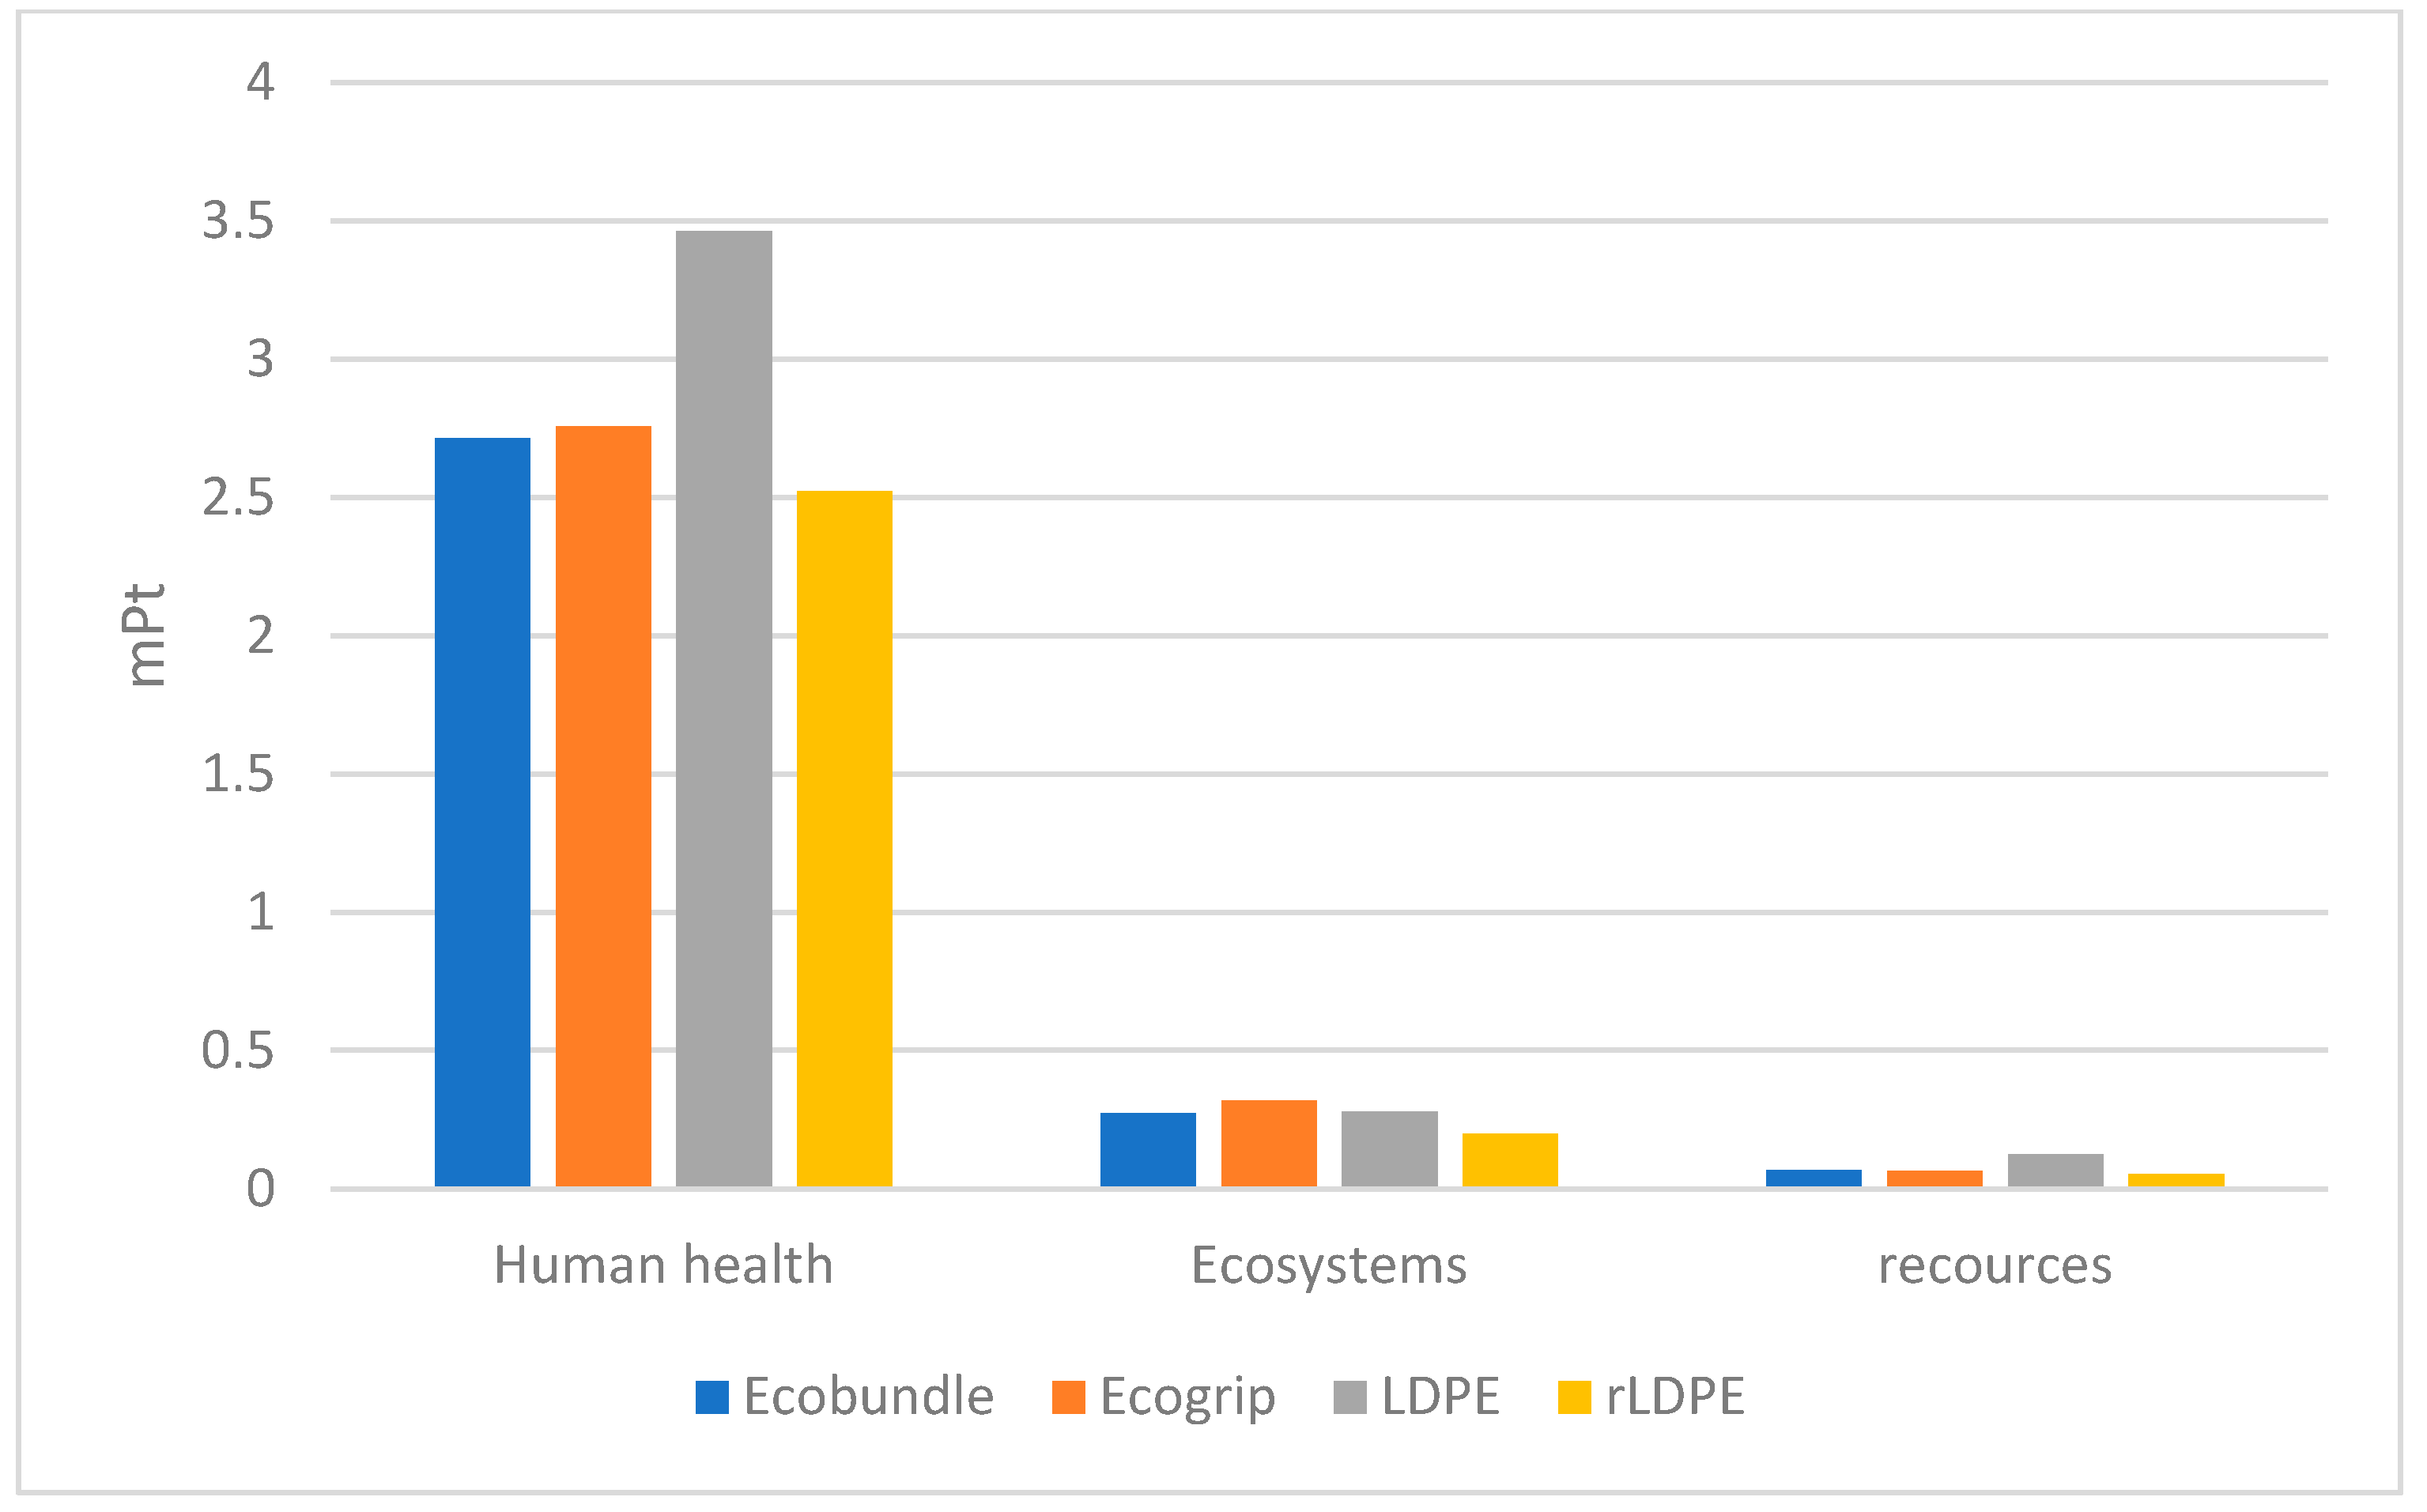
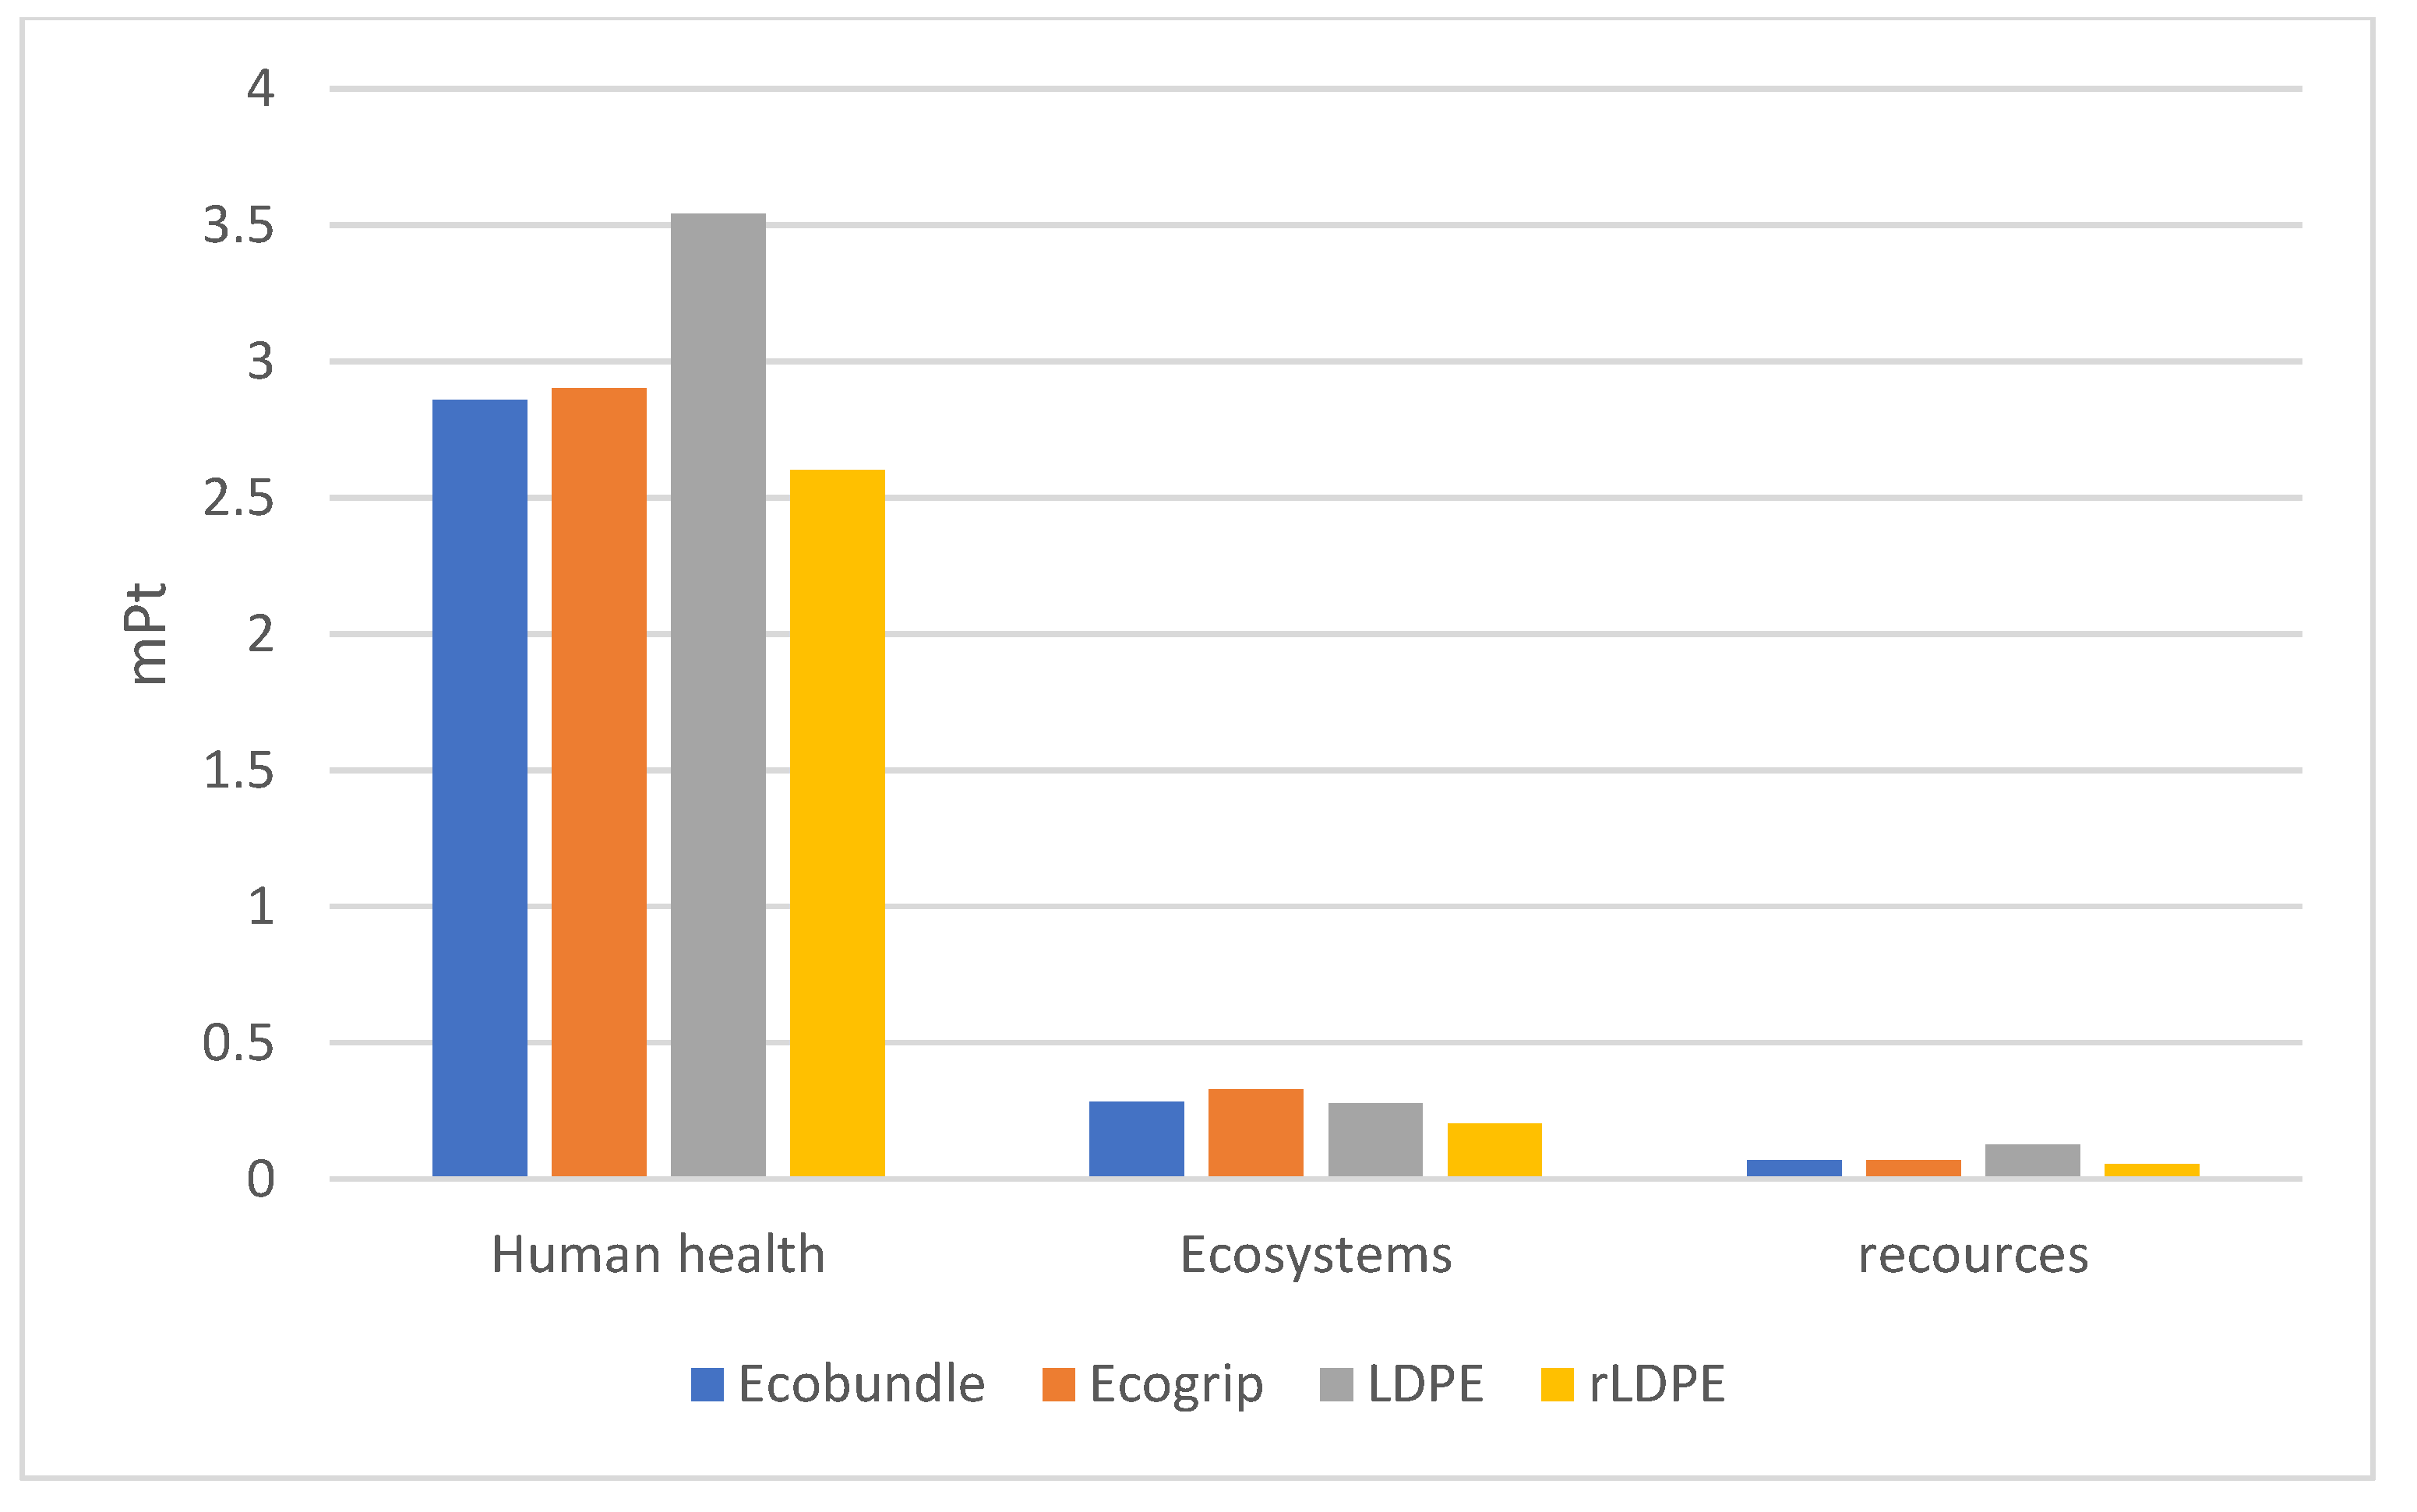
3.2. Endpoint Assessment
4. Discussion
5. Conclusions
Author Contributions
Funding
Institutional Review Board Statement
Data Availability Statement
Conflicts of Interest
Appendix A

| Product 01 |  |
| Commercial name | LDPE and rLDPE shrink film |
| Packaging type ‘declared unit’ | Bundle packaging for 6 PET bottles 1.5 L each |
| Materials | LDPE or rLDPE film and MOPP handle |
| Weight | Wrapping film: 15.74 g MOPP handle: 1.8 g |
| Max number of uses | 01—Single use |
| Distribution packaging | Corrugated interlayer 14.19 g Stretch PE film 4.95 g |
| Product 02 | 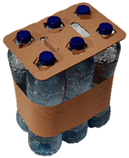 |
| Commercial name | Ecogrip |
| Packaging type‘declared unit’ | Bundle packaging for 6 PET bottles 1.5 L each |
| Materials | Corrugated board + stretch kraft paper |
| Weight | Stretch band of virgin kraft paper: 10 g Corrugated recycle d board: 28 g Hot glue: 6 × 0.03 g |
| Max number of uses | 01—Single use |
| Distribution packaging | Corrugated interlayer:14.19 g Stretch PE film 4.95 g |
 | |
| Commercial name | Ecobundle |
| Packaging type ‘declared unit’ | Bundle packaging for 6 PET bottles 1.5 L each |
| Materials | Corrugated board + stretch kraft paper |
| Weight | Virgin kraft paper handle: 2 × 2.7 g Corrugated recycled board: 40 g Hot glue: 14 × 0.03 g |
| Max number of uses | 01—Single use |
| Distribution packaging | Stretch PE film 4.95 g |
Appendix B
| 0 km Transport | |||||
|---|---|---|---|---|---|
| Indicator | Unit | Ecobundle | Ecogrip | Shrink Film | Shrink Film rLDPE |
| Global warming | - | 9.75 × 10⁻⁶ | 9.59× 10⁻⁶ | 1.46 × 10⁻⁵ | 1.07 × 10⁻⁵ |
| Stratospheric ozone depletion | - | 9.04 × 10⁻⁷ | 9.84 × 10⁻⁷ | 5.57 × 10⁻⁷ | 4.77 × 10⁻⁷ |
| Ionizing radiation | - | 2.22 × 10⁻⁵ | 2.28 × 10⁻⁵ | 1.65 × 10⁻⁵ | 1.15 × 10⁻⁵ |
| Ozone formation, Human health | - | 1.17 × 10⁻⁵ | 1.16 × 10⁻⁵ | 9.86× 10⁻⁶ | 6.17× 10⁻⁶ |
| Fine particulate matter formation | - | 5.00 × 10⁻⁶ | 4.99 × 10⁻⁶ | 4.17 × 10⁻⁶ | 2.76 × 10⁻⁶ |
| Ozone formation, Terrestrial ecosystem | - | 1.39 × 10⁻⁵ | 1.39 × 10⁻⁵ | 1.22 × 10⁻⁵ | 7.42 × 10⁻⁶ |
| Terrestrial acidification | - | 6.47 × 10⁻⁶ | 6.50 × 10⁻⁶ | 6.39 × 10⁻⁶ | 4.08 × 10⁻⁶ |
| Freshwater eutrophication | - | 6.44 × 10⁻⁵ | 6.44 × 10⁻⁵ | 4.33 × 10⁻⁵ | 2.99 × 10⁻⁵ |
| Marine eutrophication | - | 1.79 × 10⁻⁶ | 1.75 × 10⁻⁶ | 1.51 × 10⁻⁶ | 1.82 × 10⁻⁶ |
| Terrestrial ecotoxicity | - | 0.00027 | 0.00027275 | 0.0001698 | 0.00015395 |
| Freshwater ecotoxicity | - | 0.0024582 | 0.00251061 | 0.0033465 | 0.00332101 |
| Marine ecotoxicity | - | 0.003936 | 0.00402324 | 0.0053337 | 0.00530539 |
| Human carcinogenic toxicity | - | 0.0009747 | 0.0010012 | 0.0009941 | 0.0007789 |
| Human non-carcinogenic toxicity | - | 0.0005092 | 0.00054975 | 0.0005123 | 0.00048157 |
| Land use | - | 1.10 × 10⁻⁵ | 1.17 × 10⁻⁵ | 5.80 × 10⁻⁷ | 5.57 × 10⁻⁷ |
| Mineral resource scarcity | - | 1.53 × 10⁻⁹ | 1.54 × 10⁻⁹ | 1.46 × 10⁻⁹ | 1.18 × 10⁻⁹ |
| Fossil resource scarcity | - | 2.48 × 10⁻⁵ | 2.43 × 10⁻⁵ | 4.81 × 10⁻⁵ | 2.23 × 10⁻⁵ |
| Water consumption | - | 4.74 × 10⁻⁶ | 5.44 × 10⁻⁶ | 6.95 × 10⁻⁶ | 5.09 × 10⁻⁶ |
| 500 km Transport | |||||
|---|---|---|---|---|---|
| Indicator | Unit | Ecobundle | Ecogrip | Shrink Film | Shrink Film rLDPE |
| Global warming | - | 1.03 × 10⁻⁵ | 1.01 × 10⁻⁵ | 1.49 × 10⁻⁵ | 1.10 × 10⁻⁵ |
| Stratospheric ozone depletion | - | 9.36 × 10⁻⁷ | 1.02 × 10⁻⁶ | 5.75 × 10⁻⁷ | 4.95 × 10⁻⁷ |
| Ionizing radiation | - | 2.24 × 10⁻⁵ | 2.30 × 10⁻⁵ | 1.66 × 10⁻⁵ | 1.16 × 10⁻⁵ |
| Ozone formation, Human health | - | 1.27 × 10⁻⁵ | 1.27 × 10⁻⁵ | 1.05 × 10⁻⁵ | 6.77 × 10⁻⁶ |
| Fine particulate matter formation | - | 5.22 × 10⁻⁶ | 5.22 × 10⁻⁶ | 4.30 × 10⁻⁶ | 2.89 × 10⁻⁶ |
| Ozone formation, Terrestrial ecosystem | - | 1.52 × 10⁻⁵ | 1.52 × 10⁻⁵ | 1.29 × 10⁻⁵ | 8.13 × 10⁻⁶ |
| Terrestrial acidification | - | 6.79 × 10⁻⁶ | 6.82 × 10⁻⁶ | 6.58 × 10⁻⁶ | 4.26 × 10⁻⁶ |
| Freshwater eutrophication | - | 6.49 × 10⁻⁵ | 6.49 × 10⁻⁵ | 4.35 × 10⁻⁵ | 3.02 × 10⁻⁵ |
| Marine eutrophication | - | 1.80 × 10⁻⁶ | 1.76 × 10⁻⁶ | 1.52 × 10⁻⁶ | 1.83 × 10⁻⁶ |
| Terrestrial ecotoxicity | - | 0.0003481 | 0.00035093 | 0.0002135 | 0.00019769 |
| Freshwater ecotoxicity | - | 0.0025355 | 0.00258799 | 0.0033897 | 0.0033643 |
| Marine ecotoxicity | - | 0.004098 | 0.0041854 | 0.0054245 | 0.0053961 |
| Human carcinogenic toxicity | - | 0.0010068 | 0.00103336 | 0.0010121 | 0.00079688 |
| Human non-carcinogenic toxicity | - | 0.00053 | 0.00057061 | 0.0005239 | 0.00049324 |
| Land use | - | 1.10 × 10⁻⁵ | 1.17 × 10⁻⁵ | 6.01 × 10⁻⁷ | 5.77 × 10⁻⁷ |
| Mineral resource scarcity | - | 1.66 × 10⁻⁹ | 1.67 × 10⁻⁹ | 1.53 × 10⁻⁹ | 1.25 × 10⁻⁹ |
| Fossil resource scarcity | - | 2.63 × 10⁻⁵ | 2.58 × 10⁻⁵ | 4.89 × 10⁻⁵ | 2.31 × 10⁻⁵ |
| Water consumption | - | 4.77 × 10⁻⁶ | 5.47 × 10⁻⁶ | 6.96 × 10⁻⁶ | 5.10 × 10⁻⁶ |
Appendix C
| 0 km Transport | |||||||
|---|---|---|---|---|---|---|---|
| Impact Class | Eenheid | Ecobundle | Ecobundle (Recycled) | Ecogrip | Ecogrip (Recycled) | Shrink Film | Shrink Film rLDPE |
| Total | mPt | 3.639 | 3.0554 | 3.6721 | 3.1395 | 3.8581 | 2.7749 |
| Human health | mPt | 3.0525 | 2.7151 | 3.0648 | 2.7569 | 3.4619 | 2.5228 |
| Ecosystems | mPt | 0.5316 | 0.2738 | 0.5535 | 0.3183 | 0.2726 | 0.1986 |
| Resources | mPt | 0.055 | 0.0664 | 0.0538 | 0.0642 | 0.1235 | 0.0534 |
| 500 km Transport | |||||||
|---|---|---|---|---|---|---|---|
| Impact Class | Eenheid | Ecobundle | Ecobundle (Recycled) | Ecogrip | Ecogrip (Recycled) | Shrink Film | Shrink Film rLDPE |
| Total | mPt | 3.7975 | 3.2139 | 3.8307 | 3.2981 | 3.9468 | 2.8636 |
| Human health | mPt | 3.1952 | 2.8578 | 3.2076 | 2.8997 | 3.5417 | 2.6027 |
| Ecosystems | mPt | 0.543 | 0.2853 | 0.5649 | 0.3298 | 0.279 | 0.205 |
| Resources | mPt | 0.0594 | 0.0708 | 0.0582 | 0.0686 | 0.126 | 0.0559 |
References
- Howard, B.C.; Gibbens, S.; Zachos, E.; Parker, E. A Running List of Action on Plastic Pollution. 2018. Available online: https://www.nationalgeographic.com/environment/article/ocean-plastic-pollution-solutions?user.testname=none (accessed on 1 August 2023).
- Council directive 2019/904 on the reduction of the impact of certain plastic products on the environment. Off. J. L155 2019, 2019, 1–19.
- NEN-EN 643:2014 Paper and Board—European List of Standard Grades of Recovered Paper and Board. Available online: https://www.scribd.com/document/512558233/SR-EN-643-2014 (accessed on 1 August 2023).
- Council directive 94/62/EC on packaging and packaging waste. Off. J. L365 1994, 1994, 10–23.
- Eurostat—Recycling Rate of Packaging Waste by Type of Packaging. Available online: https://ec.europa.eu/eurostat/web/products-datasets/-/cei_wm020 (accessed on 11 September 2023).
- Roman, J.; Verschueren, G.; Nica, W.; Slaets, P.; Juwet, M. Cardboard Eco-Bundle as an Alternative for Collation Shrink Film. Open J. Appl. Sci. 2023, 13, 94–108. [Google Scholar] [CrossRef]
- Roman, J.; Nica, W.; Teerlinck-Boelens, G.; Slaets, P.; Juwet, M. Paper as an alternative for collation shrink film. Packag. Technol. Sci. 2022, 35, 485–495. [Google Scholar] [CrossRef]
- Bueno, C.; Hauschild, M.Z.; Rossignolo, J.A.; Ometto, A.R.; Mendes, N.C. Sensitivity analysis of the use of Life Cycle Impact Assessment methods: A case study on building materials. J. Clean. Prod. 2016, 112, 2208–2220. [Google Scholar] [CrossRef]
- Eumos 40509:2020 Standard—Test Method for Load Unit Rigidity. Available online: https://sicurezzadelcarico.it/index.php/en/laws-regulations/technical-standards/eumos-40509/ (accessed on 1 August 2023).
- Finkbeiner, M.; Inaba, A.; Tan, R.; Christiansen, K.; Klüppel, H.-J. The New International Standards for Life Cycle Assessment: ISO 14040 and ISO 14044. Int. J. Life Cycle Assess. 2006, 11, 80–85. [Google Scholar] [CrossRef]
- Hauschild, M.Z.; Rosenbaum, R.K.; Olsen, S.I. Life Cycle Assessment: Theory and Practice, 1st ed.; Hauschild, M.Z., Rosenbaum, R.K., Olsen, S.I., Eds.; Springer International Publishing: Berlin/Heidelberg, Germany, 2018. [Google Scholar] [CrossRef]
- Huijbregts, M.A.J.; Steinmann, Z.J.N.; Elshout, P.M.F.; Stam, G.; Verones, F.; Vieira, M.; Zijp, M.; Hollander, A.; van Zelm, R. ReCiPe2016: A harmonised life cycle impact assessment method at midpoint and endpoint level. Int. J. Life Cycle Assess. 2017, 22, 138–147. [Google Scholar] [CrossRef]
- Blue Box Partners. Available online: https://www.packaging4europe.com/ (accessed on 2 August 2023).
- Krones Variopac Pro. Available online: https://www.krones.com/en/products/machines/versatile-packaging-machine.php (accessed on 2 August 2023).
- Production Line of Cardboard. Available online: https://www.fefco.org/technical–information/production-process (accessed on 2 August 2023).
- European Database for Corrugated Board Life Cycle Studies. Available online: https://www.fefco.org/sites/default/files/documents/2022/FEFCO_LCA_2022.pdf (accessed on 2 August 2023).
- List of Most Populous Municipalities in Belgium. Available online: https://en.wikipedia.org/wiki/List_of_most_populous_municipalities_in_Belgium (accessed on 2 August 2023).
- VPK Locations. Available online: https://www.vpkgroup.com/be-nl/locaties (accessed on 2 August 2023).
- Europe Bottled Water Companies. Available online: https://www.mordorintelligence.com/industry-reports/europe-bottled-water-market/companies (accessed on 2 August 2023).
- Afvalverbrandingsinstallatie. Available online: URL:https://nl.wikipedia.org/wiki/Afvalverbrandingsinstallatie (accessed on 2 August 2023).
- Verpakkingsafval. Available online: https://www.vlaanderen.be/statistiek-vlaanderen/milieu-ennatuur/verpakkingsafval (accessed on 2 August 2023).
- Carvalho, A.; Mimoso, A.F.; Mendes, A.N.; Matos, H.A. From a literature review to a framework for environmental process impact assessment index. J. Clean. Prod. 2014, 64, 36–62. [Google Scholar] [CrossRef]
- Silva, N.; Molina-Besch, K. Replacing plastic with corrugated cardboard: A carbon footprint analysis of disposable packaging in a B2B global supply chain—A case study. Resour. Conserv. Recycl. 2023, 191, 106871. [Google Scholar] [CrossRef]
- Nguyen, A.T.; Parker, L.; Brennan, L.; Lockrey, S. A consumer definition of eco-friendly packaging. J. Clean. Prod. 2020, 252, 119792. [Google Scholar] [CrossRef]
- 8 FAQS About Post Consumer Recycled Resin (PCR Resin). Available online: https://www.aaapolymer.com/post-consumer-recycled-resin/ (accessed on 9 October 2023).


| Corrugated Paper and Board—1.04, 4.05 | ||||
|---|---|---|---|---|
| Code | Name | Description | Non-Paper Components in % (max) | Total Unwanted Material in % (max) |
| 1.04.00 | Corrugated paper and board packaging | Used paper and board packaging, containing a minimum of 70% of corrugated board, the rest being other packaging papers and boards. | 1.5 | 3 |
| 1.04.01 | Ordinary corrugated paper and board | Used paper and board packaging, containing a minimum of 70% of corrugated board, the rest being other paper and board products. | 1.5 | 3 |
| 1.04.02 | Corrugated paper and board | Used paper and board packaging, containing a minimum of 80% of corrugated board, the rest being other paper and board products. | 1.5 | 3 |
| 1.05.00 | Ordinary corrugated board | Used boxes and sheets of corrugated board of various qualities, may include 10% of other packaging papers and boards. | 1.5 | 2.5 |
| 1.05.01 | Corrugated board | Used boxes and sheets of corrugated board of various qualities, may include 5% of other packaging papers and boards. | 1.5 | 2.5 |
| UPSTREAM | Raw material supply Transport Manufacturing |
| CORE | Packaging Forming |
| DOWNSTREAM | Transport to recovery/disposal EOL scenarios |
| Material | Ecogrip | Ecobundle |
|---|---|---|
| Corrugated board | 47.40 g | 51.95 g |
| Paper | 10.00 g | 5.40 g |
| Corrugated board + Paper | 57.40 g | 57.35 g |
| Material | Fraction Recycled [%] |
|---|---|
| CORRUGATED BOARD AND PAPER | 89.7 |
| GLASS | 96.9 |
| METALS | 96.2 |
| PLASTICS | 44.7 |
Disclaimer/Publisher’s Note: The statements, opinions and data contained in all publications are solely those of the individual author(s) and contributor(s) and not of MDPI and/or the editor(s). MDPI and/or the editor(s) disclaim responsibility for any injury to people or property resulting from any ideas, methods, instructions or products referred to in the content. |
© 2023 by the authors. Licensee MDPI, Basel, Switzerland. This article is an open access article distributed under the terms and conditions of the Creative Commons Attribution (CC BY) license (https://creativecommons.org/licenses/by/4.0/).
Share and Cite
Jannes, R.; Vanhauwermeiren, P.; Slaets, P.; Juwet, M. Assessing the Sustainable Potential of Corrugated Board-Based Bundle Packaging of PET Bottles: A Life Cycle Perspective—A Case Study. Clean Technol. 2023, 5, 1214-1234. https://doi.org/10.3390/cleantechnol5040061
Jannes R, Vanhauwermeiren P, Slaets P, Juwet M. Assessing the Sustainable Potential of Corrugated Board-Based Bundle Packaging of PET Bottles: A Life Cycle Perspective—A Case Study. Clean Technologies. 2023; 5(4):1214-1234. https://doi.org/10.3390/cleantechnol5040061
Chicago/Turabian StyleJannes, Roman, Pieter Vanhauwermeiren, Peter Slaets, and Marc Juwet. 2023. "Assessing the Sustainable Potential of Corrugated Board-Based Bundle Packaging of PET Bottles: A Life Cycle Perspective—A Case Study" Clean Technologies 5, no. 4: 1214-1234. https://doi.org/10.3390/cleantechnol5040061