Article

Evaluation of Distillery Fractions in Direct Methanol Fuel Cells and Screening of Reaction Products

by
Giuseppe Montevecchi
1,
Maria Cannio
2,3,*,
Umberto Cancelli
1,4,
Andrea Antonelli
1 and
Marcello Romagnoli
2
1
Department of Life Sciences (Agro-Food Science Area), BIOGEST—SITEIA Interdepartmental Centre, University of Modena and Reggio Emilia, Piazzale Europa 1A, 42124 Reggio Emilia, Italy
2
Department of Engineering “Enzo Ferrari”, University of Modena and Reggio Emilia, Via Vivarelli 10, 41125 Modena, Italy
3
Resoh Solutions SRL, Via Pietro Guardini 476/N, 41124 Modena, Italy
4
Department of Food and Drug Sciences, University of Parma, Parco Area delle Scienze 27A, 43100 Parma, Italy
*
Author to whom correspondence should be addressed.
Clean Technol. 2024, 6(2), 513-527; https://doi.org/10.3390/cleantechnol6020027
Submission received: 30 December 2023 / Revised: 17 March 2024 / Accepted: 16 April 2024 / Published: 22 April 2024
(This article belongs to the Special Issue Valorization of Industrial and Agro Waste)

Abstract

:
Fuel cells represent an appealing avenue for harnessing eco-friendly energy. While their fuel supply traditionally stems from water electrolysis, an environmentally conscious approach also involves utilizing low-weight alcohols like methanol and ethanol. These alcohols, concentrated from sustainable sources within the enological by-product distillation process, offer a noteworthy contribution to the circular economy. This study delved into evaluating the efficacy of distillery fractions in powering methanol fuel cells. Beyond their energy-generation potential, the performed GC-MS analysis unveiled appreciable quantities of acetic acid resulting from the partial oxidation of ethanol. This revelation opens the door to intriguing possibilities, including the recovery and repurposing of novel compounds such as short-chain fatty acids (predominantly acetic acid), ketones, and aldehydes—establishing a link between sustainable energy production and the emergence of valuable by-product applications.

1. Introduction

In recent times, the imperative for developing novel technologies and harnessing renewable energy sources has intensified. Among these emerging solutions, fuel cells stand out as a promising remedy for the escalating global energy requirements, offering the dual advantage of addressing the mounting dependence on fossil fuels. Despite being the predominant energy source, fossil fuels continue to exert the most profound influence on both the environment and humanity. Moreover, their unrestrained exploitation gives rise to intricate political and social quandaries. Within this intricate landscape, investigating and enhancing fuel cell technologies not only promise palpable environmental gains but also hold the potential to ameliorate societal disparities.
Proton-exchange membrane or polymer–electrolyte membrane (PEM) fuel cells (FC) represent a technology that has come to the fore to produce power in the last few years. In direct methanol and direct ethanol fuel cells (DMFC and DEFC, respectively), these alcohols are oxidized into carbon dioxide in the anode layer, thus releasing electrons that are transported through an external circuit to the cathode, where oxygen is reduced to water [1,2,3,4,5,6,7].
Methanol and ethanol have the advantage of being liquids and easily transportable at room temperature and atmospheric pressure [8] and, consequently, their application in power production has revamped FC technology [9]. Furthermore, these alcohols can be produced from biomasses and wastewaters [10,11,12,13], aside from natural gas, or other hydrocarbons, through the steam-reforming process.
The possibility of having these alcohols available from carbohydrate fermentation and enzymatic activities is very attractive [14,15] as the carbon dioxide formed during FC performance balances that consumed in plant photosynthesis. For this reason, the use of these alcohols does not increase the greenhouse effect [12,16].
The utilization of waste generated from distilleries as a valuable resource for fueling methanol and ethanol fuel cells holds significant promise for advancing sustainable energy solutions. Distillery waste, which predominantly consists of organic materials such as spent grains, residues, and by-products, can be transformed into bio-methanol and bio-ethanol through a series of biochemical and catalytic processes. This bio-alcohol can then serve as a clean and renewable fuel source for DMFC and DEFC fuel cells, generating electricity with minimal emissions. By repurposing distillery waste into bio-alcohols, we not only mitigate environmental concerns associated with waste disposal but also contribute to the reduction of greenhouse gas emissions and the transition towards a more circular and resource-efficient economy. This innovative approach exemplifies the synergies between the agriculture, energy, and waste management sectors, offering a tangible step towards a greener and more sustainable future.
Enological by-products are generally distilled to obtain neutral ethanol. The separation of ethanol from its congeners takes place in a multistage plant where these substances are separated from ethanol through concentrated out-streams that are withdrawn in different points of the plant [17,18]. These out-streams are concentrated solutions in a minimal amount of ethanol that, along with water, are the main solvents [19,20,21,22]. These fractions (so-called phlegms) are generally burnt in waste-to-energy facilities or used as co-formulant in denatured alcohol. Although these fractions could also be used for bio-methane production [23], in general, more profitable uses with higher yields are required by distilleries.
The high alcoholic strength of some of these fractions, the absence of non-volatile contaminants, and the presence of appreciable amounts of other volatile congeners all coming from renewable sources constitute an attractive opportunity to use DMFC and DEFC as alternative sources to the use of pure chemicals, in many cases of fossil origin.
The primary objective of this project was to delve into innovative avenues for the technical and commercial enhancement of distillation fractions. While ethanol stands as the predominant alcohol within these fractions, its energy density falls short of that exhibited by methanol. Considering this, a groundbreaking facet of this research study focused on the utilization of these alcoholic fractions within DMFC. This endeavor sought to unlock the latent potential of the combined energy density of methanol, in conjunction with the calorific value of ethanol. Notably, the intricate/complex composition of these fuels represents uncharted territory within the realm of fuel cells. The present investigation represents a pioneering effort, as no prior exploration into fuels of such complex compositions within fuel cell technology has been documented. As we navigated this unexplored landscape, we anticipated both the prospect of renewable energy fuels and the possibility of unanticipated outcomes and side product formation.

2. Materials and Methods

2.1. Plant and Sampling

The distillation fractions were supplied by Caviro S.p.A. (Faenza, Italy) and were classified as follows: distillation heads and tails deriving from grape pomace (HTG); distillation heads and tails deriving from lees (HTL); demethylation column reflux fraction (DRF); and epuration column recycling fraction (ERF). Figure 1 shows a scheme of the considered distillation plant, a common 7-column purification plant, and the main fractions involved in the multistep process, along with the sampling sites [24].

2.2. Chemicals

All pure reference standards and other chemicals were of analytical grade and purchased from Sigma–Aldrich (Milan, Italy). Deionized water was obtained through an Elix 3UV purification system (Merck Millipore, Milan, Italy). The deionized water was produced using tap water through a Merck Millipore Elix3UV water purification system. The resistivity of the deionized water was >5 MΩ·cm at 25 °C and TOC < 30 ppb.
Here is the list of pure standards used: 2-methylpropan-1-ol, 2-methylpropyl ethanoate, 3-hydroxybutan-2-one, 3-methylbutan-1-ol, 3-methylbutyl acetate, 3-methyl-1-pentanol (internal standard), acetic acid, butan-1-ol, butan-2-ol, butan-2-one, butyric acid, ethanal, ethanol, ethyl 2-hydroxypropanoate, ethyl 2-methylpropanoate, ethyl acetate, ethyl hexanoate, ethyl octanoate, ethyl pentanoate, hexan-1-ol, hexyl acetate, isobutyric acid, isovaleric acid, methanol, pentan-1-ol, propan-1-ol, and propionic acid (internal standard).

2.3. Direct Methanol Fuel Cell and Experiments’ Description

The instrumentation used for the experiments included a direct methanol fuel cell (DMFC; F111, Fuel Cell Store, College Station, TX, USA) that works with dominant methanol solutions (3% w/w). This fuel cell employs a proton-exchange membrane (PEM) made of sulfonated tetrafluoroethylene (Nafion) and features a Pt-Rh binary catalyst on a carbon support with an active surface area of 4 cm2. The electrolyte consisted of a Nafion® membrane, 25 µm thick, with an active area of 50 mm × 50 mm. The anode and cathode electrodes were loaded with Pt-Rh at rates of 0.3 mg/cm2 and 0.6 mg/cm2, respectively. For the analysis of distillation fractions, the Fuel Cell pack kit “ClearPak™” (Pragma Industries, Biarritz, France) was employed. The main specifications of this system include dimensions measuring 110 mm × 90 mm × 70 mm, a weight of 520 g, and a power supply of 24 VDC. The pack also includes a power hub to feed the regulated air supply system. It is designed to operate within certain parameters:
  • Maximum gas pressure of 2 bars and a maximum internal temperature of 70 °C;
  • Voltage control/voltage measurements: from 0.05 V to 5 V with a resolution of 0.01 V;
  • Current control/measurement: from 0 A to 25 A with a resolution of 0.1 A;
  • Temperature measurement: 0–110 °C with a resolution of 1%.
To collect data, a data logger was used to regulate voltage settings, and a multimeter, specifically the digital multimeter fluke 87 V Voltage and Current DC/AC model, was employed to measure current flowing through the circuit. The multimeter boasts an error margin declared by the manufacturer of 3%. These instruments were interconnected in series with the cell. Additionally, the power generator was specifically calibrated to deliver power outputs of up to 10 mW.
A diagram illustrating the instruments employed in the experiments conducted is presented in Figure 2.
All the distillation fractions were diluted with water up to 3% w/w based on the initial amounts of ethanol and methanol, and 1.5 g (exactly weighed) of each diluted sample was introduced into the DMFC chamber. Before and after the test, the DMFC was exactly weighed to determine the final net weight. As for the cleaning procedure, the cell was rinsed with deionized water, then left overnight with 1% sulfuric acid to regenerate the membrane, and, finally, carefully rinsed with deionized water.
At the anode, methanol is directly oxidized to carbon dioxide, while at the cathode, oxygen is reduced to water. Protons formed during this process will pass through the membrane and move towards the cathode, whereas electrons will flow through the external circuit. The reactions taking place are outlined as follows:
Anode reaction:    CH3OH + H2O → CO2 + 6 H+ + 6 e
                                                    CH3CH2OH + 3 H2O → 2 CO2 + 12 H+ + 12 e
Cathode reaction:    1.5 O2 + 6 H+ + 6 e → 3 H2O
                                         3 O2 + 12 H+ + 12 e → 6 H2O
Overall reaction:    CH3OH + 1.5 O2 → CO2 + 2 H2O
                                              CH3CH2OH + 3 O2 → 2 CO2 + 3 H2O

2.4. Determination of the Relationship of Voltage, Current Intensity, and Apparent Power during the DMFC Experiments

Methanol and ethanol aqueous solutions with known concentrations and all the distillation fractions diluted with deionized water to a 3% w/w ethanol content were used in an experiment where the voltage (V) was varied between 50 and 200 mV. The current intensity and apparent power were measured, with each test repeated 4 times.
Briefly, to measure and plot current and voltage, a series circuit was assembled using a data logger to set the voltage and a multimeter to measure the current passing through the circuit. The data logger was responsible for defining the desired load by adjusting an internal variable-value resistor, while the cell acted as the current generator, and the multimeter recorded the current passing through. The power generator was designed for outputs up to 10 mW. Each test involved introducing precisely 1.5 g of the diluted fraction into the DMFC chamber. After each test, the cell was rinsed with distilled water followed by 1% sulfuric acid to regenerate the membrane. Tests were conducted in a random order to minimize contamination between samples and prevent false results. The solutions used for each sample composition remained consistent throughout.

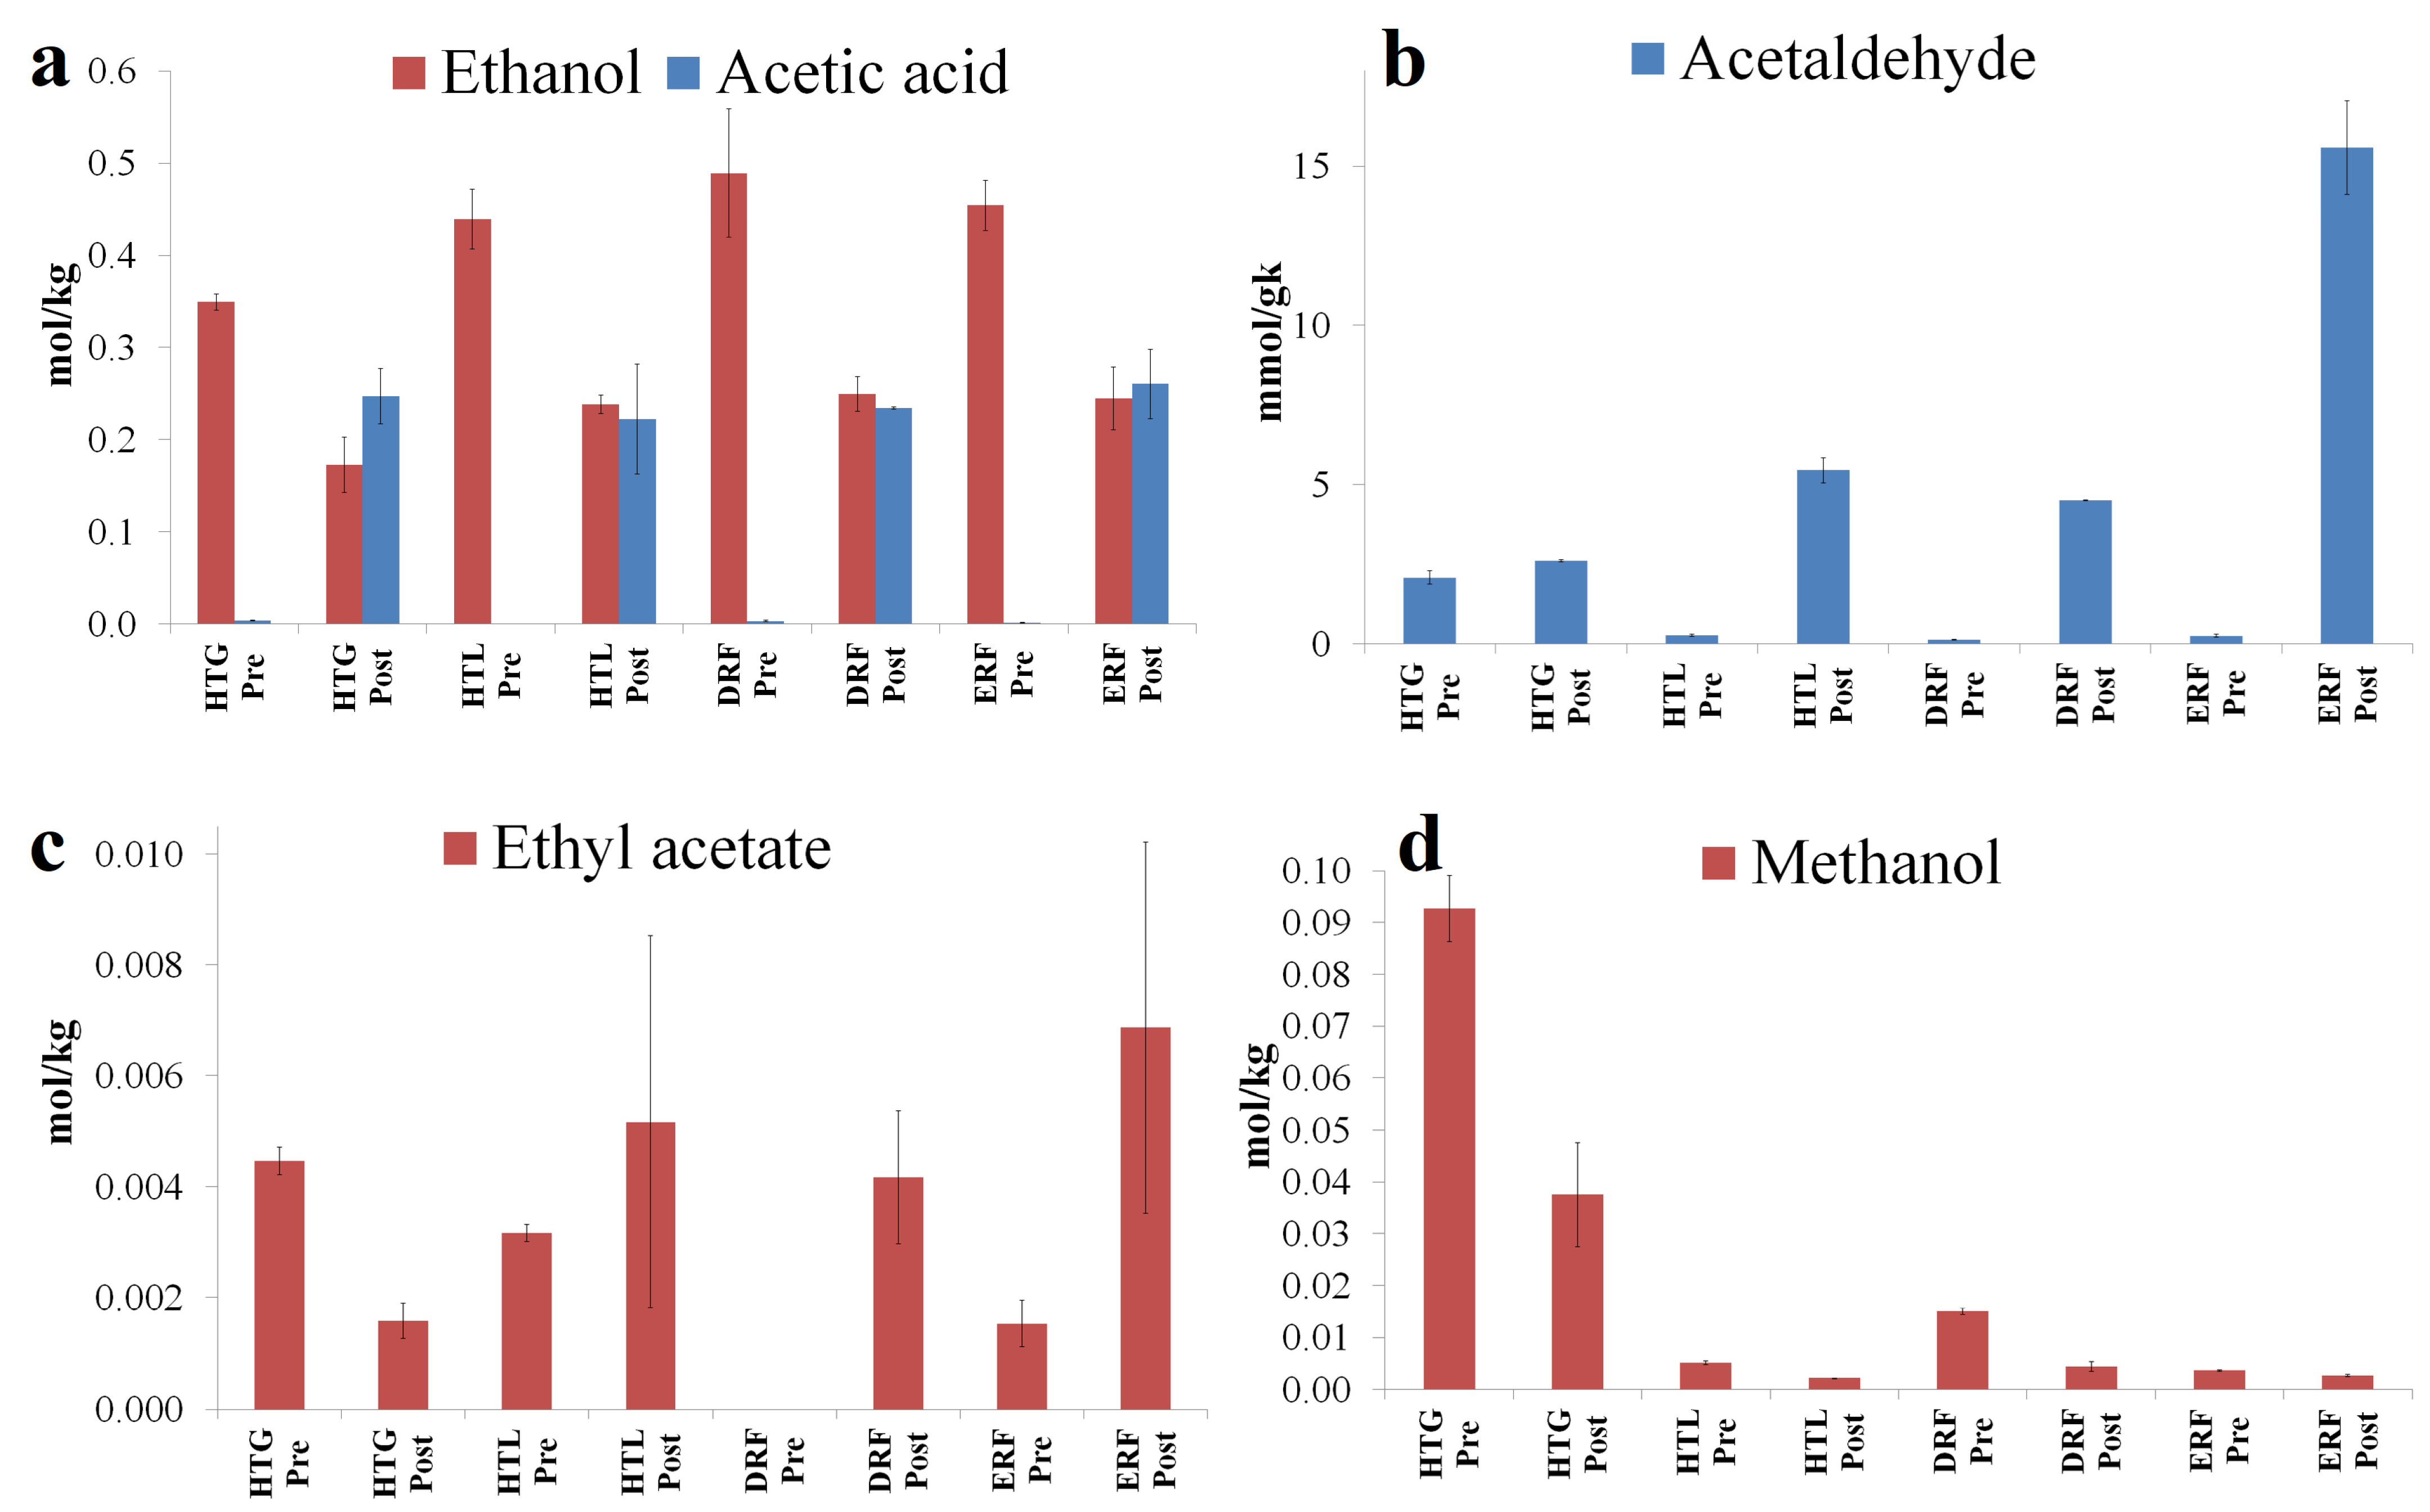
2.5. Determination of the Reaction Products in Steady-Voltage Experiments

A different experiment was conducted utilizing the diluted fractions at the same concentrations as those employed in the previous test. A consistent electric potential at 50 mV, 100 mV, 150 mV, or 200 mV was applied, resulting in varying resistance and initiating the reaction upon complete cable connection. Subsequently, the current intensity (mA) and apparent power (mW) were recorded using Pragma Industries Software OSC34-25 (Biarritz, France). The initial set of experiments concluded after 2 h, whereas the subsequent set ceased when the current intensity halved, irrespective of the total experiment duration. The final net weight of the residual sample was measured in all instances. Each test was replicated four times.

2.6. GC-MS Determination of the Diluted Distillery Fractions

All the fractions were analyzed through a gas chromatograph (6890 series, Hewlett-Packard, Waldbronn, Germany), equipped with a 30 m capillary column Stabilwax-DA (Restek, Milan, Italy) with 0.25 mm i.d. and 0.25 µm f.t. The injection was performed in the split mode (20:1) at 240 °C. The oven temperature was set to 45 °C, increased at 4.25 °C/min up to 66 °C, then held for 1.00 min, and, finally, increased at 8.00 °C/min up to 120 °C, where it was held for 5.00 min (17.69 total min of analysis). The temperature of the transfer line was set to 240 °C. The data were obtained in the full-scan mode and the mass-to-charge ratio (m/z) was recorded as between 30 and 350 at 70 eV.
Peaks were identified by (i) retention times and mass spectra of standard substances (the main ions—m/z—monitored for each substance were added to Table 1); (ii) consistency of their retention times with the nature of the substance; and (iii) comparison of the mass spectra obtained with those found in the NIST and Wiley libraries for GC/MS.
Quantification was performed using two internal standards: 3-methyl-1-pentanol (20 µL at 10,000 ppm) for all the volatile congeners, except for acetic acid, which was quantified with propionic acid (20 µL at 100,000 ppm). Calculations of the fraction performances in the FC were carried out on molal basis. Each value is represented in the figures as an average with its specific error bar.

3. Results and Discussion

3.1. Chemical Characterization of the Distillery Fractions

All the fractions had a high alcohol content (54–75 g/100 g), while the methanol concentration was in a range between 4000 and 105,000 mg/kg (Table 1). The highest concentration of methanol was found in HTG due to its considerable release caused by the pectinase activity on the pomace pectin, while DRF showed methanol concentrations of one order of magnitude lower, and even lower for the remaining samples.

3.2. Electrochemical Measurements of Diluted Distillation Fractions

Electrochemical measurements of each 3%-w/w-diluted distillation fraction were carried out. In our experiment, we employed a fuel cell originally designed for methanol to examine a solution containing an ethanol fraction. It is essential to acknowledge that this adaptation could affect the cell’s performance. The electro-oxidation of ethanol is notably more intricate than that of methanol, primarily due to differences in reaction kinetics and catalyst-poisoning phenomena between the two fuel molecules. The complexity of ethanol electro-oxidation poses challenges that can significantly impact cell performance. Moving forward, it is crucial to emphasize our ongoing efforts to gain deeper insights into the intricacies of ethanol electro-oxidation and the mechanisms governing ethanol solution oxidation in fuel cell environments. Through additional measurements and targeted experimentation, our aim was to optimize and advance fuel cell technologies to new levels of efficiency and effectiveness.
Figure 3a illustrates the power values plotted against voltage for both MeOH and EtOH solutions, while Figure 3b shows those of all four investigated diluted distillation fractions. Figure 3c,d report the current vs. voltage for alcoholic MeOH and EtOH solutions and for all the four diluted distillation fractions.
All the samples were capable of releasing a measurable energy quantity: the apparent power expressed as mW showed similar behavior across all solutions with known concentrations and diluted fractions (Figure 3a,b). However, preventive trials with a lab mixture of MeOH and EtOH (Table 2 and Table 3) showed that even a small amount of ethanol added to the solution was able to significantly lower the result. An EtOH content of 3% (case B Table 2 and Table 3) caused a decrease in power obtained, which was, on average, 70.3% lower. Higher EtOH concentrations were less disrupting (Figure 3a,c). It was not possible to note the same decrease when considering compositions B and F (Table 2 and Table 3), or any other solution, as extremes. In general, the curves of apparent powers and current intensity obtained with the diluted distillation fractions were similar, if not higher than those obtained with the model mixtures of methanol and ethanol.
The results in Figure 3a,b suggest that MeOH and EtOH solutions and the four diluted fractions show the maximum values of mW in correspondence to 0.25–0.30 Volts and a decreased to zero at 0.65 Volts. The only sample that shows values considerably higher in comparison with all the other samples is the 3.1% methanol solution. This provides confirmation of the effectiveness of each distillation fraction as a fuel for DMFC, and, at the same time, shows that this kind of fuel cell is suitable for use in work with an alcohol fraction that has a prevalence of ethanol, as well.
The intensity of the electric current showed a progressive decrease during the redox reaction inside the DMFC in all the samples (Figure 3c,d) [25,26,27]. However, some differences could be observed. Indeed, if the 3% methanol solution showed by far the highest initial value, there was not a linear decrease when increasing ethanol concentrations of the model solutions. This was probably due to the competitive effect of the alcohols on the electrocatalysts. A less marked difference could be observed in the fractions where the competition phenomenon was certainly higher. DRF showed the highest electric current intensity initial value, probably due to a lesser competitive effect on the membrane given the lower total content of the single solutes, aside from ethanol and methanol.
As a matter of fact, ethanol, and very likely other volatile congeners, have been shown to decrease the energy yield, as already documented in the literature [28]. Initially, this result may appear discouraging when compared to the outcomes of a pure methanol supply (see Table 2 and Table 3). However, these mixed compounds, typically considered waste by distilleries, hold significant potential for profit if utilized directly at their production site, eliminating transportation costs and minimizing storage expenses. Furthermore, there is the opportunity for further purification of methanol for fuel cell applications by diluting the mixture with water to separate soluble alcohol from other volatile congeners.
The fractionation of the diluted alcoholic mixture could be relatively straightforward. For each distillation fraction, electrochemical measurements were performed for the determination of the electric current intensity and the apparent power at different voltages (Table 4). HT G, HT L, DW, and EW showed a gradual decrease in the intensity of the electric current and power during the application of the different voltages, which was due to the gradual development of the redox reaction inside the fuel cell.
The obtained results highlight the potential for harnessing diluted distillation by-products to generate electrical energy through direct methanol fuel cells. The distinctive substances found in distillation by-products, apart from methanol, exhibited varying degrees of electric current (and electric power) generation. Among these compounds, samples of 3-methyl butanol and isopropanol produced the highest power outputs at equivalent voltages. These two branched higher alcohols are present in concentrations in the order of hundreds of mg/L, even in wines. Consequently, wines destined for disposal could emerge as intriguing raw materials for direct methanol fuel cell energy production, as the potential of these higher alcohols could complement that of ethanol.
The power generated from n-butanol, a linear higher alcohol, was only slightly lower than that of the branched alcohols. Conversely, an ester, ethyl acetate, exhibited lesser efficacy.
Surprisingly, acetic acid, despite its heterogeneous chemical nature compared to alcohols and its presumed role as a product of ethanol oxidation under the same experiment, demonstrated remarkable performance. As highlighted for the branched higher alcohols, acetic acid also constitutes compositional percentages exceeding 5% in vinegars. Thus, vinegars destined for disposal due to irreparable defects could warrant further investigation. The behavior of methanol warrants separate description as it exhibited a lower performance than expected and compared to other substances. A definitive judgment remains challenging, prompting a reevaluation of the materials used while awaiting confirmation.
To sum up, these preliminary results suggest that the utilization of alcoholic solutions derived from distillation residues in direct methanol fuel cell technology for electricity generation could present an alternative, sustainable, and environmentally friendly energy source. However, further investigation is imperative regarding this technology, including the qualitative and quantitative analysis of redox reaction compounds occurring within the cells. This comprehensive analysis is crucial for obtaining a more complete understanding of the behaviors of diverse substances and for estimating their potential applications based on recovery yields.

3.3. GC-MS Evaluation of the Diluted Distillery Fractions

The oxidation mechanisms of methanol and ethanol are quite different. Moreover, in diluted distillation fractions, electro-oxidation also involves other minor alcohols, thus bringing about the formation of other reaction products. This also entails different performances of the single alcohols and energy yields.
As for electro-oxidation, the mole balance between main alcohols and their intermediates and reaction products showed interesting results. In an FC equipped with a binary metal catalyst such as Pt-Rh/C, ethanol oxidation is characterized by various pathways and reaction intermediates [23,29,30].
In all samples, there was a strong increase in the concentration of acetic acid at the end of each experiment (Figure 4a) due to the partial oxidation of ethanol [28,31,32], which occurred on the Pt surface via the acetyl intermediate, a partially oxidized acetaldehyde (CH3CO) [30,33]. This acetyl intermediate reacted to give acetic acid with the hydroxyl group formed on the Rh surface from the cleavage of water. The same acetyl intermediate can also be subjected to a C–C cleavage to form carbon dioxide and, to a lesser extent, also methane [34].
In the samples obtained after the FC experiments, the increase in acetaldehyde was evident, as well (Figure 4b), even though its millimolal concentrations could not be compared with any of the reagents since it is a labile intermediate.
Ethyl acetate concentrations increased during electro-oxidation in the DMFC, except in HTG, where a reduction was observed (Figure 4c). The formation of ethyl acetate also derives from the acetyl intermediate through the reaction with ethanol (that has lost an H) [17,35] (Chauhan and Srivastava, 2019). The esterification is favored by the acidic environment and by proton transfer flows.
Methanol (Figure 4d) is adsorbed as well on the surface of the electrocatalyst to be partially oxidized to formaldehyde, from which formic acid is then formed. Although the reaction scheme is very similar to that described for ethanol electro-oxidation, there are two elements to consider. Firstly, complete oxidation of methanol to carbon dioxide is very efficient, and, secondly, formic acid is an unstable compound, which can easily give rise to the formation of carbon dioxide, as well. For this reason, neither formic acid nor other methanol reaction intermediates were detected in GC-MS. However, methanol did not disappear at the end of the experiments (Figure 4d) due to a certain competitive effect on the FC electrocatalysts. It is interesting to note a significant linear correlation (r = −0.65; p ≤ 0.05) between the difference in molal concentrations of methanol before and after the experiment and the time lapsed to halve the current intensity.
The correct amount of the carbon dioxide formed was not calculated since the weight loss during the experiments took into account the total amount of compounds that were lost. However, with a good approximation, the weight loss can be expressed as the amount of carbon dioxide produced. A significant linear correlation (r = −0.84; p ≤ 0.01) was verified between the carbon dioxide molal concentration and the time lapsed to halve the current intensity. In general, carbon dioxide formation in methanol electro-oxidation occurs faster than ethanol cleavage [30]. Indeed, as the carbon chain increases, the reactivity of the alcohols towards electro-oxidation decreases [36].
Among the other higher alcohols, 2-butanol showed quite high amounts and noteworthy behavior. Indeed, its concentration decreased in all the samples after the FC experiments due to partial oxidation to its corresponding ketone, 2-butanone (Figure 5a) [37]. 2-butanone was already found in marc spirits, such as grappa, in significantly lower concentrations than its precursor 2-butanol [38]. Furthermore, the formation of 2-butanone can also be due to the presence of acetoin [39] through radical electro-hydrogenolysis [40]. However, acetoin was only found in HTG (around 1 mmol/kg before the fuel cell experiment) and its concentration decreased to zero in HTG after the fuel cell experiment.
In the DMFC, the electro-oxidation also involved other alcohols, such as propanol, isobutyl alcohol, butanol, and isoamyl alcohol. Although propanol showed a clear reduction at the end of the experiment (Figure 5b), it was not possible to quantify the trend of the corresponding propionic acid because the latter was used as an internal standard. The concentration of butanol decreased in the samples after fuel cell experiments with a parallel increase in butyric acid (Figure 6a). The mechanism of this reaction proceeds through the adsorption of the compound on the electrocatalyst surface with the formation of carbon dioxide and butyric acid. Butyric acid is rather unstable and can be subjected to decarboxylation with the release of carbon dioxide [30,32].
The concentrations of isobutyl and isoamyl alcohols decreased in the samples after FC tests (Figure 6b,c) due to the electro-oxidation reactions on these alcohols, which bring about the formation of isobutyric and isovaleric acids, respectively [41]. To sum up, the total amount of these short-chain fatty acids increased as a result of the complex electro-oxidation reactions that occurred in the DMFC (Figure 6d).

4. Conclusions

This pioneering investigation into utilizing distillery fractions to power methanol fuel cells underscores the advantages of integrating environmentally friendly energy solutions with the sustainable utilization of by-products. Methanol and ethanol, sourced from the distillation of enological by-products, present promising fuel options for fuel cells, thereby contributing to the circular economy. Moreover, GC-MS analysis identified acetic acid, short-chain fatty acids, ketones, and aldehydes as by-products, hinting at the potential for recovering valuable compounds, even at low concentrations. The scalability of such applications may render this opportunity highly appealing. This linkage between sustainable energy and valuable by-products suggests synergies between clean energy technologies and the advancement of sustainable materials. In summary, this study propels the advancement of eco-friendly energy solutions by effectively utilizing distillery fractions, thus underscoring the interdependence of sustainable energy generation and the creation of valuable by-products. The research emphasizes the significance of holistic approaches that align with environmental stewardship and circular economy principles.

Author Contributions

Conceptualization, G.M., A.A., M.R. and M.C.; data curation, U.C., G.M. and M.C.; writing—original draft preparation, G.M. and M.C.; review and editing, M.C., G.M. and U.C. All authors have read and agreed to the published version of the manuscript.

Funding

This research received no external funding.

Data Availability Statement

Data are contained within the article.

Acknowledgments

The authors wish to thank the CAVIRO Group for supplying the samples. In addition, we would like to acknowledge Sara Ronconi as the English-language reviewer, along with Riccardo Adinolfi Borea, Giulia Veneri, and Niccolò Piccinini. This work was supported by the Emilia-Romagna Region, Italy [grant number CUP E99D16007700007 Bando Alte Competenze, “Training of skills for the management and enhancement of some by-products from the distillation of oenological waste” (Ref. PA: 2016-8349/RER), PO FSE 2014-2020 “Safety, Quality and Integration of regional agri-food chains to increase their competitiveness”].

Conflicts of Interest

The authors declare no conflicts of interest.

Abbreviations

DEFCdirect ethanol fuel cell
DMFCdirect methanol fuel cell
DRFdemethylation column reflux fraction
ERFepuration column recycling fraction
FCfuel cell
HTGdistillation heads and tails deriving from grape pomace
HTLdistillation heads and tails deriving from lees
m/zMass-to-charge ratio
PEMpolymer–electrolyte membrane
rcoefficient of correlation
Vvoltage

References

  1. Bahrami, H.; Faghri, A. Review and advances of direct methanol fuel cells: Part II: Modeling and numerical simulation. J. Power Sources 2013, 230, 303–320. [Google Scholar] [CrossRef]
  2. Ince, A.C.; Karaoglan, M.U.; Glüsen, A.; Colpan, C.O.; Müller, M.; Stolten, D. Semiempirical thermodynamic modeling of a direct methanol fuel cell system. Int. J. Energy Res. 2019, 43, 3601–3615. [Google Scholar] [CrossRef]
  3. Li, X.; Faghri, A. Review and advances of direct methanol fuel cells (DMFCs) part I: Design, fabrication, and testing with high concentration methanol solutions. J. Power Sources 2013, 226, 223–240. [Google Scholar] [CrossRef]
  4. Shrivastava, N.K.; Thombre, S.B.; Chadge, R.B. Liquid feed passive direct methanol fuel cell: Challenges and recent advances. Ionics 2016, 22, 1–23. [Google Scholar] [CrossRef]
  5. Radenahmad, N.; Afif, A.; Petra, P.I.; Rahman, S.M.; Eriksson, S.-G.; Azad, A.K. Proton-conducting electrolytes for direct methanol and direct urea fuel cells—A state-of-the-art review. Renew. Sustain. Energy Rev. 2016, 57, 1347–1358. [Google Scholar] [CrossRef]
  6. Oumer, A.; Hasan, M.; Baheta, A.T.; Mamat, R.; Abdullah, A. Bio-based liquid fuels as a source of renewable energy: A review. Renew. Sustain. Energy Rev. 2018, 88, 82–98. [Google Scholar] [CrossRef]
  7. Sánchez Ballester, S.C. Synthesis and Characterization of New Polymer Electrolytes to Use in Fuel Cells Fed with Bio-Alcohols; Universitat Politècnica de València: Valencia, Spain, 2017. [Google Scholar]
  8. Revankar, S.T.; Majumdar, P. Fuel Cells: Principles, Design, and Analysis; CRC Press: Boca Raton, FL, USA, 2016. [Google Scholar]
  9. Araya, S.S.; Liso, V.; Cui, X.; Li, N.; Zhu, J.; Sahlin, S.L.; Jensen, S.H.; Nielsen, M.P.; Kær, S.K. A Review of The Methanol Economy: The Fuel Cell Route. Energies 2020, 13, 596. [Google Scholar] [CrossRef]
  10. Hodson, G.; Wilkes, E.; Azevedo, S.; Battaglene, T. Methanol in wine. BIO Web Conf. 2017, 9, 02028. [Google Scholar] [CrossRef]
  11. Shamsul, N.S.; Kamarudin, S.K.; Rahman, N.A.; Kofli, N.T. An overview on the production of bio-methanol as potential renewable energy. Renew. Sustain. Energy Rev. 2014, 33, 578–588. [Google Scholar] [CrossRef]
  12. Roode-Gutzmer, Q.I.; Kaiser, D.; Bertau, M. Renewable Methanol Synthesis. ChemBioEng Rev. 2019, 6, 209–236. [Google Scholar] [CrossRef]
  13. Dias, M.O.; Modesto, M.; Ensinas, A.V.; Nebra, S.A.; Filho, R.M.; Rossell, C.E. Improving bioethanol production from sugarcane: Evaluation of distillation, thermal integration and cogeneration systems. Energy 2011, 36, 3691–3703. [Google Scholar] [CrossRef]
  14. Gupta, C.; Prakash, D.; Gupta, S. A Biotechnological Approach to Microbial Based Perfumes and Flavours. J. Microbiol. Exp. 2015, 2, 11–18. [Google Scholar] [CrossRef]
  15. Ottone, C.; Romero, O.; Aburto, C.; Illanes, A.; Wilson, L. Biocatalysis in the winemaking industry: Challenges and opportunities for immobilized enzymes. Compr. Rev. Food Sci. Food Saf. 2020, 19, 595–621. [Google Scholar] [CrossRef] [PubMed]
  16. Pu, H. Polymers for PEM Fuel Cells; Wiley: Hoboken, NJ, USA, 2014. [Google Scholar] [CrossRef]
  17. Carvallo, J.; Labbe, M.; Pérez-Correa, J.; Zaror, C.; Wisniak, J. Modelling methanol recovery in wine distillation stills with packing columns. Food Control 2011, 22, 1322–1332. [Google Scholar] [CrossRef]
  18. Junqueira, T.L.; Dias, M.O.S.; Filho, R.M.; Wolf-Maciel, M.R.; Rossell, C.E.V.; Atala, D.I.P. Proposition of alternative configurations of the distillation columns for bioethanol production using vacuum extractive fermentation process. Chem. Eng. Trans. 2009, 17, 1627–1632. [Google Scholar] [CrossRef]
  19. Batista, F.R.; Follegatti-Romero, L.A.; Meirelles, A.J. A new distillation plant for neutral alcohol production. Sep. Purif. Technol. 2013, 118, 784–793. [Google Scholar] [CrossRef]
  20. Bastidas, P.; Parra, J.; Gil, I.; Rodríguez, G. Alcohol Distillation Plant Simulation: Thermal and Hydraulic Studies. Procedia Eng. 2012, 42, 80–89. [Google Scholar] [CrossRef]
  21. Aylott, R.I. Flavoured spirits. In Fermented Beverage Production; Springer: New York, NY, USA, 1995. [Google Scholar] [CrossRef]
  22. Wiley, H.W. Industrial Alcohol: Uses and Statistics; US Department of Agriculture: Washington, DC, USA, 1906.
  23. Khandelwal, M.; van Dril, T. Decarbonisation Options for the Dutch Biofuels Industry; PBL Planbureau voor de Leefomgeving: Hague, The Netherlands, 2020; Available online: https://www.pbl.nl/sites/default/files/downloads/pbl-2020-decarbonisation-options-for-the-dutch-biofuels-industry_3887.pdf (accessed on 17 March 2024).
  24. Montevecchi, G.; Cancelli, U.; Masino, F.; Antonelli, A. Composition and applications of fractions discharged from a distillation plant for neutral ethanol production. Chem. Eng. Res. Des. 2021, 171, 80–85. [Google Scholar] [CrossRef]
  25. Wongyao, N.; Therdthianwong, A.; Therdthianwong, S. The fading behavior of direct methanol fuel cells under a start-run-stop operation. Fuel 2010, 89, 971–977. [Google Scholar] [CrossRef]
  26. Mazzapioda, L.; Lo Vecchio, C.; Aricò, A.S.; Navarra, M.A.; Baglio, V. Performance Improvement in Direct Methanol Fuel Cells by Using CaTiO3-δ Additive at the Cathode. Catalysts 2019, 9, 1017. [Google Scholar] [CrossRef]
  27. Bhuvanendran, N.; Ravichandran, S.; Zhang, W.; Ma, Q.; Xu, Q.; Khotseng, L.; Su, H. Highly efficient methanol oxidation on durable PtxIr/MWCNT catalysts for direct methanol fuel cell applications. Int. J. Hydrogen Energy 2020, 45, 6447–6460. [Google Scholar] [CrossRef]
  28. Leo, T.J.; Raso, M.A.; Navarro, E.; Mora, E. Long Term Performance Study of a Direct Methanol Fuel Cell Fed with Alcohol Blends. Energies 2013, 6, 282–293. [Google Scholar] [CrossRef]
  29. Kim, J.H.; Choi, S.M.; Nam, S.H.; Seo, M.H.; Choi, S.H.; Kim, W.B. Influence of Sn content on PtSn/C catalysts for electrooxidation of C1–C3 alcohols: Synthesis, characterization, and electrocatalytic activity. Appl. Catal. B Environ. 2008, 82, 89–102. [Google Scholar] [CrossRef]
  30. Puthiyapura, V.K.; Lin, W.-F.; Russell, A.E.; Brett, D.J.L.; Hardacre, C. Effect of Mass Transport on the Electrochemical Oxidation of Alcohols Over Electrodeposited Film and Carbon-Supported Pt Electrodes. Top. Catal. 2018, 61, 240–253. [Google Scholar] [CrossRef]
  31. Geng, W.; Zheng, M.; Chen, D.; Wang, X.; Zhang, Z.; Lin, Y.; Cai, D.; Li, H.; Huang, G.; Yu, Y.J.; et al. The Performance of a Novel PdFe/B-N-G Catalys for Ethanol Electro-oxidation in Alkaline Medium. Int. J. Electrochem. Sci. 2020, 15, 2528–2538. [Google Scholar] [CrossRef]
  32. Wnuk, P.; Jurczakowski, R.; Lewera, A. Electrochemical Characterization of Low-Temperature Direct Ethanol Fuel Cells using Direct and Alternate Current Methods. Electrocatalysis 2020, 11, 121–132. [Google Scholar] [CrossRef]
  33. Sánchez-Monreal, J.; García-Salaberri, P.A.; Vera, M. A mathematical model for direct ethanol fuel cells based on detailed ethanol electro-oxidation kinetics. Appl. Energy 2019, 251, 113264. [Google Scholar] [CrossRef]
  34. Choudhary, A.K.; Pramanik, H. Enhancement of ethanol electrooxidation in half cell and single direct ethanol fuel cell (DEFC) using post-treated polyol synthesized Pt-Ru nano electrocatalysts supported on HNO3-functionalized acetylene black carbon. Int. J. Hydrogen Energy 2020, 45, 574–594. [Google Scholar] [CrossRef]
  35. Ong, B.; Kamarudin, S.; Basri, S. Direct liquid fuel cells: A review. Int. J. Hydrogen Energy 2017, 42, 10142–10157. [Google Scholar] [CrossRef]
  36. Li, N.-H.; Sun, S.-G.; Chen, S.-P. Studies on the role of oxidation states of the platinum surface in electrocatalytic oxidation of small primary alcohols. J. Electroanal. Chem. 1997, 430, 57–67. [Google Scholar] [CrossRef]
  37. Puthiyapura, V.K.; Brett, D.J.L.; Russell, A.E.; Lin, W.-F.; Hardacre, C. Biobutanol as Fuel for Direct Alcohol Fuel Cells—Investigation of Sn-Modified Pt Catalyst for Butanol Electro-oxidation. ACS Appl. Mater. Interfaces 2016, 8, 12859–12870. [Google Scholar] [CrossRef] [PubMed]
  38. Masino, F.; Montevecchi, G.; Riponi, C.; Antonelli, A. Composition of some commercial grappas (grape marc spirit): The anomalous presence of 1,1-diethoxy-3-methylbutane: A case study. Eur. Food Res. Technol. 2009, 228, 565–569. [Google Scholar] [CrossRef]
  39. Liu, J.; Solem, C.; Jensen, P.R. Harnessing biocompatible chemistry for developing improved and novel microbial cell factories. Microb. Biotechnol. 2020, 13, 54–66. [Google Scholar] [CrossRef] [PubMed]
  40. Ochoa-Gómez, J.R.; Fernández-Carretero, F.; Río-Pérez, F.; García-Luis, A.; Roncal, T.; García-Suárez, E.J. Electrosynthesis of 2,3-butanediol and methyl ethyl ketone from acetoin in flow cells. Green Chem. 2019, 21, 164–177. [Google Scholar] [CrossRef]
  41. Vaze, A.S.; Sawant, S.B.; Pangarkar, V.G. Electrochemical oxidation of isobutanol to isobutyric acid at nickel oxide electrode: Improvement of the anode stability. J. Appl. Electrochem. 1997, 27, 584–588. [Google Scholar] [CrossRef]
Figure 1. A scheme of the considered industrial distillation plant. A: column of epuration; B: column of distillation; C: column of concentration; D: column of hydroselection; E: column of rectification; F: column of demethylation; G: column of fusel oil recovery [24].
Cleantechnol 06 00027 g001
Figure 2. The equipment employed in the experimental setup comprises a direct methanol fuel cell (DMFC) housing a Nafion membrane as an electrolyte; a data logger capable of establishing a predefined constant voltage; a voltmeter to capture voltage fluctuations; and an ammeter to monitor charges in electric current.
Cleantechnol 06 00027 g002
Figure 3. Electrochemical measurements of the diluted distillation fractions. (a) Power (mW) variation in the fuel cell loaded with solutions of MeOH and EtOH; (b) power (mW) variation in the fuel cell loaded with the four fractions; (c) current (mA) variation in the fuel cell loaded with solutions of MeOH and EtOH; (d) current (mA) variation in the fuel cell loaded with the four fractions. HTG: distillation heads and tails deriving from grape pomace; HTL: distillation heads and tails deriving from lees; DRF: demethylation column reflux fraction; ERF: epuration column recycling fraction.
Cleantechnol 06 00027 g003
Figure 4. Diagrams of the concentrations in mol/kg of the pairing of ethanol and acetic acid (a); and of acetaldehyde (mmol/kg) (b); ethyl acetate (c); and methanol (d) in the diluted distillation fractions before and after the experiment with the DMFC.
Cleantechnol 06 00027 g004
Figure 5. Diagrams of the concentrations in mmol/kg of the pairing of 2-butanol and 2-butanone (a); and of propanol (b) in the diluted distillation fractions before and after the experiment with the DMFC.
Cleantechnol 06 00027 g005
Figure 6. Diagrams of the concentrations in mmol/kg of the pairing of butanol and butyric acid (a); isobutyl alcohol and isobutyric acid (b); isoamyl alcohol and isovaleric acid (c); and total alcohols and total acids (d) in the diluted distillation fractions before and after the experiment with the DMFC.
Cleantechnol 06 00027 g006
Table 1. Concentrations of volatile compounds in the distillation phlegms in mg/kg. Ethanol is expressed in g/100 g.
IUPAC NomenclatureCommon NamesMonitored IonsHTGHTLDRFERF
m/zmg/kgmg/kgmg/kgmg/kg
EthanalAcetaldehyde44, 4353141738
Ethyl acetate 43, 45, 6114,0009333384333
Methanol 31, 32105,333600017,0004000
Butan-2-one2-Butanone43, 72, 57100717832614220
2-Methylpropyl ethanoateIsobutyl acetate42, 56, 7367n.d.n.d.41
Butan-2-ol2-Butanol43, 41, 7417,50320,87210614,088
Propan-1-olPropanol31, 42, 598383812182611
Ethyl 2-methylpropanoateEthyl isobutyrate43, 71, 11667201010
Ethyl pentanoateEthyl valerate57, 88, 101298112n.d.52
2-Methylpropan-1-olIsobutyl alcohol43, 74, 552325n.d.4n.d.
3-Methylbutyl acetateIsoamyl acetate43, 70, 558091n.d.191
Butan-1-olButanol56, 41, 7256237n.d.36
Pentan-1-olPentanol42, 55, 70n.d.n.d.n.d.4
3-Methylbutan-1-olIsoamyl alcohol42, 55, 7032195916730
Ethyl hexanoateEthyl caproate88, 99, 1152883n.d.79
3-Hydroxybutan-2-oneAcetoin45, 43, 88340n.d.n.d.n.d.
Hexyl acetateCapryl acetate43, 56, 84n.d.n.d.n.d.2
Ethyl 2-hydroxypropanoateEthyl lactate45, 75n.d.n.d.n.d.15
Hexan-1-olHexanol56, 69, 84n.d.1230
Ethyl octanoateEthyl caprylate88, 101, 127n.d.42181
Ethanoic acidAcetic acid43, 45, 60200148159
Ethanol (g/100 g) 45, 4654677570
HTG: distillation heads and tails deriving from grape pomace; HTL: distillation heads and tails deriving from lees; DRF: demethylation column reflux fraction; ERF: epuration column recycling fraction. n.d.: not detected.
Table 2. Composition (MeOH and EtOH) and measured current in mA at different voltages.
%EtOH
%MeOH
0%
3.101%
0.894%
2.261%
1.635%
1.564%
2.464%
0.786%
2.784%
0.485%
3.291%
0%
VmA (A)mA (B)mA (C)mA (D)mA (E)mA (F)
0.00134.0871.5547.7351.0061.9849.68
0.05120.5361.9041.6044.2857.3343.48
0.10107.9353.8336.0338.2050.9839.73
0.1595.6346.0330.7532.3545.5534.95
0.2085.8537.6325.7027.0538.7830.15
0.2572.3830.2021.1521.9332.8525.10
0.3059.9322.9316.7317.0527.2020.63
0.3544.5516.8012.6512.7321.6516.20
0.4034.0811.739.108.0317.3012.23
0.4525.036.555.634.9513.688.70
0.5019.282.832.701.9510.285.68
0.5514.650.000.000.006.683.18
0.609.78///3.550.00
0.652.88///0.00/
0.700.00/////
Table 3. Composition (MeOH and EtOH) and calculated mW at different voltages.
%EtOH
%MeOH
0%
3.101%
0.894%
2.261%
1.635%
1.564%
2.464%
0.786%
2.784%
0.485%
3.291%
0%
VmW (A)mW (B)mW (C)mW (D)mW (E)mW (F)
0.000.000.000.000.000.000.00
0.056.033.102.082.212.872.17
0.1010.795.383.603.825.103.97
0.1514.346.904.614.856.835.24
0.2017.177.535.145.417.766.03
0.2518.097.555.295.488.216.28
0.3017.986.885.025.128.166.19
0.3515.595.884.434.457.585.67
0.4013.634.693.643.216.924.89
0.4511.262.952.532.236.153.92
0.509.641.411.350.975.142.84
0.558.060.000.000.003.671.75
0.605.87///2.130.00
0.651.87///0.00/
0.700.00/////
Table 4. Electrochemical measurements of the heads and tails from grape pomace. mA: intensity of electric current; mW: apparent power; HT G: grape pomace heads and tails; DW: demethylation waste; EW: epuration waste; HT L: lees head and tails.
mAmWmAmWmAmWmAmW
HT G HT LDWEW
0 Volts63.2 ± 1.8 60.9 ± 2.0 75.9 ± 3.0 68.8 ± 2.1
0.05 Volts56.6 ± 1.32.8 ± 0.154.3 ± 2.32.7 ± 0.167.7 ± 3.83.4 ± 0.260.5 ± 4.03.0 ± 0.2
0.10 Volts49.2 ± 0.94.9 ± 0.148.5 ± 2.74.9 ± 0.359.2 ± 3.05.9 ± 0.354.3 ± 2.95.4 ± 0.3
0.15 Volts42.8 ± 1.06.4 ± 0.241.5 ± 2.26.2 ± 0.350.6 ± 2.17.6 ± 0.347.7 ± 2.07.1 ± 0.3
0.20 Volts36.1 ± 0.87.2 ± 0.235.7 ± 1.67.1 ± 0.342.2 ± 1.38.4 ± 0.341.4 ± 1.78.3 ± 0.3
0.25 Volts30.7 ± 0.77.7 ± 0.230.4 ± 1.47.6 ± 0.334.1 ± 1.48.5 ± 0.335.3 ± 1.78.8 ± 0.4
0.30 Volts25.7 ± 0.97.7 ± 0.325.2 ± 0.97.6 ± 0.328.0 ± 0.48.4 ± 0.129.5 ± 1.58.9 ± 0.5
0.35 Volts20.8 ± 0.77.3 ± 0.320.6 ± 0.97.2 ± 0.322.2 ± 0.87.8 ± 0.324.0 ± 1.78.4 ± 0.6
0.40 Volts16.7 ± 0.36.7 ± 0.116.3 ± 1.06.5 ± 0.417.2 ± 1.06.9 ± 0.419.2 ± 1.57.7 ± 0.6
0.45 Volts14.1 ± 0.56.4 ± 0.312.4 ± 1.05.6 ± 0.513.3 ± 0.66.0 ± 0.315.0 ± 1.46.7 ± 0.6
0.50 Volts9.7 ± 1.04.8 ± 0.69.1 ± 1.14.5 ± 0.69.8 ± 0.54.9 ± 0.211.2 ± 1.15.6 ± 0.6
0.55 Volts6.4 ± 0.63.5 ± 0.46.0 ± 1.03.3 ± 0.56.6 ± 0.63.6 ± 0.36.9 ± 0.53.8 ± 0.3
0.60 Volts3.3 ± 0.42.0 ± 0.32.9 ± 0.51.7 ± 0.33.2 ± 0.51.9 ± 0.33.0 ± 0.51.8 ± 0.3
0.65 Volts0.00.00.00.00.00.00.00.0
Disclaimer/Publisher’s Note: The statements, opinions and data contained in all publications are solely those of the individual author(s) and contributor(s) and not of MDPI and/or the editor(s). MDPI and/or the editor(s) disclaim responsibility for any injury to people or property resulting from any ideas, methods, instructions or products referred to in the content.

