
Electrothermal Instabilities in Barium-Titanate-Based Ceramics

Institute of Thermal Research, 2 Kanigos Str., P.O. Box 106 77 Athens, Greece
J 2024, 7(2), 153-168; https://doi.org/10.3390/j7020009
Submission received: 7 March 2024
/
Revised: 19 April 2024
/
Accepted: 19 April 2024
/
Published: 26 April 2024
Abstract
:An electrothermal analysis for barium-titanate-based ceramics is presented, combining the Heywang–Jonker model for the electric resistivity with a heat dissipation mechanism based on natural convection and radiation in a one-dimensional model on the device level with voltage as the control parameter. Both positive-temperature-coefficient (PTC) and negative temperature coefficient (NTC) effects are accounted for through the double Schottky barriers at the grain boundaries of the material. The problem formulated in this way admits uniform and non-uniform multiple-steady-state solutions that do not depend on the external circuit. The numerical bifurcation analysis reveals that the PTC effect gives rise to several multiplicites above the Curie point, whereas the NTC effect is responsible for the thermal runaway (temperature blowup). The thermal runaway phenomenon as a potential thermal shock could be among the possible reasons for the observed thermomechanical failures (delamination fracture). The theoretical results for the NTC regime and the thermal runaway are in agreement with the experimental flash sintering results obtained for barium titanate, and 3% and 8% yttria-stabilized zirconia.
1. Introduction
Since the first invention, back in 1955 [1], of the basic materials and processing technologies of positive-temperature-coefficient (PTC) ceramics, the field of interfacially controlled electroceramics is now of paramount technological importance, as well as high scientific interest. Two different categories of materials may be identified: (i) PTC resistors (thermistors) based on barium titanate, and (ii) ZnO varistors. A salient feature for both types is the highly non-linear voltage–current relationship caused by the formation of double Schottky barriers at the grain boundaries which are affected by the local composition of grain boundary regions’ (doping and segregation) oxygen partial pressure and the applied voltage. We will discuss only the former, albeit certain similarities regarding the existence of multiple solutions and the thermal runaway phenomenon will be addressed in the appropriate sections. PTC thermistors are manufactured from silicon, barium, lead, and strontium titanates with the addition of yttrium, manganese, tantalium, and silica. They are extensively used for electric circuit protection, sensing excessive currents, and constant-temperature heating elements, and as current limiting devices, that is, as nondestructible (resettable) fuses. The technical and theoretical aspects may be found in the review papers [2,3]. Although PTCs and, in general, electroceramics are, in principle, loaded electrically as components of electrical and/or electronic circuits, a significant number of mechanical failures is being recorded annually. Although the reasons for the failure are not fully understood, several studies are based on the Joule self-heating effect which causes temperature differences, thermal strains, and excessive thermo–mechanical stresses that may cause the failure of the device [4,5,6,7]. Today, there is an increasing demand for a thorough analysis and understanding of the underlying non-linearly coupled electrothermal phenomena in electroceramic devices, since the current technological trends point towards designs with a reduced size and increasingly higher power densities.
The thermistor as a strongly non-linear coupled electrothermal problem (i.e., the exponential increase of the electric resistivity above the Curie temperature) has attracted significant engineering (theoretical and experimental [5,6,7,8,9,10,11,12,13]), and mathematical (applied and numerical [14,15,16,17,18,19]) attention. The above literature review suggests that the thermistor problem has been studied with various assumptions and/or restrictions. These usually include a constant heat transfer coefficient, an idealization of the PTC effect through a simplified electric conductivity function and, in certain cases, the influence of an external linear electric circuit. The latter admits up to three solutions as determined from the number of the intersection points between the current–voltage characteristic curves of the thermistor and the external circuit [15,16,17].
Yet, a complete analysis of the inherent electrothermal instabilities on the device level, induced by the combined positive and negative temperature coefficient (NTC) behavior, called thereafter the P–NTC effect, is still missing. The aim of the present study is to provide insight and, hopefully, a reasonable explanation to the most common reason of thermistor failure, namely, the delamination fracture due to excessive thermal loading (shock). To this end, the Heywang–Jonker model for the electric resistivity of the device is adopted, which describes both the positive and the negative temperature coefficient regimes. This non-linear and non-monotonic electric resistivity function of the temperature is combined with a non-linear temperature-dependent natural convection and radiation heat dissipation mechanism to form a one-dimensional distributed device model based on voltage control. The problem formulated in this way admits multiple-steady-state solutions that can be either uniform or non-uniform and do not depend on the external circuit. The numerical bifurcation analysis reveals that the PTC effect gives rise to several multiplicites above the Curie point, whereas the NTC effect is responsible for the temperature blowup (thermal runaway) which, unless detected and prevented, will lead to the destruction of the device. This result is further supported from a similar behavior that is encountered in other bistable systems such as superconductors [20] and boiling wires [21].
2. Analysis
2.1. Energy Balance
Following the energy analysis in [13] for the device shown in Figure 1a, the temperature variation T along the longitudinal direction Z is describe by the following partial differential equation:
This is the balance between the heat generated by the Joule effect and the heat dissipated by conduction, radiation, and natural convection. In the equation above, A is the cross-sectional area, is the ambient temperature, C is the volumetric specific heat capacity, is the convective heat transfer coefficient, P is the perimeter, is the surface emissivity, is the Stefan–Boltzmann constant, J is the current density through the device, and E is the electric field intensity. For a constant DC current, the electric field intensity will be proportionally related to the current density through Ohm’s law, although the electric resistivity will be a function of the local temperature [22]. Since, in many practical applications, the controlling parameter is the applied voltage, it is instructive to introduce the electric potential as [23]:
Integrating the above relationship and considering that the current remains constant, albeit still unknown, yields:
where V is the voltage drop across the device, as shown schematically in Figure 1c. Substituting the current density J from Equation (3) into Equation (1), the energy balance for voltage control takes the form:
In contrast to the corresponding current control problem, this is a non-local problem since the solution depends on the resistivity integral over the device. Neumann-type boundary conditions are imposed on the device ends:
implying that heat is dissipated only through the lateral surface of the conductor.
2.2. Heat Transfer Model
For the heat dissipation by natural convection, the correlation of Churchill and Chu [24] for the circumferentially average Nusselt number Nu is adopted:
where is a weak function of the Prandtl number Pr. Equation (6) is valid for a very wide range of Rayleigh numbers, from 10−6 to 109, while it maintains a simple and compact mathematical form, which facilitates the calculation of the partial derivatives during the continuation on the stable and unstable branches of the solution. Equation (6) is applied locally in the evaluation of the convective heat flux along the device axis, in a similar manner as it was applied by Faghri and Sparrow for the calculation of the non-linear external heat flux in a horizontal pipe [25]. Hence, the local Rayleigh number Ra is evaluated from the local temperature difference as:
where is the acceleration due to gravity, is the thermal expansivity, D is the device diameter, α is the thermal diffusivity, and ν is the kinematic viscosity.
2.3. Electric Resistivity: The Heywang–Jonker Model
A salient feature of a ceramic PTC device is the strongly non-linear dependence of its resistivity with respect to temperature. Driven by a transition of the ferroelectric PTC material, the resistance increases several orders of magnitude in a relatively narrow temperature interval (PTC effect). After Heywang’s [26] fundamental research, several authors [26,27,28,29] have explained the PTC effect in terms of a double-Schottky-barrier model. The acceptor states in the grain boundary core region acts as a trap for the majority charge carriers (electrons in the case of donor-doped BaTiO3) which gives rise to a negative net charge of the grain boundary core and adjacent space charge layers in the grains where the majority charge carriers are depleted. Above the ferroelectric–paraelectric phase transition point (Curie temperature), the potential, , in the space charge layer can be obtained from Poisson’s equation:
where is the permittivity of vacuum, is the relative permittivity, and e is the elementary charge, whereas and are the densities of the donor and acceptor states in the bulk region, respectively. The solution of Equation (8) with boundary conditions and yields the depletion zone width
and the potential barrier height of the space charge layers
with being the density of the occupied acceptor states in the boundary layer. The temperature dependence of the relative permittivity is given by the Curie–Weiss law
where K is the Curie–Weiss constant and corresponds to the Curie–Weiss temperature. The density of the occupied acceptor states can be expressed as a function of temperature in terms of Fermi–Dirac statistics:
with being the acceptor state density in the boundary layer and the energy level of the acceptor states relative to the conduction band edge. The energy level corresponds to the Fermi level defined as
with being the density of states of the conduction band, which corresponds to the density of titanium ions in the lattice ( cm−3) [27,29], owing to a small band width of the order of 0.1 eV. In the linear response regime, Jonker showed that the total resistivity is given by [27,30]:
where and denote the grain resistivity and the grain boundary density, respectively. Equation (14) describes the characteristic increase in the resistivity by several orders of magnitude above the ferroelectric–paraelectric transition temperature °C. However, after exceeding °C where the maximum resistivity is encountered, the resistivity is entering the negative temperature coefficient (NTC) regime where its magnitude is rapidly decreasing with increasing temperature. It is exactly this combined non-linear and non-monotonic P–NTC effect that gives rise to multiple steady states and eventually to thermal runaway as it will be shown in the following paragraphs. The validity of Equation (14) well within the NTC regime and up to 900 °C has been experimentally verified [31].
2.4. The Electrothermal Model in Dimensionless Form
The electrothermal model developed in the previous paragraph may be recast in dimensionless form through the below variables’ transformation:
To simplify the convective and radiative terms a convenient choice for the reference temperature is , whereas the magnitude of the maximum resistivity is taken as the reference value, . Introducing the new variables into Equation (4), the temperature distribution along the device takes the form:
In the above equation, the conduction–convection parameter (CCP) is defined as:
where k is the thermal conductivity and L is the device length. The reference heat transfer coefficient is defined through the Nusselt number:
In terms of the dimensionless variables defined above, the local Rayleigh number becomes:
The current density parameter is related to the current density as below
and is the ratio of the radiative heat transfer coefficient to the reference heat transfer coefficient
Under steady-state conditions, the partial differential equation, Equation (16), reduces to a two-point boundary value problem for the device temperature
where , , and
The dimensionless voltage–current relationship (the global constraint) becomes
with boundary conditions
2.5. Stability
The linear stability of a certain steady state , to small perturbations is determined by substituting the below expansions into Equations (16) and (21)
Retaining only linear terms, the current density perturbation reads:
Assuming the below form of the temperature perturbation in terms of the eigenvalue and the eigenfunction
we obtain an integro–differential problem for the eigenvalue
where
and
The corresponding boundary conditions are . Stable solutions are characterized by negative eigenvalues, whereas positive ones correspond to unstable temperature distributions. It is worth pointing out that similar non-local eigenvalue problems appear, for instance, in the theory of the microwave heating of ceramic materials [32].
3. Numerical Methods
An efficient way to solve the second-order integro–differential two-point boundary value problem in Equation (20) is, first, to transform it into a standard form that can be handled by ordinary differential equation (ODE) solvers. Employing the new variables , and , Equation (20) is transformed into a system of first-order equations
which can be integrated by standard solvers, say, from to , since the voltage–current constraint is now an implicit boundary condition in at , i.e.,
4. Results and Discussion
Before we analyze the complete numerical solution, it is instructive to discuss, first, the uniform solutions of Equation (20), which reduces to an algebraic one for a constant temperature profile:
A geometrical (graphical) solution is depicted in Figure 2 where the heat generation and the heat dissipation curves are being plotted. Depending on the magnitude of the applied voltage , up to two solutions of Equation (32) may be obtained from the number of the intersection points shown in Figure 2. The solutions are projected in the plane in Figure 3 with u as a parameter. From the two solutions, the one corresponding to a lower temperature, i.e., is stable (solid line), whereas the other one is unstable (dashed line). The two branches, the stable and the unstable one, are connected through a singular point with a characteristic voltage magnitude. Any applied voltage that exceeds this threshold will lead to an instability, namely, a thermal runaway (temperature blowup). Hence, the curve connecting the singular points forms the instability threshold which depends only on the conduction–convection parameter u since the ambient temperature and the donor and acceptor densities remain fixed. The associated instabilities may also be understood from the voltage–current relationship shown in Figure 4 which resembles an unusual lobe-like curve. Such non-linear and non-monotonic v–j characteristic curves are encountered, for instance, in semiconductors (S-, N-, or Z-shaped) [33], superconductors [34], and organic LEDs [35], leading to interesting and complex bifurcations.
Interestingly, when the conduction term is taken into consideration, a far more complicated solution structure and multiplicity pattern emerges, as shown in Figure 5. There, the base temperature has been selected as the bifurcation parameter and it is plotted against the dimensionless applied voltage v. Compared with Figure 3, both uniform solutions are recovered, and, in addition, several non-uniform solutions appear mostly within the zone . The temperature profiles that correspond to the multiplicity pattern of Figure 5 are shown in Figure 6 for . Our linear stability analysis presented in paragraph II.5 reveals that the spatially periodic profiles (specifically 2 and 4 in Figure 6) are unstable, while profiles 1 and 5, which are antisymmetric with respect to the center of the device, are stable. This is in agreement with the stability analysis results of Elmer [36] for an idealized resistivity–temperature curve consisting of a step function below the transition point and a linearly decreasing segment above the transition point. This means that, in contrast to the uniform case where a single path for the instability existed, now, the path to instability may come from the stable non-uniform solution as indicated by the red arrows in Figure 6. An important conclusion that can drawn from Figure 6 is that the abrupt change in the resistivity (PTC effect) is responsible for the multiplicity below approximately the temperature of maximum resistivity while the NTC effect leads to a thermal runaway since the heat generation rate exceeds the heat that can be dissipated by natural convection and radiation. A similar thermal runaway phenomenon is observed in metallic conductors and high-temperature superconductors as a result of the non-linear relationship between the temperature and the electric resistivity [21,37].
4.1. The Relationship between Temperature and Mechanical Failure
In general, the mechanical failures of electroceramic components are attributed to thermal stresses induced by the temperature gradients developed. Dewitte et al. [5] carried out a thermo–elastic analysis which verified that a temperature difference between the core and surface exists during transient switching processes and the amplitudes of the resulting thermal stresses are sensitive to the applied boundary conditions on the edges of the device. However, the calculated mechanical stresses in a homogeneous PTC component are too low to explain the delamination fracture. As a possible explanation, it has been postulated that excessive stress amplitudes may be a consequence of inhomogeneities in the resistance field within the ceramic material. Supancic [6] extended the resistivity model to include the varistor effect, that is, the resistivity dependence on the electric field intensity, also known as the varistor effect (voltage-dependent resistor). The analysis and the subsequent experimental verification showed that the varistor effect significantly changes the thermo–electrical response of the device since higher temperature gradients are prevailing, which give rise to substantial thermo–mechanical stresses. In any case, with or without the varistor effect, the calculated temperature remains bounded [5,6]. This phenomenon may be explained from a different perspective, as soon as it is recognized that, because of the PTC effect, the problem is a bistable one; that is, it admits multiple solutions (states), one “cold” and one “hot” [13,15]. The latter state is inevitably associated with temperatures of sufficient magnitude either under voltage or under current control. However, the present study shows that, when the whole P–NTC effect is taken into consideration, on one hand, the stable non-uniform steady state may exceed the temperature of maximum resistivity at high voltages as shown in Figure 5. This temperature profile is not symmetric with respect to the center and a significant temperature gradient may develop across the device. On the other hand, an electrothermal instability, which is a consequence of the NTC effect at higher temperatures, may trigger a temperature blowup when the runaway voltage is exceeded, which could be another reason for the thermo–mechanical failures observed in the electroceramic devices.
The preceding multiplicity analysis and the instability leading to thermal runaway is also applicable to metal oxide (i.e., ZnO) varistors. The ZnO-based varistor is a highly non-linear two-terminal polycrystalline device, commonly known as multi-component metal oxide varistors (MOVs) [38,39,40]. Because of their highly symmetric non-linear current–voltage characteristic curve with respect to the polarity of the applied voltage, these MOVs demonstrate an excellent surge-withstanding capability. Similarly to the barium-based ceramics, these electric characteristics can be explained with the formation of potential barriers (Schottky barriers) involving thin insulating layers around the successive ZnO grains [41,42,43]. Because of their special characteristics, varistiors are widely used in the power systems’ protection, for suppressing internally generated spikes in electronic circuits, as surge absorbers, and as surge protectors of electric and electronic circuitry, among others. For the surge arrester application in particular, the energy absorption capability while maintaining thermal stability is of paramount importance. Three failure modes have been identified thus far: (i) electrical puncture, (ii) physical cracking, and (iii) thermal runaway [39,44]. Similar energy balances between heat generation and heat dissipation leading to thermal runaway have been recently reported [38,45,46,47].
4.2. Comparison with Experiments
Above in the NTC regime where the potential barrier assumes an Arrhenius-type temperature dependence, as in Equation (33), the thermistor problem, and, especially, the thermal runaway phenomenon described above, is closely associated with the flash sintering of ceramics as in, for instance, barium and strontium titanates, and 3% and 8% yttria-stabilized zirconia, just to name a few. The key feature of the process is to exercise control when an operating parameter, usually the furnace temperature, exceeds the corresponding limit point, established by the voltage applied to the specimen. Under these conditions, the heat dissipation mechanism can no longer balance the Joule heating and the temperature blows up. To maintain the temperature below a certain threshold, the process controller will switch from voltage to current control [48,49]. Detailed reviews may be found in the papers [50,51,52]. In this case, the electric resistivity is given by a simpler and monotonic Arrhenius relationship:
where is the activation energy, R is the universal gas constant, and the pre-exponential factor. Now, stands for the furnace temperature, which is no longer a constant but rather a parameter. Thus, a different reference temperature has been selected, namely, K. A convenient choice for the reference electric resistivity is:
With the above reference values, the dimensionless electric resistivity yields:
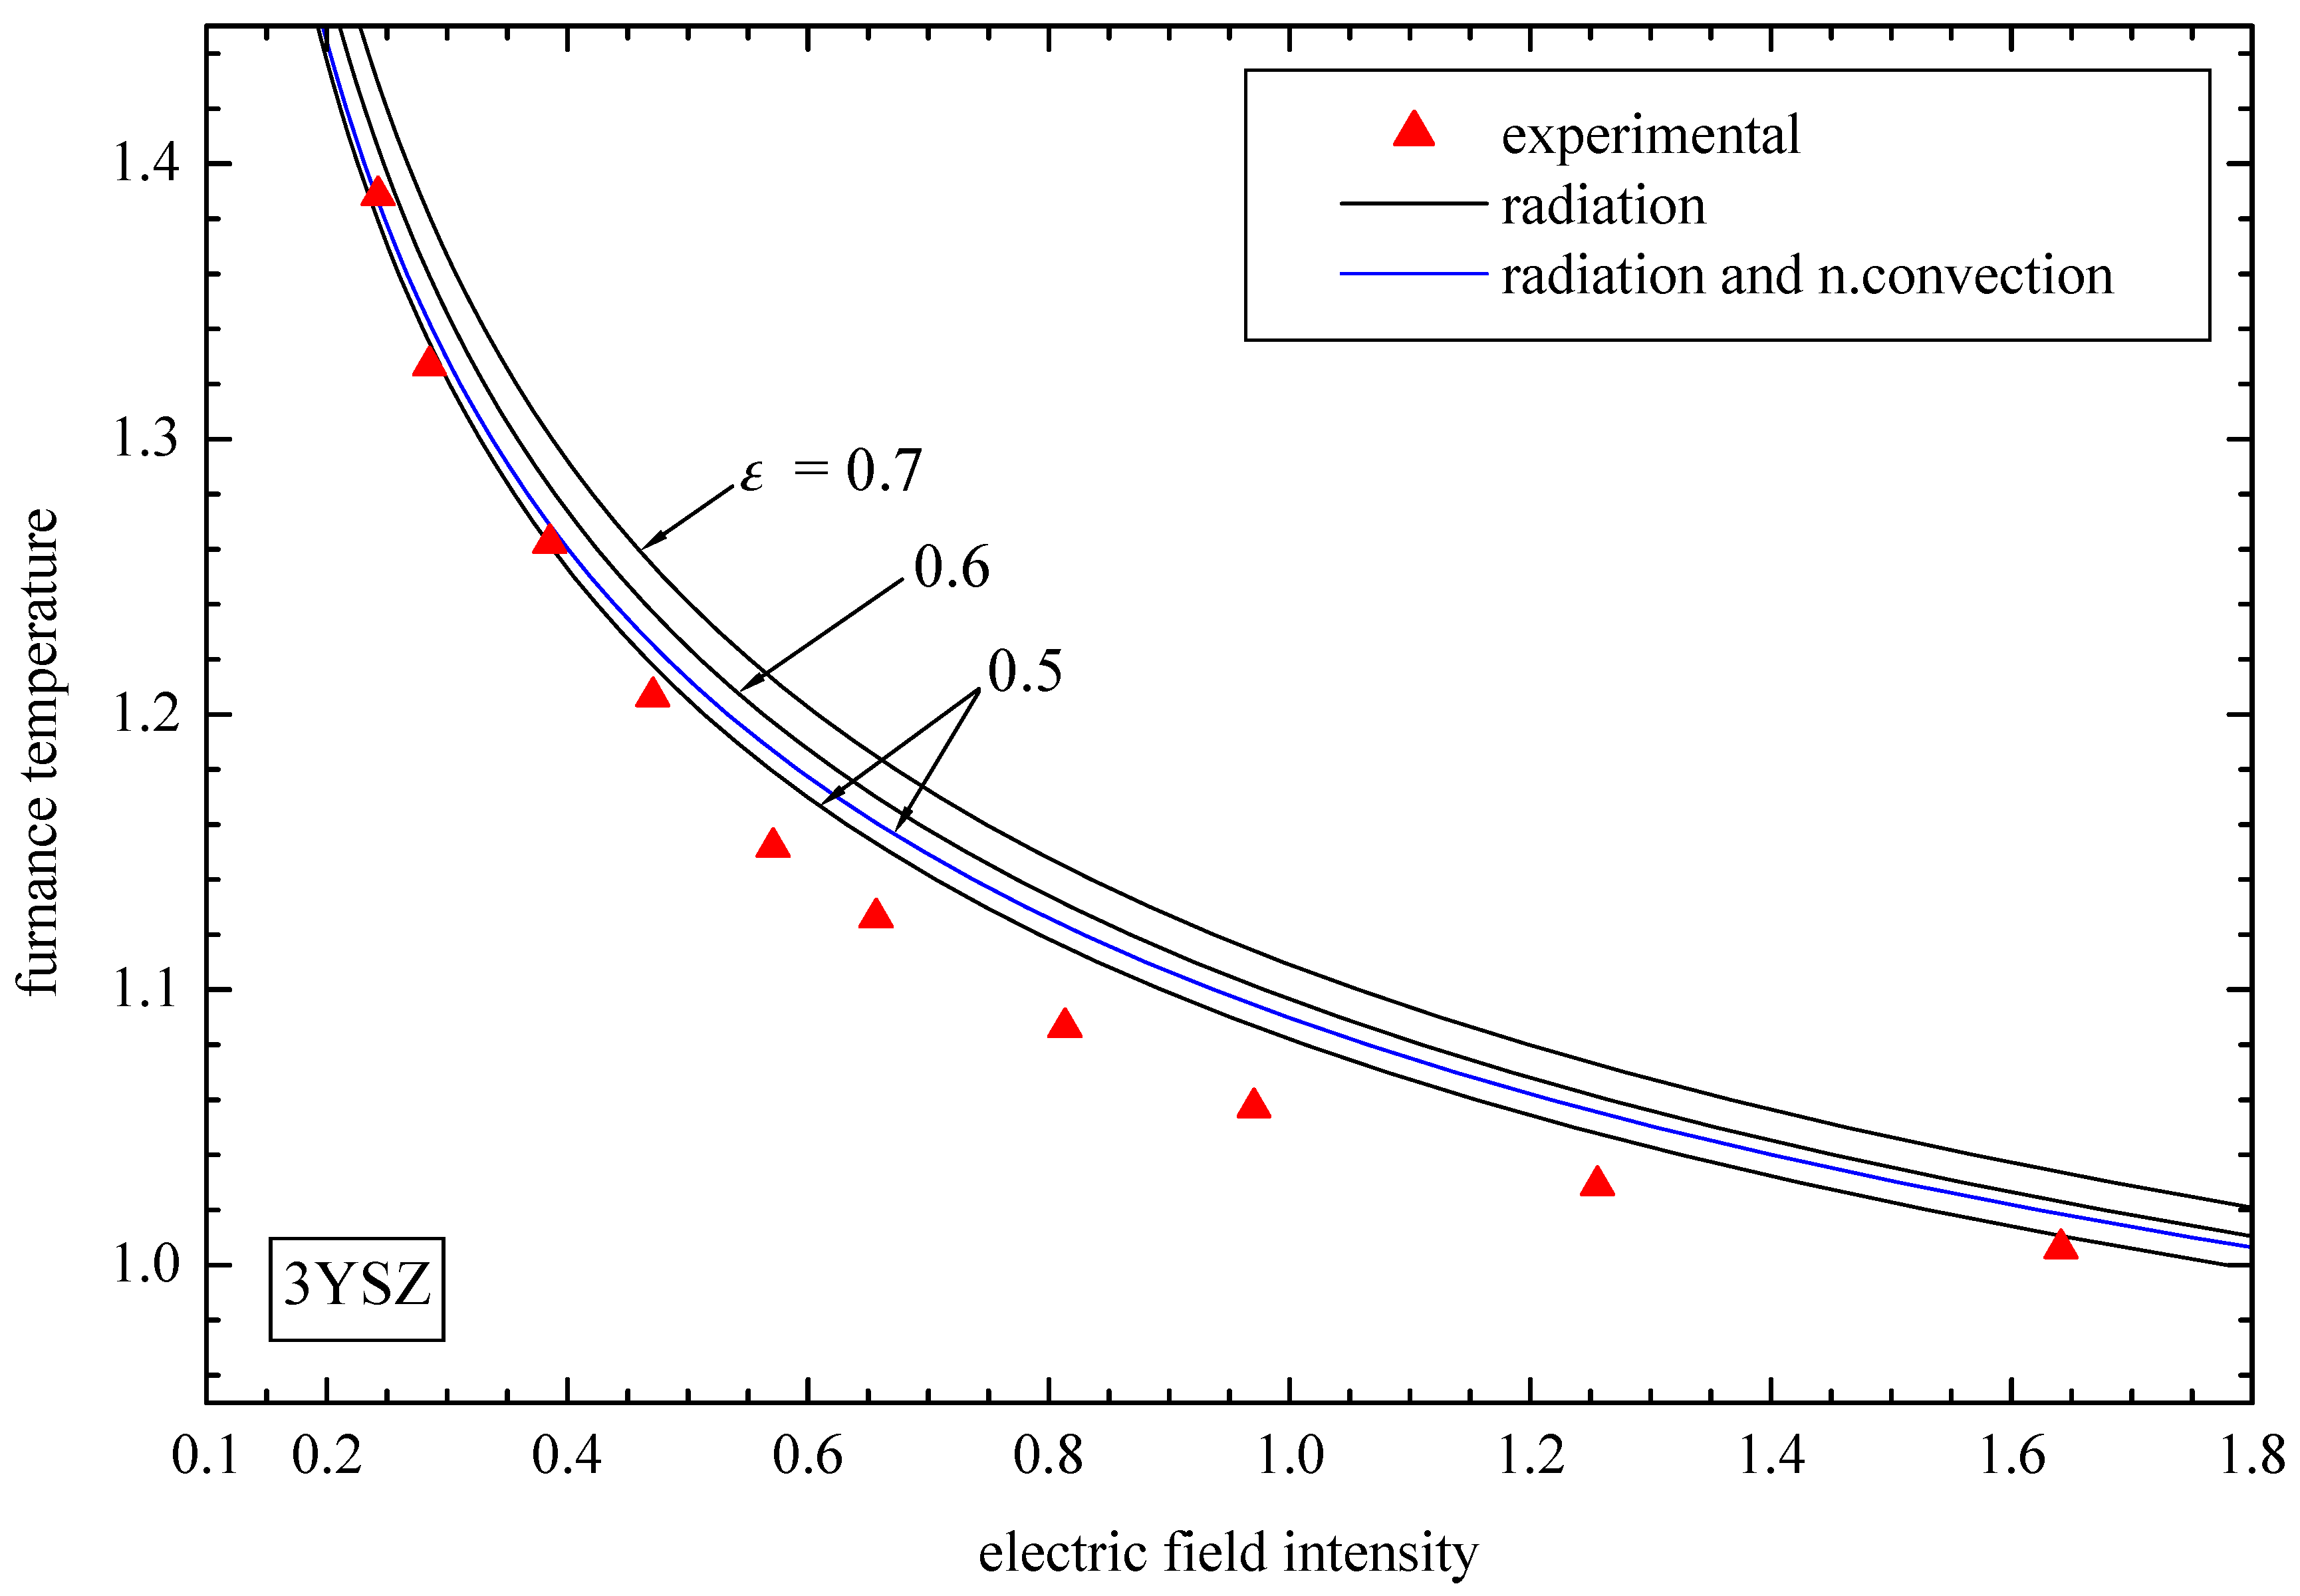
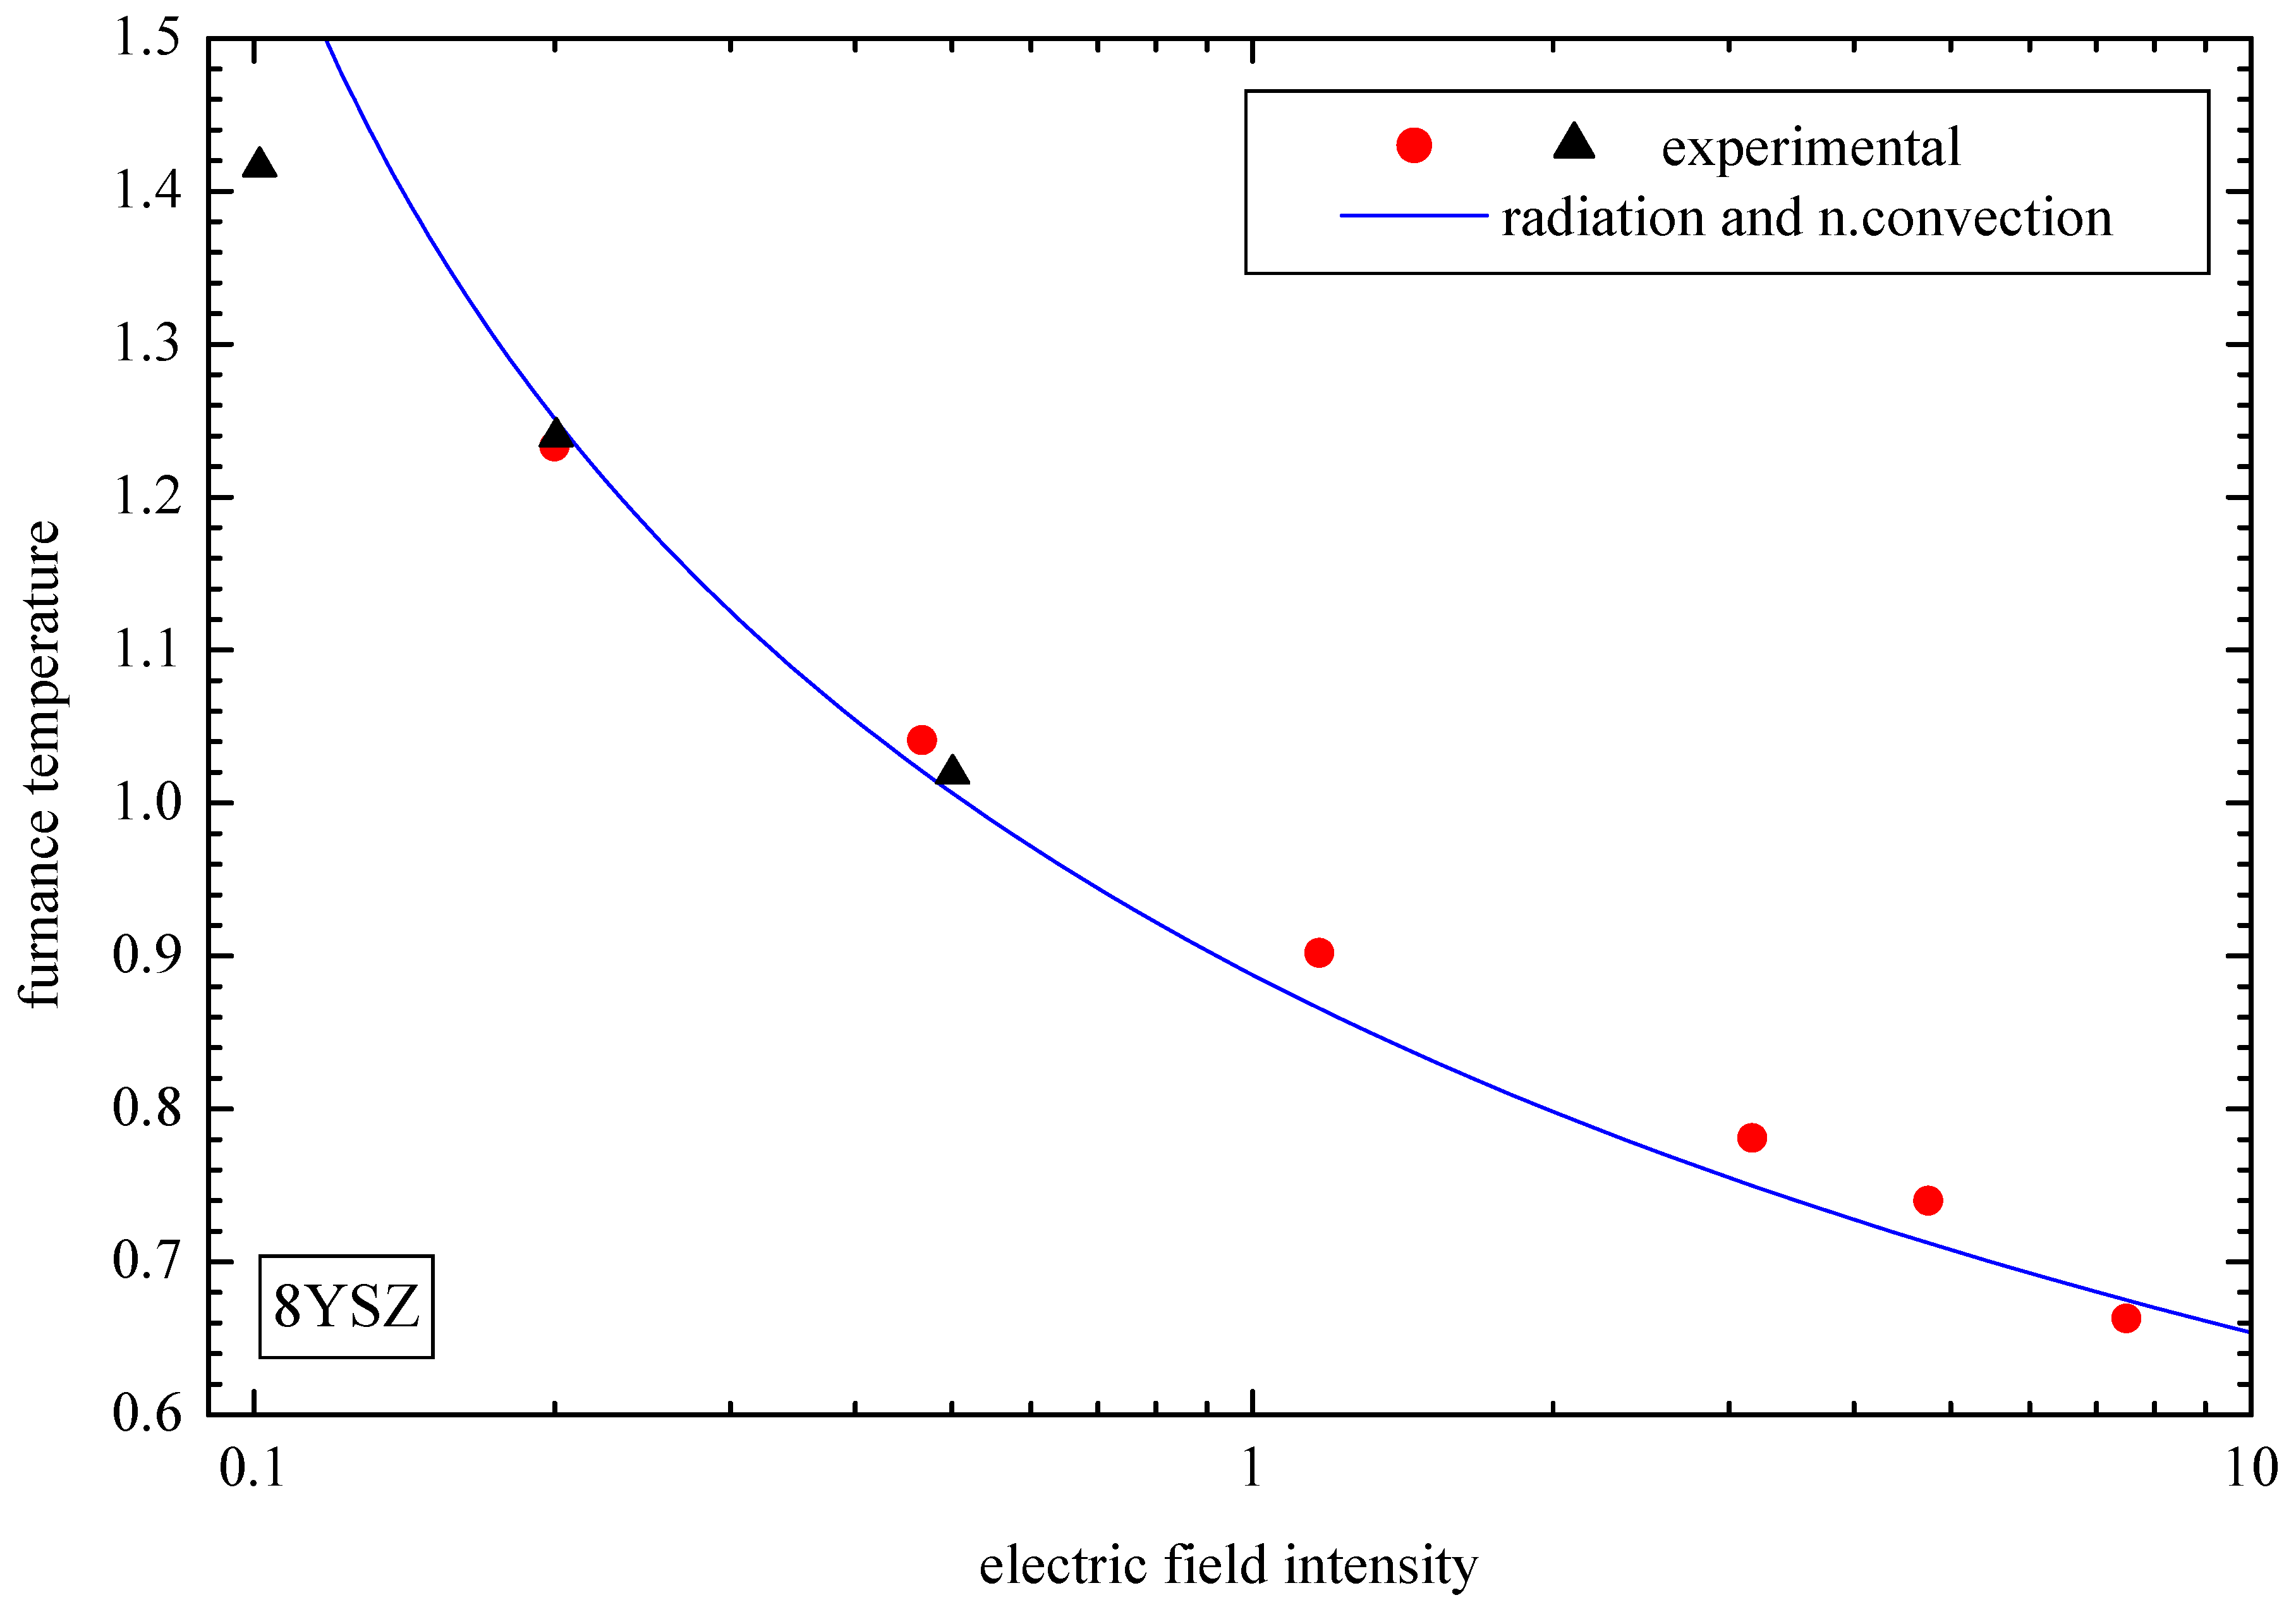
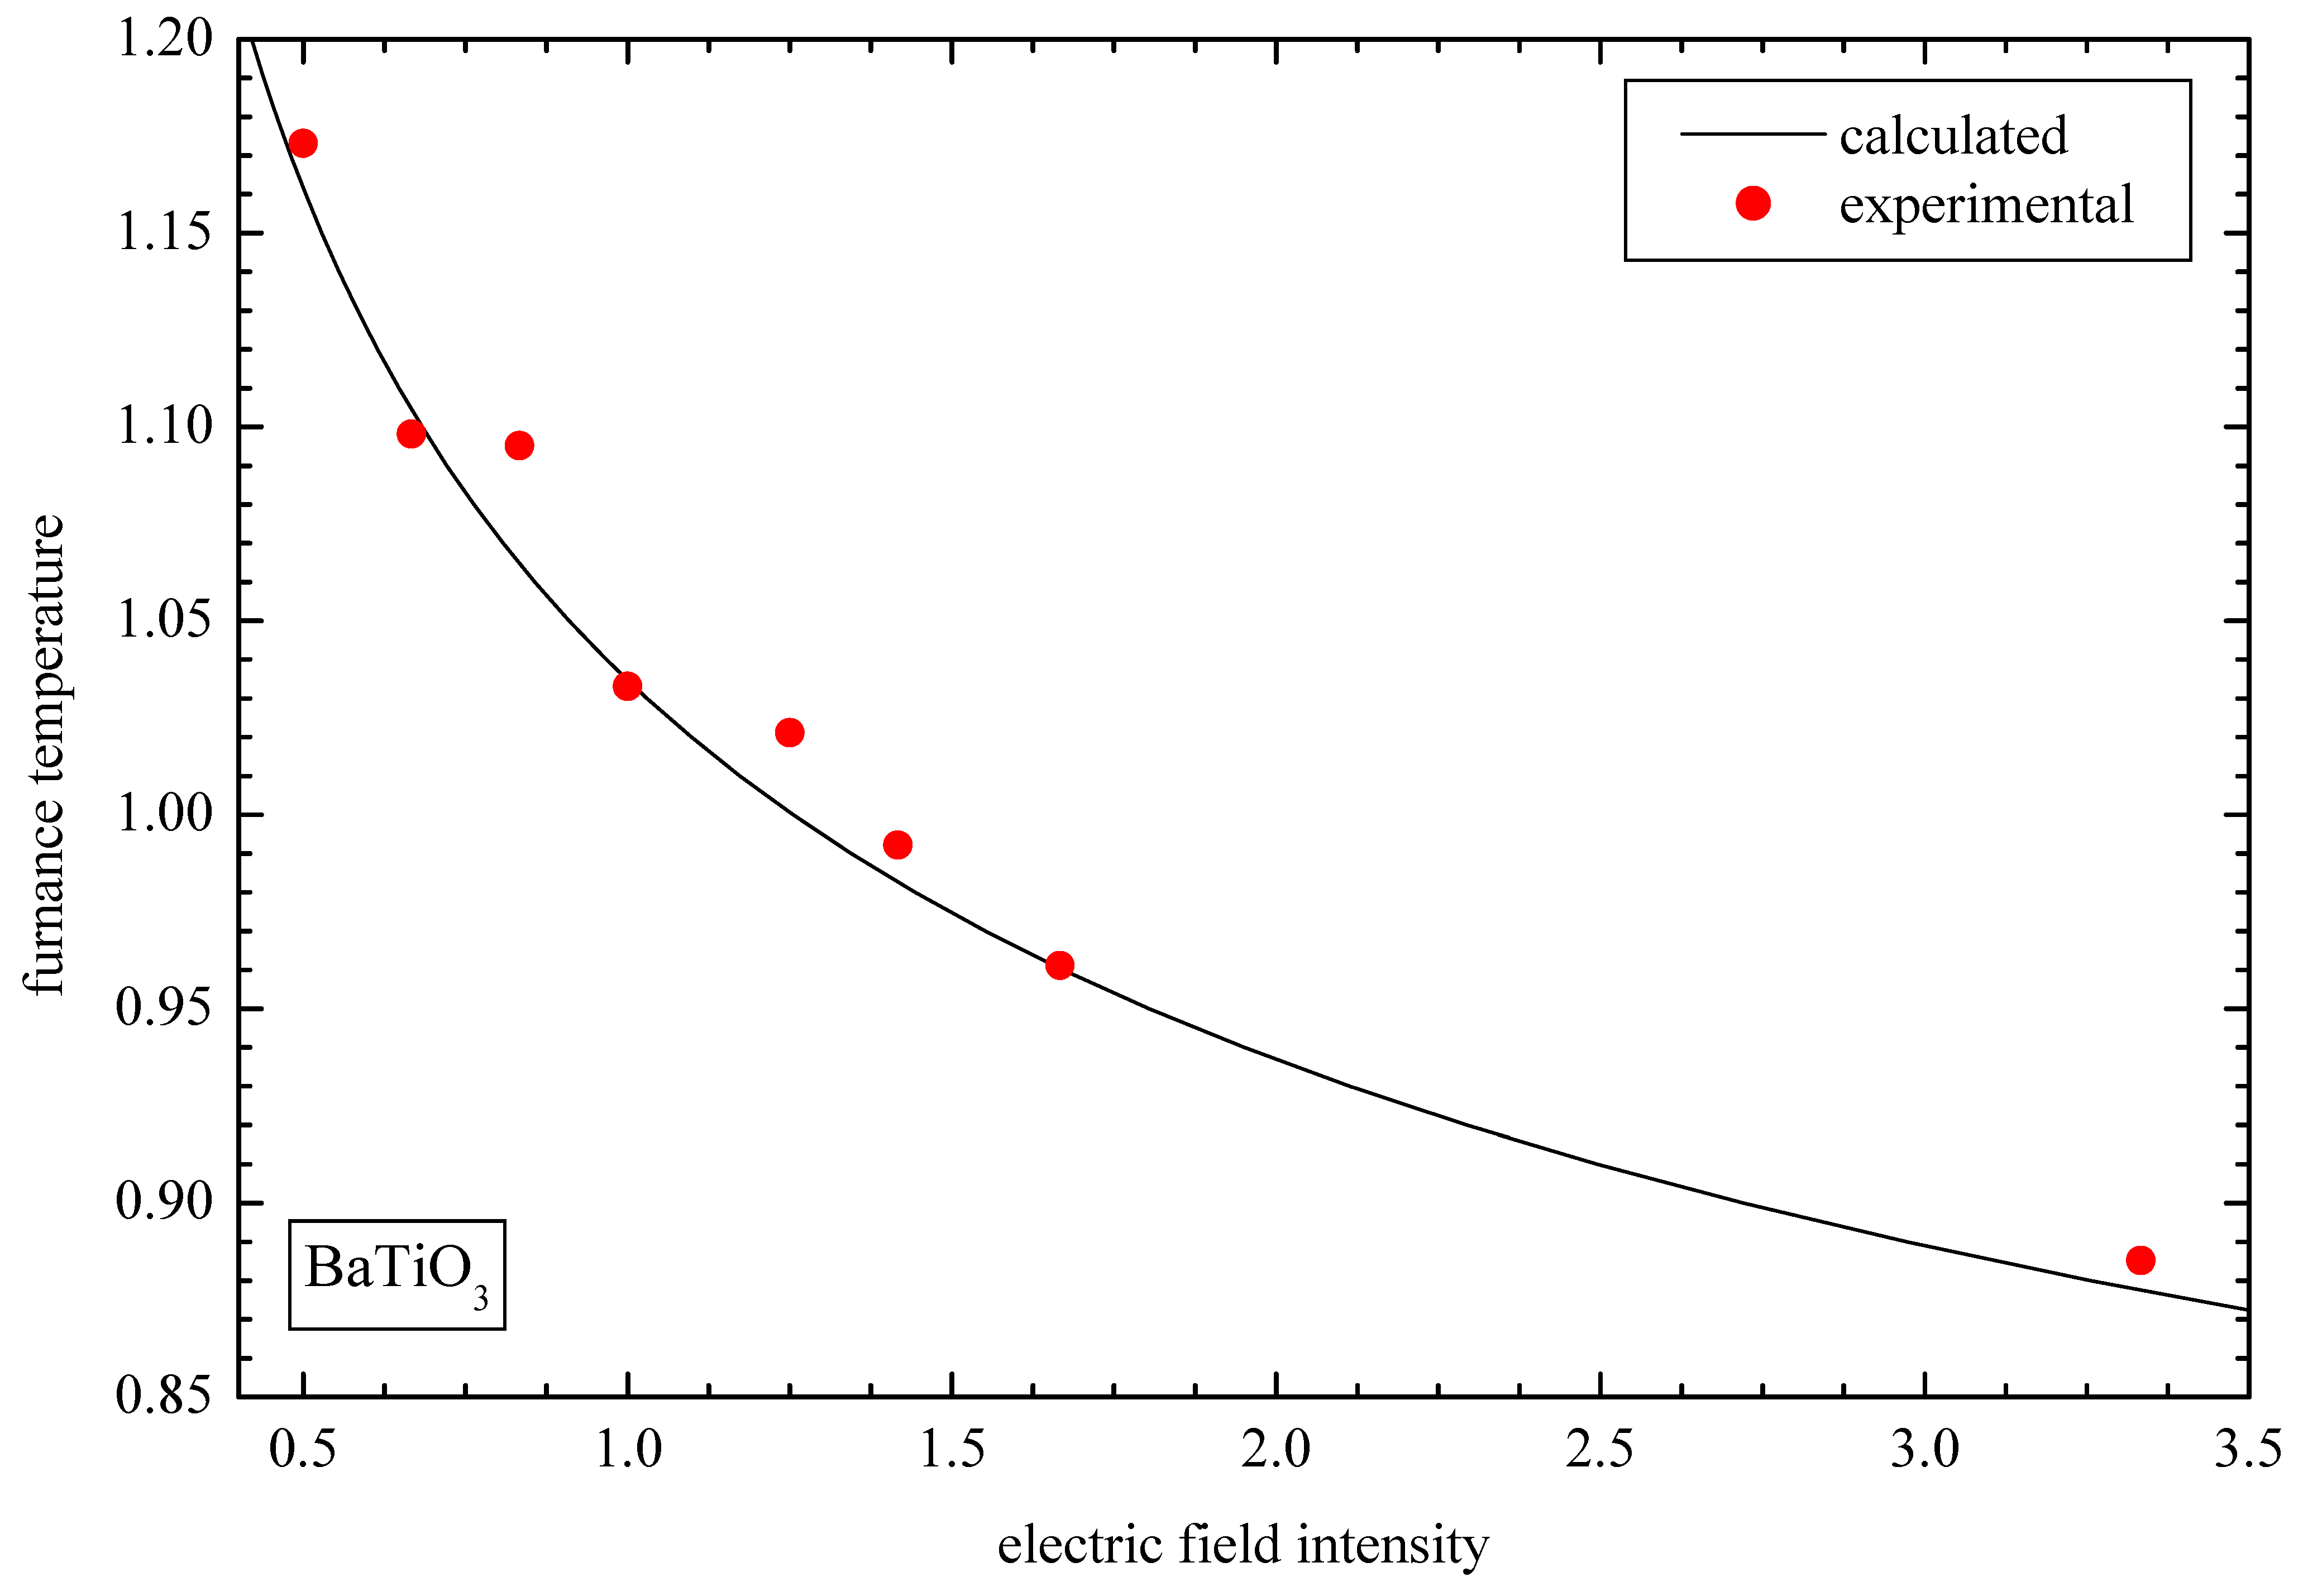
Utilizing the Frank–Kamenetskii approximation for the exponential term of the electric resistivity, Hewitt et al. [53] obtained closed-form solutions of Equation (20) for plane and radial geometries under certain assumptions. In the present study, the bifurcation and stability analysis are carried out numerically; therefore, no simplified assumptions for the form of the electric resistivity have been introduced, so the same model described by Equation (30) and Neumann boundary conditions (insulated edges) has been used for the numerical solution of the flash sintering phenomenon. The solution structure and the singular points are presented in Figure 7, which looks very similar to Figure 3, which describes the corresponding uniform solutions in the whole P–NTC regime. Hence, it is worth pointing out that the boundary value problem in Equation (20), together with the monotonically decreasing function of the electric resistivity in Equation (35) and Neumann boundary conditions, , admits only uniform solutions, i.e., . In fact, under these circumstances the solution can be obtained by solving the much simpler zero-dimensional model described by the algebraic relationship in Equation (32). This kind of boundary conditions, i.e., insulated edges, may be justified by the presence of the connecting electrodes (see Figure 1c) which diminish cooling through the edges acting like insulators. As long as only uniform solutions exist, there is a single singular point that connects the stable and the unstable branches. As soon as the voltage or the furnace temperature limits specified by the singular point, a limit point in this case, are exceeded, a thermal runaway is under way and the process controller must switch from voltage to current control in order to maintain the temperature within limits. This is because, for the current control mode, a unique solution exists for an NTC device. Similar instability criteria have been proposed for the uniform temperature model [54]. The singular points calculated from Equation (32) are in good agreement with the experimental data for 3YSZ [49] shown in Figure 8, for 8YSZ [48,55] shown in Figure 9, and for barium titanate [56] shown in Figure 10. The absence of non-uniform solutions when the edges of the specimen are insulated or, in general, when the heat transfer is poor could be a reason why a single energy balance between Joule heating and cooling through radiation and natural convection in Equation (32) is quite successful and, consequently, has been widely used for correlating experimental flash sintering data.
5. Conclusions
An electrothermal model for barium-titanate-based ceramics has been developed, combining the Heywang–Jonker model for the electric resistivity with a heat dissipation mechanism based on natural convection and radiation in a one-dimensional model on the device level with voltage as the control parameter. Both PTC and NTC effects are accounted for through the double Schottky barriers at the grain boundaries of the material. The problem formulated in this way admits uniform and non-uniform multiple-steady-state solutions that do not depend on the external circuit. The instability thresholds calculated for the NTC regime and the associated thermal runaway are in agreement with the experimental flash sintering results obtained for barium titanate, and 3% and 8% yttria-stabilized zirconia. The important findings are as follows:
- The PTC effect gives rise to multiple solutions mainly in the temperature range between the Curie and the maximum resistivity points.
- Thermal runaway is due to the NTC effect. The runaway voltage depends on the conduction–convection parameter u.
- Thermal runaway as a thermal shock is a potential reason for the thermo–mechanical failures observed (delamination fracture).
- For the NTC regime (flash sintering) when Neumann boundary conditions are imposed on the distributed model, only uniform solutions are admitted, one stable and one unstable.
Funding
This research received no external funding.
Institutional Review Board Statement
Not applicable.
Informed Consent Statement
Not applicable.
Data Availability Statement
No data has been used for this study.
Conflicts of Interest
The authors declare no conflict of interest.
References
- Haayman, P.; Dam, R.; Klasens, H. Verfahren zur Herstellung Halbleitenden Materials. German Patent 929350, 1955. [Google Scholar]
- Huybrechts, B.; Ishizaki, K.; Takata, M. The positive temperature coefficient of resistivity in barium titanate. J. Mater. Sci. 1995, 30, 2463–2474. [Google Scholar] [CrossRef]
- Preis, W.; Sitte, W. Electrical properties of grain boundaries in interfacially controlled functional ceramics. J. Electroceram. 2015, 34, 185–206. [Google Scholar] [CrossRef]
- Danzer, R.; Kaufmann, B.; Supancic, P. Failure of high power varistor ceramic components. J. Eur. Ceram. Soc. 2020, 40, 3766–3770. [Google Scholar] [CrossRef]
- Dewitte, C.; Elst, R.; Delannay, F. On the mechanism of delamination fracture of BaTiO3–based PTC thermistors. J. Eur. Ceram. Soc. 1994, 14, 481–492. [Google Scholar] [CrossRef]
- Supancic, P. Mechanical stability of BaTiO3–based PTC thermistors components: Experimental investigation and theoretical modeling. J. Eur. Ceram. Soc. 2000, 20, 2009–2024. [Google Scholar] [CrossRef]
- Chlup, Z.; Drdlík, D.; Hadraba, H.; Ševeček, O.; Šiška, F.; Erhart, J.; Maca, K. Temperature effect on elastic and fracture behaviour of lead-free piezoceramic BaTiO3. J. Eur. Ceram. Soc. 2023, 43, 1509–1522. [Google Scholar] [CrossRef]
- Smith, D.; Ghayoub, N.; Charissou, I.; Bellon, O.; Abélard, P.; Edwards, A. Transient Thermal Gradients in Barium Titanate Positive Temperature Coefficient (PTC) Thermistors. J. Am. Ceram. Soc. 1998, 81, 1789–1796. [Google Scholar] [CrossRef]
- Mader, G.; Meixner, H.; Kleinschmidt, P. Study of microscopic heat sources in semiconducting barium titanate ceramics. J. Appl. Phys. 1984, 56, 2832–2836. [Google Scholar] [CrossRef]
- Heinen, B.; Waser, R. Influence of the thickness and area of NiCr/Ag electrodes on the characteristics of BaTiO3–ceramic based positive–temperature–coefficient thermistor. J. Mat. Sci. 1998, 33, 4603–4608. [Google Scholar] [CrossRef]
- Karpov, E. Bistability, autowaves and dissipative structures in semiconductor fibers with anomalous resistivity properties. Philos. Mag. 2012, 92, 1300–1316. [Google Scholar] [CrossRef]
- Platzer, A.; Supancic, P.; Danzer, R. Thermography and Simulation of Advanced Nonlinear Electroceramic Components. Adv. Eng. Mater. 2006, 8, 1134–1139. [Google Scholar] [CrossRef]
- Krikkis, R. Multiplicity Analysis of a Thermistor problem—A Possible Explanation of Delamination Fracture. J 2023, 6, 517–535. [Google Scholar] [CrossRef]
- Cimatti, G. Remark on existence and uniqueness for the thermistor problem under mixed boundary conditions. Quart. Appl. Math. 1989, 47, 117–121. [Google Scholar] [CrossRef]
- Fowler, A.; Frigaard, I.; Howison, S. Temperature surges in current-limiting circuit devices. SIAM J. Appl. Math. 1992, 52, 998–1011. [Google Scholar] [CrossRef]
- Howison, S.; Rodrigues, J.; Shilor, M. Stationary solutions to the thermistor problem. J. Math. Anal. Appl. 1993, 174, 573–588. [Google Scholar] [CrossRef]
- Zhou, S.; Westbrook, D. Numerical solutions of the thermistor equations. J. Comput. Appl. Math. 1997, 79, 101–118. [Google Scholar] [CrossRef]
- Golosnoy, I.; Sykulski, J. Numerical modeling of non-linear coupled thermo-electric problems. A comparative study. COMPEL 2009, 28, 639–655. [Google Scholar] [CrossRef]
- Liero, M.; Koprucki, T.; Fisher, A.; Scholz, R.; Glitzky, A. p–Laplace thermistor modeling of electrothermal feedback in organic semiconductor devices. Z. Angew. Math. Phys. 2009, 66, 639–655. [Google Scholar] [CrossRef]
- Romanovskii, V.; Watanabe, K. Operating modes of high-Tc composite superconductors and thermal runaway conditions under current charging. Supercond. Sci. Technol. 2006, 19, 541–550. [Google Scholar] [CrossRef]
- Krikkis, R. On the Thermal Dynamics of Metallic and Superconducting Wires. Bifurcations, Quench, the Destruction of Bistability and Temperature Blowup. J 2021, 4, 803–823. [Google Scholar] [CrossRef]
- Metaxas, A. Foundations of Electroheat. A Unified Approach; Wiley: Hoboken, NJ, USA, 1996. [Google Scholar]
- Lupi, S. Fundamentals of Electroheat. Electrical Technologies for Process Heating; Springer: Berlin/Heidelberg, Germany, 2017. [Google Scholar]
- Churchill, S.; Chu, H.H. Correlating equations for laminar and turbulent free convection from a horizontal cylinder. Int. J. Heat Mass Transfer. 1975, 18, 1049–1053. [Google Scholar] [CrossRef]
- Faghri, M.; Sparrow, E. Forced convection in a horizontal pipe subjected to nonlinear external natural convection and to external radiation. Int. J. Heat Mass Transfer. 1986, 23, 861–872. [Google Scholar] [CrossRef]
- Heywang, W. Resistivity Anomaly in Doped Barium Titanate. J. Am. Ceram. Soc. 1964, 47, 484–490. [Google Scholar] [CrossRef]
- Jonker, G. Some aspects of semiconducting barium titanate. Solid State Electron. 1964, 7, 895–903. [Google Scholar] [CrossRef]
- Kulwicki, B.; Purdes, A. Diffusion potentials in BaTiO3 and the theory of PTC materials. Ferroelectrics 1970, 1, 253–263. [Google Scholar] [CrossRef]
- Ihrig, H.; Puschert, W. A systematic experimental and theoretical investigation of the grain boundary resistivities of n–doped BaTiO3 ceramics. J. Appl. Phys. 1977, 48, 3081–3088. [Google Scholar] [CrossRef]
- Mallick, G.; Emtage, P. Current–Voltage Characteristics of Semiconducting Barium Titanate Ceramic. J. Appl. Phys. 1968, 39, 3088–3094. [Google Scholar] [CrossRef]
- Preis, W.; Sitte, W. Modeling of transport properties of interfacially controlled electroceramics: Application to n–conducting barium titanate. J. Electroceram. 2011, 27, 83–88. [Google Scholar] [CrossRef]
- Kriegsmann, G. Pattern formation in microwave heated ceramics: Cylinders and slabs. IMA J. Appl. Math. 2001, 66, 1–32. [Google Scholar] [CrossRef]
- Wacker, A.; Schöll, E. Criteria for stability in bistable electrical devices with S– or Z–shaped current voltage characteristic. J. Appl. Phys. 1995, 78, 7352–7357. [Google Scholar] [CrossRef]
- Romanowskii, V.; Watanabe, K. Multi-Stable Static Resistive States of High Tc Superconductors with Temperature-Decreasing Power Exponent of Their Voltage-Current Characteristic. IEEE Trans. Appl. Supercond. 2010, 20, 2134–2137. [Google Scholar] [CrossRef]
- Fisher, A.; Pfalz, M.; Vandewal, K.; Lenk, S.; Liero, M.; Glitzky, A.; Reineke, S. Full Electrothermal OLED Model Including Nonlinera Self–heating Effects. Phys. Rev. Appl. 2018, 10, 014023. [Google Scholar] [CrossRef]
- Elmer, F. Limit cycles of the ballast resistor caused by intrinsic instabilities. Z. Phys. B–Cond. Mat. 1992, 87, 377–386. [Google Scholar] [CrossRef]
- Krikkis, R. Analysis of High-Temperature Superconducting Current Leads: Multiple Solutions, Thermal Runaway, and Protection. J 2023, 6, 302–317. [Google Scholar] [CrossRef]
- Gupta, T. Application of Zinc Oxide Varistors. J. Am. Ceram. Soc. 1990, 73, 1817–1840. [Google Scholar] [CrossRef]
- Clarke, D. Varistor Ceramics. J. Am. Ceram. Soc. 1999, 82, 485–502. [Google Scholar] [CrossRef]
- Li, J.; Li, S.; Cheng, P.; Alim, M. Advances in ZnO–Bi2O3 based varistors. J. Mater. Sci. Mater. Electron. 2015, 26, 4782–4809. [Google Scholar] [CrossRef]
- Mahan, G.; Philipp, H. Theory of conduction in ZnO varistors. J. Appl. Phys. 1979, 50, 2799–2812. [Google Scholar] [CrossRef]
- Blatter, G.; Greuter, F. Carrier transport through grain boundaries in semiconductors. Phys. Rev. B 1986, 33, 3952–3966. [Google Scholar] [CrossRef]
- Greuter, F.; Blatter, G. Electrical properties of grain boundaries in polycrystalline compound semiconductors. Semicond. Sci. Technol. 1990, 5, 111–137. [Google Scholar] [CrossRef]
- Eda, K. Destruction mechanism of ZnO varistors due to high currents. J. Appl. Phys. 1984, 56, 2948–2955. [Google Scholar] [CrossRef]
- Späck-Leigsnering, Y.; Gjonaj, E.; De Gersem, H.; Weiland, T.; Gießel, M.; Hinrichsen, V. Electroquasistatic-Thermal Modeling and Simulation of Station Class Surge Arresters. IEEE Trans. Magn. 2016, 52, 2490547. [Google Scholar] [CrossRef]
- Seyyedbarzegar, S.; Mirzaie, M. Thermal balance diagram modelling of surge arrester for thermal stability analysis considering ZnO varistor degradation effect. IET Gener. Transm. Distrib. 2016, 10, 1570–1581. [Google Scholar] [CrossRef]
- Likitha, S.; Kanyakumari, M.; Pauly, P.J.; Aradhya, R.S.; Vasudev, N. Estimation of Critical Resistive Leakage Current of polymer housed ZnO surge arrester by electro-thermal modeling. J. Electr. Syst. Inf. Technol. 2018, 5, 861–873. [Google Scholar] [CrossRef]
- Cologna, M.; Raskova, B.; Raj, R. Flash Sintering of Nanograin Zirconia in <5 s at 850 °C. J. Am. Ceram. Soc. 2010, 93, 3556–3559. [Google Scholar]
- Todd, R.; Zapata-Solvas, E.; Bonilla, R.; Sneddon, T.; Wilshaw, P. Electrical characteristics of flash sintering: Thermal runaway of Joule heating. J. Eur. Ceram. Soc. 2015, 35, 1865–1877. [Google Scholar] [CrossRef]
- Yu, M.; Grasso, S.; Mckinnon, R.; Saunders, T.; Reece, M. Review of flash sintering: Materials, mechanisms and modeling. Adv. Appl. Ceram. 2016, 116, 24–60. [Google Scholar] [CrossRef]
- Biesuz, M.; Sglavo, V. Flash sintering of ceramics. J. Eur. Ceram. Soc. 2019, 39, 115–145. [Google Scholar] [CrossRef]
- Zhou, H.; Li, X.; Zhu, Y.; Liu, J.; Wu, A.; Ma, G.; Wang, X.; Jia, Z.; Wang, L. Review of flash sintering with strong electric field. High Volt. 2022, 7, 1–11. [Google Scholar] [CrossRef]
- Hewitt, I.; Lacey, A.; Todd, R. A mathematical model for flash sintering. Math. Model. Nat. Phenom. 2015, 10, 77–89. [Google Scholar] [CrossRef]
- Dong, Y.; Chen, I.W. Predicting the Onset of Flash Sintering. J. Am. Ceram. Soc. 2015, 98, 2333–2335. [Google Scholar] [CrossRef]
- Downs, J.; Sglavo, V. Electric Field Assisted Sintering of Cubic Zirconia at 390 °C. J. Am. Ceram. Soc. 2013, 96, 1342–1344. [Google Scholar] [CrossRef]
- M’Peko, J.-C.; Francis, J.S.C.; Raj, R. Field–assisted sintering of undoped BaTiO3. Microstructure evolution and dielectric permittivity. J. Eur. Ceram. Soc. 2014, 34, 3655–3660. [Google Scholar] [CrossRef]
Figure 1.
(a) Conductor geometry; (b) energy balance on an elementary volume element; and (c) simplified electric circuit.
Figure 1.
(a) Conductor geometry; (b) energy balance on an elementary volume element; and (c) simplified electric circuit.
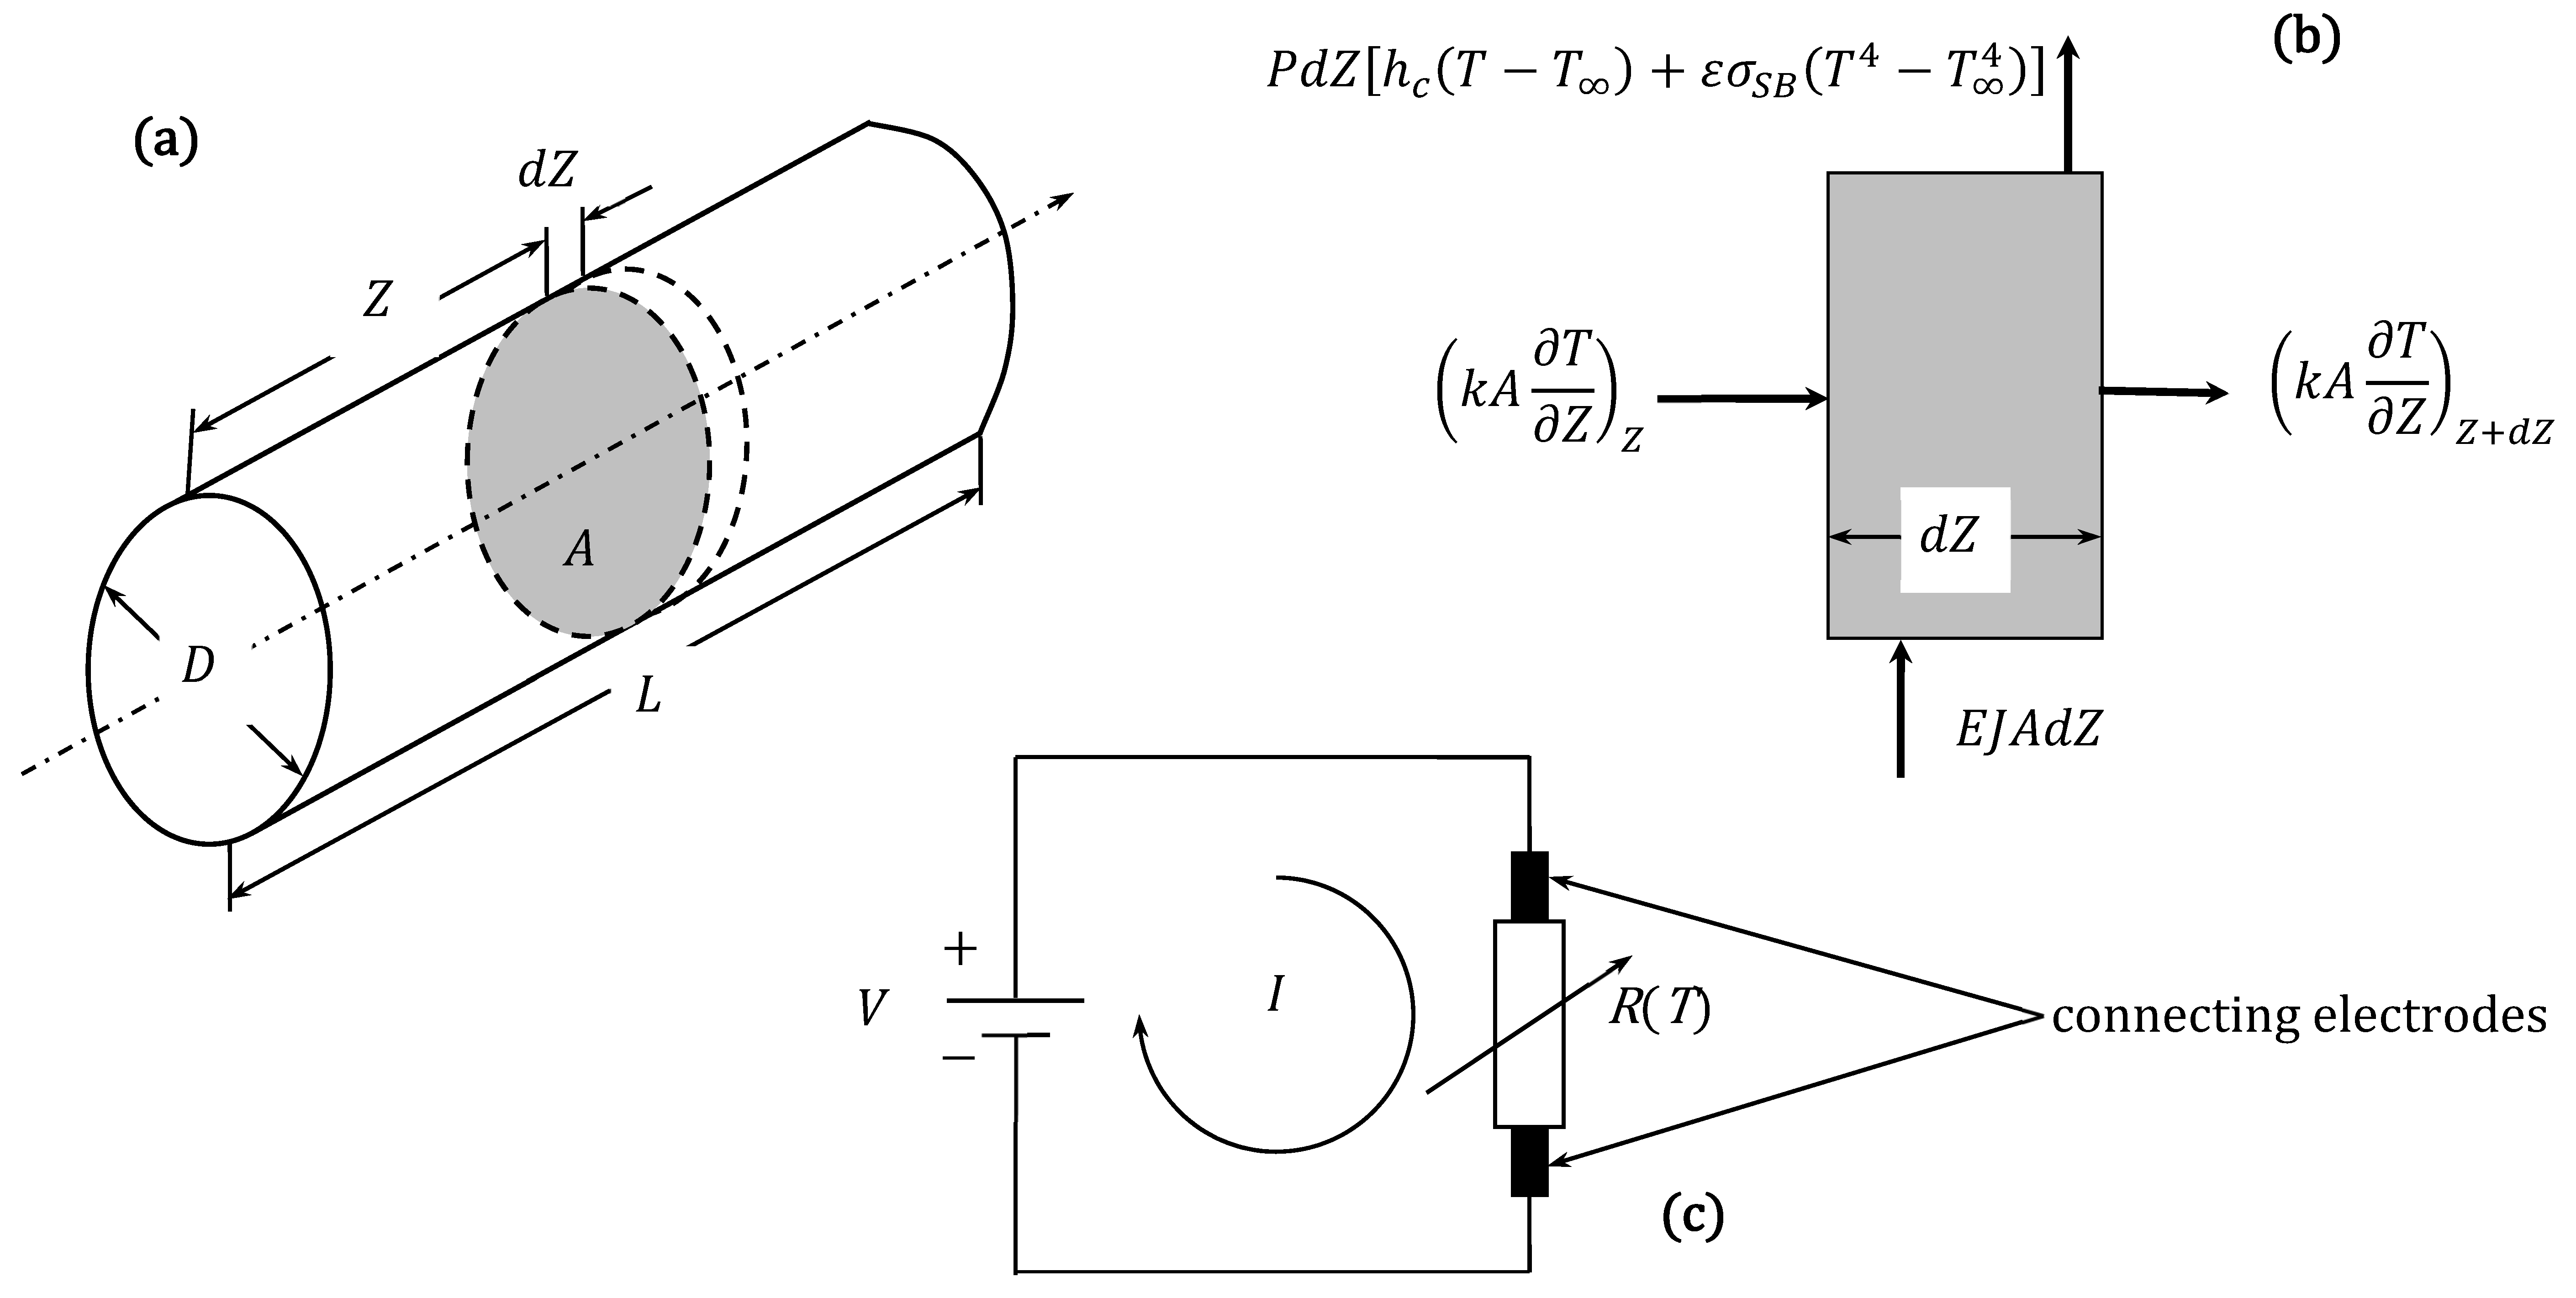
Figure 2.
Energy balance and uniform solutions of Equation (32). Heat generation () and dissipation curves () are plotted against temperature. For a certain range of the applied voltage , two intersection points exist, one below and one above , corresponding to one stable and one unstable solution, respectively. Above a certain threshold (singular point at ), i.e., for , no intersection point exists and a thermal runaway is triggered.
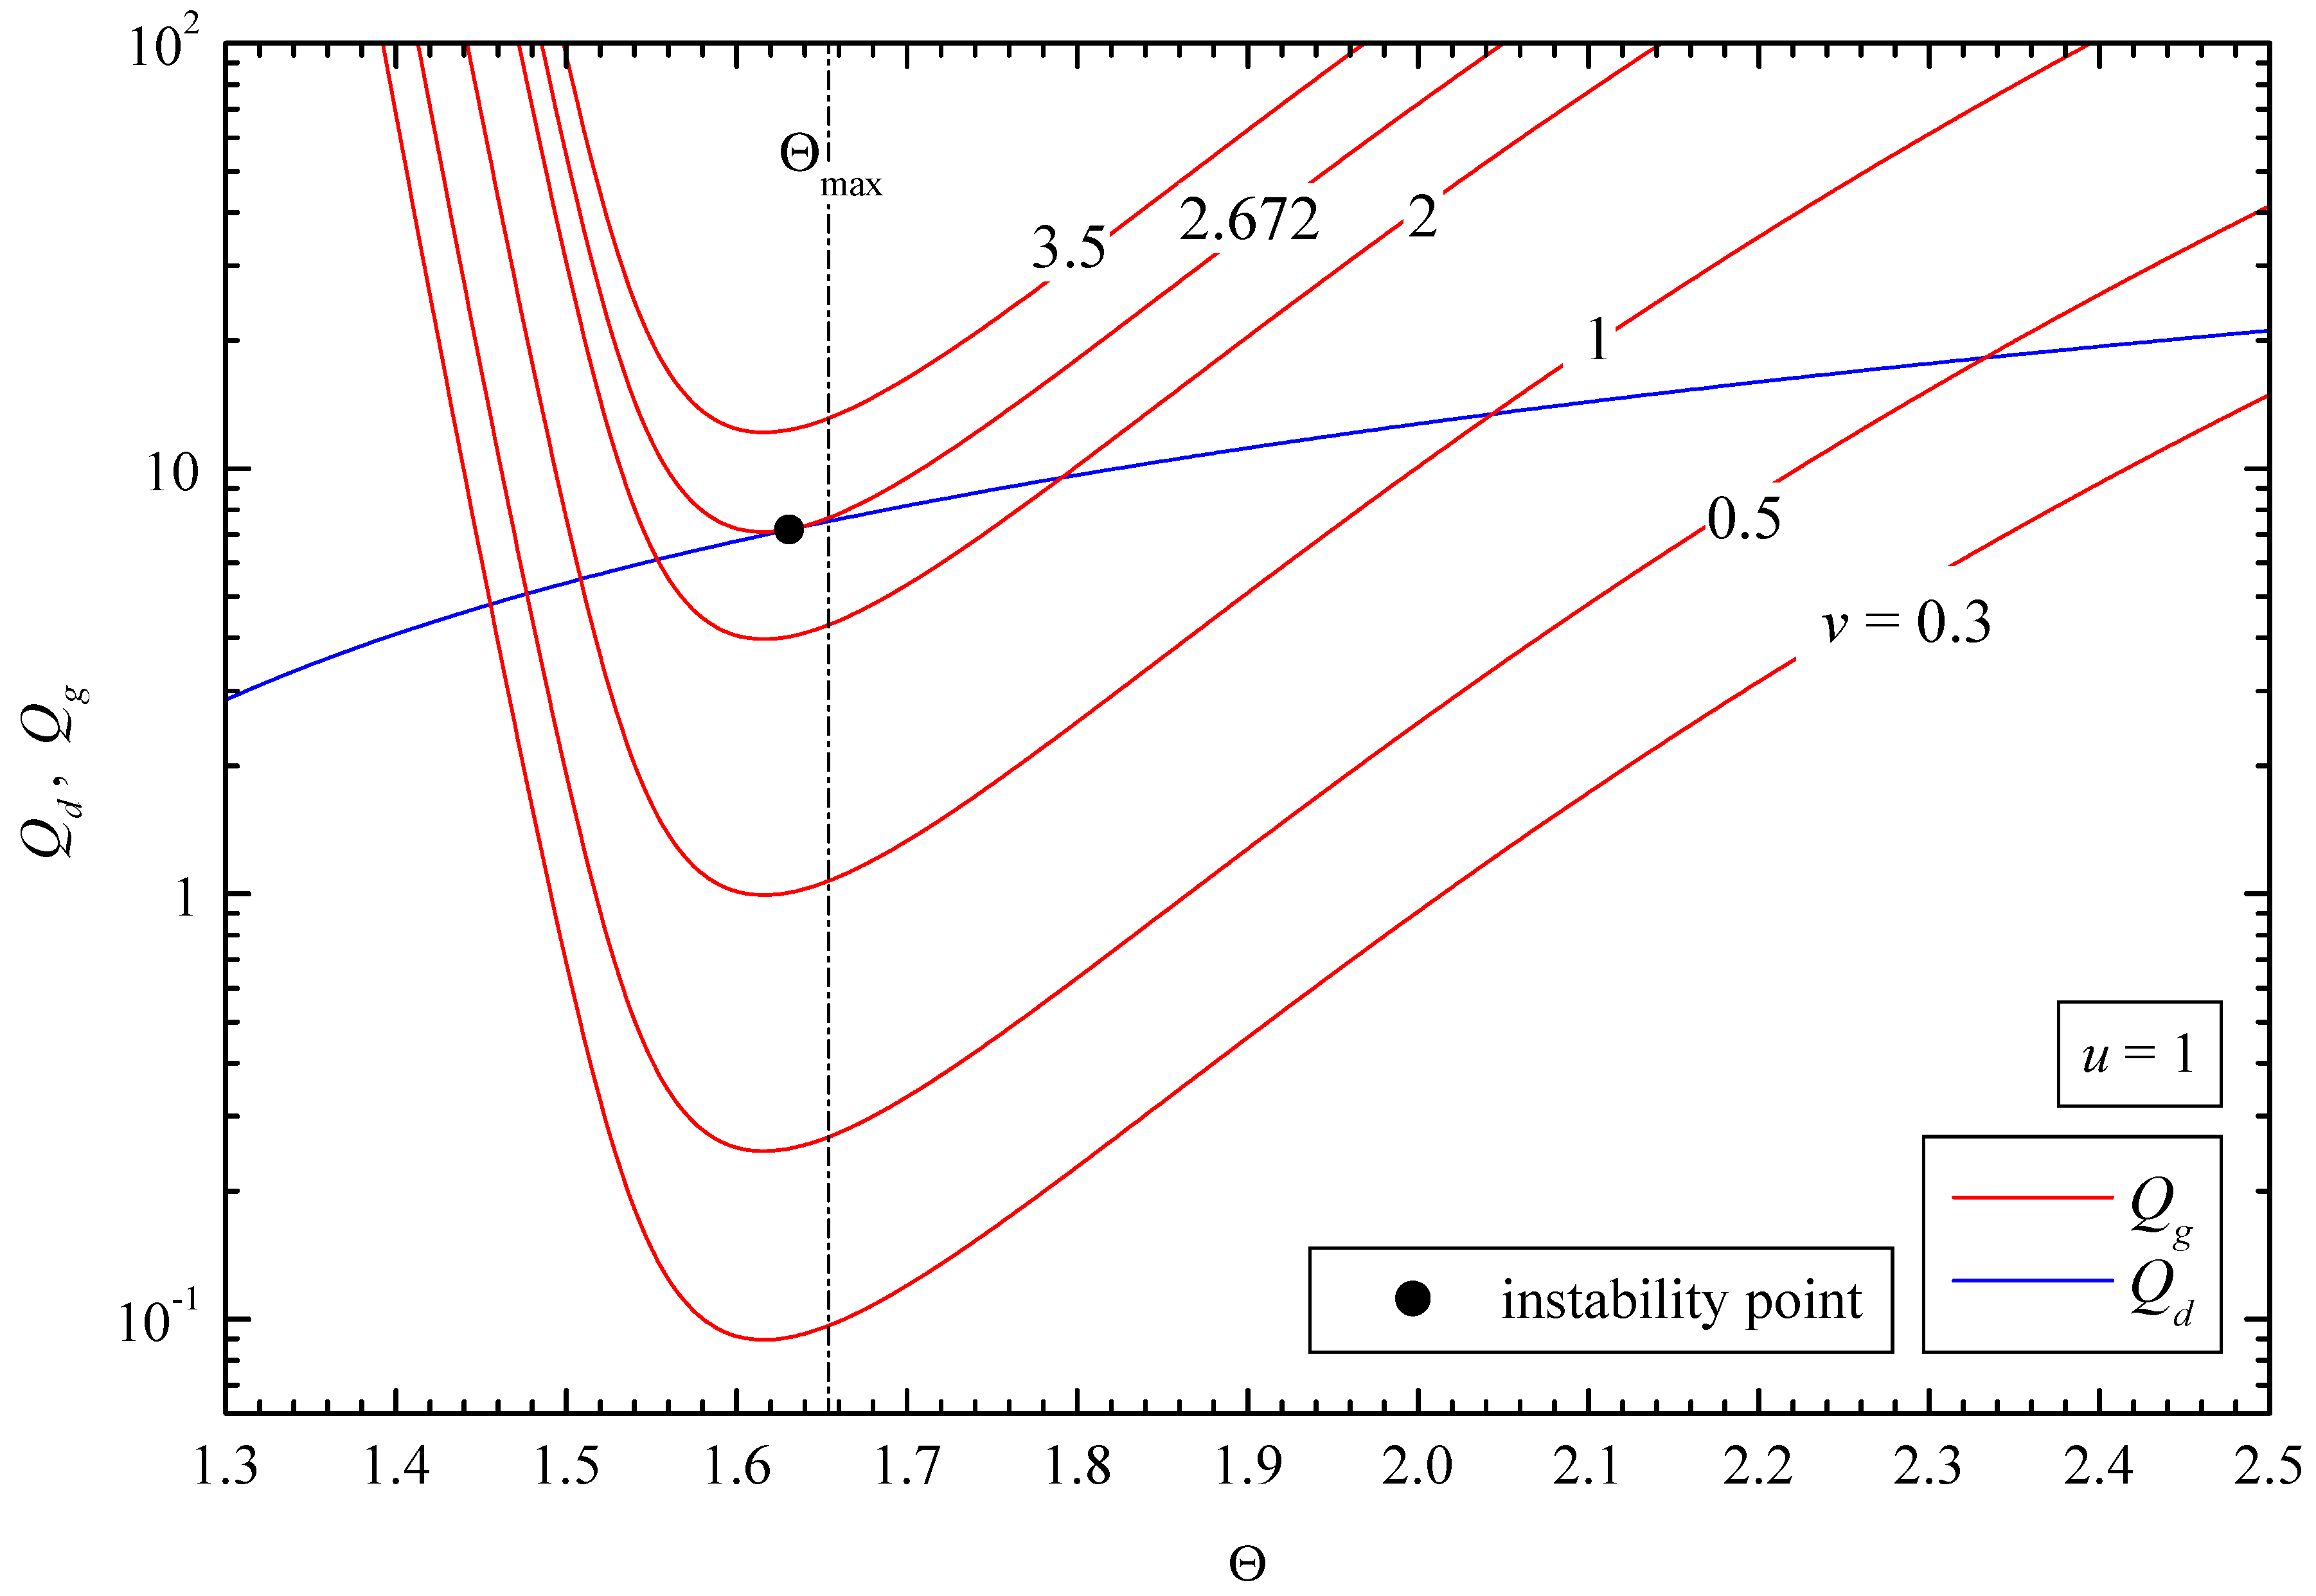
Figure 3.
Solution structure of Equation (32) projected on the plane and instability threshold. Stable solutions are plotted wih a continuous line, whereas the unstable ones are plotted with a dashed line. The thermal runaway triggered by an increase in the applied voltage is shown schematically with red arrows. The instability threshold is formed by the singular points (●) and depends on the conduction–convection parameter .

Figure 4.
Solution structure of Equation (32) projected on the plane. Increasing the voltage beyond the singular points, the current blows up, resulting in temperature blowup.
Figure 4.
Solution structure of Equation (32) projected on the plane. Increasing the voltage beyond the singular points, the current blows up, resulting in temperature blowup.
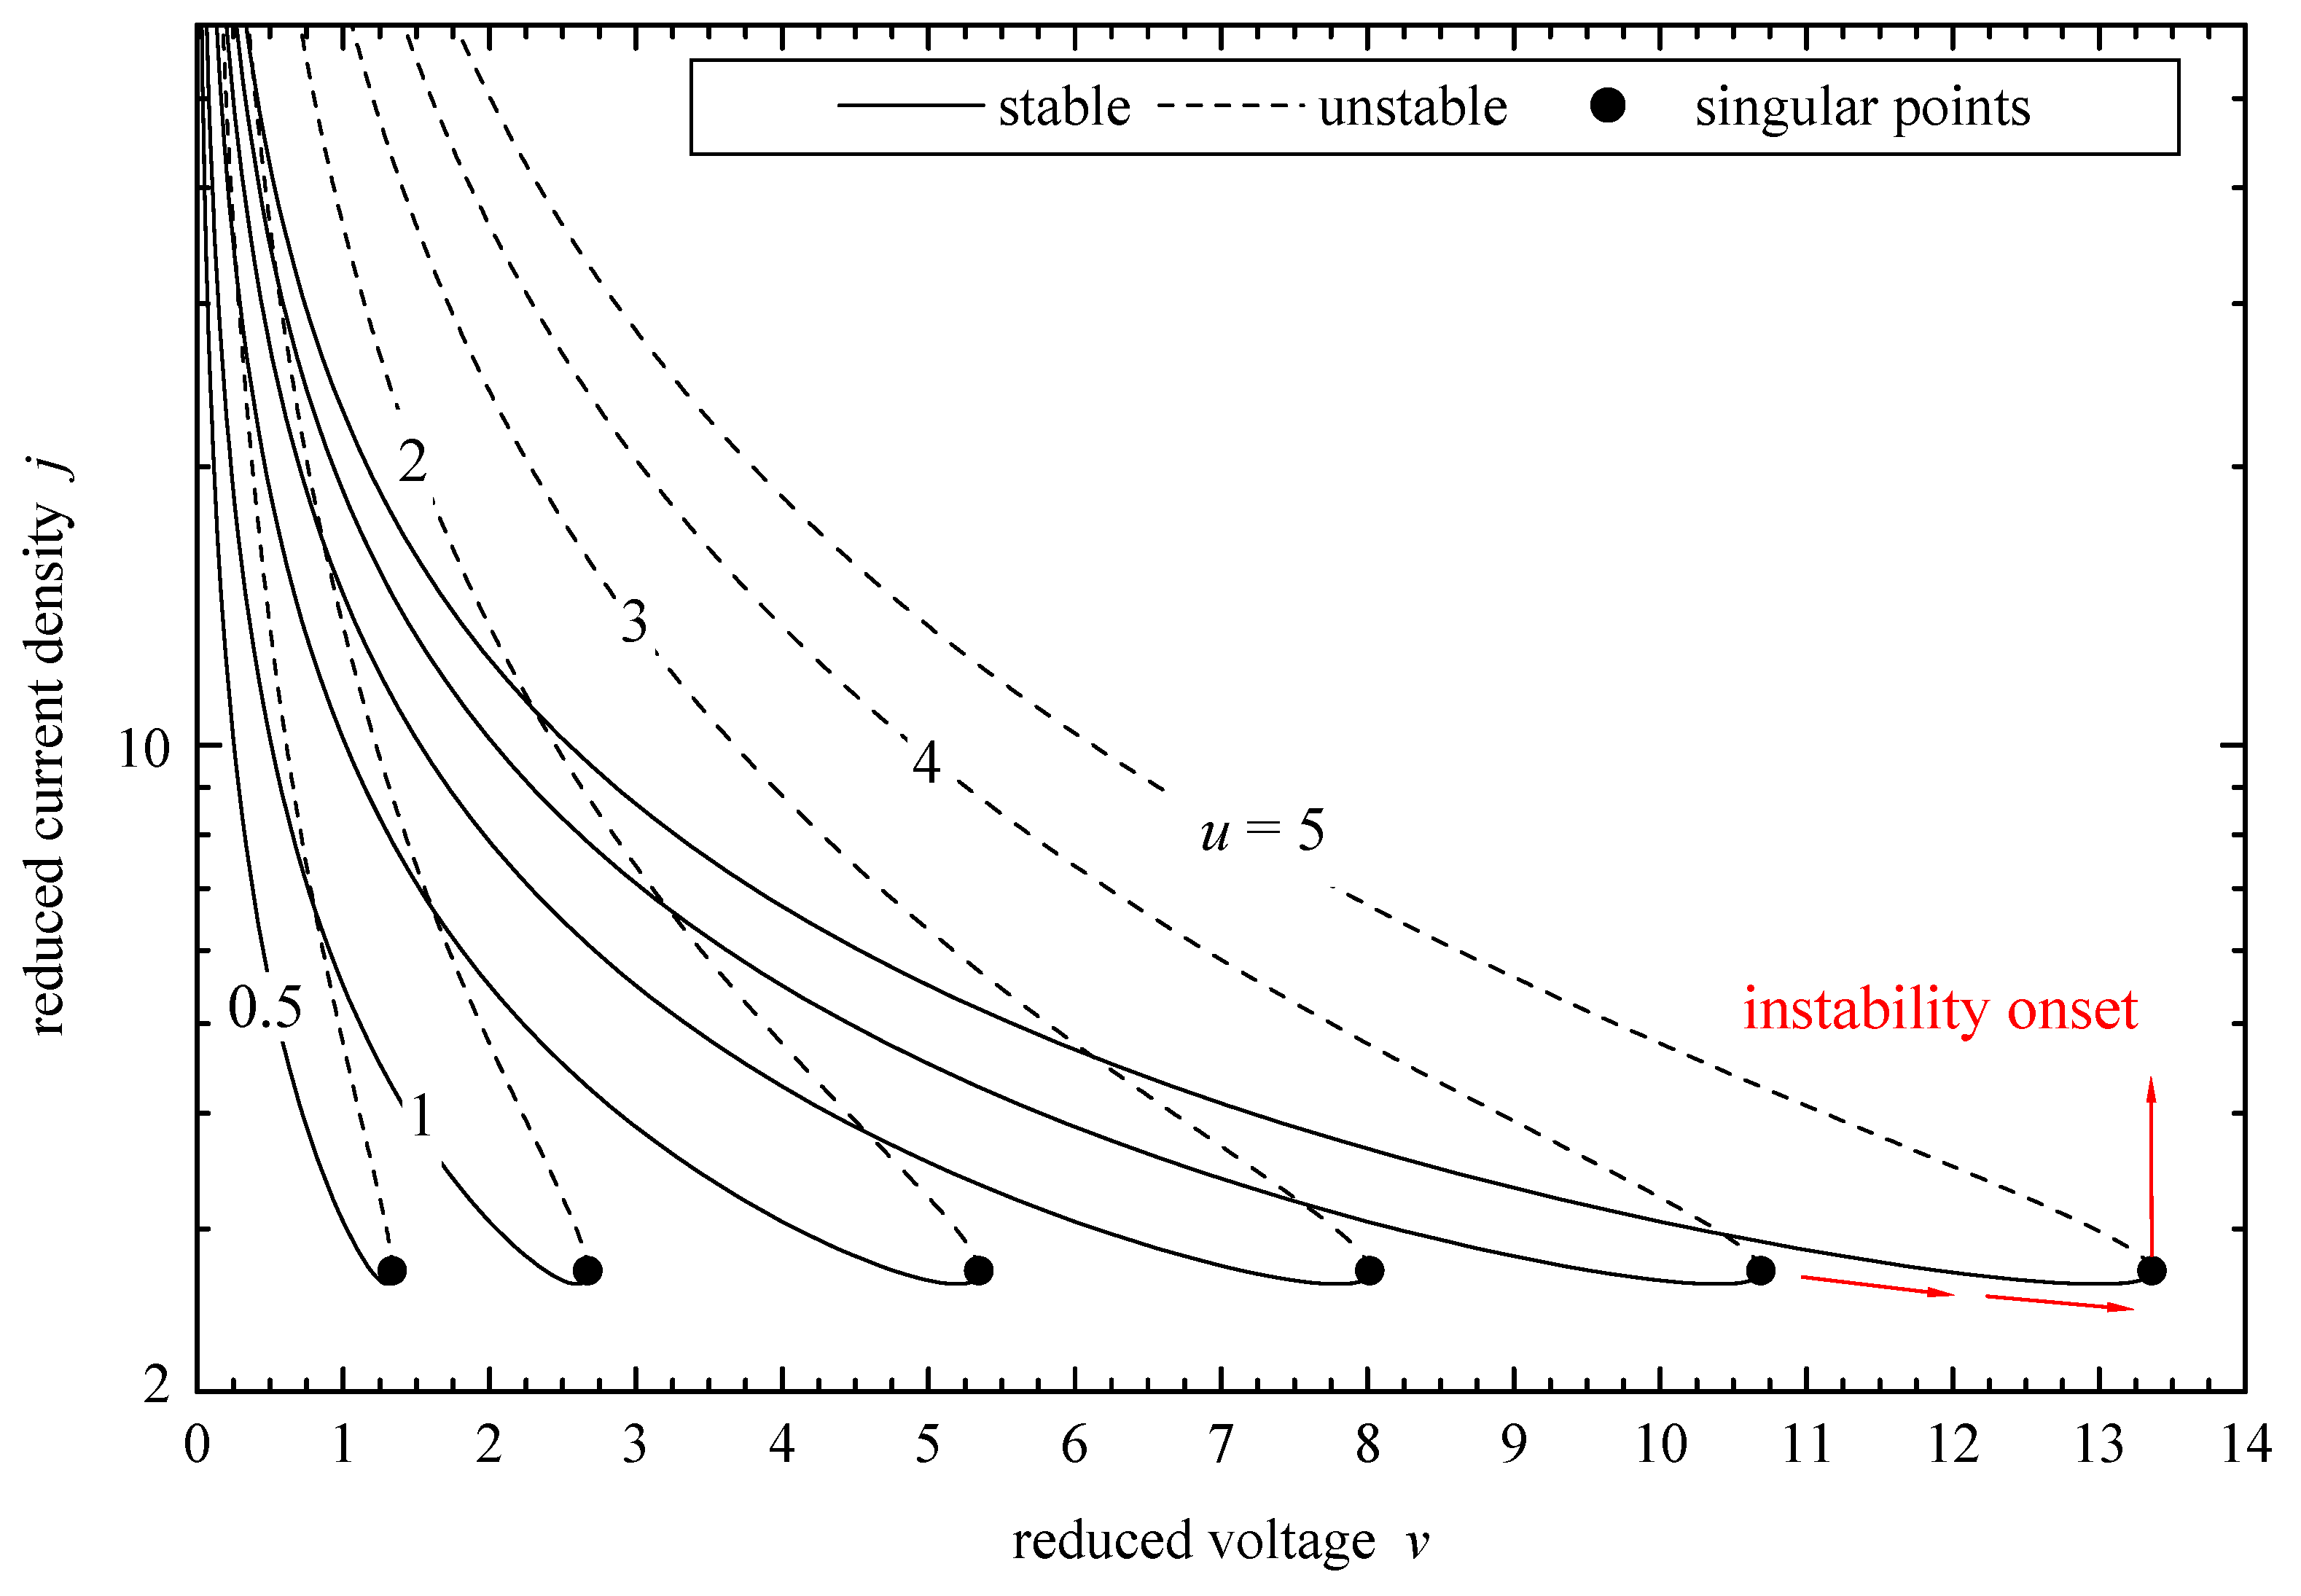
Figure 5.
Solution structure for the distributed model in Equation (20) with bifurcation parameter . Apart from the uniform solutions that are recovered, as in Figure 3, stable (continuous) and unstable (dashed) non-uniform solutions exist as well. The instability mechanism is the same as before, but, now, the path to thermal runway could also be through the stable non-uniform branches as indicated by the red arrows.
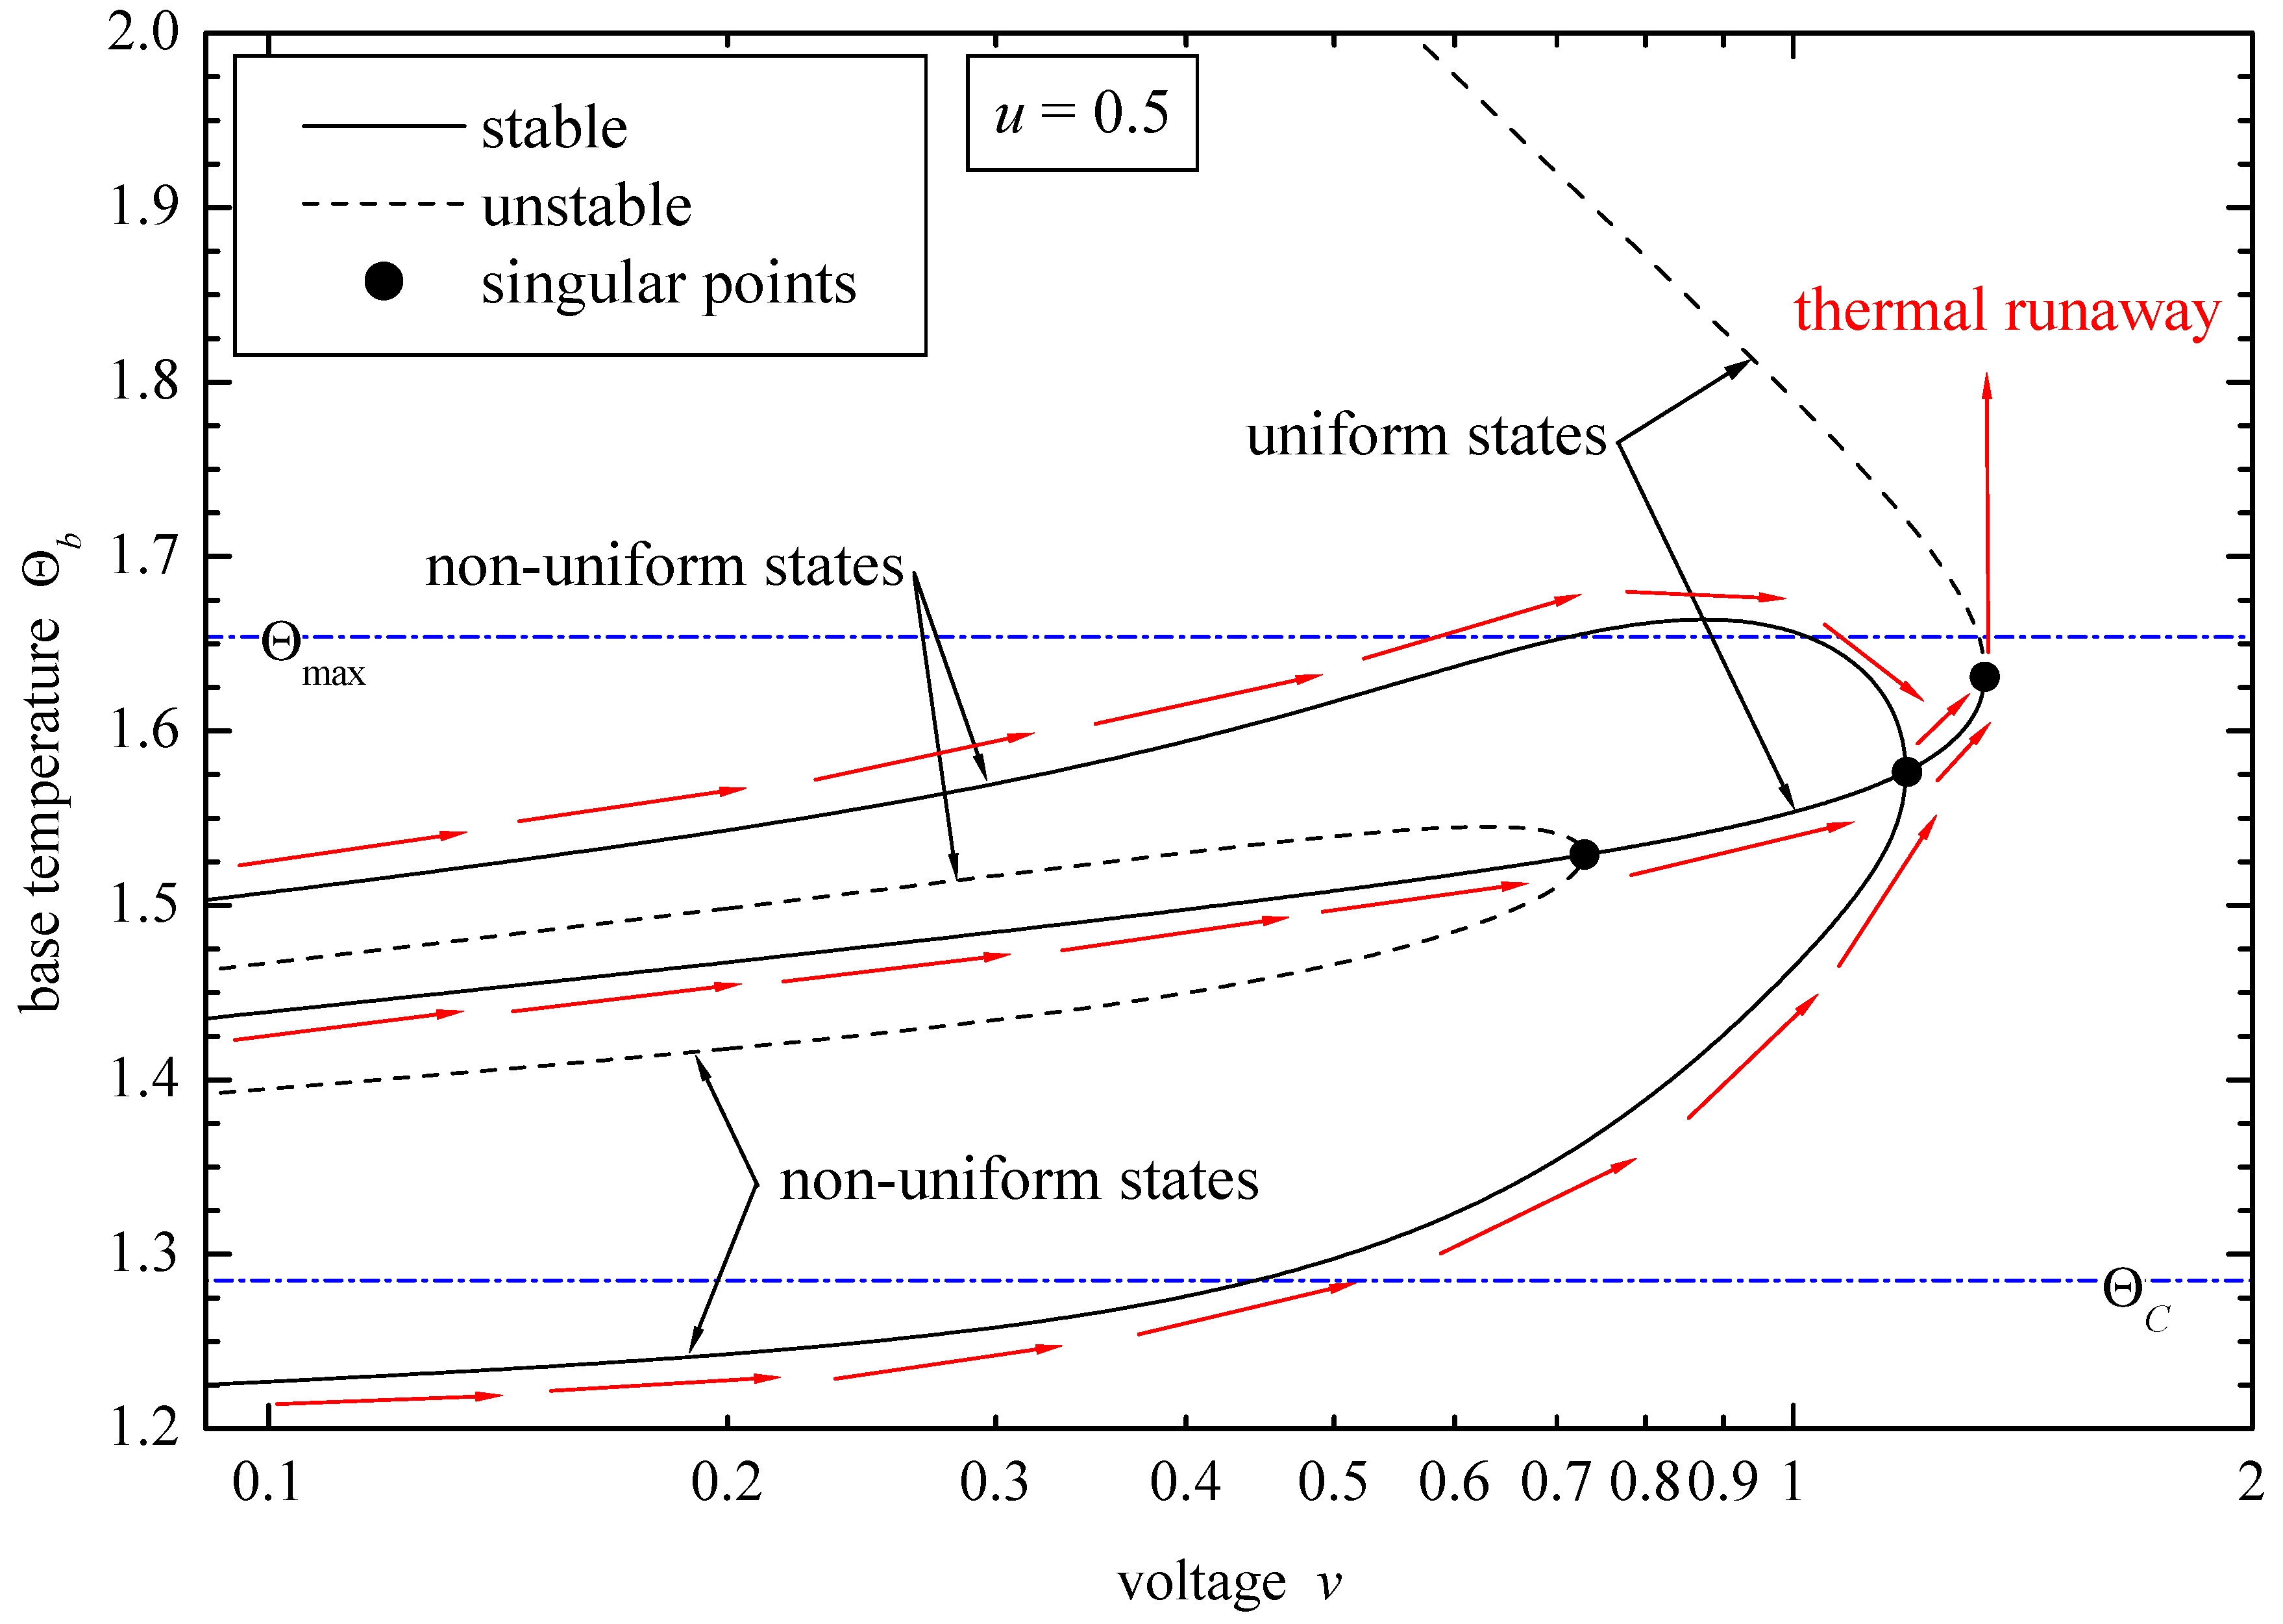
Figure 6.
Numerically computed temperature profiles for the distributed model of Equation (20). Solutions designated as 1, 2, 4, and 5 correspond to non-uniform profiles, whereas 3 and 6 correspond to uniform profiles.
Figure 6.
Numerically computed temperature profiles for the distributed model of Equation (20). Solutions designated as 1, 2, 4, and 5 correspond to non-uniform profiles, whereas 3 and 6 correspond to uniform profiles.
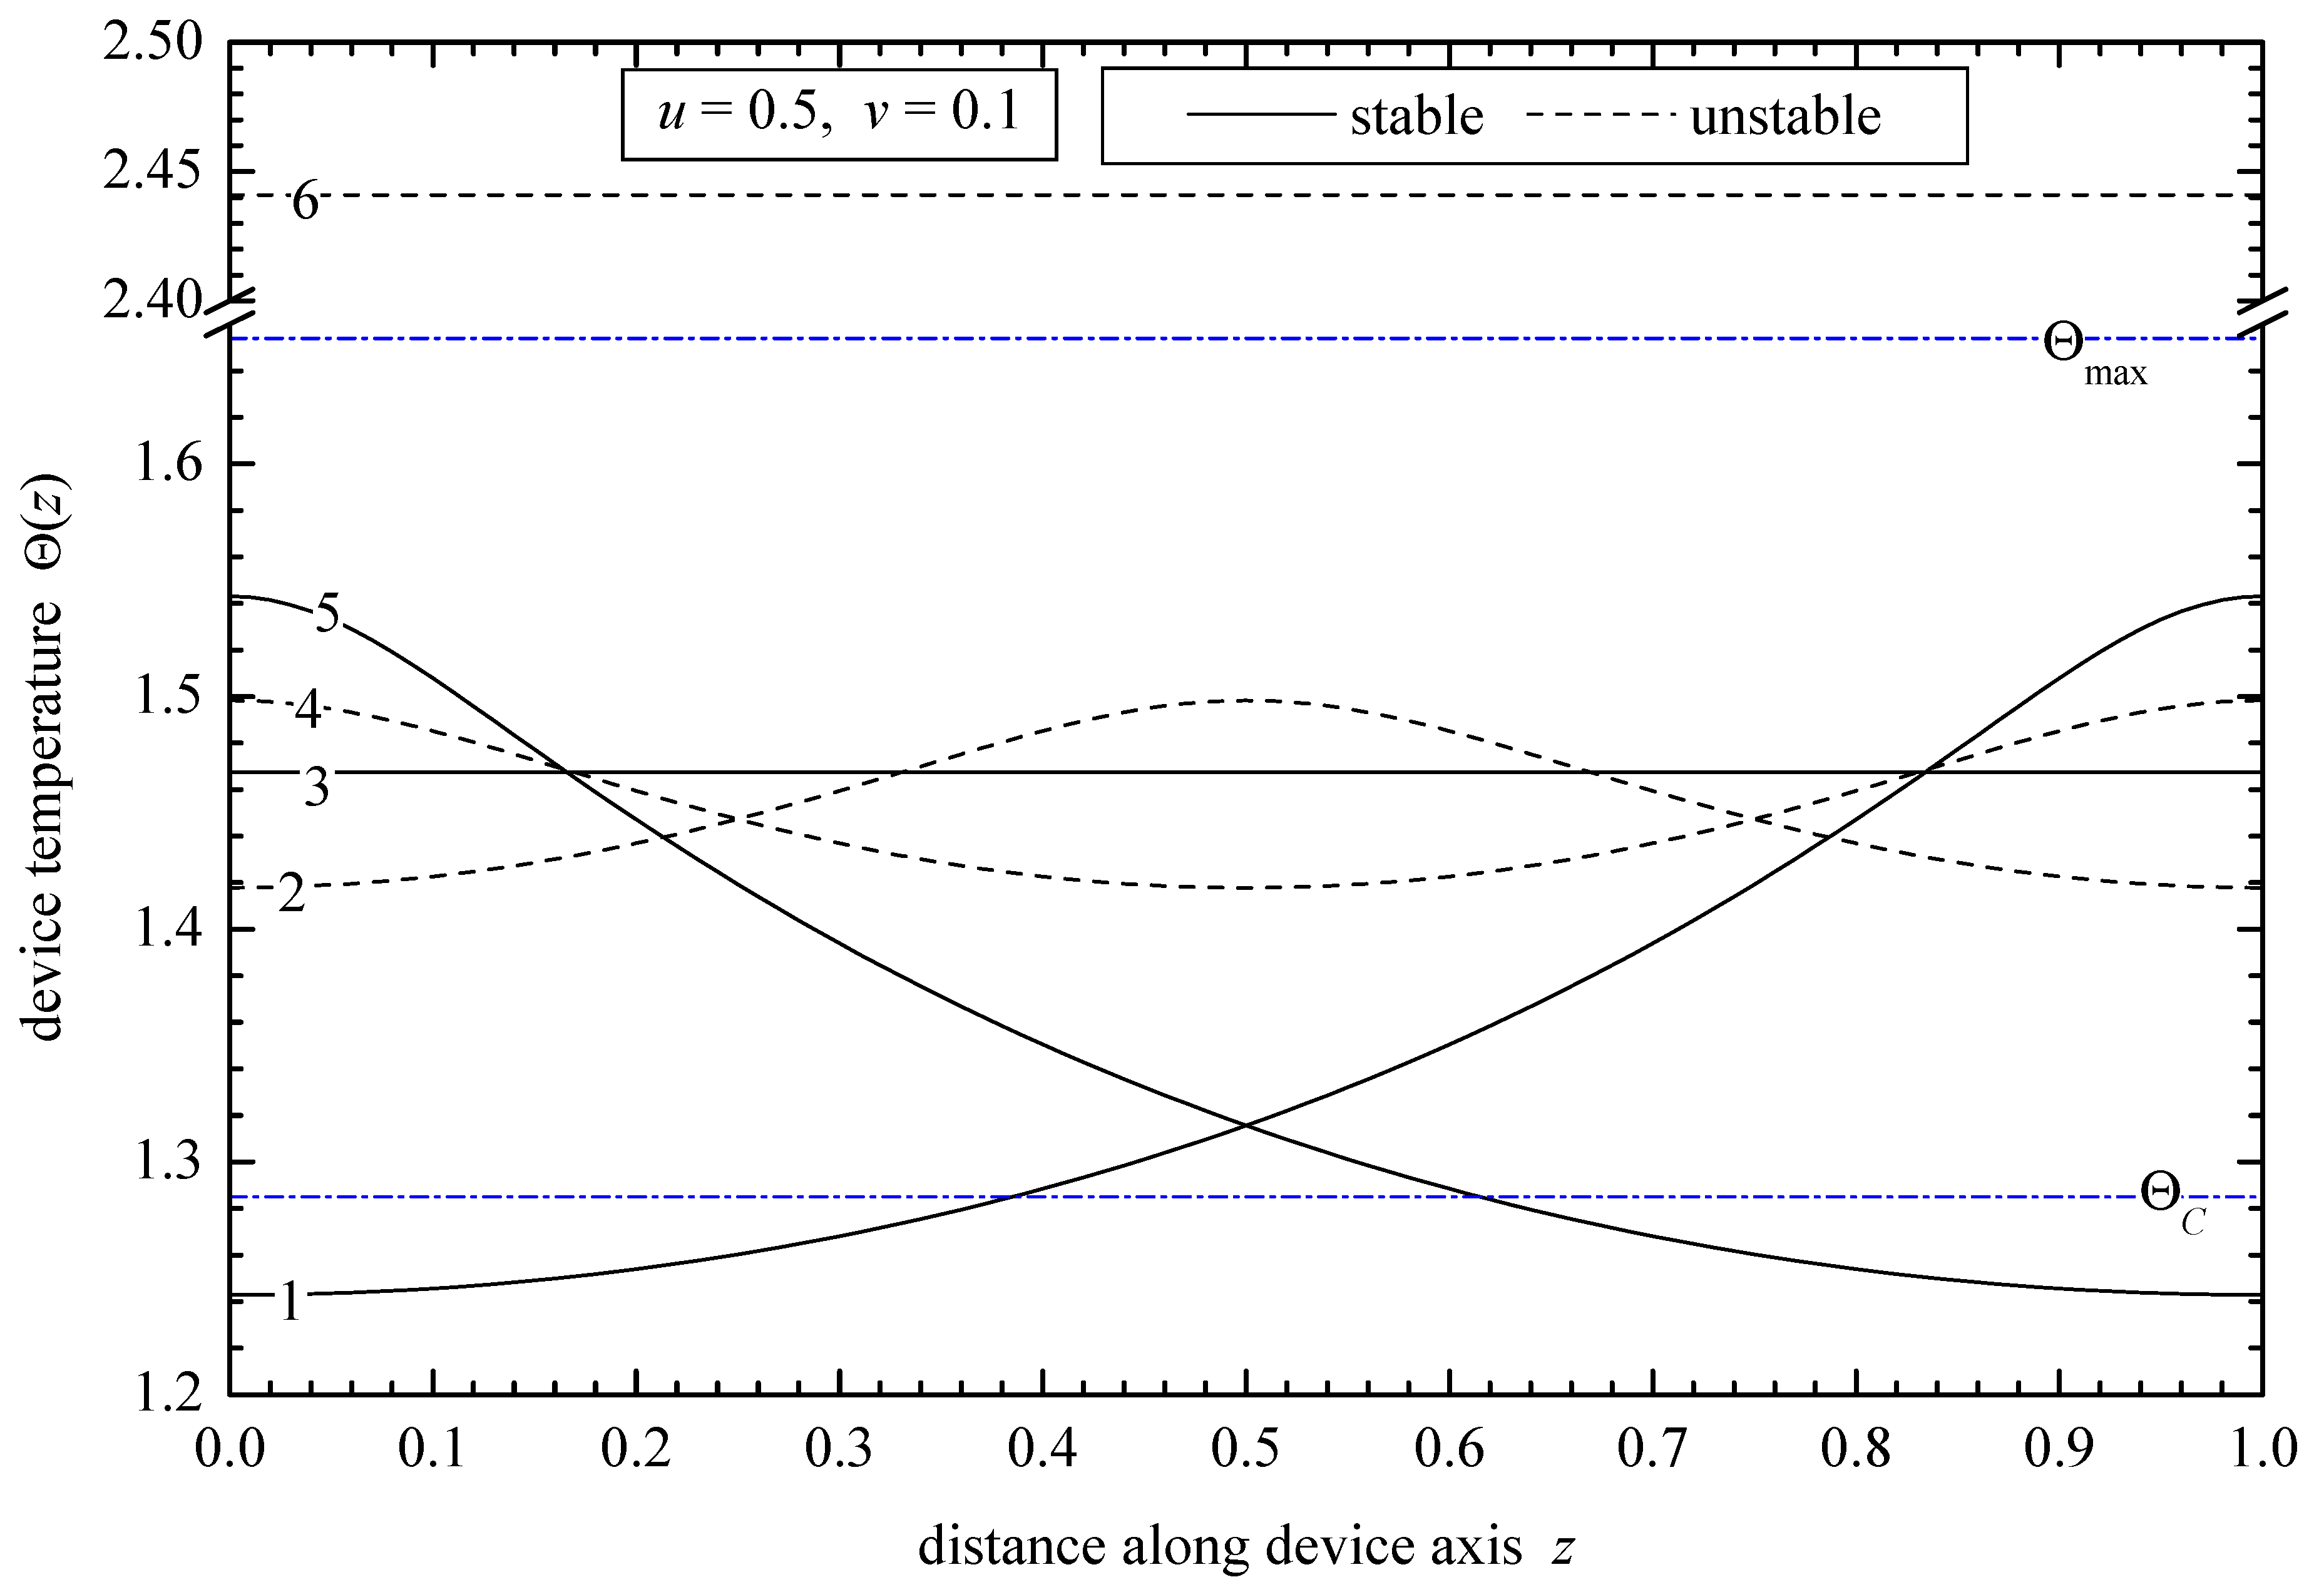
Figure 7.
Instability threshold formed by the singular points (●) for flash sintering. now stands for the furnace temperature which is no longer constant. The electric resistivity is given by the Arrhenius form in Equation (35). When the NTC effect is combined with Neumann boundary conditions, Equations (20) and (32) have the same uniform solutions.
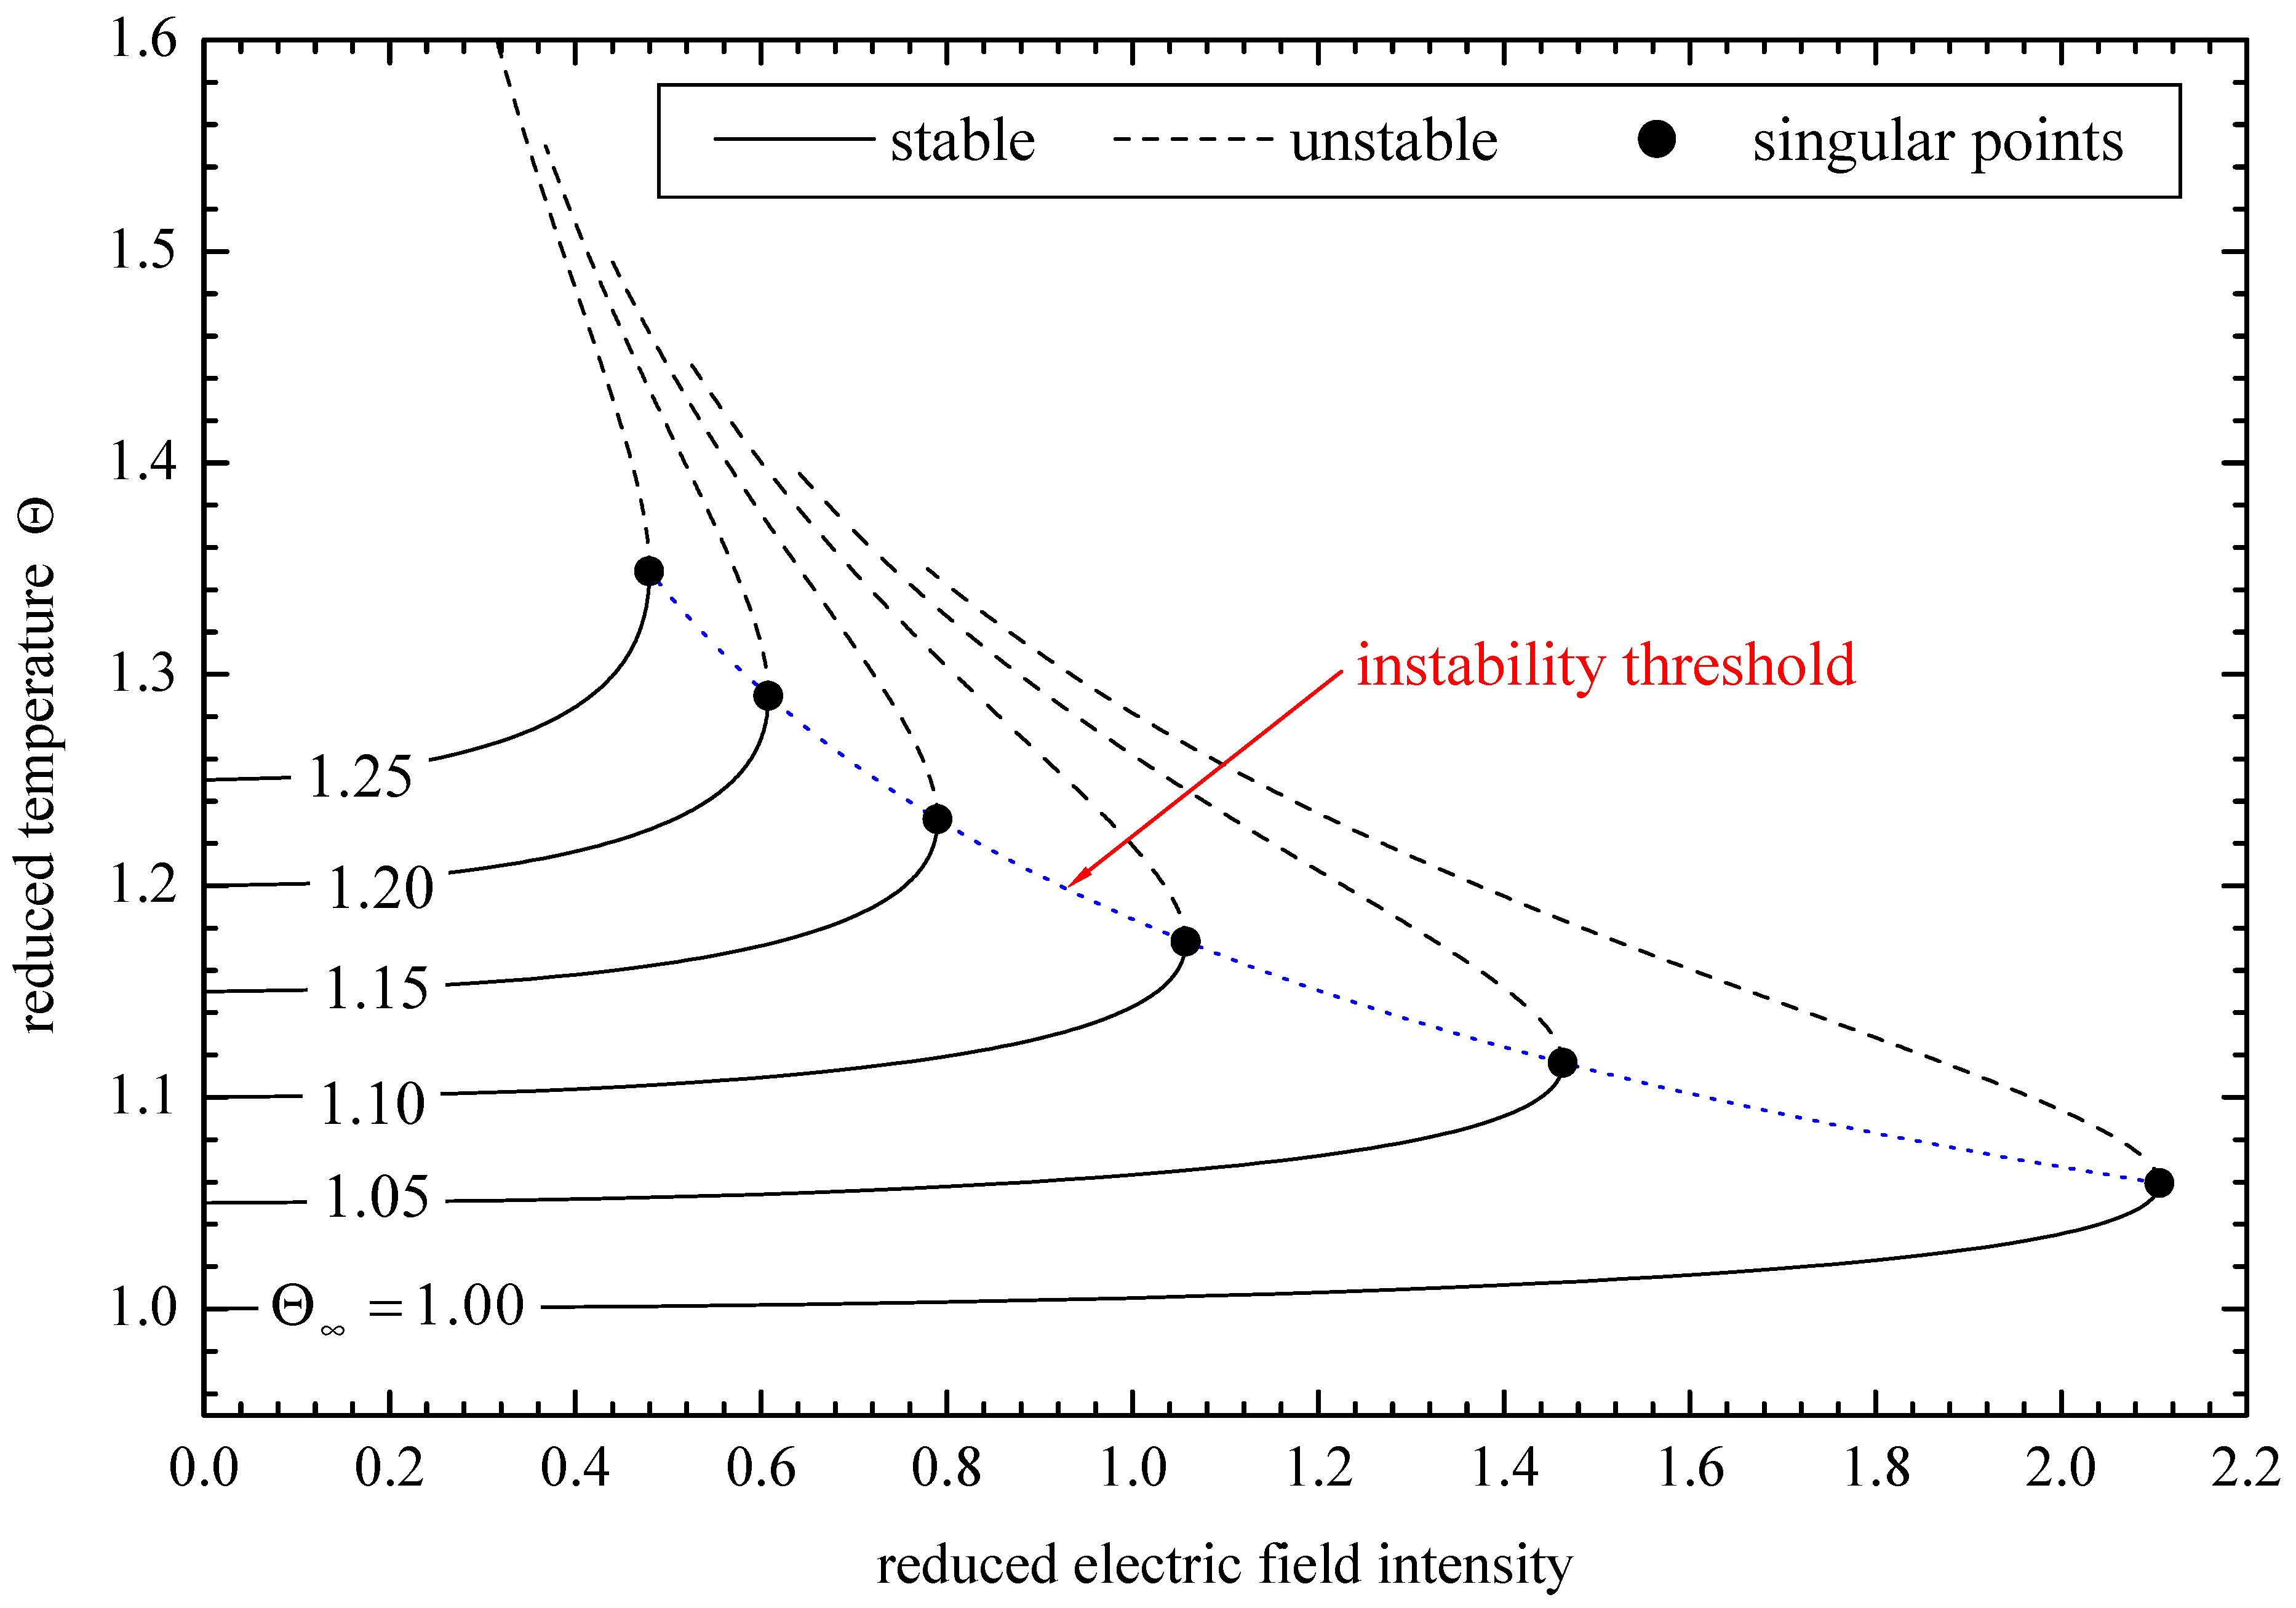
Figure 8.
Instability threshold for 3YSZ. Comparison with experimental data [49].
Figure 8.
Instability threshold for 3YSZ. Comparison with experimental data [49].
Figure 10.
Instability threshold for barium titanate. Comparison with experimental data [56].
Figure 10.
Instability threshold for barium titanate. Comparison with experimental data [56].
Disclaimer/Publisher’s Note: The statements, opinions and data contained in all publications are solely those of the individual author(s) and contributor(s) and not of MDPI and/or the editor(s). MDPI and/or the editor(s) disclaim responsibility for any injury to people or property resulting from any ideas, methods, instructions or products referred to in the content. |
© 2024 by the author. Licensee MDPI, Basel, Switzerland. This article is an open access article distributed under the terms and conditions of the Creative Commons Attribution (CC BY) license (https://creativecommons.org/licenses/by/4.0/).
Share and Cite
MDPI and ACS Style
Krikkis, R.N. Electrothermal Instabilities in Barium-Titanate-Based Ceramics. J 2024, 7, 153-168. https://doi.org/10.3390/j7020009
AMA Style
Krikkis RN. Electrothermal Instabilities in Barium-Titanate-Based Ceramics. J. 2024; 7(2):153-168. https://doi.org/10.3390/j7020009
Chicago/Turabian StyleKrikkis, Rizos N. 2024. "Electrothermal Instabilities in Barium-Titanate-Based Ceramics" J 7, no. 2: 153-168. https://doi.org/10.3390/j7020009