Article

Plasma Electrolytic Oxidation on Magnesium AZ31 with Sepiolite as Inhibitor Carrier for Improved Corrosion Protection

1
DECHEMA Research Institute, 60486 Frankfurt am Main, Germany
2
Department of Chemical and Process Engineering, Karlsruher Institut für Technologie, Kaiserstraße 12, 76131 Karlsruhe, Germany
3
Fraunhofer Institute for Ceramic Technologies and Systems IKTS, 01277 Dresden, Germany
*
Author to whom correspondence should be addressed.
Corros. Mater. Degrad. 2023, 4(3), 488-502; https://doi.org/10.3390/cmd4030025
Submission received: 19 July 2023 / Revised: 23 August 2023 / Accepted: 28 August 2023 / Published: 30 August 2023

Abstract

:
Plasma electrolytic oxidation (PEO) in an alkaline silicate electrolyte containing nanosized sepiolite fibers was carried out on magnesium alloy AZ31. The mineral fibers were loaded with different corrosion inhibitors and incorporated in situ during the PEO treatment. The composition and microstructure of the PEO coatings were investigated by SEM. It was shown that the fibers are located on the surface as well as inside the “weak spots” of the coating, i.e., pores and discharge channels. The fixation of the particles is caused by sintering due to the heat developed during the PEO treatment. Investigations using electrochemical impedance spectroscopy and linear sweep voltammetry in 0.01 M NaCl solution confirmed an improvement of the corrosion protection. The use of the inhibitors shifts the critical pitting potential in the anodic direction. Regarding efficiency, cerium-loaded sepiolite showed the best behavior by shifting the pitting potential by +0.9 V.

1. Introduction

Magnesium is a lightweight construction material with beneficial mechanical properties and low density, rendering it attractive to aerospace and automotive applications [1]. Its increased use would contribute significantly to a reduction in fuel consumption and hence CO2 emissions. However, due to the low standard potential of −2.372 V vs. SHE, it is very susceptible to corrosion [2]. Although a native oxide film is formed, the unfavorable Pilling–Bedworth ratio of 0.81 results in a mechanically unstable oxide [3]. The comparatively small passive range also precludes possible wide range applications [4]. Furthermore, magnesium compounds are soluble below pH 12 and permeable to water and hence not protective [5,6,7].
Plasma electrolytic oxidation (PEO) competes with other protection methods, like the formation of conversion layers, PVD/CVD, coating with polymers, or conventional anodizing. The formation of conversion layers has often been achieved with chromate, but this is toxic. PVD/CVD techniques are expensive and offer little protection against corrosion. Coating with polymers also offers only little protection due to the low hardness and thermal stability, so it is often used as a post-treatment for PEO. Passivation is more useful on Al and Ti substrates; on Mg alloys the protection is very weak. The PEO forms stable ceramic layers with better corrosion protection compared to the other techniques. Many PEO electrolyte systems for magnesium are known. Most use fluoride, chromate, aluminate, phosphate, silicate, titanium, or zirconium salts. Fluoride and chromate are not used due to their toxicity. Titanium and zirconium salts are not used due their relatively high price. Aluminate and phosphate require higher voltages for the PEO [8,9,10,11,12,13]. A silicate-based electrolyte was therefore used in this work. PEO is commonly used to protect magnesium from corrosion and the formation mechanism is well investigated [14,15]. This technique is mainly used for Mg, Al, and Ti alloys. A major difference from standard passivation techniques is the use of high voltages for the creation of plasma electrolytic discharges, which provide a plasma-assisted electrochemical conversion of the surface metal into a ceramic magnesia layer. PEO coatings generally provide good corrosion and wear protection; however, process-inherent discharge channels, pores, or cracks can be considered as weak points. Therefore, several attempts have been made to investigate the use of inhibitor-loaded nanocontainers, which were applied to magnesium in addition to polymer protective layers, sol–gel layers, or after the PEO procedure, even without the use of nanocontainers [16,17,18,19,20,21,22,23,24,25]. Likewise, numerous publications suggest the incorporation of nanoparticles without the inhibitors into PEO layers to improve the mechanical properties and/or the corrosion behavior, e.g., WO3, TiO2 Y2O3, Sb2O3, SiC, TiC, WS2, TiN [26,27,28,29,30,31,32]. Studies applying an in situ incorporation of inhibitor-loaded nanocontainers during PEO treatment are comparatively rare, e.g., halloysite nanotubes loaded with benzotriazole, molybdate, vanadate, or 8-hydroxychinoline [33,34] and zeolites loaded with cerium ions [35]. One reason may be the concern about high local temperatures during the plasma discharges, which might destroy organic inhibitors.
To protect magnesium against corrosion, inhibitors can be used to reduce the corrosion reaction. Inhibitors can be classified into different types. The main types are adsorption inhibitors and film-forming inhibitors. The adsorption-type inhibitors adsorb directly to the metal or the hydroxide layer. The adsorption leads to a displacement of water molecules and harmful ions, like chlorides from the surface. There are two types of film-forming inhibitors, passivating inhibitors and precipitation inhibitors. What is common to both is the capability of forming a barrier layer, which is widely used, e.g., for conversion coatings [36,37,38]. Table 1 shows some selected inhibitors by their main protection mechanism on magnesium. Anionic surfactants work mainly as adsorption-type inhibitors, but some of them will also form a precipitation layer, reacting with the magnesium ions. Numerous inhibitors have been tested for their effectiveness on various magnesium alloys [39,40]. Due to the alkalization at the magnesium surface, it may be hard to distinguish between non-oxidizing and precipitation inhibition. Thus, there is no distinction between the two in Table 1.
In this study neutralized phosphate esters were used because of their good inhibiting properties and temperature stability [43,45]. In addition, phosphate esters with 2-ethylhexyl groups are relatively stable to hydrolysis [45] and cost-efficient. Additionally, cerium(III) ions and an oxidation product of 1-dodedylamine are investigated in this study.
The mineral sepiolite was selected as a cheap nanocontainer carrying the corrosion inhibitors. It is a layered silicate with alternating layers [46]. This special structure yields excellent sorptive, adsorptive, and absorptive properties [47]. For this reason, sepiolite is used in both its modified and unmodified forms in numerous fields such as the food industry and chemical cleaning [48,49]. There are numerous deposits of sepiolite worldwide; thus, shortages are not expected [50].
This study investigates the in situ incorporation of inhibitor-loaded sepiolite as nanocontainers for inhibitors on Mg AZ31 and its influence on the resulting corrosion properties, suggesting that the corrosion resistance of the PEO layer can be significantly improved.

2. Materials and Methods

2.1. Loading of Sepiolite with Inhibitors

The sepiolite (Sigma Aldrich, MA, SUA the fibers are a few micrometers in length and around 40 nm in diameter) was loaded with ions by ion exchange or with organic molecules by filling its tunnel structure. Since the tunnel structure is covered with water molecules, the sepiolite was dried in a drying cabinet at 150 °C before loading.
The following compounds were chosen as inhibitors:
  • Cerium(III) ions
  • Phosphate ester
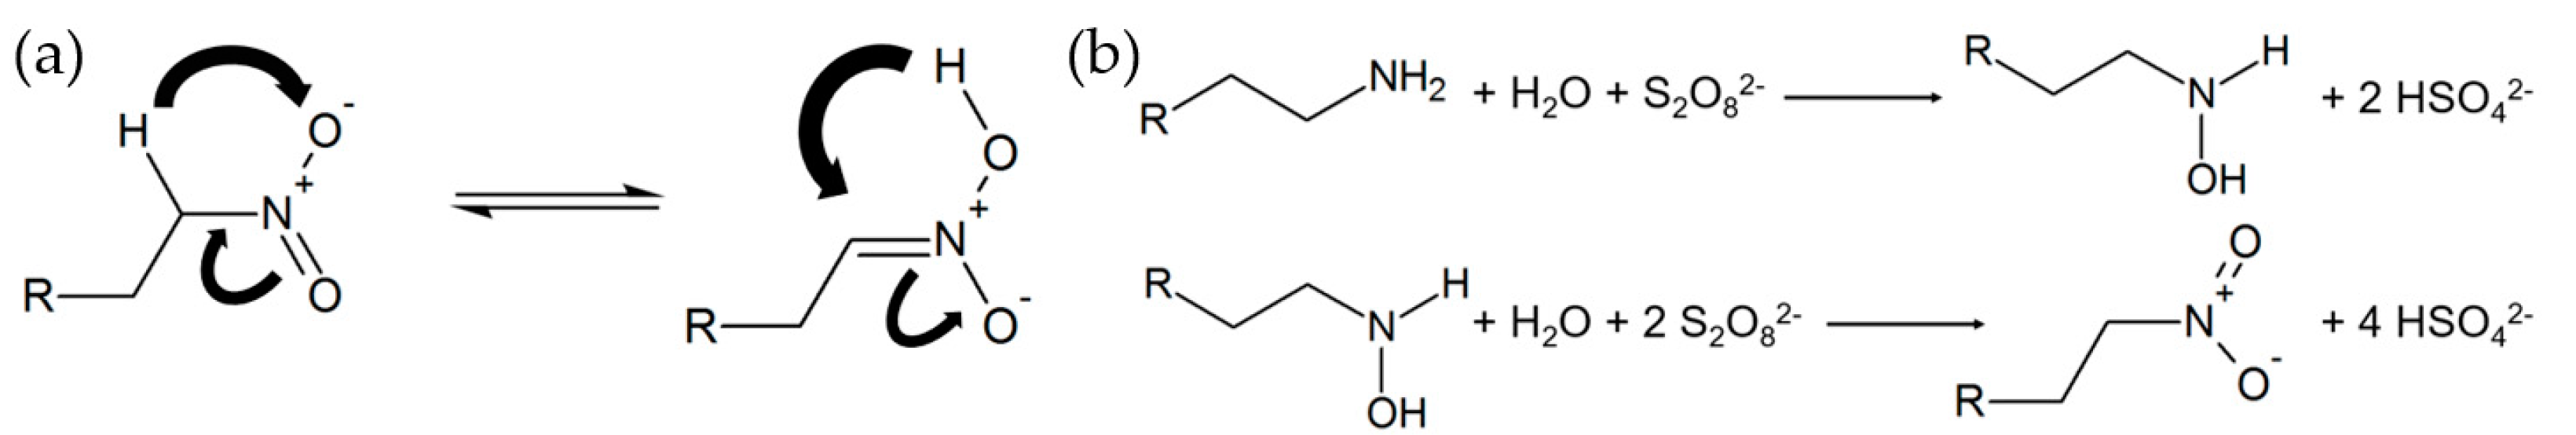
  • Oxidized 1-dodecylamine (1-nitrododecane)
For loading with cerium, first, the maximum loading capacity was determined. For this purpose, 1 g of sepiolite (Sigma Aldrich) was mixed with 100 mL of water of different concentrations of cerium nitrate (Acros Organics, Geel, Belgium). The cerium concentrations were 50, 100, 200, 500, 1000, and 2000 mg/L. These solutions were stirred with the sepiolite for 48 h while the solution was covered to prevent water evaporation. Then the cerium concentration was determined using ICP-MS. The maximum loading capacity in natural sepiolite was determined at 6.2 mg/g cerium ions.
Another class of inhibitors used here are tris(2-ethylhexyl) phosphate and Apricon OPE (Stockmeier Chemie, Bielefeld, Germany) as a 2-ethylhexyl ester. The tris (2-ethylhexyl) phosphate itself is not an inhibitor as a chargeless molecule, i.e., there are no surface-active groups. However, as a result of slow hydrolysis, it can react to active bis- and monoesters (Figure 1).
A total of 30 g/L of tris (2-ethylhexyl) phosphate (Merck, Darmstadt, Germany) was dissolved in petroleum ether 40/60. To the solution 150 g/L of dried sepiolite was added and stirred. The petroleum ether was then distilled off and the sepiolite was dried.
Apricon OPE (Stockmeier Chemie) is a mono bis ester mixture of 2-ethylhexyl phosphate. This acidic product was neutralized first. Since its water solubility is very high, it was incorporated into the sepiolite together with the tris(2-ethylhexyl) phosphate. 10 g/L Apricon OPE were dissolved in water and 3.5 g/L KOH (Merck Germany) were added, then the solution was dried and vacuum dried until a waxy product was formed. Totals of 20 g/L of neutralized Apricon OPE (dry) and 20 g/L of tris(2-ethylhexyl) phosphate were mixed and dissolved in ethanol. To the solution 200 g/L of dried sepiolite was added. After stirring, the alcohol was distilled off and the sepiolite was vacuum dried.
Since nitrate is often named as a good inhibitor, an attempt was made to create a storable form of it. In this case, an attempt was made to synthesize 1-nitrododecane, which can be stored in the sepiolite due to its limited water solubility. The starting point for the synthesis was 1-dodecylamine (Merck Germany), which was oxidized using sodium persulfate (Merck Germany). A total of 100 g/L 1-dodecylamine was added to deionized water containing 400 g/L sodium persulphate. The solution was stirred at 40 °C for a total time of 48 h until the pH dropped to 4. The solution was neutralized with KOH and stirred again at 40 °C. According to [51], the oxidation reaction should take place in the two steps schematically shown in Figure 2b.
Since acidic compounds are formed according to the reaction equations and the alkyl nitrate has a high acidity, the drop in the pH value indicated the progress of the reaction and also the formation of the nitro group (Figure 2a). A total of 30 g/L of the reaction product was dissolved in a mixture consisting of 70 mL/L acetone (Merck Germany), 30 mL/L distilled water, and 900 mL/L triethylamine (Merck Germany). To the solution 150 g/L of dried sepiolite was added and stirred. The solvent was then distilled off and the sepiolite was dried.
For the reader’s convenience, the following nomenclature is used in the results and discussion parts accordingly (Table 2).

2.2. Suspension Stability

The suspension stability tests were performed to assess the speed of phase separation when sepiolite was added to the PEO electrolyte. A total of 5 g/L of loaded or unloaded sepiolite was added to the electrolyte (10 g/L KOH (Merck Germany); 10 g/L Na2SiO3 (Sigma Aldrich)). The mixture was dispersed in an RZ3 glass rosette cell with ultrasound treatment for 10 min. Here, the ultrasonic finger Bandelin HD 2200 Sonoplus was used, which was operated at 60% of the device power (120 W). The dispersion was filled into a glass cylinder, enabling the quantification of the phase separation. The actual height h of the nearly particle-free phase boundary was determined weekly over a period of 28 days and compared to the initial height h0 to estimate the suspension stability.

2.3. Leaching Tests

The leaching test was established to assess the amount of phosphorus inhibitors released into the electrolyte by sepiolite C and sepiolite D. The measurements were carried out using mass spectrometry with inductively coupled plasma (ICP-MS). The samples of the electrolyte were analyzed regarding the phosphorus concentration. The PEO electrolyte with cerium as an inhibitor on sepiolite was not tested since it can be assumed that cerium does not dissolve in a strongly alkaline environment.
For the measurement, the PEO electrolyte was mixed with 5 g/L of the loaded sepiolite (C and D) and dispersed for 10 min using a Bandelin HD 2200 Sonoplus ultrasonic device with ultrasonic finger operating at 120 W. Volumes of 10 mL of the electrolyte were removed in the initial state and after 1, 2, 3 and 7 days were placed in centrifuge tubes. Immediately after the sample was taken, the sepiolite was centrifuged off to prevent further inhibitor release.

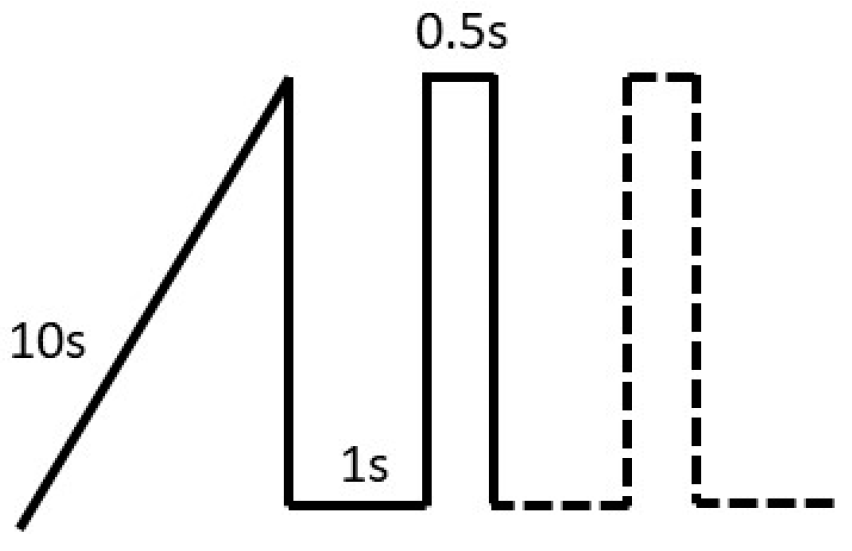
2.4. Plasma Electrolytic Oxidation

For the PEO process, rectangular magnesium AZ31 sheets (70 mm × 20 mm × 1.8 mm) were cleaned with Gardoclean® S5165 (Chemetall, Budapest, Hungary) and pickled with Gardoclean® T5491 (Chemetall). Between the pretreatment steps the sheets were rinsed with distilled water. The sheets were installed in an additively manufactured acrylic sample holder to achieve a constant sample area of 6.6 cm2. The nominal chemical composition of the material is shown in Table 3. The PEO electrolyte used consisted of 10 g/L KOH (Merck Germany) and 10 g/L Na2SiO3 (Sigma Aldrich) with a conductivity of 54 mS cm−1 measured by the handheld conductivity measuring device 304 series from VWR. The electrolyte temperature was kept constant at 20 °C using a Lauda Ecoline Staredition RE207 thermostat. Platinized titanium served as the counter electrode. The PEO tests were run on a DC power supply EA-PS 8720-15 (Elektro-Automatik GmbH, Viersen, Germany). The current regime used is shown in Figure 3. The PEO process started with an initial ramp of 10 s until a current density of 20 mAcm−2 was reached, afterward pulsing sets in with pulse durations of toff = 1 s (j = 0 mAcm−2) and ton = 0.5 s (20 mAcm−2). The PEO process lasted 1000 s in total.
The PEO mode had already been used in earlier studies by the authors (see, inter alia, M. Schneider et al. [52]) and results in thin (1–3 µm) open porous PEO layers, which should be suitable to study the effect of the additional active corrosion protection by incorporated inhibitors.

2.5. Electrochemical Impedance Spectroscopy

For the EIS measurements, the samples were abraded on the back side for electrical connection and inserted into the electrochemical cell. A conventional 3-electrode setup was used and 400 mL of 0.01 M NaCl (VWR Chemicals) solution was filled in. The area exposed to the electrolyte was 0.785 cm2. A saturated calomel electrode was used as reference and a platinum Elektrode as counter electrode. EIS spectra were recorded hourly using a Zahner Zennium potentiostat for a period of 24 h at room temperature. The frequency range was set between 50 kHz and 10 mHz with an amplitude of 10 mV.

2.6. Linear Sweep Voltammetry (LSV)

The LSV measurements were carried out using a special combination test cell exposing an area of 0.11 cm2 of the anodized Mg AZ31 (working electrode). Platinized expanded Ni mesh was used as counter electrode and a saturated calomel electrode was used as reference electrode. Corrosion tests were performed in 0.01 M NaCl solution adjusted to a pH of 7.6. The potential was scanned between −2 V and +1 V vs. the saturated calomel electrode. Each type of PEO coating was measured 3 times. The sweep rate was dE/dt = 1 mVs−1. The measurements started immediately after immersion of the samples in the electrolyte.

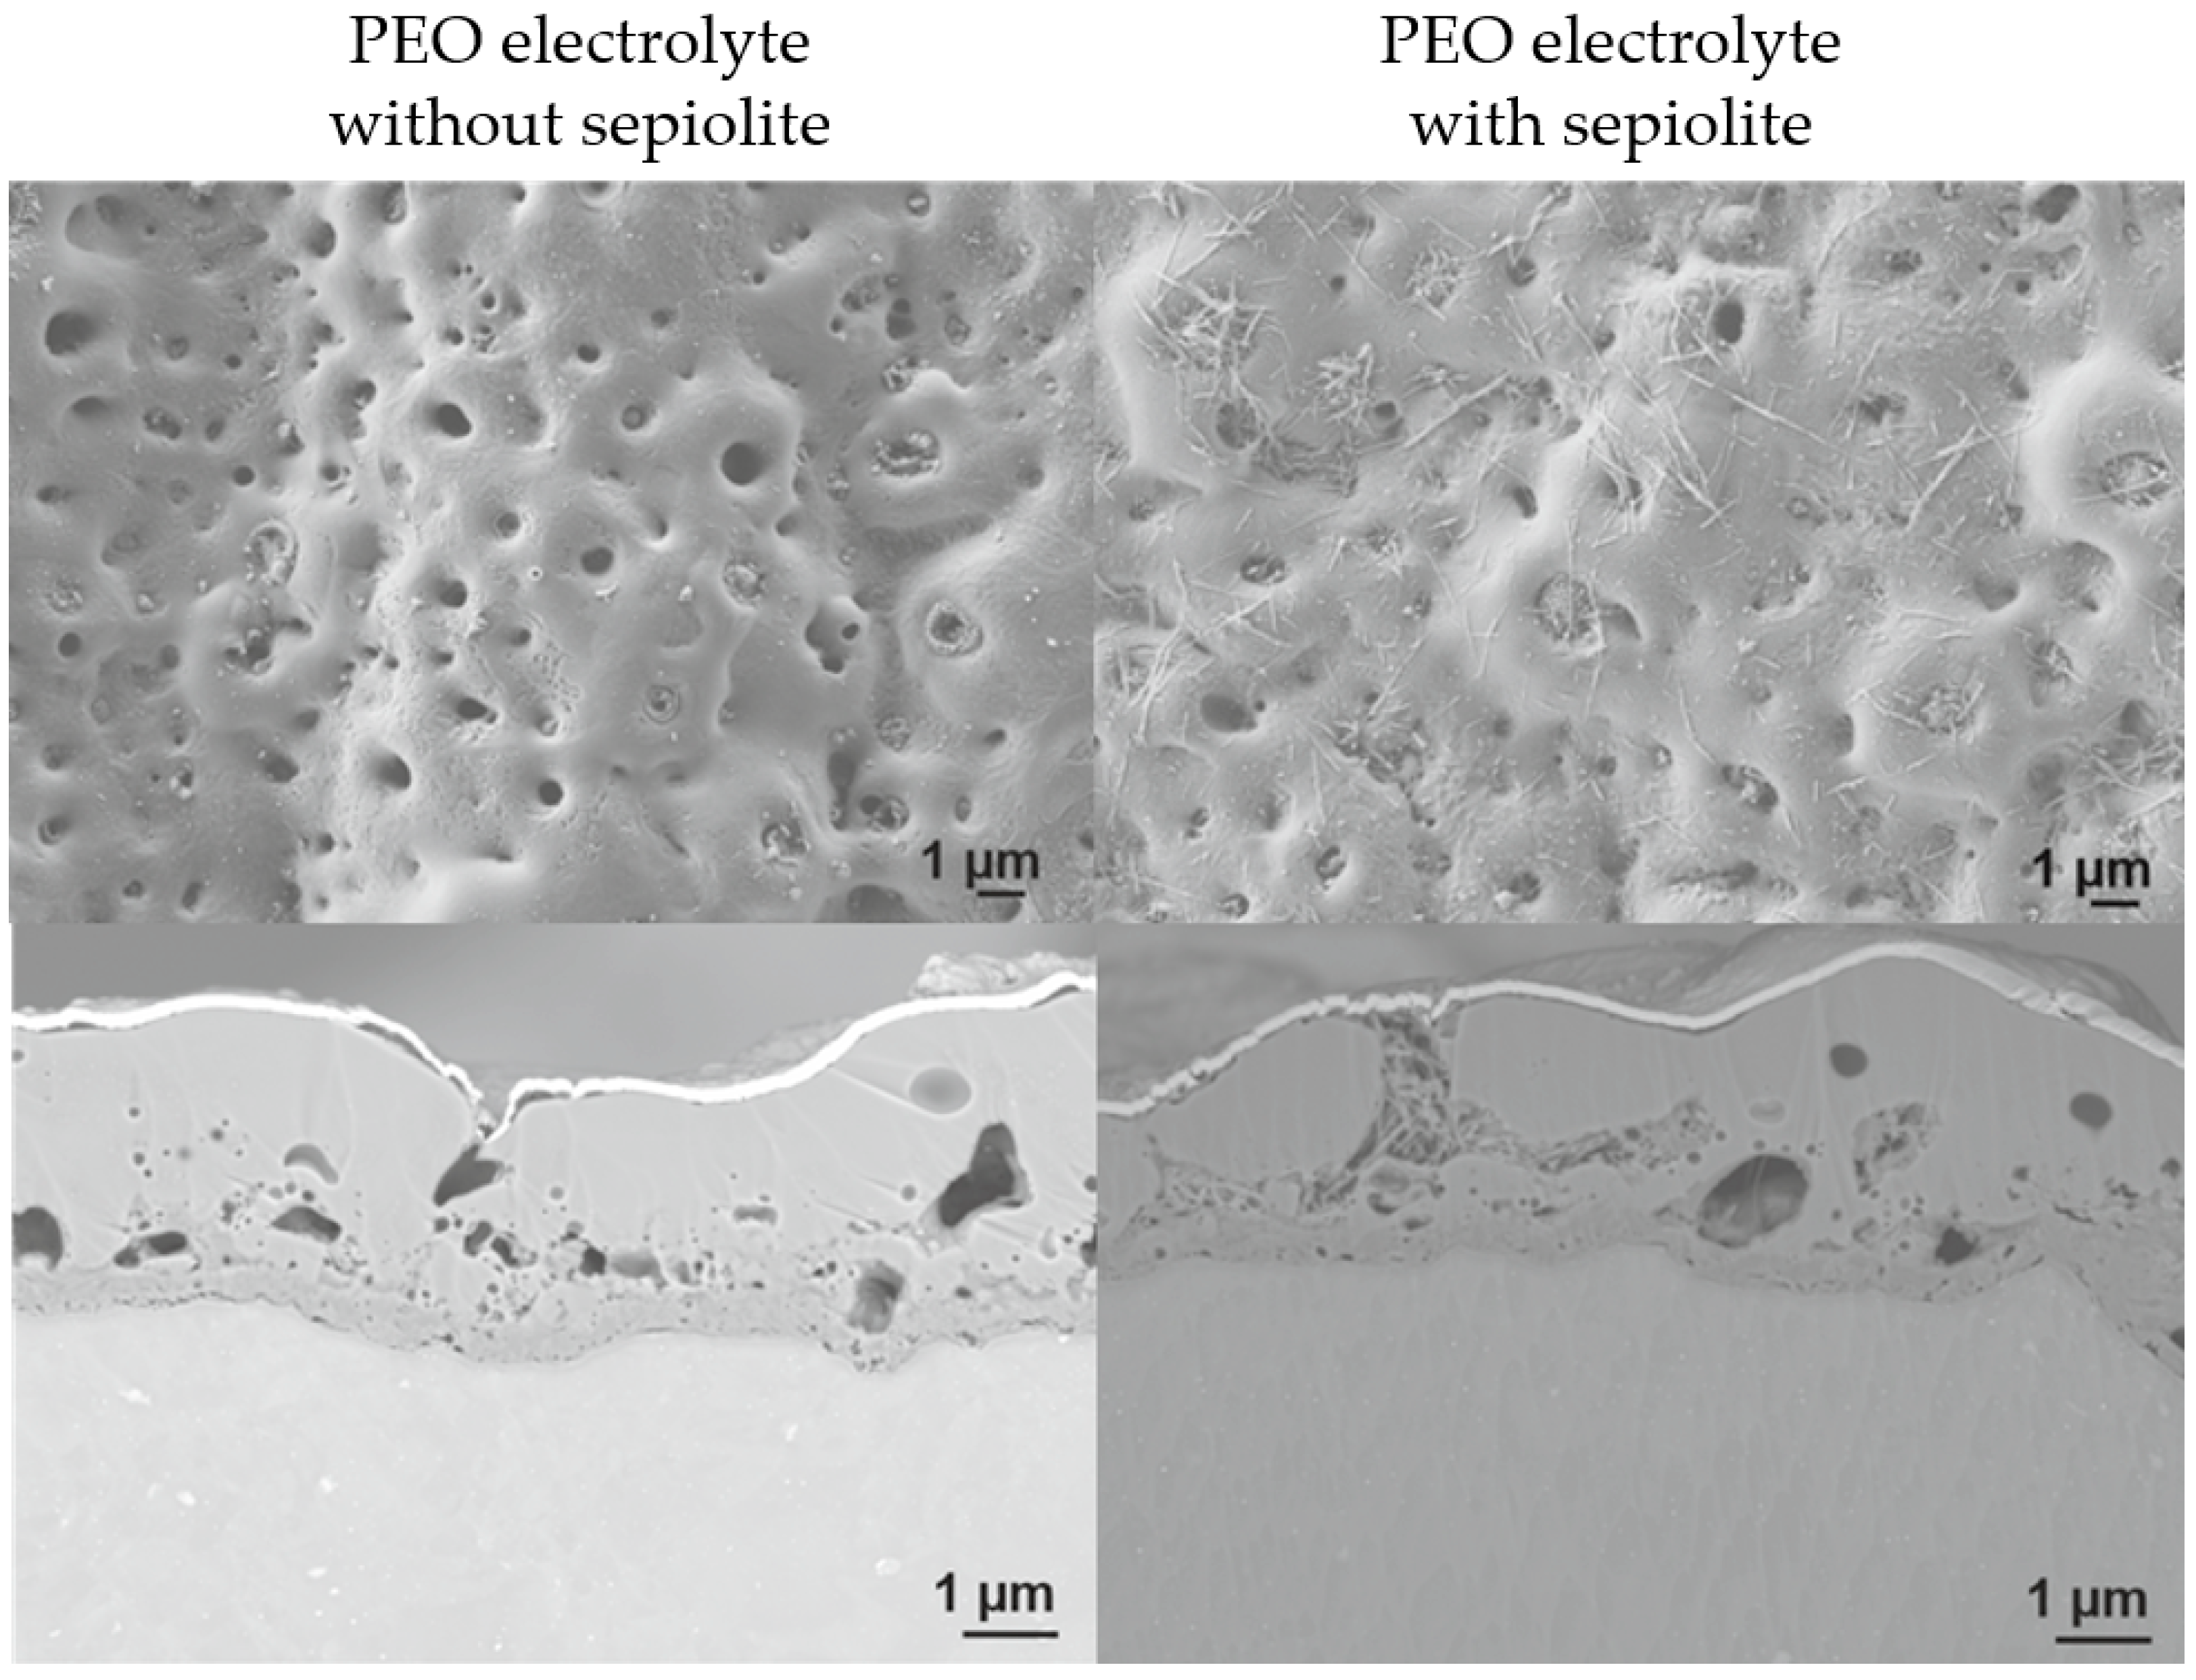
2.7. Scanning Electron Microscopy (SEM)

The investigation of the morphology and the cross-section of the PEO layer was carried out with an FEGSEM ZEISS Crossbeam 550 in secondary electron mode. The acceleration voltages were 2 and 3 kV, respectively. The cross-sections of the samples were made by argon ion beam preparation (GATAN PECS II).

3. Results and Discussion

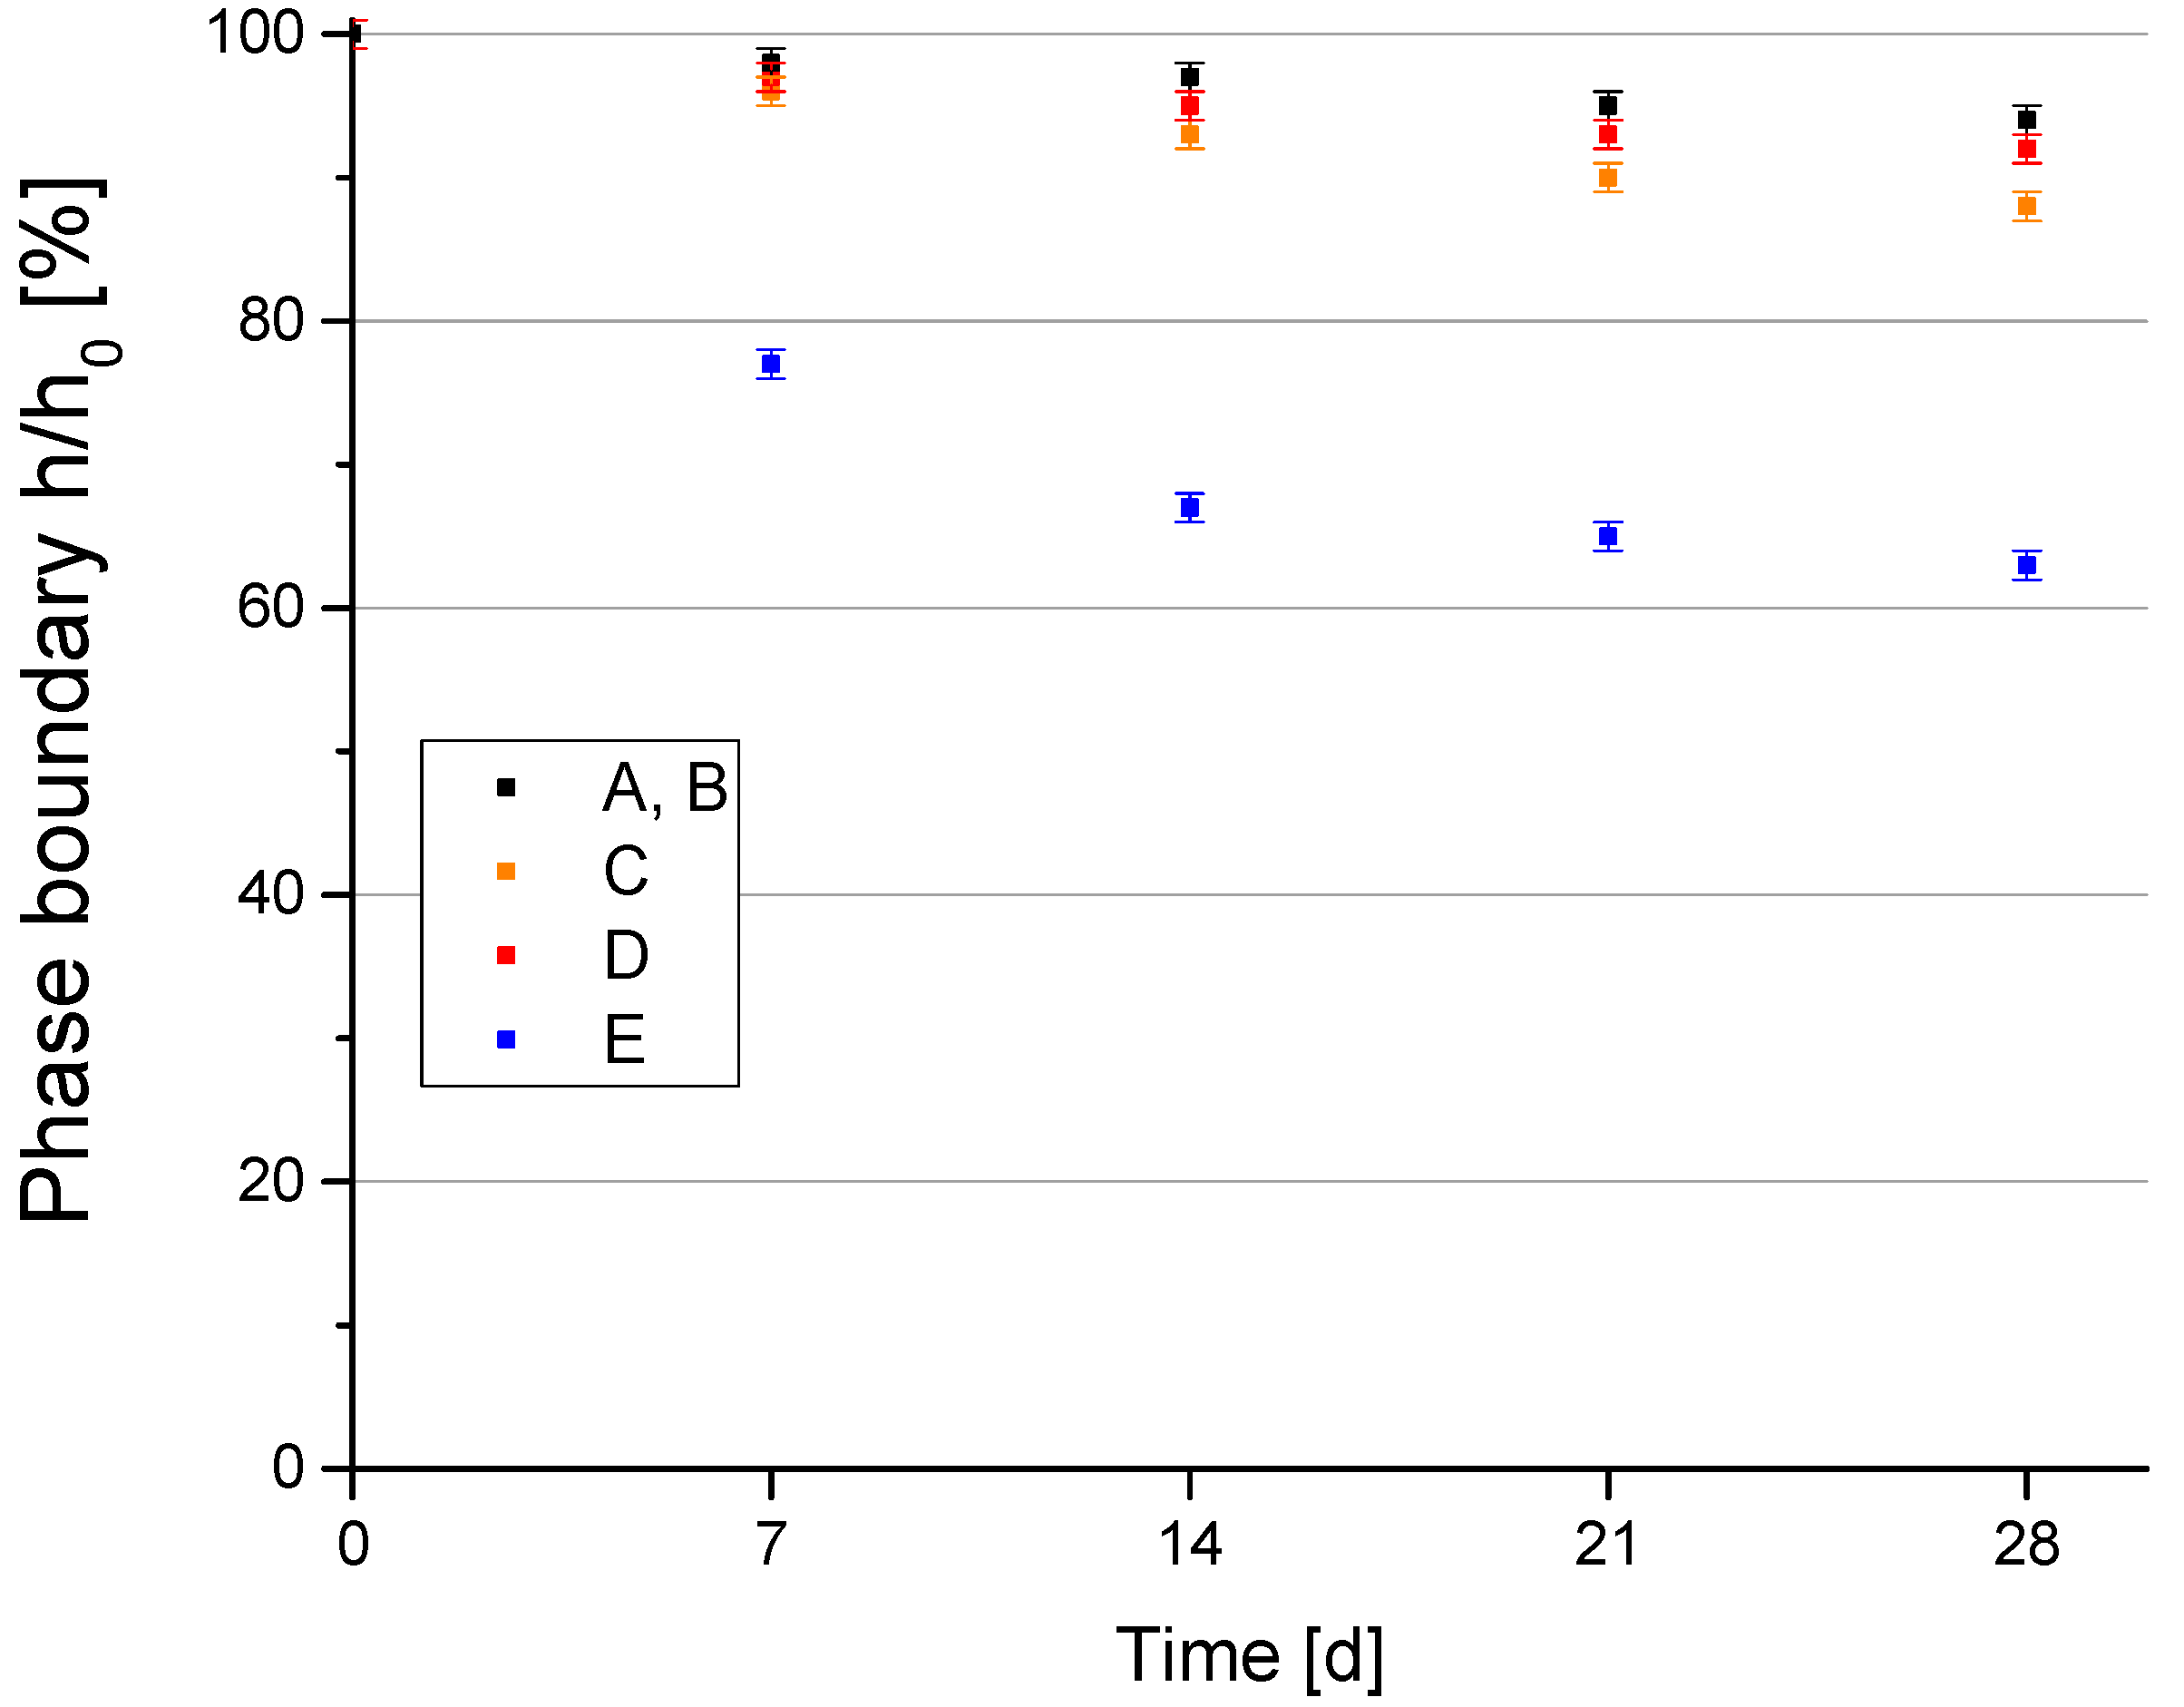
3.1. Suspension Stability
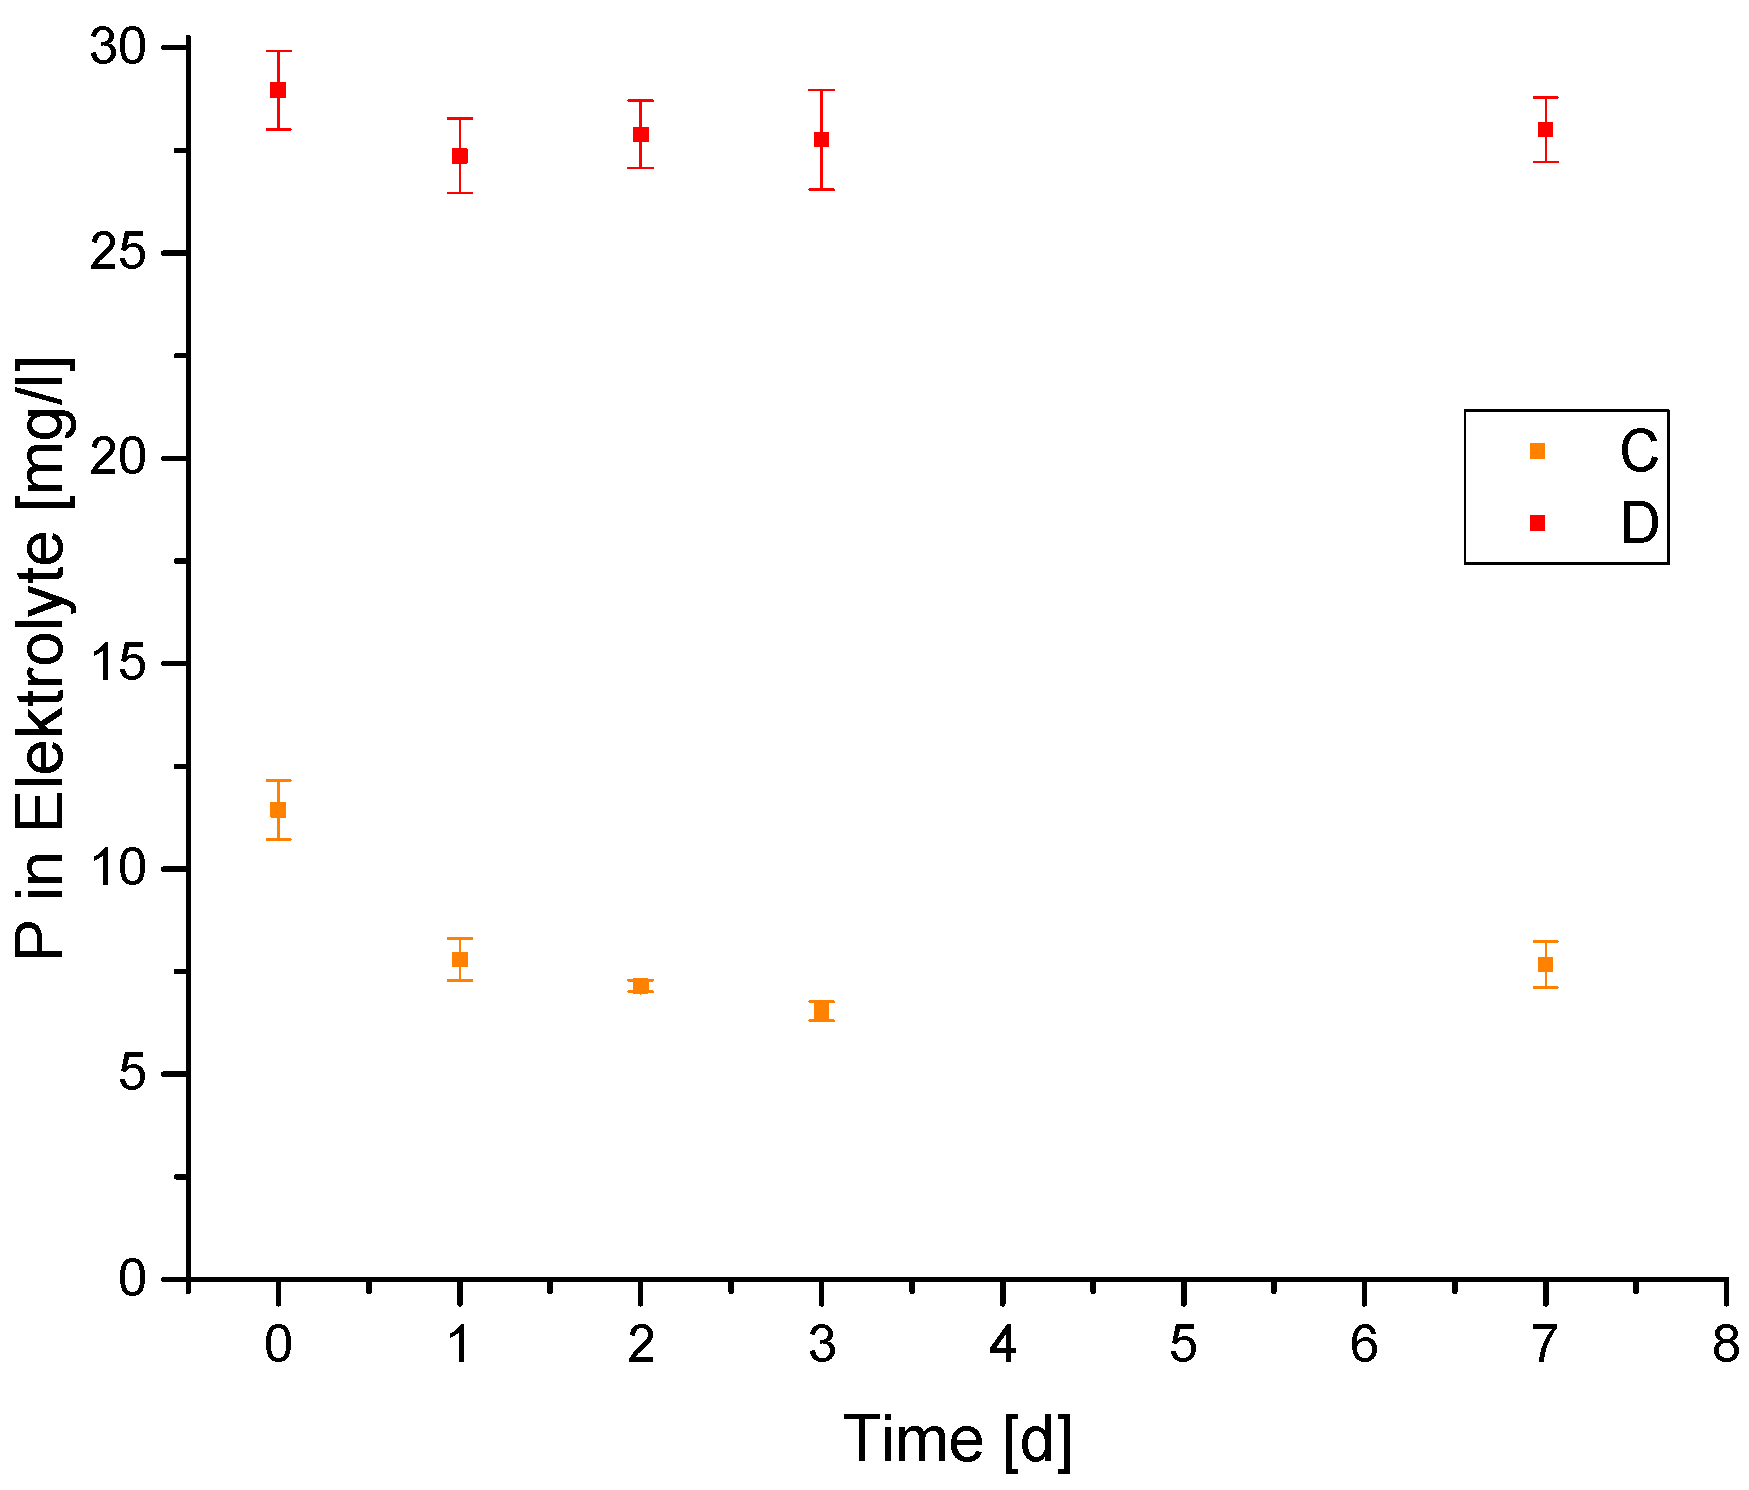
In Figure 4 the normalized separation height h/h0, given as the ratio of the height h of the determined phase boundary between dispersed phase/clear phase and the initial volume height h0 in percent of total volume, as a function of time is displayed. Over a measuring period of 28 days at room temperature all suspensions were highly stable. After 28 days the percentage of the nearly particle-free phase was <10% for suspensions containing sepiolite types A–D, whereas for sepiolite dispersion E the ratio of the clear phase was around 38%. However, if sepiolite is added just before the PEO treatment, the stability for all used suspensions is assured.

3.2. Leaching Tests

In Figure 5 the evaluation of the phosphorus concentration for the phosphate ester-based sepiolite/inhibitor systems (i.e., C and D) over time is displayed.
The phosphorus concentration in the electrolyte is a measure for the loss of inhibitor. The results showed a loss of 41% for sepiolite D and 12% for sepiolite C.
As expected, a significantly lower amount of inhibitor went into the electrolyte from sepiolite C compared to sepiolite D because of the good solubility of the mono and bis ester.

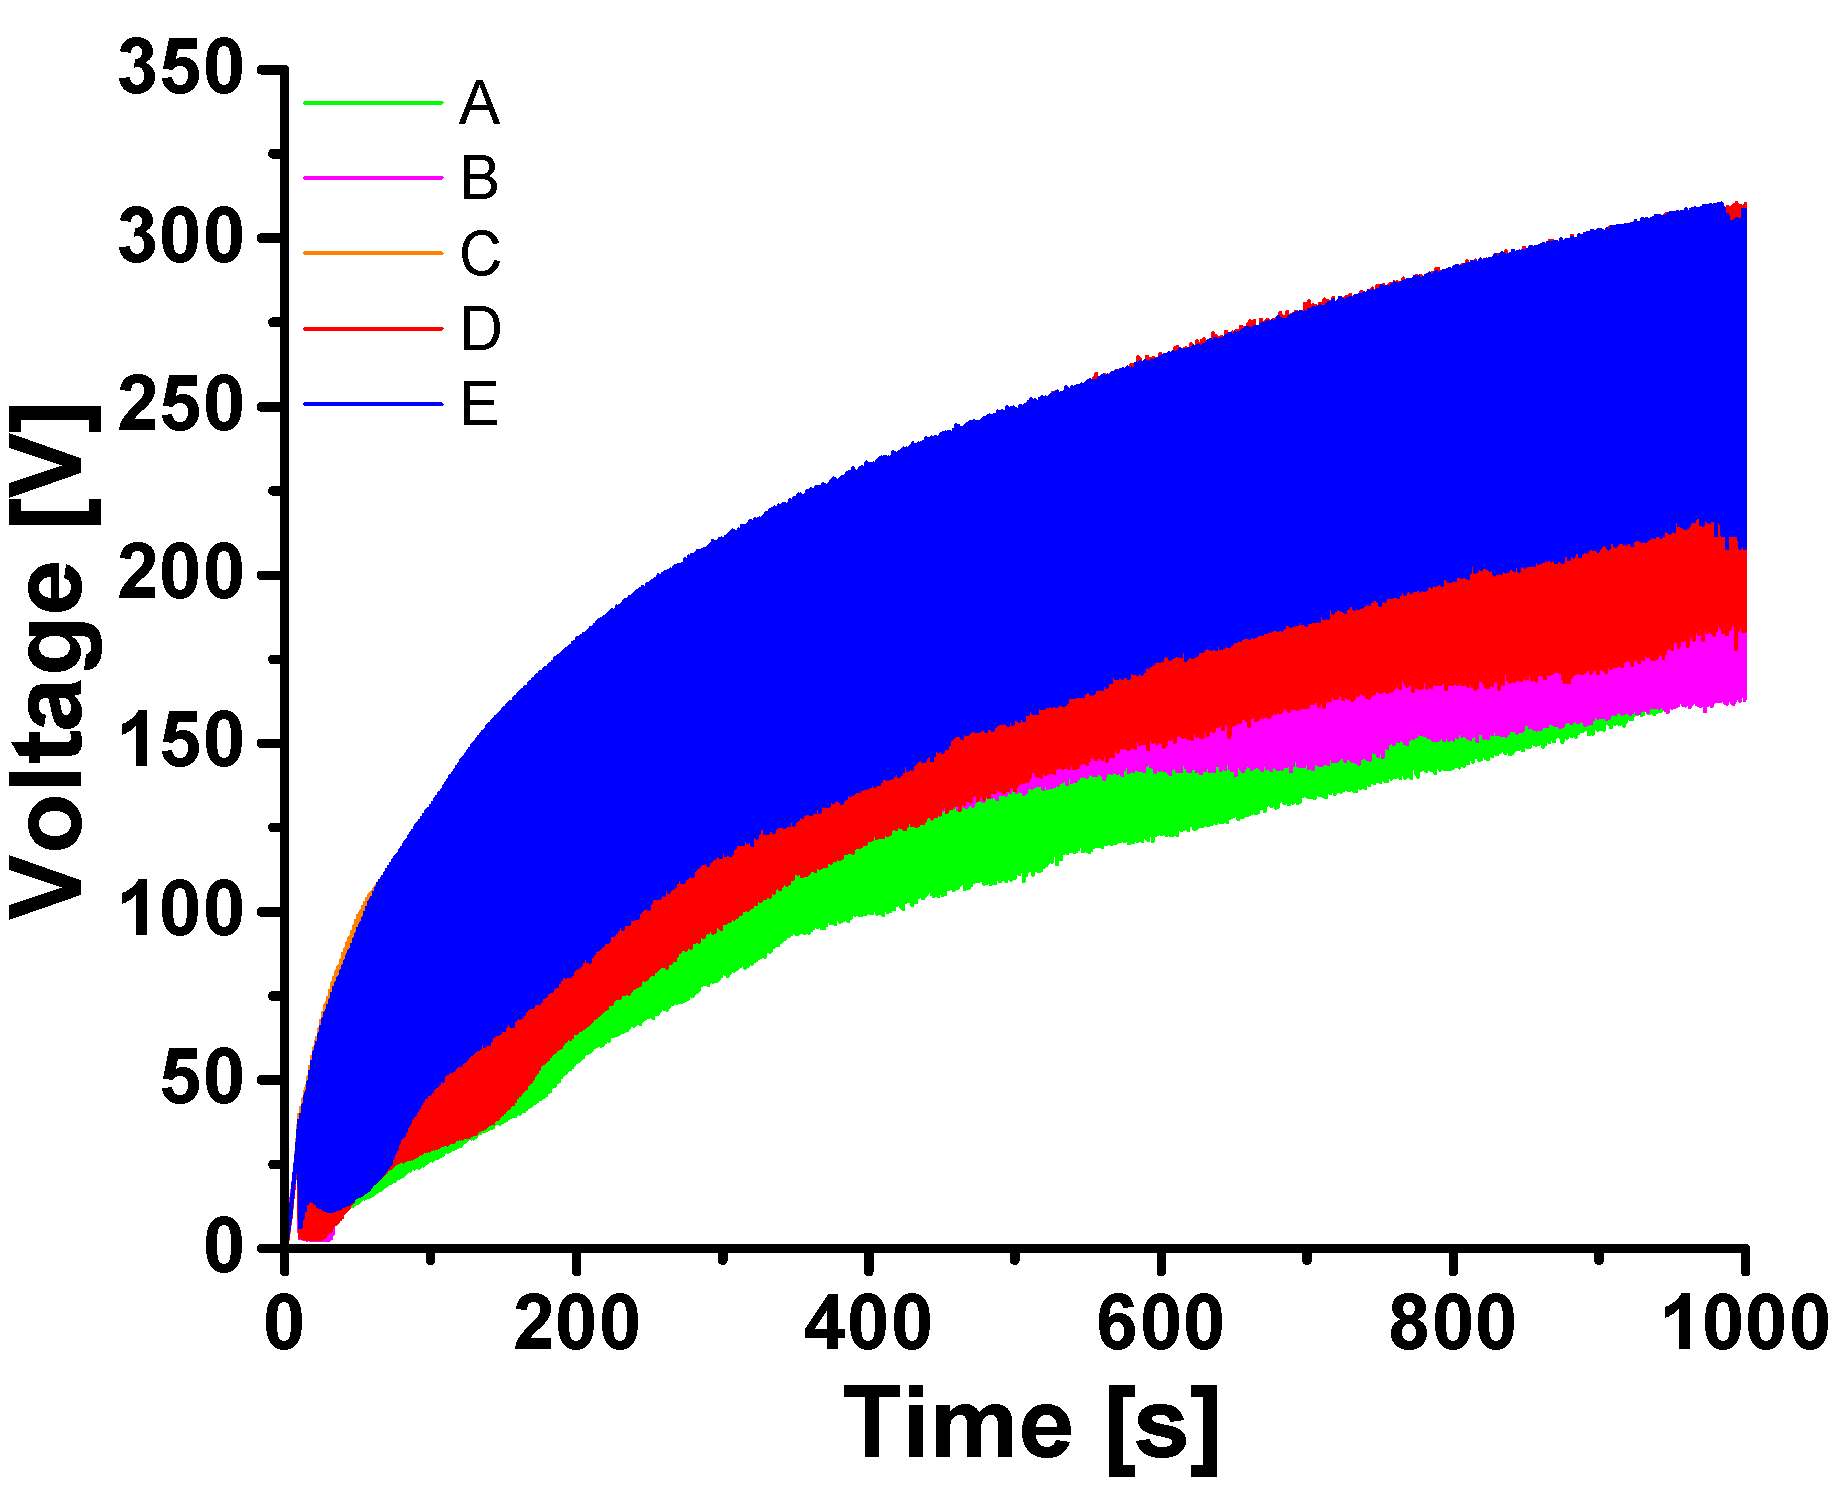
3.3. Plasma Electrolytic Oxidation

In Figure 6 the time-dependent voltage developments of the PEO experiments carried out in the different electrolytes are shown. Here, the voltage transient appears as a broad band since the (graphical) time resolution is not high enough to show individual cycles where the potential jumps between a current sustaining and a relaxation potential. The difference in the voltage between ton and toff depends on the dominating kind of overvoltage.
For reference, curve A shows the PEO in an electrolyte without sepiolite. The curves B-E are experiments with (inhibitor-loaded) sepiolite in the electrolyte. In general, the voltage values of the tests in electrolytes with sepiolite were higher than those in sepiolite-free electrolytes. This result corresponds to the considerations made in [53]. The morphology of the PEO layers is presented in Figure 7 by selected surface and cross-sectional SEM micrographs. On the left-hand side a sample anodized in the electrolyte without sepiolite is shown, while on the right-hand side a sample after PEO treatment in the sepiolite-containing electrolyte is depicted. Sample B was selected as a representative example, since the morphological characteristics of the samples were similar for all the electrolytes containing sepiolite.
The ceramic-like but porous surface structure of the PEO layers anodized in the sepiolite-free electrolyte and in the sepiolite-containing electrolyte resulted from the appearance of microdischarges during the PEO treatment. The pore size varied in the micrometer range. The cross-sections of the PEO layers show the layer structure, consisting of a thin inner layer and a thicker but more porous outer layer. The inner layer shows small, closed pores, and the outer layer shows open pores (discharge craters).
In sample B, anodized in electrolyte with sepiolite, the sepiolite fibers appear to be on the surface and inside the discharge craters. The distribution of sepiolite is inhomogeneous and the surface is not completely covered. Likewise, not all pores are filled with sepiolite. This concerns a part of the closed pores and open pores with a pore mouth diameter similar to or smaller than the sepiolite particles. Also, not all larger pores or craters are completely filled with sepiolite. This applies to both open and closed pores. The analysis of the incorporation mechanism and evidence of incorporated sepiolite by EDX analysis was already published by Schneider et al. [53].

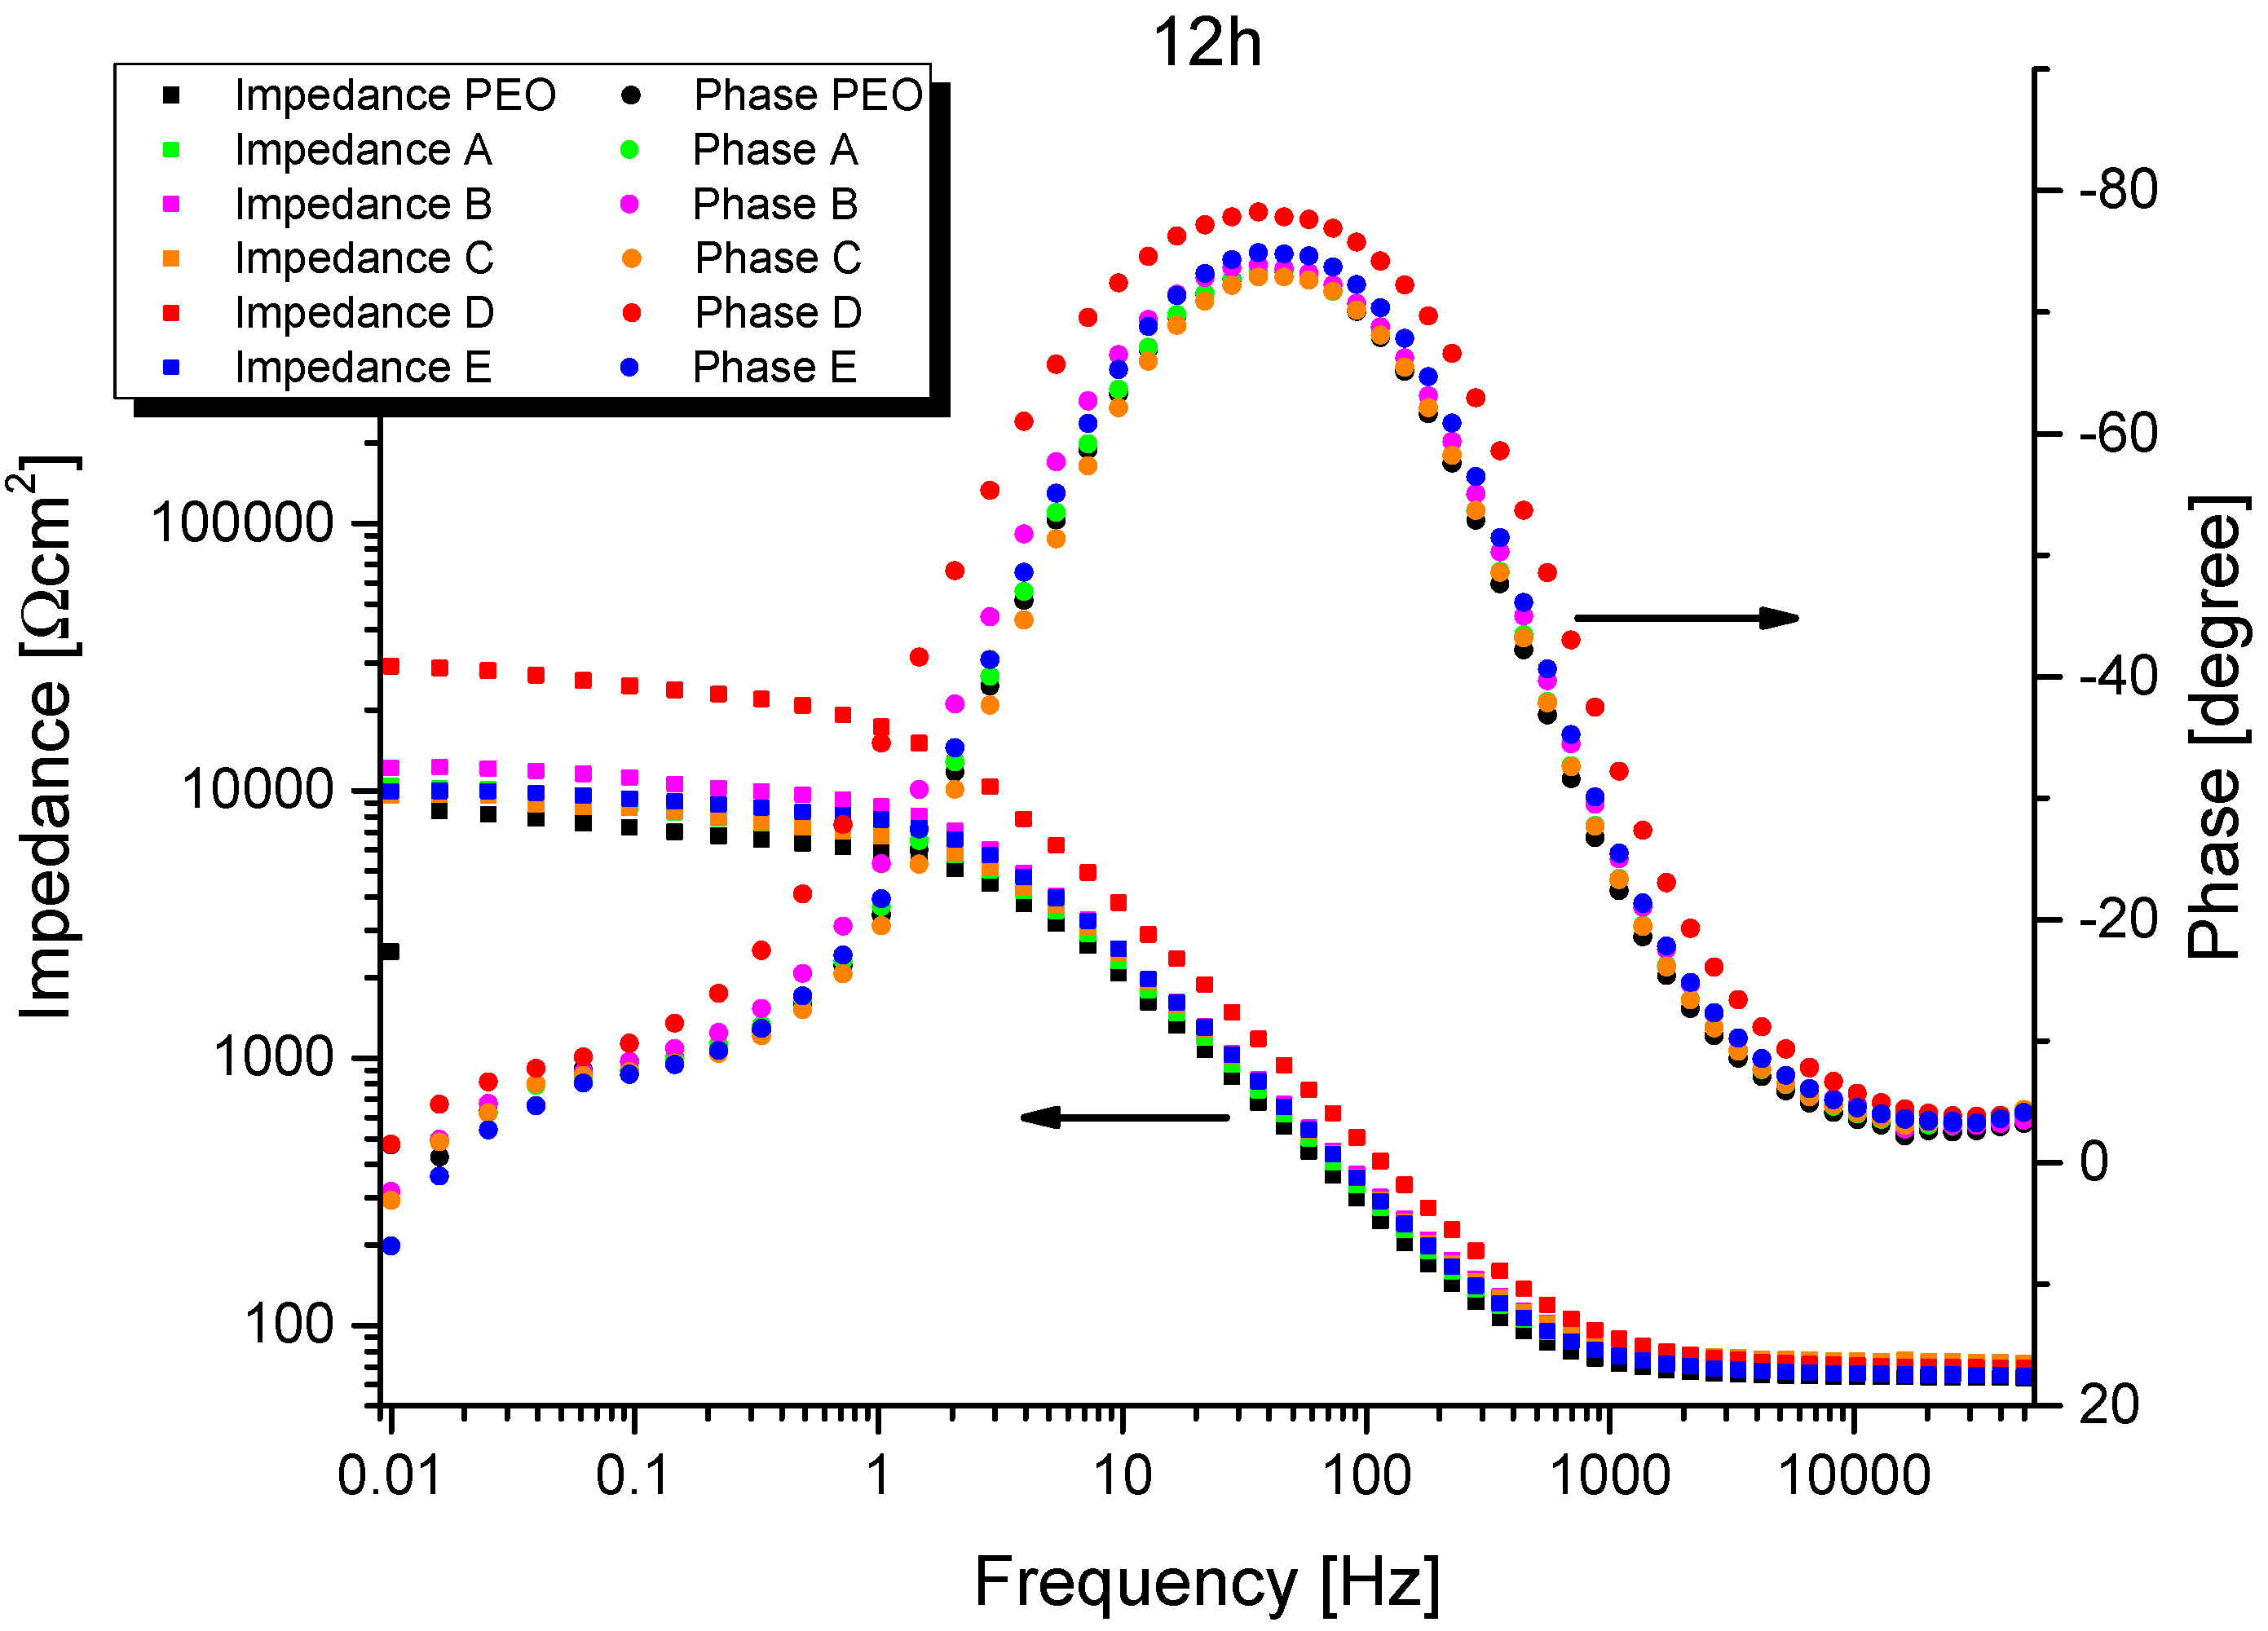
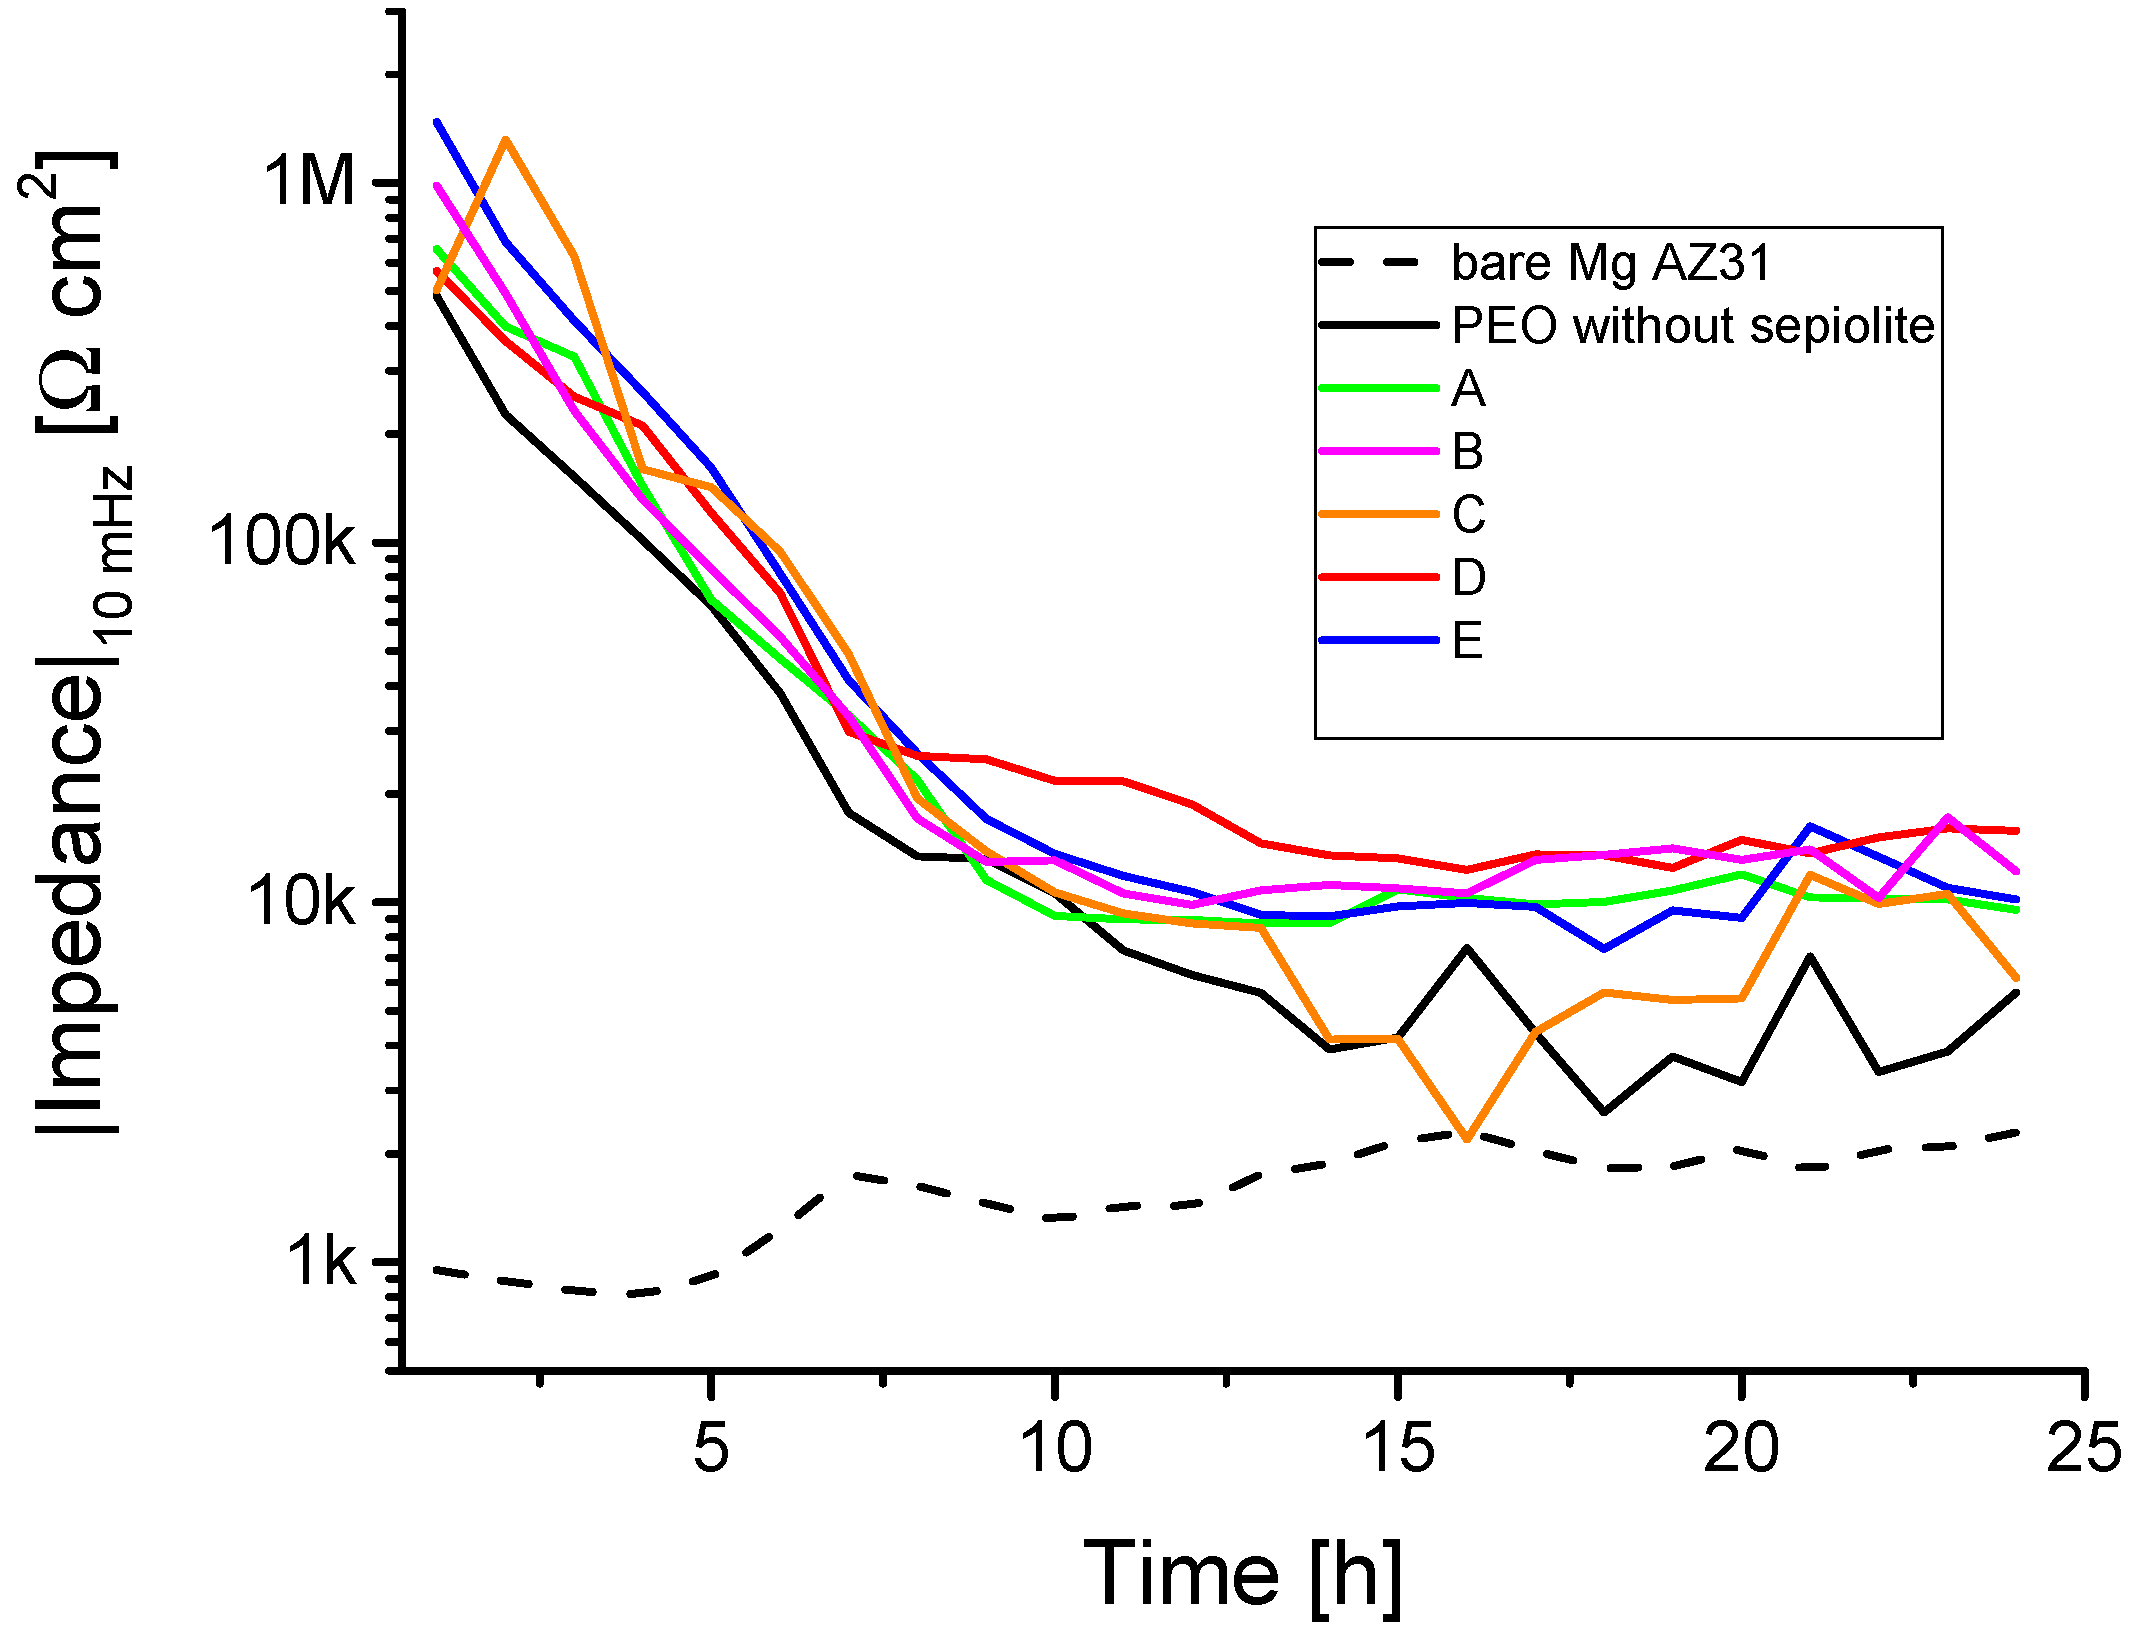
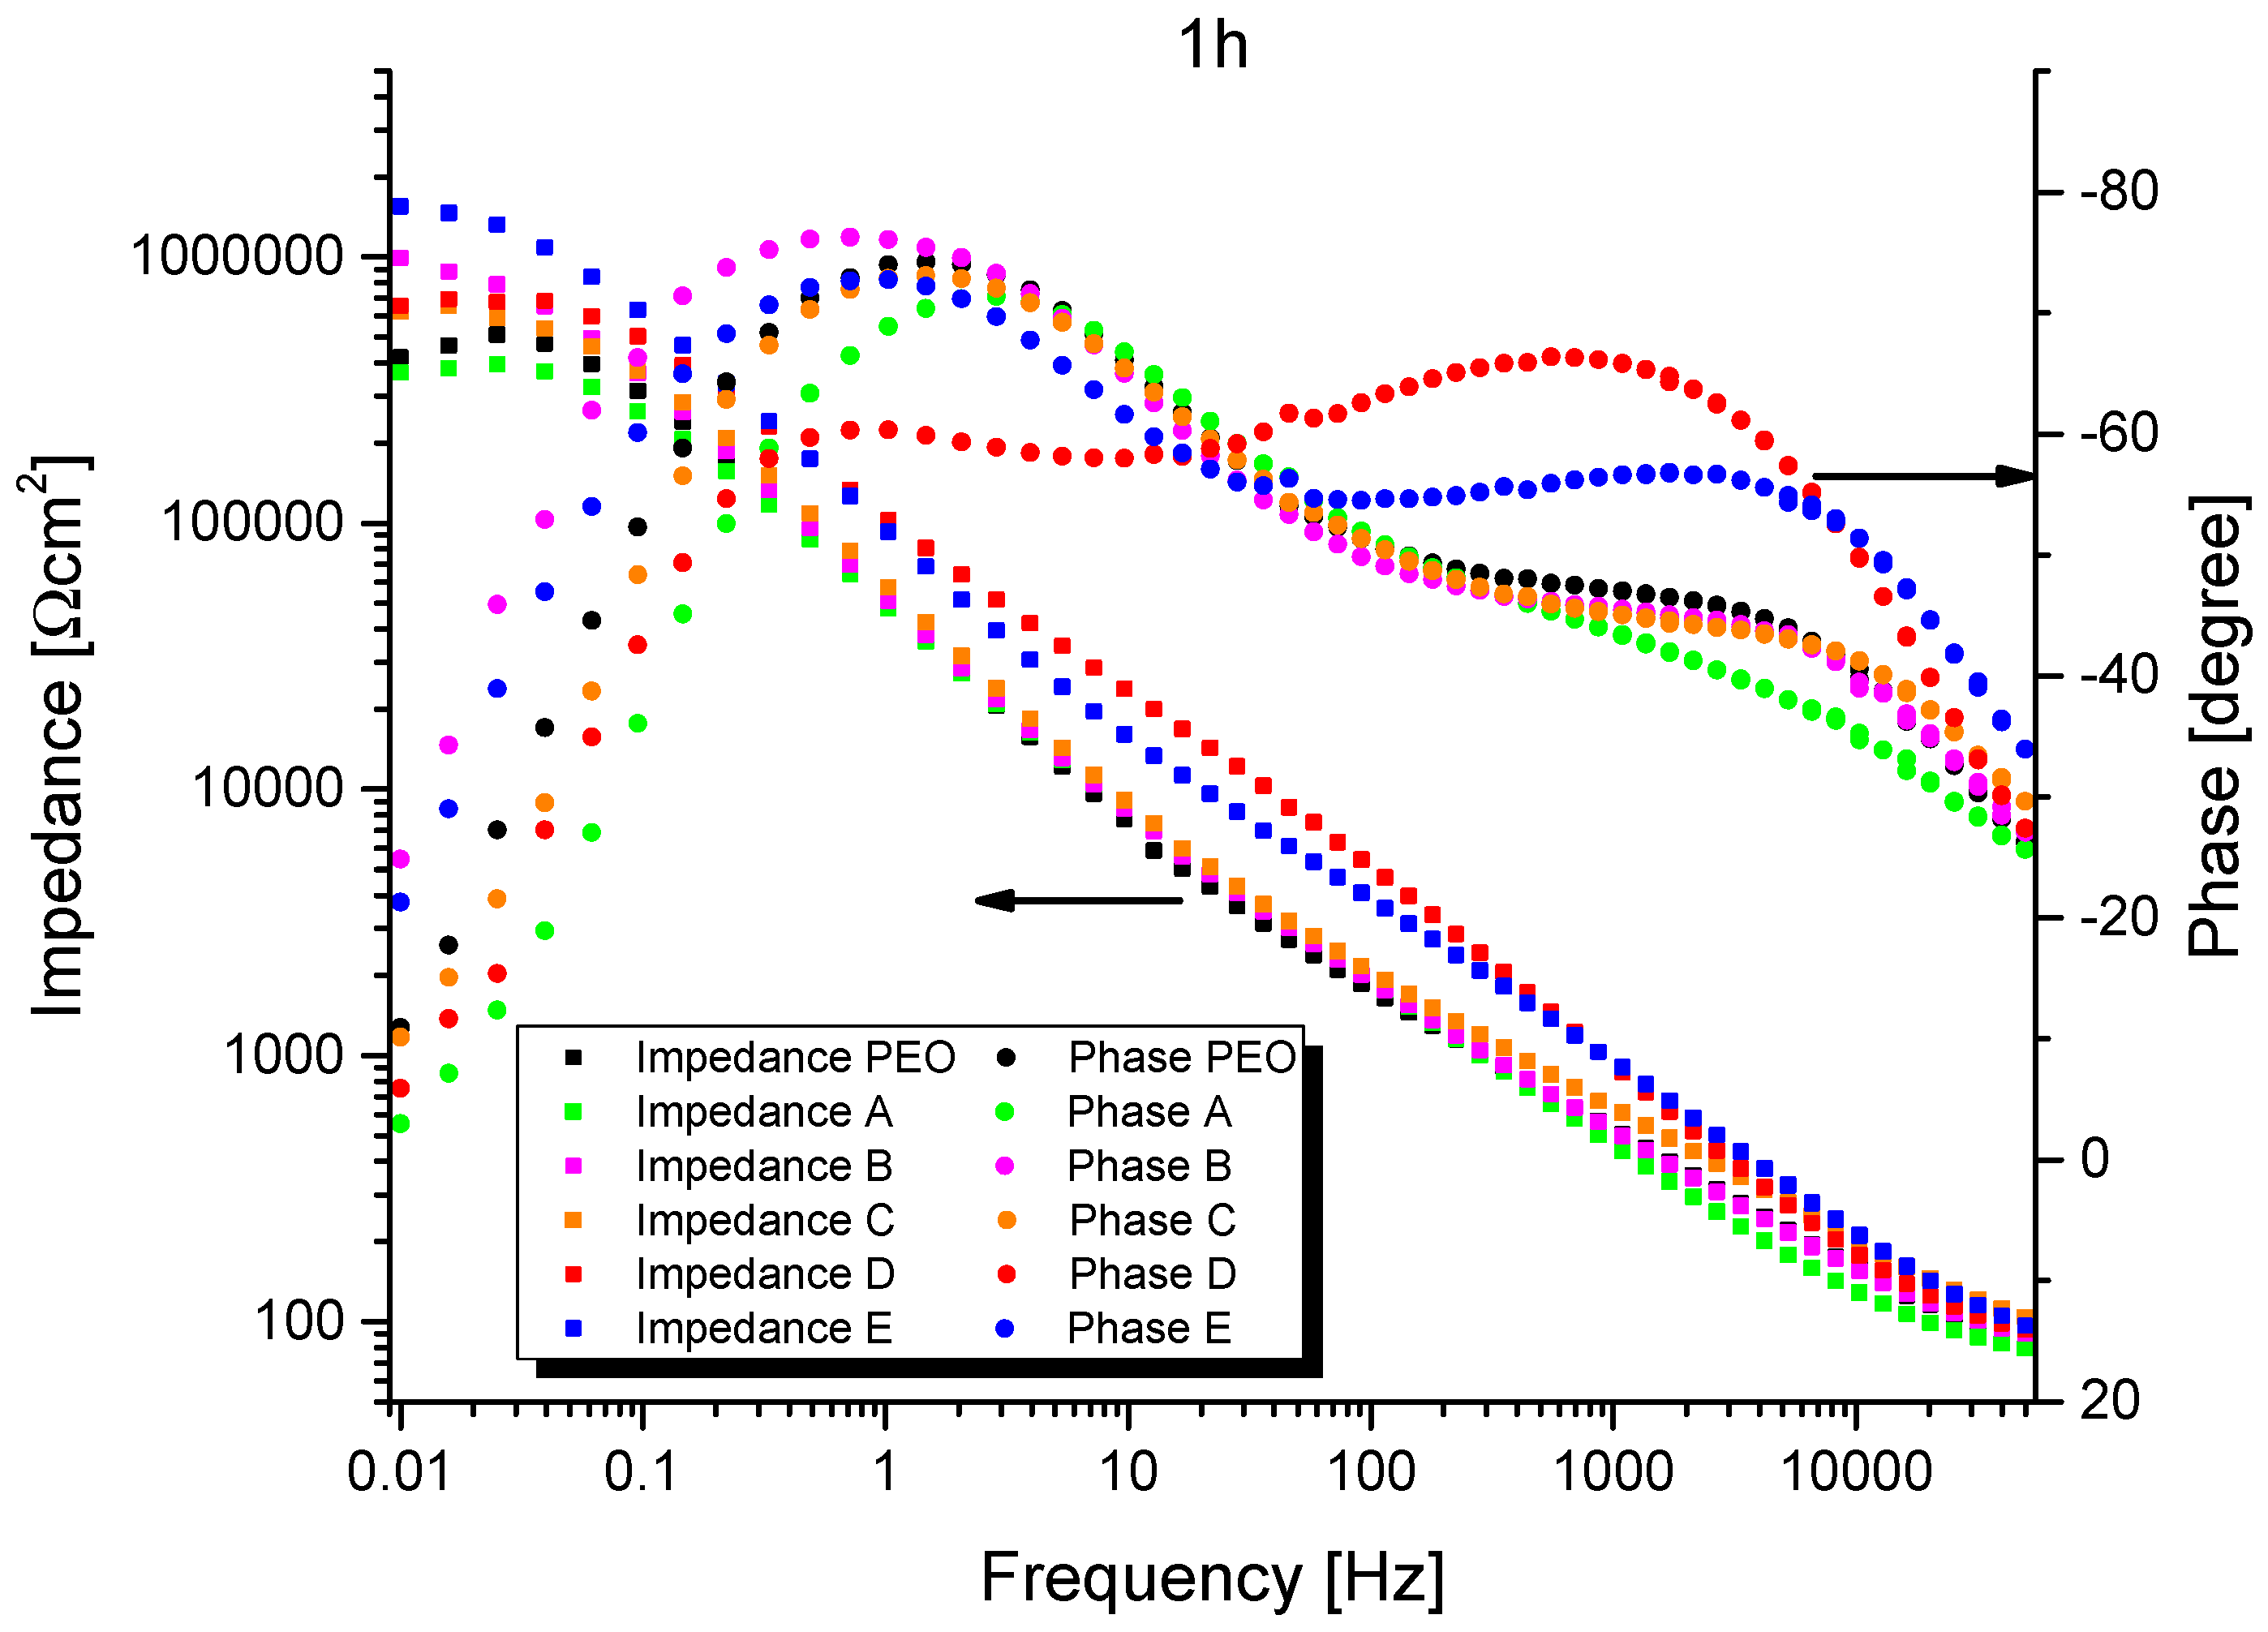
3.4. Electrochemical Impedance Spectroscopy (EIS)

The representative results of EIS measurements are shown in Figure 8 and Figure 9. The spectra representing 1 h of exposure show two well-defined time constants for all systems, while only one remains after 12 h of exposure. (Since EIS spectra were recorded for all PEO/sepiolite combinations at least four times, for the reader’s convenience only one representative measurement is selected.) The magnitude of the impedances of the systems (at low frequencies) decreases for at least two orders over time and the electrolyte resistance becomes visible at >2 kHz. This suggests that after a short time of immersion (see below), the inherent defects of the PEO layer (cracks, pores, discharge channels) promote the full penetration with the NaCl electrolyte and a corrosive attack of the bilayer system.
In the first stage of the corrosion attack the electrolyte will dissolve the oxide, possibly enlarging the pores and craters. When the electrolyte reaches the metal interface, active corrosion starts, referring to reaction Equation (1).
Mg + 2 H2O → Mg(OH)2 + H2
The corrosion product Mg(OH)2 [3] is likewise not stable in the used electrolyte. Consequently, the remaining time constant is associated with the interface impedance consisting of the double-layer capacitance and the polarization resistance, probably controlled by charge transfer. The positive values of the phase shifts for all systems at 0.01 Hz are evidence of the non-stationary conditions caused by a self-accelerated active dissolution of magnesium. There is no indication of a diffusion limitation through the oxide layer. Spectra of the individual measurements were fitted according to the equivalent circuits schematically shown in Figure 10.
The fit was carried out using the Zahner analysis program. The results are listed in Table 4. In all simulations, constant phase elements (CPEs) were used instead of pure capacitances to contribute to the fractal surface character of the PEO coatings. The tabulated capacitances were then calculated from the CPE parameters according to Formula 1, published by Hsu and Mansfeld [54]. In this formula C is the capacity, Y0 the CPE value, fZ″max the frequency at which the imaginary part of the impedance (Z″) has a maximum.
C = Y 0 · ( f Z m a x ) n 1
The resistor R0 refers to the electrolyte resistance. The electrolyte conductivity of 9.5 mS cm−2 was measured by a conductivity meter. This resulted in a calculated distance between the reference and working electrode of around 5 to 6 mm, which corresponds well with the realized electrode design. The measured variations in the electrolyte resistance are the result of small variations in the distance between the electrodes. The nearly identical R0 is evidence that the measurements were made under almost identical conditions. The time constant R1·CPE1 characterizes the PEO layer. R1 represents the resistance across the pore/electrolyte interphase of the PEO layer and depends on the ‘real’ physical pore surface area. (The porosity of the PEO layers was obtained from image evaluation of SEM micrographs. In this case, it appears to be in the range of 4–6%.) This porosity varies due to branched pores (tortuosity) and local discharge events during the PEO. This may also be the reason for the high standard deviation of some results. CPE1 represents the dielectric properties of the (ceramic) PEO coating. After calculation of the PEO layer thickness (with εr = 9.65 for MgO and C1 from Table 4, calculated for a plate capacitor), the results were two orders of magnitude too low. This was also mentioned previously in other studies [52]; one reason can be that εr rises due to the reaction of MgO to Mg(OH)2. After 12 h of exposure, only one time constant was observed in the measured frequency range. After 12 h of exposure, the surfaces were highly penetrated and active corrosion occurred. In this case, R2 is interpreted as the polarization resistance and CPE2 the double-layer capacitance of the metal/electrolyte interface.
From the evaluation of the fitting data, it can be concluded that incorporation of the inhibitors was able to delay the corrosion process. After 1 h of immersion, R2 of the PEO layer was significantly higher for sepiolite charged with inhibitors D and E. For R2 we saw increased resistance for A, B, and E, with only significance for B. The high values are, as mentioned before, a result of inhomogeneities of the PEO layer. With sepiolite D this may also be due to leached inhibitor into the electrolyte, which leads to many more inhomogeneities of the PEO layer.
After 12 h with ongoing corrosion, the bare metal surface was exposed to the electrolyte, yielding the observed increase in the double-layer capacitance CPE2. In all cases, values of R3 were slightly increased to non-inhibited conditions.
In Figure 11 the impedance modulus (values averaged for four samples per inhibitor condition) measured at 10 mHz as a function of exposure duration for the different inhibitor modifications is shown. From the data, the impedance dropped steeply for all samples within the first 10 to 12 h and reached a plateau. In the transition region, i.e., between the maximum impedance modulus and the baseline, the inhibitors appeared to work most effectively. For this reason, in retrospect, the data were evaluated separately after 1 and 12 h of exposure.

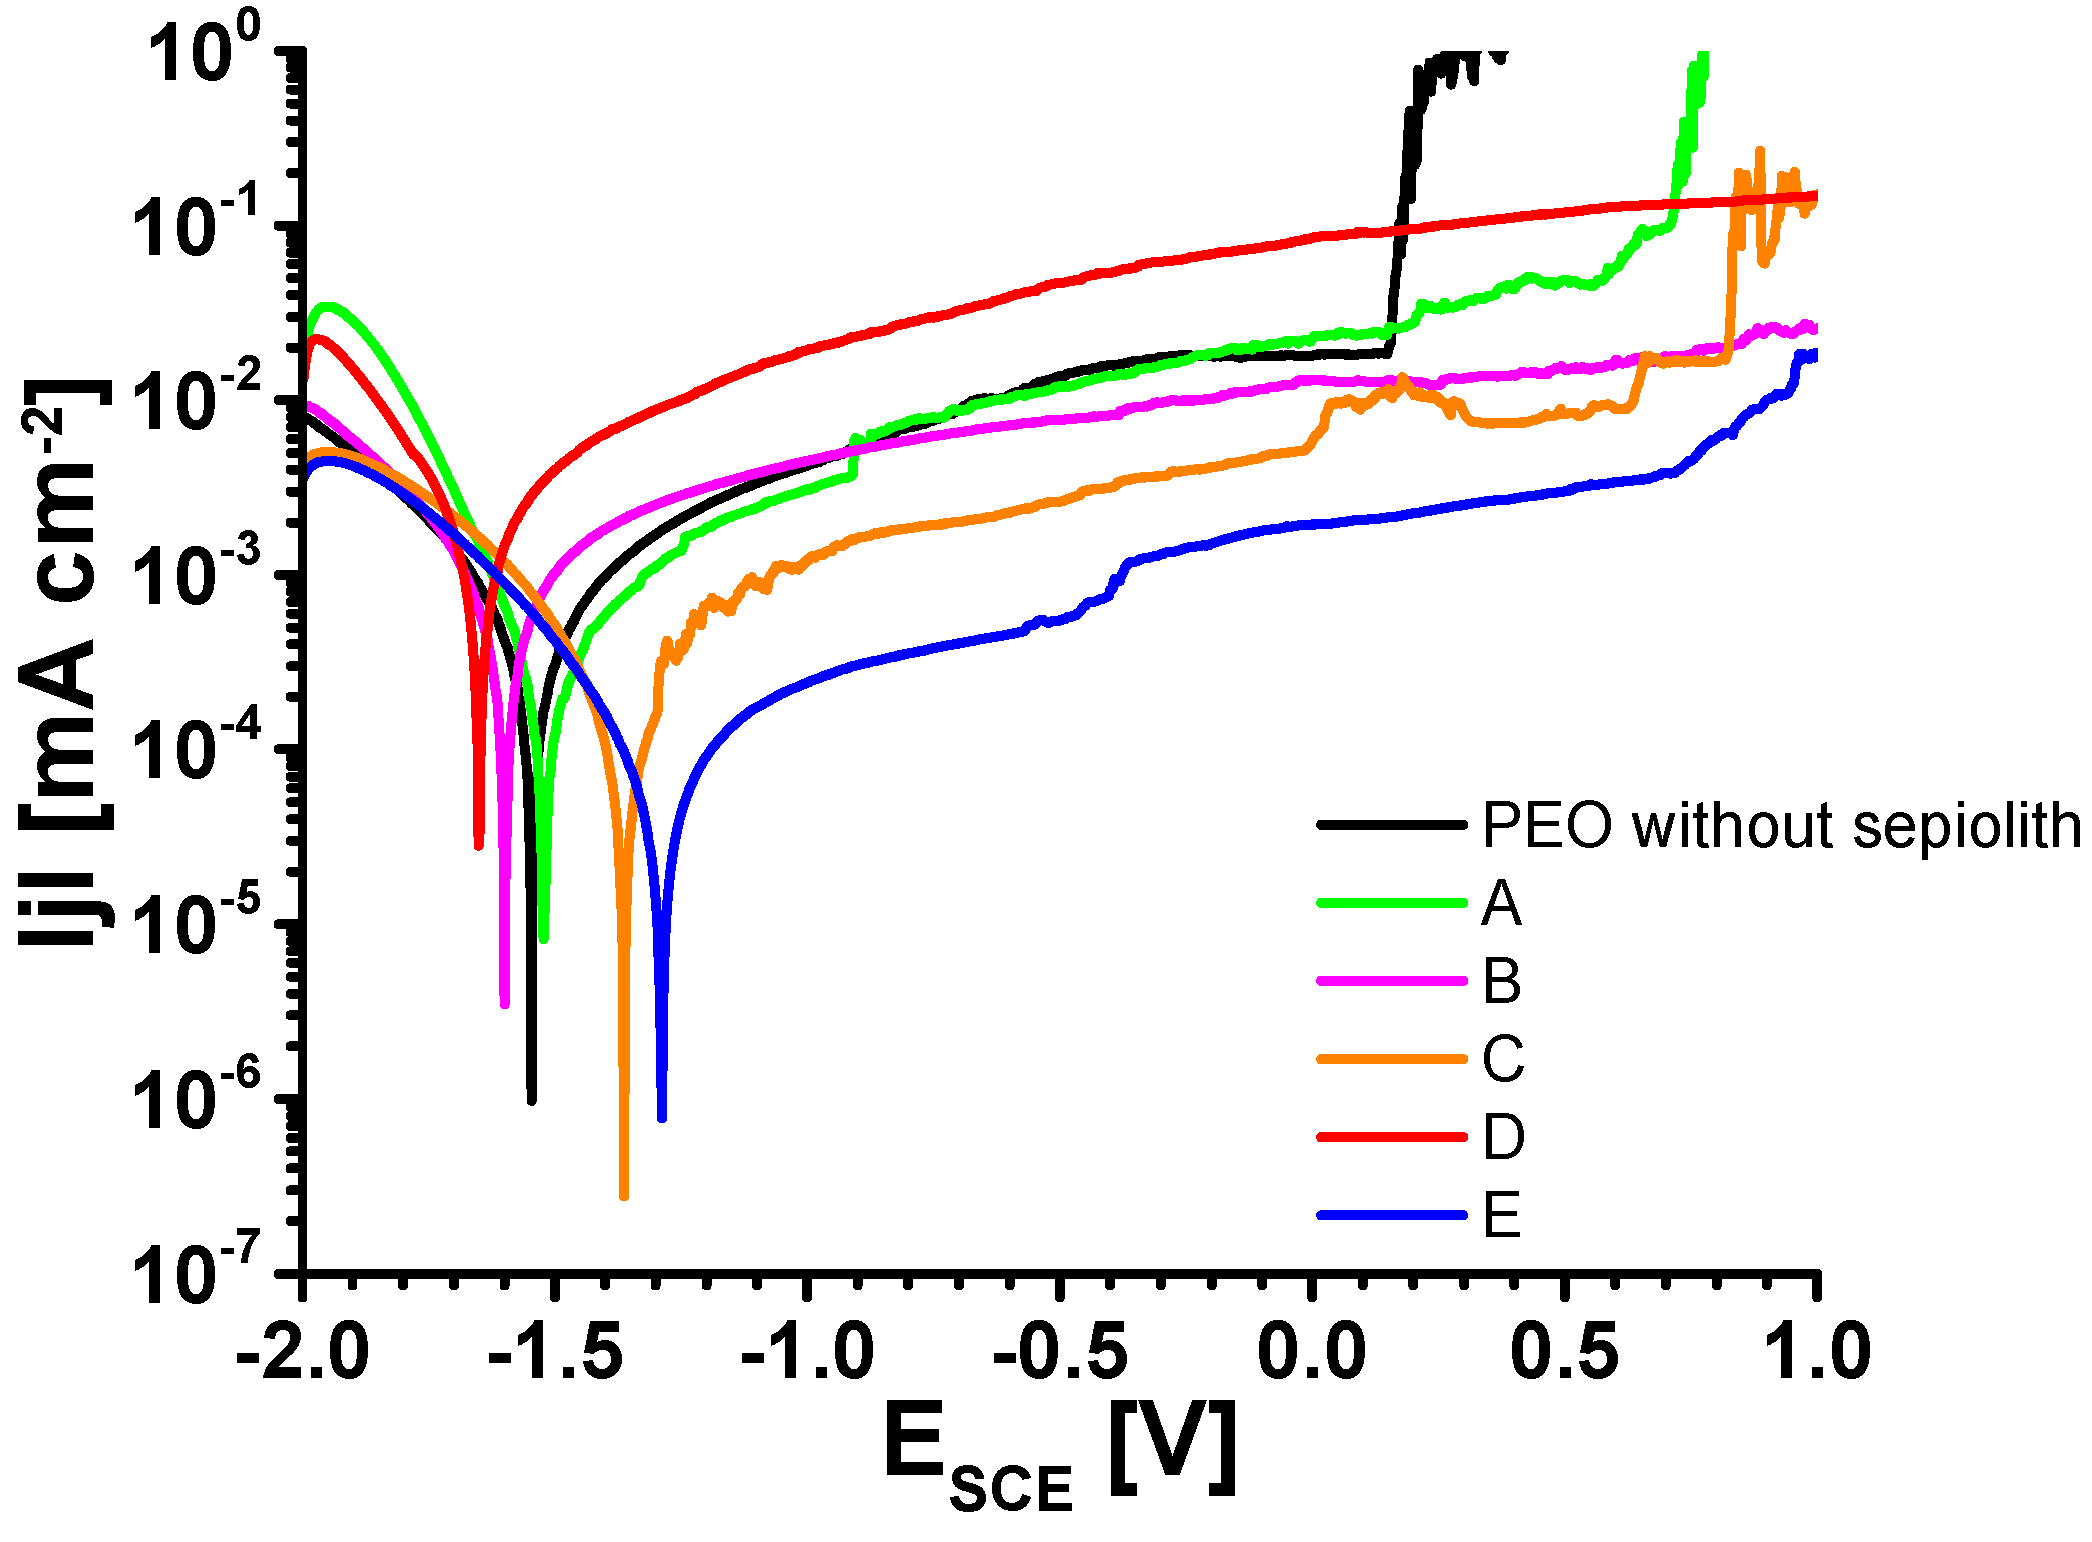
3.5. Linear Sweep Voltammetry (LSV)

In Figure 12 LSV measurements of the samples with different inhibitors are compared. In total, three measurements were performed per system. However, it turned out that there were strong deviations between the LSV measurements for the same inhibitor condition. Possible reasons for this behavior are inhomogeneities of the PEO layer, an irregular distribution of the inhibitors, or the use of a small measuring area.
To consider qualitative statements about the PEO layers and the inhibitor efficiencies, the corrosion potential and the breakdown potential as well as corrosion current densities were determined. Table 5 summarizes all these corrosion-relevant electrochemical quantities. The mean value of the corrosion potential varied between −1.4 and −1.65 V vs. SCE. The inhibitors C and E showed significantly smaller anodic currents and a shift of the corrosion potential to more positive values. Consequently, the passive range also expanded in the positive potential direction. It must be noted that the results presented in Figure 11 are the best of the respective measurements. The data presented in Table 5 include the results of all LSV experiments of this study. Unfortunately, the scattering of the results within the measurement does not show a stringent tendency (Table 4). The corrosion potential in LSV was dominated by the anodic reaction, since the cathodic appeared to be very similar for all inhibitors used. Since the PEO layer is mechanically very stable, there must be weak points in the oxide, for instance, at the bottom of the discharge craters. Micropores or cracks located there will be covered with Mg(OH)2, which is easily soluble. If there are many of them, the anodic partial current density increases and the corrosion potential becomes more negative. Converting the corrosion currents to the polarization resistances yields reasonable values close to those from the impedance measurements above.
The corrosion current densities of inhibitors B, C, and E varied between 0.14 and 0.36 µA/cm2. The highest corrosion current density was observed with sepiolite A and D reaching approximately 1 µA/cm2.
However, the values of the critical pitting potentials (or general breakdown potential) were influenced strongly by the used inhibitor. Samples A, C, and E showed a strong distribution of the potential. Although sample D showed a small distribution of the single values, the PEO layer already failed at potentials of ~−0.9 V vs. SCE. In contrast, the pitting potential for sample B was shifted toward the anodic region.

4. Conclusions

Sepiolite has proven to be an ideal inhibitor carrier as it can be loaded with the selected inhibitors. The establishment of long-term stable dispersions with the alkaline electrolyte, with both underloaded and unloaded modification, is possible. All sepiolite types could be detected on the PEO layers and in the discharge channels. In the impedance spectroscopy, the layers loaded with sepiolite B, D, and E showed a slight improvement in the corrosion properties. The improvement in sepiolite D can also be attributed to the partially dissolved inhibitor. In the LSV experiments, there was no significant difference in the corrosion potentials Ecorr. LSV and EIS measurements showed that the use of the inhibitors delays the onset of the corrosion process. In particular, the critical pitting potential is shifted toward the anodic region by about 1 V. The corrosion current densities tend to increase slightly as a result of the inhibitors, with sepiolite D even by a factor of 5.
Regarding the minor improvements performed by sepiolite D and E, no further gain is expected since the maximum loading capacity has been reached. The sepiolite loaded with cerium (B), on the other hand, still has significant potential for its loading capacity. This can be achieved by chemical modification of the sepiolite. Therefore, highly loaded sepiolite will be examined in future experiments using EIS and LSV.

Author Contributions

R.S.: Investigation, Writing—original draft. R.G.: Investigation. K.K.: Formal analysis, Investigation, Writing—original draft, S.L.: Conceptualization, Writing—original draft, Writing—review and editing, Project administration. M.S.: Writing—original draft, Writing—review and editing, Project administration, Funding acquisition. W.F.: Writing—review and editing, Project administration, Funding acquisition. All authors have read and agreed to the published version of the manuscript.

Funding

Funding of this research under Grant No. 20627 BG by the German Federal Ministry for Economic Affairs and Climate Action via the AiF Federation of Industrial Research Associations according to a resolution of the German Bundestag is gratefully acknowledged.

Acknowledgments

The authors acknowledge Ralf Peipmann for reviewing and editing this article.

Conflicts of Interest

The authors declare no conflict of interest.

References

  1. Friedrich, H.E. Magnesium Technology: Metallurgy, Design Data, Applications; Springer: Berlin/Heidelberg, Germany, 2006; ISBN 3-540-20599-3. [Google Scholar]
  2. Rumble, J.R.; Bruno, T.J.; Doa, M.J. CRC Handbook of Chemistry and Physics: A Ready-Reference Book of Chemical and Physical Data, 101st ed.; CRC Press: Boca Raton, FL, USA; Taylor & Francis Group: London, UK; New York, NY, USA, 2020; ISBN 0367417243. [Google Scholar]
  3. Song, G.-L. Corrosion of Magnesium Alloys; ebrary, Inc.: Oxford, UK; Woodhead Pub: Philadelphia, PA, USA, 2011; ISBN 9781845697082. [Google Scholar]
  4. Pourbaix, M. Atlas of Electrochemical Equilibria in Aqueous Solutions; NACE International: Houston, TX, USA, 1974. [Google Scholar]
  5. Koppers, M.; Weber, K.; Dehnke, V.; Fuhrmann, J. Einfluss der chemischen Umgebung auf Morphologie und Struktur von Magnesiumhydroxid auf Magnesiumoberflächen. Mat.-Wiss. U. Werkstofftech. 2001, 32, 88–96. [Google Scholar] [CrossRef]
  6. Nordlien, J.H.; Nisancioglu, K.; Ono, S.; Masuko, N. Morphology and Structure of Water-Formed Oxides on Ternary MgAl Alloys. J. Electrochem. Soc. 1997, 144, 461–466. [Google Scholar] [CrossRef]
  7. Nordlien, J.H.; Ono, S.; Masuko, N.; Nisancioglu, K. Morphology and Structure of Oxide Films Formed on Magnesium by Exposure to Air and Water. J. Electrochem. Soc. 1995, 142, 3320–3322. [Google Scholar] [CrossRef]
  8. Arrabal, R.; Mohedano, M.; Matykina, E. Electrochemical Surface Treatments for Mg Alloys. In Encyclopedia of Materials: Metals and Alloys; Elsevier: Amsterdam, The Netherlands, 2022; pp. 87–112. ISBN 9780128197332. [Google Scholar]
  9. Barati Darband, G.; Aliofkhazraei, M.; Hamghalam, P.; Valizade, N. Plasma electrolytic oxidation of magnesium and its alloys: Mechanism, properties and applications. J. Magnes. Alloys 2017, 5, 74–132. [Google Scholar] [CrossRef]
  10. Sikdar, S.; Menezes, P.V.; Maccione, R.; Jacob, T.; Menezes, P.L. Plasma Electrolytic Oxidation (PEO) Process-Processing, Properties, and Applications. Nanomaterials 2021, 11, 1375. [Google Scholar] [CrossRef]
  11. Wierzbicka, E.; Vaghefinazari, B.; Mohedano, M.; Visser, P.; Posner, R.; Blawert, C.; Zheludkevich, M.; Lamaka, S.; Matykina, E.; Arrabal, R. Chromate-Free Corrosion Protection Strategies for Magnesium Alloys—A Review: Part II—PEO and Anodizing. Materials 2022, 15, 8515. [Google Scholar] [CrossRef]
  12. Sampatirao, H.; Radhakrishnapillai, S.; Dondapati, S.; Parfenov, E.; Nagumothu, R. Developments in plasma electrolytic oxidation (PEO) coatings for biodegradable magnesium alloys. Mater. Today Proc. 2021, 46, 1407–1415. [Google Scholar] [CrossRef]
  13. Sankara Narayanan, T.; Park, I.S.; Lee, M.H. Strategies to improve the corrosion resistance of microarc oxidation (MAO) coated magnesium alloys for degradable implants: Prospects and challenges. Prog. Mater. Sci. 2014, 60, 1–71. [Google Scholar] [CrossRef]
  14. Hussein, R.O.; Nie, X.; Northwood, D.O. An investigation of ceramic coating growth mechanisms in plasma electrolytic oxidation (PEO) processing. Electrochim. Acta 2013, 112, 111–119. [Google Scholar] [CrossRef]
  15. Kaseem, M.; Fatimah, S.; Nashrah, N.; Ko, Y.G. Recent progress in surface modification of metals coated by plasma electrolytic oxidation: Principle, structure, and performance. Prog. Mater. Sci. 2021, 117, 100735. [Google Scholar] [CrossRef]
  16. Adsul, S.H.; Soma Raju, K.; Sarada, B.V.; Sonawane, S.H.; Subasri, R. Evaluation of self-healing properties of inhibitor loaded nanoclay-based anticorrosive coatings on magnesium alloy AZ91D. J. Magnes. Alloys 2018, 6, 299–308. [Google Scholar] [CrossRef]
  17. Vaghefinazari, B.; Wang, C.; Mercier, D.; Mei, D.; Seyeux, A.; Marcus, P.; Blawert, C.; Lamaka, S.V.; Zheludkevich, M.L. Adverse effect of 2,5PDC corrosion inhibitor on PEO coated magnesium. Corros. Sci. 2021, 192, 109830. [Google Scholar] [CrossRef]
  18. Wang, S.Y.; Li, Q.; Zhong, X.K.; Li, L.Q.; Chen, F.N.; Luo, F.; Dai, Y.; Gao, H.; Liu, F.; Zhang, H.X. Effects of NO −3 in NaCl solution on corrosion protection of AZ91D magnesium alloy coated with silane films. Trans. IMF 2012, 90, 78–85. [Google Scholar] [CrossRef]
  19. Ouyang, Y.; Li, L.-X.; Xie, Z.-H.; Tang, L.; Wang, F.; Zhong, C.-J. A self-healing coating based on facile pH-responsive nanocontainers for corrosion protection of magnesium alloy. J. Magnes. Alloys 2022, 10, 836–849. [Google Scholar] [CrossRef]
  20. Zhang, G.; Wu, L.; Tang, A.; Ma, Y.; Song, G.-L.; Zheng, D.; Jiang, B.; Atrens, A.; Pan, F. Active corrosion protection by a smart coating based on a MgAl-layered double hydroxide on a cerium-modified plasma electrolytic oxidation coating on Mg alloy AZ31. Corros. Sci. 2018, 139, 370–382. [Google Scholar] [CrossRef]
  21. Zhang, G.; Wu, L.; Tang, A.; Ding, X.; Jiang, B.; Atrens, A.; Pan, F. Smart epoxy coating containing zeolites loaded with Ce on a plasma electrolytic oxidation coating on Mg alloy AZ31 for active corrosion protection. Prog. Org. Coat. 2019, 132, 144–147. [Google Scholar] [CrossRef]
  22. Zhang, G.; Jiang, E.; Wu, L.; Ma, W.; Yang, H.; Tang, A.; Pan, F. Corrosion protection properties of different inhibitors containing PEO/LDHs composite coating on magnesium alloy AZ31. Sci. Rep. 2021, 11, 2774. [Google Scholar] [CrossRef]
  23. Yang, J.; Blawert, C.; Lamaka, S.V.; Snihirova, D.; Lu, X.; Di, S.; Zheludkevich, M.L. Corrosion protection properties of inhibitor containing hybrid PEO-epoxy coating on magnesium. Corros. Sci. 2018, 140, 99–110. [Google Scholar] [CrossRef]
  24. Gnedenkov, A.S.; Sinebryukhov, S.L.; Mashtalyar, D.V.; Gnedenkov, S.V. Localized corrosion of the Mg alloys with inhibitor-containing coatings: SVET and SIET studies. Corros. Sci. 2016, 102, 269–278. [Google Scholar] [CrossRef]
  25. Dong, Q.; Ba, Z.; Jia, Y.; Chen, Y.; Lv, X.; Zhang, X.; Wang, Z. Effect of solution concentration on sealing treatment of Mg-Al hydrotalcite film on AZ91D Mg alloy. J. Magnes. Alloys 2017, 5, 320–325. [Google Scholar] [CrossRef]
  26. Fattah-alhosseini, A.; Chaharmahali, R.; Babaei, K. Effect of particles addition to solution of plasma electrolytic oxidation (PEO) on the properties of PEO coatings formed on magnesium and its alloys: A review. J. Magnes. Alloys 2020, 8, 799–818. [Google Scholar] [CrossRef]
  27. Toorani, M.; Aliofkhazraei, M.; Sabour Rouhaghdam, A. Microstructural, protective, inhibitory and semiconducting properties of PEO coatings containing CeO2 nanoparticles formed on AZ31 Mg alloy. Surf. Coat. Technol. 2018, 352, 561–580. [Google Scholar] [CrossRef]
  28. Chaharmahali, R.; Fattah-alhosseini, A.; Esfahani, H. Increasing the in-vitro corrosion resistance of AZ31B-Mg alloy via coating with hydroxyapatite using plasma electrolytic oxidation. J. Asian Ceram. Soc. 2020, 8, 39–49. [Google Scholar] [CrossRef]
  29. Lu, X.; Mohedano, M.; Blawert, C.; Matykina, E.; Arrabal, R.; Kainer, K.U.; Zheludkevich, M.L. Plasma electrolytic oxidation coatings with particle additions—A review. Surf. Coat. Technol. 2016, 307, 1165–1182. [Google Scholar] [CrossRef]
  30. Mashtalyar, D.V.; Imshinetskiy, I.M.; Nadaraia, K.V.; Gnedenkov, A.S.; Suchkov, S.N.; Opra, D.P.; Pustovalov, E.V.; Yu Ustinov, A.; Sinebryukhov, S.L.; Gnedenkov, S.V. Effect of TiO2 nanoparticles on the photocatalytic properties of PEO coatings on Mg alloy. J. Magnes. Alloys 2023, 11, 735–752. [Google Scholar] [CrossRef]
  31. Zehra, T.; Patil, S.A.; Shrestha, N.K.; Fattah-alhosseini, A.; Kaseem, M. Anionic assisted incorporation of WO3 nanoparticles for enhanced electrochemical properties of AZ31 Mg alloy coated via plasma electrolytic oxidation. J. Alloys Compd. 2022, 916, 165445. [Google Scholar] [CrossRef]
  32. Mingo, B.; Guo, Y.; Němcová, A.; Gholinia, A.; Mohedano, M.; Sun, M.; Matthews, A.; Yerokhin, A. Incorporation of halloysite nanotubes into forsterite surface layer during plasma electrolytic oxidation of AM50 Mg alloy. Electrochim. Acta 2019, 299, 772–788. [Google Scholar] [CrossRef]
  33. Mingo, B.; Guo, Y.; Leiva-Garcia, R.; Connolly, B.J.; Matthews, A.; Yerokhin, A. Smart Functionalization of Ceramic-Coated AZ31 Magnesium Alloy. ACS Appl. Mater. Interfaces 2020, 12, 30833–30846. [Google Scholar] [CrossRef]
  34. Sun, M.; Yerokhin, A.; Bychkova, M.; Shtansky, D.V.; Levashov, E.A.; Matthews, A. Self-healing plasma electrolytic oxidation coatings doped with benzotriazole loaded halloysite nanotubes on AM50 magnesium alloy. Corros. Sci. 2016, 111, 753–769. [Google Scholar] [CrossRef]
  35. Schneider, M.; Kremmer, K.; Tabatabai, D.; Fürbeth, W. Nano-sized zeolite particles as inhibitor carrier in plasma electrolytic oxide layers on AZ31. Mater. Corros. 2018, 69, 971–977. [Google Scholar] [CrossRef]
  36. Guo, X.-P.; Song, G.-L.; Hu, J.-Y.; Huang, D.-B. Corrosion inhibition of magnesium (Mg) Alloys. In Corrosion Prevention of Magnesium Alloys; Song, G.-L., Ed.; WP Woodhead Publisching: Oxford, UK; Cambridge, UK; Philadelphia, PA, USA, 2013; pp. 61–84. ISBN 9780857094377. [Google Scholar]
  37. McCafferty, E. Introduction to Corrosion Science; Springer: New York, NY, USA, 2010. [Google Scholar] [CrossRef]
  38. Palanisamy, G. Corrosion Inhibitors. In Corrosion Inhibitors; Singh, A., Ed.; IntechOpen: 2019; ISBN 978-1-78984-714-7.
  39. Lamaka, S.V.; Vaghefinazari, B.; Mei, D.; Petrauskas, R.P.; Höche, D.; Zheludkevich, M.L. Comprehensive screening of Mg corrosion inhibitors. Corros. Sci. 2017, 128, 224–240. [Google Scholar] [CrossRef]
  40. Galvão, T.L.P. CORDATA. Available online: https://datacor.shinyapps.io/cordata/ (accessed on 15 November 2022).
  41. Song, H.; Xu, Z.; Benabou, L.; Yin, Z.; Guan, H.; Yan, H.; Chao, L.; Hu, Z.; Wang, X. Sodium dodecyl sulfate (SDS) as an effective corrosion inhibitor for Mg-8Li-3Al alloy in aqueous NaCl: A combined experimental and theoretical investigation. J. Magnes. Alloys 2021, 11, 287–300. [Google Scholar] [CrossRef]
  42. Li, Y.; Lu, X.; Wu, K.; Yang, L.; Zhang, T.; Wang, F. Exploration the inhibition mechanism of sodium dodecyl sulfate on Mg alloy. Corros. Sci. 2020, 168, 108559. [Google Scholar] [CrossRef]
  43. Calado, L.M.; Taryba, M.G.; Morozov, Y.; Carmezim, M.J.; Montemor, M.F. Cerium phosphate-based inhibitor for smart corrosion protection of WE43 magnesium alloy. Electrochim. Acta 2021, 365, 137368. [Google Scholar] [CrossRef]
  44. Hu, J.; Huang, D.; Zhang, G.; Song, G.-L.; Guo, X. Research on the inhibition mechanism of tetraphenylporphyrin on AZ91D magnesium alloy. Corros. Sci. 2012, 63, 367–378. [Google Scholar] [CrossRef]
  45. Rudnick, L.R. Synthetics, Mineral oils, and Bio-Based Lubricants: Chemistry and Technology, 3rd ed.; CRC Press: Boca Raton, FL, USA, 2020; ISBN 9781138068216. [Google Scholar]
  46. Poppe, L.J.; Paskevich, V.F.; Hathaway, J.C.; Blackwood, D.S. A Laboratory Manual for X-ray Powder Diffraction. Open-File Report 01-041. Available online: https://pubs.usgs.gov/of/2001/of01-041/ (accessed on 15 November 2022).
  47. Álvarez, A.; Santarén, J.; Esteban-Cubillo, A.; Aparicio, P. Current Industrial Applications of Palygorskite and Sepiolite. In Developments in Palygorskite-Sepiolite Research; Elsevier: Amsterdam, The Netherlands, 2011; pp. 281–298. ISBN 9780444536075. [Google Scholar]
  48. Harvey, C.C.; Lagaly, G. Industrial Applications. In Handbook of Clay Science; Elsevier: Amsterdam, The Netherlands, 2013; pp. 451–490. ISBN 9780080993645. [Google Scholar]
  49. Sabah, E.; Majdan, M. Removal of phosphorus from vegetable oil by acid-activated sepiolite. J. Food Eng. 2009, 91, 423–427. [Google Scholar] [CrossRef]
  50. Murray, H.H.; Pozo, M.; Galán, E. An Introduction to Palygorskite and Sepiolite Deposits—Location, Geology and Uses. In Developments in Palygorskite-Sepiolite Research; Elsevier: Amsterdam, The Netherlands, 2011; pp. 85–99. ISBN 9780444536075. [Google Scholar]
  51. Robert, J.D.; Caserio, M.C. Basic Principles of Organic Chemistry. Available online: https://chem.libretexts.org/Bookshelves/Organic_Chemistry/Book%3A_Basic_Principles_of_Organic_Chemistry_(Roberts_and_Caserio)/23%3A_Organonitrogen_Compounds_I_-_Amines/23.11%3A_Oxidation_of_Amines (accessed on 15 November 2022).
  52. Schneider, M.; Kremmer, K.; Höhn, S. Corrosion protection of thickness reduced plasma electrolytic layers on AZ31. Mater. Corros. 2016, 67, 921–928. [Google Scholar] [CrossRef]
  53. Schneider, M.; Kremmer, K.; Fürbeth, W.; Lederer, S.; Sottor, R. Sepiolite reinforced PEO layer on AZ 31. Surf. Coat. Technol. 2023, 459, 129369. [Google Scholar] [CrossRef]
  54. Hsu, C.H.; Mansfeld, F. Technical Note: Concerning the Conversion of the Constant Phase Element Parameter Y 0 into a Capacitance. CORROSION 2001, 57, 747–748. [Google Scholar] [CrossRef]
Figure 1. Phosphate ester hydrolysis up to phosphoric acid (R = 2-ethylhexyl).
Cmd 04 00025 g001
Figure 2. Aci-nitro tautomerism of nitro alkanes (a) and oxidation reaction of 1-dodecylamine in two steps (R = C10H23) (b).
Cmd 04 00025 g002
Figure 3. Current ramp and first two pulses used for the PEO treatment.
Cmd 04 00025 g003
Figure 4. Dispersion stability results.
Cmd 04 00025 g004
Figure 5. ICP-MS results/concentration of phosphorus in the PEO electrolyte regarding the estimated inhibiting stability of inhibitors C and D.
Cmd 04 00025 g005
Figure 6. Voltage time response during PEO with natural sepiolite (A) and with the different inhibitor-loaded sepiolites (B–E).
Cmd 04 00025 g006
Figure 7. SEM images of the PEO layers, surface and cross-section. On the left side without sepiolite, on the right side with sepiolite. According to the scale bar in all images, the layer thickness locally varies between 2 and 3.5 µm.
Cmd 04 00025 g007
Figure 8. Single measurement impedance results after 1 h of exposure (Bode plot).
Cmd 04 00025 g008
Figure 9. Single measurement impedance results after 12 h of exposure (Bode plot).
Cmd 04 00025 g009
Figure 10. Equivalent circuits used for fitting the impedance data. (A) After 1 h of exposure. (B) After 12 h of exposure [52].
Cmd 04 00025 g010
Figure 11. Impedance results (10 mHz) over time.
Cmd 04 00025 g011
Figure 12. Selected LSV measurements.
Cmd 04 00025 g012
Table 1. Summary of some corrosion inhibitors used for Mg selected by mechanism.
Adsorption InhibitorsFilm-Forming Inhibitors
Passivating InhibitorsPrecipitation Inhibitors
Oxidizing InhibitorsNon-Oxidizing Inhibitors
sodium dodecyl-
sulfate [41,42]
sodium dodecylbenzene-sulfonate [36,39]
hexamethylene-tetramine [36]
bis(2-ethylhexyl)-phosphate [43]
nitrate [18,36,39]
chromate [36,39]
hydrogen peroxide [36]
permanganate [36]
phosphate [39]
fluoride [36,39]
5,10,15,20-tetraphenyl-
prophyrin [36,44]
8-hydroxychinolin [23,39]
sodium aminopropyl-
triethoxysilicate [36]
Table 2. Nomenclature for natural sepiolite and all inhibitor-loaded sepiolites.
NomenclatureLoaded with…Loading Capacity [mg/g]
AUnloaded/natural-
BCe3+6.2
Ctris (2-ethylhexyl) phosphate200
Dtris (2-ethylhexyl) phosphate +Apricon OPE100 + 100
Eoxidized 1-dodecylamine200
Table 3. Nominal chemical composition of the used AZ31 (wt.%) according to the distributor (Salomon’s Metalen B.V.) information.
AlZnMnSiCuCaFeNiOthersMg
2.5–3.50.7–1.30.2Max. 0.05Max. 0.05Max. 0.04Max. 0.005Max. 0.0050.3 max totalbalanced
Table 4. Impedance fit results.
Sepiolite TypeOCP vs. SCE
[V]
R0
[Ω cm2]
R1
[kΩ cm2]
C1
[µF/cm2]
R2
[kΩ cm2]
C2
[µF/cm2]
Overall Fit Error
[%]
After 1 h of exposure
PEO without sepiolite−1.454 ± 0.08868 ± 35.9 ± 2.90.12 ± 0.8790 ± 7600.61 ± 0.268.8 ± 3.1
A−1.444 ± 0.07969 ± 42.7 ± 2.30.081 ± 0.0451060 ± 10800.88 ± 0.2812.9 ± 2.2
B−1.460 ± 0.18374 ± 22.0 ± 0.20.071 ± 0.0101500 ± 3000.94 ± 0.1513.5 ± 1.2
C−1.493 ± 0.02762 ± 23.2 ± 2.10.073 ± 0.060490 ± 2300.56 ± 0.2211.8 ± 3.2
D−1.532 ± 0.02967 ± 440.4 ± 11.20.11 ± 0.01660 ± 2900.25 ± 0.126.8 ± 4.1
E−1.452 ± 0.04960 ± 210.6 ± 2.70.062 ± 0.0152300 ± 11000.47 ± 0.1110.5 ± 1.1
After 12 h of exposure
PEO without sepiolite−1.499 ± 0.01466 ± 2--6.5 ± 1.63.5 ± 0.69.4 ± 0.9
A−1.505 ± 0.00266 ± 2--7.3 ± 0.93.2 ± 0.29.4 ± 0.6
B−1.511 ± 0.00970 ± 2--8.4 ± 3.03.4 ± 0.59.2 ± 2.0
C−1.508 ± 0.01071 ± 3--6.3 ± 2.03.4 ± 0.69.2 ± 1.2
D−1.517 ± 0.00270 ± 1--16.1 ± 6.02.6 ± 0.39.3 ± 0.4
E−1.501 ± 0.00367 ± 3--9.3 ± 0.93.1 ± 0.37.5 ± 0.1
Table 5. Corrosion-relevant electrochemical variables extracted from the LSV experiments.
PEOABCDE
Ecorr/
[V vs. SCE]
−1.44 ± 0.12−1.50 ± 0.101.49 ± 0.09−1.40 ± 0.04−1.65 ± 0.06−1.42 ± 0.15
/jcorr/
[µA cm−2]
0.12 ± 0.110.98 ± 0.900.25 ± 0.150.14 ± 0.021.00 ± 0.680.36 ± n.a.
Ebreak down
[V vs. SCE]
−0.28 ± 0.43−0.65 ± 0.530.57 ± 0.320.04 ± 0.75−0.92 ± 0.10−0.06 ± 1.16
Disclaimer/Publisher’s Note: The statements, opinions and data contained in all publications are solely those of the individual author(s) and contributor(s) and not of MDPI and/or the editor(s). MDPI and/or the editor(s) disclaim responsibility for any injury to people or property resulting from any ideas, methods, instructions or products referred to in the content.

