Article

Differences and Similarities in Breast and Colorectal Cancer Screening Uptake among Municipalities in Flanders, Belgium

1
Social Epidemiology and Health Policy, Family Medicine and Population Health (FAMPOP), University of Antwerp, 2610 Antwerp, Belgium
2
Department of Health Sciences (DISSAL), University of Genoa, 16123 Genoa, Italy
3
Centre for Cancer Detection, 8000 Bruges, Belgium
4
Department of Oncology, Antwerp University Hospital, 2650 Antwerp, Belgium
5
Integrated Personalized & Precision Oncology Network (IPPON), University of Antwerp, 2610 Antwerp, Belgium
*
Author to whom correspondence should be addressed.
Gastrointest. Disord. 2022, 4(2), 84-96; https://doi.org/10.3390/gidisord4020010
Submission received: 2 March 2022 / Revised: 8 April 2022 / Accepted: 20 April 2022 / Published: 23 May 2022
(This article belongs to the Special Issue Colorectal Cancer Screening and Prevention)

Abstract

:
Despite the recognized benefits of fecal occult blood test (FOBT) and mammography screenings, participation in breast (BC) and colorectal cancer (CRC) screening programs is still suboptimal. This study investigates municipal characteristics associated with their BC/CRC screening uptake profiles among women aged 55–69 years. Using data from 308 municipalities of Flanders from 2014 to 2017, a profile for each municipality based on its BC/CRC screening uptake compared with the median screening uptake was created. Logistic regression with generalized estimating equations was used to assess the associations between municipal characteristics and BC/CRC screening uptake profiles. The overall median uptake of cancer screening was higher for CRC (57.4%) than for BC (54.6%). The following municipal characteristics were associated with worse performance in terms of only CRC, only BC, or both CRC and BC screening uptake, respectively: foreign nationality, self-employment rate, (early) retirement rate, diabetes, disabilities; (early) retirement rate; age group 65–69, foreign nationality, self-employment rate, (early) retirement rate, wage-earners, diabetes. The following municipal characteristics were associated with better performance in terms of only CRC, only BC, or both CRC and BC screening uptake respectively: residential stability, having a partner, having children, jobseeker rate, GP visits, preventive dental visits; having children, GP visits; age group 55–59, residential stability, having a partner, having children, jobseeker rate, higher education, GP visits, preventive dental visits. This study’s results regarding the interrelation between the BC and CRC screening could be used to tailor interventions to improve the participation of the target population in both programs.

1. Introduction

According to the World Health Organization’s GLOBOCAN database, breast cancer (BC) ranks first in terms of cancer incidence globally, with over two million cases diagnosed each year [1]. It represents the leading cause of cancer death among women. Belgium has the highest global rate of breast cancer (BC) [2], with an age-standardized rate of 105.3 per 100,000 person-years. Flanders, in particular, has the highest incidence, with an age-standardized rate of 106.2 per 100,000 person-years [3]. Colorectal cancer (CRC), the third most commonly diagnosed cancer in males and the second in females, ranks second in terms of mortality worldwide [2]. Belgium ranks 14th in terms of CRC incidence rate [4], with an age-standardized rate of CRC of 36.1 per 100,000 person-years in males and 25.8 per 100,000 person-years in females. In Flanders, in 2019, CRC was the second most common cancer in females and third in males [3].
Screening is an excellent preventive intervention for the early detection of cancer and can improve patient prognosis for both BC and CRC. Prior literature has shown that BC screening mammography programs (targeting ages 40–70) can save approximately 1.2 lives per 1000 over 12 years [5], and CRC screening programs offering annual fecal occult blood test (FOBT) (targeting ages 50–75) can save approximately 3 lives per 1000 over 13 years [6]. In terms of relative impact, FOBT and mammography screenings result in a similar magnitude of reduction in cancer deaths: 14–32% for BC [7] and 30% for CRC [8].
Despite the recognized benefits of screening, however, the uptake of both programs is still suboptimal in Flanders, with just over half of the target population participating in the organized screening program for both BC and CRC screening [9]. Understanding the determinants of screening participation in each program is therefore crucial. Nevertheless, rarely have these been investigated in a communal target population. The aim of this study is to provide insight into the municipal-level determinants of screening participation in the target population for both BC and CRC screening (women aged 55–69 years). The evidence collected can be used to inform and guide more holistic interventions to effectively increase screening uptake in both the BC and CRC screening programs.

2. Methods

2.1. Study Setting and Data Source

The present study used municipality-level data from 308 Flemish municipalities from 2014 to 2017. The data from the Centre for Cancer Detection on organized colorectal cancer (CRC) and breast cancer (BC) screening uptake—defined as the number of people who participate in screening within 12 months after invitation, divided by the number of people invited—[10] were linked to socioeconomic, demographic and health-related municipal parameters from the Flemish provincial authorities [11]. Privacy was warranted since only aggregated data at the municipality level were used, and figures were not displayed for cells with less than five events.
A breast cancer screening program (BCSP) has been in place in Flanders since 2001 [12]. The program provides a mammographic screening test on a two-year basis paid by the health insurance system to all eligible women aged 50–69, actively recruited through a personalized invitation letter with a fixed time and place sent by the Centre for Cancer Detection.
The organized colorectal screening program (CRCSP), offering a free of charge fecal immunochemical test (FIT) every two years to all individuals aged 50–74, actively recruits through a personalized invitation letter and has been in place since 2013 [13]. Target ages have been gradually extended from 56–74 in 2013 to 50–74 in 2020.
Both programs align with the European Guidelines for Quality Assurance [14,15].

2.2. Study Design and Objective

The objective of the present study is to identify the factors associated with breast and colorectal cancer screening uptake in Flemish municipalities and the potential interrelationships between the two screening programs. To accomplish this objective, municipality-level characteristics were linked to screening uptake among Flemish women 55–69 years of age, representing the communal target population of both screening programs.
Because screening uptake among municipalities was not normally distributed, we compared the uptake of each municipality with the median uptake of all 308 municipalities, calculated for each year of the study period. Then, a profile for each municipality based on its BC/CRC screening uptake compared with the median screening uptake across all municipalities (four possible profiles) was created as follows:
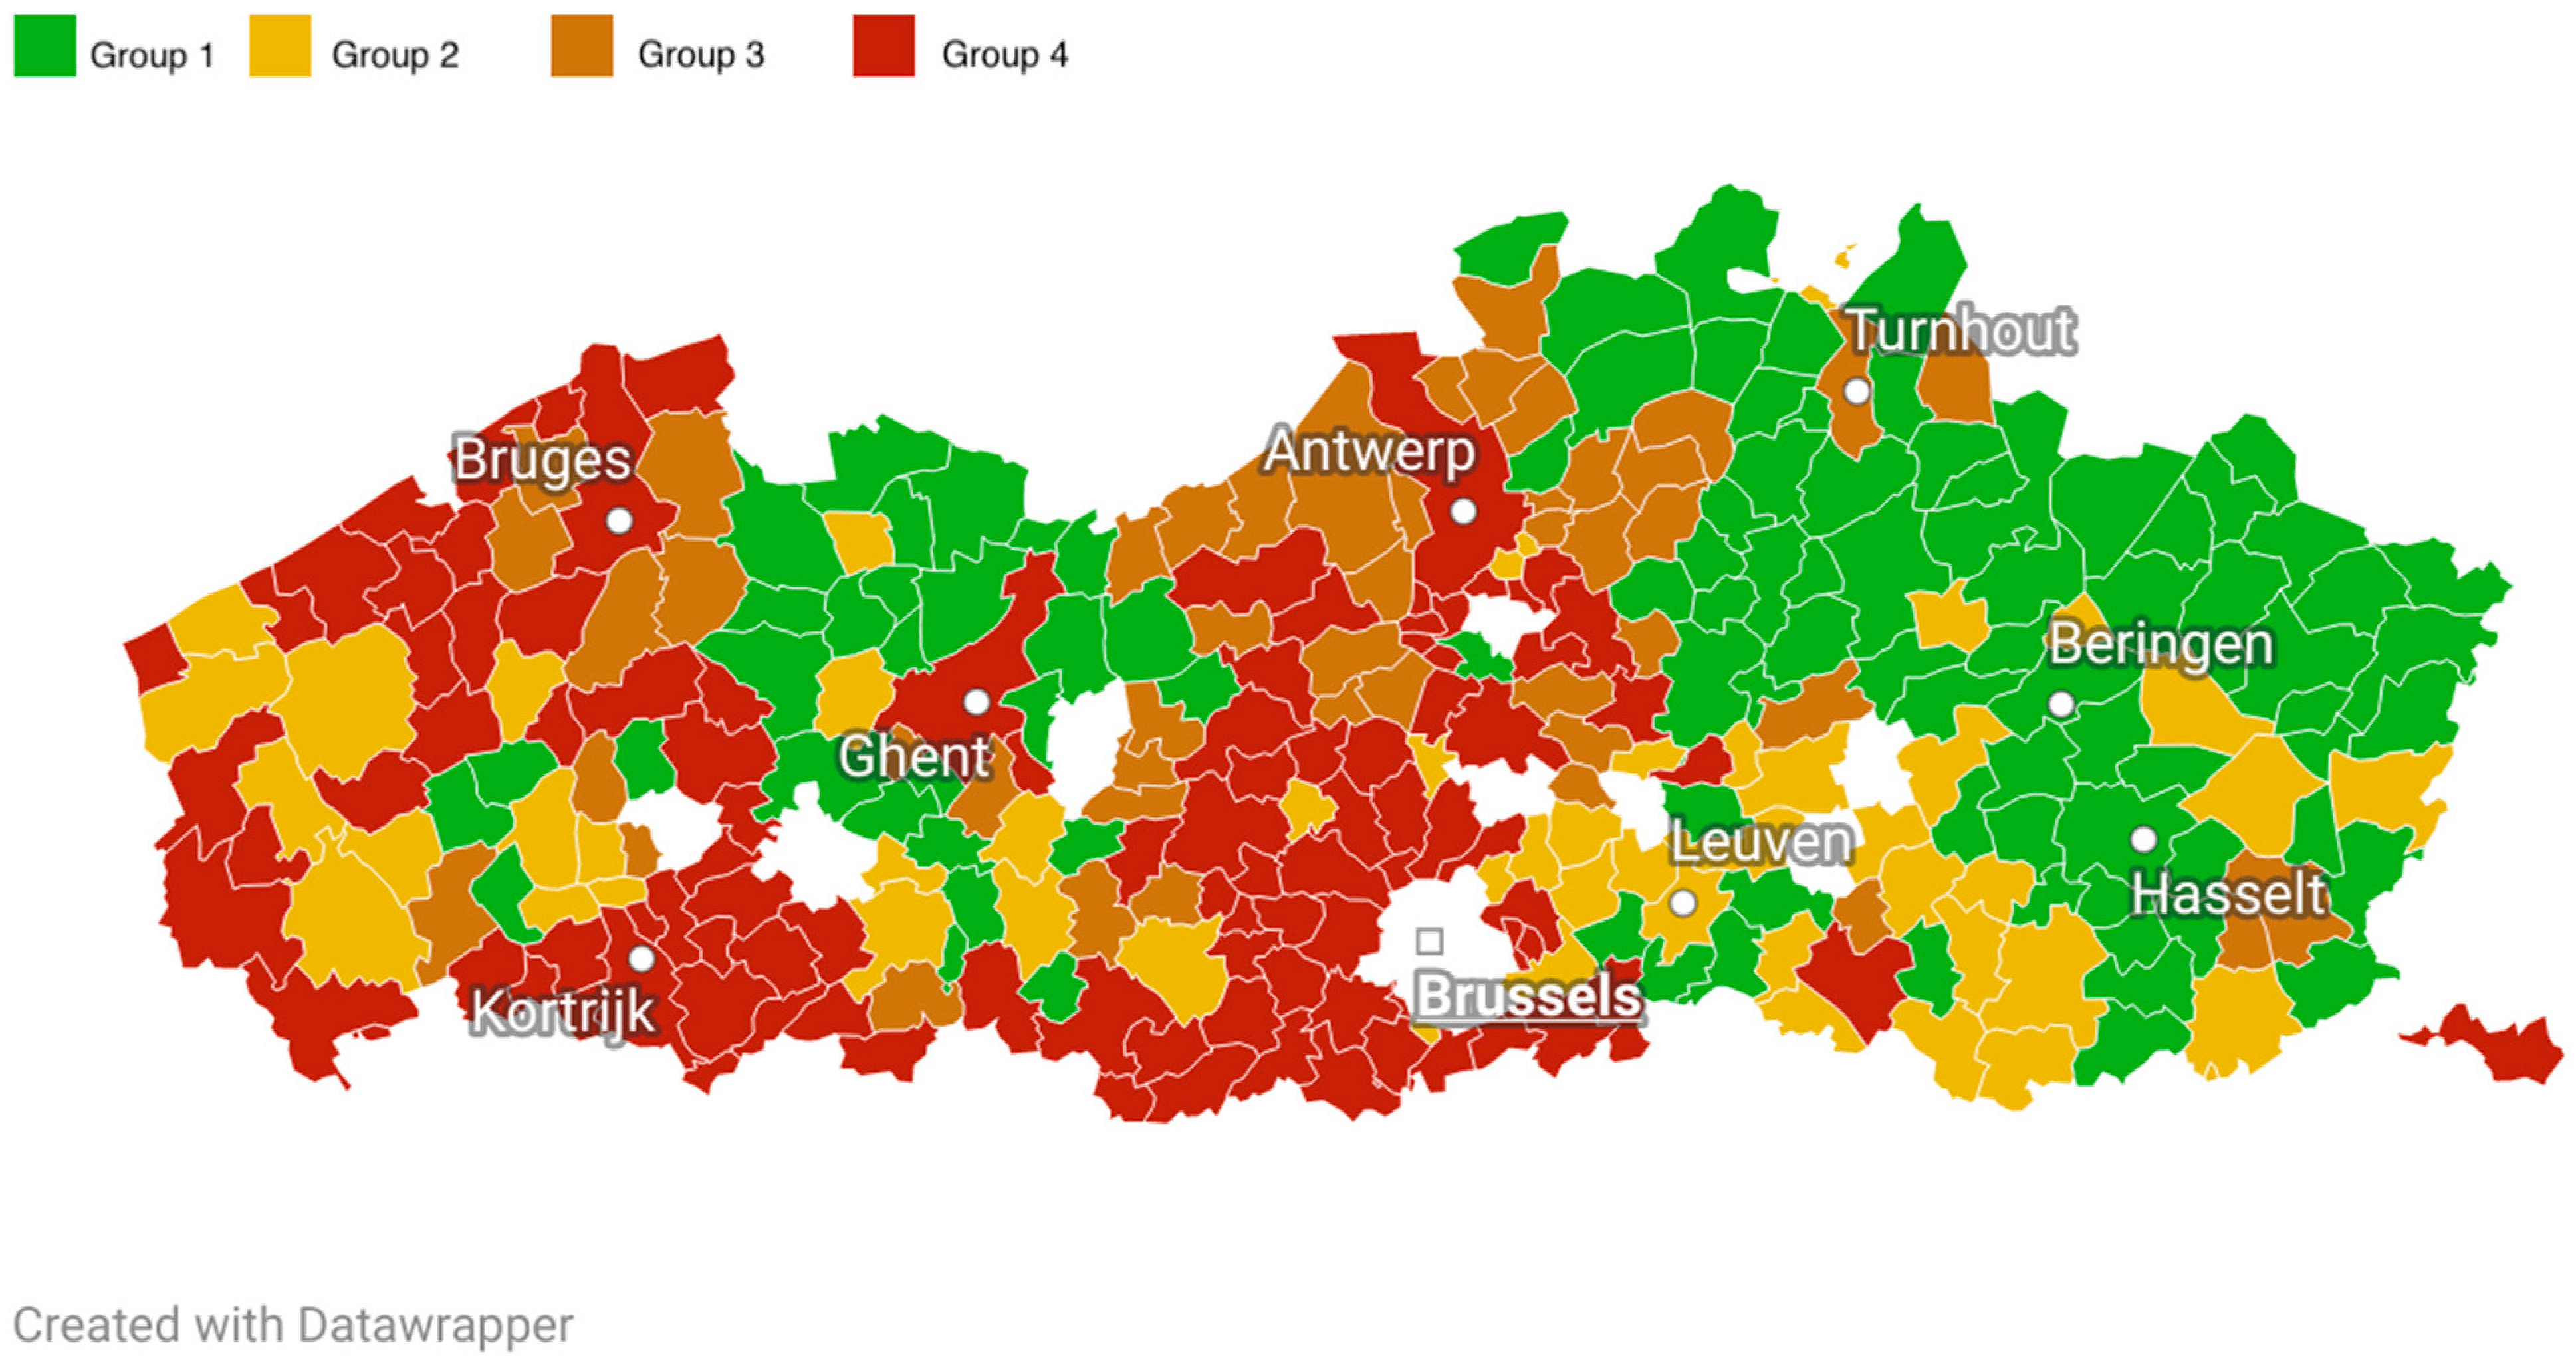
  • Group 1: BC municipal uptake ≥ median uptake of Flemish municipalities, CRC municipal uptake ≥ median uptake of Flemish municipalities (“high BC, high CRC”);
  • Group 2: BC municipal uptake ≥ median uptake of Flemish municipalities, CRC municipal uptake < median uptake of Flemish municipalities (“high BC, low CRC”);
  • Group 3: BC municipal uptake < median uptake of Flemish municipalities, CRC municipal uptake ≥ median uptake of Flemish municipalities (“low BC, high CRC”);
  • Group 4: BC municipal uptake < median uptake of Flemish municipalities, CRC municipal uptake < median uptake of Flemish municipalities (“low BC, low CRC”).

2.3. Determinants

Fourteen municipal parameters were investigated as potential factors associated with BC and CRC screening uptake. These included:
Demographic variables:
  • Age group (group 1: females aged between 55 and 59 years old; group 2: females aged between 60 and 64 years old; group 3: females aged between 65 and 69 years old) (%)
  • Average household size (n)
  • Residential stability (same address as previous year) (%)
  • Having a partner (%)
  • Having child(ren) (%)
  • Foreign nationality (%)
  • Socio-economic variables:
  • Average income (EUR)
  • Position in the labor market (job seekers, wage-earners, self-employed, (early) retired) (%)
  • Students in higher education (%)
  • Health-related variables:
  • Chronic conditions (%)
  • Diabetes (%)
  • Disabilities (%)
  • General practitioner (GP) visits (%)
  • Preventive dental visits (%)
With the exception of “average household size” and “average income”, all listed variables were expressed as rates. These were measured over the total population (both males and females) of each municipality and were used as a proxy for the characteristics of the female target population. Instead, the rates of each age group were calculated exclusively over the female target population. Because of the substantial cultural and linguistic similarities between Belgium and the Netherlands (Dutch being the official Flemish language), people without either of these nationalities were referred to as foreigners. Within each municipality, the percentage of residents aged 18–24 studying at a college/university (higher education) was used as a proxy for education level. Additional details on the included variables are available in Supplementary Material (Table S1) and online at https://provincies.incijfers.be/databank (accessed on 1 February 2021).

2.4. Covariates for Adjustment

To minimize possible collider biases [16], a causal directed acyclic graph (DAG) based on prior knowledge about the Flemish organized screening programs [17], ref. [18] was employed to identify covariates for adjustment when assessing the associations between municipal characteristics and profile of BC/CRC screening uptake. A multidisciplinary brainstorming session was organized between a medical doctor, two epidemiologists (amongst whom the program manager of the Flemish CRC screening program), and a sociologist to conceptualize the exposure–outcome relationship. DAGs have become an established framework for the analysis of causal inference in epidemiology and are used to show how associations translate into causal relations [19]. The final covariates for adjustment in multivariable analysis and DAG are available in Supplementary Material (Table S2, Figure S1) and online at http://dagitty.net/dags.html?id=ck1-_X (accessed on 30 November 2021).

2.5. Statistical Analysis

At least 10 events per variable are required for accurate coefficient estimation in multinomial logistic regression models [20]. This study included 17 determinants and 308 municipalities carrying independent data on screening uptake to provide a sample size with sufficient statistical power. Not normally distributed continuous variables were calculated using median values.
Each municipality was assigned a screening uptake profile (study outcome), with group 1 as the reference group in all analyses (Group 1: high BC, high CRC; Group 2: high BC, low CRC; Group 3: low BC, high CRC, Group 4: low BC, low CRC).
In order to account for repeated measures, multinomial logistic regression analysis with generalized estimating equation (GEE) was used to evaluate the associations between considered determinants and BC/CRC screening uptake profiles. In the GEE model, the dependent variable was the municipal profile of the BC/CRC screening uptake, and the independent variables were the municipal characteristics. Adjusted odds ratios (ORs) were reported with 95% confidence intervals (95% CIs). Multicollinearity in multivariate models was checked using variance inflation factors (VIFs). p-values < 0.05 (two-sided) were considered statistically significant. All analyses were performed with R (version 4.0.3) [21].

3. Results

3.1. Municipal Characteristics

Data from all 308 municipalities in Flanders for the period of 2014 to 2017 were included.
Considering women only, the overall median uptake of all years and municipalities was 54.6% for BC screening uptake and 57.4% for CRC screening uptake. In particular, uptake rates were, for BC and CRC screening, respectively, 52% and 56.6% in 2014, 54.5% and 56.5% in 2015, 55.2% and 59% in 2016 and 56.9% and 57.9% in 2017.
Median values and range (defined as the lowest and the highest values) of the included municipal characteristics grouped, for each year, by BC/CRC screening uptake municipality profiles (Group 1: high BC, high CRC; Group 2: high BC, low CRC; Group 3: low BC, high CRC, Group 4: low BC, low CRC) are shown in Table 1.
Figure 1 displays a map of Flanders showing the assigned municipality uptake profile based on the mode across all years. Municipalities for which it was not possible to find a mode are represented in white. Additional maps showing the mode for each year can be found in the Supplementary Material (Figure S2).

3.2. Factors Associated with BC/CRC Screening Uptake

As above mentioned, each municipality was assigned a screening uptake profile and Group 1 (“high BC, high CRC”) was used as the reference group in all analyses. As a consequence, municipalities with characteristics that are negatively associated (OR < 1) with Group 2 (“high BC, low CRC”), Group 3 (“low BC, high CRC”), or Group 4 (“low BC, low CRC”) are more likely, in comparison to the median uptake of all Flemish municipalities, to have a better performance in terms of screening uptake (more likely to be in Group 1, our reference group). By contrast, municipalities with characteristics that are positively associated (OR > 1) with Group 2 (“high BC, low CRC”) or Group 3 (“low BC, high CRC”) are more likely to perform, in comparison to the median uptake of all Flemish municipalities, better with regards to one screening and worse with regards to the other. Accordingly, municipalities with characteristics that are positively associated (OR > 1) with Group 4 (“low BC, low CRC”) are more likely to have worse performance in terms of screening uptake for both BC and CRC in comparison to the median uptake of Flemish municipalities.
Multicollinearity in multivariate models was low (VIFs < 5). Results after covariate adjustment are presented in Table 2 and graphically summarized in Figure 2.

3.2.1. Factors Associated with Higher BC/CRC Screening Uptake

Municipalities with a higher percentage of jobseekers, people with a partner, people living at the same address as the previous year and people with at least 2 preventive dental visits in last 3 years were less likely to be in Group 2 (“high BC, low CRC”) [OR 0.23 (95% CI 0.13–0.39), OR 0.71 (95% CI 0.59–0.87) and OR 0.90 (95% CI 0.86–0.95) respectively] or Group 4 (“low BC, low CRC”) [OR (0.28 (95% CI 0.16–0.50), OR 0.60 (95% CI 0.50–0.71), and OR 0.93 (95% CI 0.88–0.97), respectively], compared to Group 1. In other words, these municipalities were more likely to have “high BC, high CRC” compared to “high BC, low CRC” or “low BC, low CRC”. Moreover, municipalities with a higher percentage of females aged 55–59 [OR (0.90 (95% CI 0.82–0.99)] and people in higher education [OR (0.94 (95% CI 0.90–0.99)] were also less likely to be in Group 4 vs. Group 1, meaning that these municipalities were more likely to have “high BC, high CRC” compared to “low BC, low CRC”.
Finally, municipalities with a higher percentage of people with at least 1 GP contact in the last 12 months and people with children were less likely to be both in Group 2 (“high BC, low CRC”) [OR (0.84 (95% CI 0.71–0.98) and OR (0.81 (95% CI 0.58–0.77), respectively], Group 3 (“low BC, high CRC”) [OR 0.76 (95% CI 0.65–0.89) and OR 0.76 (95% CI 0.63–0.92) respectively] and Group 4 (“low BC, low CRC”) [OR 0.72 (95% CI 0.60–0.86) and OR (0.72 (95% CI 0.59–0.87), respectively], in comparison to Group 1. In other words, these municipalities were more likely to have “high BC, high CRC” compared to “high BC, low CRC”, “low BC, high CRC” and “low BC, low CRC”.

3.2.2. Factors Associated with Lower BC/CRC Screening Uptake

Municipalities with a higher percentage of foreigners, self-employed and people with diabetes were more likely to be in Group 2 (“high BC, low CRC”) [OR 1.30 (95% CI 1.19–1.42), OR 1.17 (95% CI 1.06–1.30) and OR 2.59 (95% CI 1.80–3.72) respectively] or Group 4 (“low BC, low CRC”) [OR 1.36 (95% CI 1.24–1.49), OR 1.14 (95% CI 1.01–1.28), and OR 2.72 (95% CI 1.87–3.96), respectively], compared to Group 1. Moreover, municipalities with a higher percentage of people with disabilities [OR 1.14 (95% CI 1.03–1.27)] were more likely to be in Group 2 (“high BC, low CRC”) vs. Group 1, and municipalities with a higher percentage of women aged 65–69 [OR 1.16 (95% CI 1.04–1.29)] and wage earners [OR 1.09 (95% CI 1.00–1.19)] were more likely to be in Group 4 (“low BC, low CRC”) vs. Group 1.
Lastly, municipalities with a higher percentage of (early) retired were more likely to be both in Group 2 (“high BC, low CRC”) [OR 1.29 (95% CI 1.11–1.51), Group 3 (“low BC, high CRC”) [OR 1.20 (95% CI 1.04–1.37)] and Group 4 (“low BC, low CRC”) [OR 1.3 (95% CI 1.17–1.55)], in comparison to Group 1.

4. Discussion

In this study, we found that, considering women only, the overall median uptake of cancer screening during the study period was 57.4% for CRC and 54.6% for BC. The median uptake rate of both screening programs is within the range of uptake levels of European countries (respectively 48.2% (range: 19.4–88.9%) for BC [22] and 45.4% (range: 19.9–68.2%) for CRC in both sex [23]).
Demographic, socioeconomic and health-related characteristics were significantly associated with the BC/CRC screening uptake profiles.
We found the percentage of foreigners to be associated with a lower probability of screening for CRC and BC. These findings are consistent with previous observations at both municipal and individual levels [17,24,25] and can be explained by the reported perceived language barriers and embarrassment when talking about screening [26]. Moreover, migrants are a high-risk group for limited health literacy. This means that individuals among this group may experience greater difficulties, compared to non-immigrant individuals, in processing health information and translating it into healthy behaviors [27].
With regards to health status, we found that the percentage of people with diabetes is associated with a lower screening uptake for CRC and BC. A possible explanation is that people with pre-existing conditions tend to prioritize disease-related care over routine preventive care. Previous evidence has shown that screening rates are about 17% and 14% lower for BC and CRC screening, respectively, in women with diabetes, which is particularly alarming when we consider that adults with type 2 diabetes have an increased risk of cancer mortality [28].
Other health priorities may as well be a reason for the association between disabilities and a lower CRC screening uptake. Participation in CRC and BC screening programs, in fact, has been previously shown to be about 10% less in persons with disabilities in comparison with the Flemish average [29]. Other studies have found that the probability of undergoing screening for CRC, among people with disabilities, is lower than among people without disability [30,31]. These evidences point to the need for effective interventions aimed at reducing disparities and improving access to care among more vulnerable individuals. In this regard, healthcare providers have both the power and responsibility to guide patients’ decision-making processes and positively influence screening participation [32,33]. In accordance with a previous study on CRC conducted in Flanders [17] we have found that a higher percentage of people with at least one general practitioner (GP) visit in the previous year is associated with higher uptake of both CRC and BC screening.
Also, consistently with previous evidence [18], we found that a higher percentage of people who underwent at least 2 preventive dental visits in previous 3 years was associated with higher uptake of CRC and BC screening. Considering that dental visits are not fully covered by the health insurance system in Flanders, a higher dental care may be a strong indicator of predisposition towards preventive health behaviors.
With regards to the age groups considered, although it has been well reported that people from the younger age groups tend to participate less in screening [17], we found that a higher percentage of people aged 55–59 was associated with higher uptake for both BC and CRC, while a higher percentage of people aged 65–69 was associated with lower uptake for both BC and CRC. Although in this study we could not assess the oldest age group participating in CRC screening (ages 70–74) because it is not included in the BC screening target population, previous studies have found a negative association between people aged 70–74 and FOBT screening in Flanders [17] and other European countries [34]. Moreover, we found that (early) retired, which partly constitute the older age group, participate less in screening as well. It is plausible that, tending to suffer from multiple health issues that may need prioritization, also perceiving a lower life expectancy, which has been shown to be associated with worse screening participation [35], the elders are inclined to participate less in screening. These findings are particularly relevant when we consider that age is a major risk factor for sporadic cancer and age-specific incidence rates tend increase in each succeeding decade after ages 40–50 [36].
With regards to socio-economic status, present findings did not support a strong association between income and screening utilization. This is not surprising since the Flemish screening programs do not impose any direct cost on the individual. On the contrary, with regards to position in the labor market, we found that while percentage of people with a source of income (wage earners, self-employed and (early) retired) is significantly associated with lower screening uptake, the rate of jobseekers is associated with higher screening uptake. These data confirm previous results on CRC and BC screening which have shown that, in comparison with employees and entrepreneurs, jobseekers are more likely to participate in screening [17,18]. It is plausible that, in comparison with active workers, jobseekers have more free time to participate in screening and, because screening is completely free of charge, there are no financial barriers to participating. In addition, people occupying other positions in the labor market may have access to higher financial means and opt to screen outside of the program (opportunistic screening), paying out-of-pocket for diagnostic tests.
In accordance with other studies [37,38,39], our results show that having children and/or a partner may have a positive effect on uptake of both BC and CRC screening. Marital status has been suggested as a proxy for social support [39] and several studies have shown that married individuals are more likely to adopt preventive and healthy lifestyles or that spouses can influence their partner’s awareness and engagement in health-seeking behaviors [40]. Accordingly, parents are more likely to undergo screening and maintain a healthy lifestyle in order to provide for their children needs [37].
Finally, we found the percentage of people in higher education and people living at the same address as the previous year to also be associated with a higher uptake of CRC and BC screening. Higher education (as a proxy for education level and health literacy) may facilitate comprehension of screening information and, therefore, adhesion to preventive behaviors [27]. Moreover, with regard to FOBT screening, higher health literacy may help overcome psychological barriers related to stool collection [17,32]. Residential stability (same address), on the other hand, guarantees that invitation letters arrive at the correct address.
Flanders offers an interesting scenario in which to study screening participation patterns. In Figure 1, we can observe a noticeable difference in BC/CRC screening uptake profiles between the areas closer to the French-speaking southern part (Wallonia) and the northeastern part of Flanders, closer to the border with the Netherlands. The two areas tend to perform the worst (more chances of being in Group 4 vs. 1) and best (fewer chances of being in Group 4 vs. 1), respectively. In Flanders, each municipality has relative autonomy in health promotion and disease prevention actions which, along with sociodemographic (e.g., SES, number of immigrants, spoken languages) and cultural differences among these communities, may explain the variations in uptake. In particular, inhabitants closer to the border with Wallonia may have developed a higher affinity with the healthcare services of the region, where most are screened outside the organized program following consultations with their GPs or gynecologists [41]. It is also possible that a number of these women have moved from Wallonia to Flanders and carried on the habit of opportunistic screening. Additional analyses, not yet published, indicate that municipalities in these areas have a high BC outside screening coverage (but a low CRC outside screening coverage). While this data may partially support the hypothesis of a tendency towards opportunistic screening, more in-depth analyses of screening patterns in these areas are needed.
Some limitations need to be acknowledged. First, in this study, we employed data aggregated at a municipal level which, with regards to screening uptake, was subcategorized in four different municipal profiles for BC/CRC screening. This may lead to ecological fallacy, which means incorrect assumptions about individuals based on data for a group to which those individuals belong [42]. Second, with the exception of age, the other independent variables were measured for the complete municipality population and used as a proxy for the study target population. Despite the limitations, our results substantiate previous findings at both municipal [17,18,24,25,29] and individual [26] levels.
A key strength of this study is that the use of administrative data minimizes possible recall biases associated with self-reported data. In addition, the use of DAG to identify covariates for adjustment allowed us to avoid collider biases (see Section 2).
Retrieved data should be used to tailor interventions with the intent of improving knowledge about the importance of early detection of both BC and CRC and increasing screening uptake, particularly among women presenting with the characteristics which are common within municipalities that perform worse in terms of BC and CRC screening uptake. For example, given that foreign nationality has been associated with lower screening uptake, it is important to be mindful of the possible cultural and language barriers that may exist within our target population and therefore attempt to tailor invitation letters and informative content to these needs.
In addition, it is important to actively ensure that the presence of any pre-existing condition (older age, having diabetes, having a disability) does not overshadow the importance of preventative screening. In this regard, it is imperative to reduce healthcare access barriers and facilitate communications between patients and healthcare providers. GPs, in particular, should remain up to date regarding the need for cancer screening and should be given the tools with which to promote screening adherence among their patients.

5. Conclusions

The present study was the first to compare CRC and BC screening uptake in a target population for both screenings in Flanders. The collected evidence allows for better identification of those community members towards which it is especially crucial to tailor interventions and raise awareness about the importance of early cancer detection within the organized screening programs.
In addition, this study allowed us to explore the existing interrelationships between the two programs and the geographical differences in screening participation patterns in Flanders. Further studies are needed to identify the social and cultural roots of these differences as well as possible intervention measures.

Supplementary Materials

The following supporting information can be downloaded at: https://www.mdpi.com/article/10.3390/gidisord4020010/s1. Table S1: Potential municipal characteristics associated with BC/CRC screening uptake; Table S2: Covariates for adjustment in multivariable analyses to estimate the association between each municipal characteristic and profile of BC/CRC screening uptake; Figure S1: Causal directed acyclic graph (DAG) built to identify covariates for adjustment in multivariable analyses.; Figure S2: Maps of Flanders municipalities (division before 2019) displaying municipality uptake profiles (2014–2017). Causal directed acyclic graph (DAG) is also available online at: http://dagitty.net/dags.html?id=ck1-_X (accessed on 30 November 2021).

Author Contributions

Conceptualization, A.F., T.N.T. and G.V.H.; writing—original draft preparation, A.F. and T.N.T.; writing—review and editing, G.V.H., S.H., T.N.T., A.F., M.G. and M.P.; statistical analysis: T.N.T. and A.F.; visualization, A.F.; supervision, G.V.H., M.G. and M.P. All authors have read and agreed to the published version of the manuscript.

Funding

This research received no external funding.

Data Availability Statement

Data on screening uptake, gender and age-specific proportions of the target screening population can be requested by contacting the Centre for Cancer Detection in Flanders at https://www.bevolkingsonderzoek.be/ (accessed on 2 January 2022). Data on demographic, socioeconomic and health-related variables are publicly available on the https://provincies.incijfers.be/databank website (accessed on 2 January 2022).

Acknowledgments

We would like to thank Irene Schiavetti (University of Genoa, Department of Health Sciences) for her valuable support and constructive suggestions relative to statistical analysis and presentations of results.

Conflicts of Interest

The authors declare no conflict of interest.

References

  1. World Health Organization (WHO); International Agency for Research on Cancer (IARC). Global Cancer Observatory. Available online: https://gco.iarc.fr/ (accessed on 2 January 2021).
  2. Bray, F.; Ferlay, J.; Soerjomataram, I.; Siegel, R.L.; Torre, L.A.; Jemal, A. Global Cancer Statistics 2018: Globocan Estimates of Incidence and Mortality Worldwide for 36 Cancers in 185 Countries. CA Cancer J. Clin. 2018, 68, 394–424. [Google Scholar] [CrossRef] [PubMed] [Green Version]
  3. Belgian Cancer Registry. Cancer Fact Sheets. Available online: https://kankerregister.org/Cancer_Fact_Sheets (accessed on 2 January 2021).
  4. Center, M.M.; Jemal, A.; Smith, R.A.; Ward, E. Worldwide Variations in Colorectal Cancer. CA. Cancer J. Clin. 2009, 59, 366–378. [Google Scholar] [CrossRef] [PubMed] [Green Version]
  5. Gøtzsche, P.C.; Olsen, O. Is Screening for Breast Cancer with Mammography Justifiable? Lancet 2000, 355, 129–134. [Google Scholar] [CrossRef]
  6. Mandel, J.S.; Bond, J.H.; Church, T.R.; Snover, D.C.; Bradley, G.M.; Schuman, L.M.; Ederer, F. Reducing Mortality from Colorectal Cancer by Screening for Fecal Occult Blood. Minnesota Colon Cancer Control Study. N. Engl. J. Med. 1993, 328, 1365–1371. [Google Scholar] [CrossRef] [PubMed] [Green Version]
  7. Nelson, H.D.; Fu, R.; Cantor, A.; Pappas, M.; Daeges, M.; Humphrey, L. Effectiveness of Breast Cancer Screening: Systematic Review and Meta-Analysis to Update the 2009 U.S. Preventive Services Task Force Recommendation. Ann. Intern. Med. 2016, 164, 244–255. [Google Scholar] [CrossRef]
  8. Lin, J.S.; Piper, M.A.; Perdue, L.A.; Rutter, C.M.; Webber, E.M.; O’Connor, E.; Smith, N.; Whitlock, E.P. Screening for Colorectal Cancer: Updated Evidence Report and Systematic Review for the US Preventive Services Task Force. JAMA 2016, 315, 2576–2594. [Google Scholar] [CrossRef] [Green Version]
  9. Centre for Cancer Detection. Monitoring Report of the Flemish Colorectal Cancer Screening Programme 2019. Available online: https://www.bevolkingsonderzoek.be (accessed on 2 January 2021).
  10. Centre for Cancer Detection. Available online: https://bevolkingsonderzoek.incijfers.be/jive (accessed on 1 February 2021).
  11. Flemish Provincial Authorities. Available online: https://provincies.incijfers.be/databank (accessed on 1 February 2021).
  12. Goossens, M.; Van Hal, G.; Van der Burg, M.; Kellen, E.; Van Herck, K.; De Grève, J.; Martens, P.; Van Limbergen, E. Quantifying Independent Risk Factors for Failing to Rescreen in a Breast Cancer Screening Program in Flanders, Belgium. Prev. Med. 2014, 69, 280–286. [Google Scholar] [CrossRef]
  13. Hoeck, S.; Pringels, S.; Kellen, E.; Van Herck, K.; Martens, P.; Van Limbergen, E.; Francart, J.; Van Hal, G. First Results of the Flemish Colorectal Cancer Screening Program: Start-up-Period Late 2013. Acta Gastro-Enterol. Belg. 2016, 79, 421–428. [Google Scholar]
  14. Directorate-General for Health and Consumers (European Commission); Executive Agency for Health and Consumers (European Commission); World Health Organization; von Karsa, L.; Patnick, J.; Segnan, N. European Guidelines for Quality Assurance in Colorectal Cancer Screening and Diagnosis; Publications Office of the European Union: Luxembourg, 2010.
  15. Directorate-General for Health and Consumers (European Commission); von Karsa, L.; Holland, R.; Broeders, M.; de Wolf, C.; Perry, N.; Törnberg, S. European Guidelines for Quality Assurance in Breast Cancer Screening and Diagnosis, 4th ed.; Publications Office of the European Union: Luxembourg, 2013.
  16. Velentgas, P.; Dreyer, N.A.; Nourjah, P.; Smith, S.R.; Torchia, M.M. (Eds.) Developing a Protocol for Observational Comparative Effectiveness Research: A User’s Guide; AHRQ Methods for Effective Health Care; Agency for Healthcare Research and Quality (US): Rockville, MD, USA, 2013. [Google Scholar]
  17. Tran, T.N.; Van Hal, G.; Peeters, M.; Jidkova, S.; De Schutter, H.; Hoeck, S. Population-Based Data Reveal Factors Associated with Organised and Non-Organised Colorectal Cancer Screening: An Important Step towards Improving Coverage. Int. J. Environ. Res. Public Health 2021, 18, 8373. [Google Scholar] [CrossRef]
  18. Ding, L.; Jidkova, S.; Greuter, M.J.W.; Van Herck, K.; Goossens, M.; Martens, P.; de Bock, G.H.; Van Hal, G. Coverage Determinants of Breast Cancer Screening in Flanders: An Evaluation of the Past Decade. Int. J. Equity Health 2020, 19, 212. [Google Scholar] [CrossRef]
  19. Textor, J.; van der Zander, B.; Gilthorpe, M.S.; Liskiewicz, M.; Ellison, G.T. Robust Causal Inference Using Directed Acyclic Graphs: The R Package “Dagitty”. Int. J. Epidemiol. 2016, 45, 1887–1894. [Google Scholar] [CrossRef] [PubMed] [Green Version]
  20. de Jong, V.M.T.; Eijkemans, M.J.C.; van Calster, B.; Timmerman, D.; Moons, K.G.M.; Steyerberg, E.W.; van Smeden, M. Sample Size Considerations and Predictive Performance of Multinomial Logistic Prediction Models. Stat. Med. 2019, 38, 1601–1619. [Google Scholar] [CrossRef] [PubMed]
  21. R Foundation for Statistical Computing, Vienna, Austria. Available online: https://www.r-project.org/foundation/ (accessed on 20 November 2021).
  22. Giordano, L.; Von Karsa, L.; Tomatis, M.; Majek, O.; De Wolf, C.; Lancucki, L.; Hofvind, S.; Nystrom, L.; Segnan, N.; Ponti, A. Mammographic Screening Programmes in Europe: Organization, Coverage and Participation. J. Med. Screen. 2012, 19 (Suppl. S1), 72–82. [Google Scholar] [CrossRef] [PubMed] [Green Version]
  23. Navarro, M.; Nicolas, A.; Ferrandez, A.; Lanas, A. Colorectal Cancer Population Screening Programs Worldwide in 2016: An Update. World J. Gastroenterol. 2017, 23, 3632–3642. [Google Scholar] [CrossRef] [PubMed]
  24. Hoeck, S.; van de Veerdonk, W.; De Brabander, I.; Kellen, E. Does the Flemish Colorectal Cancer Screening Programme Reach Equity in FIT Uptake? Eur. J. Public Health 2019, 29, 1108–1114. [Google Scholar] [CrossRef] [PubMed]
  25. Ding, L.; Jidkova, S.; Greuter, M.J.W.; Van Herck, K.; Goossens, M.; De Schutter, H.; Martens, P.; Van Hal, G.; de Bock, G.H. The Role of Socio-Demographic Factors in the Coverage of Breast Cancer Screening: Insights from a Quantile Regression Analysis. Front. Public Health 2021, 9, 648278. [Google Scholar] [CrossRef] [PubMed]
  26. Hoeck, S.; Van Roy, K.; Willems, S. Barriers and Facilitators to Participate in the Colorectal Cancer Screening Programme in Flanders (Belgium): A Focus Group Study. Acta Clin. Belg. 2020, 77, 37–44. [Google Scholar] [CrossRef]
  27. Baumeister, A.; Aldin, A.; Chakraverty, D.; Monsef, I.; Jakob, T.; Seven, Ü.S.; Anapa, G.; Kalbe, E.; Skoetz, N.; Woopen, C. Interventions for Improving Health Literacy in Migrants. Cochrane Database Syst. Rev. 2019, 65, 54–64. [Google Scholar] [CrossRef]
  28. Rao Kondapally Seshasai, S.; Kaptoge, S.; Thompson, A.; Di Angelantonio, E.; Gao, P.; Sarwar, N.; Whincup, P.H.; Mukamal, K.J.; Gillum, R.F.; Holme, I.; et al. Emerging Risk Factors Collaboration. Diabetes Mellitus, Fasting Glucose, and Risk of Cause-Specific Death. N. Engl. J. Med. 2011, 364, 829–841. [Google Scholar] [CrossRef] [Green Version]
  29. Kellen, E.; Nuyens, C.; Molleman, C.; Hoeck, S. Uptake of Cancer Screening among Adults with Disabilities in Flanders (Belgium). J. Med. Screen. 2020, 27, 48–51. [Google Scholar] [CrossRef]
  30. Gofine, M.; Mielenz, T.J.; Vasan, S.; Lebwohl, B. Use of Colorectal Cancer Screening among People with Mobility Disability. J. Clin. Gastroent. 2018, 52, 789–795. [Google Scholar] [CrossRef] [PubMed]
  31. Steele, C.B.; Townsend, J.S.; Courtney-Long, E.A.; Young, M. Prevalence of Cancer Screening among Adults with Disabilities, United States, 2013. Prev. Chronic Dis. 2017, 14, 160312. [Google Scholar] [CrossRef] [PubMed] [Green Version]
  32. Tran, T.N.; Ferrari, A.; Hoeck, S.; Peeters, M.; Van Hal, G. Colorectal Cancer Screening: Have We Addressed Concerns and Needs of the Target Population? Gastrointest. Disord. 2021, 3, 173–203. [Google Scholar] [CrossRef]
  33. Jensen, L.F.; Mukai, T.O.; Andersen, B.; Vedsted, P. The Association between General Practitioners Attitudes towards Breast Cancer Screening and Women’s Screening Participation. BMC Cancer 2012, 12, 254. [Google Scholar] [CrossRef] [Green Version]
  34. Cancer Screening in the European Union (2017). Report on the Implementation of the Council Recommendation on Cancer Screening (Second Report). Available online: https://screening.iarc.fr/EUreport.php (accessed on 21 January 2022).
  35. Kobayashi, L.C.; von Wagner, C.; Wardle, J. Perceived Life Expectancy Is Associated with Colorectal Cancer Screening in England. Ann. Behav. Med. Publ. Soc. Behav. Med. 2017, 51, 327–336. [Google Scholar] [CrossRef] [Green Version]
  36. Data from: Surveillance, Epidemiology, and End Results (SEER) Program, 2014–2018. Available online: https://seer.cancer.gov/explorer/application.html?site=20&data_type=1&graph_type=3&compareBy=sex&chk_sex_1=1&rate_type=2&race=1&advopt_precision=1&advopt_show_ci=on&advopt_display=2 (accessed on 21 January 2022).
  37. Achat, H.; Close, G.; Taylor, R. Who Has Regular Mammograms? Effects of Knowledge, Beliefs, Socioeconomic Status, and Health-Related Factors. Prev. Med. 2005, 41, 312–320. [Google Scholar] [CrossRef]
  38. Damiani, G.; Federico, B.; Basso, D.; Ronconi, A.; Bianchi, C.B.N.A.; Anzellotti, G.M.; Nasi, G.; Sassi, F.; Ricciardi, W. Socioeconomic Disparities in the Uptake of Breast and Cervical Cancer Screening in Italy: A Cross Sectional Study. BMC Public Health 2012, 12, 99. [Google Scholar] [CrossRef]
  39. Zackrisson, S.; Andersson, I.; Manjer, J.; Janzon, L. Non-Attendance in Breast Cancer Screening Is Associated with Unfavourable Socio-Economic Circumstances and Advanced Carcinoma. Int. J. Cancer 2004, 108, 754–760. [Google Scholar] [CrossRef]
  40. Hanske, J.; Meyer, C.P.; Sammon, J.D.; Choueiri, T.K.; Menon, M.; Lipsitz, S.R.; Noldus, J.; Nguyen, P.L.; Sun, M.; Trinh, Q.-D. The Influence of Marital Status on the Use of Breast, Cervical, and Colorectal Cancer Screening. Prev. Med. 2016, 89, 140–145. [Google Scholar] [CrossRef]
  41. Willems, B.; Bracke, P. The Impact of Regional Screening Policies on the Diffusion of Cancer Screening Participation in Belgium: Time Trends in Educational Inequalities in Flanders and Wallonia. BMC Health Serv. Res. 2018, 18, 943. [Google Scholar] [CrossRef]
  42. Sedgwick, P. Ecological Studies: Advantages and Disadvantages. BMJ 2014, 348, g2979. [Google Scholar] [CrossRef] [PubMed]
Figure 1. Map of municipalities in Flanders (division before 2019) displaying municipality screening uptake profiles based on the mode across all years. Group 1 (reference group): high BC, high CRC; Group 2: high BC, low CRC; Group 3: low BC, high CRC: Group 4: low BC, low CRC.
Gastrointestdisord 04 00010 g001
Figure 2. Positive/negative associations between municipal characteristics and BC/CRC screening uptake municipal profile. The reference category is: Group 1 (high BC, high CRC); Group 2: high BC, low CRC; Group 3: low BC, high CRC: Group 4: low BC, low CRC. Darker colors correspond to higher levels of significance (progressively, p values between 0.05 and 0.01, between 0.01 and 0.001, lower than 0.001).
Gastrointestdisord 04 00010 g002
Table 1. Municipal characteristics of municipalities in Flanders grouped by BC/CRC screening uptake municipality profiles, 2014–2017.
Median (Range)
2014201520162017
Demographic variables
Age group 1 (%)high BC, high CRC38.0 (32.3–42.2)37.4 (27.6–42.7)37.6 (25.9–42.4)37.2 (29.9–42.8)
high BC, low CRC36.9 (27.3–43.2)37.5 (33.7–42.2)37.6 (26.1–42.2)37.7 (26.5–42.4)
low BC, high CRC37.3 (33.9–41.5)37.1 (32.7–40.5)37.1 (32.6–41.5)37.6 (33.5–41.2)
low BC, low CRC37.1 (29.2–43.0)37.1 (26.8–43.9)37.7 (29.7–42.8)37.3 (28.1–42.4)
Age group 2 (%)high BC, high CRC32.9 (29.1–37.1)33.1 (28.8–37.4)32.9 (28.2–37.3)33.1 (29.0–36.7)
high BC, low CRC32.5 (27.7–36.1)32.7 (29.7–36.5)33.2 (29.0–40.2)33.5 (28.5–35.9)
low BC, high CRC32.7 (29.8–36.2)32.7 (30.1–36.4)33.1 (30.4–35.9)33.2 (29.7–37.1)
low BC, low CRC32.6 (28.9–41.1)32.6 (28.3–44.0)33.1 (29.0–37.3)33.3 (24.7–38.1)
Age group 3 (%)high BC, high CRC29.2 (24.9–35.8)29.4 (24.9–35.8)29.4 (24.9–36.8)29.2 (25.9–39.0)
high BC, low CRC30.8 (25.1–37.9)29.4 (26.1–34.2)29.3 (25.1–38.7)29.0 (25.0–39.3)
low BC, high CRC29.1 (25.9–33.3)30.1 (26.0–35.6)29.7 (25.2–33.3)29.2 (26.4–33.0)
low BC, low CRC30.5 (24.9–38.4)30.2 (25.0–38.9)29.6 (25.6–37.0)29.5 (24.7–38.6)
Average household size (n)high BC, high CRC2.44 (2.18–2.61)2.42 (2.17–2.61)2.41 (2.17–2.62)2.42 (2.17–2.59)
high BC, low CRC2.41 (1.93–2.61)2.44 (2.01–2.65)2.41 (1.93–2.60)2.44 (1.94–2.70)
low BC, high CRC2.45 (2.31–2.67)2.41 (2.24–2.55)2.41 (2.22–2.61)2.39 (2.22–2.52)
low BC, low CRC2.41 (1.94–2.61)2.40 (1.93–2.66)2.41 (1.92–2.66)2.39 (1.91–2.63)
Same address (%)high BC, high CRC93.0 (89.5–96.5)92.7 (87.6–95.4)93.0 (89.1–97.8)92.8 (90.4–94.8)
high BC, low CRC92.6 (85.3–95.3)92.1 (84.5–96.5)92.5 (84.6–95.5)92.3 (83.7–98.9)
low BC, high CRC92.7 (91.1–94.7)92.3 (89.7–94.2)92.7 (88.2–95.0)92.3 (88.1–94.3)
low BC, low CRC91.8 (87.2–95.0)91.6 (85.4–95.7)91.9 (87.0–94.9)91.6 (86.7–94.4)
Having partner (%)high BC, high CRC53.4 (46.8–56.2)53.5 (48.0–55.9)53.4 (47.1–57.1)53.5 (48.8–55.8)
high BC, low CRC51.7 (42.3–55.9)51.8 (42.1–55.9)51.8 (42.2–56.6)51.6 (42.0–55.9)
low BC, high CRC53.3 (49.2–56.1)53.3 (50.3–56.3)53.3 (47.5–56.1)53.2 (47.6–56.7)
low BC, low CRC51.3 (41.2–55.4)51.3 (41.1–56.4)51.1 (41.0–55.1)51.1 (40.9–56.9)
Having children (%)high BC, high CRC29.9 (25.9–32.8)29.4 (26.3–32.7)29.1 (20.2–32.3)29.1 (26.7–32.0)
high BC, low CRC29.3 (21.9–31.3)29.4 (23.3–31.9)28.8 (21.2–31.7)28.8 (18.0–31.4)
low BC, high CRC29.6 (28.1–32.3)28.9 (26.8–31.0)28.8 (26.6–31.0)28.4 (26.4–30.5)
low BC, low CRC29.0 (22.5–32.9)28.7 (21.6–32.4)28.6 (21.8–31.6)28.3 (21.5–30.7)
Foreign nationality (%)high BC, high CRC2.5 (1.1–10.8)2.5 (0.6–8.7)2.6 (0.6–7.2)2.7 (0.7–7.8)
high BC, low CRC2.4 (0.8–19.9)3.5 (1.0–29.5)3.1 (0.9–20.8)3.6 (0.8–22.0)
low BC, high CRC2.1 (0.7–10.8)2.1 (1.1–7.5)2.4 (0.8–10.1)3.0 (1.4–10.3)
low BC, low CRC3.5 (0.9–29.0)3.4 (0.8–23.0)3.9 (1.1–29.6)3.9 (1.4–29.4)
Socioeconomic variables
Average income
(×1000 €)
high BC, high CRC18.5 (0.2–25.0)18.6 (0.2–25.4)18.9 (0.2–24.2)19.2 (0.2–25.9)
high BC, low CRC19.2 (0.2–24.5)18.8 (1.6–26.9)18.4 (0.2–25.7)20.1 (1.8–25.3)
low BC, high CRC20.0 (0.2–25.8)19.6 (0.0–27.6)19.7 (1.7–25.2)20.3 (0.2–30.7)
low BC, low CRC20.6 (0.2–27.7)18.7 (1.7–24.9)19.0 (0.2–28.3)19.3 (0.2–25.6)
Jobseeker rate (%)high BC, high CRC2.2 (1.0–4.2)2.1 (0.7–3.9)1.8 (0.8–2.7)1.7 (0.7–2.4)
high BC, low CRC1.8 (1.0–3.8)1.7 (1.0–4.2)1.7 (0.7–3.8)1.4 (0.9–3.3)
low BC, high CRC1.7 (1.0–4.4)1.7 (1.1–2.8)1.6 (1.1–3.6)1.5 (0.8–3.5)
low BC, low CRC1.8 (1.1–4.3)1.8 (1.0–4.3)1.7 (1.0–3.9)1.6 (0.6–3.8)
Wage earners (%)high BC, high CRC36.8 (23.7–40.6)36.2 (24.1–40.6)36.7 (17.2–40.5)36.8 (24.2–40.3)
high BC, low CRC36.3 (17.1–39.0)36.9 (24.3–39.8)36.7 (23.6–39.7)36.7 (17.6–40.0)
low BC, high CRC37.1 (26.0–40.9)37.3 (24.4–40.5)36.8 (26.3–40.4)37.0 (23.5–40.7)
low BC, low CRC36.1 (23.9–40.5)36.1 (17.4–40.4)36.3 (23.5–40.5)36.6 (23.3–40.6)
Self-employed (%)high BC, high CRC7.8 (4.1–15.3)7.8 (4.0–16.9)8.0 (4.1–15.8)8.1 (6.0–14.4)
high BC, low CRC8.7 (5.4–16.8)7.8 (4.8–16.3)8.2 (5.0–17.2)7.8 (4.0–17.1)
low BC, high CRC7.5 (4.7–16.4)7.6 (4.9–18.8)8.1 (5.1–15.3)8.4 (5.1–19.7)
low BC, low CRC7.8 (4.0–18.5)8.3 (4.1–14.7)7.8 (4.2–19.1)8.0 (4.3–14.7)
Early retired (%)high BC, high CRC18.9 (10.6–23.1)19.2 (14.6–27.0)19.8 (14.4–26.9)19.9 (15.4–26.7)
high BC, low CRC20.4 (13.1–34.4)19.2 (11.6–23.7)20.0 (15.7–36.1)19.8 (15.0–36.7)
low BC, high CRC19.3 (14.9–22.8)20.1 (17.0–23.8)20.4 (16.2–23.1)20.6 (18.1–24.2)
low BC, low CRC19.9 (14.4–31.2)20.2 (13.8–35.6)19.9 (14.4–32.5)20.2 (14.5–33.1)
Higher education (%)high BC, high CRC44.3 (11.1–71.5)44.6 (31.7–72.8)44.3 (0.0–65.6)45.6 (34.2–71.9)
high BC, low CRC41.2 (23.8–98.3)43.8 (0.0–99.8)41.8 (8.0–96.2)46.7 (8.2–84.4)
low BC, high CRC45.4 (32.3–67.0)45.9 (36.6–70.5)46.9 (38.0–66.9)49.0 (38.6–69.6)
low BC, low CRC44.5 (6.5–68.9)41.5 (6.5–61.8)45.0 (6.9–66.9)42.9 (7.0–62.1)
Health-related variables
GP visits (%)high BC, high CRC84.8 (77.4–88.9)85.4 (78.2–88.9)86.3 (77.0–90.0)86.1 (74.3–89.3)
high BC, low CRC84.0 (72.4–89.1)83.8 (67.2–88.7)85.4 (68.2–89.3)84.1 (67.6–89.0)
low BC, high CRC82.5 (78.6–88.5)84.5 (77.7–89.4)84.9 (77.3–89.0)84.1 (77.7–88.7)
low BC, low CRC81.3 (65.9–86.9)83.0 (68.0–86.9)82.9 (67.8–88.6)83.3 (66.2–89.9)
Preventive dental visits (%)high BC, high CRC32.7 (19.0–44.5)36.2 (20.0–51.9)38.5 (21.6–53.7)42.0 (22.6–55.6)
high BC, low CRC30.7 (17.9–42.3)34.4 (23.9–43.6)36.5 (19.3–43.9)39.6 (26.8–50.9)
low BC, high CRC32.2 (17.4–49.9)34.7 (19.5–45.8)37.7 (22.2–54.1)41.2 (31.9–50.8)
low BC, low CRC30.9 (16.6–49.5)32.6 (18.7–46.6)35.8 (23.0–49.5)37.1 (20.7–47.7)
Chronic conditions (%)high BC, high CRC9.1 (6.6–12.3)9.7 (7.4–12.9)10.5 (7.8–13.9)11.1 (8.4–14.2)
high BC, low CRC10.1 (6.5–13.1)9.9 (6.8–13.5)11.2 (7.3–15.2)11.2 (7.8–14.9)
low BC, high CRC8.8 (6.0–12.4)9.4 (6.5–13.0)10.2 (8.2–13.3)10.8 (8.6–13.8)
low BC, low CRC8.7 (6.3–13.2)9.8 (7.1–14.3)10.0 (7.2–13.8)11.1 (7.5–16.4)
Diabetes (%)high BC, high CRC5.1 (3.9–7.6)5.2 (4.2–7.5)5.3 (4.2–10.3)5.1 (4.1–7.2)
high BC, low CRC5.9 (4.5–7.5)5.6 (3.8–8.0)5.8 (4.6–8.7)5.7 (3.8–9.1)
low BC, high CRC5.3 (4.0–7.2)5.3 (4.2–6.9)5.6 (4.3–7.2)5.2 (4.1–6.7)
low BC, low CRC5.5 (3.8–8.5)5.9 (4.0–8.5)5.8 (3.9–7.9)5.7 (3.9–8.4)
Disabilities (%)high BC, high CRC6.2 (3.0–12.2)6.5 (3.1–11.5)6.6 (3.9–13.3)6.5 (2.9–14.4)
high BC, low CRC8.2 (2.8–14.6)6.8 (2.2–13.8)7.7 (3.0–15.1)6.7 (2.4–13.3)
low BC, high CRC6.0 (3.0–10.7)5.7 (3.0–10.6)6.1 (3.0–10.5)5.8 (2.9–10.7)
low BC, low CRC5.8 (2.2–13.9)6.9 (2.5–14.7)6.0 (2.3–10.9)6.9 (2.3–15.2)
Group 1 (reference group): high BC, high CRC; Group 2: high BC, low CRC; Group 3: low BC, high CRC: Group 4: low BC, low CRC.
Table 2. Multivariable associations between municipal characteristics and BC/CRC screening uptake municipality profiles.
OR (95% CI); p Value
Uptake aGroup 2
High BC, Low CRC
Group 3
Low BC, High CRC
Group 4
Low BC, Low CRC
Demographic variables
Age group 1 (%)0.93 (0.85–1.03); 0.160.97 (0.90–1.06); 0.54 0.90 (0.82–0.99); 0.04 *
Age group 2 (%)0.99 (0.88–1.122); 0.900.97 (0.86–1.09); 0.600.94 (0.82–1.07); 0.34
Age group 3 (%)1.08 (0.97–1.21); 0.141.05 (0.95–1.15); 0.321.16 (1.04–1.29); 0.005 *
Average household size (n)0.51 (0.01–2.84); 0.74 16.44 (0.43–62.5); 0.135.58 (0.09–34.5); 0.41
Same address (%)0.71 (0.59–0.87); 0.001 *0.88 (0.77–1.02); 0.090.60 (0.50–0.71); <0.001 *
Having partner (%)0.66 (0.57–0.75); <0.001 *0.96 (0.86–1.09); 0.580.58 (0.51–0.67); <0.001 *
Having children (%)0.81 (0.58–0.77); 0.046 *0.76 (0.63–0.92); 0.005 *0.72 (0.59–0.87); <0.001 *
Foreign nationality (%)1.30 (1.19–1.42); <0.001 *0.91 (0.79–1.05); 0.211.36 (1.24–1.49); <0.001 *
Socioeconomic variables
Average income (×1000) (€)1.00 (0.97–1.03); 0.72 1.00 (0.97–1.02); 0.811.00 (0.98–1.03); 0.63
Jobseeker rate (%)0.23 (0.13–0.39); <0.001 *0.73 (0.41–1.27); 0.270.28 (0.16–0.50); <0.001 *
Wage earners (%)1.05 (0.96–1.16); 0.251.05 (0.98–1.12); 0.19 1.09 (1.00–1.19); 0.04 *
Self-employed (%)1.17 (1.06–1.30); 0.002 *1.09 (0.97–1.23); 0.131.14 (1.01–1.28); 0.03 *
Early retired (%)1.29 (1.11–1.51); 0.001 *1.20 (1.04–1.37); 0.01 *1.3 (1.17–1.55); <0.001 *
Higher education (%)0.99 (0.94–1.03); 0.581.00 (0.96–1.04); 0.850.94 (0.90–0.99); 0.02 *
Health-related variables
GP visits (%)0.84 (0.71–0.98); 0.032 *0.76 (0.65–0.89); <0.001 *0.72 (0.60–0.86); <0.001 *
Preventive dental visits (%)0.90 (0.86–0.95); <0.001 *0.99 (0.95–1.03); 0.540.93 (0.88–0.97); 0.002 *
Chronic conditions (%)1.02 (0.86–1.21); 0.780.85 (0.72–1.01); 0.060.94 (0.80–1.10); 0.43
Diabetes (%)2.59 (1.80–3.72); <0.001 *1.27 (0.90–1.79); 0.16522.72 (1.87–3.96); <0.001 *
Disabilities (%)1.14 (1.03–1.27); 0.01 *0.93 (0.83–1.03); 0.150.98 (0.88–1.09); 0.75
a The reference category is: Group 1 (high BC, high CRC); Group 2: high BC, low CRC; Group 3: low BC, high CRC: Group 4: low BC, low CRC. Significant p values are indicated with asterisk (*).
Publisher’s Note: MDPI stays neutral with regard to jurisdictional claims in published maps and institutional affiliations.

