Public Preferences and Willingness to Pay for Shared Autonomous Vehicles Services in Nagoya, Japan


1
Department of Civil Engineering, Nagoya University, Nagoya 464-8601, Japan
2
Institute of Materials and Systems for Sustainability, Nagoya University, Nagoya 464-8601, Japan
*
Author to whom correspondence should be addressed.
Smart Cities 2019, 2(2), 230-244; https://doi.org/10.3390/smartcities2020015
Submission received: 1 May 2019
/
Revised: 23 May 2019
/
Accepted: 6 June 2019
/
Published: 11 June 2019
(This article belongs to the Section Smart Transportation)
Abstract
:Shared autonomous vehicle systems are anticipated to offer cleaner, safer, and cheaper mobility services when autonomous vehicles are finally implemented on the roads. The evaluation of people’s intentions regarding shared autonomous vehicle services appears to be critical prior to the promotion of this emerging mobility on demand approach. Based on a stated preference survey in Nagoya, Japan, the preference for shared autonomous vehicle services as well as willingness to pay for these services were examined among 1036 respondents in order to understand the relationship between people’s socioeconomic characteristics and their preferred shared autonomous vehicle services. For this purpose, k-modes clustering technique was selected and six clusters were obtained. Six groups with respect to different interests on shared autonomous vehicle services were clustered. The result of correlation analysis and discussion of willingness to pay on services provided insightful results for the future shared autonomous vehicle services. This study not only aids in revealing the demands of customer different clusters, but also states the prospective needs of users for stakeholders from research, policymaker and industry field, who are preparing to work on promoting shared autonomous vehicle systems, and subsequently, develops an optimum transportation mode by considering both demand and services as a whole.
1. Introduction
1.1. Autonomous Technology and Shared Autonomous Vehicles (SAVs)
The current trend of the automobile industry and driverless technology has encouraged a tremendous amount of investigation, which provides a clear sign that driverless cars will eventually be introduced in the coming years. The SAVs services defined in this study are stated as follows: In the future, level 4 [1] Autonomous Vehicles (AVs) owners allow their cars to move out of garages during the unused time. AVs can pick up passengers who make reservations and collect payment autonomously. SAVs will certainly provide an affordable and safer mode than human-piloted mobility services [2].
With the maturation of autonomous technology, studies have considered the performance of both AVs advantages and the SAVs system. The reduction of casualties on the road is one of the most critical advantages provided by AVs. Fagnant and Kockelman [3] and Burns [4] provided an overview and projection of connected and driverless vehicles that lead to cost savings by eliminating traffic accidents. Moreover, parking areas, such as on-street parking can be reduced with the involvement of AVs [5]. Consequently, with the improvement of the traffic environment, a smoother traffic flow will lead to decreasing greenhouse gas emissions and congestion in urban areas [6] when vehicle demand stays at a stable level. Given the advantages of AVs, further investigations concerning SAVs were developed under different transportation scenarios, such as shared autonomous taxi systems. Ford [7] and Kornhauser [8] stated that profits could be obtained by providing a safer, fuel-efficient, and congestion-alleviated transportation mode under the condition of adopting autonomous taxis. Furthermore, Fagnant et al. [9] examined the implication of SAVs in Austin, Texas, while considering relocation when using a network-based simulation model. The results revealed that approximately nine conventional vehicles can be replaced by a single SAV within a 24- by 12-mile area, while maintaining a reasonable service level.
1.2. Public Preference
In this study, instead of exploring the performance of system, we focus on users’ preferences when using mobility services provided by SAVs. In that case, we looked at the previous studies exploring perspective of both AVs technology and SAVs services.
First of all, attitudes on the benefits, concerns, and implications towards autonomous technology have been discussed. Howard and Dai [10] investigated the attitudes towards AV perception among 107 prospective adopters in Berkley, California. Safety benefits, no parking hassles, and multitasking while en route were the most attractive items for respondents. However, liability, technology costs when updating to fully AVs, and losing control of cars were the major areas of concern. Furthermore, Kyriakidis et al. [11] conducted an online survey among 5000 respondents from 109 countries to understand their concerns and attitudes towards different automation levels. In this study, further concerns have been investigated, such as data transmission issues, software hacking/misuse, and willingness to pay (WTP) for automated driving systems. König and Neumayr [12], meanwhile, delved deeper into the barriers and resistance towards AVs.
1.3. Aims of the Study
Previous studies have been conducted to discuss the future possibilities of SAVs. Researchers [7,8] discussed about the feasibility of shared autonomous taxi systems and further evaluate the capability of the services when replacing conventional vehicles in the system. In addition, Krueger et al. [13] conducted the survey among 435 respondents in major metropolitan areas of Australia. This study helps with understanding not only preferences on SAVs, but also willingness to pay of SAVs with/without dynamic ride share. Similarly, Bansal et al. [14] provided a clear picture of people’s preference and concern when providing different pricing scenario of SAVs.
This study stands on a different perspective than previous studies. Particularly, rather than considering the value of waiting time, in-vehicle time and travel cost mentioned by Krueger et al. [15], we further try to provide a detailed analysis of additional services of SAVs such as “larger trunk” for the user who need more spaces, “multi-user” for those who want to share ride with friends, “child-tracking” for parents who would like to monitor the condition of their children when using SAV services, etc. We included 11 services in this study for SAVs in order to acquire more possibilities for the business model of SAVs in the future. In this case, the gaps between research of SAVs and future development in the industries could be filled. And we hope to help with guiding the design and investment directions of SAVs services in the near future.
1.4. Research Structure
The objective of this study was to evaluate the intention and WTP across different clusters of people when using various additional services that can be provided by SAVs other than the functions that have already been provided by present taxi hailing applications (such as pick up/drop off at designated locations by reserving taxis via smartphone applications). In this study, a stated preference (SP) survey was conducted to obtain people’s intentions regarding SAV services and WTP for these in future scenarios. In this survey, we described different scenarios for respondents and aided them with the imagination of using SAVs in the future (in this study, we informed respondents to imagine that this service will be ready to use in the year of 2030). For example, the process of reserving SAVs and how long the SAVs will take for picking up were described in detail for improved understanding. Questions such as “how much would you like to pay if the waiting time after making the reservation drops from around five minutes to one minute?” were provided directly after each scenario description. Then, people’s selections were collected by indicating the given amount of money they would like to pay for each additional service of the SAV trip. Socioeconomic characteristics were also obtained in the SP survey. Firstly, clustering techniques were applied for cluster analysis regarding people’s intentions of SAV services, and k-modes and partitioning around medoids (PAM) were the two clustering algorithms used. The results of these two algorithms were compared. As demonstrated in a later section, k-modes was selected as the clustering method for this study. Thereafter, a Spearman correlation matrix was established to identify the significant features of individual correlations in each categorized cluster. In the final step, the WTP for each service was calculated for a further comparative study, considering the results from the clustering and correlation analysis.
The research flow of this paper is organized as follows. Section 2 presents detailed information regarding the SP survey. In Section 3, we describe the cluster algorithm applied in this study. Based on the comparison analysis between k-modes and PAM, the merits of the selected k-modes method are demonstrated. Section 4 presents the clustering and correlation analysis results, while discussing the distinct features of each cluster. Furthermore, the WTP for services is calculated for respondents in each cluster. Finally, a conclusion is provided.
2. Survey Design and Materials
2.1. Survey Design
The SP survey was conducted by a survey specialist company named Macromill in Japan to guarantee the quality of the data. The operation time of survey was from September 25th to September 30th in the year of 2015. Nagoya City was chosen as the study area. Nagoya city is the largest city in central region of Japan and it is also the center of the third-largest metropolitan region. The respondents were regarded as invalid when respondents fail to answer questions related to SAVs services or the answered number are obviously unreasonable. As a result, 1036 out of 1050 participants were collected as valid sample size. The survey comprised two parts. In the first part, socio-economic characteristics, frequent trip purpose, and the person you trip with were required. The second stage of the survey aimed to collect attitudes of 11 SAVs services. Furthermore, in case of those who may not be familiar with AVs technologies and SAVs services, detailed instructions of SAVs operation and expected results of each SAVs service were explicitly explained at the beginning of each question.
2.2. Participants
In Table 1, sample distribution of socio-economic characteristics, features of frequency trip as well as the general interest on SAVs are reported.
2.3. Intention on SAV Services
In the following Table 2, respondents’ interest on each SAVs services was collected. Also, respondents were asked how much they are willing to pay for the services (for example: How much money would you like to pay per trip if you want to use the large-trunk service? 0.09 USD, 0.27 USD, 0.45 USD, 0.72 USD, 0.9 USD, Other___; 1 JPY = 0.009 USD is used here for currency conversion). In addition, we provided the basic price as 100 JPY for 15 min and 300 JPY for 30 minutes’ trip. Thus, the answered price can be regarded as relative price compared to the basic price above.
3. Methodology
3.1. Partitioning Clustering Algorithm
As the primary objective of this study is to explore people’s intentions regarding SAV services, the partitioning clustering methods can provide a feasible tool for differentiating the population according to their choices. Partitioning clustering are clustering methods used to classify observations into multiple groups based on their similarity. The most common partitioning clustering methodologies include k-means clustering [15], k-modes [16,17], and PAM and CLARA algorithm [18].
K-means clustering algorithm is the most commonly applied clustering method for partitioning a given data set into pre-specified k clusters [19]. The observations within the same cluster present high intra-cluster similarity, whereas observations from different clusters are as dissimilar as possible. In k-means clustering, each cluster is represented by its center (i.e., the mean of points assigned to the cluster). However, a major limitation of k-means is that it is inappropriate for dealing with datasets containing categorical variables. As an extension of k-means, the k-modes clustering algorithm was introduced to deal with categorical data [16,17]. K-modes replaces the cluster means with modes, and uses a frequency-based method to update modes in the k-means manner, which removes the numerical data limitation of k-means while maintaining its efficiency [20].
Another group of extension for k-means clustering algorithm (e.g., PAM and CLARA) is to find an actual existing object in each cluster as a representative object and allocate all the objects into the most fitted clusters. Those clustering algorithms are less sensitive to outliers compared to k-means, and suitable for categorical variables. PAM begins by determining a representative object for each cluster. This representative, known as a medoid, is the most centrally located point in a cluster. After determining the initial medoids set, the algorithm iteratively replaces one medoid with one non-medoid if this improves the total distance of the resulting clustering [21]. However, PAM is more suitable for this study since CLARA only extends PAM to deal with large sample size in order to reduce computing time by applying sampling approach.
Considering the categorical characteristic and small sample size of this dataset, k-modes and PAM clustering algorithms are applied in this study. For both k-modes and PAM, firstly we need to determine the number of clusters k. To estimate the optimal number of clusters, we’ll calculate the total within-cluster simple matching distance using different values of clusters k. The measure of dissimilarity is weighted by the frequency of features to avoid neglecting rare categories [18]. Generally speaking, the total within-cluster simple matching distance reduces when k increases and the degree of descending decreases when k gets closer to the optimal number. Therefore, a kink point was selected as the appropriate number of clusters to avoid over-distinction (i.e., the observations are clustered into too many groups). Figure 1 indicates that is appropriate for the initial number of clusters for both k-modes clustering algorithm and PAM.
3.2. Clustering Algorithm Comparison
We name the 6 clusters from C-1 to C-6 according to the size of clusters. In order to compare the clustering results of PAM and k-modes, we calculated the feature dissimilarities (see notation of Table 3 for the definition of dissimilarity) between each corresponding pair of C-1 to C-6 generated from the two different algorithms, indicating similar preferences for SAV services. The results are listed in Table 3. In this table, smaller difference indicates less dissimilarity between the corresponding cluster features. Indeed, two clusters show dissimilarity among some characteristics, other four clusters have similar characteristics using two different clustering algorithms. The dissimilarity results demonstrate that the socioeconomic characteristics of four paired clusters (C-1, C-2, C-3 and C-4) according to k-modes and PAM are similar, as most dissimilarity values are lower than 5%, and none exceed 9%.
However, according to Table 3, the two clustering algorithms produce distinguished results for the two remaining clusters (C-5 and C-6). In order to demonstrate the differences further, the percentage of respondents who expressed interest in services from the two remaining cluster pairs are illustrated in Figure 2. As indicated in the figure, k-modes provides a more distinguishable clustering result compare to PAM. For this dataset, all objects are represented by ordinal variables, which indicate people’s preferences for SAV services. It is noticeable that PAM selects k objects from the dataset to represent the characteristics of each cluster, while k-modes uses mode vectors of categorical attributes to represent cluster centers, where the mode of a value set is the most frequently occurring value [22]. Moreover, each object in the dataset consists of 11 attributes (11 SAV services for people to select), so that k-modes can provide efficient observation, as the algorithm selects more representative cluster modes than PAM. At this step, the purpose of this research is to seek the representative for each categorized cluster that can effectively explain the characteristics and people’s preferences for SAV services, rather than that existing in each cluster. In this regard, k-modes is preferable, as we are more concerned with the characteristics of the entire cluster, and the representative selected by the clustering algorithms of each cluster does not necessarily exist in the dataset. Therefore, we select the clustering results of k-modes as the clustering algorithm for the following sections.
4. Results and Discussion
In this study, k-modes clustering and the Spearman correlation matrix were implemented and calculated using R software (version 3.2.1) [23].
4.1. Clustering Results
People from each group can be distinguished in terms of their interests in services that will be provided by SAVs in the future. Table 4 presents the major interests in SAV services for each cluster. In total, 36% of respondents who were interested in all SAV services were categorized as cluster 1 (C-1), and 33% were assigned to cluster 2 (C-2), in which most services except for charging and child tracking were accepted. In cluster 3 (C-3), 12% of respondents expressed no interest in any SAV services. Cluster 4 (C-4, 9%) indicated that reliable services (short waiting time, on-time, and larger trunk) were more attractive than others. Moreover, reliable services, multi-user, and child tracking were the highlighted interests in cluster 5 (C-5, 7%). Finally, people in cluster 6 (C-6, 3%) expressed greater interest in the short waiting time, on time, and easy boarding services when using SAVs.
4.2. Cluster Name Definition
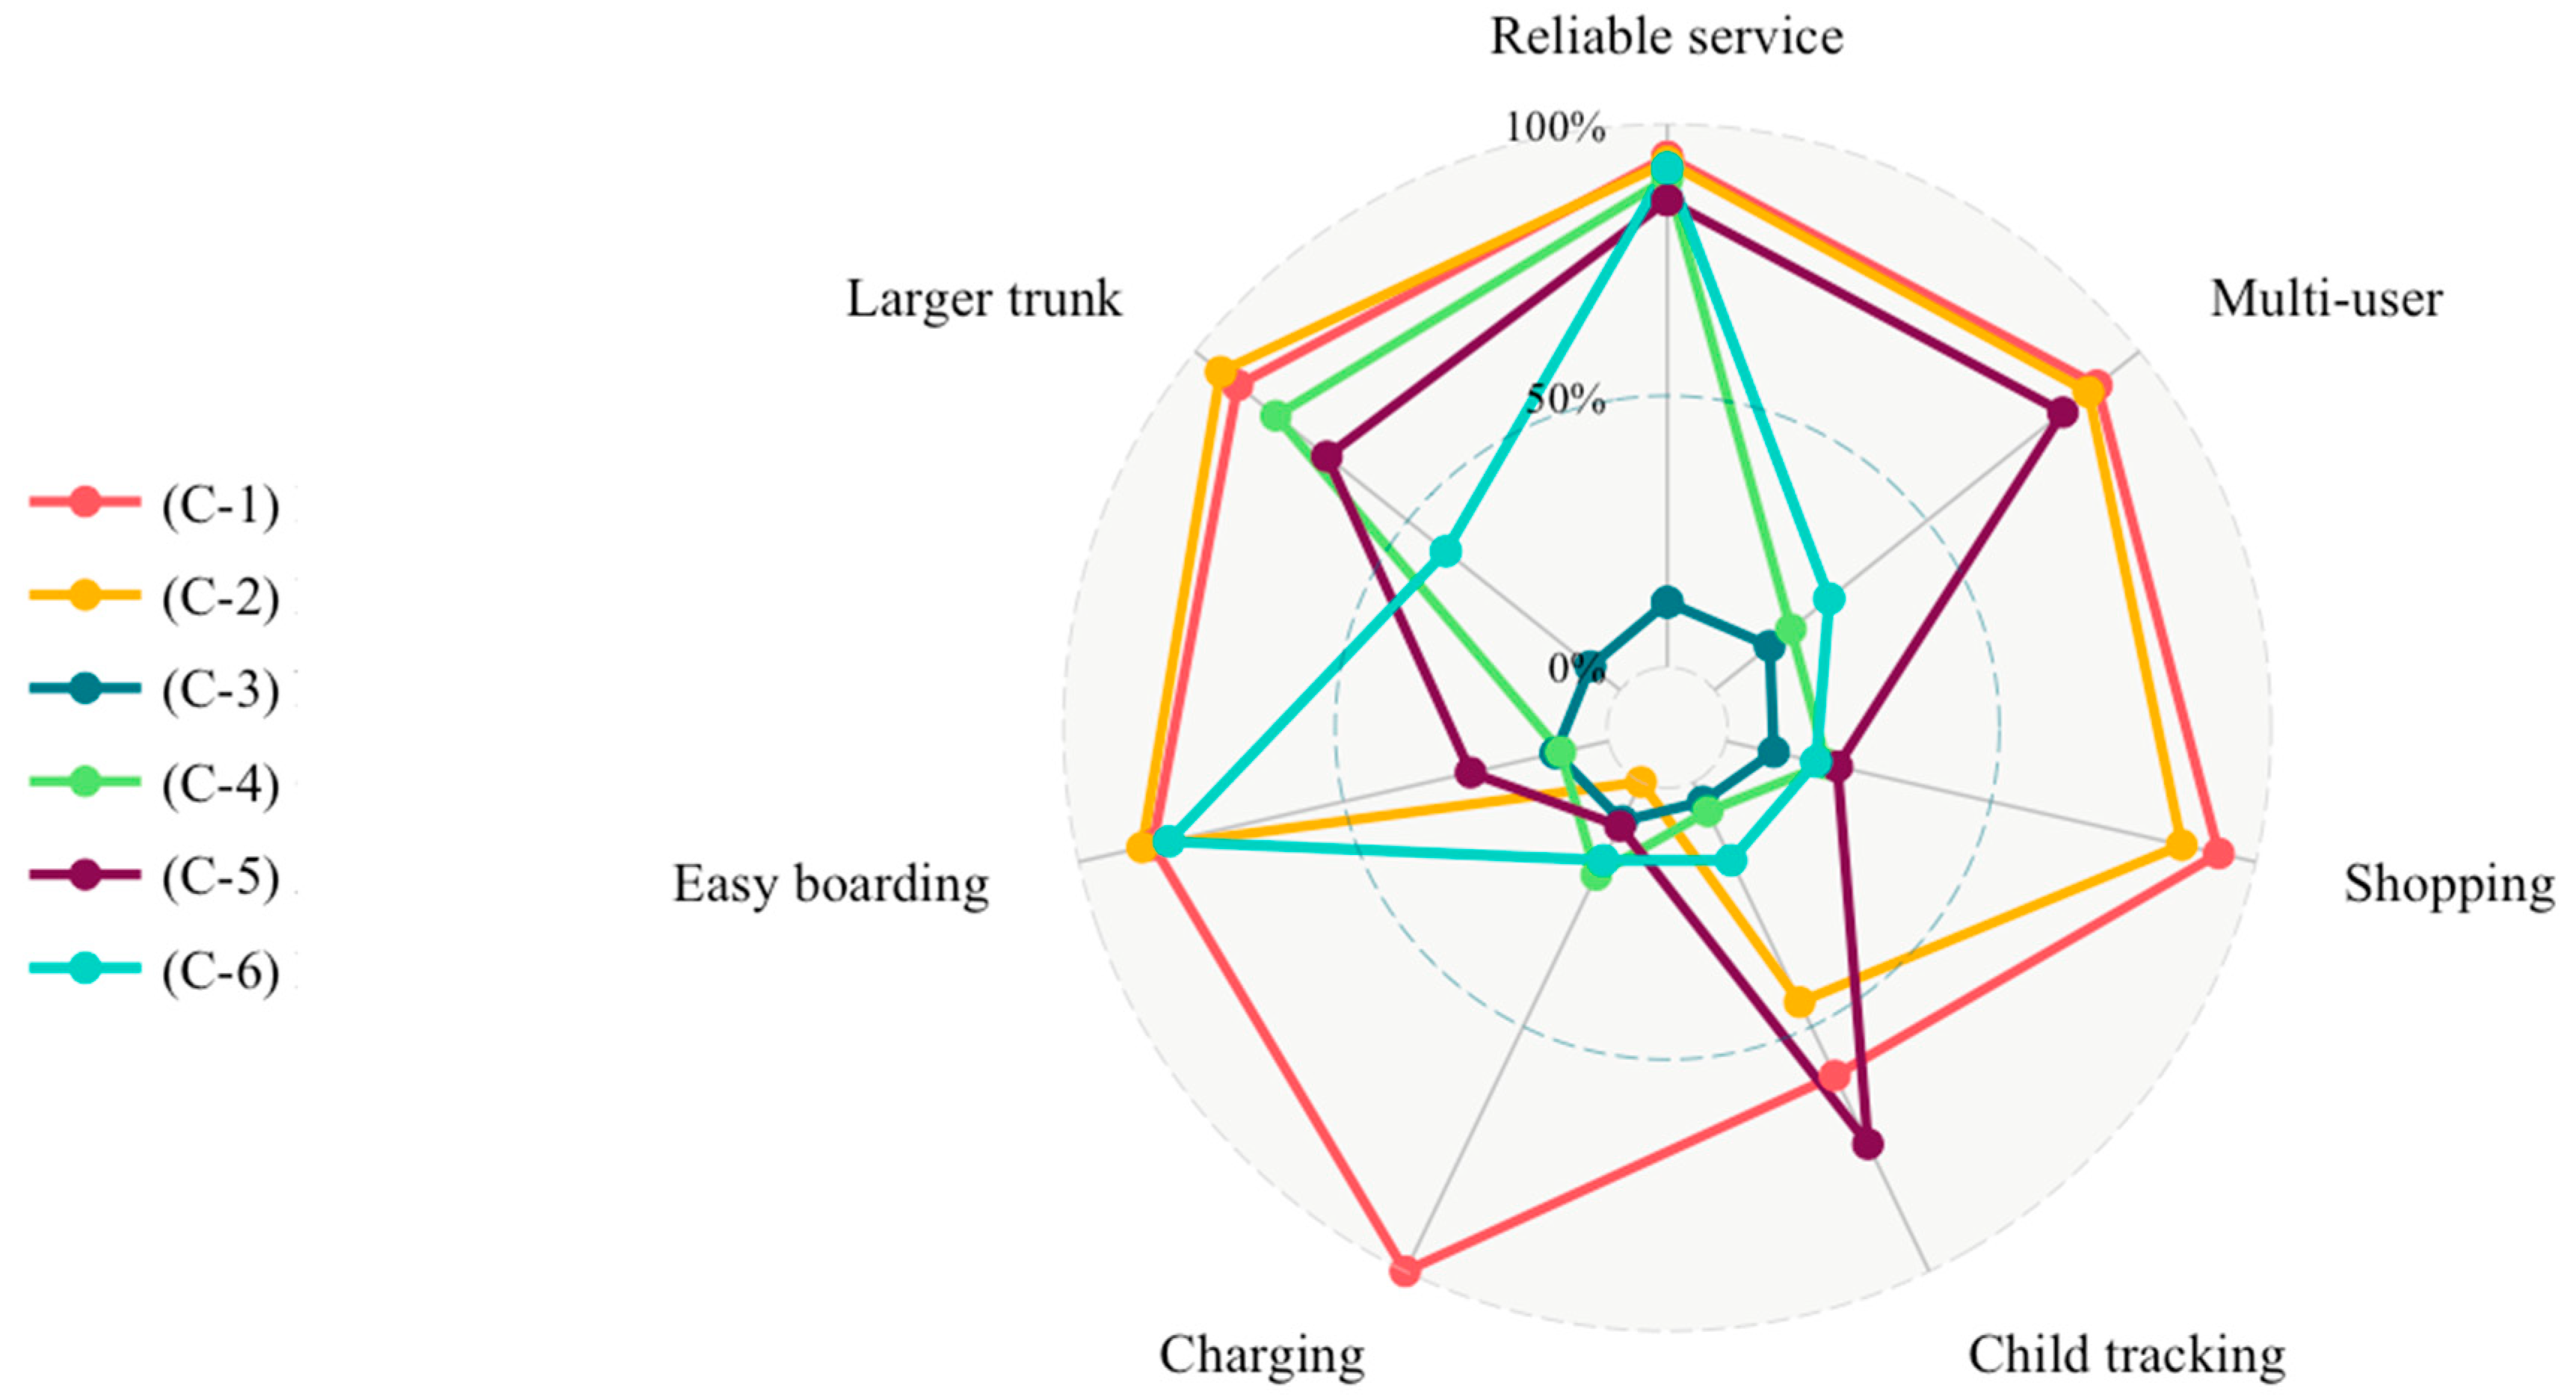
Figure 3 presents a more straightforward result of the k-modes clustering analysis. For the convenience of demonstration, we combine services performing similarly in the clustering results (reliable service—short waiting time and on time; multi-user—multiple user and multi-origin; shopping—keep car while shopping and easy loading; easy boarding—longer boarding time and easy boarding).
In order to have a straightforward impression on each group, we name the clustered groups according to their characteristics of interest services. According to Figure 3, “High-interest (HI)” is given to C-1 since respondents in this group shows high interest in all groups. “Easy-Storage-Reliable-Multi-Shopping (ESRMS)” is used to define group C-2. People in this group prefer most of the services except charging and child tracking. C-3 is defined as “Low-interest (LI)” for its low interest among all services. Similarly, C-4, C-5 and C-6 are named “Storage-Reliable (SR)”, “Storage-Reliable-Multi-Child (SRMC)”, and “Easy-Reliable (ER)”, respectively, according to the clustering result shown in Figure 3. Starting from this section, we will be using the abbreviation to represent the name of 6 groups, which could remind us interested services of each clusters.
Six clustered groups were categorized and a more informative explanation can be obtained by viewing statistical characteristics of each cluster in the next section.
4.3. Statistical Interpretation
The characteristics for each cluster regarding the respondent characteristics in the SP survey dataset are provided in Table 5. On this basis, a prior implication could be concluded considering statistical results in terms of the six categorized clusters.
The six clusters can be interpreted as follows:
“HI (C-1)” group:
- Higher proportion of the younger generation (38%) than other clusters.
- Relatively high interest in SAVs (45%).
“ESRMS (C-2)” group:
- Tends to express leisure-used function.
- This group has more elder-people (16%) than the others.
- Fewer single trips (17%) can be observed in this group compared to the remaining clusters.
- Employed occupation proportion (45%) in this cluster is the lowest among all groups.
“LI (C-3)” group:
- Corresponds to the relatively lower interest compare to the other groups.
- This cluster comprises mainly middle-aged people (73%).
- Relatively high proportion of employed people (63%).
- Low interest in SAVs (15%) compared to other groups.
“SR (C-4)” group:
- Corresponds to a more conservative way of use since only basic services are preferred.
- People in this cluster express a relatively high interest in SAVs (25%) compared to the “LI (C-3)” group (15%), while the statistical characteristics of the other variables are demonstrated to be similar.
“SRMC (C-5)” group:
- Higher incidence of having children (25%) than other clusters.
- Middle-aged (68%) people dominate this cluster.
- A certain percentage of people exhibit a high interest in SAVs (44%).
- People drive more frequently (40%) in this group than others.
“ER (C-6)” group:
- Consists of respondents who are generally middle-aged (72%), employed (72%), take trips alone (44%).
- Having some interest in SAVs (38%).
In this section, we preliminarily interpret each cluster by investigating the services of interest and statistical features of the categorized clusters. Thereafter, further discrepancies among groups are demonstrated by observing the correlation between the cluster and people’s characteristics in the following section.
4.4. Correlation Analysis
In order to confirm the discussion above, the Spearman’s correlation matrix provides a basis for exploring the correlations among assigned clusters and the characteristics within the same clusters. In this manner, further conclusions can be obtained by comparing the Spearman’s correlation coefficients of each variable from the clusters. Table 6 summarizes the correlation matrix for the categorized clusters and variables. In general, car use frequency was not identified and it has little difference among all groups (as most of the absolute correlation coefficients were smaller than 0.02).
“HI (C-1)” cluster:
- Young-generation customers, part-time workers, and students expressed positive correlations by selecting all services.
“ESRMS (C-2)” cluster:
- Indicated interest in almost every service, with people in this cluster tending to travel with children or elders, which corresponds to the multi-user and multi-origin services.
- Homemakers and unemployed people showed a positive correlation with selecting shopping-related services.
- Positive coefficient of elders and the negative correlation of having children appeared to affect people’s decision of not selecting child tracking and in-vehicle charging services.
“LI (C-3)” cluster:
- Negative significant correlation of interest in SAVs.
- Middle-aged people, particularly employed respondents, were found to be less likely to select any services when considering SAVs.
“SR (C-4)” cluster:
- Expressed a similar inclination among all variables, with people in this cluster exhibiting a relatively small correlation coefficient of interest in SAVs
- Basic fundamental services were applied in this context (shorter waiting time, on time, and larger trunk were selected for this cluster).
“SRMC (C-5)” cluster:
- Having children tended to affect people when selecting SAV services.
- Positive influence on high frequent car use and homemakers compared to other clusters, although the correlation was weak at this point.
- Multi-user, multi-origin, and child tracking systems may be reasonable for this group when first attempting SAVs, particularly for households with children.
- Basic fundamental services for families, including shorter waiting time, on time, and larger trunk should also be provided for this group to maintain their daily obligations.
“ER (C-6)” cluster:
- People who are employees and usually take trips by themselves are more likely to be identified as this group.
- The selected services (shorter waiting time, on time, longer boarding time, and easy boarding) revealed that only functional services will be accepted by this cluster.
- Services that can ensure that the trip is on schedule and improvement of boarding services could eliminate the probability of missing SAVs, particularly for users who are heading to work places.
4.5. WTP for Services
Based on the survey results, the average WTP can be calculated directly among different clusters of people. Table 7 displays a summary of the WTP for different services provided by SAVs. Child tracking, larger trunk, and multi-origin are the services to which people attach great significance when selecting SAVs as their traveling approach. The final column in Table 2 indicates that, on average, people are willing to pay more than 0.45 USD for using child tracking services, 0.41 USD for a large trunk, and 0.40 USD for keeping the car while shopping for each trip. Comparative analysis is applied when considering both people’s WTP for SAV services and their socioeconomic features, which correspond to the cluster to which they belong. Certain preliminary imaginative scenarios are also provided for specific groups of people with regard to the comparison between the correlation study and the results of the price of services.
People in the “HI (C-1)” group are likely to pay more for SAV services than average. The services with the highest average price are child tracking, large trunk, multi-user, and multi-origin. In contrast, people in the “LI (C-3)” group do not have great interest in SAV services, and the average price they are willing to pay is lower than that of other groups for every service in the survey.
People in the “ER (C-6)” group place a higher value on more useful services and are more willing to pay higher prices for these services. For the on time, short waiting time, and multi-origin services, they can offer 0.67, 0.58, and 0.53 USD, respectively, for one trip, which is significantly higher than the average price. A possible scenario could be that the user hails a SAV online for the commute to work, and an additional amount of money is paid for on time and shorter waiting time services so that they will not be bothered by being late for work. A person may also be willing to pay more money to allow the SAV to wait longer than usual to say goodbye to their children.
However, people in the “ESRMS (C-2)” group may not wish to spend too much money on these practical services. For on time and short waiting time service, they only want to pay half the price of that of the “ER (C-6)” group. Instead, they would like to spend more on most of the other services provided by SAVs. From our scenarios, homemakers or those who do no work may take advantage of SAV services such as multi-user and multi-origin to meet with friends. In the meantime, fundamental features provided by SAVs, including shorter waiting time, on time, and larger trunk may still be considered by the “ESRMS (C-2)” group to pursue high-quality trips.
The “SR (C-4)” group is more interested in the on time, short waiting time, and large trunk services. Thus, these people are more willing to pay a relatively high price for these services. Furthermore, although only a small number of people show an interest in the child tracking service, they would like to pay the highest price for this service among all those provided by SAVs in the questionnaire.
People in the “SRMC (C-5)” group are willing to pay more money for multi-origin, multi-user, and large trunk services. A possible scenario could be that in which a SAV picks up a student from school, while the parents are free to check the real-time status of their children when the vehicle is en route to meet up with the mother who may be a homemaker and is just about to return home from the supermarket.
Furthermore, we calculate the average added bundle service WTP for each cluster. And generally, “HI (C-1)”, “ESRMS (C-2)” and “ER (C-6)” groups are more likely to pay over 4.5 USD per trip while “LI (C-3)” group would only like to spend less than 2 USD on these additional SAV services.
5. Conclusions and Limitations
5.1. Conclusions
With the development of autonomous technologies, we could expect that the next generation mobility like SAV will provide a cleaner, safer, and cheaper mobility, when all vehicles can drive automatically and driverless mobility can be easily accessed by all of users. This study has taken the lead in investigating the service side of SAVs and understanding user service choices, as well as their WTP for each service.
By comparing the clustering results and algorithm characteristics between PAM and k-modes, we apply k-modes to our data in order to get more interpretive result. The clustering analysis provided us clear classification according to the respondents’ characteristics and their interested services combination of SAV. Six clusters were identified and we defined clusters according to their interested services combination. The defined clusters are “HI (C-1)”, “ESRMS (C-2)”, “LI (C-3)”, “SR (C-4)”, “SRMC (C-5)”, and “ER (C-6)”. To obtain more in-depth knowledge of the relationships between respondent features and clusters, a Spearman correlation matrix analysis was applied, and the results provided us with an improved understanding of the manner in which socio-demographic features affect respondent service selections. Inferences of preferences for different services could also be revealed by comparing the calculated WTP for services selected by distinctive clusters.
We compare the result of clustering and features of respondents in each group for further discussion. The young generation with high interest in SAVs, particularly those who have part-time jobs or students, are more likely to be identified as the “HI (C-1)” group. It is interesting to note that users in this group are more likely to pay for almost every service during their SAV trips. Older people, traveling with children or other elders, homemakers, and unemployed respondents exhibit a positive correlation with spending more money on “ESRMS (C-2)” related services, such as larger trunk, multi-user, and easy loading. For the “LI (C-3)” cluster, middle-aged employed people who express an interest in SAVs are willing to pay less for every service than other clusters. The “SR (C-4)” cluster is identified as having a similar tendency of demographic characteristics to the “LI (C-3)” group. However, the coefficient of no interest in SAVs is exhibited less among the “SR (C-4)” group than the “LI (C-3)” group. This corresponds to their relatively high expenses for the larger trunk and longer boarding time services. In general, most groups are likely to pay more for the child tracking service even if they do not express great interest therein, which may be attributed to the consensus of protecting the young generation. In the “SRMC (C-5)” group, people with children, those who have high car use frequency, and homemakers express a positive WTP more money for the larger trunk, multi-user, and multi-origin services. Moreover, people who are employed and usually travel alone are more likely to be categorized in the “ER (C-6)” group, for which significantly greater expenses can be observed for the two functional services (on time and short waiting time). In all, “HI (C-1)”, “ESRMS (C-2)” and “ER (C-6)” groups are willing to pay more than 4.5 USD/trip on service bundle in addition to the basic ride fare, while the WTP of service bundle of “LI (C-3)” group would be less than 2 USD/trip.
From the perspective of strategic vision and future business models, the author would like to provide the implication here even though it may seem to be intuitive. The groups of users that tend to pay more according to our result (“HI (C-1)”, “ESRMS (C-2)” and “ER (C-6)”) could be considered as the target users when firstly promoting SAVs services. At the same time, the younger generation who commute to school or part-time job locations, elders who travel with children or friends, and employed users who trip alone for commuting or business trips are the high potential adoption mode when the SAV arrives. On the other hand, it seems that SAVs services will benefit from expanding the opportunities for students who choose schools or part-time jobs, elders who are desired to social while having limitations on their capability to traveling and also could provide convenient and affordable mobility services for solo-commuters so that they could have more opportunities when choosing their job locations.
At present, on the government side, policy making should be considered prior to the development of the technologies. In this case, this study could provide a guidance for the future needs of SAVs passengers. Also, policy makers could have a clear idea of balancing the profit of both users and SAVs providers. On the other hand, companies from the car manufacturers division (such as Daimler and Toyota) and the service provider division (such as Uber, Lyft, Baidu, and DiDi) are making their effort to bring autonomous mobility to the real world. From the authors’ perspective, it is necessary to balance the profit of mobility services providers and the satisfaction of users prior to the major investigation of the service such as SAV. For this purpose, the results of this study reveal the relationship between SAV services and preference of users and aims to provide a prior view for stakeholders who are planning to develop this next generation mobility service. We also expect that with the help of our study and the following effort of other researchers, next generation mobility which satisfies both the providers and the users will be achieved.
5.2. Limitations
In this section, we list our limitations and future research directions for other researchers who also would like to devote their effort to next generation mobility services such as SAVs.
Smart survey designs such as pivot style design could be applied to this study by considering the features of respondents, so that a more reliable survey could be conducted. With the limited knowledge of the autonomous technology and SAVs services, we try to explain the scenarios in the survey to make sure respondents could have basic ideas of how SAVs works. In the near future, with the development of people’s acceptance of AVs technology, more reliable survey design methods should be considered.
With the fast development of the machine learning algorithms there will be more advanced methods which can be applied to our dataset. In this case, we will keep looking for suitable algorithms to get more accurate results and interpretation in the future.
Even though we provided the interpretation of future SAV scenario for respondents in the questionnaire survey, the limitation of the knowledge of autonomous technologies and SAV would have affected the result of the study. With the development of the autonomous technologies, we will provide more follow-up studies to respondents to further explain the possible difference of the result caused by the knowledge improvement of respondents.
In addition, in the current scenario, further surveys should be conducted in various locations prior to generalization of the findings, as different expectation types for SAV services could be obtained. Furthermore, more variables will be involved in future work to achieve more substantial results. For instance, scenarios that are more related to operation model could be further considered. Detailed consideration such as people’s propensity and willingness to walk to the pick-up point seem to be important to discuss when using this autonomous sharing service.
We asked respondents directly about their WTP for each service, which may underestimate the calculated result. In the scenario of our survey, WTP for the SAV service per trip was applied and it would be interesting to consider the elasticities of the WTP per distance in future studies. Moreover, additional services related to SAVs could be added in future studies, such as the inclusion of periodic inspections and maintenance.
From this study, future enterprises, particularly those who would like to operate SAVs, may provide different vehicle models that are designed to meet various needs. Policymakers could turn to a more practical discussion regarding the obligation of SAVs once they are implemented on the roads and aim to provide superior services.
Author Contributions
Conceptualization, M.H., Y.L. and T.Y.; methodology, M.H. and Y.L.; software, Y.L.; validation, M.H, Y.L. and T.Y.; formal analysis, M.H. and Y.L.; investigation, T.Y.; resources, T.Y.; data curation, M.H. and Y.L.; writing—original draft preparation, M.H. and Y.L.; writing—review and editing, M.H., Y.L. and T.Y; visualization, M.H. and Y.L.; supervision, T.Y.; project administration, T.Y.; funding acquisition, T.Y.
Funding
This study is supported by the Grant-in-Aid for Scientific Research (no. 16H02367) from the Ministry of Education, Culture, Sports, Science, and Technology, Japan, as well as the Japan Society for the Promotion of Science.
Acknowledgments
This study is an extension of the collaborative research with the Denso Corporation. The authors wish to thank Daisuke Kaji, Masayuki Yamamoto, and Yuya Hattori for productive discussions during the collaborative research.
Conflicts of Interest
The authors declare no conflict of interest.
References
- Taxonomy, S.A.E. Definitions for Terms Related to On-Road Motor Vehicle Automated Driving Systems; J3016; SAE International Standard: Warrendale, PA, USA, 2014. [Google Scholar]
- Hao, M.; Yamamoto, T. Shared Autonomous Vehicles: A Review Considering Car Sharing and Autonomous Vehicles. Asian Trans. Stud. 2018, 5, 47–63. [Google Scholar]
- Fagnant, D.J.; Kockelman, K. Preparing a nation for autonomous vehicles: Opportunities, barriers and policy recommendations. Trans. Res. Part A Policy Pract. 2015, 77, 167–181. [Google Scholar] [CrossRef]
- Burns, L.D. Sustainable mobility: A vision of our transport future. Nature 2013, 497, 181–182. [Google Scholar] [CrossRef] [PubMed]
- Kek, A.; Cheu, R.; Chor, M. Relocation simulation model for multiple-station shared-use vehicle systems. J. Trans. Res. Board 2006, 1986, 81–88. [Google Scholar] [CrossRef]
- Barth, M.; Boriboonsomsin, K. Traffic congestion and greenhouse gases. Access Mag. 2009, 1, 26. [Google Scholar]
- Ford, H.J. Shared Autonomous Taxis: Implementing an Efficient Alternative to Automobile Dependency. Ph.D. Thesis, Princeton University, Princeton, NJ, USA, 2012. [Google Scholar]
- Kornhauser, A. Uncongested Mobility for All: New Jersey’s Area-Wide aTaxi System; Operations Research and Financial Engineering, Princeton University: Princeton, NJ, USA, 2013; Volume 23. [Google Scholar]
- Fagnant, D.J.; Kockelman, K.M.; Bansal, P. Operations of Shared Autonomous Vehicle Fleet for Austin, Texas, Market. J. Trans. Res. Board 2015, 98–106. [Google Scholar] [CrossRef]
- Howard, D.; Dai, D. Public perceptions of self-driving cars: The case of Berkeley, California. In Proceedings of the Transportation Research Board 93rd Annual Meeting, Washington, DC, USA, 12–16 January 2014; pp. 1–16. [Google Scholar]
- Kyriakidis, M.; Happee, R.; De Winter, J.C.F. Public opinion on automated driving: Results of an international questionnaire among 5000 respondents. Trans. Res. Part F Traffic Psychol. Behav. 2015, 32, 127–140. [Google Scholar] [CrossRef]
- König, M.; Neumayr, L. Users’ resistance towards radical innovations: The case of the self-driving car. Trans. Res. Part F Traffic Psychol. Behav. 2017, 44, 42–52. [Google Scholar] [CrossRef]
- Krueger, R.; Rashidi, T.H.; Rose, J.M. Preferences for shared autonomous vehicles. Trans. Res. Part C Emerg. Technol. 2016, 69, 343–355. [Google Scholar] [CrossRef]
- Bansal, P.; Kockelman, K.M.; Singh, A. Assessing public opinions of and interest in new vehicle technologies: An Austin perspective. Trans. Res. Part C Emerg. Technol. 2016, 67, 1–14. [Google Scholar] [CrossRef]
- MacQueen, J. Some methods for classification and analysis of multivariate observations. In Proceedings of the Fifth Berkeley Symposium on Mathematical Statistics and Probability, Berkeley, CA, USA, 18–21 July 1965; Volume 1, pp. 281–297. [Google Scholar]
- Huang, Z. Clustering large data sets with mixed numeric and categorical values. In Proceedings of the 1st Pacific-Asia Conference on Knowledge Discovery and Data Mining (PAKDD), Singapore, 23–24 February 1997; pp. 21–34. [Google Scholar]
- Huang, Z. Extensions to the k-means algorithm for clustering large data sets with categorical values. Data Min. Knowl. Discov. 1998, 2, 283–304. [Google Scholar] [CrossRef]
- Kaufman, L.; Rousseeuw, P.J. Partitioning around medoids (program pam). In Finding Groups in Data: An Introduction to Cluster Analysis; John Wiley & Sons, Inc.: Hoboken, NJ, USA, 1990; pp. 68–125. [Google Scholar]
- Ahmad, A.; Dey, L. A k-mean clustering algorithm for mixed numeric and categorical data. Data Knowl. Eng. 2007, 63, 503–527. [Google Scholar] [CrossRef]
- Sharma, N.; Gaud, N. K-modes Clustering Algorithm for Categorical Data. Int. J. Comput. Appl. 2015, 127, 1–6. [Google Scholar] [CrossRef]
- Kumar, V.; Kumar, S.; Singh, A.K. Outlier Detection: A Clustering-Based Approach. Int. J. Sci. Mod. Eng. (IJISME) 2013, 1, 16–19. [Google Scholar]
- Huang, J.Z. Clustering categorical data with k-Modes. In Encyclopedia of Data Warehousing and Mining, 2nd ed.; IGI Global: Hershey, PA, USA, 2009; pp. 246–250. [Google Scholar]
- R Core Team. R: A Language and Environment for Statistical Computing. R Foundation for Statistical Computing, Vienna, Austria. 2015. Available online: http://www.R-project.org/ (accessed on 10 June 2019).
Figure 1.
Total within-cluster simple matching distance: (a) k-modes; (b) PAM.

Figure 2.
Interest on Shared Autonomous Vehicles (SAV) services of C-5 and C-6: (a) k-modes; (b) PAM.
Figure 2.
Interest on Shared Autonomous Vehicles (SAV) services of C-5 and C-6: (a) k-modes; (b) PAM.

Figure 3.
Radar chart of interest services by k-modes.

Table 1.
Sample distribution of socio-economic characteristics.
| Variables | Levels | Percentage |
|---|---|---|
| Gender | Male | 47% |
| Age | Young (16 to 34 years old) | 29% |
| Middle age (35 to 64 years old) | 60% | |
| Elder (over 65 years old) | 11% | |
| Job | Employee | 51% |
| Part-time | 14% | |
| Student | 9% | |
| Homemaker | 21% | |
| Unemployed | 5% | |
| Have child | Yes | 14% |
| Trip with | Family member (less than 6 years old) | 13% |
| Family member (6 to 60 years old) | 41% | |
| Family member (over 60 years old) | 14% | |
| Friends | 8% | |
| Alone | 21% | |
| Others | 3% | |
| Car use frequency | High (at least 4 to 5 days per week) | 32% |
| Medium (1 to 3 days per week) | 29% | |
| Low (less than 1 day per week) | 39% | |
| Interest in SAVs 1 | High | 40% |
| Low | 60% |
1 1 to 5 levels of interest in SAVs are provided in the questionnaire. Level 1 to 2 are regarded as “High” and 2 to 5 are regarded as “Low” interest.
Table 2.
SAV services description.
| Service | Description | % 1 | WTP 2 | |
|---|---|---|---|---|
| M 3 | SD 4 | |||
| Short waiting time | Passengers wait for less than one minute to be picked up | 83% | 0.37 | 0.37 |
| On time | Difference between actual and expected arrival time is less than one minute | 82% | 0.39 | 0.38 |
| Larger trunk | Extra space for large luggage | 78% | 0.41 | 0.42 |
| Multi-origin | Sharing the same autonomous car with friends or colleagues from different origins to the same destination | 73% | 0.41 | 0.44 |
| Easy boarding | Providing a specially designed car for comfortable getting in/out | 72% | 0.30 | 0.45 |
| Multi-user | More than one users share one SAV to the same destination | 69% | 0.40 | 0.46 |
| Easy loading | Providing special equipment or design to assist with loading luggage | 69% | 0.30 | 0.46 |
| Keep car while shopping | Keeping your belongings in the autonomous car while shopping | 64% | 0.40 | 0.48 |
| Longer boarding time | Providing longer boarding time for passengers who have difficulty getting in/out (default boarding time is 20 s). | 60% | 0.26 | 0.49 |
| Child tracking | Tracking the movement of children (≥12 years old) when they are using AVs | 43% | 0.45 | 0.50 |
| Charging | Providing a charging service for electronic devices | 39% | 0.22 | 0.49 |
1 % indicates the percentage of people interested in the specific service. 2 WTP represents the willingness to pay for the service in USD (1 JPY = 0.009 USD is used for conversion). 3 Mean value of WTP is calculated here. 4 Standard deviation of the WTP is calculated here.
Table 3.
Dissimilarity results 1 of four pairs of clusters.
| Variables | Levels | C-1 | C-2 | C-3 | C-4 | C-5 | C-6 |
|---|---|---|---|---|---|---|---|
| Age | Young | 2% | 0% | 1% | 4% | 7% | 16% |
| Middle age | 2% | 1% | 0% | 6% | 14% | 16% | |
| Elder | 0% | 1% | 1% | 2% | 7% | 0% | |
| Job | Employed | 3% | 0% | 1% | 4% | 9% | 12% |
| Part-time | 1% | 1% | 1% | 3% | 17% | 1% | |
| Student | 0% | 1% | 1% | 1% | 6% | 2% | |
| Homemaker | 3% | 2% | 2% | 9% | 5% | 19% | |
| Unemployed | 0% | 1% | 1% | 1% | 14% | 0% | |
| Have child | Yes | 3% | 3% | 1% | 2% | 8% | 19% |
| Trip with | Child | 3% | 0% | 1% | 9% | 1% | 5% |
| Elder | 1% | 2% | 1% | 1% | 2% | 4% | |
| Alone | 3% | 2% | 1% | 3% | 8% | 10% | |
| Car frequency | High | 1% | 6% | 3% | 6% | 1% | 1% |
| Medium | 2% | 3% | 2% | 3% | 6% | 4% | |
| Low | 0% | 2% | 1% | 0% | 4% | 4% | |
| Interest in SAVs | Yes | 5% | 4% | 0% | 7% | 3% | 0% |
1 The dissimilarity result is the absolute value between the percentages of socioeconomic characteristics of two paired clusters according to k-modes and PAM.
Table 4.
Service preferences for clusters.
| Cluster | Size | Interest Services |
|---|---|---|
| C-1 | 36% | Interest in all SAV services |
| C-2 | 33% | Short waiting time; on time; larger trunk; multi-user; keep car while shopping; easy loading; multi-origin; longer boarding time; easy boarding |
| C-3 | 12% | No interest in selecting any SAV services |
| C-4 | 9% | Short waiting time; on time; larger trunk |
| C-5 | 7% | Short waiting time; on time; larger trunk; child tracking; multi-user; multi-origin |
| C-6 | 3% | Short waiting time; on time; longer boarding time; easy boarding |
Table 5.
Statistical summary of six clusters.
| Variables | Levels | HI (C-1) | ESRMS (C-2) | LI (C-3) | SR (C-4) | SRMC (C-5) | ER (C-6) |
|---|---|---|---|---|---|---|---|
| Age | Young | 38% | 26% | 18% | 23% | 23% | 19% |
| Middle age | 52% | 58% | 73% | 68% | 68% | 72% | |
| Elder | 10% | 16% | 9% | 9% | 9% | 9% | |
| Job | Employed | 48% | 45% | 63% | 58% | 49% | 72% |
| Part-time | 17% | 14% | 11% | 13% | 12% | 09% | |
| Student | 12% | 7% | 9% | 9% | 5% | 9% | |
| Homemaker | 19% | 27% | 12% | 13% | 27% | 6% | |
| Unemployed | 4% | 8% | 5% | 7% | 6% | 3% | |
| Have child | Yes | 11% | 13% | 18% | 17% | 25% | 19% |
| Trip with | Child | 14% | 17% | 7% | 7% | 9% | 9% |
| Elder | 12% | 19% | 12% | 11% | 12% | 9% | |
| Alone | 19% | 17% | 27% | 26% | 18% | 44% | |
| Car frequency | High | 32% | 31% | 29% | 31% | 40% | 34% |
| Medium | 26% | 30% | 33% | 30% | 26% | 34% | |
| Low | 8% | 0% | 7% | 7% | 6% | 9% | |
| Interest in SAVs | Yes | 45% | 48% | 15% | 25% | 44% | 38% |
Table 6.
Spearman correlation matrix 1 (multiplied by 100).
| Variables | Levels | HI (C-1) | ESRMS (C-2) | LI (C-3) | SR (C-4) | SRMC (C-5) | ER (C-6) |
|---|---|---|---|---|---|---|---|
| Age | Young | 15 | −4 | −9 | −4 | −3 | −4 |
| Middle age | −11 | −3 | 10 | 5 | 4 | 4 | |
| Elder | −5 | 10 | −3 | −2 | −2 | −1 | |
| Job | Employed | −4 | −8 | 9 | 5 | −1 | 8 |
| Part-time | 6 | −1 | −4 | −1 | −2 | −2 | |
| Student | 8 | −6 | 0 | 0 | −4 | 0 | |
| Homemaker | , | 12 | −8 | −6 | 5 | −6 | |
| Unemployed | −6 | 6 | −1 | 2 | 1 | −2 | |
| Have child | Yes | −7 | −3 | 4 | 2 | 9 | 2 |
| Trip with | Child | 1 | 9 | −6 | −5 | −3 | −2 |
| Elder | −5 | 10 | −2 | −3 | −2 | −3 | |
| Alone | −3 | −6 | 5 | 4 | −2 | 10 | |
| Car frequency | High | −1 | −1 | −2 | 0 | 5 | 1 |
| Medium | −4 | 2 | 3 | 1 | −2 | 2 | |
| Low | 0 | 3 | −3 | −1 | −2 | 1 | |
| Interest in SAVs | Yes | 7 | 11 | −19 | −10 | 2 | −1 |
1 A correlation coefficient of p = 0.06 is statistically significant (p < 0.05). The color gradient runs from values indicated by green (lowest) to yellow (median) to red (highest).
Table 7.
WTP 1 for different services by groups (USD/trip) 2.
| HI (C-1) | ESRMS (C-2) | LI (C-3) | SR (C-4) | SRMC (C-5) | ER (C-6) | |
|---|---|---|---|---|---|---|
| On time | 0.38 | 0.34 | 0.15 | 0.39 | 0.38 | 0.67 |
| Short waiting time | 0.39 | 0.35 | 0.13 | 0.38 | 0.37 | 0.60 |
| Multi-user | 0.49 | 0.50 | 0.18 | 0.36 | 0.45 | 0.39 |
| Multi-origin | 0.49 | 0.50 | 0.11 | 0.30 | 0.48 | 0.53 |
| Keep car while shopping | 0.46 | 0.50 | 0.22 | 0.35 | 0.40 | 0.44 |
| Easy loading | 0.40 | 0.41 | 0.10 | 0.29 | 0.29 | 0.27 |
| Easy boarding | 0.39 | 0.38 | 0.10 | 0.28 | 0.30 | 0.35 |
| Charging | 0.30 | 0.23 | 0.13 | 0.22 | 0.19 | 0.24 |
| Child tracking | 0.58 | 0.50 | 0.41 | 0.49 | 0.39 | 0.36 |
| Longer boarding time | 0.29 | 0.32 | 0.07 | 0.31 | 0.24 | 0.32 |
| Larger trunk | 0.50 | 0.51 | 0.16 | 0.44 | 0.44 | 0.40 |
| Bundle 3 | 4.67 | 4.54 | 1.76 | 3.81 | 3.93 | 4.57 |
1 WTP indicates the willingness to pay for each additional service (converted to USD, 1JPY = 0.009 USD). As a reference, local costs such as bus fare: 1.89 USD and taxi fare: 5.85 USD + 4.32 USD/km are provided for comparison of the monetary data in the SP survey. 2 The calculated values are compared to the total average payment for each service. The color gradient values run from green (lower than average) to yellow (similar to average) to red (higher than average). 3 Bundle represents added value of services per trip (not including the base cost of the ride).
© 2019 by the authors. Licensee MDPI, Basel, Switzerland. This article is an open access article distributed under the terms and conditions of the Creative Commons Attribution (CC BY) license (http://creativecommons.org/licenses/by/4.0/).
Share and Cite
MDPI and ACS Style
Hao, M.; Li, Y.; Yamamoto, T. Public Preferences and Willingness to Pay for Shared Autonomous Vehicles Services in Nagoya, Japan. Smart Cities 2019, 2, 230-244. https://doi.org/10.3390/smartcities2020015
AMA Style
Hao M, Li Y, Yamamoto T. Public Preferences and Willingness to Pay for Shared Autonomous Vehicles Services in Nagoya, Japan. Smart Cities. 2019; 2(2):230-244. https://doi.org/10.3390/smartcities2020015
Chicago/Turabian StyleHao, Mingyang, Yanyan Li, and Toshiyuki Yamamoto. 2019. "Public Preferences and Willingness to Pay for Shared Autonomous Vehicles Services in Nagoya, Japan" Smart Cities 2, no. 2: 230-244. https://doi.org/10.3390/smartcities2020015